Embed Size (px)
Citation preview
GR-SJ-04-3
UNIVERSITY OF CALIFORNIA COOPERATIVE EXTENSION
2004
SAMPLE COSTS TO
ESTABLISH AND PRODUCE
TABLE GRAPES CRIMSON SEEDLESS
SAN JOAQUIN VALLEY
William L. Peacock UCCE Farm Advisor, Tulare County
Stephen J. Vasquez UCCE Farm Advisor, Fresno County
Jennifer M. Hashim UCCE Farm Advisor, Kern County
George M. Leavitt UCCE Farm Advisor, Madera County
Nick K. Dokoozlian UCCE Specialist, Kearney Agricultural Center
Karen M. Klonsky UCCE Specialist, Department of Agricultural and Resource Economics,
Agricultural and Resource Economics, UC Davis
Donald G. Katayama Staff Research Associate, Kearney Agricultural Center
Richard L. De Moura Research Associate, Department of Agricultural and Resource Economics, UC Davis
2004 Table Grapes Costs and Returns Study (Crimson Seedless) San Joaquin Valley UC Cooperative Extension 2
UC COOPERATIVE EXTENSION
SAMPLE COSTS TO ESTABLISH AND
PRODUCE TABLE GRAPES
Crimson Seedless
San Joaquin Valley
CONTENTS
INTRODUCTION............................................................................................................................................2
ASSUMPTIONS ..............................................................................................................................................3
Establishment Operating Costs .......................................................................................................................3
Production Operating Costs ............................................................................................................................5
Cash Overhead Costs ......................................................................................................................................8
Non-cash Overhead Costs...............................................................................................................................8
REFERENCES...............................................................................................................................................10
Table 1. COSTS TO ESTABLISH A TABLE GRAPE VINEYARD.............................................................11
Table 2. COSTS PER ACRE TO PRODUCE TABLE GRAPES - Crimson Seedless.....................................13
Table 3. COSTS AND RETURNS PER ACRE TO PRODUCE TABLE GRAPES - Crimson Seedless.........15
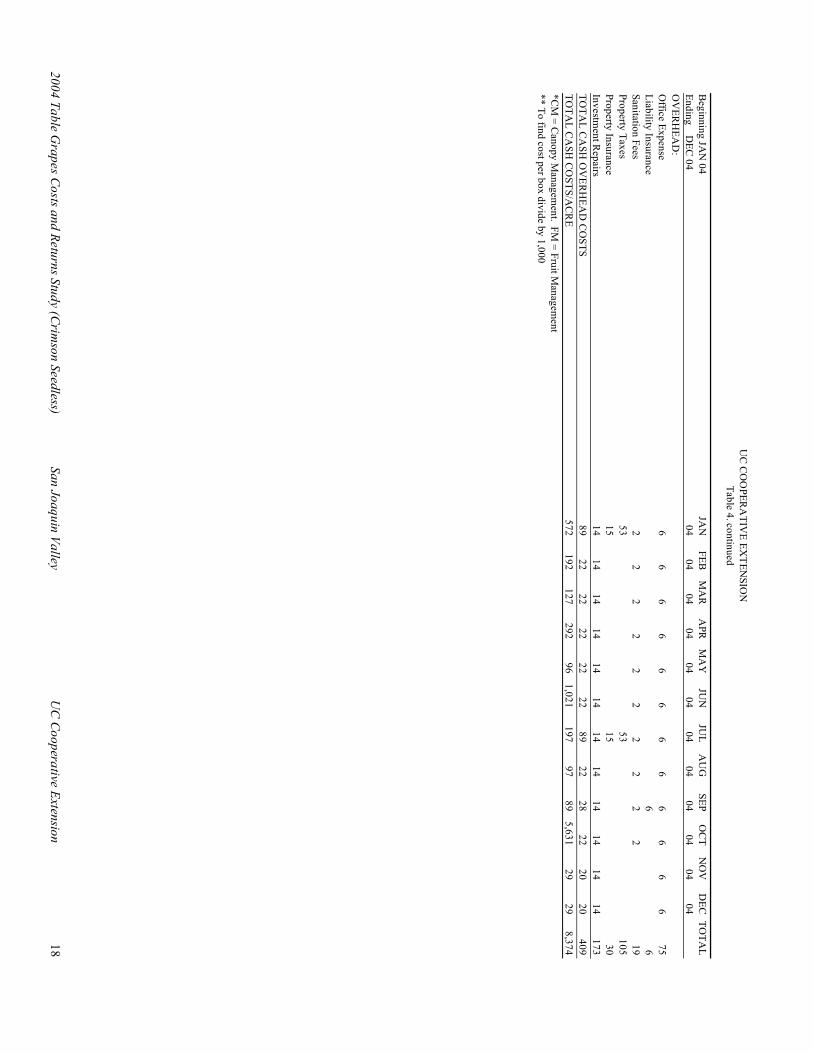
Table 4. MONTHLY CASH COSTS – TABLE GRAPES - Crimson Seedless...............................................17
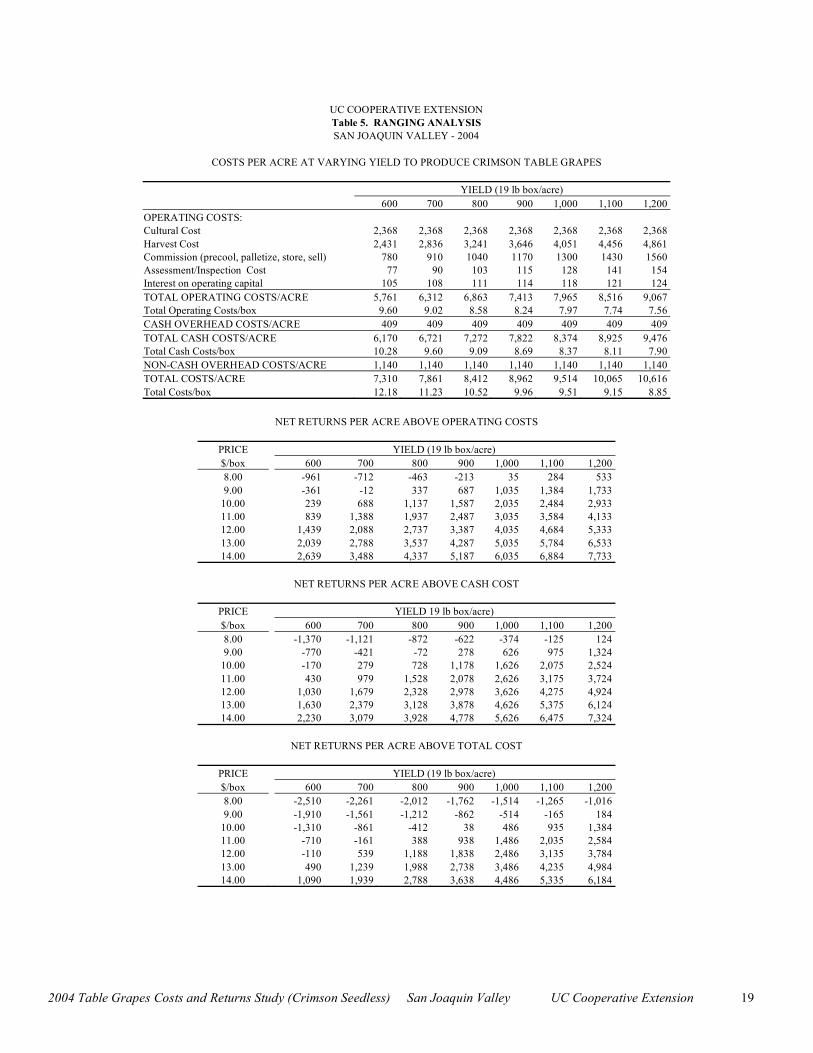
Table 5. RANGING ANALYSIS for Crimson Seedless Table Grapes ...........................................................19
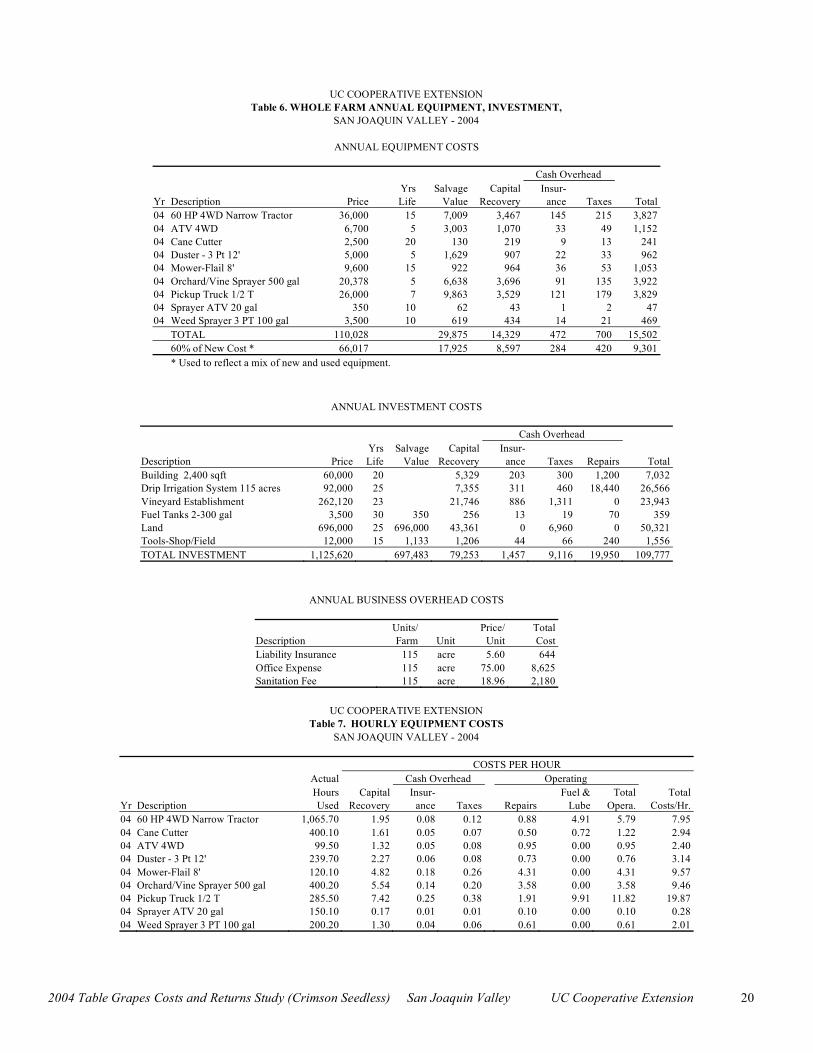
Table 6. WHOLE FARM EQUIPMENT, INVESTMENT, AND BUSINESS OVERHEAD COSTS.............20
Table 7. HOURLY EQUIPMENT COSTS ....................................................................................................20
Table 8. OPERATIONS WITH EQUIPMENT ..............................................................................................21
INTRODUCTION
Sample costs to establish and produce Crimson Seedless table grapes are presented in this study. This
study is intended as a guide only, and can be used to make production decisions, determine potential returns,
prepare budgets and evaluate production loans. Practices described are considered typical for the crop and area,
but these practices will not apply to every farming operation. The sample costs for labor, materials, equipment
and custom services are based on current figures. A blank column, “Your Costs”, in Tables 2 and 3 is provided
for entering your farm costs.
The hypothetical farm operation, production practices, overhead, and calculations are described under
the assumptions. For additional information or an explanation of the calculations used in the study call the
Department of Agricultural and Resource Economics, University of California, Davis, (530) 752-3589 or your
local UC Cooperative Extension office.
Sample Cost of Production Studies for many commodities can be downloaded at
http://coststudies.ucdavis.edu, requested through the Department of Agricultural and Resource Economics, UC
Davis, (530) 752-4424 or obtained from the local county UC Cooperative Extension offices. Some archived
studies are also available on the website.
The University of California is an affirmative action/equal opportunity employer
The University of California and the United States Department of Agriculture, Risk Management Agency, cooperating.
2004 Table Grapes Costs and Returns Study (Crimson Seedless) San Joaquin Valley UC Cooperative Extension 3
ASSUMPTIONS
The assumptions refer to Tables 1 to 8 and pertain to sample costs to establish the vineyard and produce Crimson Seedless table grapes in the San Joaquin Valley. The cultural practices described represent production operations and materials considered typical on a well-managed vineyard in the region. Costs, materials, and practices in this study will not apply to all farms. Timing of and types of establishment and cultural practices will vary among growers within the region and from season to season due to variables such as weather, soil, and insect and disease pressure. The use of trade names and cultural practices in this report does not constitute
an endorsement or recommendation by the University of California nor is any criticism implied by
omission of other similar products or cultural practices.
Farm. The hypothetical farm consists of 120 contiguous acres. Crimson Seedless vineyard establishment and table grapes production is on 40 acres. Other table grape varieties are on 75 acres; roads, irrigation systems, and farmstead occupy five acres. The farm is owned and managed by the grower.
Establishment Operating Costs
Site Preparation. This vineyard is established on ground previously planted to vineyards or orchards. Land coming from vines or trees should be fallowed for two years except for a possible grain crop. The land is assumed to be fairly level. A custom operator chisels the ground (subsoils) twice to a depth of 4-5 feet. The grower floats the land to smooth and level the surface. Afterwards the ground is disced twice to apply and incorporate preplant herbicide. Nematode samples should be taken from land formerly in vines or trees and fumigated if necessary. Most operations that prepare the vineyard for planting are done in the year prior to planting, but costs are shown in the first year.
Plant. Planting the vineyard starts by laying out and marking vine sites in early spring. Holes are dug and vines planted and a two-inch by two-inch cardboard carton placed around the vine. In the second year, 2% or 9 vines per acre are replaced.
Vines. The Crimson Seedless plants are dormant, bench-grafted rootstock vines purchased from a commercial nursery. The grapevines are planted during the first spring on an 8-foot x 12-foot spacing (vine x row) with 454 vines per acre. Vines are trained during the first and second years. The grapevines are expected to begin yielding fruit in two to three years and then be productive for an additional 22 to 23 years.
Trellis System. A commercial company installs the trellis system in the second year. The trellis system will be removed when the vineyard is removed; therefore it is considered part of the vineyard and included in the establishment costs. Materials for the open gable trellis are as follows: (1) Stakes with V structure are placed every 24-feet down the row. Metal stakes (2 lbs/ft strength) are 8.5-feet long and placed in the ground 3-feet. The open gable is 72-inches wide from tip to tip. (2) End assemblies consist of 9.5-foot metal post (4 lb/ft) with a V that matches those within the row and with 10-inch helix anchor. (3) Eight wires, 12.5 gauge high tensile, are used for fruit and canopy support, and three wires, 14 gauge high tensile, are used for movable catch wires and drip hose support.
Train/Prune. Dormant season pruning begins the second year. Along with training the selected canes, training also includes suckering and tying canes. Suckering is the removal of water sprouts from the trunk. As the vines mature and grow larger, pruning costs increase and training costs decrease. Training continues through the third year for vines of low vigor or those that were replaced. Selecting and tying canes to fruiting wires is required each year for the life of the vineyard.
2004 Table Grapes Costs and Returns Study (Crimson Seedless) San Joaquin Valley UC Cooperative Extension 4
Irrigate. Water pumping costs plus labor constitute the irrigation cost. In this study, water is calculated to cost $3.36 per acre-inch or $40.32 per acre-foot. The pumping cost is based on a 40 horsepower (HP) motor to pump from 130 feet deep. The vineyard is irrigated during the growing season from March through August during the establishment years. Price per acre-foot of water will vary by grower in this region depending on quantity used, water district, power cost, various well characteristics, and other irrigation factors. The amount of water applied to the vineyard varies through the establishment years and is shown in Table A.
Fertilize. Liquid nitrogen fertilizer, UN32, is applied through the irrigation
system in April of the first year at five pounds of N per acre. A single application is made in April of the second year. The amount of nitrogen applied each year increases as the vineyard matures and is shown in Table B. It is important to identify sources of nitrogen in order to properly manage the nitrogen budget. Sources of nitrogen such as irrigation well water should be calculated to determine the need to irrigate and fertilize.
Pest Management. For pest identification, monitoring, management and pesticide information, visit the UC IPM website at www.imp.ucdavis.edu. Written recommendations are required for many commercially applied pesticides, and are available from licensed pest control advisers (PCAs). For information on pesticide use permits, contact the local county Agricultural Commissioner’s office. Pesticides mentioned in this study
are used to calculate rates and costs. Although the pesticides mentioned are commonly used by growers,
many other pesticides are available. Check with your PCA and/or the UC IPM website for current
recommendations.
Insects. Beginning in the second year, western grapeleaf skeletonizer (Harrisina brillians) is controlled in April with an application of Kryocide insecticide (mixed with micronized sulfur sprays). Additionally insects such as mealybugs should be monitored each year and may add additional costs if found. If mealybugs (Pseudococcus sp.) are found during vineyard establishment, the grower should consult with a PCA, farm advisor, and/or ag commissioner to develop management strategies.
Diseases. Although many pathogens attack grapevines, phomopsis cane and leafspot (Phomopsis
viticola) and powdery mildew (Uncinula necator) are the two diseases managed in this study. In April of the second year, Microthiol plus Abound (strobilurin) are applied for phomopsis and mildew control. Mildew is controlled with various fungicide applications at 7 to 21 day intervals in the second year, depending on the fungicide used. For this study, the grower applies Kocide (copper) and Rubigan (SI), and two Microthiol applications (one with Kryocide) in April; one Rubigan (SI) application and two dusting sulfur applications in May; one Rubigan (SI) application and two dusting sulfur applications in June. Growers have the option of using sulfur (dust, wettable, flowable or micronized), sterol inhibitors (SIs), or strobilurins, as well as other fungicides to control powdery mildew. Sterol inhibitors and strobilurins are two classes of fungicides with different modes of action than sulfur against powdery mildew. It is recommended that fungicides with different modes of action be used to avoid powdery mildew populations from acquiring fungicide resistance.
Weeds (Vineyard Floor Management). In October of the year prior to planting, Treflan is applied to the vineyard floor and incorporated by discing. After planting, weeds in the vine rows and middles are managed with discing, mowing, and/or herbicides. From March through July of the first year, the row middles are disced twice and mowed twice. The vine rows are hand weeded in April. The row middles are mowed three to four
Table A. Water Applied
Year AcIn/Year 1 8 2 18
3+ 36
Table B. Applied
Nitrogen (N) Per Acre
Year Lbs of N
1 5
2 25
3+ 50
2004 Table Grapes Costs and Returns Study (Crimson Seedless) San Joaquin Valley UC Cooperative Extension 5
times during the growing season starting the second year. The vine rows are sprayed (strip spray) in January of the second year with Roundup and Surflan. The strip spray is applied to 30% of the acreage. Also in the second year, spot sprays using Roundup are applied to the vine row in April, June, and July. The spot sprays (weedy spots or areas) are applied using an all terrain vehicle (ATV) with a sprayer attached.
Harvest/Yield/Returns. The vineyard may produce a harvestable Crimson Seedless table grape crop the second year. If the crop is harvested for table grapes you can use Tables 2 and 3 to estimate your cost. If the crop is harvested for wine, a labor contractor may be needed. The contractor hand harvests the crop for $45 per ton. Harvest includes hand picking the grapes into bins, furnished by the contractor, and hauling to the winery. In this study, it is assumed that the crop if economically feasible to harvest would be harvested for table grapes.
Production Operating Costs
Prune/Sucker/Canopy Management (CM). The vines are cane-pruned during the winter months (January) and the prunings are placed in the row middles and shredded. In February, the canes are tied to a trellis wire(s) by wrapping on the trellis wire and tying with twistims. Suckers are removed from the vine trunks in early April. Shoot positioning and removal are done in late April. The canes are mechanically cut in June to improve canopy microclimate, allowing for sunlight penetration and proper coverage of pesticides.
Fruit Management (FM). Gibberellic acid (GA), a plant growth regulator, is applied two times: one
time in May for thinning during bloom at one gram per acre and a second time for berry sizing three to four weeks after full bloom (June) at eight grams per acre (disease and insect materials are included with these applications). Applying GA to Crimson Seedless for sizing increases berry weight less than 10%. GA applied at this time decreases fruit color. Tradeoffs should be considered before application. Vines are girdled to increase berry size two to three weeks after full bloom (June). Cluster tipping and hand thinning are done in late May to early June to loosen and adjust cluster length and crop load. Leaf removal for fruit exposure is done in June. Ethrel, a second plant growth regulator, is applied to the vineyard in August to enhance color development in the fruit. It may be necessary to cover canopies late in the season with plastic to protect fruit from inclement weather. The approximate cost of plastic is $250 per acre plus $250 per acre for installation and removal.
Trellis/Vines. Trellis repairs are done annually (January in this study) and the cost is not taken from any specific data. Weak or missing vines are replaced by layering. One year-old canes from neighboring vines are buried (layered) in the soil next to the stake and allowed to root. After rooting the canes are cut and the plant trained on the trellis. Trellis repair and vine replacement increases with vineyard age.
Irrigate. The vineyard is drip irrigated during the growing season from April through October. Deficit
irrigation (70% ET) is applied three to five weeks prior to harvest to slow shoot growth and promote fruit maturity. Deficit irrigation may not work well on weak or low vigor vineyards. Water pumping costs plus labor constitute the irrigation cost. In this study, water is calculated to cost $3.36 per acre-inch or $40.32 per acre-foot. The pumping cost is based on a 40 horsepower (HP) motor to pump from 130 feet depth and pressurized to 20 pounds per square inch (PSI). A total of 36 acre-inches is applied to the vineyard. Price per acre-foot of water will vary by grower in this region depending on quantity used, water district, power cost, various well characteristics, and other irrigation factors.
Fertilize. Nitrogen (N) at 50 pounds per acre as UN32 is applied through the irrigation drip system in April or post-harvest. Neutral zinc is applied to prevent zinc deficiencies and is combined with the late April mildew (Microthiol, Rally) application.
2004 Table Grapes Costs and Returns Study (Crimson Seedless) San Joaquin Valley UC Cooperative Extension 6
Pest Management. The pesticides and rates mentioned in this cost study are listed in UC Integrated
Pest Management Guidelines, Grapes. For information on other pesticides available, pest identification, monitoring, and management visit the UC IPM website at www.ipm.ucdavis.edu. For information and pesticide use permits, contact the local county agricultural commissioner's office. Pesticides mentioned in this study
are used to calculate rates and costs. Although the pesticides mentioned are commonly used by growers,
many other pesticides are available. Check with your PCA and/or the UC IPM website for current
recommendations. Adjuvants are recommended for use with many pesticides for effective control, but the adjuvants and their costs are not included in this study. Pesticide costs may vary by location, brand, and grower volume. Pesticide costs in this study are taken from a single dealer and shown as full retail.
Pest Control Adviser (PCA). Written recommendations are required for many commercially applied pesticides and are written by licensed pest control advisers. In addition the PCA will monitor the field for agronomic problems including pests, diseases, and nutritional status. Growers may hire private PCA’s or receive the service as part of a service agreement with an agricultural chemical and fertilizer company. Costs for a PCA are not included in this study.
Weeds (Vineyard Floor Management). Vineyard middles are mowed three times each season: March, May, July. Surflan and Roundup herbicides are applied to the vine row/berm in February. Roundup, a contact herbicide, is applied as a spot spray to the vine row in June.
Insects. Mealybug (Pseudococcus sp.) is treated with Lorsban insecticide in early March (dormant vines). Western grapeleaf skeletonizer (Harrisina brillians) is treated with Kryocide (mixed with a GA and/or sulfur application) during the bloom thinning spray in May. Grape leafhoppers (Erythroneura elegantula) are controlled with Provado insecticide (mixed with GA, Microthiol, Rally) during the berry size spray in June. An effective alternative material for mealybugs is to apply Admire insecticide through the drip system, but at a higher cost than a Lorsban application. It may be necessary to use multiple insecticides to control some mealybug species.
Diseases. Diseases treated in this study are phomopsis cane and leafspot (Phomopsis viticola) and
powdery mildew (Uncinula necator). Phomopsis and powdery mildew are both treated in late March (shoot length averages 2-inches) with Abound and Microthiol (micronized sulfur). Mildew is controlled with various fungicide applications at 7 to 21 day intervals, depending on the fungicide used. In this study, Dusting Sulfur is applied three times – April, June, July. Microthiol and Rally, an SI, (with zinc) are applied in late April. Microthiol (with GA and Kryocide) is applied with the May bloom thin spray. Rally and Microthiol are applied in June. Microthiol and Rally (with GA and Provado) are applied with the berry size spray in June. Microthiol and Rally are applied in July. Dusting Sulfur is applied two times in September and two times in October to control powdery mildew on the stems. The mildew does not grow on the grapes at this stage of maturity. Vangard fungicide is applied in October to protect grapes from Botrytis Bunch Rot. Growers have the option of using sulfur (dust, wettable, flowable or micronized), sterol inhibitors (SIs), or strobilurins, as well as other fungicides to control powdery mildew. Sterol inhibitors and strobilurins are two classes of fungicides with different modes of action than sulfur against powdery mildew. It is recommended that fungicides with different modes of action be used to prevent powdery mildew populations from acquiring fungicide resistance.
Harvest. Beginning in the October of the third year, the grapes are harvested for table grapes and packed in the field. The field is picked two to three times. Harvesting crews work in teams of three or four. Depending on fruit quality, the team can pick 3 – 7 boxes per hour per individual. For this study, the picker picks five shipping boxes per hour per individual. Two or three pickers field pick and trim the grapes, and put them in a reusable field box. After the fruit is picked and trimmed, the field boxes are loaded on a harvest wheelbarrow and delivered to the packer who places the fruit in bags and places them in shipping boxes. The box holds 9 bags and weighs 19 pounds when filled. The empty boxes are spread along row ends and when
2004 Table Grapes Costs and Returns Study (Crimson Seedless) San Joaquin Valley UC Cooperative Extension 7
filled, they are loaded on a truck and hauled to storage. The cost includes the boxes, plastic bags and related labor. Cold storage and palletization costs may in some cases be a grower cost but is generally charged to the buyer. Selling costs are paid by the grower and may range from 7 to 10%. A figure of 10% of gross price is used in this study and assumes that the grower will be reimbursed for cooling and palletizing.
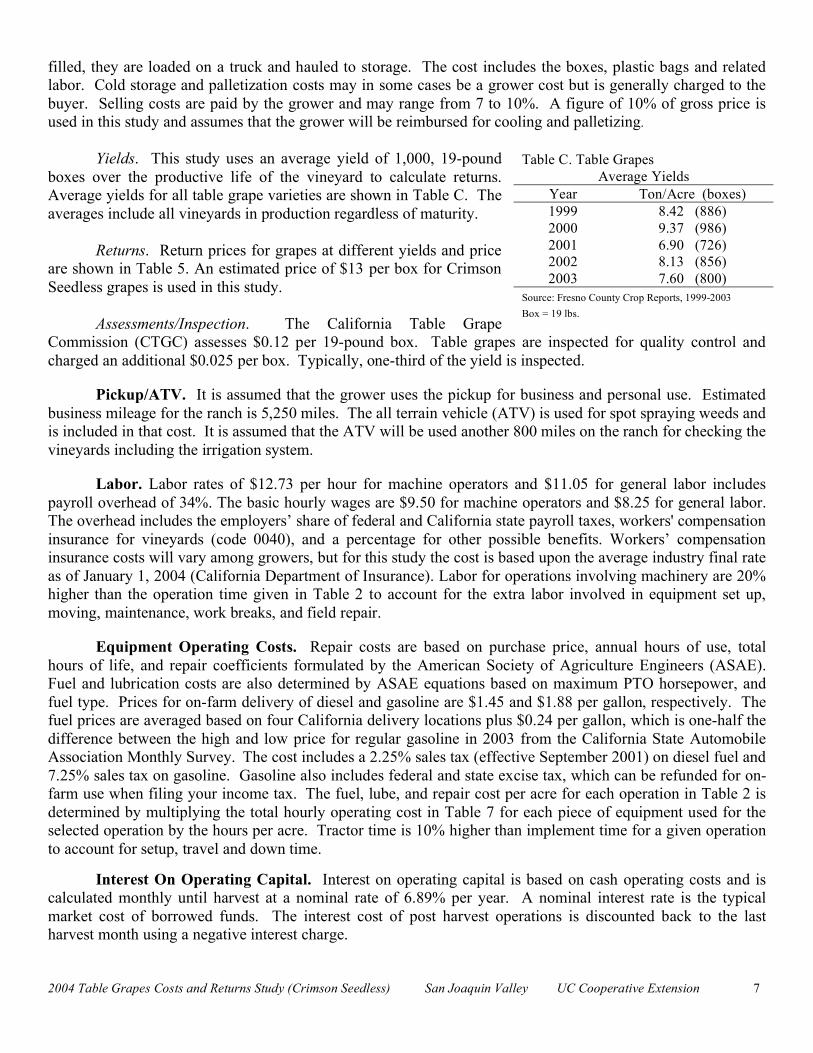
Yields. This study uses an average yield of 1,000, 19-pound
boxes over the productive life of the vineyard to calculate returns. Average yields for all table grape varieties are shown in Table C. The averages include all vineyards in production regardless of maturity.
Returns. Return prices for grapes at different yields and price
are shown in Table 5. An estimated price of $13 per box for Crimson Seedless grapes is used in this study.
Assessments/Inspection. The California Table Grape
Commission (CTGC) assesses $0.12 per 19-pound box. Table grapes are inspected for quality control and charged an additional $0.025 per box. Typically, one-third of the yield is inspected.
Pickup/ATV. It is assumed that the grower uses the pickup for business and personal use. Estimated business mileage for the ranch is 5,250 miles. The all terrain vehicle (ATV) is used for spot spraying weeds and is included in that cost. It is assumed that the ATV will be used another 800 miles on the ranch for checking the vineyards including the irrigation system.
Labor. Labor rates of $12.73 per hour for machine operators and $11.05 for general labor includes payroll overhead of 34%. The basic hourly wages are $9.50 for machine operators and $8.25 for general labor. The overhead includes the employers’ share of federal and California state payroll taxes, workers' compensation insurance for vineyards (code 0040), and a percentage for other possible benefits. Workers’ compensation insurance costs will vary among growers, but for this study the cost is based upon the average industry final rate as of January 1, 2004 (California Department of Insurance). Labor for operations involving machinery are 20% higher than the operation time given in Table 2 to account for the extra labor involved in equipment set up, moving, maintenance, work breaks, and field repair.
Equipment Operating Costs. Repair costs are based on purchase price, annual hours of use, total hours of life, and repair coefficients formulated by the American Society of Agriculture Engineers (ASAE). Fuel and lubrication costs are also determined by ASAE equations based on maximum PTO horsepower, and fuel type. Prices for on-farm delivery of diesel and gasoline are $1.45 and $1.88 per gallon, respectively. The fuel prices are averaged based on four California delivery locations plus $0.24 per gallon, which is one-half the difference between the high and low price for regular gasoline in 2003 from the California State Automobile Association Monthly Survey. The cost includes a 2.25% sales tax (effective September 2001) on diesel fuel and 7.25% sales tax on gasoline. Gasoline also includes federal and state excise tax, which can be refunded for on-farm use when filing your income tax. The fuel, lube, and repair cost per acre for each operation in Table 2 is determined by multiplying the total hourly operating cost in Table 7 for each piece of equipment used for the selected operation by the hours per acre. Tractor time is 10% higher than implement time for a given operation to account for setup, travel and down time.
Interest On Operating Capital. Interest on operating capital is based on cash operating costs and is calculated monthly until harvest at a nominal rate of 6.89% per year. A nominal interest rate is the typical market cost of borrowed funds. The interest cost of post harvest operations is discounted back to the last harvest month using a negative interest charge.
Table C. Table Grapes
Average Yields
Year Ton/Acre (boxes)
1999 8.42 (886)
2000 9.37 (986)
2001 6.90 (726) 2002 8.13 (856)
2003 7.60 (800)
Source: Fresno County Crop Reports, 1999-2003
Box = 19 lbs.
2004 Table Grapes Costs and Returns Study (Crimson Seedless) San Joaquin Valley UC Cooperative Extension 8
Risk. The risks associated with crop production should not be minimized. While this study makes every effort to model a production system based on typical, real world practices, it cannot fully represent financial, agronomic and market risks, which affect profitability and economic viability. Growers may purchase Federal crop insurance to reduce the production risk associated with specific natural hazards. Insurance policies vary and range from a basic catastrophic loss policy to one that insures losses for up to 75% of a crop. Insurance costs will depend on the type and level of coverage.
Cash Overhead
Cash overhead consists of various cash expenses paid out during the year that are assigned to the whole farm and not to a particular operation. These costs include property taxes, interest on operating capital, office expense, liability and property insurance, sanitation services, equipment repairs, and management.
Property Taxes. Counties charge a base property tax rate of 1% on the assessed value of the property. In some counties special assessment districts exist and charge additional taxes on property including equipment, buildings, and improvements. For this study, county taxes are calculated as 1% of the average value of the property. Average value equals new cost plus salvage value divided by 2 on a per acre basis.
Insurance. Insurance for farm investments varies depending on the assets included and the amount of coverage. Property insurance provides coverage for property loss and is charged at 0.676% of the average value of the assets over their useful life. Liability insurance covers accidents on the farm and costs $645 for the entire farm.
Office Expense. Office and business expenses for 120 acres are estimated at $75 per producing acre or $8,625 annually for the ranch. These expenses include office supplies, telephones, bookkeeping, accounting, legal fees, road maintenance, etc.
Sanitation Services. Sanitation services provide double portable toilets with washbasins for 10 months. The cost includes delivery and weekly cleaning service. The number of sanitation facilities will vary depending upon local regulations and size of labor force. In many cases labor contractors furnish the sanitation facilities for their crews and is included in the contractors labor overhead.
Management/Supervisor Wages. Salary is not included. Returns above costs are considered a return to management
Investment Repairs. Annual maintenance is calculated as 2% of the purchase price.
Non-Cash Overhead Costs
Non-cash overhead is calculated as the capital recovery cost for equipment and other farm investments.
Capital Recovery Costs. Capital recovery cost is the annual depreciation and interest costs for a capital investment. It is the amount of money required each year to recover the difference between the purchase price and salvage value (unrecovered capital). It is equivalent to the annual payment on a loan for the investment with the down payment equal to the discounted salvage value. This is a more complex method of calculating ownership costs than straight-line depreciation and opportunity costs, but more accurately represents the annual costs of ownership because it takes the time value of money into account (Boehlje and Eidman). The formula for the calculation of the annual capital recovery costs is ((Purchase Price – Salvage Value) x Capital Recovery Factor) + (Salvage Value x Interest Rate).
Salvage Value. Salvage value is an estimate of the remaining value of an investment at the end of its useful life. For farm machinery (tractors and implements) the remaining value is a percentage of the new cost of the investment (Boehlje and Eidman). The percent remaining value is calculated from equations developed
2004 Table Grapes Costs and Returns Study (Crimson Seedless) San Joaquin Valley UC Cooperative Extension 9
by the American Society of Agricultural Engineers (ASAE) based on equipment type and years of life. The life in years is estimated by dividing the wear out life, as given by ASAE by the annual hours of use in this operation. For other investments including irrigation systems, buildings, and miscellaneous equipment, the value at the end of its useful life is zero. The salvage value for land is the purchase price because land does not depreciate. The purchase price and salvage value for equipment and investments are shown in Table 6.
Capital Recovery Factor. Capital recovery factor is the amortization factor or annual payment whose present value at compound interest is 1. The amortization factor is a table value that corresponds to the interest rate used and the life of the machine.
Interest Rate. The interest rate of 6.23% used to calculate capital recovery cost is the USDA-ERS’s ten-year average of California’s agricultural sector long-run rate of return to production assets from current income. It is used to reflect the long-term realized rate of return to these specialized resources that can only be used effectively in the agricultural sector.
Land. The land was formerly a vineyard, but has been out of production for two years. The open land was planted to grain crops. Land in the valley with table grape production ranges from $4,500 to $6,500 per acre. For this study, the land was assumed to be purchased with a producing vineyard; therefore a cost of $5,800 per acre or $6,052 per producing acre is used. Cropland with district water in the area ranges from $1,400 to $5,000.
Tools. This is an assumed value for shop, hand, and miscellaneous field tools and not based on any grower’s tool inventory.
Fuel Tanks. Two 300-gallon fuel tanks using gravity feed are on metal stands. The tanks are setup in a cement containment pad that meets federal, state, and county regulations.
Drip Irrigation System. The drip lines, filters, booster pump and the labor to install the components are included in the irrigation system cost. The previous vineyard is assumed to have a pumping system that had been refurbished and therefore is not included as a cost. Water is delivered from a 130-foot depth using a 40-horsepower pump.
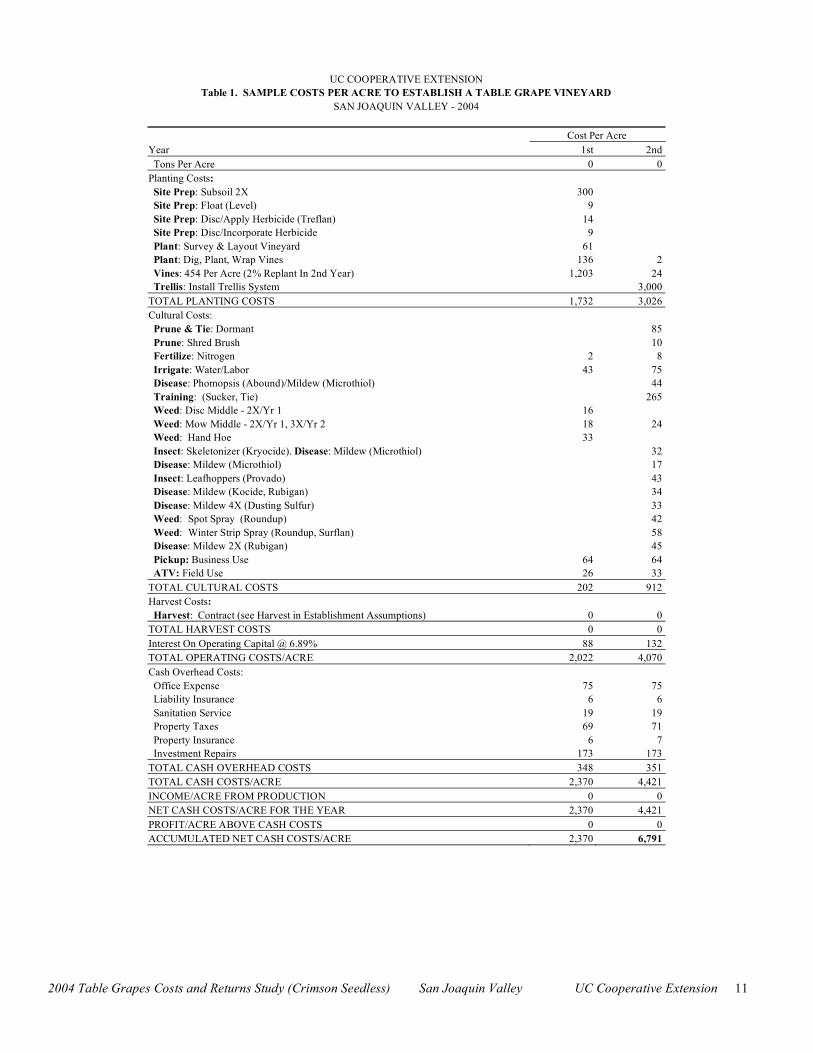
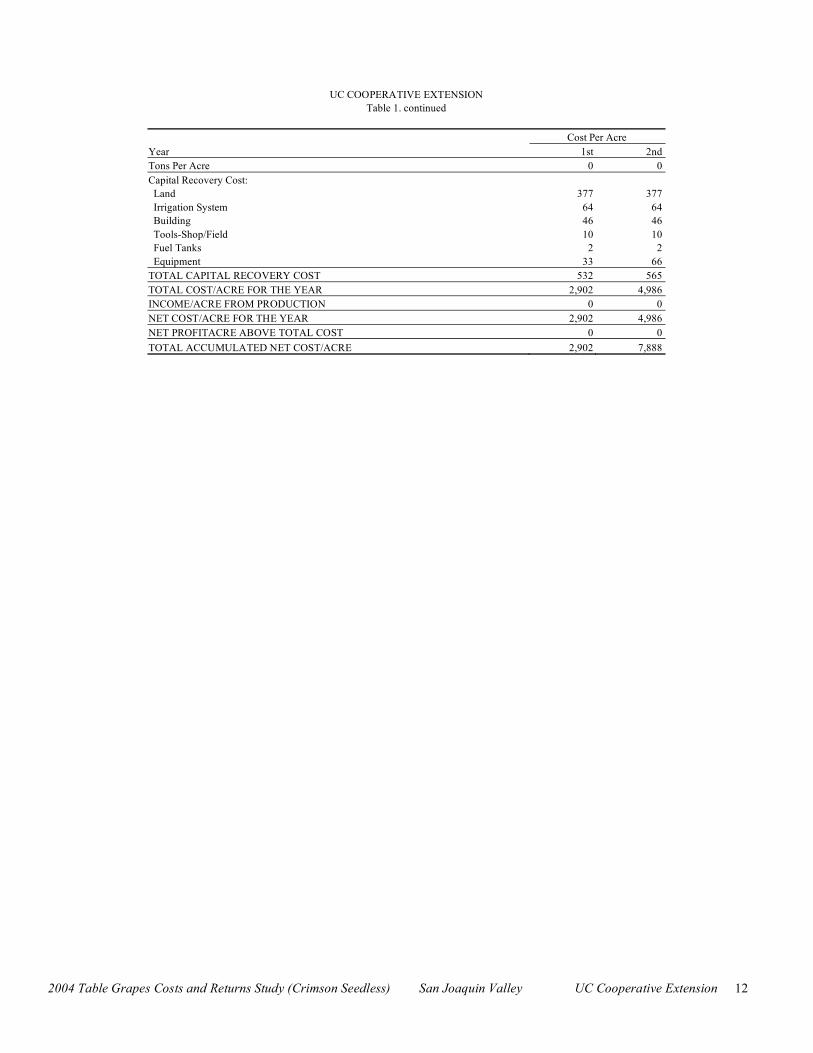
Establishment Cost. The establishment cost is the sum of the costs for land preparation, trellis system, planting, vines, cash overhead and production expenses for growing the vines through the second year that grapes are planted or first year that grapes are harvested. It is used to determine the non-cash overhead expense, capital recovery cost, during the production years. In some vineyards, the current variety may or may not produce a marketable crop in the second year. If a crop is harvested, the returns would be deducted from the net cash costs to determine establishment costs. In this study, no crop was produced in the second year; therefore, the Total Accumulated Net Cash Cost on Table 1, in the second year represents the establishment cost. For this study the cost is $6,791 per acre or $271,640 for the 40 producing acres. The establishment cost is spread over the remaining 23 years of the 25 years the vineyard is in production.
Equipment. Farm equipment is purchased new or used, but the study shows the current purchase price for new equipment. The new purchase price is adjusted to 60% to indicate a mix of new and used equipment. Annual ownership costs for equipment and other investments are shown in Table 6. Equipment costs are composed of three parts: non-cash overhead, cash overhead, and operating costs. Both of the overhead factors have been discussed in previous sections. The operating costs consist of repairs, fuel, and lubrication and are discussed under operating costs.
Table Values. Due to rounding, the totals may be slightly different from the sum of the components.
2004 Table Grapes Costs and Returns Study (Crimson Seedless) San Joaquin Valley UC Cooperative Extension 10
REFERENCES
Agriculture Commissioner. 1999 – 2003. Crop Reports. Fresno County Ag Commissioner, Fresno, CA. American Society of Agricultural Engineers. (ASAE). 1994. American Society of Agricultural Engineers
Standards Yearbook. St. Joseph, Missouri. Barker, Doug. April 22, 2003. California Workers’ Compensation Rating Data for Selected Agricultural
Classifications as of January 1, 2004 (Updated). California Department of Insurance, Rate Regulation Branch.
Boehlje, Michael D., and Vernon R. Eidman. 1984. Farm Management. John Wiley and Sons. New York, New
York California State Automobile Association. 2004. Gas Price Survey 2003. AAA Public Affairs, San Francisco,
CA. Christensen, Pete. Training Table Grape Vineyards. 1998. University of California Cooperative Extension,
Tulare, CA. Pub. #TB 11-98. Doanes. 1984. Facts and Figures for Farmers. 1984. Doane Publishing, St. Louis, MO. Jensen, Frederick L., William L. Peacock. Thompson Seedless. 1998. University of California Cooperative
Extension, Tulare, CA. Pub # TB7-97. University of California Statewide IPM Project. 2003. UC Pest Management Guidelines, Pistachios. University
of California, Davis CA. http://www.ipm.ucdavis.edu USDA-ERS. 2004. Farm Sector: Farm Financial Ratios. Agriculture and Rural Economics Division, ERS.
USDA. Washington, DC http://www.ers.usda.gov/data/farmbalancesheet/fbsdmu.htm; Internet; accessed January 5, 2004.
Vasquez, Stephen J., George M. Leavitt, William L. Peacock, L. Peter Christensen, Stephen R. Sutter, Kurt J.
Hembree, Karen L. Klonsky, Donald G. Katayama, and Richard L. De Moura. 2003. Sample Costs to
Establish a Vineyard and Produce Dried-on-Vine Raisins, San Joaquin Valley. University of California Cooperative Extension and the Department of Agricultural and Resource Economics. Davis, CA.
For information concerning the above or other University of California publications, contact your local county UC Cooperative Extension office or UC DANR
Communications Services online at http://ucanr.org .
2004 Table Grapes Costs and Returns Study (Crimson Seedless) San Joaquin Valley UC Cooperative Extension 11
UC COOPERATIVE EXTENSION
Table 1. SAMPLE COSTS PER ACRE TO ESTABLISH A TABLE GRAPE VINEYARD
SAN JOAQUIN VALLEY - 2004
Cost Per Acre
Year 1st 2nd
Tons Per Acre 0 0
Planting Costs:
Site Prep: Subsoil 2X 300
Site Prep: Float (Level) 9
Site Prep: Disc/Apply Herbicide (Treflan) 14
Site Prep: Disc/Incorporate Herbicide 9
Plant: Survey & Layout Vineyard 61
Plant: Dig, Plant, Wrap Vines 136 2
Vines: 454 Per Acre (2% Replant In 2nd Year) 1,203 24
Trellis: Install Trellis System 3,000
TOTAL PLANTING COSTS 1,732 3,026
Cultural Costs:
Prune & Tie: Dormant 85
Prune: Shred Brush 10
Fertilize: Nitrogen 2 8
Irrigate: Water/Labor 43 75
Disease: Phomopsis (Abound)/Mildew (Microthiol) 44
Training: (Sucker, Tie) 265
Weed: Disc Middle - 2X/Yr 1 16
Weed: Mow Middle - 2X/Yr 1, 3X/Yr 2 18 24
Weed: Hand Hoe 33
Insect: Skeletonizer (Kryocide). Disease: Mildew (Microthiol) 32
Disease: Mildew (Microthiol) 17
Insect: Leafhoppers (Provado) 43
Disease: Mildew (Kocide, Rubigan) 34
Disease: Mildew 4X (Dusting Sulfur) 33
Weed: Spot Spray (Roundup) 42
Weed: Winter Strip Spray (Roundup, Surflan) 58
Disease: Mildew 2X (Rubigan) 45
Pickup: Business Use 64 64
ATV: Field Use 26 33
TOTAL CULTURAL COSTS 202 912
Harvest Costs:
Harvest: Contract (see Harvest in Establishment Assumptions) 0 0
TOTAL HARVEST COSTS 0 0
Interest On Operating Capital @ 6.89% 88 132
TOTAL OPERATING COSTS/ACRE 2,022 4,070
Cash Overhead Costs:
Office Expense 75 75
Liability Insurance 6 6
Sanitation Service 19 19
Property Taxes 69 71
Property Insurance 6 7
Investment Repairs 173 173
TOTAL CASH OVERHEAD COSTS 348 351
TOTAL CASH COSTS/ACRE 2,370 4,421
INCOME/ACRE FROM PRODUCTION 0 0
NET CASH COSTS/ACRE FOR THE YEAR 2,370 4,421
PROFIT/ACRE ABOVE CASH COSTS 0 0
ACCUMULATED NET CASH COSTS/ACRE 2,370 6,791
2004 Table Grapes Costs and Returns Study (Crimson Seedless) San Joaquin Valley UC Cooperative Extension 12
UC COOPERATIVE EXTENSION
Table 1. continued
Cost Per Acre
Year 1st 2nd
Tons Per Acre 0 0
Capital Recovery Cost:
Land 377 377
Irrigation System 64 64
Building 46 46
Tools-Shop/Field 10 10
Fuel Tanks 2 2
Equipment 33 66
TOTAL CAPITAL RECOVERY COST 532 565
TOTAL COST/ACRE FOR THE YEAR 2,902 4,986
INCOME/ACRE FROM PRODUCTION 0 0
NET COST/ACRE FOR THE YEAR 2,902 4,986
NET PROFITACRE ABOVE TOTAL COST 0 0
TOTAL ACCUMULATED NET COST/ACRE 2,902 7,888
2004 Table Grapes Costs and Returns Study (Crimson Seedless) San Joaquin Valley UC Cooperative Extension 13
UC COOPERATIVE EXTENSION
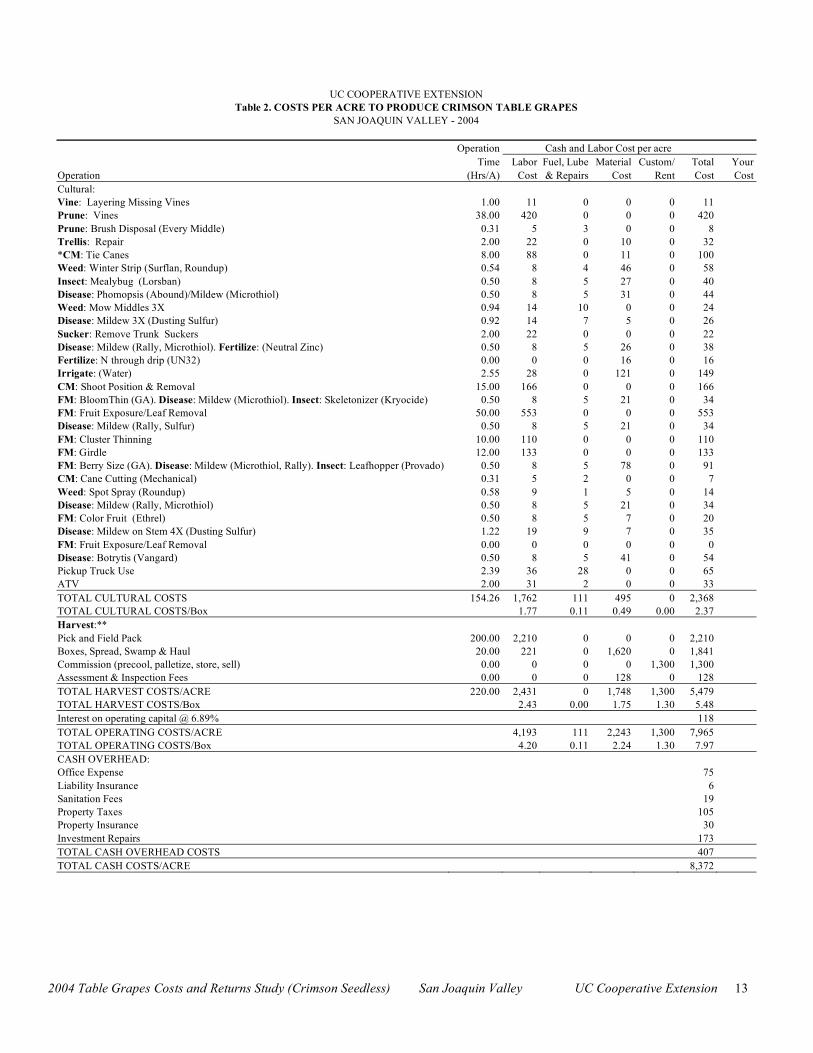
Table 2. COSTS PER ACRE TO PRODUCE CRIMSON TABLE GRAPES
SAN JOAQUIN VALLEY - 2004
Operation Cash and Labor Cost per acre
Time Labor Fuel, Lube Material Custom/ Total Your
Operation (Hrs/A) Cost & Repairs Cost Rent Cost Cost
Cultural:
Vine: Layering Missing Vines 1.00 11 0 0 0 11
Prune: Vines 38.00 420 0 0 0 420
Prune: Brush Disposal (Every Middle) 0.31 5 3 0 0 8
Trellis: Repair 2.00 22 0 10 0 32
*CM: Tie Canes 8.00 88 0 11 0 100
Weed: Winter Strip (Surflan, Roundup) 0.54 8 4 46 0 58
Insect: Mealybug (Lorsban) 0.50 8 5 27 0 40
Disease: Phomopsis (Abound)/Mildew (Microthiol) 0.50 8 5 31 0 44
Weed: Mow Middles 3X 0.94 14 10 0 0 24
Disease: Mildew 3X (Dusting Sulfur) 0.92 14 7 5 0 26
Sucker: Remove Trunk Suckers 2.00 22 0 0 0 22
Disease: Mildew (Rally, Microthiol). Fertilize: (Neutral Zinc) 0.50 8 5 26 0 38
Fertilize: N through drip (UN32) 0.00 0 0 16 0 16
Irrigate: (Water) 2.55 28 0 121 0 149
CM: Shoot Position & Removal 15.00 166 0 0 0 166
FM: BloomThin (GA). Disease: Mildew (Microthiol). Insect: Skeletonizer (Kryocide) 0.50 8 5 21 0 34
FM: Fruit Exposure/Leaf Removal 50.00 553 0 0 0 553
Disease: Mildew (Rally, Sulfur) 0.50 8 5 21 0 34
FM: Cluster Thinning 10.00 110 0 0 0 110
FM: Girdle 12.00 133 0 0 0 133
FM: Berry Size (GA). Disease: Mildew (Microthiol, Rally). Insect: Leafhopper (Provado) 0.50 8 5 78 0 91
CM: Cane Cutting (Mechanical) 0.31 5 2 0 0 7
Weed: Spot Spray (Roundup) 0.58 9 1 5 0 14
Disease: Mildew (Rally, Microthiol) 0.50 8 5 21 0 34
FM: Color Fruit (Ethrel) 0.50 8 5 7 0 20
Disease: Mildew on Stem 4X (Dusting Sulfur) 1.22 19 9 7 0 35
FM: Fruit Exposure/Leaf Removal 0.00 0 0 0 0 0
Disease: Botrytis (Vangard) 0.50 8 5 41 0 54
Pickup Truck Use 2.39 36 28 0 0 65
ATV 2.00 31 2 0 0 33
TOTAL CULTURAL COSTS 154.26 1,762 111 495 0 2,368
TOTAL CULTURAL COSTS/Box 1.77 0.11 0.49 0.00 2.37
Harvest:**
Pick and Field Pack 200.00 2,210 0 0 0 2,210
Boxes, Spread, Swamp & Haul 20.00 221 0 1,620 0 1,841
Commission (precool, palletize, store, sell) 0.00 0 0 0 1,300 1,300
Assessment & Inspection Fees 0.00 0 0 128 0 128
TOTAL HARVEST COSTS/ACRE 220.00 2,431 0 1,748 1,300 5,479
TOTAL HARVEST COSTS/Box 2.43 0.00 1.75 1.30 5.48
Interest on operating capital @ 6.89% 118
TOTAL OPERATING COSTS/ACRE 4,193 111 2,243 1,300 7,965
TOTAL OPERATING COSTS/Box 4.20 0.11 2.24 1.30 7.97
CASH OVERHEAD:
Office Expense 75
Liability Insurance 6
Sanitation Fees 19
Property Taxes 105
Property Insurance 30
Investment Repairs 173
TOTAL CASH OVERHEAD COSTS 407
TOTAL CASH COSTS/ACRE 8,372
2004 Table Grapes Costs and Returns Study (Crimson Seedless) San Joaquin Valley UC Cooperative Extension 14
UC COOPERATIVE EXTENSION
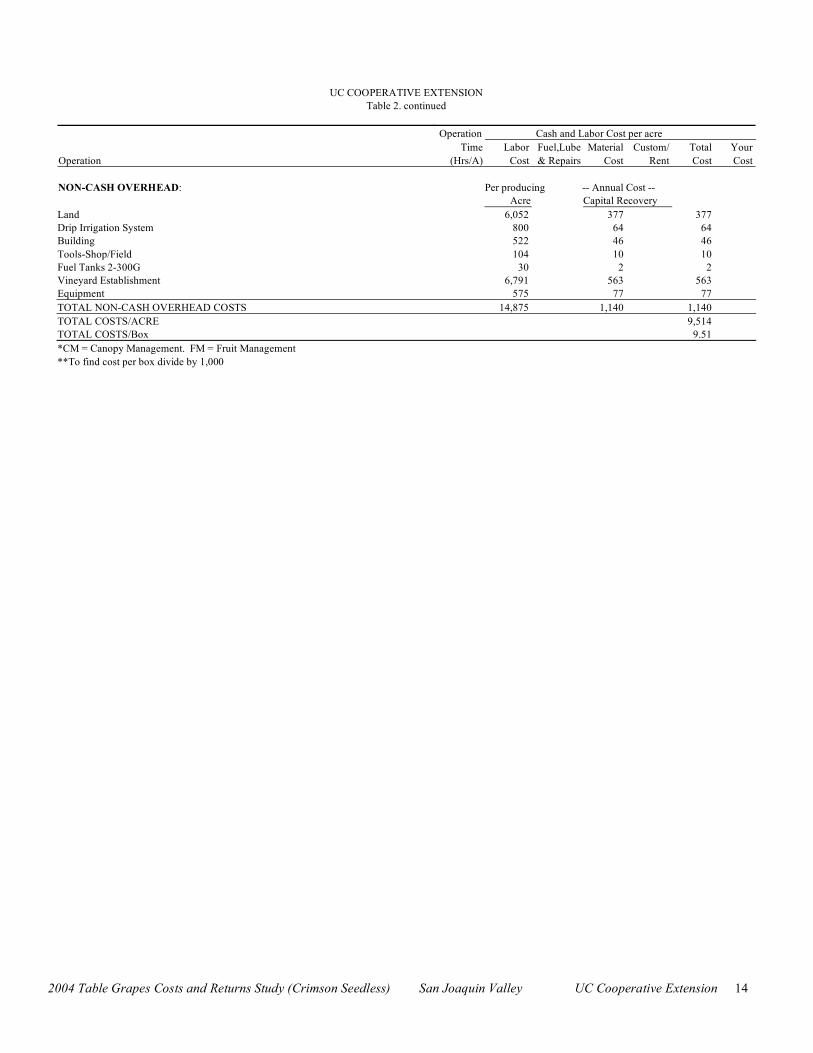
Table 2. continued
Operation Cash and Labor Cost per acre
Time Labor Fuel,Lube Material Custom/ Total Your
Operation (Hrs/A) Cost & Repairs Cost Rent Cost Cost
NON-CASH OVERHEAD: Per producing -- Annual Cost --
Acre Capital Recovery
Land 6,052 377 377
Drip Irrigation System 800 64 64
Building 522 46 46
Tools-Shop/Field 104 10 10
Fuel Tanks 2-300G 30 2 2
Vineyard Establishment 6,791 563 563
Equipment 575 77 77
TOTAL NON-CASH OVERHEAD COSTS 14,875 1,140 1,140
TOTAL COSTS/ACRE 9,514
TOTAL COSTS/Box 9.51
*CM = Canopy Management. FM = Fruit Management
**To find cost per box divide by 1,000
2004 Table Grapes Costs and Returns Study (Crimson Seedless) San Joaquin Valley UC Cooperative Extension 15
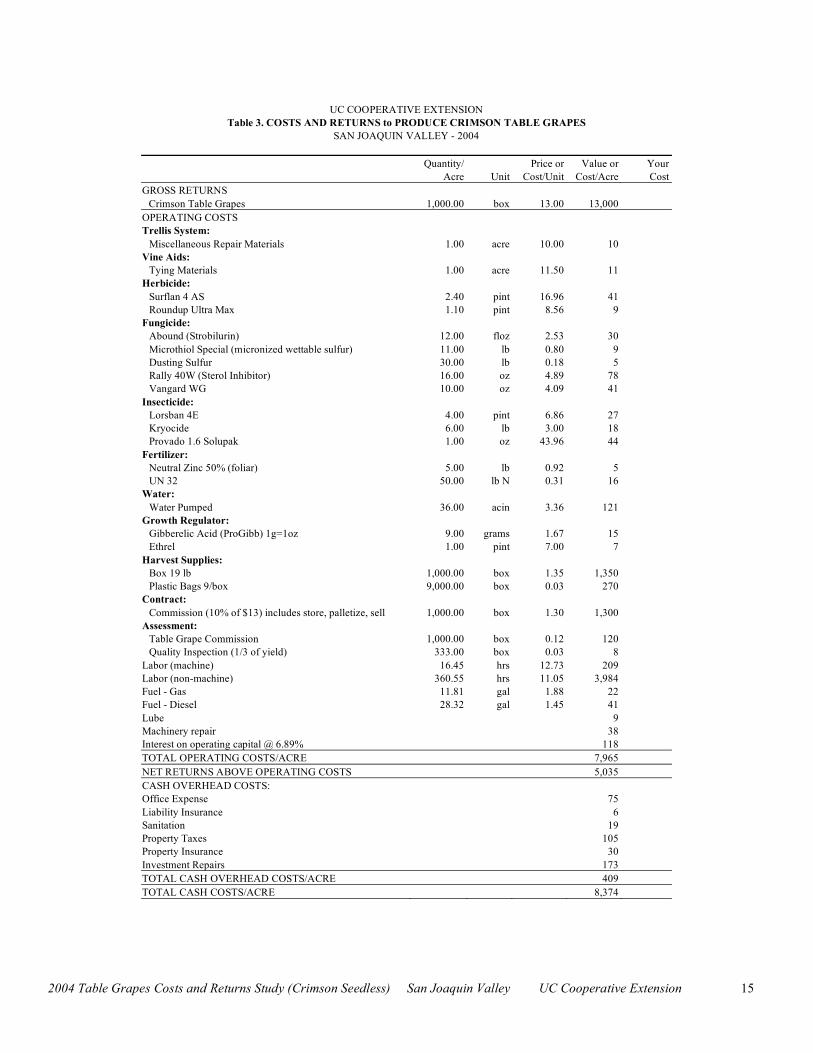
UC COOPERATIVE EXTENSION
Table 3. COSTS AND RETURNS to PRODUCE CRIMSON TABLE GRAPES
SAN JOAQUIN VALLEY - 2004
Quantity/ Price or Value or Your
Acre Unit Cost/Unit Cost/Acre Cost
GROSS RETURNS
Crimson Table Grapes 1,000.00 box 13.00 13,000
OPERATING COSTS
Trellis System:
Miscellaneous Repair Materials 1.00 acre 10.00 10
Vine Aids:
Tying Materials 1.00 acre 11.50 11
Herbicide:
Surflan 4 AS 2.40 pint 16.96 41
Roundup Ultra Max 1.10 pint 8.56 9
Fungicide:
Abound (Strobilurin) 12.00 floz 2.53 30
Microthiol Special (micronized wettable sulfur) 11.00 lb 0.80 9
Dusting Sulfur 30.00 lb 0.18 5
Rally 40W (Sterol Inhibitor) 16.00 oz 4.89 78
Vangard WG 10.00 oz 4.09 41
Insecticide:
Lorsban 4E 4.00 pint 6.86 27
Kryocide 6.00 lb 3.00 18
Provado 1.6 Solupak 1.00 oz 43.96 44
Fertilizer:
Neutral Zinc 50% (foliar) 5.00 lb 0.92 5
UN 32 50.00 lb N 0.31 16
Water:
Water Pumped 36.00 acin 3.36 121
Growth Regulator:
Gibberelic Acid (ProGibb) 1g=1oz 9.00 grams 1.67 15
Ethrel 1.00 pint 7.00 7
Harvest Supplies:
Box 19 lb 1,000.00 box 1.35 1,350
Plastic Bags 9/box 9,000.00 box 0.03 270
Contract:
Commission (10% of $13) includes store, palletize, sell 1,000.00 box 1.30 1,300
Assessment:
Table Grape Commission 1,000.00 box 0.12 120
Quality Inspection (1/3 of yield) 333.00 box 0.03 8
Labor (machine) 16.45 hrs 12.73 209
Labor (non-machine) 360.55 hrs 11.05 3,984
Fuel - Gas 11.81 gal 1.88 22
Fuel - Diesel 28.32 gal 1.45 41
Lube 9
Machinery repair 38
Interest on operating capital @ 6.89% 118
TOTAL OPERATING COSTS/ACRE 7,965
NET RETURNS ABOVE OPERATING COSTS 5,035
CASH OVERHEAD COSTS:
Office Expense 75
Liability Insurance 6
Sanitation 19
Property Taxes 105
Property Insurance 30
Investment Repairs 173
TOTAL CASH OVERHEAD COSTS/ACRE 409
TOTAL CASH COSTS/ACRE 8,374
2004 Table Grapes Costs and Returns Study (Crimson Seedless) San Joaquin Valley UC Cooperative Extension 16
UC Cooperative Extension
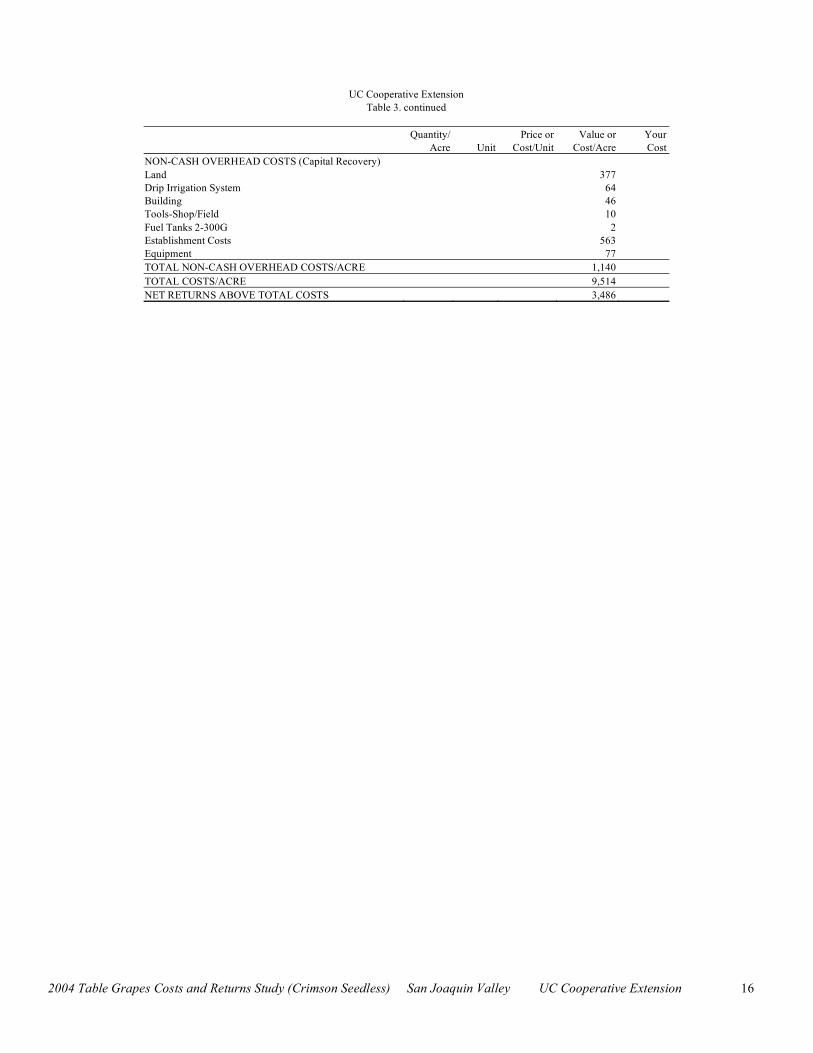
Table 3. continued
Quantity/ Price or Value or Your
Acre Unit Cost/Unit Cost/Acre Cost
NON-CASH OVERHEAD COSTS (Capital Recovery)
Land 377
Drip Irrigation System 64
Building 46
Tools-Shop/Field 10
Fuel Tanks 2-300G 2
Establishment Costs 563
Equipment 77
TOTAL NON-CASH OVERHEAD COSTS/ACRE 1,140
TOTAL COSTS/ACRE 9,514
NET RETURNS ABOVE TOTAL COSTS 3,486
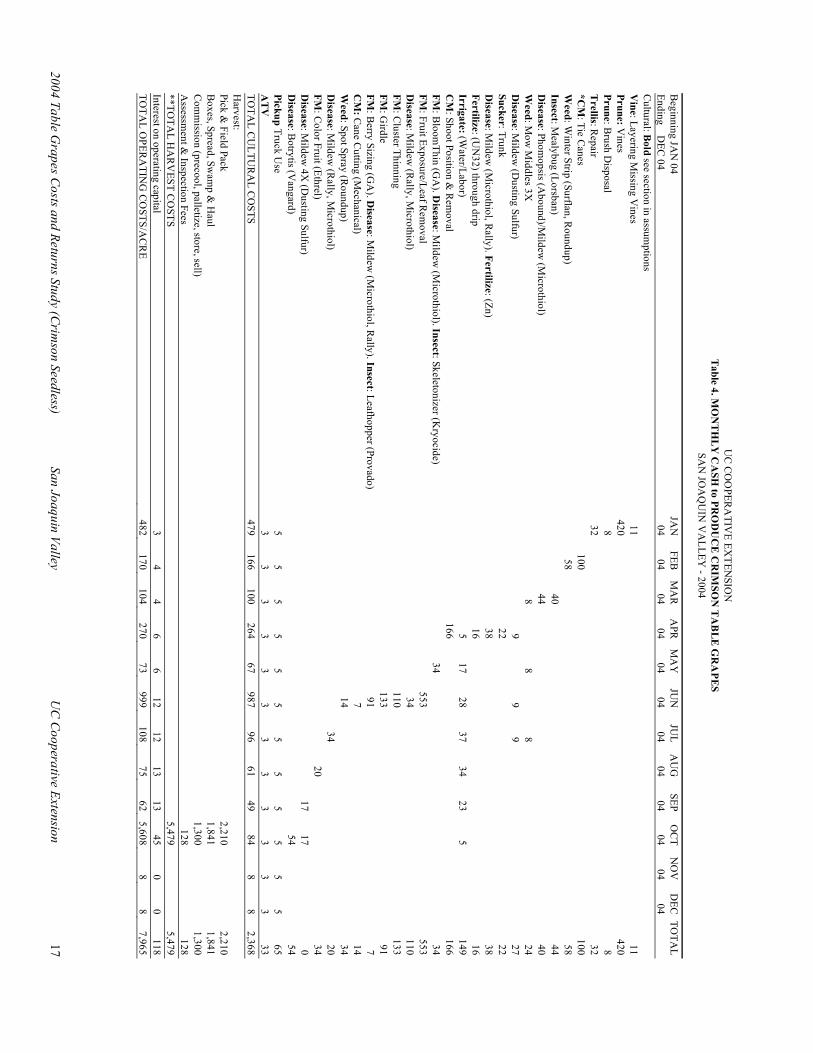
20
04
Ta
ble G
rap
es C
osts a
nd
Retu
rns S
tud
y (Crim
son
Seed
less) S
an
Joa
qu
in V
alle
y
UC
Co
op
erative
Exten
sion
1
7
U
C C
OO
PE
RA
TIV
E E
XT
EN
SIO
N
Ta
ble
4. M
ON
TH
LY
CA
SH
to P
RO
DU
CE
CR
IMS
ON
TA
BL
E G
RA
PE
S
SA
N JO
AQ
UIN
VA
LL
EY
- 20
04
Beg
inn
ing
JAN
04
JA
N
FE
B
MA
R
AP
R
MA
Y
JUN
JU
L
AU
G
SE
P
OC
T
NO
V
DE
C
TO
TA
L
En
din
g D
EC
04
0
4
04
0
4
04
0
4
04
0
4
04
0
4
04
0
4
04
Cu
ltural: B
old
see section
in assu
mp
tion
s
Vin
e: Lay
erin
g M
issing
Vin
es
11
11
Pru
ne: V
ines
42
0
4
20
Pru
ne: B
rush
Disp
osal
8
8
Trellis: R
epair
32
32
*C
M: T
ie C
anes
1
00
1
00
Weed
: Win
ter S
trip (S
urfla
n, R
ou
nd
up
)
58
5
8
Inse
ct: M
ealy
bu
g (L
orsb
an
)
4
0
4
4
Dise
ase: P
ho
mo
psis (A
bo
und
)/Mild
ew (M
icroth
iol)
44
40
Weed
: Mo
w M
idd
les 3
X
8
8
8
2
4
Dise
ase: M
ildew
(Du
sting
Su
lfur)
9
9
9
2
7
Su
ck
er: T
run
k
2
2
22
Dise
ase: M
ildew
(Micro
thio
l, Rally
). Fertiliz
e: (Zn
)
38
3
8
Fertiliz
e: (UN
32
) thro
ug
h d
rip
1
6
16
Irrig
ate
: (Wate
r/Lab
or)
5
1
7
28
3
7
34
2
3
5
14
9
CM
: Sh
oo
t Po
sition
& R
emo
val
1
66
1
66
FM
: Blo
om
Th
in (G
A). D
isea
se: Mild
ew (M
icroth
iol). In
sect: S
kele
ton
izer (K
ryo
cid
e)
34
34
FM
: Fru
it Ex
po
sure
/Leaf R
emo
val
5
53
5
53
Dise
ase: M
ildew
(Rally
, Micro
thio
l)
34
1
10
FM
: Clu
ster Th
inn
ing
11
0
13
3
FM
: Gird
le
13
3
91
FM
: Berry
Sizin
g (G
A). D
isea
se: Mild
ew (M
icroth
iol, R
ally). In
sect: L
eafho
pp
er (Pro
vad
o)
9
1
7
CM
: Can
e C
uttin
g (M
ech
an
ical)
7
1
4
Weed
: Sp
ot S
pray
(Ro
un
du
p)
1
4
34
Dise
ase: M
ildew
(Rally
, Micro
thio
l)
3
4
2
0
FM
: Co
lor F
ruit (E
threl)
2
0
34
Dise
ase: M
ildew
4X
(Du
sting
Su
lfur)
17
1
7
0
Dise
ase: B
otry
tis (Van
gard
)
54
5
4
Pic
ku
p T
ruck
Use
5
5
5
5
5
5
5
5
5
5
5
5
65
AT
V
3
3
3
3
3
3
3
3
3
3
3
3
33
TO
TA
L C
UL
TU
RA
L C
OS
TS
4
79
1
66
1
00
2
64
6
7
98
7
96
6
1
49
8
4
8
8
2,3
68
Harv
est:
Pic
k &
Fie
ld P
ack
2,2
10
2
,21
0
Bo
xes, S
pre
ad
, Sw
am
p &
Hau
l
1,8
41
1
,84
1
Co
mm
ission
(pre
co
ol, p
alletiz
e, sto
re, sell)
1
,30
0
1,3
00
Assessm
ent &
Insp
ection
Fees
1
28
1
28
**
TO
TA
L H
AR
VE
ST
CO
ST
S
5
,47
9
5,4
79
Interest o
n o
peratin
g cap
ital 3
4
4
6
6
1
2
12
1
3
13
4
5
0
0
11
8
TO
TA
L O
PE
RA
TIN
G C
OS
TS
/AC
RE
4
82
1
70
1
04
2
70
7
3
99
9
10
8
75
6
2
5,6
08
8
8
7
,96
5
20
04
Ta
ble G
rap
es C
osts a
nd
Retu
rns S
tud
y (Crim
son
Seed
less) S
an
Joa
qu
in V
alle
y
UC
Co
op
erative
Exten
sion
1
8
U
C C
OO
PE
RA
TIV
E E
XT
EN
SIO
N
Tab
le 4
. co
ntin
ued
Beg
inn
ing
JAN
04
JA
N
FE
B
MA
R
AP
R
MA
Y
JUN
JU
L
AU
G
SE
P
OC
T
NO
V
DE
C
TO
TA
L
En
din
g D
EC
04
0
4
04
0
4
04
0
4
04
0
4
04
0
4
04
0
4
04
OV
ER
HE
AD
:
Offic
e E
xp
en
se
6
6
6
6
6
6
6
6
6
6
6
6
75
Liab
ility In
suran
ce
6
6
San
itation
Fees
2
2
2
2
2
2
2
2
2
2
19
Pro
perty
Tax
es 5
3
5
3
1
05
Pro
perty
Insu
rance
15
15
30
Inv
estmen
t Rep
airs 1
4
14
1
4
14
1
4
14
1
4
14
1
4
14
1
4
14
1
73
TO
TA
L C
AS
H O
VE
RH
EA
D C
OS
TS
8
9
22
2
2
22
2
2
22
8
9
22
2
8
22
2
0
20
4
09
TO
TA
L C
AS
H C
OS
TS
/AC
RE
5
72
1
92
1
27
2
92
9
6
1,0
21
1
97
9
7
89
5
,63
1
29
2
9
8,3
74
*C
M =
Can
op
y M
anag
em
ent. F
M =
Fru
it Man
ag
em
ent
**
To
find
co
st per b
ox
div
ide b
y 1
,00
0
2004 Table Grapes Costs and Returns Study (Crimson Seedless) San Joaquin Valley UC Cooperative Extension 19
UC COOPERATIVE EXTENSION
Table 5. RANGING ANALYSIS
SAN JOAQUIN VALLEY - 2004
COSTS PER ACRE AT VARYING YIELD TO PRODUCE CRIMSON TABLE GRAPES
YIELD (19 lb box/acre)
600 700 800 900 1,000 1,100 1,200
OPERATING COSTS:
Cultural Cost 2,368 2,368 2,368 2,368 2,368 2,368 2,368
Harvest Cost 2,431 2,836 3,241 3,646 4,051 4,456 4,861
Commission (precool, palletize, store, sell) 780 910 1040 1170 1300 1430 1560
Assessment/Inspection Cost 77 90 103 115 128 141 154
Interest on operating capital 105 108 111 114 118 121 124
TOTAL OPERATING COSTS/ACRE 5,761 6,312 6,863 7,413 7,965 8,516 9,067
Total Operating Costs/box 9.60 9.02 8.58 8.24 7.97 7.74 7.56
CASH OVERHEAD COSTS/ACRE 409 409 409 409 409 409 409
TOTAL CASH COSTS/ACRE 6,170 6,721 7,272 7,822 8,374 8,925 9,476
Total Cash Costs/box 10.28 9.60 9.09 8.69 8.37 8.11 7.90
NON-CASH OVERHEAD COSTS/ACRE 1,140 1,140 1,140 1,140 1,140 1,140 1,140
TOTAL COSTS/ACRE 7,310 7,861 8,412 8,962 9,514 10,065 10,616
Total Costs/box 12.18 11.23 10.52 9.96 9.51 9.15 8.85
NET RETURNS PER ACRE ABOVE OPERATING COSTS
PRICE YIELD (19 lb box/acre)
$/box 600 700 800 900 1,000 1,100 1,200
8.00 -961 -712 -463 -213 35 284 533
9.00 -361 -12 337 687 1,035 1,384 1,733
10.00 239 688 1,137 1,587 2,035 2,484 2,933
11.00 839 1,388 1,937 2,487 3,035 3,584 4,133
12.00 1,439 2,088 2,737 3,387 4,035 4,684 5,333
13.00 2,039 2,788 3,537 4,287 5,035 5,784 6,533
14.00 2,639 3,488 4,337 5,187 6,035 6,884 7,733
NET RETURNS PER ACRE ABOVE CASH COST
PRICE YIELD 19 lb box/acre)
$/box 600 700 800 900 1,000 1,100 1,200
8.00 -1,370 -1,121 -872 -622 -374 -125 124
9.00 -770 -421 -72 278 626 975 1,324
10.00 -170 279 728 1,178 1,626 2,075 2,524
11.00 430 979 1,528 2,078 2,626 3,175 3,724
12.00 1,030 1,679 2,328 2,978 3,626 4,275 4,924
13.00 1,630 2,379 3,128 3,878 4,626 5,375 6,124
14.00 2,230 3,079 3,928 4,778 5,626 6,475 7,324
NET RETURNS PER ACRE ABOVE TOTAL COST
PRICE YIELD (19 lb box/acre)
$/box 600 700 800 900 1,000 1,100 1,200
8.00 -2,510 -2,261 -2,012 -1,762 -1,514 -1,265 -1,016
9.00 -1,910 -1,561 -1,212 -862 -514 -165 184
10.00 -1,310 -861 -412 38 486 935 1,384
11.00 -710 -161 388 938 1,486 2,035 2,584
12.00 -110 539 1,188 1,838 2,486 3,135 3,784
13.00 490 1,239 1,988 2,738 3,486 4,235 4,984
14.00 1,090 1,939 2,788 3,638 4,486 5,335 6,184
2004 Table Grapes Costs and Returns Study (Crimson Seedless) San Joaquin Valley UC Cooperative Extension 20
UC COOPERATIVE EXTENSION
Table 6. WHOLE FARM ANNUAL EQUIPMENT, INVESTMENT,
SAN JOAQUIN VALLEY - 2004
ANNUAL EQUIPMENT COSTS
Cash Overhead
Yrs Salvage Capital Insur-
Yr Description Price Life Value Recovery ance Taxes Total
04 60 HP 4WD Narrow Tractor 36,000 15 7,009 3,467 145 215 3,827
04 ATV 4WD 6,700 5 3,003 1,070 33 49 1,152
04 Cane Cutter 2,500 20 130 219 9 13 241
04 Duster - 3 Pt 12' 5,000 5 1,629 907 22 33 962
04 Mower-Flail 8' 9,600 15 922 964 36 53 1,053
04 Orchard/Vine Sprayer 500 gal 20,378 5 6,638 3,696 91 135 3,922
04 Pickup Truck 1/2 T 26,000 7 9,863 3,529 121 179 3,829
04 Sprayer ATV 20 gal 350 10 62 43 1 2 47
04 Weed Sprayer 3 PT 100 gal 3,500 10 619 434 14 21 469
TOTAL 110,028 29,875 14,329 472 700 15,502
60% of New Cost * 66,017 17,925 8,597 284 420 9,301
* Used to reflect a mix of new and used equipment.
ANNUAL INVESTMENT COSTS
Cash Overhead
Yrs Salvage Capital Insur-
Description Price Life Value Recovery ance Taxes Repairs Total
Building 2,400 sqft 60,000 20 5,329 203 300 1,200 7,032
Drip Irrigation System 115 acres 92,000 25 7,355 311 460 18,440 26,566
Vineyard Establishment 262,120 23 21,746 886 1,311 0 23,943
Fuel Tanks 2-300 gal 3,500 30 350 256 13 19 70 359
Land 696,000 25 696,000 43,361 0 6,960 0 50,321
Tools-Shop/Field 12,000 15 1,133 1,206 44 66 240 1,556
TOTAL INVESTMENT 1,125,620 697,483 79,253 1,457 9,116 19,950 109,777
ANNUAL BUSINESS OVERHEAD COSTS
Units/ Price/ Total
Description Farm Unit Unit Cost
Liability Insurance 115 acre 5.60 644
Office Expense 115 acre 75.00 8,625
Sanitation Fee 115 acre 18.96 2,180
UC COOPERATIVE EXTENSION
Table 7. HOURLY EQUIPMENT COSTS
SAN JOAQUIN VALLEY - 2004
COSTS PER HOUR
Actual Cash Overhead Operating
Hours Capital Insur- Fuel & Total Total
Yr Description Used Recovery ance Taxes Repairs Lube Opera. Costs/Hr.
04 60 HP 4WD Narrow Tractor 1,065.70 1.95 0.08 0.12 0.88 4.91 5.79 7.95
04 Cane Cutter 400.10 1.61 0.05 0.07 0.50 0.72 1.22 2.94
04 ATV 4WD 99.50 1.32 0.05 0.08 0.95 0.00 0.95 2.40
04 Duster - 3 Pt 12' 239.70 2.27 0.06 0.08 0.73 0.00 0.76 3.14
04 Mower-Flail 8' 120.10 4.82 0.18 0.26 4.31 0.00 4.31 9.57
04 Orchard/Vine Sprayer 500 gal 400.20 5.54 0.14 0.20 3.58 0.00 3.58 9.46
04 Pickup Truck 1/2 T 285.50 7.42 0.25 0.38 1.91 9.91 11.82 19.87
04 Sprayer ATV 20 gal 150.10 0.17 0.01 0.01 0.10 0.00 0.10 0.28
04 Weed Sprayer 3 PT 100 gal 200.20 1.30 0.04 0.06 0.61 0.00 0.61 2.01
2004 Table Grapes Costs and Returns Study (Crimson Seedless) San Joaquin Valley UC Cooperative Extension 21
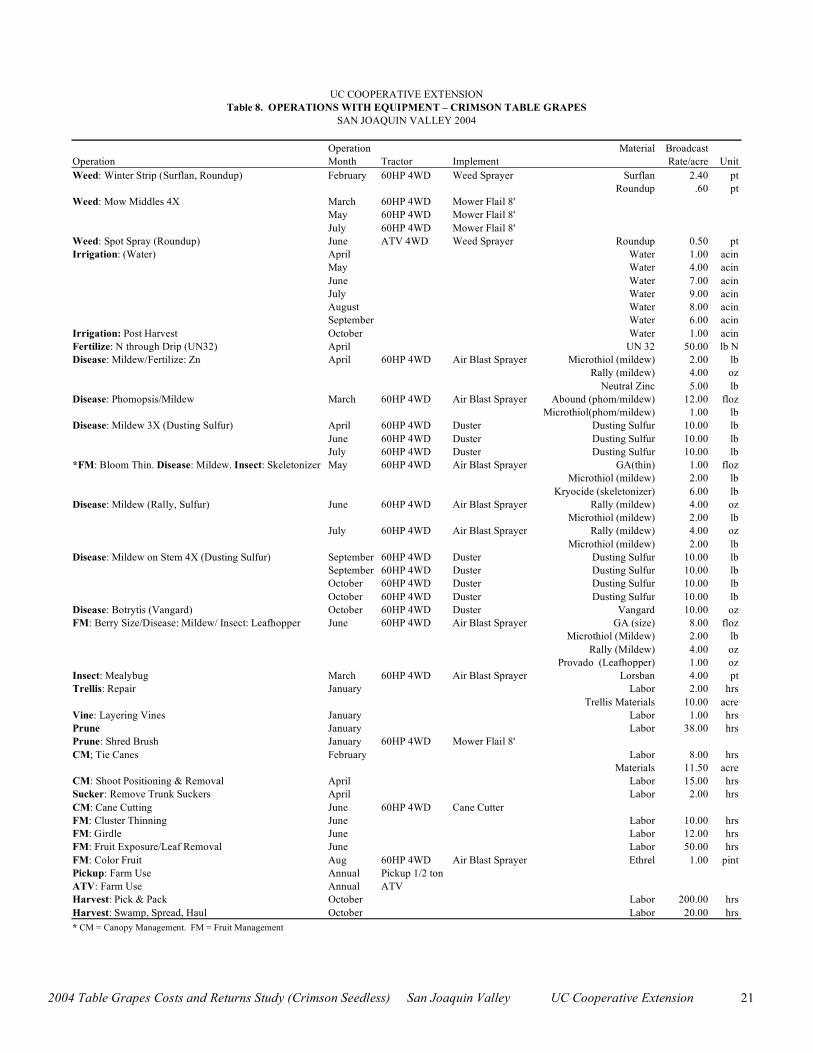
UC COOPERATIVE EXTENSION
Table 8. OPERATIONS WITH EQUIPMENT – CRIMSON TABLE GRAPES
SAN JOAQUIN VALLEY 2004
Operation Material Broadcast
Operation Month Tractor Implement Rate/acre Unit
Weed: Winter Strip (Surflan, Roundup) February 60HP 4WD Weed Sprayer Surflan 2.40 pt
Roundup .60 pt
Weed: Mow Middles 4X March 60HP 4WD Mower Flail 8'
May 60HP 4WD Mower Flail 8'
July 60HP 4WD Mower Flail 8'
Weed: Spot Spray (Roundup) June ATV 4WD Weed Sprayer Roundup 0.50 pt
Irrigation: (Water) April Water 1.00 acin
May Water 4.00 acin
June Water 7.00 acin
July Water 9.00 acin
August Water 8.00 acin
September Water 6.00 acin
Irrigation: Post Harvest October Water 1.00 acin
Fertilize: N through Drip (UN32) April UN 32 50.00 lb N
Disease: Mildew/Fertilize: Zn April 60HP 4WD Air Blast Sprayer Microthiol (mildew) 2.00 lb
Rally (mildew) 4.00 oz
Neutral Zinc 5.00 lb
Disease: Phomopsis/Mildew March 60HP 4WD Air Blast Sprayer Abound (phom/mildew) 12.00 floz
Microthiol(phom/mildew) 1.00 lb
Disease: Mildew 3X (Dusting Sulfur) April 60HP 4WD Duster Dusting Sulfur 10.00 lb
June 60HP 4WD Duster Dusting Sulfur 10.00 lb
July 60HP 4WD Duster Dusting Sulfur 10.00 lb
*FM: Bloom Thin. Disease: Mildew. Insect: Skeletonizer May 60HP 4WD Air Blast Sprayer GA(thin) 1.00 floz
Microthiol (mildew) 2.00 lb
Kryocide (skeletonizer) 6.00 lb
Disease: Mildew (Rally, Sulfur) June 60HP 4WD Air Blast Sprayer Rally (mildew) 4.00 oz
Microthiol (mildew) 2.00 lb
July 60HP 4WD Air Blast Sprayer Rally (mildew) 4.00 oz
Microthiol (mildew) 2.00 lb
Disease: Mildew on Stem 4X (Dusting Sulfur) September 60HP 4WD Duster Dusting Sulfur 10.00 lb
September 60HP 4WD Duster Dusting Sulfur 10.00 lb
October 60HP 4WD Duster Dusting Sulfur 10.00 lb
October 60HP 4WD Duster Dusting Sulfur 10.00 lb
Disease: Botrytis (Vangard) October 60HP 4WD Duster Vangard 10.00 oz
FM: Berry Size/Disease: Mildew/ Insect: Leafhopper June 60HP 4WD Air Blast Sprayer GA (size) 8.00 floz
Microthiol (Mildew) 2.00 lb
Rally (Mildew) 4.00 oz
Provado (Leafhopper) 1.00 oz
Insect: Mealybug March 60HP 4WD Air Blast Sprayer Lorsban 4.00 pt
Trellis: Repair January Labor 2.00 hrs
Trellis Materials 10.00 acre
Vine: Layering Vines January Labor 1.00 hrs
Prune January Labor 38.00 hrs
Prune: Shred Brush January 60HP 4WD Mower Flail 8'
CM; Tie Canes February Labor 8.00 hrs
Materials 11.50 acre
CM: Shoot Positioning & Removal April Labor 15.00 hrs
Sucker: Remove Trunk Suckers April Labor 2.00 hrs
CM: Cane Cutting June 60HP 4WD Cane Cutter
FM: Cluster Thinning June Labor 10.00 hrs
FM: Girdle June Labor 12.00 hrs
FM: Fruit Exposure/Leaf Removal June Labor 50.00 hrs
FM: Color Fruit Aug 60HP 4WD Air Blast Sprayer Ethrel 1.00 pint
Pickup: Farm Use Annual Pickup 1/2 ton
ATV: Farm Use Annual ATV
Harvest: Pick & Pack October Labor 200.00 hrs
Harvest: Swamp, Spread, Haul October Labor 20.00 hrs
* CM = Canopy Management. FM = Fruit Management