Embed Size (px)
Citation preview

Emily SymmesE
UNIVERSITY OF CALIFORNIA COOPERATIVE EXTENSION AGRICULTURE AND NATURAL RESOURCES
AGRICULTURAL ISSUES CENTER
2018
SAMPLE COSTS TO ESTABLISH AND PRODUCE
ENGLISH WALNUTS
In the Sacramento Valley Micro Sprinkler Irrigated
Janine K. Hasey UC Cooperative Extension Farm Advisor, Sutter, Yuba and Colusa Counties Dani Lightle UC Cooperative Extension Farm Advisor, Glenn, Butte and Tehama Counties Katherine Jarvis-Shean UC Cooperative Extension Farm Advisor, Yolo, Solano and Sacramento Counties Luke Milliron UC Cooperative Extension Farm Advisor, Butte, Tehama and Glenn Counties Emily Symmes UC Cooperative Extension Area IPM Advisor, Sacramento Valley Brad Hanson UC Cooperative Extension Weed Specialist, UC Davis Alan Fulton UC Cooperative Extension Irrigation and Water Resources Advisor, Tehama,
Colusa, Glenn and Shasta Counties Jeremy Murdock Staff Research Associate, Agricultural Issues Center, Department of Agricultural
and Resource Economics, UC Davis Daniel A. Sumner Director, University of California Agricultural Issues Center and Frank H.
Buck, Jr. Professor, Department of Agricultural and Resource Economics, University of California, Davis

UC AGRICULTURE AND NATURAL RESOURCES COOPERATIVE EXTENSION
AGRICULTURAL ISSUES CENTER UC DAVIS DEPARTMENT OF AGRICULTURAL AND RESOURCE ECONOMICS
SAMPLE COSTS TO ESTABLISH AND PRODUCE WALNUTS Sacramento Valley – 2018
CONTENTS INTRODUCTION 2 ASSUMPTIONS 3 Establishment Cultural Practices and Material Inputs 3 Production Cultural Practices and Material Inputs 6 Labor, Interest and Equipment 8 Cash Overhead 9 Non-Cash Overhead 10 REFERENCES 12 Table 1. SAMPLE COSTS PER ACRE TO ESTABLISH A WALNUT ORCHARD 13 Table 2. COSTS PER ACRE TO PRODUCE WALNUTS 15 Table 3. COSTS AND RETURNS PER ACRE TO PRODUCE WALNUTS 17 Table 4. MONTHLY CASH COSTS – WALNUTS 19 Table 5. RANGING ANALYSIS 20 Table 6. WHOLE FARM EQUIPMENT, INVESTMENT, AND BUSINESS OVERHEAD COSTS 21 Table 7. HOURLY EQUIPMENT COSTS 22 Table 8. OPERATIONS WITH EQUIPMENT & MATERIAL INPUTS 23
INTRODUCTION
Sample costs to establish a walnut orchard and produce walnuts under micro-sprinkler irrigation in the Sacramento Valley are presented in this study. The study is intended as a guide only. It can be used to guide production decisions, estimate potential returns, prepare budgets and evaluate production loans. Sample costs given for labor, materials, equipment and contract services are based on January 2018 figures. Practices described are based on production practices considered typical for the crop and area, but will not apply to every situation. A blank column titled “Your Costs” is provided in Tables 1 and 2 to enter your estimated costs.
For an explanation of calculations used in the study refer to the section titled Assumptions. For more information contact Jeremy Murdock; University of California Agriculture and Natural Resources, Agricultural Issues Center, Department of Agricultural and Resource Economics, at 530-752-4651 or [email protected]. You can contact the local UCCE Advisor through the county offices: http://ucanr.edu/County_Offices/
Sample Cost of Production studies for many commodities are available and can be down-loaded from the website, http://coststudies.ucdavis.edu. Archived studies are also available on the website.
Costs and Returns Study Program/Acknowledgements. A costs and returns study is a compilation of specific crop data collected from meetings with professionals working in production agriculture from the area the study is based. The authors thank the cooperators, UC Cooperative Extension, and other industry representatives who provided information, assistance, and expert advice. The use of trade names and farming practices in this report does not constitute an endorsement or recommendation by the University of California nor is any criticism implied by omission of other similar products or cultural practices. The University is an affirmative action/equal opportunity employer.
2018 Walnuts Costs & Returns Study Sacramento Valley UCCE, UC-AIC, UC DAVIS ARE 2
ASSUMPTIONS
The assumptions refer to Tables 1 through 8 and pertain to sample costs to establish an orchard and produce walnuts under micro- sprinkler or low- volume irrigation in the Sacramento Valley. The cultural practices described represent production operations and materials considered typical for a well-managed farm in the Sacramento Valley. For consistency, the authors selected Chandler as the cost study variety. Costs, materials, and practices will not apply to all farms and should be adjusted to apply to specific varieties and locations. Cultural practices will vary by location and by season depending upon weather, soil, and insect and disease pressure. The study is intended as a guide only.
Farm. The hypothetical farm consists of 105 contiguous acres farmed by the owner. Smaller non-contiguous parcels may have additional costs for travel time and equipment re-calibration. Walnuts are established on 100 acres; roads, irrigation systems and farmstead occupy five acres.
Establishment Cultural Practices and Material Inputs
Site Preparation. This orchard is established on ground previously planted to walnuts. A custom service removes the old orchard. The soil is ripped five feet deep in two directions to break up underlying hardpan and pull up old roots. The roots are removed by hand. The cost of root removal can vary greatly depending on tree variety and the associated size and volume of the root system. The orchard site is disced and rolled twice to break up clods. The new orchard site is laser leveled to reduce or eliminate the possibility of standing water. Then the rows to be planted are fumigated, untarped, with Telone and Chloropicrin. Berms in the tree row are formed with a ridger, the row middles are smoothed/floated once to fill in borrow pits, and the irrigation system is installed underground. A contact herbicide strip spray is applied prior to planting in early spring. All operations that prepare the orchard for planting are done in the year prior to planting, but costs are shown in the first year.
Trees. The Chandler variety of English walnut is planted in this study. Cost adjustments may be necessary for other cultivars. Isolated orchards often include 2 to 3 percent of a second variety for pollination. Cisco and/or Franquette are typical Chandler pollinizers. Seedling or clonal Paradox are the typical rootstocks in the Sacramento Valley; clonal Paradox rootstock continues to gain popularity. Many variables determine spacing, including soil, rootstock and variety planted. In this study, 1/2” June-budded bare root Chandler trees on clonal Paradox rootstock are planted at 26 X 26 foot spacing, resulting in 64 trees per acre. The economic life of the orchard is assumed to be 30 years. Trees cost $20.00 each and some clonal Paradox rootstocks have a $1.00 royalty, which is not included as a cost in this study.
Because of the cost and/or limited availability of budded or grafted finished trees, many growers plant potted clonal Paradox rootstock in the fall or spring. These rootstocks grow during the summer and are field budded in August/September or grafted the following spring. The potted trees cost $16.00 each ($1024/acre). The in-field budding service performed at the end of the first season after planting is included in the $16 tree cost. After adding planting labor the total cost per acre is approximately $1200 compared to $1600 per acre for planting bare root stock.
Planting. Planting in the spring (February/March) starts by surveying and marking tree sites with a small stake, digging holes, planting, staking the trees, and heading trees back to 3 to 6 buds. Research has shown trees that are left unheaded after planting grow as well or better than those that are cut back at planting. Trees are painted white to prevent sunburn and tree protectors are placed around the trees to protect them from contact herbicides. Then a float is used down the row middles to smooth the surface. In the second year, 4 percent of the orchard or about 2 trees per acre are replanted.
2018 Walnuts Costs & Returns Study Sacramento Valley UCCE, UC-AIC, UC DAVIS ARE 3
Training/Pruning. Training and pruning begin in the spring after planting. One shoot that forms the main trunk is selected and tied loosely up the tree stake. Summer training in the first leaf consists of tying the main trunk, tipping back competing shoots and suckering. Using the minimum pruning method, the trunk is headed at 7 to 8 feet at the first dormant pruning in a standard spaced orchard. Dormant pruning and training during the second and third years develops primary and secondary scaffolds (respectively) and encourages the central leader. Heading cuts are made to tip or remove up to one-quarter of the current year’s growth on scaffold branches until trees fill in their spaces. During the first three establishment years, the brush is placed in the row middles and chopped during mowing.
Walnut trees can be grown with no pruning (unheaded with pruning limited to lower branches) in years 1-6 which often results in larger tree size and early yield based on 14 years of research in Colusa and other counties. Some growers have adopted this method for the labor savings and early yields. Brush removal costs are limited to the lower branches removed in years1 through 3 primarily. There may be an additional cost if stake extensions are needed after the first year to support tall leaders through the second leaf. The no prune, unheaded method costs are not included in this study.
Fertilization. Nitrogen is the major nutrient required for tree growth and production. Some locations will require additional nutrients. For the first two years, two split applications of granular nitrogen (15-15-15) are hand-applied in May and July when roots are active, placed approximately 18 inches from the base of the tree. Beginning in the third year, liquid nitrogen fertilizer (UAN-32) is injected through the irrigation system. (See Table A).
Leaf Sampling. Nutrition is determined by leaf analysis. Beginning in year four, leaf samples are collected in the first week of July at two samples per 100 acres. If soil conditions vary throughout the block, additional samples may be necessary. The samples are collected by a PCA and the costs shown are for the lab analysis.
Table A. Applied N Table B. Evapotranspiration(ET) Table C. Applied Water Year Lbs N/Ac Year AcIn/Yr Year AcIn/Yr
1 20 1 14 1 8 2 45 2 21 2 15 3 60 3 38 3 32 4 75 4 42 4 36 5 90 5 42 5 36 6 105 6 42 6 36
7+ 150 7+ 42 7+ 36
Irrigation. Tables B & C, above show the difference in applied water and the ET requirement of the orchard per year. Applied water is less depending upon the contribution from stored soil moisture and any rainfall. This study assumes six acre-inches of stored soil moisture and no effective rainfall during the growing season. Pressure chambers are used to measure stem water potential and verify irrigation adequacy. All irrigations are with the micro-sprinkler irrigation system.
Water Costs. In this study, water is pumped from a well assuming a cost of $90 per acre-foot ($7.50/acre-inch). Water charges will vary depending on the irrigation district, power source, well characteristics, and irrigation setup. Applied water for each year is estimated in Table C.
Well Test/Water Analysis. An annual well test is performed during the winter to monitor pumping level and efficiency (gallons/minute). A water analysis should be done annually to determine nitrate availability and to maintain regulatory records. A water sample is taken and analyzed for nitrogen and other minerals. Costs for these tests are allocated over the entire acreage the pump can service.
2018 Walnuts Costs & Returns Study Sacramento Valley UCCE, UC-AIC, UC DAVIS ARE 4
Chemical Buildup/Acid Flush. The drip system requires chemical flushing to retard chemical buildup and emitter clogging. The flushing is performed after harvest with N-pHuric acid applied through the drip system with 0.10 acre-inches of water.
Pest Management. The pesticides and rates mentioned are listed in UC Integrated Pest Management Guidelines, Walnuts. For information on other pesticides available, pest identification, monitoring, and management visit the UC IPM website at ipm.ucanr.edu. For information and pesticide use permits, contact the local county agricultural commissioner's office.
Pest Control Adviser/Certified Crop Advisor (PCA/CCA). Written recommendations are required for many pesticides and are available from licensed pest control or certified crop advisers. In addition, the PCA/CCA or an independent consultant will monitor the field for agronomic problems including irrigation and nutrition; they may take leaf samples in July for fertilizer recommendations. Growers may hire a private PCA/CCA or receive the service as part of a service agreement with an agricultural chemical and fertilizer company. For this study, a PCA monitors the orchard for disease and insect pests weekly for nine months annually. The PCA fee of $10 per acre during establishment and $35 per acre during production (Year 4+) is included as an operating cost.
Application Methods. Pesticide and fertilizer applications are made by either chemigation (pesticides and/or fertilizers applied through the irrigation water), by ATV mounted ground or spot sprayer or foliar-broadcast by tractor pulled air-blast sprayer. Check individual pesticide labels for compatibility, mixing and usage. Adjuvants are recommended for effective control of many pesticides and are an added cost. Adjuvants are not included as a cost in this study.
Nematodes/Fumigation. Prior to land preparation, the area is sampled (1 sample/20 acres) for nematodes injurious to walnuts to help make pre-plant soil fumigation decisions. Pre-plant fumigation may not be necessary on bare or row crop ground but is usually necessary where orchards follow orchards. Telone plus Chloropicrin are applied by a custom applicator down the tree rows (10 ft. strip) at 44 gallons per acre. Application costs including materials are approximately $1,500 per acre. The above rates are effective on light textured soils when the soils are properly ripped and dried prior to fumigation. Heavier textured soils may need additional efforts to dry and prepare the soil if the fumigation is to be effective. See http://ipm.ucanr.edu/PMG/r881200111.html
Vegetation Management. Weed pressure, materials and application timing will vary by orchard and season. A contact herbicide (Roundup PowerMAX) is applied pre-plant in February and a pre-emergence herbicide (Prowl H2O) is applied in April. Beginning in the first year, row middles are mowed five times, once in April, May, June, July, and August. During the late fall, (November) of the first two years, strip sprays using Prowl H2O and Goal 2XL are applied. In-season spot-sprays using Roundup PowerMAX or Rely 280 are applied to tree rows in July of the first year and in June of years two and three.
Diseases. During the establishment years, trees usually do not have enough crop to protect from walnut blight until the fourth or fifth year. In this study, no disease control costs are included during the establishment years because Chandler is late leafing and less susceptible to walnut blight.
Insects and Mites. In the first through third year, infestation of red humped caterpillars and other insects and mites is possible. For this study, it is assumed that on average, only one of these pests will occur in any one year. Under that assumption, insect and mite control begins in year three, with a Zeal application in July for mite control. The cost is assumed to be equivalent to the average cost of controlling many other insects.
Vertebrate Pests. Beginning in the first year, gophers are managed in the spring (March) using poison bait placed underground by a mechanical bait applicator. It is assumed that gophers are under control by the end of the third year and in subsequent years only spot treatments are necessary.
2018 Walnuts Costs & Returns Study Sacramento Valley UCCE, UC-AIC, UC DAVIS ARE 5
Harvest. Depending upon variety and orchard management, harvest usually starts in the fourth or fifth year. In this study, economical harvest starts in the fourth year. A custom operator mechanically shakes, sweeps, collects and hauls walnuts to a facility for hulling and drying. Mature yield is reached in the eighth year. Refer to harvest section under the production assumptions.
Production Cultural Practices and Material Inputs
Pruning. In mature orchards, pruning is done mainly to maintain light for healthy buds, and remove dead and undesired limbs. Although mechanical hedging is effectively used in the Sacramento Valley this cost study orchard is not a hedgerow configuration and predicts costs based on a standard planting configuration. Hand pruning is done each year in the summer to remove low, broken, and dead limbs. Pruning towers are used to make cuts higher in the tree canopy. Pruning for light penetration and to maintain nut size is done every three years. Pruning should be done when no rain is predicted or when temperatures are below 50 degrees Fahrenheit to reduce the possibility of Botryosphaeria infection. Prunings are placed in the row middles and are pushed to the orchard edge for burning. The brush removal crew includes the tractor driver and one person on the ground.
Fertilization. Nitrogen (N) is applied through the irrigation system as described in Table A. Nitrogen (N) as (UAN 32) is injected through the drip irrigation system in equal amounts, three times between May and July for a seasonal total of 150 pounds of N per acre. Adjustments for nitrogen contributions from groundwater, manure, compost and cover crops should be accounted for in the season total. Labor for the fertilizer application is included in the irrigation labor. Since the major exporter of nitrogen is the crop, another way to estimate the nitrogen requirement is to figure 35 - 40 pounds of nitrogen per dry ton of production and target a 70 percent application efficiency. Potassium levels are maintained by banding sulfate of potash (SOP) in the fall. Sixty pounds of SOP are needed annually to support a 6,000 lb. walnut crop.
Leaf/Tissue Samples. Nutrition is determined by leaf analysis. Leaf sampling begins in the fourth year. Leaf samples, two per 100 acres, are taken in July for nutrient analysis. If soil conditions vary throughout the block, additional samples may be necessary. The samples are collected by the PCA. The cost shown is for the lab analysis.
Irrigation. In the Sacramento Valley, annual ET is estimated at 42-acre inches of water per acre for full canopy walnuts (See Table B). Beginning in year six, we assume a soil moisture contribution of six acre-inches and no effective rainfall during the growing season, therefore 36 acre-inches of irrigation water is applied from May to September (See Table C). Irrigation costs include the water pumping costs and assumed labor. Tree water status is monitored throughout the season using a pressure chamber to measure stem water potential and verify first irrigation timing. By verifying mild water stress with the pressure chamber before the first irrigation, irrigation may actually begin in June.
Pest Management. See the statements above, under the Pest Management section.
Vegetation Management. During the production years, weeds are controlled in the row middles with mechanical mowing. The weeds within the tree rows are controlled with winter and in-season strip sprays using pre-emergent and post-emergent contact herbicides. Alion, Matrix and Roundup Powermax are applied in November as a winter strip spray. This operation is charged on the previous year’s budgets. Rely 280 is applied during the growing season in July or August as a strip spray.
Disease. Botryosphaeria canker and blight (Botryosphaeria spp., known simply as “Bot”) causes blighted spurs, shoots, and branches and sometimes brown to black nuts appearing around harvest. Research has yet to show value to applying a postharvest spray. In orchards with less Bot pressure, one spray applied in mid-June to early July has been effective. This study assumes a two fungicide spray program for Bot beginning in the fourth year
2018 Walnuts Costs & Returns Study Sacramento Valley UCCE, UC-AIC, UC DAVIS ARE 6

with a May application of Merivon and a June spray of Quadris Top. Utilizing the leaf wetness model for Botryosphaeria risk may indicate more, or fewer sprays. See http://ipm.ucanr.edu/PMG/FIG/Leaf_wetness_model.html.
Walnut blight (Xanthomonas arboricola pv juglandis), is a spring disease that affects all green tissue including nutlets. Depending on rainfall, earlier leafing varieties typically require more sprays than later leafing varieties like Chandler used in this study. Starting in year four, the first treatment is applied in mid-April using a copper compound, Kocide 3000 tank mixed with Manzate Prostick and a second treatment is applied 7-10 days later. The second spray can be rotated with the antibiotic Kasumin for resistance management. Additional sprays are triggered depending on rainfall and orchard history and are not included in these costs.
Insects and Mites. Insects and mites are typical problems for Sacramento Valley walnut production. Each particular pest is not a problem in every year. The cost study assumes the most likely pest encountered.
Aphids and mites generally do not occur every year in every orchard. In this study, it is assumed that on average, only one of these pests will appear in any given year and the costs reflect one treatment per year. Starting in year three and continuing, Zeal is applied in July for mite control.
Codling moth (CM), a major pest, can cause damage resulting in off-grade nuts. CM is assumed to reach treatment levels by the fifth year. Three generations usually occur and are monitored using pheromone traps and insect degree days. See http://www.ipm.ucanr.edu/WEATHER/index.html. The pheromone traps are furnished, installed and serviced by the PCA, therefore no cost is shown. One treatment for codling moth is assumed for the second flight, and Altacor is applied in July. A May spray is often applied for earlier leafing varieties. Codling Moth mating disruption using pheromone puffers or dispensers is an option particularly for larger contiguous walnut orchards. This cost study assumes a spray program for Codling moth.
Naval Orangeworm (NOW), is not a new pest of walnuts, but damage potential has been an increasing concern in recent years. One treatment for NOW timed to protect the majority of the period between hull split though harvest is assumed. Winter sanitation activities (mowing, disking, or shredding ground mummies and blowing berms) are assumed. Naval Orangeworm treatment and sanitation begins in year 5.
Starting in year six, Seize 35WP is applied in March for scale insect control. Scale should be monitored to determine if annual sprays are needed. Walnut husk fly (WHF) is a problem in most orchards and is monitored using yellow sticky traps with ammonium carbonate superchargers. Also in the sixth year, WHF first spray is applied in July using Brigade plus Nu-Lure and again in August with Assail plus Nu-Lure. This cost study assumes a two-spray program for WHF. More WHF sprays may be needed in certain years depending on WHF trap catch information.
Vertebrate Pests. Gophers require control and maintenance treatments are necessary. Spot treatments with gopher bait are made in March of each year. Squirrels are managed using anti-coagulant bait stations on the field perimeter beginning in the fourth year and are maintained during May, June, September and October. See http://ucanr.org/sites/Ground_Squirrel_BMP/.
Promoting Early Harvest. Ethephon, a growth regulator that enhances hull-split, is applied at packing tissue brown (an indicator of kernel maturity), to promote early harvest. In this study, Ethephon is applied to one-half of the orchard in September to stagger the Chandler harvest for more efficient huller and dryer management. Ethephon can also be used to promote one shake harvest by applying it 10 days before the normal harvest date.
Harvest. Custom harvesters shake, sweep, collect, and truck the walnuts to a facility for hulling and drying. Labor for hand raking to collect walnuts missed by the sweeper is supplied by the grower. Hulling and drying
2018 Walnuts Costs & Returns Study Sacramento Valley UCCE, UC-AIC, UC DAVIS ARE 7
costs are charged on a per-pound of dry-weight basis. Custom harvest operators may charge by the hour, acre or yield, but most have a minimum per-acre charge.
Yields. Annual yields for walnut varieties are measured as clean, dry, in-shell pounds per acre. The average yield over the remaining life of the orchard is assumed to be 6,000 pounds per acre. Yields can vary widely from year to year, site to site and grower to grower. See Table 5 for a range analysis of returns based on different yields.
Returns. Actual price depends on a number of factors such as demand, size of the state crop, variety, nut size, and quality. For this study, a projected price of $1.00 per pound is used in the tables. This price reflects long term expected price. It does not reflect a price forecast for any specific year. Refer to the ranging analysis (Table 5) for guidance on price variability.
Assessments. Under a state marketing order, the California Walnut Commission (CWC) collects mandatory assessment fees. The 2018 CWC assessment fee is $0.01 per pound of dry in-shell nuts. The assessment fee from the California Walnut Assessment Board, (CWAB), and Federal marketing order is paid by handlers, not growers, so it is not included in this study.
Pickup/ATV. The study assumes the pickup is for general farm use only, moving laborers, picking up supplies and parts. The ATV is used for weed spraying and baiting squirrels and gophers, and is included in those costs. Additional ATV uses for checking the orchard, diseases, and irrigation system are shown as a line item. The travel and time are estimated and not taken from any specific data.
Labor, Equipment, and Interest
Labor. Hourly wages for workers are $14.50 for machine operators and $12.50 per hour non-machine labor. Adding 42 percent for the employer’s share of federal and state payroll taxes, workers compensation insurance, for nut crops and other possible benefits gives the labor rates shown of $20.59 and $17.75 per hour for machine labor and non-machine labor, respectively. Workers’ compensation costs will vary among growers. The cost is based upon the average industry final rate as of January 2018. Labor for operations involving machinery are 20 percent higher than the actual operation time given to account for the extra labor involved in equipment set up, moving, maintenance, work breaks, and field repair.
California Minimum Wage and Overtime Rules. In 2016, The California State Government passed new legislation concerning overtime and minimum wage rates that may affect farm labor costs. The California minimum wage rate for 2018 is $11.00 per hour for companies with more than 25 employees and will rise each year by $1.00 per hour until it reaches $15.00 per hour in 2022. Businesses with 25 or fewer employees are given an additional year to comply with the changes. For businesses with 25 or fewer employees, the minimum wage rate is $10.50 per hour for 2018 and increases to $11.00 per hour in 2019; thereafter, their minimum wage rate increases by $1.00 per hour each year from $11.00 per hour in 2019 to $15.00 per hour in 2023.
Recent California regulations also decrease the overtime threshold—the number of hours required to be worked before overtime benefits are received—for agricultural workers. The regulations decrease the overtime threshold for agricultural workers from 60 hours per week and 10 hours per day by 5.0 hours per week and 0.5 hours per day each year until it reaches 40 hours per week and 8.0 hours per day in 2022. Businesses with 25 or fewer employees are given an additional three years to comply with the regulation’s changes. By January 1st, 2019 (2022 for employers with 25 or fewer employees) employees will also be entitled to overtime for 8 hours on the seventh consecutive day of work.
2018 Walnuts Costs & Returns Study Sacramento Valley UCCE, UC-AIC, UC DAVIS ARE 8
These regulations cause increased cost of labor used on farms, whether as direct hires, as farm labor contractor employees or as a component of custom services.
For more information and to view the California minimum wage and overtime phase-in schedules visit http://aic.ucdavis.edu/
Equipment Operating Costs. Repair costs are based on purchase price, annual hours of use, total hours of life, and repair coefficients formulated by American Society of Agricultural and Biological Engineers (ASABE). Fuel and lubrication costs are also determined by ASABE equations based on maximum power takeoff (PTO) horsepower, and fuel type. Prices for on-farm delivery of diesel and gasoline are $2.92 and $3.46 per gallon, respectively. The cost includes a 13.0 percent local sales tax on diesel fuel and 10.17 percent sales tax on gasoline. Gasoline also includes federal and state excise tax, which are refundable for on-farm use when filing your income tax.
Fuel/Lube/Repair. The fuel, lube, and repair cost per acre for each operation in Table 2 is determined by multiplying the total hourly operating cost in Table 7 for each piece of equipment used for the selected operation by the hours per acre. Tractor time is 10 percent higher than implement time for a given operation to account for setup, travel and down time.
Interest on Operating Capital. Interest on operating capital is based on cash operating costs and is calculated monthly until harvest at a nominal rate of 5.0 percent per year. A nominal interest rate is the typical market cost of borrowed funds. The interest cost of post- harvest operations is discounted back to the last harvest month using a negative interest charge. The rate will vary depending upon various factors, but the rate in this study is considered a typical lending rate by a farm lending agency as of January 2018.
Risk. The risks associated with crop production should not be minimized. While this study makes every effort to model a production system based on typical, real world practices, it cannot fully represent financial, agronomic and market risks, which affect profitability and economic viability of tree nut production. Because of so many potential risk factors, effective risk management must combine specific tactics in a detailed manner, in various combinations for a sustainable operation. Moreover, Table 5 of this study reflects a ranging analysis of returns based on various assumptions which is therefore hypothetical in nature. It is important to realize that actual results may differ from the returns contained in this study. Any returns above total costs are considered returns on risk and investment to management (or owners).
Cash Overhead
Cash overhead consists of various cash expenses paid out during the year that are assigned to the whole farm and not to a particular operation. These costs can include property taxes, interest on operating capital, office expense, liability and property insurance, sanitation services, equipment repairs, and management.
Property Taxes. Counties charge a base property tax rate of 1 percent on the assessed value of the property. In some counties special assessment districts exist and charge additional taxes on property including equipment, buildings, and improvements. For this study, county taxes are calculated as 1 percent of the average value of the property.
Insurance. Insurance for farm investments varies depending on the assets included and the amount of coverage.
Property Insurance. This provides coverage for property loss and is charged at 0.846 percent of the average value of the assets over their useful life.
2018 Walnuts Costs & Returns Study Sacramento Valley UCCE, UC-AIC, UC DAVIS ARE 9

Liability Insurance. A standard farm liability insurance policy will help cover the expenses for which you become legally obligated to pay for bodily injury claims on your property and damages to another person’s property as a result of a covered accident. Common liability expenses covered under your policy include attorney fees and court costs, medical expenses for people injured on your property, injury or damage to another’s property. In this study, $810 is charged and covers the entire farm.
Crop Insurance. A significant number of growers purchase federal crop insurance in this region. Crop insurance is available to walnut growers for unavoidable loss of production, damage or poor quality resulting from adverse weather conditions such as excessive heat, cool wet weather, freeze, frost, hail, rain, wind and damage from birds, drought, earthquakes and fire. Coverage levels are from 50-85 percent of the approved average yield as established by verifiable production records from the farm. Actual insurance coverage is by unit, not by acre. http://www.rma.usda.gov/policies/2017policy.html. We assume no crop insurance is purchased in this study.
Office Expense. Office and business expenses are estimated at $100 per acre annually. These expenses include office supplies, communication, bookkeeping, accounting and miscellaneous administrative costs.
Sanitation Services. Sanitation services provide portable toilets with wash basins for the orchard and cost the farm $875 annually. This cost includes delivery and five months of weekly service.
Supervisor/Management Salaries. Wages for management are not included as a cash cost. Any returns above total costs are considered returns to management.
Investment Repairs. Annual repairs on investment or capital recovery items that require maintenance are calculated as 2 percent of the purchase price on investments listed in Table 6.
Non-Cash Overhead
Non-cash overhead, shown on an annual per acre basis is calculated as the capital recovery cost for equipment and other farm investments.
Capital Recovery Costs. Capital recovery cost is the annual depreciation and interest costs for a capital investment. It is the amount of money required each year to recover the difference between the purchase prices and salvage value (unrecovered capital). It is equivalent to the annual payment on a loan for the investment with the down payment equal to the discounted salvage value. This is a more complex method of calculating ownership costs than straight-line depreciation and opportunity costs, but more accurately represents the annual costs of ownership because it takes the time value of money into account (Boehlje and Eidman). The formula for the calculation of the annual capital recovery costs is ((Purchase Price – Salvage Value) x Capital Recovery Factor) + (Salvage Value x Interest Rate).
Salvage Value. Salvage value is an estimate of the remaining value of an investment at the end of its useful life. For farm machinery (e.g., tractors and implements) the remaining value is a percentage of the new cost of the investment (Boehlje and Eidman). The percent remaining value is calculated from equations developed by the American Society of Agricultural and Biological Engineers (ASABE) based on equipment type and years of life. The life in years is estimated by dividing the wear-out life, as given by ASABE by the annual hours of use in this operation. For other investments including irrigation systems, buildings, and miscellaneous equipment, the value at the end of its useful life is zero. The salvage value for land is the purchase price because land does not depreciate. The purchase price and salvage value for equipment and investments are shown in Table 6.
2018 Walnuts Costs & Returns Study Sacramento Valley UCCE, UC-AIC, UC DAVIS ARE 10

Capital Recovery Factor. Capital recovery factor is the amortization factor or annual payment whose present value at compound interest is 1. The amortization factor is a table value that corresponds to the interest rate used and the life of the machine.
Interest Rate. An interest rate of 5.50 percent is used to calculate capital recovery. The rate will vary depending upon loan amount and other lending agency conditions, but is the basic suggested rate by a farm lending agency as of January 2018.
Building. The 2,400 sq. ft. metal shop building is on a cement slab with an attached pole barn that is used for equipment storage.
Land. Land values range from $18,000 to $40,000. The orchard site is assumed to be on previously farmed orchard ground. The bare land value in this study is $25,000 per acre.
Irrigation System. The pumping cost is based on two 75-horsepower electric motors pumping from a depth of 125 feet. Price per acre-foot of water will vary by grower depending on power source, well characteristics, and irrigation district. In this study, electrical costs for pumping groundwater are calculated to cost $90.00 per acre-foot or $7.50 per acre-inch. Water is pumped through a filtration system, into the buried main lateral lines, and out into the orchard and micro-sprinklers. The well and pump already exist, so the cost of the irrigation system is for the new well casing, refurbishing the pump and motor, and installing a new, automated filtration system. The main laterals and micro-sprinklers are installed separately, after the orchard has been laid out and prior to planting. The life of the irrigation system is estimated to be 30 years.
Fuel Tanks. Two 500-gallon fuel tanks, one for diesel and one for gasoline, are placed on stands in a cement containment meeting federal, state, and local regulations.
Tools. Includes shop tools/equipment, hand tools, and field tools such as pruning equipment, rakes, shovels, etc.
Pressure Chamber Instrument. The instrument produces pressure in the chamber to take water potential readings. This provides data to determine timing of irrigation events. A separate pressure chamber monitoring cost has been included as an operating expense.
Establishment Cost. Costs to establish the orchard are used to determine the non-cash overhead expenses, capital recovery, and interest on investment for the production years. The establishment cost is the sum of cash costs for land preparation, planting, trees, production expenses, and cash overhead for growing walnut trees through the first year nuts are harvested less returns from production. The Accumulated Net Cash Cost in the fourth year shown in Table 1 represents the establishment cost per acre. For this study, this cost is $10,075 per acre or $1,007,500 for the 100-acre orchard. Establishment cost is amortized beginning in the fifth year over the remaining 30 years of production.
Equipment. Farm equipment is purchased new or used, but the study shows the current purchase price for new equipment. The new purchase price is adjusted to 60 percent to indicate a mix of new and used equipment. Annual ownership costs for equipment and other investments are shown in Table 6. Equipment costs are composed of three parts: non-cash overhead, cash overhead, and operating costs. Both of the overhead factors have been discussed in previous sections. The operating costs consist of repairs, fuel, and lubrication and are discussed under operating costs.
Table Values. Due to rounding, the totals may be slightly different from the sum of the components.
2018 Walnuts Costs & Returns Study Sacramento Valley UCCE, UC-AIC, UC DAVIS ARE 11
REFERENCES
American Society of Agricultural Engineers. (ASABE). 2015. American Society of Agricultural Engineers Standards Yearbook. St. Joseph, Missouri. [email protected]
Boehlje, M., and V.R. Eidman. 1984. Farm Management. John Wiley and Sons. New York, New York
Bruce Lampinen, Janine Hasey, John Edstrom, Sam Metcalf, William Stewart, Loreto Contador. 2015. Chandler Walnut Hedgerow Pruning and Training Trial, https://ucanr.edu/sites/cawalnut/showyears/2015/?repository=83894&a=160277
Buchner, Richard P., Janine K. Hasey, Karen Klonsky, Don Stewart, Dan Sumner, Nina Anderson . Sample Costs to Establish a Walnut Orchard and Produce Walnuts, Sacramento Valley-2015. Department of Agricultural and Resource Economics, University of California Cooperative Extension. Davis, CA. http://coststudies.ucdavis.edu/.
California State Board of Equalization. Fuel Tax Division Tax Rates. http://www.boe.ca.gov/sptaxprog/spftdrates.htm
California Department of Insurance. California Workers’ Compensation Rating Data for Selected Agricultural Classifications as of January 2018. California Department of Insurance, Rate Regulation Branch. http://www.insurance.ca.gov/0500-about-us/
Energy Information Administration. Weekly Retail on Highway Diesel Prices, January 2018. http://tonto.eix.doe.gov/oog/info/wohdp
Joseph A. Grant, Janet L. Caprile, David A. Doll, Kathleen Kelly Anderson, Karen Klonsky, Richard L. DeMoura, “Sample Costs to Establish a Walnut Orchard and Produce Walnuts, San Joaquin Valley-2013”, University of California, Cooperative Extension. Department of Agricultural and Resource Economics. Davis, CA. http://coststudies.ucdavis.edu/en/current/
Janine Hasey, UCCE Farm Advisor, Sutter/Yuba/Colusa Counties Bob Van Steenwyk, Research Entomologist, UC Berkeley, Themis Michailides, Plant Pathologist, UC Kearney Research and Extension Center, Parlier. “Preventing Walnut scale and Botryosphaeria canker and blight”. http://cesutter.ucanr.edu/newsletters/Sacramento_Valley_Walnut_News52111.pdf
TRENDS® In Agricultural Land and Lease Values. (ASFMRA), 2018. California Chapter, of the American Society of Farm Managers & Rural Appraisers, Inc. Woodbridge, CA. www.calasfmra.com
UC IPM Pest Management Guidelines: University of California. Division of Agriculture and Natural Resources. Oakland, CA. http://ipm.ucdavis.edu/
2018 Walnuts Costs & Returns Study Sacramento Valley UCCE, UC-AIC, UC DAVIS ARE 12

UC COOPERATIVE EXTENSION-AGRICULTURAL ISSUES CENTER TABLE 1. COSTS PER ACRE TO ESTABLISH AN ENGLISH WALNUT ORCHARD, OVER YEARS
SACRAMENTO VALLEY - 2018
Codling Moth (CM), Walnut Husk Fly (WHF), Naval Orange Worm (NOW) Cost Per Acre Year: Est/1st 2nd 3rd 4th 5th 6th 7th
Price: $1.00/Lb. Yield: Dry, In-Shell Pounds Per Acre: 500 1,500 3,000 5,000 Pre-Plant: Nematode Sampling 1 Orchard Removal/Cleanup 800 Root Removal 2X 600 Rip 4 ft. 2X 400 Disc & Roll 2X 50 Laser Leveling 100 Fumigate- 8’ Strip (Telone & Chloropicrin) 1500 Pull Berms-Tree Rows 30 Float-Between Rows 30 Weeds-Pre-Plant Strip Spray (RU PowerMax) 10 TOTAL PRE-PLANT COSTS 3,521 Planting: Survey/Mark/Plant-64 Trees/Ac 1,479 44 Head/Paint/Stake/Wrap Trees 174 4 TOTAL PLANTING COSTS 1,653 48 Cultural: Well Test/Water Analysis 6 6 6 6 6 6 6 Sanitation- NOW 13 13 13 Prune: (Sucker & Train Trees 5X-1st Yr.) 178 Prune (Tipping)/Stack/Alt-Rows 30 30 40 Fertilize By Hand- 15-15-15 2X 100 180 Fertilize: Fertigate UAN-32 2X 35 44 52 61 87 Fertilize: Leaf Analysis 1 1 1 1 Irrigate 10X 60 113 240 270 270 270 270 Irrigation Labor 53 53 53 53 53 53 53 Monitoring with Pressure Chamber 15 15 15 15 15 15 15 Weeds-Pre-emergent Strip Spray (Prowl H20) 35 35 35 Weeds-Mow Middles 5X 36 36 36 36 36 36 36 Weeds-Spot Spray 25% Ac (RU PowerMax) 2 2 2 Weeds-In-season Strip Spray (Rely 280) 11 11 11 11 Weeds-Winter Strip Spray (Yr. 1 & 2 - Prowl H20 & Goal XL, Yr. 3+ - Alion, Matrix & RU) 38 38 84 84 84 84 84 Pests-Diseases-Walnut Blight 2X 263 263 263 263 Pests-Diseases-Bot 2X 96 96 96 96 Pests-Scale 69 69 Pests-Mites (Zeal) 67 67 Pests-Insects-CM/WHF/Mites (5th Yr.- CM/Mites) 131 157 157 Pests-Insects-WHF 85 85 Pests-Insects-NOW 35 35 35 Pests-Gophers 8 8 8 8 8 8 8 Pests-Squirrels (Bait) 4X 46 46 46 46 PCA/CCA Fee 10 10 10 35 35 35 35 Pickup Truck-Farm Use 27 27 27 27 27 27 27 ATV-Farm Use 9 9 9 9 9 9 9 TOTAL CULTURAL COSTS 576 561 656 1,108 1,190 1,379 1,405 Harvest Costs: Shake/Sweep/Pickup/Haul 35 105 210 350 Harvest Aid-Ethephon 50% Ac 28 28 Hull & Dry 40 120 240 400 California Walnut Commission Assessment 5 15 30 50 TOTAL HARVEST COSTS 80 240 508 828 Interest On Operating Capital @ 5.00% 273 16 14 22 24 29 31 TOTALOPERATING COSTS/ACRE 6022 624 670 1,210 1,454 1,916 2,264
2018 Walnuts Costs & Returns Study Sacramento Valley UCCE, UC-AIC, UC DAVIS ARE 13
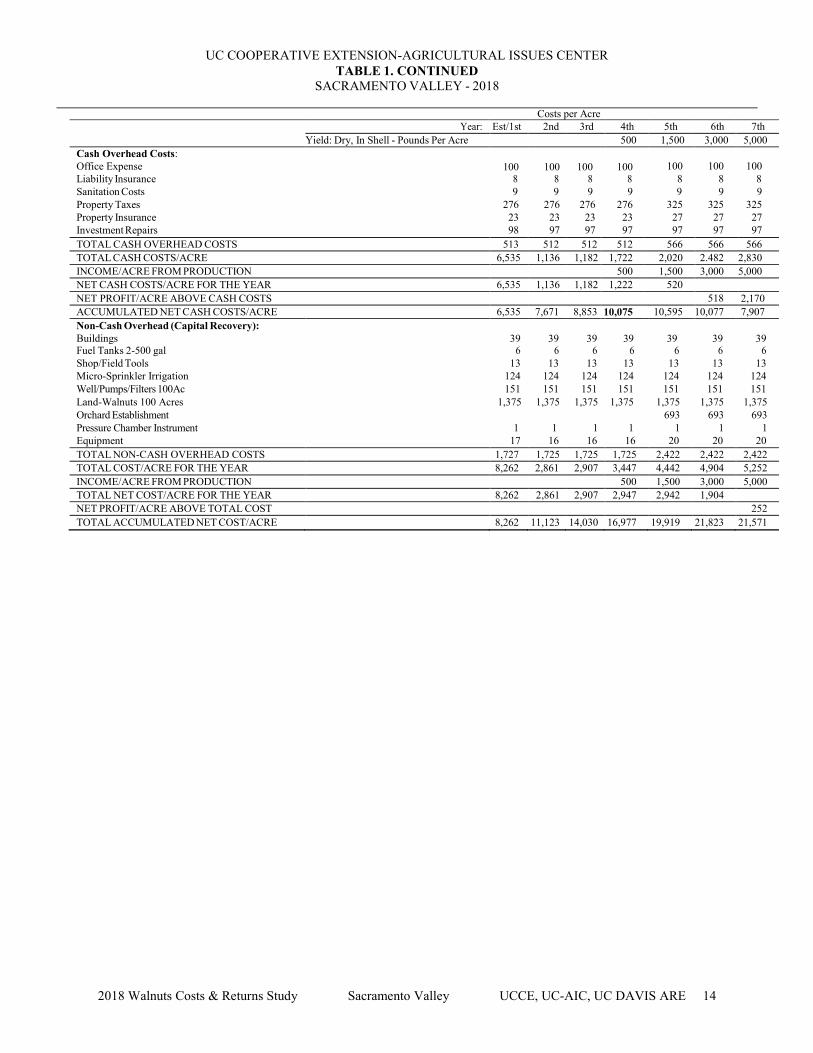
UC COOPERATIVE EXTENSION-AGRICULTURAL ISSUES CENTER TABLE 1. CONTINUED
SACRAMENTO VALLEY - 2018
Costs per Acre Year: Est/1st 2nd 3rd 4th 5th 6th 7th
Yield: Dry, In Shell - Pounds Per Acre 500 1,500 3,000 5,000 Cash Overhead Costs: Office Expense 100 100 100 100 100 100 100 Liability Insurance 8 8 8 8 8 8 8 Sanitation Costs 9 9 9 9 9 9 9 Property Taxes 276 276 276 276 325 325 325 Property Insurance 23 23 23 23 27 27 27 Investment Repairs 98 97 97 97 97 97 97 TOTAL CASH OVERHEAD COSTS 513 512 512 512 566 566 566 TOTAL CASH COSTS/ACRE 6,535 1,136 1,182 1,722 2,020 2.482 2,830 INCOME/ACRE FROM PRODUCTION 500 1,500 3,000 5,000 NET CASH COSTS/ACRE FOR THE YEAR 6,535 1,136 1,182 1,222 520 NET PROFIT/ACRE ABOVE CASH COSTS 518 2,170 ACCUMULATED NET CASH COSTS/ACRE 6,535 7,671 8,853 10,075 10,595 10,077 7,907 Non-Cash Overhead (Capital Recovery): Buildings 39 39 39 39 39 39 39 Fuel Tanks 2-500 gal 6 6 6 6 6 6 6 Shop/Field Tools 13 13 13 13 13 13 13 Micro-Sprinkler Irrigation 124 124 124 124 124 124 124 Well/Pumps/Filters 100Ac 151 151 151 151 151 151 151 Land-Walnuts 100 Acres 1,375 1,375 1,375 1,375 1,375 1,375 1,375 Orchard Establishment 693 693 693 Pressure Chamber Instrument 1 1 1 1 1 1 1 Equipment 17 16 16 16 20 20 20 TOTAL NON-CASH OVERHEAD COSTS 1,727 1,725 1,725 1,725 2,422 2,422 2,422 TOTAL COST/ACRE FOR THE YEAR 8,262 2,861 2,907 3,447 4,442 4,904 5,252 INCOME/ACRE FROM PRODUCTION 500 1,500 3,000 5,000 TOTAL NET COST/ACRE FOR THE YEAR 8,262 2,861 2,907 2,947 2,942 1,904 NET PROFIT/ACRE ABOVE TOTAL COST 252 TOTAL ACCUMULATED NET COST/ACRE 8,262 11,123 14,030 16,977 19,919 21,823 21,571
2018 Walnuts Costs & Returns Study Sacramento Valley UCCE, UC-AIC, UC DAVIS ARE 14

UC COOPERATIVE EXTENSION-AGRICULTURAL ISSUES CENTER TABLE 2. COSTS PER ACRE TO PRODUCE WALNUTS
SACRAMENTO VALLEY – 2018
Operation Cash and Labor Costs per Acre Time Labor Fuel Lube Material Custom/ Total Your
Operation (Hrs/A) Cost & Repairs Cost Rent Cost Cost Cultural: Sanitation- NOW 0.29 7 3 2 0 0 13 Replant 1% of Orchard 0.00 0 0 0 0 26 26 Well Test/Water Analysis 0.00 0 0 0 0 6 6 Pests- Gophers 0.11 3 1 0 4 0 8 Pests- Insects/Scale 0.00 0 0 0 44 25 69 Weeds-Mow Middles 5X 0.74 18 10 8 0 0 36 Disease-Walnut Blight 2X 0.00 0 0 0 213 50 263 Pests-Squirrels (Bait) 4X 0.00 14 0 0 32 0 47 Disease-Bot 2X 0.00 0 0 0 46 50 96 Pressure Chamber Monitoring 0.00 0 0 0 0 15 15 Irrigate 10X 0.00 0 0 0 270 0 270 Fertigate UAN-32 3X 0.00 0 0 0 87 0 87 Leaf Analysis (1 per 50/acres) 0.00 0 0 0 0 1 1 Pests-Insects-CM/WHF/Mites 0.00 0 0 0 132 25 157 Prune/Dead Limb Removal/Push Brush 0.65 51 6 2 0 0 59 Pests-Insects/WHF 0.00 0 0 0 60 25 85 Weeds- In-Season Strip Spray 0.16 4 0 1 6 0 11 Pests-Insects/NOW 0.00 0 0 0 10 25 35 Irrigation Labor 0.00 53 0 0 0 0 53 Weeds- Winter Strip Spray 0.16 4 0 1 79 0 84 Fertilize- Band Potassium (SOP) 0.06 2 1 1 23 0 26 PCA/CCA Fee 0.00 0 0 0 0 35 35 Pickup Truck-Farm Use 0.75 19 5 3 0 0 27 ATV-Farm Use 0.33 8 0 0 0 0 9
TOTAL CULTURAL COSTS 3.26 183 28 16 1,006 283 1,517 Harvest: Harvest Aid-Ethephon 50% Ac 0.00 0 0 0 15 13 28 Shake/Sweep/Pickup/Haul 0.00 0 0 0 0 420 420 Hull & Dry 0.00 0 0 0 0 480 480 Assessment Fees 0.00 0 0 0 60 0 60
TOTAL HARVEST COSTS 0.00 0 0 0 75 913 988
Interest on Operating Capital at 5.00% 32 TOTAL OPERATINGCOSTS/ACRE 3 183 28 16 1,081 1,195 2,537
2018 Walnuts Costs & Returns Study Sacramento Valley UCCE, UC-AIC, UC DAVIS ARE 15

UC COOPERATIVE EXTENSION-AGRICULTURAL ISSUES CENTER TABLE 2. CONTINUED
SACRAMENTO VALLEY – 2018
Operation Cash and Labor Costs per Acre Time Labor Fuel
Operation (Hrs/A) Cost Lube Material Custom/ Total Your
& Repairs Cost Rent Cost Cost CASH OVERHEAD: Liability Insurance 8 Office Expense 100 Sanitation Services 9 Property Taxes 326 Property Insurance 27 Investment Repairs 97
TOTAL CASH OVERHEAD COSTS/ACRE 567 TOTAL CASH COSTS/ACRE 3,104 NON-CASHOVERHEAD: Per Producing Annual Cost
Acre Capital Recovery
Buildings 2400 sq. ft. 571 39 39 Fuel Tanks 2-500gal 85 6 6 Shop/Field Tools 190 13 13 Micro-Sprinkler Irrigation 1,800 124 124 Well/Pumps/Filters 100Ac 2,200 151 151 Land Walnuts 25,000 1,375 1,375 Orchard Establishment 10,075 693 693 Pressure Chamber Instrument 16 1 1 Equipment 231 25 25
TOTAL NON-CASH OVERHEAD COSTS 40,169 2,427 2,427 TOTALCOSTS/ACRE 5,531
2018 Walnuts Costs & Returns Study Sacramento Valley UCCE, UC-AIC, UC DAVIS ARE 16

UC COOPERATIVE EXTENSION-AGRICULTURAL ISSUES CENTER TABLE 3. COSTS AND RETURNS PER ACRE TO PRODUCE WALNUTS
SACRAMENTO VALLEY – 2018
Quantity/ Price or Value or Your Acre Unit Cost/Unit Cost/Acre Cost
GROSS RETURNS Year 8 6,000 Lb 1.00 6,000
TOTAL GROSS RETURNS 6,000 Lb 6,000 OPERATINGCOSTS Custom: 1,195
Replant 1 Tree (Yr. 8+) 0.64 tree 40.00 26 Well Test/Water Analysis 1.00 acre 6.00 6 Spray Ground - Air Blast Sprayer 8.50 acre 25.00 213 Pressure Chamber Monitoring 1.00 acre 15.00 15 Leaf Analysis 0.02 each 50.00 1 Shake Sweep Pickup Haul 6000.00 lb 0.07 420 Dry/Hull 6000.00 lb 0.08 480 PCA/CCA Fee (YR4-8+) 1.00 acre 35.00 35
Rodenticide: 36 Vertebrate Pest Bait 10.00 lb 1.92 19 Bait Stations 2.00 each 8.50 17
Insecticide: 246 Seize 35 WP 4.00 floz 11.05 44 Zeal 2.00 oz 21.00 42 Nu-Lure Bait 6.00 pt 6.95 42 Altacor 4.50 floz 14.27 64 Brigade WSB 3.20 oz 1.57 5 Assail 30 SG 8.00 oz 4.95 40 Bifenture EC 12.00 floz 0.80 10
Fungicide: 143 Manzate Pro Stick 4.80 lb 7.58 36 Kocide 3000 10.00 lb 6.14 61 Merivon 4.00 floz 7.27 29 Quadris Top 12.00 floz 1.37 16
Bactericide: 115 Kasumin 1.00 gal 115.22 115
Irrigation: 270 Water-Pumped 36.00 acin 7.50 270
Fertilizer: 110 UAN-32 150.00 lb N 0.58 87 Sulfate of Potash 60.00 lb 0.38 23
Herbicide: 85 Rely 280 12.00 floz 0.53 6 Alion 3.50 floz 13.84 48 Matrix SG 4.00 oz 6.37 25 Roundup PowerMax 2.00 pt 2.45 5
Tree Aids: 15 Ethephon 2SL 2.00 pt 7.71 15
Assessment: 60 CWC 6000.00 lb 0.01 60
Labor 183 Equipment Operator Labor 3.91 hrs 20.59 81 Non-Machine Labor 2.80 hrs 17.75 50 Irrigation Labor 3.00 hrs 17.75 53
Machinery 44 Fuel-Gas 1.16 gal 3.46 4 Fuel-Diesel 8.28 gal 2.92 24 Lube 4 Machinery Repair 12
Interest on Operating Capital @ 5.00% 32
TOTALOPERATINGCOSTS/ACRE 2,537 NET RETURNS ABOVE OPERATING COSTS 3,463
2018 Walnuts Costs & Returns Study Sacramento Valley UCCE, UC-AIC, UC DAVIS ARE 17
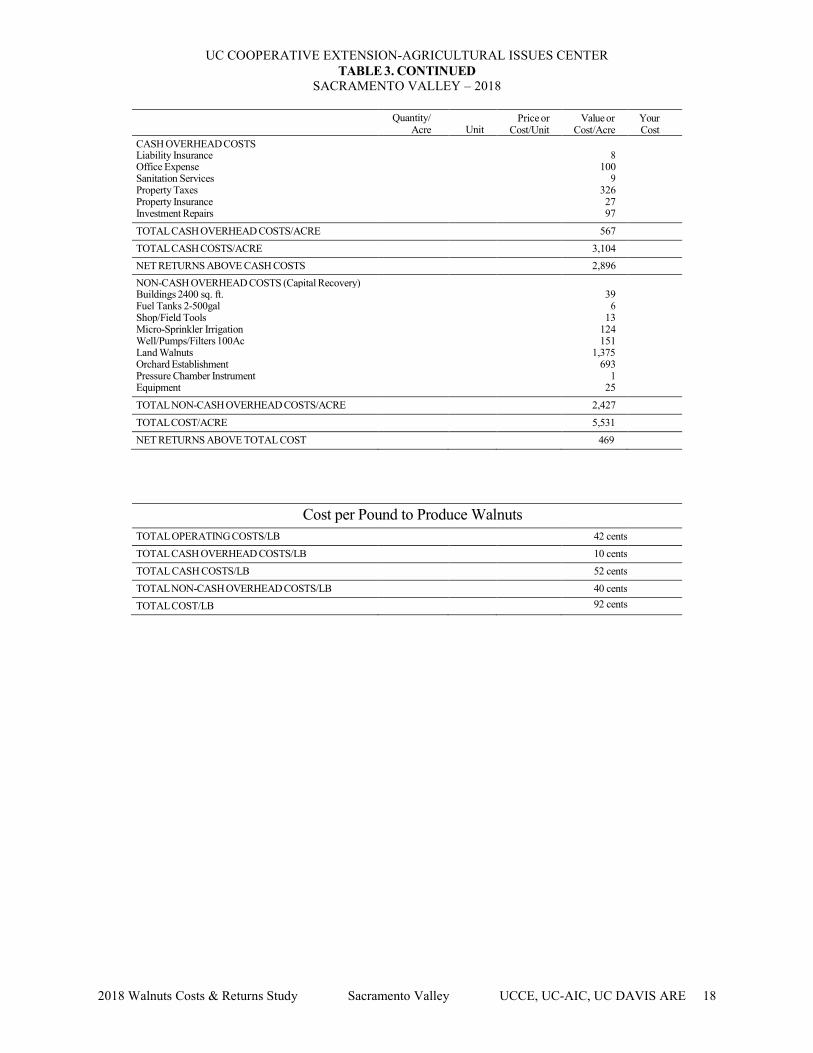
UC COOPERATIVE EXTENSION-AGRICULTURAL ISSUES CENTER TABLE 3. CONTINUED
SACRAMENTO VALLEY – 2018
Quantity/ Price or Value or Your Acre Unit Cost/Unit Cost/Acre Cost
CASH OVERHEAD COSTS Liability Insurance 8 Office Expense 100 Sanitation Services 9 Property Taxes 326 Property Insurance 27 Investment Repairs 97
TOTAL CASH OVERHEAD COSTS/ACRE 567 TOTAL CASH COSTS/ACRE 3,104 NET RETURNS ABOVE CASH COSTS 2,896 NON-CASH OVERHEAD COSTS (Capital Recovery) Buildings 2400 sq. ft. 39 Fuel Tanks 2-500gal
Land Walnuts 1,375
6 Shop/Field Tools 13 Micro-Sprinkler Irrigation 124 Well/Pumps/Filters 100Ac 151
Orchard Establishment 693 Pressure Chamber Instrument 1 Equipment 25 TOTAL NON-CASH OVERHEAD COSTS/ACRE 2,427 TOTALCOST/ACRE 5,531 NET RETURNS ABOVE TOTAL COST 469
Cost per Pound to Produce Walnuts TOTAL OPERATING COSTS/LB 42 cents TOTAL CASH OVERHEAD COSTS/LB 10 cents TOTAL CASH COSTS/LB 52 cents TOTAL NON-CASH OVERHEAD COSTS/LB 40 cents TOTALCOST/LB 92 cents
2018 Walnuts Costs & Returns Study Sacramento Valley UCCE, UC-AIC, UC DAVIS ARE 18
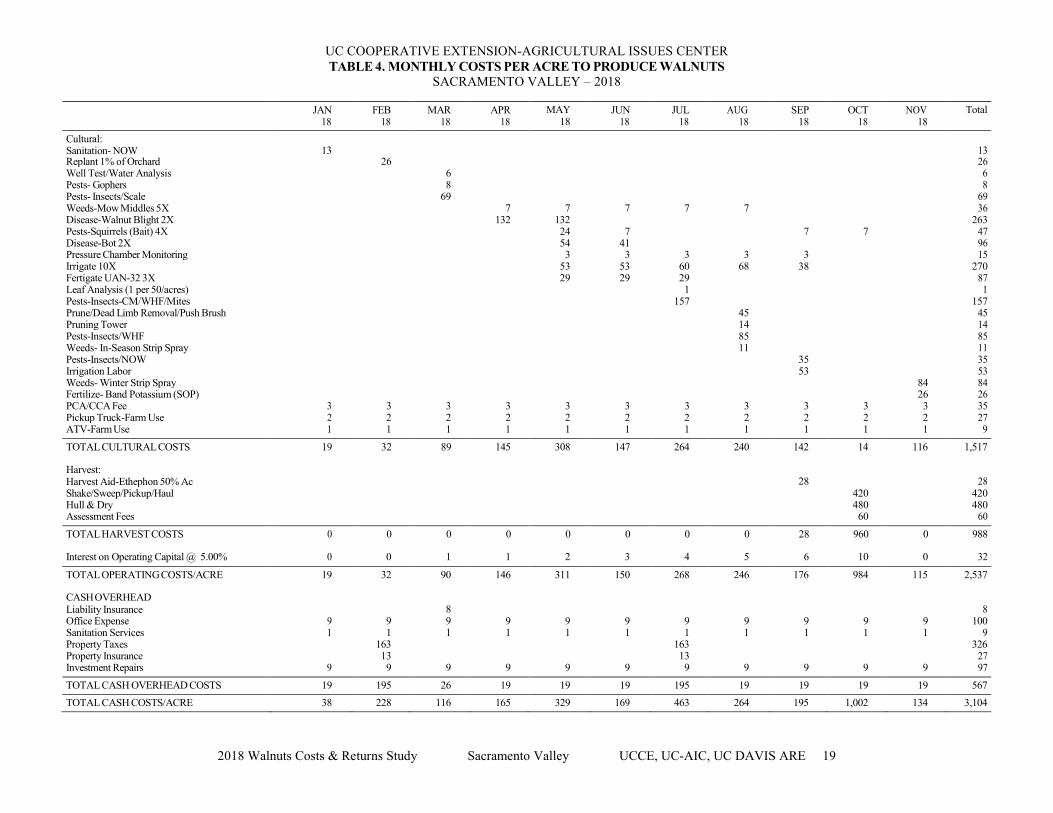
UC COOPERATIVE EXTENSION-AGRICULTURAL ISSUES CENTER TABLE 4. MONTHLY COSTS PER ACRE TO PRODUCE WALNUTS
SACRAMENTO VALLEY – 2018
JAN FEB MAR APR MAY JUN JUL AUG SEP OCT NOV Total 18 18 18 18 18 18 18 18 18 18 18
Cultural: Sanitation- NOW Replant 1% of Orchard Well Test/Water Analysis Pests- Gophers Pests- Insects/Scale Weeds-Mow Middles 5X
13 26
6 8
69 7 7 7 7 7
13 26 6 8
69 36
Disease-Walnut Blight 2X Pests-Squirrels (Bait) 4X Disease-Bot 2X
132 132 24 54
7 41
7 7 263
47 96
Pressure Chamber Monitoring Irrigate 10X Fertigate UAN-32 3X Leaf Analysis (1 per 50/acres) Pests-Insects-CM/WHF/Mites Prune/Dead Limb Removal/Push Brush Pruning Tower Pests-Insects/WHF Weeds- In-Season Strip Spray Pests-Insects/NOW Irrigation Labor Weeds- Winter Strip Spray Fertilize- Band Potassium (SOP) PCA/CCA Fee Pickup Truck-Farm Use ATV-Farm Use
3 2 1
3 2 1
3 2 1
3 2 1
3 53 29
3 2 1
3 53 29
3 2 1
3 60 29 1
157
3 2 1
3 68
45 14 85 11
3 2 1
3 38
35 53
3 2 1
3 2 1
84 26 3 2 1
15 270
87 1
157 45 14 85 11 35 53 84 26 35 27 9
TOTAL CULTURAL COSTS 19 32 89 145 308 147 264 240 142 14 116 1,517
Harvest: Harvest Aid-Ethephon 50% Ac Shake/Sweep/Pickup/Haul Hull & Dry Assessment Fees
28 420 480 60
28 420 480
60
TOTAL HARVEST COSTS 0 0 0 0 0 0 0 0 28 960 0 988
Interest on Operating Capital @ 5.00% 0 0 1 1 2 3 4 5 6 10 0 32
TOTAL OPERATING COSTS/ACRE 19 32 90 146 311 150 268 246 176 984 115 2,537
CASHOVERHEAD Liability Insurance Office Expense Sanitation Services
9 1
9 1
8 9 1
9 1
9 1
9 1
9 1
9 1
9 1
9 1
9 1
8 100
9 Property Taxes Property Insurance Investment Repairs 9
163 13 9 9 9 9 9
163 13 9 9 9 9 9
326 27 97
TOTAL CASH OVERHEAD COSTS 19 195 26 19 19 19 195 19 19 19 19 567 TOTAL CASH COSTS/ACRE 38 228 116 165 329 169 463 264 195 1,002 134 3,104
2018 Walnuts Costs & Returns Study Sacramento Valley UCCE, UC-AIC, UC DAVIS ARE 19
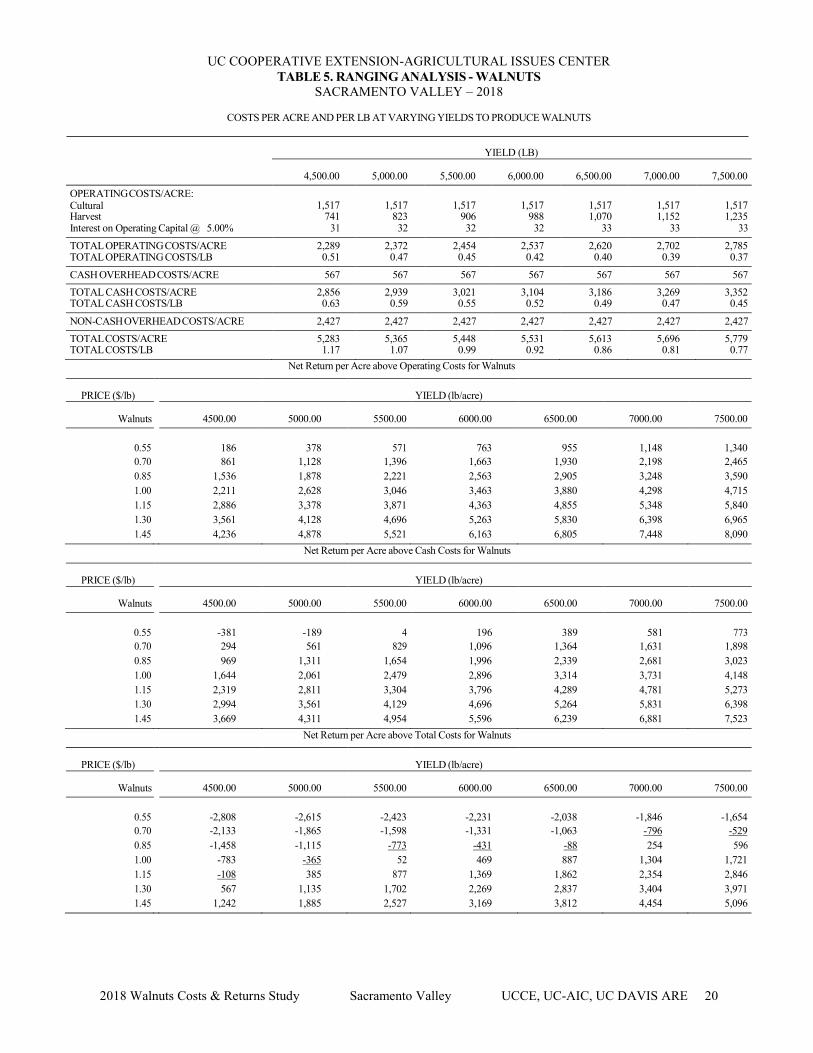
UC COOPERATIVE EXTENSION-AGRICULTURAL ISSUES CENTER TABLE 5. RANGING ANALYSIS - WALNUTS
SACRAMENTO VALLEY – 2018
COSTS PER ACRE AND PER LB AT VARYING YIELDS TO PRODUCE WALNUTS
YIELD (LB)
4,500.00 5,000.00 5,500.00 6,000.00 6,500.00 7,000.00 7,500.00 OPERATINGCOSTS/ACRE: Cultural Harvest Interest on Operating Capital @ 5.00%
TOTAL OPERATINGCOSTS/ACRE TOTAL OPERATING COSTS/LB
CASH OVERHEADCOSTS/ACRE TOTAL CASH COSTS/ACRE TOTAL CASH COSTS/LB
1,517 741
31
2,289 0.51
567 2,856 0.63
1,517 823 32
2,372 0.47
567 2,939 0.59
1,517 906 32
2,454 0.45
567 3,021 0.55
1,517 988 32
2,537 0.42
567 3,104 0.52
1,517 1,070
33
2,620 0.40
567 3,186 0.49
1,517 1,152
33
2,702 0.39
567 3,269 0.47
1,517 1,235
33
2,785 0.37
567 3,352 0.45
NON-CASHOVERHEADCOSTS/ACRE TOTALCOSTS/ACRE TOTALCOSTS/LB
2,427 2,427 2,427 2,427 5,283 5,365 5,448 5,531 1.17 1.07 0.99 0.92
Net Return per Acre above Operating Costs for Walnuts
2,427 5,613 0.86
2,427 5,696 0.81
2,427 5,779 0.77
PRICE ($/lb) YIELD (lb/acre)
Walnuts 4500.00 5000.00 5500.00 6000.00 6500.00 7000.00 7500.00
0.55 0.70 0.85 1.00 1.15 1.30 1.45
186 861
1,536 2,211 2,886 3,561 4,236
378 571 763 1,128 1,396 1,663 1,878 2,221 2,563 2,628 3,046 3,463 3,378 3,871 4,363 4,128 4,696 5,263 4,878 5,521 6,163
Net Return per Acre above Cash Costs for Walnuts
955 1,930 2,905 3,880 4,855 5,830 6,805
1,148 2,198 3,248 4,298 5,348 6,398 7,448
1,340 2,465 3,590 4,715 5,840 6,965 8,090
PRICE ($/lb) YIELD (lb/acre)
Walnuts 4500.00 5000.00 5500.00 6000.00 6500.00 7000.00 7500.00
0.55 0.70 0.85 1.00 1.15 1.30 1.45
-381 294 969
1,644 2,319 2,994 3,669
-189 4 196 561 829 1,096
1,311 1,654 1,996 2,061 2,479 2,896 2,811 3,304 3,796 3,561 4,129 4,696 4,311 4,954 5,596 Net Return per Acre above Total Costs for Walnuts
389 1,364 2,339 3,314 4,289 5,264 6,239
581 1,631 2,681 3,731 4,781 5,831 6,881
773 1,898 3,023 4,148 5,273 6,398 7,523
PRICE ($/lb) YIELD (lb/acre)
Walnuts 4500.00 5000.00 5500.00 6000.00 6500.00 7000.00 7500.00
0.55 0.70 0.85 1.00 1.15 1.30 1.45
-2,808 -2,133 -1,458
-783 -108 567
1,242
-2,615 -1,865 -1,115
-365 385
1,135 1,885
-2,423 -1,598
-773 52
877 1,702 2,527
-2,231 -1,331
-431 469
1,369 2,269 3,169
-2,038 -1,063
-88 887
1,862 2,837 3,812
-1,846 -796 254
1,304 2,354 3,404 4,454
-1,654 -529 596
1,721 2,846 3,971 5,096
2018 Walnuts Costs & Returns Study Sacramento Valley UCCE, UC-AIC, UC DAVIS ARE 20

UC COOPERATIVE EXTENSION-AGRICULTURAL ISSUES CENTER TABLE 6. WHOLE FARM ANNUAL EQUIPMENT, INVESTMENT, AND BUSINESS OVERHEAD COSTS
SACRAMENTO VALLEY – 2018
ANNUALEQUIPMENT COSTS
Cash Overhead Yrs. Salvage Capital
Yr. Description Price Life Value Recovery Insurance Taxes Total 18 90 HP 4WD Tractor 76,839 15 14,959 6,988 39 459 7,485 18 Pickup Truck 1/2 Ton 32,000 5 14,342 4,924 20 232 5,175 18 Flail Mower 14' 12,790 10 2,262 1,521 6 75 1,603 18 ATV-4WD 8,500 12 2,125 857 4 53 914 18 Bait Applicator 2,473 10 437 294 1 15 310 18 34HP2WD Tractor 21,261 12 5,316 2,142 11 133 2,287 18 ATV sprayer 200 gal 26' 9,700 10 1,715 1,154 5 57 1,216 18 Brush Rake 9' 1,800 25 51 133 1 9 143 18 Sweeper/Blower 62,000 15 5,952 5,911 29 340 6,280 18 Pruning Tower 26,900 20 1,402 2,211 12 142 2,364 18 Fertilizer spreader PTO 15,000 12 2,078 1,614 7 85 1,706
TOTAL 269,263 - 50,639 27,748 135 1,600 29,483 60% of New Cost* 161,558 - 30,383 16,649 81 960 17,690 *Used to reflect a mix of new and used equipment
ANNUAL INVESTMENT COSTS
Cash Overhead Yrs. Salvage Capital
Description Price Life Value Recovery Insurance Taxes Repairs Total INVESTMENT Buildings 2400sqft 60,000 30 4,200 4,070 27 321 1,200 5,619 Fuel Tanks 2-500gal 8,900 30 623 604 4 48 178 833 Shop/Field Tools 20,000 30 1,400 1,357 9 107 400 1,873 Irrigation System-Micro 180,000 30 0 12,385 0 900 3,600 16,885 Well/Pumps/Filters 100Ac 220,000 30 0 15,137 93 1,100 4,400 20,730 Land Walnuts 2,625,000 30 2,625,000 144,375 2,221 26,250 0 172,846 Orchard Establishment 1,007,500 30 0 69,321 426 5,038 0 74,785 Pressure Chamber Instrument 1,600 20 112 131 1 9 32 172 TOTAL INVESTMENT 4,123,000 - 2,631,335 247,380 2,781 33,772 9,810 293,743
ANNUALBUSINESS OVERHEAD COSTS
Units/ Price/ Total Description Farm Unit Unit Cost Liability Insurance 100 acre 7.71 771 Office Expense 100 acre 100.00 10,000 Sanitation Services 100 acre 8.75 875
2018 Walnuts Costs & Returns Study Sacramento Valley UCCE, UC-AIC, UC DAVIS ARE 21

UC COOPERATIVE EXTENSION-AGRICULTURAL ISSUES CENTER TABLE 7. HOURLY EQUIPMENT COSTS
SACRAMENTO VALLEY – 2018
Walnuts Total Cash Overhead Operating Hours Hours Capital Lube & Total Total
Yr. Description Used Used Recovery Insurance Taxes Repairs Fuel Oper. Costs/Hr. 18 90 HP 4WD Tractor 130 1066 3.93 0.02 0.26 3.86 12.91 16.76 20.97 18 Pickup Truck 1/2 Ton 75 400 7.39 0.03 0.35 3.48 7.30 10.78 18.54 18 Flail Mower 14' 88 200 4.56 0.02 0.23 6.16 0.00 6.16 10.97 18 ATV-4WD 66 166 3.10 0.02 0.19 0.80 1.30 2.10 5.41 18 Bait Applicator 11 120 1.47 0.01 0.07 0.95 0.00 0.95 2.50 18 34HP2WD Tractor 12 1000 1.29 0.01 0.08 1.69 4.88 6.57 7.94 18 ATV sprayer 200 gal 26' 33 150 4.61 0.02 0.23 2.60 0.00 2.60 7.46 18 Brush Rake 9' 23 80 1.00 0.01 0.07 0.32 0.00 0.32 1.39 18 Sweeper/Blower 16 250 14.19 0.07 0.82 2.49 8.76 11.25 26.32 18 Pruning Tower 46 200 6.63 0.04 0.42 1.55 6.92 8.47 15.56 18 Fertilizer spreader PTO 6 100 9.68 0.04 0.51 5.74 0.00 5.74 15.97
2018 Walnuts Costs & Returns Study Sacramento Valley UCCE, UC-AIC, UC DAVIS ARE 22

UC COOPERATIVE EXTENSION TABLE 8. OPERATIONS WITH EQUIPMENT & MATERIALS
SACRAMENTO VALLEY – 2015
Operation Labor Type/ Rate/ Operation Month Tractor Implement Material acre Unit Sanitation- NOW Jan 90 HP 4WD Tractor Flail Mower 14' Equipment Operator Labor 0.18 hour
Sweeper/Blower Equipment Operator Labor 0.17 hour Replant 1% of Orchard Feb Replant 1 Tree (Yr. 8+) 0.64 tree Well Test/Water Analysis Mar Well Test/Water Analysis 1.00 acre Pests- Gophers Mar 34HP2WD Tractor Bait Applicator Equipment Operator Labor 0.14 hour
Vertebrate Pest Bait 2.00 lb Pests- Insects/Scale Mar Spray Ground - Air Blast Sprayer 1.00 acre
Seize 35 WP 4.00 floz Weeds-Mow Middles 5X Apr 90 HP 4WD Tractor Flail Mower 14' Equipment Operator Labor 0.18 hour
May 90 HP 4WD Tractor Flail Mower 14' Equipment Operator Labor 0.18 hour June 90 HP 4WD Tractor Flail Mower 14' Equipment Operator Labor 0.18 hour July 90 HP 4WD Tractor Flail Mower 14' Equipment Operator Labor 0.18 hour Aug 90 HP 4WD Tractor Flail Mower 14' Equipment Operator Labor 0.18 hour
Disease-Walnut Blight Apr Spray Ground - Air Blast Sprayer 1.00 acre Manzate Pro Stick 2.40 lb Kocide 3000 5.00 lb Kasumin 0.50 gal
May Kocide 3000 5.00 lb Manzate Pro Stick 2.40 lb Kasumin 0.50 gal Spray Ground - Air Blast Sprayer 1.00 acre
Pests-Squirrels (Bait) May Non-Machine Labor 0.20 hour Vertebrate Pest Bait 2.00 lb Bait Stations 2.00 each
June Non-Machine Labor 0.20 hour Vertebrate Pest Bait 2.00 lb
Sept Non-Machine Labor 0.20 hour Vertebrate Pest Bait 2.00 lb
Oct Non-Machine Labor 0.20 hour Vertebrate Pest Bait 2.00 lb
Disease-Bot 2X May Spray Ground - Air Blast Sprayer 1.00 acre Merivon 4.00 floz
June Spray Ground - Air Blast Sprayer 1.00 acre Quadris Top 12.00 floz
Pressure Chamber May- Sept Pressure Chamber Monitoring 1.00 acre Irrigate 10X May Water-Pumped 7.00 acin
June Water-Pumped 7.00 acin July Water-Pumped 8.00 acin Aug Water-Pumped 9.00 acin Sept Water-Pumped 5.00 acin
Fertigate UAN-32 3X May UAN-32 50.00 lb N June UAN-32 50.00 lb N July UAN-32 50.00 lb N
Leaf Analysis (1 per 50 Ac) July Leaf Analysis 0.02 each Pests-Insects-CM/WHF July Spray Ground - Air Blast Sprayer 1.00 acre
Zeal 2.00 oz Nu-Lure Bait 3.00 pt Altacor 4.50 floz Brigade WSB 3.20 oz
Prune/Dead Limb Removal Aug 90 HP 4WD Tractor Brush Rake 9' Non-Machine Labor 2.00 hours Pruning Tower Equipment Operator Labor 0.50 hour
Pests-Insects/WHF Aug Nu-Lure Bait 3.00 pt Assail 30 SG 8.00 oz Spray Ground - Air Blast Sprayer 1.00 acre
Weeds- In-Season Strip Aug ATV-4WD Equipment Operator Labor 0.20 hour Rely 280 12.00 floz
ATV sprayer 200 gal 26' Pests-Insects/NOW Sept Spray Ground - Air Blast Sprayer 1.00 acre
Bifenture EC 12.00 floz Irrigation Labor Sept Irrigation Labor 3.00 hours Weeds- Winter Strip Nov ATV-4WD Equipment Operator Labor 0.20 hour
Alion 3.50 floz ATV sprayer 200 gal 26' Matrix SG 4.00 oz
Roundup PowerMax 2.00 pt Fertilize- Band Potassium Nov 90 HP 4WD Tractor Fertilizer spreader PTO Equipment Operator Labor 0.08 hour
Sulfate of Potash 60.00 lb PCA/CCA Fee Nov PCA/CCA Fee (YR4-8) 1.00 acre Pickup Truck-Farm Nov Pickup Truck 1/2 Ton Equipment Operator Labor 0.90 hour ATV-Farm Use Nov ATV-4WD Equipment Operator Labor 0.40 hour Harvest Aid-Ethephon Sept Spray Ground - Air Blast 0.50 acre
Ethephon 2SL 2.00 pt Shake/Sweep/Pickup/ Oct Shake Sweep Pickup Haul 6,000.00 lb Hull & Dry Oct Dry/Hull 6,000.00 lb Assessment Fees Oct CWC 6,000.00 lb
2018 Walnuts Costs & Returns Study Sacramento Valley UCCE, UC-AIC, UC DAVIS ARE 23

2018 Walnuts Costs & Returns Study Sacramento Valley UCCE, UC-AIC, UC DAVIS ARE 24