Embed Size (px)
Citation preview
Sample ChaptersCopyright © 2011 by Aaron Margosis and Mark Russinovich
All rights reserved.
To learn more about this book visit:http://oreilly.com/catalog/9780735656727/
vii
Table of ContentsForeword . . . . . . . . . . . . . . . . . . . . . . . . . . . . . . . . . . . . . . . . . . . . . . . . . . . . . . . . . .xix
Introduction . . . . . . . . . . . . . . . . . . . . . . . . . . . . . . . . . . . . . . . . . . . . . . . . . . . . . . .xxiTools the Book Covers . . . . . . . . . . . . . . . . . . . . . . . . . . . . . . . . . . . . . . . . . . . . .xxiThe History of Sysinternals . . . . . . . . . . . . . . . . . . . . . . . . . . . . . . . . . . . . . . . . xxiiWho Should Read This Book . . . . . . . . . . . . . . . . . . . . . . . . . . . . . . . . . . . . . . . xxv
Assumptions . . . . . . . . . . . . . . . . . . . . . . . . . . . . . . . . . . . . . . . . . . . . . . . . xxvOrganization of This Book . . . . . . . . . . . . . . . . . . . . . . . . . . . . . . . . . . . . . . . . .xxviConventions and Features in This Book . . . . . . . . . . . . . . . . . . . . . . . . . . . . .xxviSystem Requirements . . . . . . . . . . . . . . . . . . . . . . . . . . . . . . . . . . . . . . . . . . . . .xxviAcknowledgments . . . . . . . . . . . . . . . . . . . . . . . . . . . . . . . . . . . . . . . . . . . . . . xxviiErrata & Book Support . . . . . . . . . . . . . . . . . . . . . . . . . . . . . . . . . . . . . . . . . . xxviiiWe Want to Hear from You . . . . . . . . . . . . . . . . . . . . . . . . . . . . . . . . . . . . . . xxviiiStay in Touch . . . . . . . . . . . . . . . . . . . . . . . . . . . . . . . . . . . . . . . . . . . . . . . . . . xxviii
Part I GettingStarted 1 Getting Started with the Sysinternals Utilities . . . . . . . . . . . . . . . . 3
Overview of the Utilities . . . . . . . . . . . . . . . . . . . . . . . . . . . . . . . . . . . . . . . . . . . . 3The Windows Sysinternals Web Site . . . . . . . . . . . . . . . . . . . . . . . . . . . . . . . . . . 6
Downloading the Utilities . . . . . . . . . . . . . . . . . . . . . . . . . . . . . . . . . . . . . . 7Running the Utilities Directly from the Web . . . . . . . . . . . . . . . . . . . . . 10Single Executable Image . . . . . . . . . . . . . . . . . . . . . . . . . . . . . . . . . . . . . . 11The Windows Sysinternals Forums . . . . . . . . . . . . . . . . . . . . . . . . . . . . . . 11Windows Sysinternals Site Blog . . . . . . . . . . . . . . . . . . . . . . . . . . . . . . . . 12Mark’s Blog . . . . . . . . . . . . . . . . . . . . . . . . . . . . . . . . . . . . . . . . . . . . . . . . . 12Mark’s Webcasts . . . . . . . . . . . . . . . . . . . . . . . . . . . . . . . . . . . . . . . . . . . . . 13
Sysinternals License Information . . . . . . . . . . . . . . . . . . . . . . . . . . . . . . . . . . . . 13End User License Agreement and the /accepteula Switch . . . . . . . . . . 13Frequently Asked Questions About Sysinternals Licensing . . . . . . . . . 14
Microsoft is interested in hearing your feedback so we can continually improve our books and learning resources for you. To participate in a brief online survey, please visit:
www.microsoft.com/learning/booksurvey/
What do you think of this book? We want to hear from you!
viii Table of Contents
2 Windows Core Concepts . . . . . . . . . . . . . . . . . . . . . . . . . . . . . . . . . 15Administrative Rights . . . . . . . . . . . . . . . . . . . . . . . . . . . . . . . . . . . . . . . . . . . . . . 15
Running a Program with Administrative Rights on Windows XP and Windows Server 2003 . . . . . . . . . . . . . . . . . . . . . . . . . 16Running a Program with Administrative Rights on Windows Vista or Newer . . . . . . . . . . . . . . . . . . . . . . . . . . . . . . . . . . . . . . 18
Processes, Threads, and Jobs . . . . . . . . . . . . . . . . . . . . . . . . . . . . . . . . . . . . . . . 21User Mode and Kernel Mode . . . . . . . . . . . . . . . . . . . . . . . . . . . . . . . . . . . . . . . 22Handles . . . . . . . . . . . . . . . . . . . . . . . . . . . . . . . . . . . . . . . . . . . . . . . . . . . . . . . . . . 23Call Stacks and Symbols . . . . . . . . . . . . . . . . . . . . . . . . . . . . . . . . . . . . . . . . . . . . 24
What Is a Call Stack? . . . . . . . . . . . . . . . . . . . . . . . . . . . . . . . . . . . . . . . . . . 24What Are Symbols? . . . . . . . . . . . . . . . . . . . . . . . . . . . . . . . . . . . . . . . . . . . 26Configuring Symbols . . . . . . . . . . . . . . . . . . . . . . . . . . . . . . . . . . . . . . . . . 28
Sessions, Window Stations, Desktops, and Window Messages . . . . . . . . . . 30Terminal Services Sessions . . . . . . . . . . . . . . . . . . . . . . . . . . . . . . . . . . . . . 31Window Stations . . . . . . . . . . . . . . . . . . . . . . . . . . . . . . . . . . . . . . . . . . . . . 32Desktops . . . . . . . . . . . . . . . . . . . . . . . . . . . . . . . . . . . . . . . . . . . . . . . . . . . . 33Window Messages . . . . . . . . . . . . . . . . . . . . . . . . . . . . . . . . . . . . . . . . . . . 34
Part II UsageGuide 3 Process Explorer . . . . . . . . . . . . . . . . . . . . . . . . . . . . . . . . . . . . . . . . 39
Procexp Overview . . . . . . . . . . . . . . . . . . . . . . . . . . . . . . . . . . . . . . . . . . . . . . . . . 39Measuring CPU Consumption . . . . . . . . . . . . . . . . . . . . . . . . . . . . . . . . . . 41Administrative Rights . . . . . . . . . . . . . . . . . . . . . . . . . . . . . . . . . . . . . . . . . 42
Main Window . . . . . . . . . . . . . . . . . . . . . . . . . . . . . . . . . . . . . . . . . . . . . . . . . . . . 43Process List . . . . . . . . . . . . . . . . . . . . . . . . . . . . . . . . . . . . . . . . . . . . . . . . . . 43Customizing Column Selections . . . . . . . . . . . . . . . . . . . . . . . . . . . . . . . . 53Saving Displayed Data . . . . . . . . . . . . . . . . . . . . . . . . . . . . . . . . . . . . . . . . 65Toolbar Reference . . . . . . . . . . . . . . . . . . . . . . . . . . . . . . . . . . . . . . . . . . . . 65Identifying the Process That Owns a Window . . . . . . . . . . . . . . . . . . . . 66Status Bar . . . . . . . . . . . . . . . . . . . . . . . . . . . . . . . . . . . . . . . . . . . . . . . . . . . 67
DLLs and Handles . . . . . . . . . . . . . . . . . . . . . . . . . . . . . . . . . . . . . . . . . . . . . . . . . 67Finding DLLs or Handles . . . . . . . . . . . . . . . . . . . . . . . . . . . . . . . . . . . . . . 68DLL View . . . . . . . . . . . . . . . . . . . . . . . . . . . . . . . . . . . . . . . . . . . . . . . . . . . . 69Handle View . . . . . . . . . . . . . . . . . . . . . . . . . . . . . . . . . . . . . . . . . . . . . . . . . 73
Process Details . . . . . . . . . . . . . . . . . . . . . . . . . . . . . . . . . . . . . . . . . . . . . . . . . . . . 77Image Tab . . . . . . . . . . . . . . . . . . . . . . . . . . . . . . . . . . . . . . . . . . . . . . . . . . . 78Performance Tab . . . . . . . . . . . . . . . . . . . . . . . . . . . . . . . . . . . . . . . . . . . . . 79
Table of Contents ix
Performance Graph Tab . . . . . . . . . . . . . . . . . . . . . . . . . . . . . . . . . . . . . . . 80Threads Tab . . . . . . . . . . . . . . . . . . . . . . . . . . . . . . . . . . . . . . . . . . . . . . . . . 81TCP/IP Tab . . . . . . . . . . . . . . . . . . . . . . . . . . . . . . . . . . . . . . . . . . . . . . . . . . . 82Security Tab . . . . . . . . . . . . . . . . . . . . . . . . . . . . . . . . . . . . . . . . . . . . . . . . . 83Environment Tab . . . . . . . . . . . . . . . . . . . . . . . . . . . . . . . . . . . . . . . . . . . . . 84Strings Tab . . . . . . . . . . . . . . . . . . . . . . . . . . . . . . . . . . . . . . . . . . . . . . . . . . 85Services Tab . . . . . . . . . . . . . . . . . . . . . . . . . . . . . . . . . . . . . . . . . . . . . . . . . 86 .NET Tabs . . . . . . . . . . . . . . . . . . . . . . . . . . . . . . . . . . . . . . . . . . . . . . . . . . . 87Job Tab . . . . . . . . . . . . . . . . . . . . . . . . . . . . . . . . . . . . . . . . . . . . . . . . . . . . . 88
Thread Details . . . . . . . . . . . . . . . . . . . . . . . . . . . . . . . . . . . . . . . . . . . . . . . . . . . . 89Verifying Image Signatures . . . . . . . . . . . . . . . . . . . . . . . . . . . . . . . . . . . . . . . . . 91System Information . . . . . . . . . . . . . . . . . . . . . . . . . . . . . . . . . . . . . . . . . . . . . . . 92Display Options . . . . . . . . . . . . . . . . . . . . . . . . . . . . . . . . . . . . . . . . . . . . . . . . . . . 95Procexp as a Task Manager Replacement . . . . . . . . . . . . . . . . . . . . . . . . . . . . . 96
Creating Processes from Procexp . . . . . . . . . . . . . . . . . . . . . . . . . . . . . . . 97Other User Sessions . . . . . . . . . . . . . . . . . . . . . . . . . . . . . . . . . . . . . . . . . . 97
Miscellaneous Features . . . . . . . . . . . . . . . . . . . . . . . . . . . . . . . . . . . . . . . . . . . . 97Shutdown Options . . . . . . . . . . . . . . . . . . . . . . . . . . . . . . . . . . . . . . . . . . . 97Command-Line Switches . . . . . . . . . . . . . . . . . . . . . . . . . . . . . . . . . . . . . . 98Restoring Procexp Defaults . . . . . . . . . . . . . . . . . . . . . . . . . . . . . . . . . . . . 98
Keyboard Shortcut Reference . . . . . . . . . . . . . . . . . . . . . . . . . . . . . . . . . . . . . . . 98
4 Process Monitor . . . . . . . . . . . . . . . . . . . . . . . . . . . . . . . . . . . . . . . 101Getting Started with Procmon . . . . . . . . . . . . . . . . . . . . . . . . . . . . . . . . . . . . . 102Events . . . . . . . . . . . . . . . . . . . . . . . . . . . . . . . . . . . . . . . . . . . . . . . . . . . . . . . . . . 104
Understanding the Column Display Defaults . . . . . . . . . . . . . . . . . . . . 104Customizing the Column Display . . . . . . . . . . . . . . . . . . . . . . . . . . . . . . 107Event Properties Dialog Box . . . . . . . . . . . . . . . . . . . . . . . . . . . . . . . . . . 108Displaying Profiling Events . . . . . . . . . . . . . . . . . . . . . . . . . . . . . . . . . . . 114Finding an Event . . . . . . . . . . . . . . . . . . . . . . . . . . . . . . . . . . . . . . . . . . . . 115Copying Event Data . . . . . . . . . . . . . . . . . . . . . . . . . . . . . . . . . . . . . . . . . 115Jumping to a Registry or File Location . . . . . . . . . . . . . . . . . . . . . . . . . 115Searching Online . . . . . . . . . . . . . . . . . . . . . . . . . . . . . . . . . . . . . . . . . . . . 116
Filtering and Highlighting . . . . . . . . . . . . . . . . . . . . . . . . . . . . . . . . . . . . . . . . . 116Configuring Filters . . . . . . . . . . . . . . . . . . . . . . . . . . . . . . . . . . . . . . . . . . 117Configuring Highlighting . . . . . . . . . . . . . . . . . . . . . . . . . . . . . . . . . . . . 119Advanced Output . . . . . . . . . . . . . . . . . . . . . . . . . . . . . . . . . . . . . . . . . . . 120Saving Filters for Later Use . . . . . . . . . . . . . . . . . . . . . . . . . . . . . . . . . . . 121
x Table of Contents
Process Tree . . . . . . . . . . . . . . . . . . . . . . . . . . . . . . . . . . . . . . . . . . . . . . . . . . . . . 122Saving and Opening Procmon Traces . . . . . . . . . . . . . . . . . . . . . . . . . . . . . . . 123
Saving Procmon Traces . . . . . . . . . . . . . . . . . . . . . . . . . . . . . . . . . . . . . . 124Opening Saved Procmon Traces . . . . . . . . . . . . . . . . . . . . . . . . . . . . . . . 125
Logging Boot, Post-Logoff, and Shutdown Activity . . . . . . . . . . . . . . . . . . . 127Boot Logging . . . . . . . . . . . . . . . . . . . . . . . . . . . . . . . . . . . . . . . . . . . . . . . 127Keeping Procmon Running After Logoff . . . . . . . . . . . . . . . . . . . . . . . 128
Long-Running Traces and Controlling Log Sizes . . . . . . . . . . . . . . . . . . . . . . 129Drop Filtered Events . . . . . . . . . . . . . . . . . . . . . . . . . . . . . . . . . . . . . . . . . 129History Depth . . . . . . . . . . . . . . . . . . . . . . . . . . . . . . . . . . . . . . . . . . . . . . 130Backing Files . . . . . . . . . . . . . . . . . . . . . . . . . . . . . . . . . . . . . . . . . . . . . . . 130
Importing and Exporting Configuration Settings . . . . . . . . . . . . . . . . . . . . . 131Automating Procmon: Command-Line Options . . . . . . . . . . . . . . . . . . . . . . 132Analysis Tools . . . . . . . . . . . . . . . . . . . . . . . . . . . . . . . . . . . . . . . . . . . . . . . . . . . . 134
Process Activity Summary . . . . . . . . . . . . . . . . . . . . . . . . . . . . . . . . . . . 134File Summary . . . . . . . . . . . . . . . . . . . . . . . . . . . . . . . . . . . . . . . . . . . . . . . 136Registry Summary . . . . . . . . . . . . . . . . . . . . . . . . . . . . . . . . . . . . . . . . . . . 137Stack Summary . . . . . . . . . . . . . . . . . . . . . . . . . . . . . . . . . . . . . . . . . . . . . 138Network Summary . . . . . . . . . . . . . . . . . . . . . . . . . . . . . . . . . . . . . . . . . . 139Cross Reference Summary . . . . . . . . . . . . . . . . . . . . . . . . . . . . . . . . . . . . 140Count Occurrences . . . . . . . . . . . . . . . . . . . . . . . . . . . . . . . . . . . . . . . . . . 140
Injecting Debug Output into Procmon Traces . . . . . . . . . . . . . . . . . . . . . . . . 141Toolbar Reference . . . . . . . . . . . . . . . . . . . . . . . . . . . . . . . . . . . . . . . . . . . . . . . . 142
5 Autoruns . . . . . . . . . . . . . . . . . . . . . . . . . . . . . . . . . . . . . . . . . . . . . . 145Autoruns Fundamentals . . . . . . . . . . . . . . . . . . . . . . . . . . . . . . . . . . . . . . . . . . . 146
Disabling or Deleting Autostart Entries . . . . . . . . . . . . . . . . . . . . . . . . 148Autoruns and Administrative Permissions . . . . . . . . . . . . . . . . . . . . . . 148Verifying Code Signatures . . . . . . . . . . . . . . . . . . . . . . . . . . . . . . . . . . . . 149Hiding Microsoft Entries . . . . . . . . . . . . . . . . . . . . . . . . . . . . . . . . . . . . . 150Getting More Information About an Entry . . . . . . . . . . . . . . . . . . . . . . 151Viewing the Autostarts of Other Users . . . . . . . . . . . . . . . . . . . . . . . . . 151Viewing ASEPs of an Offline System . . . . . . . . . . . . . . . . . . . . . . . . . . . 152Listing Unused ASEPs . . . . . . . . . . . . . . . . . . . . . . . . . . . . . . . . . . . . . . . . 152Changing the Font . . . . . . . . . . . . . . . . . . . . . . . . . . . . . . . . . . . . . . . . . . 153
Autostart Categories . . . . . . . . . . . . . . . . . . . . . . . . . . . . . . . . . . . . . . . . . . . . . 153Logon . . . . . . . . . . . . . . . . . . . . . . . . . . . . . . . . . . . . . . . . . . . . . . . . . . . . . 153Explorer . . . . . . . . . . . . . . . . . . . . . . . . . . . . . . . . . . . . . . . . . . . . . . . . . . . . 155Internet Explorer . . . . . . . . . . . . . . . . . . . . . . . . . . . . . . . . . . . . . . . . . . . . 157
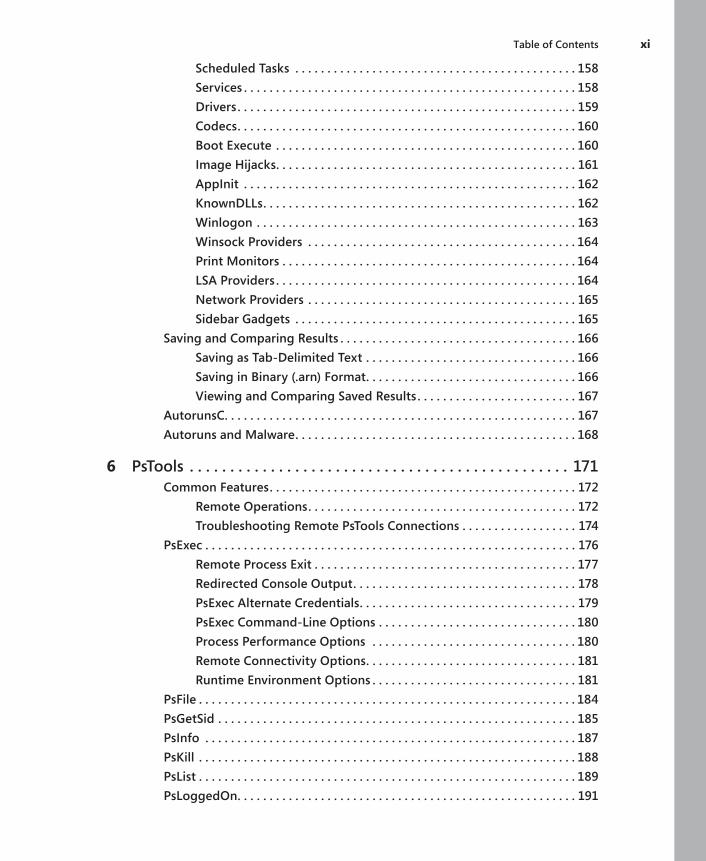
Table of Contents xi
Scheduled Tasks . . . . . . . . . . . . . . . . . . . . . . . . . . . . . . . . . . . . . . . . . . . . 158Services . . . . . . . . . . . . . . . . . . . . . . . . . . . . . . . . . . . . . . . . . . . . . . . . . . . . 158Drivers . . . . . . . . . . . . . . . . . . . . . . . . . . . . . . . . . . . . . . . . . . . . . . . . . . . . . 159Codecs . . . . . . . . . . . . . . . . . . . . . . . . . . . . . . . . . . . . . . . . . . . . . . . . . . . . . 160Boot Execute . . . . . . . . . . . . . . . . . . . . . . . . . . . . . . . . . . . . . . . . . . . . . . . 160Image Hijacks . . . . . . . . . . . . . . . . . . . . . . . . . . . . . . . . . . . . . . . . . . . . . . . 161AppInit . . . . . . . . . . . . . . . . . . . . . . . . . . . . . . . . . . . . . . . . . . . . . . . . . . . . 162KnownDLLs . . . . . . . . . . . . . . . . . . . . . . . . . . . . . . . . . . . . . . . . . . . . . . . . . 162Winlogon . . . . . . . . . . . . . . . . . . . . . . . . . . . . . . . . . . . . . . . . . . . . . . . . . . 163Winsock Providers . . . . . . . . . . . . . . . . . . . . . . . . . . . . . . . . . . . . . . . . . . 164Print Monitors . . . . . . . . . . . . . . . . . . . . . . . . . . . . . . . . . . . . . . . . . . . . . . 164LSA Providers . . . . . . . . . . . . . . . . . . . . . . . . . . . . . . . . . . . . . . . . . . . . . . . 164Network Providers . . . . . . . . . . . . . . . . . . . . . . . . . . . . . . . . . . . . . . . . . . 165Sidebar Gadgets . . . . . . . . . . . . . . . . . . . . . . . . . . . . . . . . . . . . . . . . . . . . 165
Saving and Comparing Results . . . . . . . . . . . . . . . . . . . . . . . . . . . . . . . . . . . . . 166Saving as Tab-Delimited Text . . . . . . . . . . . . . . . . . . . . . . . . . . . . . . . . . 166Saving in Binary ( .arn) Format . . . . . . . . . . . . . . . . . . . . . . . . . . . . . . . . . 166Viewing and Comparing Saved Results . . . . . . . . . . . . . . . . . . . . . . . . . 167
AutorunsC . . . . . . . . . . . . . . . . . . . . . . . . . . . . . . . . . . . . . . . . . . . . . . . . . . . . . . . 167Autoruns and Malware . . . . . . . . . . . . . . . . . . . . . . . . . . . . . . . . . . . . . . . . . . . . 168
6 PsTools . . . . . . . . . . . . . . . . . . . . . . . . . . . . . . . . . . . . . . . . . . . . . . . 171Common Features . . . . . . . . . . . . . . . . . . . . . . . . . . . . . . . . . . . . . . . . . . . . . . . . 172
Remote Operations . . . . . . . . . . . . . . . . . . . . . . . . . . . . . . . . . . . . . . . . . . 172Troubleshooting Remote PsTools Connections . . . . . . . . . . . . . . . . . . 174
PsExec . . . . . . . . . . . . . . . . . . . . . . . . . . . . . . . . . . . . . . . . . . . . . . . . . . . . . . . . . . 176Remote Process Exit . . . . . . . . . . . . . . . . . . . . . . . . . . . . . . . . . . . . . . . . . 177Redirected Console Output . . . . . . . . . . . . . . . . . . . . . . . . . . . . . . . . . . . 178PsExec Alternate Credentials . . . . . . . . . . . . . . . . . . . . . . . . . . . . . . . . . . 179PsExec Command-Line Options . . . . . . . . . . . . . . . . . . . . . . . . . . . . . . . 180Process Performance Options . . . . . . . . . . . . . . . . . . . . . . . . . . . . . . . . 180Remote Connectivity Options . . . . . . . . . . . . . . . . . . . . . . . . . . . . . . . . . 181Runtime Environment Options . . . . . . . . . . . . . . . . . . . . . . . . . . . . . . . . 181
PsFile . . . . . . . . . . . . . . . . . . . . . . . . . . . . . . . . . . . . . . . . . . . . . . . . . . . . . . . . . . . 184PsGetSid . . . . . . . . . . . . . . . . . . . . . . . . . . . . . . . . . . . . . . . . . . . . . . . . . . . . . . . . 185PsInfo . . . . . . . . . . . . . . . . . . . . . . . . . . . . . . . . . . . . . . . . . . . . . . . . . . . . . . . . . . 187PsKill . . . . . . . . . . . . . . . . . . . . . . . . . . . . . . . . . . . . . . . . . . . . . . . . . . . . . . . . . . . 188PsList . . . . . . . . . . . . . . . . . . . . . . . . . . . . . . . . . . . . . . . . . . . . . . . . . . . . . . . . . . . 189PsLoggedOn . . . . . . . . . . . . . . . . . . . . . . . . . . . . . . . . . . . . . . . . . . . . . . . . . . . . . 191
xii Table of Contents
PsLogList . . . . . . . . . . . . . . . . . . . . . . . . . . . . . . . . . . . . . . . . . . . . . . . . . . . . . . . . 192PsPasswd . . . . . . . . . . . . . . . . . . . . . . . . . . . . . . . . . . . . . . . . . . . . . . . . . . . . . . . . 196PsService . . . . . . . . . . . . . . . . . . . . . . . . . . . . . . . . . . . . . . . . . . . . . . . . . . . . . . . . 197
Query . . . . . . . . . . . . . . . . . . . . . . . . . . . . . . . . . . . . . . . . . . . . . . . . . . . . . . 198Config . . . . . . . . . . . . . . . . . . . . . . . . . . . . . . . . . . . . . . . . . . . . . . . . . . . . . 199Depend . . . . . . . . . . . . . . . . . . . . . . . . . . . . . . . . . . . . . . . . . . . . . . . . . . . . 200Security . . . . . . . . . . . . . . . . . . . . . . . . . . . . . . . . . . . . . . . . . . . . . . . . . . . . 201Find . . . . . . . . . . . . . . . . . . . . . . . . . . . . . . . . . . . . . . . . . . . . . . . . . . . . . . . 202SetConfig . . . . . . . . . . . . . . . . . . . . . . . . . . . . . . . . . . . . . . . . . . . . . . . . . . 202Start, Stop, Restart, Pause, Continue . . . . . . . . . . . . . . . . . . . . . . . . . . . 202
PsShutdown . . . . . . . . . . . . . . . . . . . . . . . . . . . . . . . . . . . . . . . . . . . . . . . . . . . . . 203PsSuspend . . . . . . . . . . . . . . . . . . . . . . . . . . . . . . . . . . . . . . . . . . . . . . . . . . . . . . 205PsTools Command-Line Syntax . . . . . . . . . . . . . . . . . . . . . . . . . . . . . . . . . . . . . 206
PsExec . . . . . . . . . . . . . . . . . . . . . . . . . . . . . . . . . . . . . . . . . . . . . . . . . . . . . 206PsFile . . . . . . . . . . . . . . . . . . . . . . . . . . . . . . . . . . . . . . . . . . . . . . . . . . . . . . 206PsGetSid . . . . . . . . . . . . . . . . . . . . . . . . . . . . . . . . . . . . . . . . . . . . . . . . . . . 206PsInfo . . . . . . . . . . . . . . . . . . . . . . . . . . . . . . . . . . . . . . . . . . . . . . . . . . . . . 207PsKill . . . . . . . . . . . . . . . . . . . . . . . . . . . . . . . . . . . . . . . . . . . . . . . . . . . . . . 207PsList . . . . . . . . . . . . . . . . . . . . . . . . . . . . . . . . . . . . . . . . . . . . . . . . . . . . . . 207PsLoggedOn . . . . . . . . . . . . . . . . . . . . . . . . . . . . . . . . . . . . . . . . . . . . . . . . 207PsLogList . . . . . . . . . . . . . . . . . . . . . . . . . . . . . . . . . . . . . . . . . . . . . . . . . . . 207PsPasswd . . . . . . . . . . . . . . . . . . . . . . . . . . . . . . . . . . . . . . . . . . . . . . . . . . . 207PsService . . . . . . . . . . . . . . . . . . . . . . . . . . . . . . . . . . . . . . . . . . . . . . . . . . . 207PsShutdown . . . . . . . . . . . . . . . . . . . . . . . . . . . . . . . . . . . . . . . . . . . . . . . . 208PsSuspend . . . . . . . . . . . . . . . . . . . . . . . . . . . . . . . . . . . . . . . . . . . . . . . . . 208
PsTools System Requirements . . . . . . . . . . . . . . . . . . . . . . . . . . . . . . . . . . . . . . 208
7 Process and Diagnostic Utilities . . . . . . . . . . . . . . . . . . . . . . . . . . 211VMMap . . . . . . . . . . . . . . . . . . . . . . . . . . . . . . . . . . . . . . . . . . . . . . . . . . . . . . . . . 211
Starting VMMap and Choosing a Process . . . . . . . . . . . . . . . . . . . . . . . 212The VMMap window . . . . . . . . . . . . . . . . . . . . . . . . . . . . . . . . . . . . . . . . 214Memory Types . . . . . . . . . . . . . . . . . . . . . . . . . . . . . . . . . . . . . . . . . . . . . . 216Memory Information . . . . . . . . . . . . . . . . . . . . . . . . . . . . . . . . . . . . . . . . 217Timeline and Snapshots . . . . . . . . . . . . . . . . . . . . . . . . . . . . . . . . . . . . . . 218Viewing Text Within Memory Regions . . . . . . . . . . . . . . . . . . . . . . . . . 220Finding and Copying Text . . . . . . . . . . . . . . . . . . . . . . . . . . . . . . . . . . . . 221Viewing Allocations from Instrumented Processes . . . . . . . . . . . . . . . 221Address Space Fragmentation . . . . . . . . . . . . . . . . . . . . . . . . . . . . . . . . 224Saving and Loading Snapshot Results . . . . . . . . . . . . . . . . . . . . . . . . . . 225
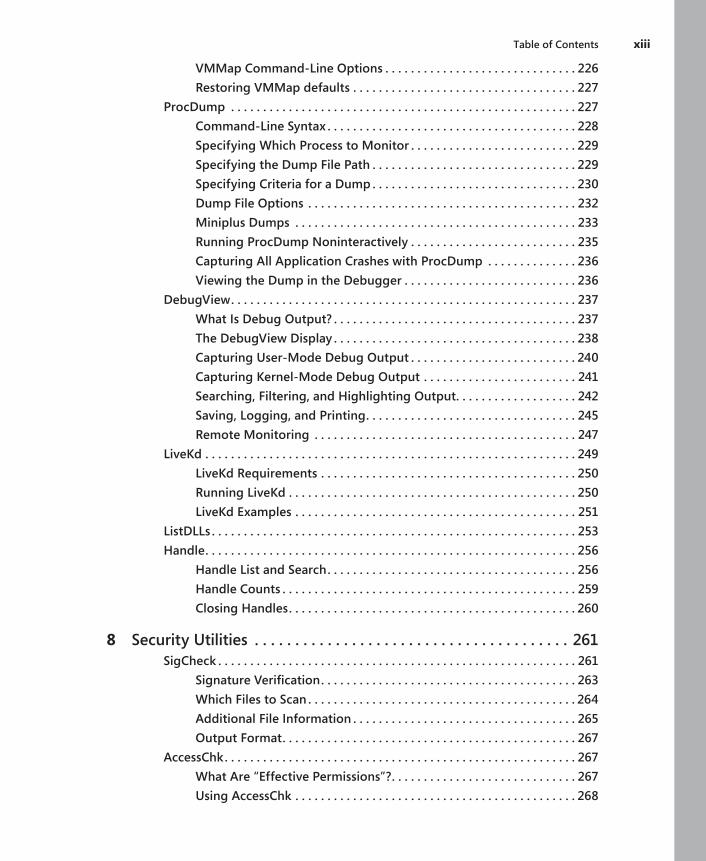
Table of Contents xiii
VMMap Command-Line Options . . . . . . . . . . . . . . . . . . . . . . . . . . . . . . 226Restoring VMMap defaults . . . . . . . . . . . . . . . . . . . . . . . . . . . . . . . . . . . 227
ProcDump . . . . . . . . . . . . . . . . . . . . . . . . . . . . . . . . . . . . . . . . . . . . . . . . . . . . . . 227Command-Line Syntax . . . . . . . . . . . . . . . . . . . . . . . . . . . . . . . . . . . . . . . 228Specifying Which Process to Monitor . . . . . . . . . . . . . . . . . . . . . . . . . . 229Specifying the Dump File Path . . . . . . . . . . . . . . . . . . . . . . . . . . . . . . . . 229Specifying Criteria for a Dump . . . . . . . . . . . . . . . . . . . . . . . . . . . . . . . . 230Dump File Options . . . . . . . . . . . . . . . . . . . . . . . . . . . . . . . . . . . . . . . . . . 232Miniplus Dumps . . . . . . . . . . . . . . . . . . . . . . . . . . . . . . . . . . . . . . . . . . . . 233Running ProcDump Noninteractively . . . . . . . . . . . . . . . . . . . . . . . . . . 235Capturing All Application Crashes with ProcDump . . . . . . . . . . . . . . 236Viewing the Dump in the Debugger . . . . . . . . . . . . . . . . . . . . . . . . . . . 236
DebugView . . . . . . . . . . . . . . . . . . . . . . . . . . . . . . . . . . . . . . . . . . . . . . . . . . . . . . 237What Is Debug Output? . . . . . . . . . . . . . . . . . . . . . . . . . . . . . . . . . . . . . . 237The DebugView Display . . . . . . . . . . . . . . . . . . . . . . . . . . . . . . . . . . . . . . 238Capturing User-Mode Debug Output . . . . . . . . . . . . . . . . . . . . . . . . . . 240Capturing Kernel-Mode Debug Output . . . . . . . . . . . . . . . . . . . . . . . . 241Searching, Filtering, and Highlighting Output . . . . . . . . . . . . . . . . . . . 242Saving, Logging, and Printing . . . . . . . . . . . . . . . . . . . . . . . . . . . . . . . . . 245Remote Monitoring . . . . . . . . . . . . . . . . . . . . . . . . . . . . . . . . . . . . . . . . . 247
LiveKd . . . . . . . . . . . . . . . . . . . . . . . . . . . . . . . . . . . . . . . . . . . . . . . . . . . . . . . . . . 249LiveKd Requirements . . . . . . . . . . . . . . . . . . . . . . . . . . . . . . . . . . . . . . . . 250Running LiveKd . . . . . . . . . . . . . . . . . . . . . . . . . . . . . . . . . . . . . . . . . . . . . 250LiveKd Examples . . . . . . . . . . . . . . . . . . . . . . . . . . . . . . . . . . . . . . . . . . . . 251
ListDLLs . . . . . . . . . . . . . . . . . . . . . . . . . . . . . . . . . . . . . . . . . . . . . . . . . . . . . . . . . 253Handle . . . . . . . . . . . . . . . . . . . . . . . . . . . . . . . . . . . . . . . . . . . . . . . . . . . . . . . . . . 256
Handle List and Search . . . . . . . . . . . . . . . . . . . . . . . . . . . . . . . . . . . . . . . 256Handle Counts . . . . . . . . . . . . . . . . . . . . . . . . . . . . . . . . . . . . . . . . . . . . . . 259Closing Handles . . . . . . . . . . . . . . . . . . . . . . . . . . . . . . . . . . . . . . . . . . . . . 260
8 Security Utilities . . . . . . . . . . . . . . . . . . . . . . . . . . . . . . . . . . . . . . . 261SigCheck . . . . . . . . . . . . . . . . . . . . . . . . . . . . . . . . . . . . . . . . . . . . . . . . . . . . . . . . 261
Signature Verification . . . . . . . . . . . . . . . . . . . . . . . . . . . . . . . . . . . . . . . . 263Which Files to Scan . . . . . . . . . . . . . . . . . . . . . . . . . . . . . . . . . . . . . . . . . . 264Additional File Information . . . . . . . . . . . . . . . . . . . . . . . . . . . . . . . . . . . 265Output Format . . . . . . . . . . . . . . . . . . . . . . . . . . . . . . . . . . . . . . . . . . . . . . 267
AccessChk . . . . . . . . . . . . . . . . . . . . . . . . . . . . . . . . . . . . . . . . . . . . . . . . . . . . . . . 267What Are “Effective Permissions”? . . . . . . . . . . . . . . . . . . . . . . . . . . . . . 267Using AccessChk . . . . . . . . . . . . . . . . . . . . . . . . . . . . . . . . . . . . . . . . . . . . 268
xiv Table of Contents
Object Type . . . . . . . . . . . . . . . . . . . . . . . . . . . . . . . . . . . . . . . . . . . . . . . . 270Searching for Access Rights . . . . . . . . . . . . . . . . . . . . . . . . . . . . . . . . . . . 272Output Options . . . . . . . . . . . . . . . . . . . . . . . . . . . . . . . . . . . . . . . . . . . . . 273
AccessEnum . . . . . . . . . . . . . . . . . . . . . . . . . . . . . . . . . . . . . . . . . . . . . . . . . . . . . 275ShareEnum . . . . . . . . . . . . . . . . . . . . . . . . . . . . . . . . . . . . . . . . . . . . . . . . . . . . . . 277ShellRunAs . . . . . . . . . . . . . . . . . . . . . . . . . . . . . . . . . . . . . . . . . . . . . . . . . . . . . . 278Autologon . . . . . . . . . . . . . . . . . . . . . . . . . . . . . . . . . . . . . . . . . . . . . . . . . . . . . . 280LogonSessions . . . . . . . . . . . . . . . . . . . . . . . . . . . . . . . . . . . . . . . . . . . . . . . . . . . 280SDelete . . . . . . . . . . . . . . . . . . . . . . . . . . . . . . . . . . . . . . . . . . . . . . . . . . . . . . . . . 283
Using SDelete . . . . . . . . . . . . . . . . . . . . . . . . . . . . . . . . . . . . . . . . . . . . . . 284How SDelete Works . . . . . . . . . . . . . . . . . . . . . . . . . . . . . . . . . . . . . . . . . 285
9 Active Directory Utilities . . . . . . . . . . . . . . . . . . . . . . . . . . . . . . . . 287AdExplorer . . . . . . . . . . . . . . . . . . . . . . . . . . . . . . . . . . . . . . . . . . . . . . . . . . . . . . 287
Connecting to a Domain . . . . . . . . . . . . . . . . . . . . . . . . . . . . . . . . . . . . . 287The AdExplorer Display . . . . . . . . . . . . . . . . . . . . . . . . . . . . . . . . . . . . . . 288Objects . . . . . . . . . . . . . . . . . . . . . . . . . . . . . . . . . . . . . . . . . . . . . . . . . . . . 290Attributes . . . . . . . . . . . . . . . . . . . . . . . . . . . . . . . . . . . . . . . . . . . . . . . . . . 291Searching . . . . . . . . . . . . . . . . . . . . . . . . . . . . . . . . . . . . . . . . . . . . . . . . . . 293Snapshots . . . . . . . . . . . . . . . . . . . . . . . . . . . . . . . . . . . . . . . . . . . . . . . . . . 294AdExplorer Configuration . . . . . . . . . . . . . . . . . . . . . . . . . . . . . . . . . . . . 296
AdInsight . . . . . . . . . . . . . . . . . . . . . . . . . . . . . . . . . . . . . . . . . . . . . . . . . . . . . . . 296AdInsight Data Capture . . . . . . . . . . . . . . . . . . . . . . . . . . . . . . . . . . . . . . 297Display Options . . . . . . . . . . . . . . . . . . . . . . . . . . . . . . . . . . . . . . . . . . . . . 300Finding Information of Interest . . . . . . . . . . . . . . . . . . . . . . . . . . . . . . . 301Filtering Results . . . . . . . . . . . . . . . . . . . . . . . . . . . . . . . . . . . . . . . . . . . . . 303Saving and Exporting AdInsight Data . . . . . . . . . . . . . . . . . . . . . . . . . . 305Command-Line Options . . . . . . . . . . . . . . . . . . . . . . . . . . . . . . . . . . . . . . 306
AdRestore . . . . . . . . . . . . . . . . . . . . . . . . . . . . . . . . . . . . . . . . . . . . . . . . . . . . . . . 306
10 Desktop Utilities . . . . . . . . . . . . . . . . . . . . . . . . . . . . . . . . . . . . . . . 309BgInfo . . . . . . . . . . . . . . . . . . . . . . . . . . . . . . . . . . . . . . . . . . . . . . . . . . . . . . . . . . 309
Configuring Data to Display . . . . . . . . . . . . . . . . . . . . . . . . . . . . . . . . . . 310Appearance Options . . . . . . . . . . . . . . . . . . . . . . . . . . . . . . . . . . . . . . . . . 313Saving BgInfo Configuration for Later Use . . . . . . . . . . . . . . . . . . . . . . 315Other Output Options . . . . . . . . . . . . . . . . . . . . . . . . . . . . . . . . . . . . . . . 315Updating Other Desktops . . . . . . . . . . . . . . . . . . . . . . . . . . . . . . . . . . . . 317
Desktops . . . . . . . . . . . . . . . . . . . . . . . . . . . . . . . . . . . . . . . . . . . . . . . . . . . . . . . . 318
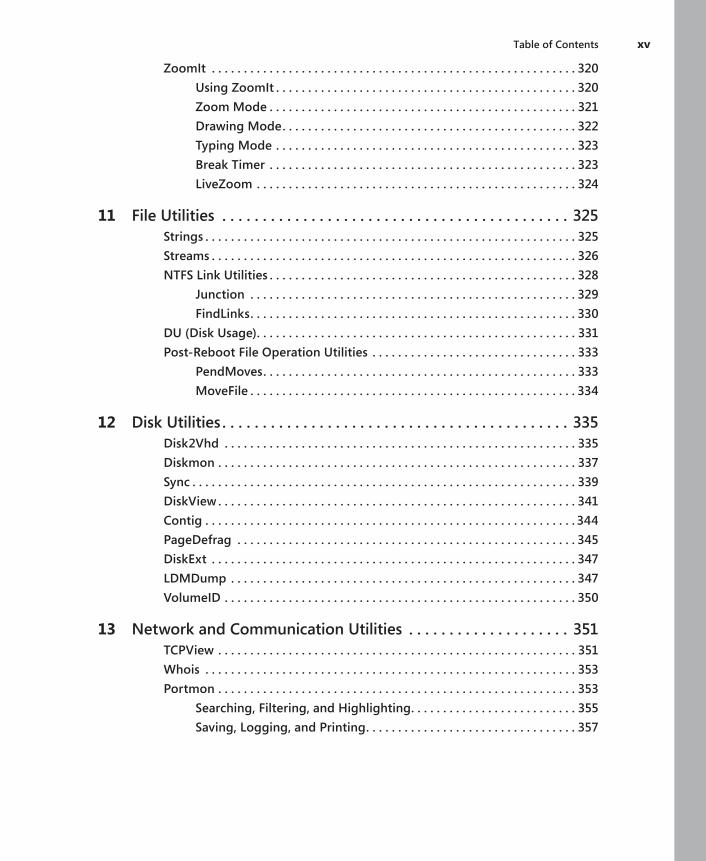
Table of Contents xv
ZoomIt . . . . . . . . . . . . . . . . . . . . . . . . . . . . . . . . . . . . . . . . . . . . . . . . . . . . . . . . . 320Using ZoomIt . . . . . . . . . . . . . . . . . . . . . . . . . . . . . . . . . . . . . . . . . . . . . . . 320Zoom Mode . . . . . . . . . . . . . . . . . . . . . . . . . . . . . . . . . . . . . . . . . . . . . . . . 321Drawing Mode . . . . . . . . . . . . . . . . . . . . . . . . . . . . . . . . . . . . . . . . . . . . . . 322Typing Mode . . . . . . . . . . . . . . . . . . . . . . . . . . . . . . . . . . . . . . . . . . . . . . . 323Break Timer . . . . . . . . . . . . . . . . . . . . . . . . . . . . . . . . . . . . . . . . . . . . . . . . 323LiveZoom . . . . . . . . . . . . . . . . . . . . . . . . . . . . . . . . . . . . . . . . . . . . . . . . . . 324
11 File Utilities . . . . . . . . . . . . . . . . . . . . . . . . . . . . . . . . . . . . . . . . . . . 325Strings . . . . . . . . . . . . . . . . . . . . . . . . . . . . . . . . . . . . . . . . . . . . . . . . . . . . . . . . . . 325Streams . . . . . . . . . . . . . . . . . . . . . . . . . . . . . . . . . . . . . . . . . . . . . . . . . . . . . . . . . 326NTFS Link Utilities . . . . . . . . . . . . . . . . . . . . . . . . . . . . . . . . . . . . . . . . . . . . . . . . 328
Junction . . . . . . . . . . . . . . . . . . . . . . . . . . . . . . . . . . . . . . . . . . . . . . . . . . . 329FindLinks . . . . . . . . . . . . . . . . . . . . . . . . . . . . . . . . . . . . . . . . . . . . . . . . . . . 330
DU (Disk Usage) . . . . . . . . . . . . . . . . . . . . . . . . . . . . . . . . . . . . . . . . . . . . . . . . . . 331Post-Reboot File Operation Utilities . . . . . . . . . . . . . . . . . . . . . . . . . . . . . . . . 333
PendMoves . . . . . . . . . . . . . . . . . . . . . . . . . . . . . . . . . . . . . . . . . . . . . . . . . 333MoveFile . . . . . . . . . . . . . . . . . . . . . . . . . . . . . . . . . . . . . . . . . . . . . . . . . . . 334
12 Disk Utilities . . . . . . . . . . . . . . . . . . . . . . . . . . . . . . . . . . . . . . . . . . . 335Disk2Vhd . . . . . . . . . . . . . . . . . . . . . . . . . . . . . . . . . . . . . . . . . . . . . . . . . . . . . . . 335Diskmon . . . . . . . . . . . . . . . . . . . . . . . . . . . . . . . . . . . . . . . . . . . . . . . . . . . . . . . . 337Sync . . . . . . . . . . . . . . . . . . . . . . . . . . . . . . . . . . . . . . . . . . . . . . . . . . . . . . . . . . . . 339DiskView . . . . . . . . . . . . . . . . . . . . . . . . . . . . . . . . . . . . . . . . . . . . . . . . . . . . . . . . 341Contig . . . . . . . . . . . . . . . . . . . . . . . . . . . . . . . . . . . . . . . . . . . . . . . . . . . . . . . . . . 344PageDefrag . . . . . . . . . . . . . . . . . . . . . . . . . . . . . . . . . . . . . . . . . . . . . . . . . . . . . 345DiskExt . . . . . . . . . . . . . . . . . . . . . . . . . . . . . . . . . . . . . . . . . . . . . . . . . . . . . . . . . 347LDMDump . . . . . . . . . . . . . . . . . . . . . . . . . . . . . . . . . . . . . . . . . . . . . . . . . . . . . . 347VolumeID . . . . . . . . . . . . . . . . . . . . . . . . . . . . . . . . . . . . . . . . . . . . . . . . . . . . . . . 350
13 Network and Communication Utilities . . . . . . . . . . . . . . . . . . . . 351TCPView . . . . . . . . . . . . . . . . . . . . . . . . . . . . . . . . . . . . . . . . . . . . . . . . . . . . . . . . 351Whois . . . . . . . . . . . . . . . . . . . . . . . . . . . . . . . . . . . . . . . . . . . . . . . . . . . . . . . . . . 353Portmon . . . . . . . . . . . . . . . . . . . . . . . . . . . . . . . . . . . . . . . . . . . . . . . . . . . . . . . . 353
Searching, Filtering, and Highlighting . . . . . . . . . . . . . . . . . . . . . . . . . . 355Saving, Logging, and Printing . . . . . . . . . . . . . . . . . . . . . . . . . . . . . . . . . 357
xvi Table of Contents
14 System Information Utilities . . . . . . . . . . . . . . . . . . . . . . . . . . . . . 359RAMMap . . . . . . . . . . . . . . . . . . . . . . . . . . . . . . . . . . . . . . . . . . . . . . . . . . . . . . . . 359
Use Counts . . . . . . . . . . . . . . . . . . . . . . . . . . . . . . . . . . . . . . . . . . . . . . . . . 360Processes . . . . . . . . . . . . . . . . . . . . . . . . . . . . . . . . . . . . . . . . . . . . . . . . . . 362Priority Summary . . . . . . . . . . . . . . . . . . . . . . . . . . . . . . . . . . . . . . . . . . . 363Physical Pages . . . . . . . . . . . . . . . . . . . . . . . . . . . . . . . . . . . . . . . . . . . . . . 363Physical Ranges . . . . . . . . . . . . . . . . . . . . . . . . . . . . . . . . . . . . . . . . . . . . . 364File Summary . . . . . . . . . . . . . . . . . . . . . . . . . . . . . . . . . . . . . . . . . . . . . . . 365File Details . . . . . . . . . . . . . . . . . . . . . . . . . . . . . . . . . . . . . . . . . . . . . . . . . 366Purging Physical Memory . . . . . . . . . . . . . . . . . . . . . . . . . . . . . . . . . . . . 367Saving and Loading Snapshots . . . . . . . . . . . . . . . . . . . . . . . . . . . . . . . . 367
CoreInfo . . . . . . . . . . . . . . . . . . . . . . . . . . . . . . . . . . . . . . . . . . . . . . . . . . . . . . . . 367ProcFeatures . . . . . . . . . . . . . . . . . . . . . . . . . . . . . . . . . . . . . . . . . . . . . . . . . . . . 369WinObj . . . . . . . . . . . . . . . . . . . . . . . . . . . . . . . . . . . . . . . . . . . . . . . . . . . . . . . . . 370LoadOrder . . . . . . . . . . . . . . . . . . . . . . . . . . . . . . . . . . . . . . . . . . . . . . . . . . . . . . 373PipeList . . . . . . . . . . . . . . . . . . . . . . . . . . . . . . . . . . . . . . . . . . . . . . . . . . . . . . . . . 374ClockRes . . . . . . . . . . . . . . . . . . . . . . . . . . . . . . . . . . . . . . . . . . . . . . . . . . . . . . . . 375
15 Miscellaneous Utilities . . . . . . . . . . . . . . . . . . . . . . . . . . . . . . . . . . 377RegJump . . . . . . . . . . . . . . . . . . . . . . . . . . . . . . . . . . . . . . . . . . . . . . . . . . . . . . . . 377Hex2Dec . . . . . . . . . . . . . . . . . . . . . . . . . . . . . . . . . . . . . . . . . . . . . . . . . . . . . . . . 378RegDelNull . . . . . . . . . . . . . . . . . . . . . . . . . . . . . . . . . . . . . . . . . . . . . . . . . . . . . . 378Bluescreen Screen Saver . . . . . . . . . . . . . . . . . . . . . . . . . . . . . . . . . . . . . . . . . . 379Ctrl2Cap . . . . . . . . . . . . . . . . . . . . . . . . . . . . . . . . . . . . . . . . . . . . . . . . . . . . . . . . 380
Part III Troubleshooting—”TheCaseoftheUnexplained...” 16 Error Messages . . . . . . . . . . . . . . . . . . . . . . . . . . . . . . . . . . . . . . . . 383
The Case of the Locked Folder . . . . . . . . . . . . . . . . . . . . . . . . . . . . . . . . . . . . . 383The Case of the Failed AV Update . . . . . . . . . . . . . . . . . . . . . . . . . . . . . . . . . . 385The Case of the Failed Lotus Notes Backups . . . . . . . . . . . . . . . . . . . . . . . . . 387The Case of the Failed Play-To . . . . . . . . . . . . . . . . . . . . . . . . . . . . . . . . . . . . . 389The Case of the Crashing Proksi Utility . . . . . . . . . . . . . . . . . . . . . . . . . . . . . . 390The Case of the Installation Failure . . . . . . . . . . . . . . . . . . . . . . . . . . . . . . . . . 391
The Troubleshooting . . . . . . . . . . . . . . . . . . . . . . . . . . . . . . . . . . . . . . . . 392The Analysis . . . . . . . . . . . . . . . . . . . . . . . . . . . . . . . . . . . . . . . . . . . . . . . . 394
The Case of the Missing Folder Association . . . . . . . . . . . . . . . . . . . . . . . . . . 397The Case of the Temporary Registry Profiles . . . . . . . . . . . . . . . . . . . . . . . . . 400
Table of Contents xvii
17 Hangs and Sluggish Performance . . . . . . . . . . . . . . . . . . . . . . . . 405The Case of the IExplore-Pegged CPU . . . . . . . . . . . . . . . . . . . . . . . . . . . . . . 405The Case of the Excessive ReadyBoost . . . . . . . . . . . . . . . . . . . . . . . . . . . . . . 408The Case of the Slow Keynote Demo . . . . . . . . . . . . . . . . . . . . . . . . . . . . . . . . 410The Case of the Slow Project File Opens . . . . . . . . . . . . . . . . . . . . . . . . . . . . . 415The Compound Case of the Outlook Hangs . . . . . . . . . . . . . . . . . . . . . . . . . . 420
18 Malware . . . . . . . . . . . . . . . . . . . . . . . . . . . . . . . . . . . . . . . . . . . . . . 427The Case of the Sysinternals-Blocking Malware . . . . . . . . . . . . . . . . . . . . . . 427The Case of the Process-Killing Malware . . . . . . . . . . . . . . . . . . . . . . . . . . . . 429The Case of the Fake System Component . . . . . . . . . . . . . . . . . . . . . . . . . . . . 431The Case of the Mysterious ASEP . . . . . . . . . . . . . . . . . . . . . . . . . . . . . . . . . . . 433
Index . . . . . . . . . . . . . . . . . . . . . . . . . . . . . . . . . . . . . . . . . . . . . . . . . . . . . . . . . . . . 437
Microsoft is interested in hearing your feedback so we can continually improve our books and learning resources for you. To participate in a brief online survey, please visit:
www.microsoft.com/learning/booksurvey/
What do you think of this book? We want to hear from you!
211
Chapter 7
Process and Diagnostic UtilitiesProcess Explorer and Process Monitor, discussed in Chapters 3 and 4, respectively, are the primary utilities for analyzing the runtime behavior and dynamic state of processes and of the system as a whole. This chapter describes six additional Sysinternals utilities for viewing details of process state:
■ VMMap is a GUI utility that displays details of a process’ virtual and physical memory usage.
■ ProcDump is a console utility that can generate a memory dump for a process when it meets specifiable criteria, such as exhibiting a CPU spike or having an unresponsive window.
■ DebugView is a GUI utility that lets you monitor user-mode and kernel-mode debug output generated from either the local computer or a remote computer.
■ LiveKd lets you run a standard kernel debugger on a snapshot of the running local system without having to reboot into debug mode.
■ ListDLLs is a console utility that displays information about DLLs loaded on the system.
■ Handle is a console utility that displays information about object handles held by processes on the system.
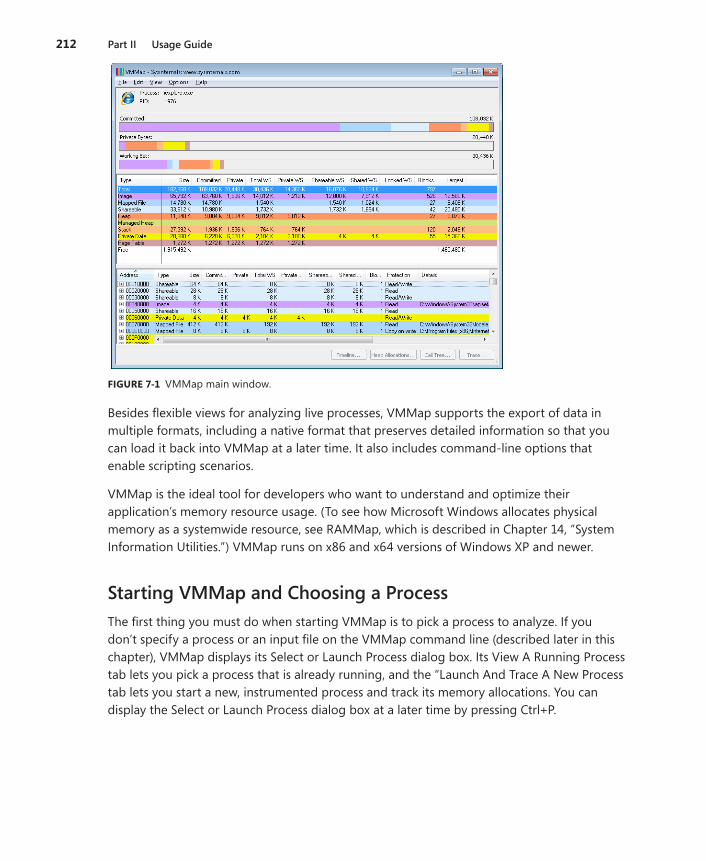
VMMapVMMap (shown in Figure 7-1) is a process virtual and physical memory analysis utility. It shows graphical and tabular summaries of the different types of memory allocated by a process, as well as detailed maps of the specific virtual memory allocations, showing char-acteristics such as backing files and types of protection. VMMap also shows summary and detailed information about the amount of physical memory (working set) assigned by the operating system for the different virtual memory blocks.
VMMap can capture multiple snapshots of the process’ memory allocation state, graphically display allocations over time, and show exactly what changed between any two points in time. Combined with VMMap’s filtering and refresh options, this allows you to identify the sources of process memory usage and the memory cost of application features.
VMMap can also instrument a process to track its individual memory allocations and show the code paths and call stacks where those allocations are made. With full symbolic information, VMMap can display the line of source code responsible for any memory allocation.
212 Part II Usage Guide
FIGURE7-1 VMMap main window.
Besides flexible views for analyzing live processes, VMMap supports the export of data in multiple formats, including a native format that preserves detailed information so that you can load it back into VMMap at a later time. It also includes command-line options that enable scripting scenarios.
VMMap is the ideal tool for developers who want to understand and optimize their application’s memory resource usage. (To see how Microsoft Windows allocates physical memory as a systemwide resource, see RAMMap, which is described in Chapter 14, “System Information Utilities.”) VMMap runs on x86 and x64 versions of Windows XP and newer.
Starting VMMap and Choosing a ProcessThe first thing you must do when starting VMMap is to pick a process to analyze. If you don’t specify a process or an input file on the VMMap command line (described later in this chapter), VMMap displays its Select or Launch Process dialog box. Its View A Running Process tab lets you pick a process that is already running, and the “Launch And Trace A New Process tab lets you start a new, instrumented process and track its memory allocations. You can display the Select or Launch Process dialog box at a later time by pressing Ctrl+P.
Chapter 7 Process and Diagnostic Utilities 213
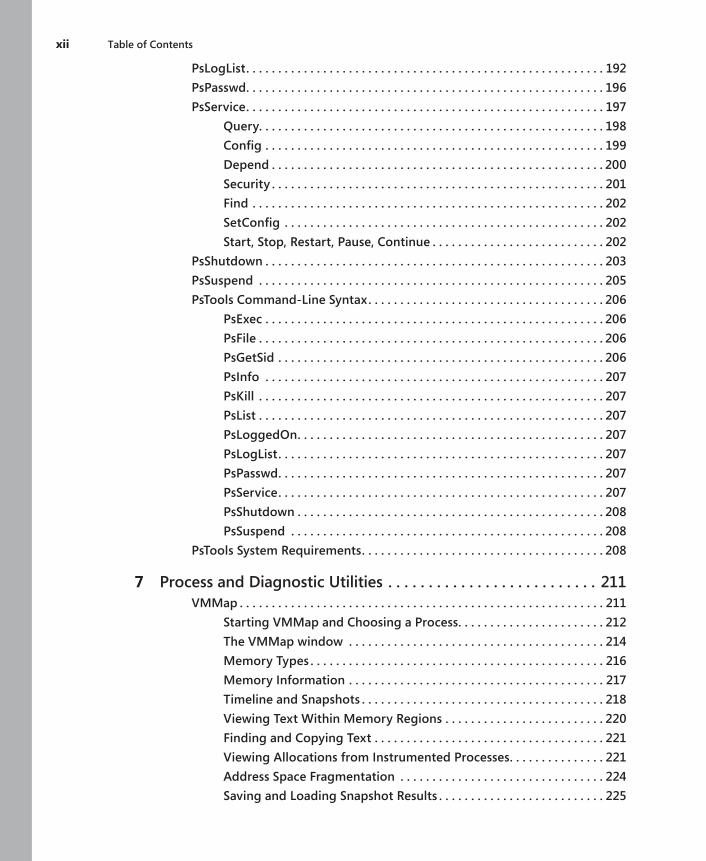
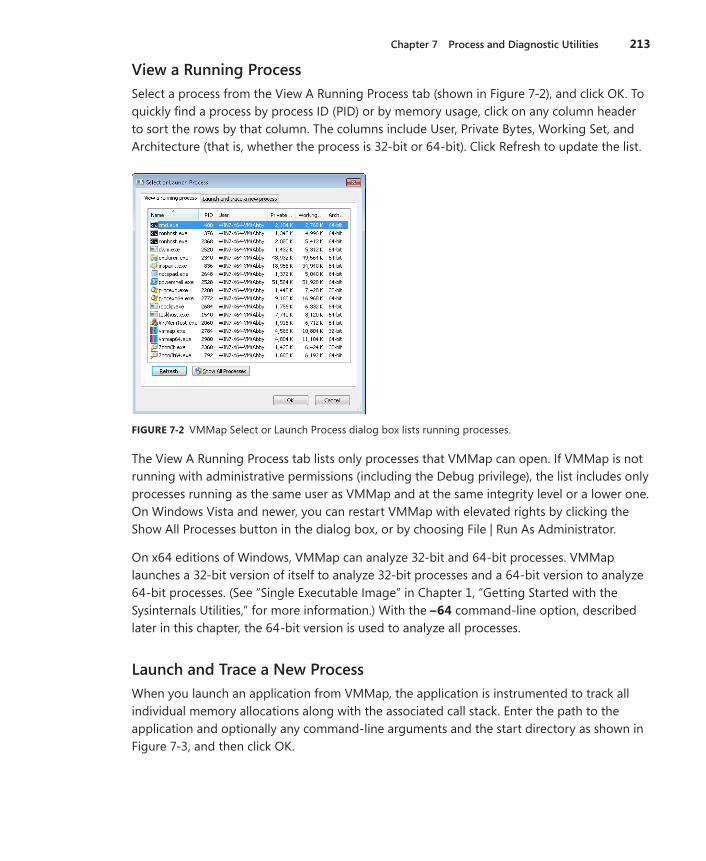
View a Running ProcessSelect a process from the View A Running Process tab (shown in Figure 7-2), and click OK. To quickly find a process by process ID (PID) or by memory usage, click on any column header to sort the rows by that column. The columns include User, Private Bytes, Working Set, and Architecture (that is, whether the process is 32-bit or 64-bit). Click Refresh to update the list.
FIGURE7-2 VMMap Select or Launch Process dialog box lists running processes.
The View A Running Process tab lists only processes that VMMap can open. If VMMap is not running with administrative permissions (including the Debug privilege), the list includes only processes running as the same user as VMMap and at the same integrity level or a lower one. On Windows Vista and newer, you can restart VMMap with elevated rights by clicking the Show All Processes button in the dialog box, or by choosing File | Run As Administrator.
On x64 editions of Windows, VMMap can analyze 32-bit and 64-bit processes. VMMap launches a 32-bit version of itself to analyze 32-bit processes and a 64-bit version to analyze 64-bit processes. (See “Single Executable Image” in Chapter 1, “Getting Started with the Sysinternals Utilities,” for more information.) With the –64 command-line option, described later in this chapter, the 64-bit version is used to analyze all processes.
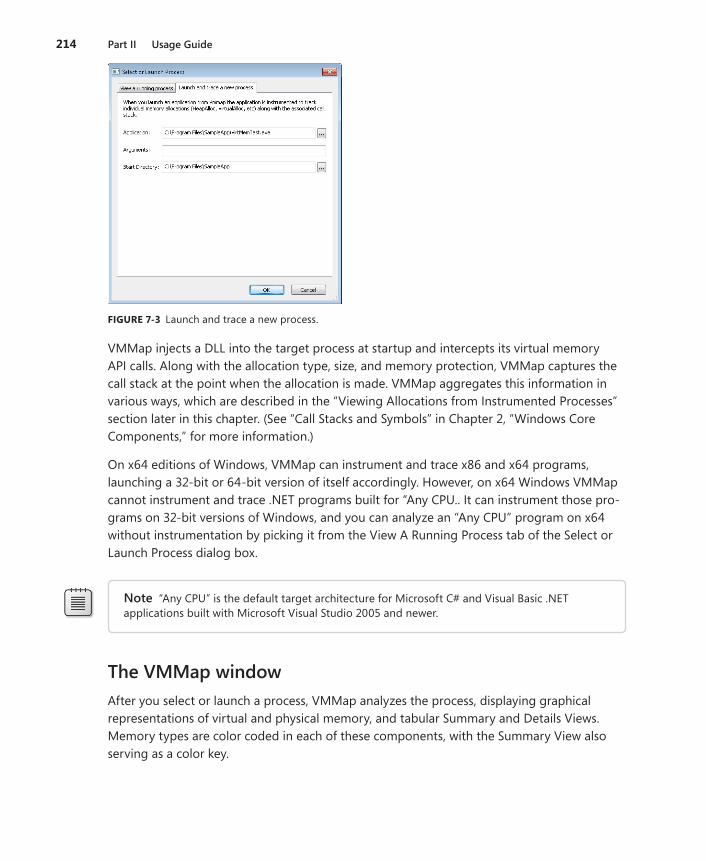
Launch and Trace a New ProcessWhen you launch an application from VMMap, the application is instrumented to track all individual memory allocations along with the associated call stack. Enter the path to the application and optionally any command-line arguments and the start directory as shown in Figure 7-3, and then click OK.
214 Part II Usage Guide
FIGURE7-3 Launch and trace a new process.
VMMap injects a DLL into the target process at startup and intercepts its virtual memory API calls. Along with the allocation type, size, and memory protection, VMMap captures the call stack at the point when the allocation is made. VMMap aggregates this information in various ways, which are described in the “Viewing Allocations from Instrumented Processes” section later in this chapter. (See “Call Stacks and Symbols” in Chapter 2, “Windows Core Components,” for more information.)
On x64 editions of Windows, VMMap can instrument and trace x86 and x64 programs, launching a 32-bit or 64-bit version of itself accordingly. However, on x64 Windows VMMap cannot instrument and trace .NET programs built for “Any CPU.. It can instrument those pro-grams on 32-bit versions of Windows, and you can analyze an “Any CPU” program on x64 without instrumentation by picking it from the View A Running Process tab of the Select or Launch Process dialog box.
Note “Any CPU” is the default target architecture for Microsoft C# and Visual Basic .NET applications built with Microsoft Visual Studio 2005 and newer.
The VMMap windowAfter you select or launch a process, VMMap analyzes the process, displaying graphical representations of virtual and physical memory, and tabular Summary and Details Views. Memory types are color coded in each of these components, with the Summary View also serving as a color key.

Chapter 7 Process and Diagnostic Utilities 215
The first bar graph in the VMMap window (shown in Figure 7-1) is the Committed summary. Its differently-colored areas show the relative proportions of the different types of committed memory within the process’ address space. It also serves as the basis against which the other two graphs are scaled. The total figure shown above the right edge of the graph is not all allocated memory, but the process’ “accessible” memory. Regions that have only been reserved cannot yet be accessed and are not included in this graph. In other words, the memory included here is backed by RAM, a paging file, or a mapped file.
The second bar graph in the VMMap window is the Private Bytes summary. This is process memory not shareable with other processes and that’s backed by physical RAM or by a paging file. It includes the stack, heaps, raw virtual memory, page tables, and read/write portions of image and file mappings. The label above the right side of the graph reports the total size of the process’ private memory. The colored areas in the bar graph show the proportions of the various types of memory allocations contributing to the private byte usage. The extent of the colored areas toward the graph’s right edge indicates its proportion to in-use virtual memory.
The third bar graph shows the working set for the process. The working set is the process’ virtual memory that is resident in physical RAM. Like the Private Bytes graph, the colored areas show the relative proportions of different types of allocations in RAM, and their extent toward the right indicates the proportion of the process’ committed virtual memory that is resident in RAM.
Note that these graphs show only the relative proportions of the different allocation types. They are not layout maps that show where in memory they are allocated. The Address Space Fragmentation dialog box, described later in this chapter, provides such a map for 32-bit processes.
Below the three graphs, the Summary View table lists the different types of memory allocations (described in the “Memory Types” section in this chapter), the total amount of each type of allocation, how much is committed, and how much is in physical RAM. Select a memory type in Summary View to filter what is shown in the Details View window. You can sort the Summary View table by the values in any column by clicking the corresponding column header. Clicking a column header again reverses the sort order for that column. The order of the colored areas in the VMMap bar graphs follows the sort order of the Summary View table. You can also change the column order for this table by dragging a column header to a new position, and resize column widths by dragging the borders between the column headers.
Below Summary View, Details View displays information about each memory region of the process’ user-mode virtual address space. To show only one allocation type in Details View, select that type in the Summary View. To view all memory allocations, select the Total row in the Summary View. As with the Summary View, the columns in Details View allow sorting, resizing and reordering.
216 Part II Usage Guide
Allocations shown in Details View can expand to show sub-blocks within the original allocation. This can occur, for example, when a large block of memory is reserved, and then parts of it are committed. It also occurs when the image loader or an application creates a file mapping and then creates multiple mapped views of that file mapping; for example, to set protection differently on the different regions of the file mapping. You can expand or collapse individual groups of sub-allocations by clicking the plus (+) and minus (–) icons in Details View. You can also expand or collapse all of them by choosing Expand All or Collapse All from the Options menu. The top row of such a group shows the sums of the individual components within it. When a different sort order is selected for Details View, sub-blocks remain with their top-level rows and are sorted within that group.
If VMMap’s default font is not to your liking, choose Options | Font to select a different font for Summary View, Details View, and some of VMMap’s dialog boxes.
Memory TypesVMMap categorizes memory allocations into one of several types:
■ Image The memory represents an executable file, such as an EXE or DLL, that has been loaded into a process by the image loader. Note that Image memory does not include executable files loaded as data files—these are included in the Mapped File memory type. Executable code regions are typically read/execute-only and shareable. Data regions, such as initialized data, are typically read/write or copy-on-write. When copy-on-write pages are modified, additional private memory is created in the process and is marked as read/write. This private memory is backed by RAM or a paging file and not by the image file. The Details column in Details View shows the file’s path or section name.
■ Mapped File The memory is shareable and represents a file on disk. Mapped files are often resource DLLs and typically contain application data. The Details column shows the file's path.
■ Shareable Shareable memory is memory that can be shared with other processes and is backed by RAM or by the paging file (if present). Shareable memory typically contains data shared between processes through DLL shared sections or through pagefile-backed, file-mapping objects (also known as pagefile-backed sections).
■ Heap A heap represents private memory allocated and managed by the user-mode heap manager and typically contains application data. Application memory allocations that use Heap memory include the C runtime malloc library, the C++ new operator, the Windows Heap APIs, and the legacy GlobalAlloc and LocalAlloc APIs.
■ Managed Heap Managed Heap represents private memory that is allocated and managed by the .NET runtime and typically contains application data.
Chapter 7 Process and Diagnostic Utilities 217
■ Stack Stack memory is allocated to each thread in a process to store function parameters, local variables, and invocation records. Typically, a fixed amount of Stack memory is allocated and reserved when a thread is created, but only a relatively small amount is committed. The amount of memory committed within that allocation will grow as needed, but it will not shrink. Stack memory is freed when its thread exits.
■ Private Data Private Data memory is memory that is allocated by VirtualAlloc and that is not further handled by the Heap Manager or the .NET runtime, or assigned to the Stack category. Private Data memory typically contains application data, as well as the Process and Thread Environment Blocks. Private Data memory cannot be shared with other processes.
Note VMMap’s definition of “Private Data” is more granular than that of Process Explorer’s “private bytes.” Procexp’s “private bytes” includes all private committed memory belonging to the process.
■ Page Table Page Table memory is private kernel-mode memory associated with the process’ page tables. Note that Page Table memory is never displayed in VMMap’s Details View, which shows only user-mode memory.
■ Free Free memory regions are spaces in the process’ virtual address space that are not allocated. To include free memory regions in Details View when inspecting a process’ total memory map, choose Options | Show Free Regions.
Memory InformationSummary View and Details View show the following information for allocation types and in-dividual allocations. To reduce noise in the output, VMMap does not show entries that have a value of 0.
■ Size The total size of the allocated type or region. This includes areas that have been reserved but not committed.
■ Committed The amount of the allocation that is committed—that is, backed by RAM, a paging file, or a mapped file.
■ Private The amount of the allocation that is private to the process.
■ Total WS The total amount of working set (physical memory) assigned to the type or region.
■ Private WS The amount of working set assigned to the type or region that cannot be shared with other processes.
■ Shareable WS The amount of working set assigned to the type or region that can be shared with other processes.
218 Part II Usage Guide
■ Shared WS The amount of Shareable WS that is currently shared with other processes.
■ Locked WS The amount of memory that has been guaranteed to remain in physical memory and not incur a page fault when accessed.
■ Blocks The number of individually allocated memory regions.
■ Largest In Summary View, the size of the largest contiguous memory block for that allocation type.
■ Address In Details View, the base address of the memory region in the process’ virtual address space.
■ Protection In Details View, identifies the types of operations that can be performed on the memory. In the case of top-level allocations that show expandable sub-blocks, Protection identifies a summary of the types of protection in the sub-blocks. An access violation occurs on an attempt to execute code from a region not marked Execute (if DEP is enabled), to write to a region not marked Write or Copy-on-Write, or to access memory that is marked as no-access or is only reserved but not yet committed.
■ Details In Details View, additional information about the memory region, such as the path to its backing file, Heap ID (for Heap memory), Thread ID (for Stack memory), or .NET AppDomain and Garbage Collection generations.
Note The VirtualProtect API can change the protection of any page to something different from that set by the original memory allocation. This means that there can potentially be pages of memory private to the process in a shareable memory region, for instance, because the region was created as a pagefile-backed section, but then the application or some other software changed the protection to copy-on-write and modified the pages.
Timeline and SnapshotsVMMap retains a history of snapshots of the target process’ memory allocation state. You can load any of these snapshots into the VMMap main view and compare any two snapshots to see what changed.
When tracing an instrumented process, VMMap captures snapshots automatically. You can set the automatic capture interval to 1, 2, 5, or 10 seconds from the Options | Trace Snapshot Interval submenu. You can pause and resume automatic snapshots by pressing Ctrl+Space, and manually capture a new snapshot at any time by pressing F5.
When you analyze a running process instead of launching an instrumented one, VMMap does not automatically capture snapshots. You must manually initiate each snapshot by pressing F5.
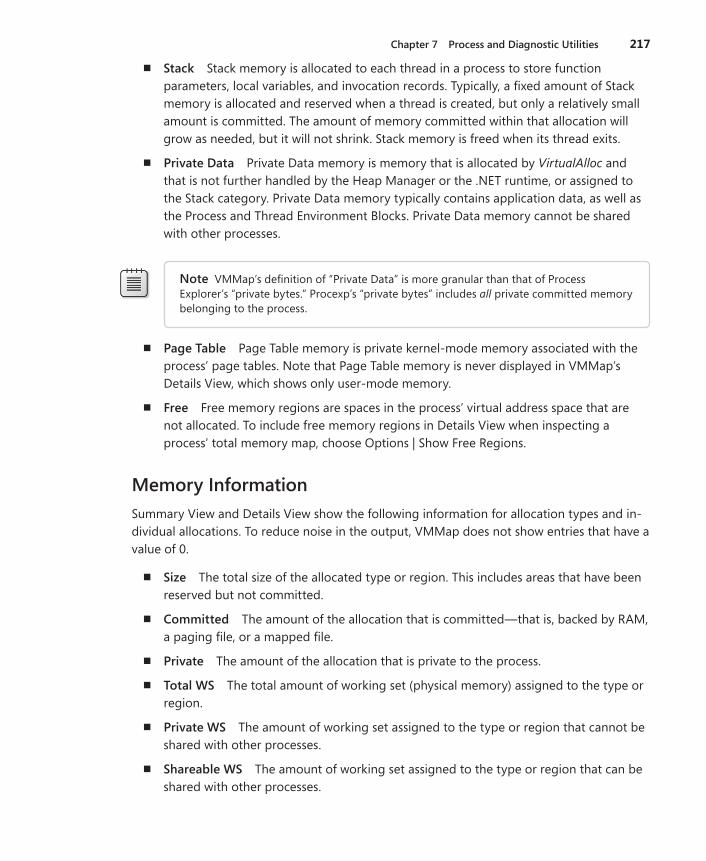
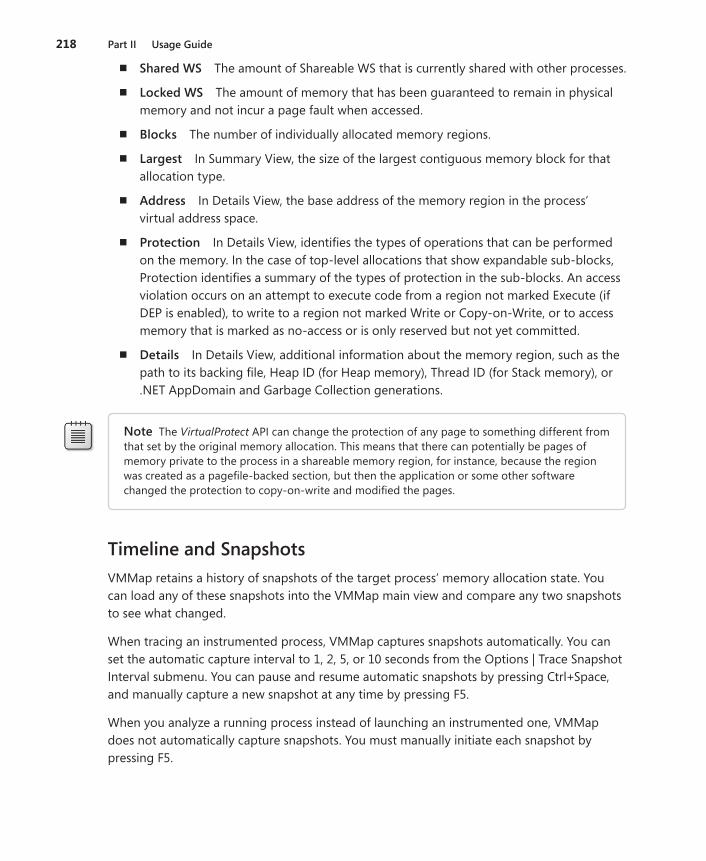
Chapter 7 Process and Diagnostic Utilities 219
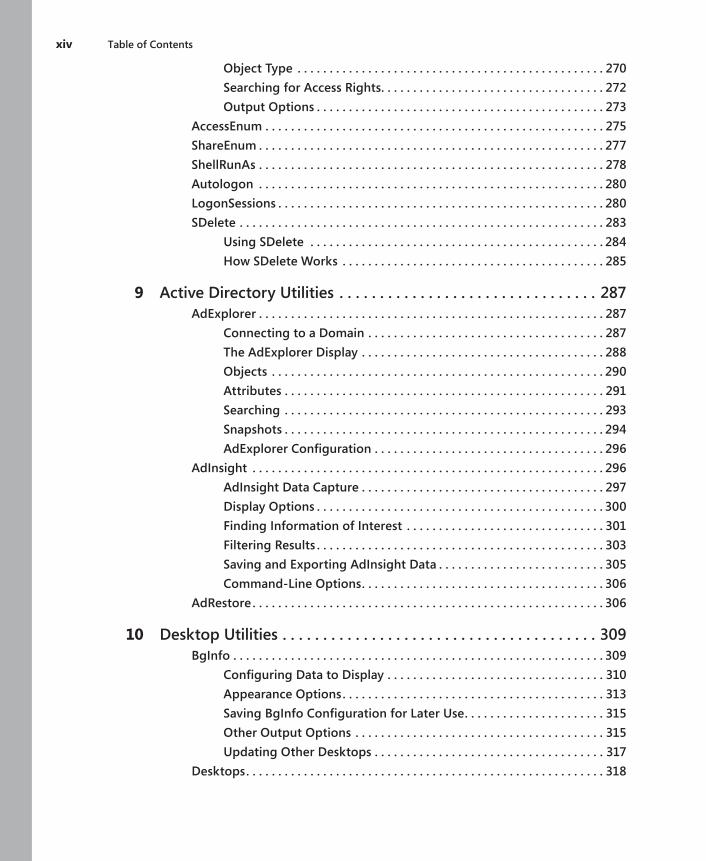
Click the Timeline button on the VMMap main view to display the Timeline dialog box (shown in Figure 7-4), which renders a graphical representation of the history of allocations in the process’ working set. The Timeline lets you load a previous snapshot into the VMMap main view and compare any two snapshots. The graph’s horizontal axis represents the num-ber of seconds since the initial snapshot, and its vertical access to the process’ working set. The colors in the graph correspond to the colors used to represent memory types in the VMMap main window.
FIGURE7-4 VMMap Timeline dialog box.
When automatic capture is enabled for an instrumented trace, the Timeline dialog box automatically updates its content. You can click the Pause button to suspend automatic snapshot capture; click it again to resume automatic captures. When viewing a process without instrumented tracing, the Timeline dialog box must be closed and reopened to update its content.
Click on any point within the timeline to load the corresponding snapshot into the VMMap main view. To compare any two snapshots, click on a point near one of the snapshots and then drag the mouse to the other point. While you have the mouse button down, the time-line displays vertical lines indicating when snapshots were captured and shades the area between the two selected points, as shown in Figure 7-5. To increase the granularity of the timeline to make it easier to select snapshots, click the plus (+) and minus (–) zoom buttons and move the horizontal scroll.
FIGURE7-5 VMMap Timeline dialog box while dragging between two snapshots.
220 Part II Usage Guide
When you compare two snapshots, the VMMap main view graphs and tables show the differences between the two snapshots. All displayed numbers show the positive or nega-tive changes since the previous snapshot. Address ranges in Details View that are in the new snapshot but not in the previous one are highlighted in green; address ranges that were only in the previous screen shot are highlighted in red. You might need to expand sub-allocations to view these. Rows in Details View that retain their normal color indicate a change in the amount of assigned working set. To view changes only for a specific allocation type, select that type in Summary View.
If you choose Empty Working Set from the View menu, VMMap first releases all physical memory assigned to the process and then captures a new snapshot. This feature is useful for measuring the memory cost of an application feature: empty the working set, exercise the feature, and then refresh the display to look at how much physical memory the application referenced.
To switch from comparison view to single-snapshot view, open the Timeline dialog box and click on any snapshot.
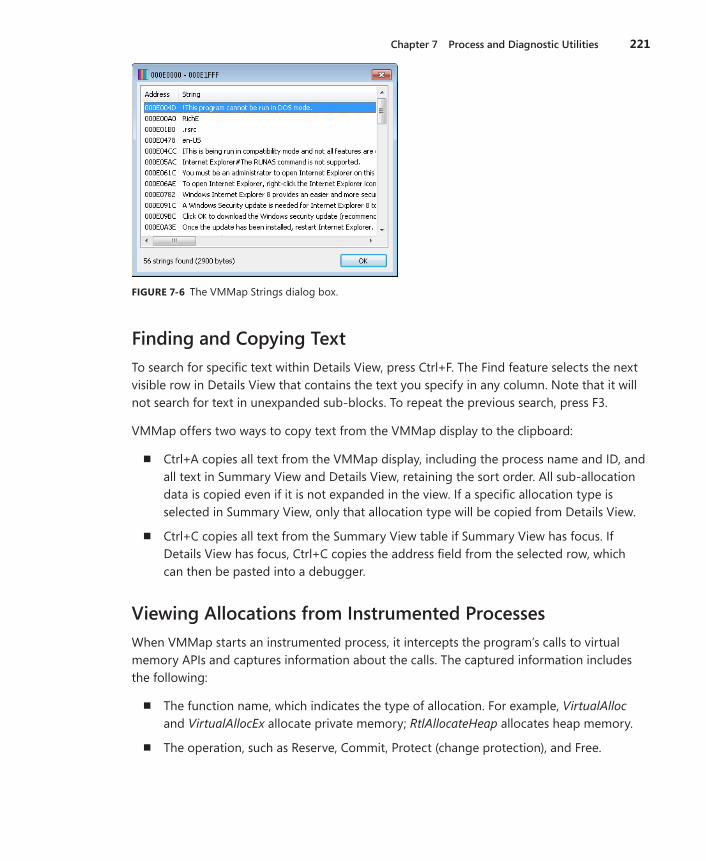
Viewing Text Within Memory RegionsIn some cases, the purpose of a memory region can be revealed by the string data stored within it. To view ASCII or Unicode strings of three or more characters in length, select a region in Details View and then choose View | Strings. VMMap displays a dialog box show-ing the virtual address range and the strings found within it, as shown in Figure 7-6. If the selected region has sub-blocks, the entire region is searched.
String data is not captured as part of a snapshot. The feature works only with a live process, and not with a saved VMMap (.mmp) file loaded from disk. Further, the strings are read directly from process memory when you invoke the Strings feature. That memory might have changed since the last snapshot was captured.
Note In computer programming, the term “string” refers to a data structure consisting of a sequence of characters, usually representing human-readable text.
Chapter 7 Process and Diagnostic Utilities 221
FIGURE7-6 The VMMap Strings dialog box.
Finding and Copying TextTo search for specific text within Details View, press Ctrl+F. The Find feature selects the next visible row in Details View that contains the text you specify in any column. Note that it will not search for text in unexpanded sub-blocks. To repeat the previous search, press F3.
VMMap offers two ways to copy text from the VMMap display to the clipboard:
■ Ctrl+A copies all text from the VMMap display, including the process name and ID, and all text in Summary View and Details View, retaining the sort order. All sub-allocation data is copied even if it is not expanded in the view. If a specific allocation type is selected in Summary View, only that allocation type will be copied from Details View.
■ Ctrl+C copies all text from the Summary View table if Summary View has focus. If Details View has focus, Ctrl+C copies the address field from the selected row, which can then be pasted into a debugger.
Viewing Allocations from Instrumented ProcessesWhen VMMap starts an instrumented process, it intercepts the program’s calls to virtual memory APIs and captures information about the calls. The captured information includes the following:
■ The function name, which indicates the type of allocation. For example, VirtualAlloc and VirtualAllocEx allocate private memory; RtlAllocateHeap allocates heap memory.
■ The operation, such as Reserve, Commit, Protect (change protection), and Free.
222 Part II Usage Guide
■ The memory protection type, such as Execute/Read and Read/Write.
■ The requested size, in bytes.
■ The virtual memory address at which the allocated block was created.
■ The call stack at the point when the API was invoked.
The call stack identifies the code path within the program that resulted in the allocation request. VMMap assigns a Call Site ID number to each unique call stack that is captured. The first call stack is assigned ID 1, the second unique stack is assigned ID 2, and so forth. If the same code path is executed multiple times, each instance will have the same call stack, and the data from those allocations are grouped together under a single Call Site ID.
Note Symbols must be properly configured to obtain useful information from instrumented processes. See “Call Stacks and Symbols” in Chapter 2 for information on configuring symbols.
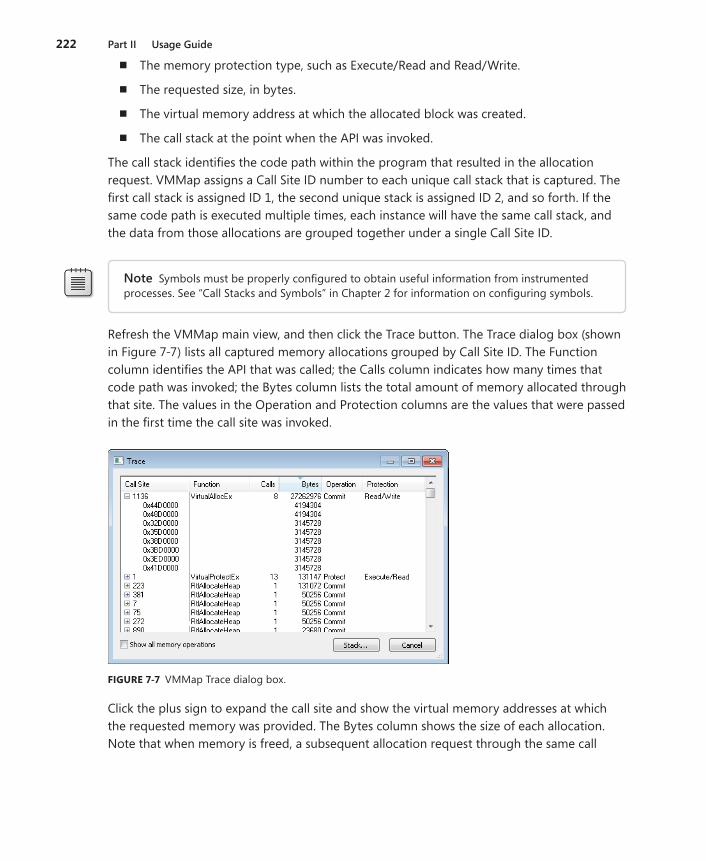
Refresh the VMMap main view, and then click the Trace button. The Trace dialog box (shown in Figure 7-7) lists all captured memory allocations grouped by Call Site ID. The Function column identifies the API that was called; the Calls column indicates how many times that code path was invoked; the Bytes column lists the total amount of memory allocated through that site. The values in the Operation and Protection columns are the values that were passed in the first time the call site was invoked.
FIGURE7-7 VMMap Trace dialog box.
Click the plus sign to expand the call site and show the virtual memory addresses at which the requested memory was provided. The Bytes column shows the size of each allocation. Note that when memory is freed, a subsequent allocation request through the same call
Chapter 7 Process and Diagnostic Utilities 223
site might be satisfied at the same address. When this happens, VMMap does not display a separate entry. The Bytes column reports the size only of the first allocation granted at that address. However, the sum shown for the Call Site is accurate.
By default, the Trace dialog box shows only those operations for which “Bytes” is more than 0. Select the “Show all memory operations” check box to display operations that report no bytes. These include operations such as RtlCreateHeap, RtlFreeHeap, and VirtualFree (when releasing an entire allocation block).
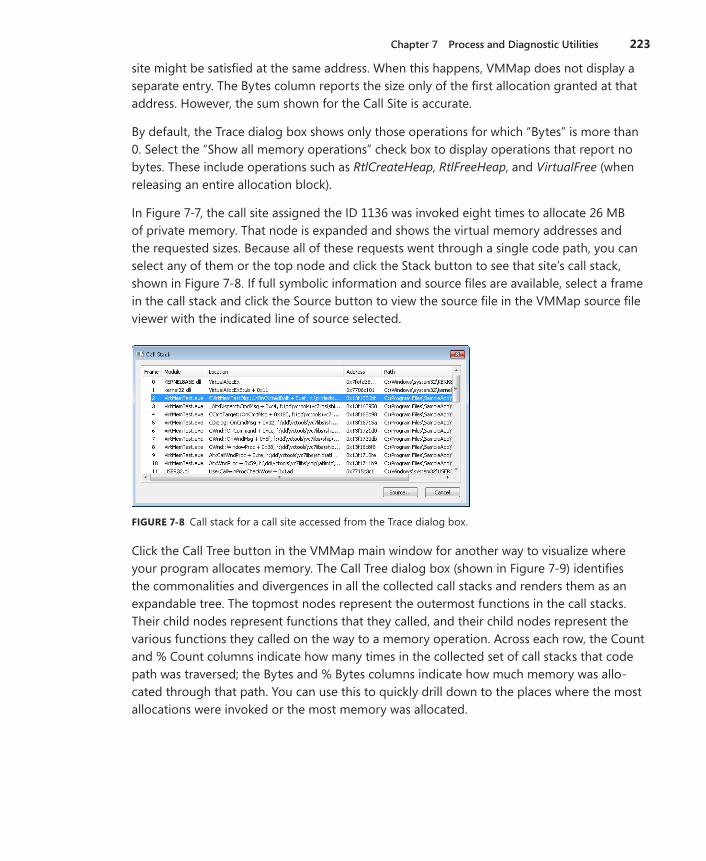
In Figure 7-7, the call site assigned the ID 1136 was invoked eight times to allocate 26 MB of private memory. That node is expanded and shows the virtual memory addresses and the requested sizes. Because all of these requests went through a single code path, you can select any of them or the top node and click the Stack button to see that site’s call stack, shown in Figure 7-8. If full symbolic information and source files are available, select a frame in the call stack and click the Source button to view the source file in the VMMap source file viewer with the indicated line of source selected.
FIGURE7-8 Call stack for a call site accessed from the Trace dialog box.
Click the Call Tree button in the VMMap main window for another way to visualize where your program allocates memory. The Call Tree dialog box (shown in Figure 7-9) identifies the commonalities and divergences in all the collected call stacks and renders them as an expandable tree. The topmost nodes represent the outermost functions in the call stacks. Their child nodes represent functions that they called, and their child nodes represent the various functions they called on the way to a memory operation. Across each row, the Count and % Count columns indicate how many times in the collected set of call stacks that code path was traversed; the Bytes and % Bytes columns indicate how much memory was allo-cated through that path. You can use this to quickly drill down to the places where the most allocations were invoked or the most memory was allocated.

224 Part II Usage Guide
FIGURE7-9 The VMMap Call Tree dialog box.
Finally, you can view the call stack for a specific heap allocation by selecting it in Details View and clicking the Heap Allocations button to display the Heap Allocations dialog box. (See Figure 7-10). Select the item in the dialog box, and click Stack to display the call stack that resulted in that allocation.
FIGURE7-10 The Heap Allocations dialog box.
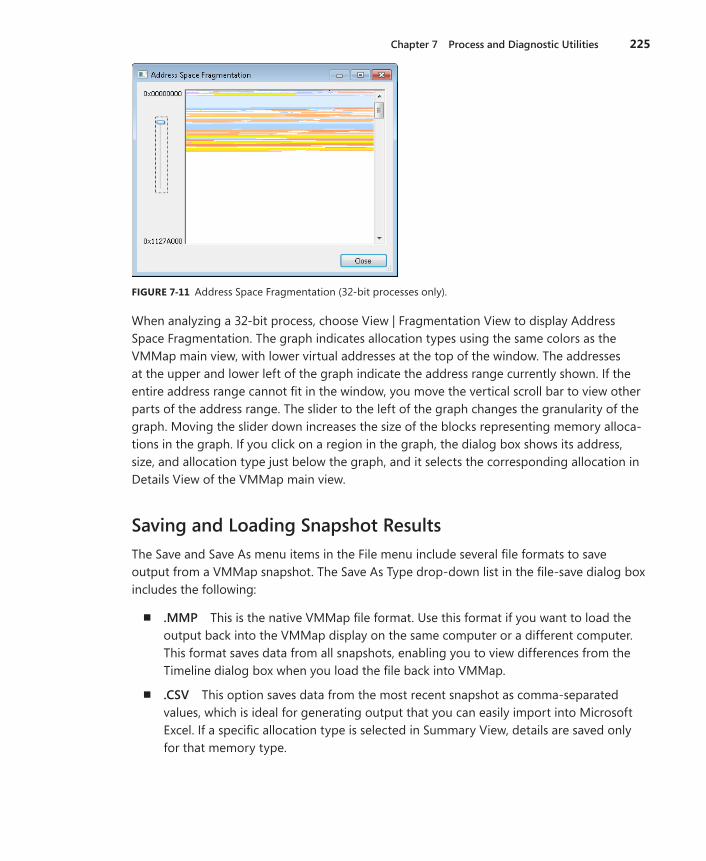
Address Space FragmentationPoor or unlucky memory management can result in a situation where there is plenty of free memory, but no individual free blocks large enough to satisfy a particular request. For 32-bit processes, the Address Space Fragmentation dialog box (shown in Figure 7-11) shows the layout of the different allocation types within the process’ address space. This can help identify whether fragmentation is a problem and locate the problematic allocations.
Chapter 7 Process and Diagnostic Utilities 225
FIGURE7-11 Address Space Fragmentation (32-bit processes only).
When analyzing a 32-bit process, choose View | Fragmentation View to display Address Space Fragmentation. The graph indicates allocation types using the same colors as the VMMap main view, with lower virtual addresses at the top of the window. The addresses at the upper and lower left of the graph indicate the address range currently shown. If the entire address range cannot fit in the window, you move the vertical scroll bar to view other parts of the address range. The slider to the left of the graph changes the granularity of the graph. Moving the slider down increases the size of the blocks representing memory alloca-tions in the graph. If you click on a region in the graph, the dialog box shows its address, size, and allocation type just below the graph, and it selects the corresponding allocation in Details View of the VMMap main view.
Saving and Loading Snapshot ResultsThe Save and Save As menu items in the File menu include several file formats to save output from a VMMap snapshot. The Save As Type drop-down list in the file-save dialog box includes the following:
■ .MMP This is the native VMMap file format. Use this format if you want to load the output back into the VMMap display on the same computer or a different computer. This format saves data from all snapshots, enabling you to view differences from the Timeline dialog box when you load the file back into VMMap.
■ .CSV This option saves data from the most recent snapshot as comma-separated values, which is ideal for generating output that you can easily import into Microsoft Excel. If a specific allocation type is selected in Summary View, details are saved only for that memory type.
226 Part II Usage Guide
■ .TXT This option saves data as formatted text, which is ideal for sharing the text results in a readable form using a monospace font. Like the .CSV format, if a specific allocation type is selected, details are saved only for that type.
To load a saved .MMP file into VMMap, press Ctrl+O, or pass the file name to VMMap on the command line with the –o option. Also, when a user runs VMMap, VMMap associates the .mmp file extension with the path to that instance of VMMap and the –o option so that users can open a saved .mmp file by double-clicking it in Windows Explorer.
VMMap Command-Line OptionsVMMap supports the following command-line options:
vmmap [-64] [-p {PID | processname} [outputfile]] [-o inputfile]
–64On x64 editions of Windows, VMMap will run a 32-bit version of itself when a 32-bit process is selected, and a 64-bit version when a 64-bit process is selected. With the –64 option, the 64-bit version of VMMap is used to analyze all processes. For 32-bit processes, the 32-bit version of VMMap more accurately categorizes allocation types. The only advantages of the 64-bit version are that it can identify the thread ID associated with 64-bit stacks and more accurately report System memory statistics.
Note The –64 option applies only to opening running processes; it does not apply when instrumenting and tracing processes launched from VMMap.
–p {PID | processname} [outputfile]Use this format to analyze the process specified by the PID or process name. If you specify a name, VMMap will match it against the first process that has a name that begins with the specified text.
If you specify an output file, VMMap will scan the target process, output results to the named file, and then terminate. If you don’t include an extension, VMMap will add .MMP and save in its native format. Add a .CSV extension to the output file name to save as comma-separated values. Any other file extension will save the output using the .TXT format.
–o inputfileWhen you use this command, VMMaps open the specified .MMP input file on startup.
Chapter 7 Process and Diagnostic Utilities 227
Restoring VMMap defaultsVMMap stores all its configuration settings in the registry in “HKEY_CURRENT_USER\Software\Sysinternals\VMMap.” The simplest way to restore all VMMap configuration settings to their defaults is to close VMMap, delete the registry key, and then start VMMap again.
ProcDumpProcDump lets you monitor a process and create a user-mode dump file when that process meets criteria that you specify, such as exceeding CPU or memory thresholds, hitting an exception or exiting unexpectedly, UI becoming nonresponsive, or exceeding performance counter thresholds. ProcDump can capture a dump for a single instance of criteria being met or continue capturing dumps each time the problem recurs. ProcDump can also generate an immediate dump or a periodic series of dumps.
A process dump file is a detailed snapshot of a process’ internal state, and it can be used by an administrator or a developer to help determine the cause of an application problem. Dump files are analyzed with a debugger such as WinDbg, which ships with the Debugging Tools for Windows.
Because ProcDump has little impact on a system while monitoring a process, it is ideal for capturing data for problems that are difficult to isolate and reproduce, even if it takes weeks for a problem to repeat. ProcDump does not terminate the process being monitored, so you can acquire dump files from processes in production with little, if any, disruption in service.
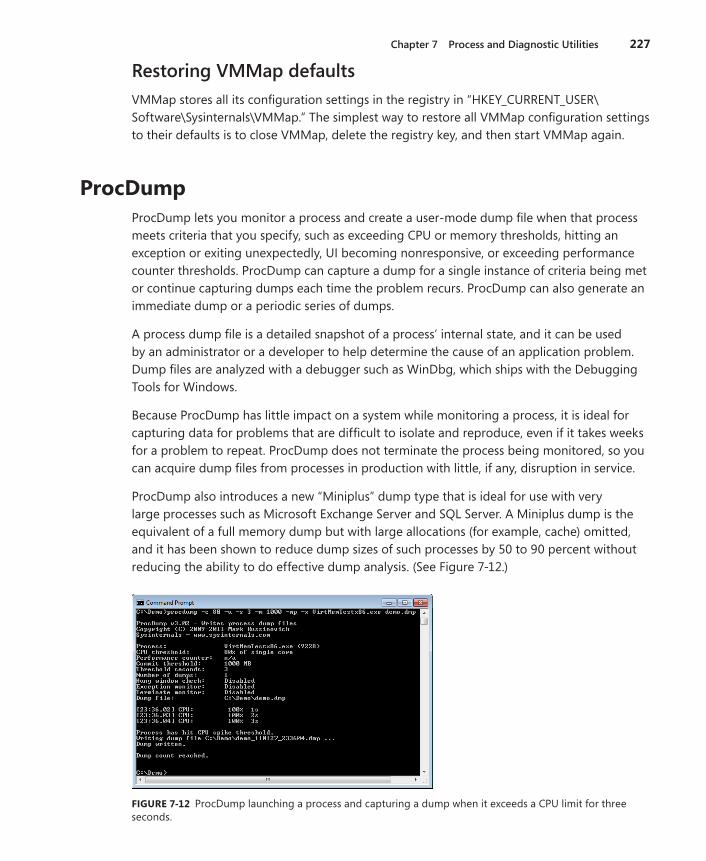
ProcDump also introduces a new “Miniplus” dump type that is ideal for use with very large processes such as Microsoft Exchange Server and SQL Server. A Miniplus dump is the equivalent of a full memory dump but with large allocations (for example, cache) omitted, and it has been shown to reduce dump sizes of such processes by 50 to 90 percent without reducing the ability to do effective dump analysis. (See Figure 7-12.)
FIGURE7-12 ProcDump launching a process and capturing a dump when it exceeds a CPU limit for three seconds.
228 Part II Usage Guide
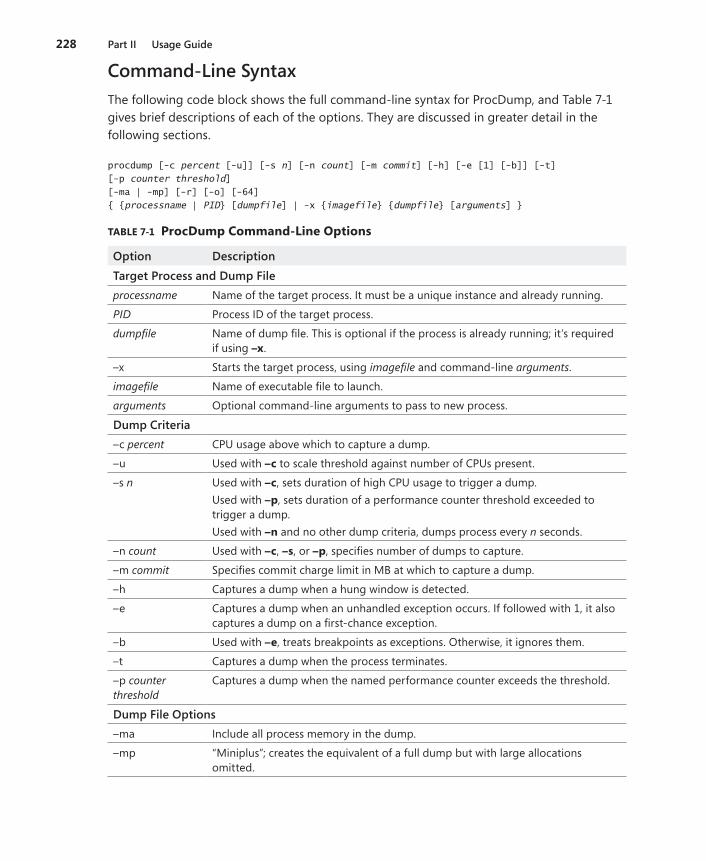
Command-Line SyntaxThe following code block shows the full command-line syntax for ProcDump, and Table 7-1 gives brief descriptions of each of the options. They are discussed in greater detail in the following sections.
procdump [-c percent [-u]] [-s n] [-n count] [-m commit] [-h] [-e [1] [-b]] [-t][-p counter threshold][-ma | -mp] [-r] [-o] [-64] { {processname | PID} [dumpfile] | -x {imagefile} {dumpfile} [arguments] }
TABLE7-1 ProcDumpCommand-LineOptions
Option DescriptionTarget Process and Dump Fileprocessname Name of the target process. It must be a unique instance and already running.
PID Process ID of the target process.
dumpfile Name of dump file. This is optional if the process is already running; it’s required if using –x.
–x Starts the target process, using imagefile and command-line arguments.
imagefile Name of executable file to launch.
arguments Optional command-line arguments to pass to new process.
Dump Criteria–c percent CPU usage above which to capture a dump.
–u Used with –c to scale threshold against number of CPUs present.
–s n Used with –c, sets duration of high CPU usage to trigger a dump.Used with –p, sets duration of a performance counter threshold exceeded to trigger a dump.Used with –n and no other dump criteria, dumps process every n seconds.
–n count Used with –c, –s, or –p, specifies number of dumps to capture.
–m commit Specifies commit charge limit in MB at which to capture a dump.
–h Captures a dump when a hung window is detected.
–e Captures a dump when an unhandled exception occurs. If followed with 1, it also captures a dump on a first-chance exception.
–b Used with –e, treats breakpoints as exceptions. Otherwise, it ignores them.
–t Captures a dump when the process terminates.
–p counter threshold
Captures a dump when the named performance counter exceeds the threshold.
Dump File Options–ma Include all process memory in the dump.
–mp “Miniplus”; creates the equivalent of a full dump but with large allocations omitted.
Chapter 7 Process and Diagnostic Utilities 229
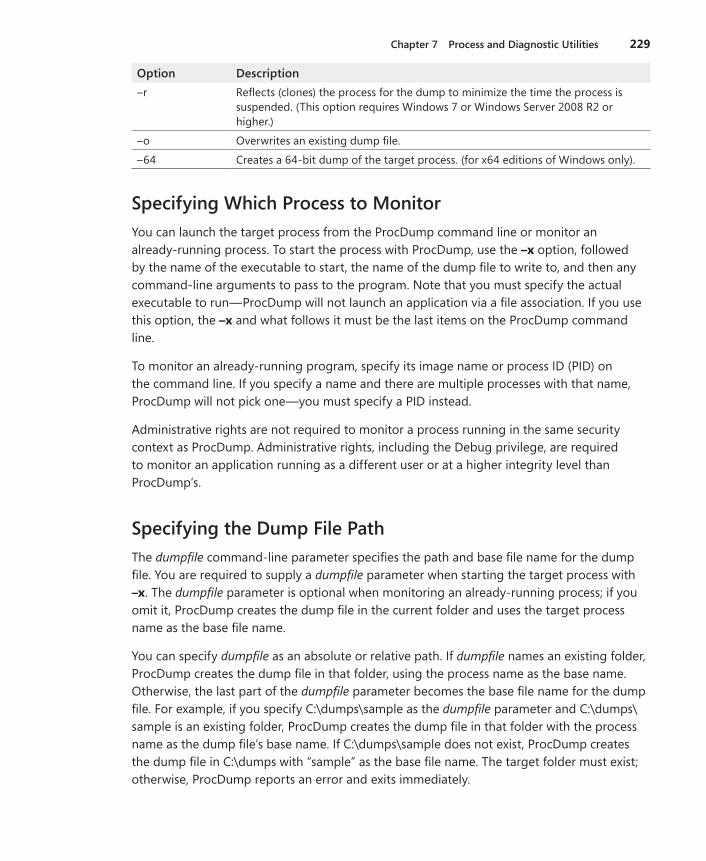
Option Description–r Reflects (clones) the process for the dump to minimize the time the process is
suspended. (This option requires Windows 7 or Windows Server 2008 R2 or higher.)
–o Overwrites an existing dump file.
–64 Creates a 64-bit dump of the target process. (for x64 editions of Windows only).
Specifying Which Process to MonitorYou can launch the target process from the ProcDump command line or monitor an already-running process. To start the process with ProcDump, use the –x option, followed by the name of the executable to start, the name of the dump file to write to, and then any command-line arguments to pass to the program. Note that you must specify the actual executable to run—ProcDump will not launch an application via a file association. If you use this option, the –x and what follows it must be the last items on the ProcDump command line.
To monitor an already-running program, specify its image name or process ID (PID) on the command line. If you specify a name and there are multiple processes with that name, ProcDump will not pick one—you must specify a PID instead.
Administrative rights are not required to monitor a process running in the same security context as ProcDump. Administrative rights, including the Debug privilege, are required to monitor an application running as a different user or at a higher integrity level than ProcDump’s.
Specifying the Dump File PathThe dumpfile command-line parameter specifies the path and base file name for the dump file. You are required to supply a dumpfile parameter when starting the target process with –x. The dumpfile parameter is optional when monitoring an already-running process; if you omit it, ProcDump creates the dump file in the current folder and uses the target process name as the base file name.
You can specify dumpfile as an absolute or relative path. If dumpfile names an existing folder, ProcDump creates the dump file in that folder, using the process name as the base name. Otherwise, the last part of the dumpfile parameter becomes the base file name for the dump file. For example, if you specify C:\dumps\sample as the dumpfile parameter and C:\dumps\sample is an existing folder, ProcDump creates the dump file in that folder with the process name as the dump file’s base name. If C:\dumps\sample does not exist, ProcDump creates the dump file in C:\dumps with “sample” as the base file name. The target folder must exist; otherwise, ProcDump reports an error and exits immediately.
230 Part II Usage Guide
To avoid an accidental overwrite of other dump files, ProcDump creates unique dump file names by incorporating the current date and time into the file name. The format for the file name is basename_yyMMdd_HHmmss.dmp. For example, the following command line creates an immediate dump file for Testapp.exe:
procdump testapp
If that dump were created at exactly 11:45:56 PM on December 28, 2010 its file name would be Testapp_101228_234556.dmp. This file naming ensures that an alphabetic sort of dump files associated with a particular executable will also be sorted chronologically (for files created from the years 2000 through 2099). Note that the format of the file name is fixed and is independent of regional settings. ProcDump also ensures that the dump file has a file extension of .dmp.
The one case where the date and time is not incorporated into the dump file name is if you capture an immediate dump of a running process and specify the dump file name. For example, the following command creates a dump file for Testapp.exe in c:\dumps\dumpfile.dmp (assuming that c:\dumps\dumpfile is not an existing folder):
procdump testapp c:\dumps\dumpfile
If c:\dumps\dumpfile.dmp already exists, ProcDump will not overwrite it unless you add the –o option to the command line.
Dumps that are created later as a result of satisfied dump criteria always have the date and time incorporated into the dump file name or names.
Specifying Criteria for a DumpAs mentioned, to capture an immediate dump of a running process, just specify it by name or PID with no other dump criteria, and an optional dump file name.
ProcDump can monitor a target process’ CPU usage and create a dump file when it exceeds a threshold for a fixed period of time. In this example, if Testapp’s CPU usage continually exceeds 90 percent for five seconds, ProcDump generates a dump file and then exits:
procdump -c 90 -s 5 testapp
If you omit the–s option, the default time period is 10 seconds. To capture multiple samples, in case the first was to the result of some transient condition not related to the problem you’re tracking (that is, a false positive), use the –n option to specify how many dumps to capture before exiting. In the following example, ProcDump will continue monitoring Testapp and create a new dump file every time it sustains 95 percent CPU for two seconds, until it has captured 10 dumps:
procdump -c 95 -s 2 -n 10 testapp
Chapter 7 Process and Diagnostic Utilities 231
On a multi-core system, a single thread cannot consume 100 percent of all the processors’ time. On a dual core, the maximum one thread can consume is 50 percent; on a quad core, the maximum is 25 percent. To scale the –c threshold against the number of CPUs on the system, add –u to the command line. On a dual-core system, procdump–c90–utestapp creates a dump when Testapp exceeds 45 percent CPU for 10 seconds—the equivalent of 90 percent of one of the CPUs. On a 16-core system, the trigger threshold is 5.625 percent. Because –c requires an integer value, the –u option increases the granularity with which you can specify a threshold on multi-core systems. See “The Compound Case of the Outlook Hangs” in Chapter 17, “Hangs and Sluggish Performance”, for an example of its use.
Note A user-mode thread running a tight CPU-bound loop can, and often will, be scheduled to run on more than one CPU, unless its processor affinity has been set to tie it to one CPU. The –u option scales the threshold only against the number of cores; it doesn’t mean, “Create a dump if the process exceeds the threshold on a single CPU.” That wouldn’t be possible anyway because Windows does not provide the tracking information to support such a query.
To capture a periodic series of dumps, use the –s and –n options together without any other dump criteria. The –s option specifies the number of seconds between the end of the previ-ous capture and the beginning of the next capture. The –n option specifies how many dumps to capture. The following example captures a dump of Testapp immediately, another dump five seconds later, and again five seconds after that, for a total of three dumps:
procdump -s 5 -n 3 testapp
To capture a dump when the process hits an unhandled exception, use the –e option. Use –e1to capture a dump on any exception, including a first-chance exception. Use –t to capture a dump when the process terminates. The –t option is useful to identify the cause of an unexpected process exit that is not caused by an unhandled exception. If you add –b, ProcDump treats debug breakpoints as exceptions; otherwise, it ignores them. For example, a program might contain code like the following:
if (IsDebuggerPresent()) DebugBreak();
ProcDump attaches to the target program as a debugger, the IsDebuggerPresent API will return TRUE, and DebugBreak will be called. ProcDump will capture a dump when DebugBreak is called only if you specify –b.
ProcDump’s –h option monitors the target process for a hung (nonresponsive) top-level window and captures a dump when detected. ProcDump uses the same definition of “not responding” that Windows and Task Manager use: if a window belonging to the process fails to respond to window messages for five seconds, it’s considered hung. ProcDump must be running on the same desktop as the target process to use this option.
232 Part II Usage Guide
You can use a process’ commit charge threshold to trigger a dump. Specify the memory threshold in MB with the –m option. The following example captures a dump when Testapp’s commit charge exceeds 200 MB:
procdump -m 200 testapp
ProcDump checks the memory counters of the process once per second, and it captures a dump only if the amount of process memory charged against the system commit limit (the sum of the paging file sizes plus most of RAM) exceeds the threshold at the moment of the check. If the commit charge spikes only briefly, ProcDump might not detect it.
Finally, you can use any performance counter to trigger a dump. Specify the –p option, followed by the name of the counter and the threshold to exceed. Put the counter name in double quotes if it contains spaces. The following example captures a dump of Taskmgr.exe if the number of processes on the system exceeds 750 for three seconds or more:
procdump -p "\System\Processes" 750 -s 3 taskmgr.exe
One way to obtain valid counter names is to add them in Performance Monitor and then view the names on the Data tab of the Properties dialog box. However, Perfmon’s default notation for distinguishing multiple instances of a process with a hash sign and a sequence number (for example, cmd#2) is neither predictable nor stable—the name associated with a specific process can change as other instances start or exit. Therefore, ProcDump does not support this notation, but instead supports the process_PID notation described in Microsoft Knowledge Base article 281884. For example, if you have two instances of Testapp with PIDs 1135 and 924, you can monitor attributes of the former by specifying it as testapp_1135. The following example captures a dump of that process if its handle count exceeds 200 for three seconds:
procdump -p "\Process(testapp_1135)\Handle Count" 200 -s 3 1135
The process_PID notation is not mandatory. You can specify just the process name, but results will be unpredictable if multiple instances of that process are running.
Options can be combined. The following command captures a dump if Testapp exceeds the CPU or the commit charge threshold, has a hung window or unhandled exception, or otherwise exits:
procdump -m 200 -c 90 -s 3 -u -h -t -e testapp
To stop monitoring at any time, just press Ctrl+C or Ctrl+Break.
Dump File OptionsDifferent debug dump options are available depending on the version of dbghelp.dll that ProcDump uses. To get the latest and greatest features, install the latest version of
Chapter 7 Process and Diagnostic Utilities 233
Debugging Tools for Windows, copy ProcDump.exe into the folder containing dbghelp.dll, and run it from there.
At a minimum, dumps created by ProcDump will contain basic information about the process and all its threads, including stack traces for all threads; data sections from all loaded mod-ules, including global variables; and module signature information so that the corresponding symbol files can be downloaded from a symbol server, even if the dump is analyzed on a completely different platform.
Note With Dbghelp.dll version 6.1 or higher, ProcDump adds thread CPU usage data so that the debugger’s !runaway command can show the amount of time consumed by each thread. Version 6.1 is included with Windows 7 and Windows Server 2008 R2.
To include all the process’ accessible memory in the dump, add the –ma option to the ProcDump command line. With newer versions of dbghelp.dll, this option also captures memory region information, including details about the allocations and protection s ettings. Note that the –ma option makes the dump file much larger and can be very time- consuming, potentially taking several minutes to write the memory of a large application to disk. (The Miniplus dump option, described in the next section, is as useful as a full dump but is up to 90 percent smaller.)
Ordinarily, ProcDump needs to suspend the target process while the dump is being captured. Windows 7 and Windows Server 2008 R2 introduced a process reflection feature, which allows the process to be “cloned” so that the process can continue to run while a memory snapshot is dumped. You can take advantage of this feature by using the –r option. ProcDump creates three files: dumpfile.dmp, which captures process and thread information; dumpfile-reflected.dmp, which captures the process’ memory; and dumpfile.ini, which ties them together and is the file you should open with the debugger. Windbg treats *.ini as a valid dump file type, although the file-open dialog box doesn’t indicate so.
On x64 editions of Windows, ProcDump creates a 32-bit dump file when the target process is a 32-bit process. To override this default and create a 64-bit dump file, add –64 to the ProcDump command line.
Miniplus DumpsThe Miniplus (–mp) dump type was specifically designed to tackle the growing problem of capturing full dumps of large applications such as the Microsoft Exchange Information Store (store.exe) on large servers. For example, capturing a full dump of Exchange 2010 can take 30 minutes and result in a dump file of 48 GB. Compressing that file down to 8 GB can take another 60 minutes, and uploading the compressed file to Microsoft support can take an-other six hours. Capturing a Miniplus dump of the same Exchange server takes one minute,
234 Part II Usage Guide
and results in a 1.5-GB dump file that takes two minutes to compress and about 15 minutes to upload.
Although originally designed for Exchange, the algorithm is generic and works as well on Microsoft SQL Server or any other native application that allocates large memory regions. This is because the algorithm uses heuristics to determine what data is to be included.
A Miniplus dump starts by creating a minidump and adds (“plus”) memory deemed important. The first step is to consider only pages marked as read/write. This excludes the majority of the image pages but still retains the image pages associated with global variables. The next step is to find the largest read/write memory area larger than 512 MB. If found, the memory area is provisionally excluded. A memory area is the collection of same-sized mem-ory allocations. For example, if there are twenty 64-MB regions (1280 MB total), and five 128-MB regions (640 MB total), the 64-MB regions will be excluded because they use more memory than the 128-MB regions even though the size of the allocations is not the largest. These excluded regions have a second chance to be included. They are divided into 4-MB chunks, and if referenced by any thread stack, the referenced 4-MB chunk is included.
Even if the process isn’t overly large, Miniplus dumps are still considerably smaller than full dumps because they do not contain the process’ executable image. For example, a full dump of Notepad is approximately 50 MB, but a Notepad Miniplus dump is only about 2 MB. And a full dump of Microsoft Word is typically around 280 MB, but a Miniplus dump of the same process is only about 36 MB. When the process isn’t overly large, you can get an approximate size of the dump by viewing the Total/Private value in VMMap.
Note When debugging Miniplus dumps, the debugger needs to substitute in the omitted image pages from a symbol store (.sympath) or executable store (.exepath). If you are capturing Miniplus dumps of your application, you need to maintain both a symbol and executable store that contains each build of your application.
An additional benefit of the Miniplus implementation is its ability to recover from memory read failures. A memory read failure is the reason why various dump utilities sometimes fail to capture a full dump. If you run across this issue when capturing a full dump, try using Miniplus instead to activate this recovery logic.
The Miniplus dump option can be combined with other ProcDump options as the following examples demonstrate. To capture a single Miniplus dump of store.exe, use the following command line:
procdump -mp store.exe
Use the following command to capture a single Miniplus dump when store.exe crashes:
procdump -mp -e store.exe
Chapter 7 Process and Diagnostic Utilities 235
This command captures three Miniplus dumps of store.exe 15 seconds apart:
procdump -mp -n 3 -s 15 store.exe
To capture three Miniplus dumps when the RPC Averaged Latency performance counter is over 250 ms for 15 seconds, use this command:
procdump -mp -n 3 -s 15 -p "\MSExchangeIS\RPC Averaged Latency" 250 store.exe
Note I don’t recommend you capture a Miniplus dump of a managed (.NET) application, but that you capture a full dump (–ma) instead. The Miniplus algorithm tries to capture a full dump in this situation, but because it builds on top of a minidump, the resulting dump isn’t as complete as a full dump. A full dump is needed because intact GC data structures and access to the NGEN image (which won’t be on a symbol or executable store) are required by the debugger.
Running ProcDump NoninteractivelyProcDump does not need to be run in an interactive desktop session. Some reasons that you might want to run it noninteractively are that you have a long-running target process and don’t want to remain logged in while monitoring it, or you’re tracking a problem that happens when no one is logged on or during a logoff.
The following example shows how to use PsExec to run ProcDump as System in the same noninteractive session and desktop in which services running as System run. The example runs it within a Cmd.exe instance so that its console outputs can be redirected to files. Note the use of the escape (̂ ) character with the output redirection character (>) so that it isn’t treated as an output redirector on the PsExec command line but becomes part of the Cmd.exe command line. The following example should be typed as a single command line. (See Chapter 6, “PsTools,” for more information about PsExec, and see Chapter 2 for more information about noninteractive sessions and desktops.)
psexec -s -d cmd.exe /c procdump.exe -e -t testapp c:\temp\testapp.dmp ^> c:\temp\procdump.out 2^> c:\temp\procdump.err
If the target application crashes during a logoff, this type of command will work better than if ProcDump were running in the same session, because ProcDump could end up exiting earlier than the target. However, if the logoff terminates the target application, ProcDump will not be able to capture a dump. ProcDump acts as a debugger for its target process, and logoff detaches any debuggers attached to processes that it terminates.
Note also that ProcDump cannot monitor for hung application windows when the target process is running on a different desktop from ProcDump.
236 Part II Usage Guide
Capturing All Application Crashes with ProcDumpYou can use ProcDump to create a crash dump whenever any application crashes by configuring it as the postmortem debugger.1 In the registry, go to HKLM\Software\Microsoft\Windows NT\CurrentVersion\AeDebug. Set the “Debugger” REG_SZ value to the ProcDump command line to execute, using %ld as the placeholder for the PID of the crashing process. For example, the following command will create a full memory dump in C:\Dumps whenever any application crashes with the process name and time stamp in the file name:
"C:\Program Files\Sysinternals\procdump.exe" /accepteula -ma %ld C:\Dumps
It is important to specify the dump file path. Otherwise, ProcDump tries to create the dump file in the current directory, which is %SystemRoot%\System32 when started in this manner. Because the configured debugger is launched in the same security context as the crashing process, ProcDump cannot create the dump file there unless the crashing process had ad-ministrative rights. Also note that the target folder must exist before ProcDump launches, and it must be writable.
Viewing the Dump in the DebuggerFor all dumps triggered by a condition, ProcDump records a comment in the dump that describes why the dump was captured. The comment can be seen in the initial text that WinDbg presents when you open the dump file. The first line of the comment shows the ProcDump command line that was used to create the dump. The second line of the comment describes what triggered the dump, along with other pertinent data if available. For example, if the memory threshold had been passed, the comment shows the memory commit limit and the process’ commit usage:
*** Process exceeded 100 MB commit usage: 107 MB
If the CPU threshold has been passed, the comment shows the CPU threshold, the duration, and the thread identifier (TID) that consumed the largest amount of CPU cycles in the period:
*** Process exceeded 50% CPU for 3 seconds. Thread consuming CPU: 4484 (0x1184)
If the performance counter threshold had been exceeded, the comment reports the performance counter, threshold, duration, and TID that consumed the largest amount of CPU cycles in the period. (The following command should be typed on a single command line, with a space separating the period and “Thread”.)
*** Counter "\Process(notepad_1376)\% Processor Time" exceeded 5 for 3 seconds. Thread consuming CPU: 1368 (0x558)
1 Windows Error Reporting can capture crash dumps, but ProcDump can be easier to configure.
Chapter 7 Process and Diagnostic Utilities 237
If a hung window triggered the dump, the comment includes the window handle in hexadecimal. If the dump was captured immediately, was timed, or was triggered by an exception or a normal termination, the comment reports only the cause with no additional data.
To avoid you having to change the thread context to the busy thread (the ~~[TID]s command) when opening a dump that has been created because of a CPU or performance counter trigger, ProcDump inserts a fake exception to do it for you. This is very useful when you capture multiple dump files because you can open each dump file knowing that the default thread context is the thread of interest. The insertion of the fake exception into the dump results in the debugger reporting a false positive with text like the following:
This dump file has an exception of interest stored in it. The stored exception information can be accessed via .ecxr. (104c.14c0): Wake debugger - code 80000007 (first/second chance not available) eax=000cfe00 ebx=00188768 ecx=00000001 edx=00000000 esi=00000000 edi=00000000 eip=01001dc7 esp=00feff70 ebp=00feff88 iopl=0 nv up ei pl zr na pe nc cs=0023 ss=002b ds=002b es=002b fs=0053 gs=002b efl=00000246
Now that you know about that, you can safely ignore it.
DebugViewDebugView is an application that lets you monitor debug output generated from the local computer or from remote computers. Unlike most debuggers, DebugView can display user-mode debug output from all processes within a session, as well as kernel-mode debug output. It offers flexible logging and display options, and it works on all x86 and x64 versions of Windows XP and newer.
What Is Debug Output?Windows provides APIs that programs can call to send text that can be captured and displayed by a debugger. If no debugger is active, the APIs do nothing. These interfaces make it easy for programs to produce diagnostic output that can be consumed by any standard debugger and that is discarded if no debugger is connected.
Debug output can be produced both by user-mode programs and by kernel-mode drivers. For user-mode programs, Windows provides the OutputDebugString Win32 API. 16-bit appli-cations running on x86 editions of Windows can produce debug output by calling the Win16 OutputDebugString API, which is forwarded to the Win32 API. For managed applications, the Microsoft .NET Framework provides the System.Diagnostics.Debug and Trace classes with
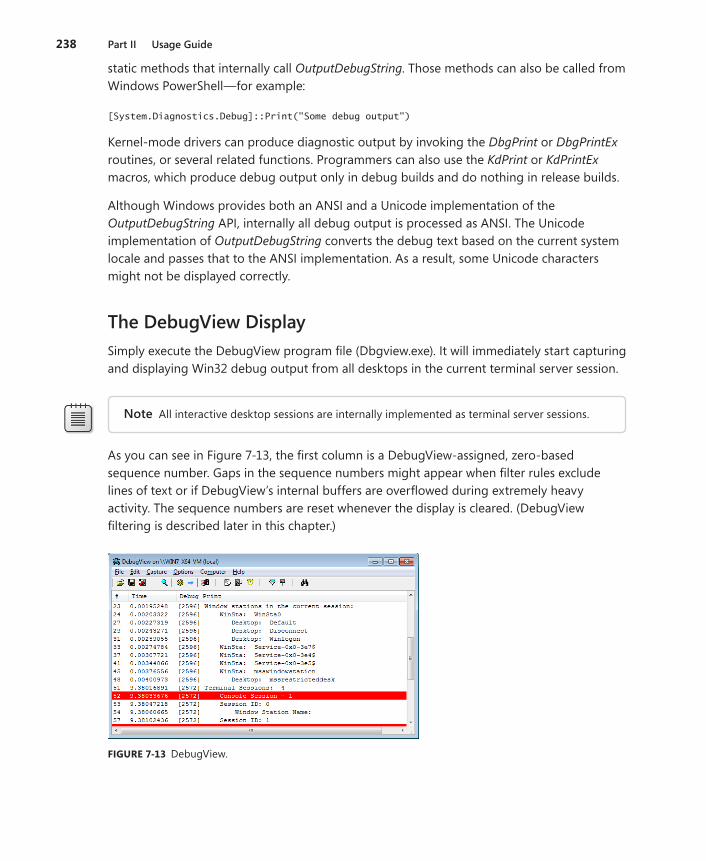
238 Part II Usage Guide
static methods that internally call OutputDebugString. Those methods can also be called from Windows PowerShell—for example:
[System.Diagnostics.Debug]::Print("Some debug output")
Kernel-mode drivers can produce diagnostic output by invoking the DbgPrint or DbgPrintEx routines, or several related functions. Programmers can also use the KdPrint or KdPrintEx macros, which produce debug output only in debug builds and do nothing in release builds.
Although Windows provides both an ANSI and a Unicode implementation of the OutputDebugString API, internally all debug output is processed as ANSI. The Unicode implementation of OutputDebugString converts the debug text based on the current system locale and passes that to the ANSI implementation. As a result, some Unicode characters might not be displayed correctly.
The DebugView DisplaySimply execute the DebugView program file (Dbgview.exe). It will immediately start capturing and displaying Win32 debug output from all desktops in the current terminal server session.
Note All interactive desktop sessions are internally implemented as terminal server sessions.
As you can see in Figure 7-13, the first column is a DebugView-assigned, zero-based sequence number. Gaps in the sequence numbers might appear when filter rules exclude lines of text or if DebugView’s internal buffers are overflowed during extremely heavy activity. The sequence numbers are reset whenever the display is cleared. (DebugView filtering is described later in this chapter.)
FIGURE7-13 DebugView.
Chapter 7 Process and Diagnostic Utilities 239
The second column displays the time at which the item was captured, either in elapsed time or clock time. By default, DebugView shows the number of seconds since the first debug record in the display was captured, with the first item always being 0.00. This can be helpful when debugging timing-related problems. This timer is reset when the display is cleared. Choose Clock Time from the Options menu if you prefer that the local clock time be dis-played instead. Additionally, choose Show Milliseconds from the Options menu if you want the time stamp to show that level of granularity. You can also configure the time display with command-line options: /o to display clock time, /om to display clock time with milliseconds, and /on to show elapsed time.
Tip Changing the Show Milliseconds setting doesn’t change the display of existing entries. You can refresh these entries by pressing Ctrl+T twice to toggle Clock Time off and back on. All entries will then reflect the new setting for Show Milliseconds.
The debug output is in the Debug Print column. For user-mode debug output, the process ID (PID) of the process that generated the output appears in square brackets, followed by the output itself. If you don’t want the PID in the display, disable the Win32 PIDs option in the Options menu.
You can select one or more rows of debug output and copy them to the Windows clipboard by pressing Ctrl+C. DebugView supports standard Windows methods of selecting multiple rows such as holding down Shift while pressing the Up or Down arrow keys to select consecutive rows, or holding down Ctrl while clicking nonconsecutive rows.
By default, the Force Carriage Returns option is enabled, which displays every string passed to a debug output function on a separate line, whether or not that text is terminated with a carriage return. If you disable that option in the Options menu, DebugView buffers output text in memory and adds it to the display only when a carriage return is encountered or the memory buffer is filled (approximately 4192 characters). This allows applications and drivers to build output lines with multiple invocations of debug output functions. However, if output is being generated from more than one process, the output can be jumbled together, and the PID that appears on the line will be that of the process that output a carriage return or filled the buffer.
If the text of any column is too wide for that column, move the mouse over it and the full text will appear in a tooltip.
Debug output is added to the end of the list as it is produced. DebugView’s Autoscroll feature (which is off by default) scrolls the display as new debug output is captured so that the most recent entry is visible. To toggle Autoscroll on and off, press Ctrl+A or click the Autoscroll icon in the toolbar.
240 Part II Usage Guide
You can annotate the output by choosing Append Comment from the Edit menu. The text you enter in the Append Comment dialog box is added to the debug output display and to the log file if logging is enabled. Note that filter rules apply to appended comments as well as to debug output.
You can increase the display space for debug output by selecting Hide Toolbar on the Options menu. You can also increase the number of visible rows of debug output by selecting a smaller font size. Choose Font from the Options menu to change the font.
To run DebugView in the background without taking up space in the taskbar, select Hide When Minimized from the Options menu. When you subsequently minimize the DebugView window, it will appear only as an icon in the notification area (also known as “the tray”). You can then right-click on the icon to display the Capture pop-up menu, where you can choose to enable or disable various Capture options. Double-click the icon to display the DebugView window again. You can enable the Hide When Minimized option on startup by adding /t to the DebugView command line.
Select Always On Top from the Options menu to keep DebugView as the topmost window on the desktop when it’s not minimized.
Capturing User-Mode Debug OutputDebugView can capture debug output from multiple local sources: the current terminal services session, the global terminal services session (“session 0”), and kernel mode. Each of these can be selected from the Capture menu. All capturing can be toggled on or off by choosing Capture Events, pressing Ctrl+E, or clicking the Capture toolbar icon. When Capture Events is off, no debug output is captured; when it is on, debug output is captured from the selected sources.
By default, DebugView captures only debug output from the current terminal services session, called “Capture Win32” on the Capture menu. A terminal services session can be thought of as all user-mode activity associated with an interactive desktop logon. It includes all processes running in the window stations and (Win32) Desktops of that session.
On Windows XP and on Windows Server 2003, an interactive session can be in session 0, and it always is when Fast User Switching and Remote Desktop are not involved. Session 0 is the session in which all services also execute and in which global objects are defined. When DebugView is executing in session 0 and Capture Win32 is enabled, it will capture debug output from services as well as the interactive user’s processes. Administrative rights are not required to capture debug output from the current session, even that from services. (See the “Sessions, Window Stations, Desktops, and Window Messages” section of Chapter 2 for more information.)
Chapter 7 Process and Diagnostic Utilities 241
With Fast User Switching or Remote Desktop, Windows XP and Windows Server 2003 users often log in to sessions other than the global one. Also, beginning with Windows Vista, session 0 isolation ensures that users never log on to the session in which services run. When run in a session other than session 0, DebugView adds the Capture Global Win32 option to the Capture menu. When enabled, this option captures debug output from processes run-ning in session 0. DebugView must run elevated on Windows Vista and newer to use this option. Administrative rights are not required to enable this option on Windows XP.
Capturing Kernel-Mode Debug OutputYou can configure DebugView to capture kernel-mode debug output generated by device drivers or by the Windows kernel by enabling the Capture Kernel option on the Capture menu. Process IDs are not reported for kernel-mode output because such output is typically not related to a process context. Kernel-mode capture requires administrative rights, and in particular the Load Driver privilege.
Kernel-mode components can set the severity level of each debug message. On Windows Vista and newer, kernel-mode debug output can be filtered based on severity level. If you want to capture all kernel debug output, choose the Enable Verbose Kernel Output option on the Capture menu. If this option is not enabled, DebugView captures only debug output at the error severity level.
DebugView can be configured to pass kernel-mode debug output to a kernel-mode debugger or to swallow the output. You can toggle pass-through mode on the Capture menu or with the Pass-Through toolbar icon. The pass-through mode allows you to see kernel-mode debug output in the output buffers of a conventional kernel-mode debugger while at the same time viewing it in DebugView.
Because it is an interactive program, DebugView cannot be started until after you log on. Ordinarily, to view debug output generated prior to logon, you need to hook up a kernel debugger from a remote computer. DebugView’s Log Boot feature offers an alternative, capturing kernel-mode debug output during system startup, holding that output in memory, and displaying it after you log in and start DebugView interactively. When you choose Log Boot from the Capture menu, DebugView configures its kernel driver to load very early in the next boot sequence. When it loads, it creates a 4-MB buffer and captures verbose kernel debug output in it until the buffer is full or DebugView connects to it. When you start DebugView with administrative rights and Capture Kernel enabled, DebugView checks for the existence of the memory buffer in kernel memory. If that is found, DebugView displays its contents. Configuring boot logging requires administrative permissions and applies only to the next boot.
If DebugView is capturing kernel debug output at the time of a bugcheck (also known as a blue-screen crash), DebugView can recover the output it had captured to that point from
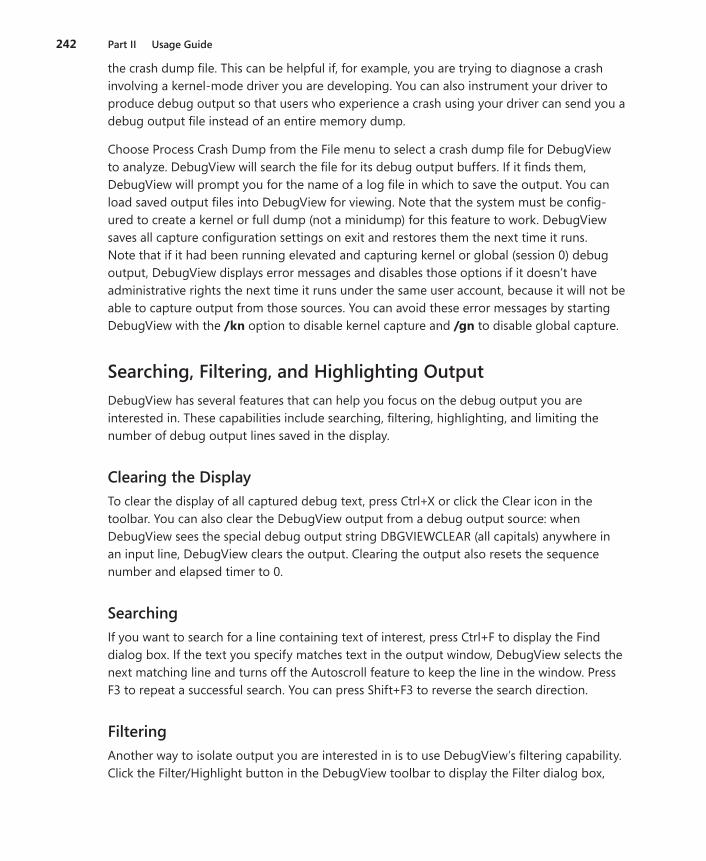
242 Part II Usage Guide
the crash dump file. This can be helpful if, for example, you are trying to diagnose a crash involving a kernel-mode driver you are developing. You can also instrument your driver to produce debug output so that users who experience a crash using your driver can send you a debug output file instead of an entire memory dump.
Choose Process Crash Dump from the File menu to select a crash dump file for DebugView to analyze. DebugView will search the file for its debug output buffers. If it finds them, DebugView will prompt you for the name of a log file in which to save the output. You can load saved output files into DebugView for viewing. Note that the system must be config-ured to create a kernel or full dump (not a minidump) for this feature to work. DebugView saves all capture configuration settings on exit and restores them the next time it runs. Note that if it had been running elevated and capturing kernel or global (session 0) debug output, DebugView displays error messages and disables those options if it doesn’t have administrative rights the next time it runs under the same user account, because it will not be able to capture output from those sources. You can avoid these error messages by starting DebugView with the /kn option to disable kernel capture and /gn to disable global capture.
Searching, Filtering, and Highlighting OutputDebugView has several features that can help you focus on the debug output you are interested in. These capabilities include searching, filtering, highlighting, and limiting the number of debug output lines saved in the display.
Clearing the Display To clear the display of all captured debug text, press Ctrl+X or click the Clear icon in the toolbar. You can also clear the DebugView output from a debug output source: when DebugView sees the special debug output string DBGVIEWCLEAR (all capitals) anywhere in an input line, DebugView clears the output. Clearing the output also resets the sequence number and elapsed timer to 0.
Searching If you want to search for a line containing text of interest, press Ctrl+F to display the Find dialog box. If the text you specify matches text in the output window, DebugView selects the next matching line and turns off the Autoscroll feature to keep the line in the window. Press F3 to repeat a successful search. You can press Shift+F3 to reverse the search direction.
FilteringAnother way to isolate output you are interested in is to use DebugView’s filtering capability. Click the Filter/Highlight button in the DebugView toolbar to display the Filter dialog box,
Chapter 7 Process and Diagnostic Utilities 243
shown in Figure 7-14. The Include and Exclude fields are used to set criteria for including or excluding incoming lines of debug text based on their content. The Highlight group box is used to color-code selected lines based on their content. Filter and Highlight rules can be saved to disk and then reloaded at a later time. (Highlighting is discussed in the next section of this chapter.)
FIGURE7-14 The DebugView Filter dialog box.
Enter substring expressions in the Include field that match debug output lines that you want DebugView to display, and enter substring expressions in the Exclude field to specify debug output lines that you do not want DebugView to display. You can enter multiple expressions, separating each with a semicolon. Do not include spaces in the filter expression unless you want the spaces to be part of the filter. Note that the “*” character is interpreted as a wild-card, and that filters are interpreted in a case-insensitive manner and are also applied to the Process ID portion of the line if PIDs are included in the output. The default rules include everything (“*”) and exclude nothing.
As shown in the example in Figure 7-14, say that you want DebugView to display debug output only if it contains the words “win,” “desk,” or “session,” unless it also contains the word “error.” Set the Include filter to “win;desk;session” (without the quotes) and the Exclude filter to “error.” If you want DebugView to show only output that has “MyApp:” and the word “ severe” following later in the output line, use a wildcard in the Include filter: “myapp:*severe”.
Filtering is applied only to new lines of debug output as they are captured and to comments appended with the Append Comment feature. New text lines that match the rules that are in effect are displayed; those that don’t match are dropped and cannot be “unhidden” by changing the filter rules after the fact. Also, changing the filter rules does not remove lines that are already displayed by DebugView.
If any filter rules are in effect when you exit DebugView, DebugView will display them in a dialog box the next time you start it. Simply click OK to continue using those rules, or change them first. You can edit them in place, click Load to use a previously saved filter, or click Reset to remove the filter. To bypass this dialog box and continue to use the rules that were in effect, add /f to the DebugView command line.

244 Part II Usage Guide
HighlightingHighlighting lets you color-code selected lines based on the text content of those lines. DebugView supports up to 20 separate highlighting rules, each with its own foreground and background color. The highlight rule syntax is the same as that for the Include filter.
Use the Filter drop-down list in the Highlight group box to select which filter (numbered 1 through 20) you want to edit. By default, each filter is associated with a color combination but no highlight rule. To set a rule for that filter, type the text for the rule in the drop-down list showing the color combination. In Figure 7-14, Filter 1 highlights lines containing the word “Console.”
Lower-numbered highlight filters take precedence over higher-numbered rules. If a line of text matches the rules for Filter 3 and Filter 5, the line will be displayed in the colors associ-ated with Filter 3. Changing highlight rules updates all lines in the display to reflect the new highlight rules.
To change the colors associated with a highlight filter, select that filter in the drop-down list and click on the Colors button. To change the foreground color, select the FG radio button, choose a color, and click the Select button. Do the same using the BG radio button to change the background color, and then click OK.
Saving and Restoring Filter and Highlight RulesUse the Load and Save buttons on the Filter dialog box to save and restore filter settings, including the Include, Exclude, and Highlight filter rules, as well as the Highlight color selections. DebugView uses the .INI file extension for its filter files, even though they are not formatted as initialization files.
Clicking the Reset button resets all Filter and Highlight rules to DebugView defaults. Note that Reset does not restore default Highlight colors.
History DepthA final way to control DebugView output is to limit the number of lines that are retained in the display. Choose History Depth from the Edit menu to display the History Depth dialog box. Enter the number of output lines you want DebugView to retain, and it will keep only that number of the most recent debut output lines, discarding older ones. A history depth of 0 (zero) represents no limit on the number of output lines retained. You can specify the history depth on the command line with the /h switch, followed by the desired depth.
You do not need to use the History Depth feature to prevent all of a system’s virtual memory from being consumed in long-running captures. DebugView monitors system memory usage, alerts the user, and suspends capture of debug output when it detects that memory is running low.
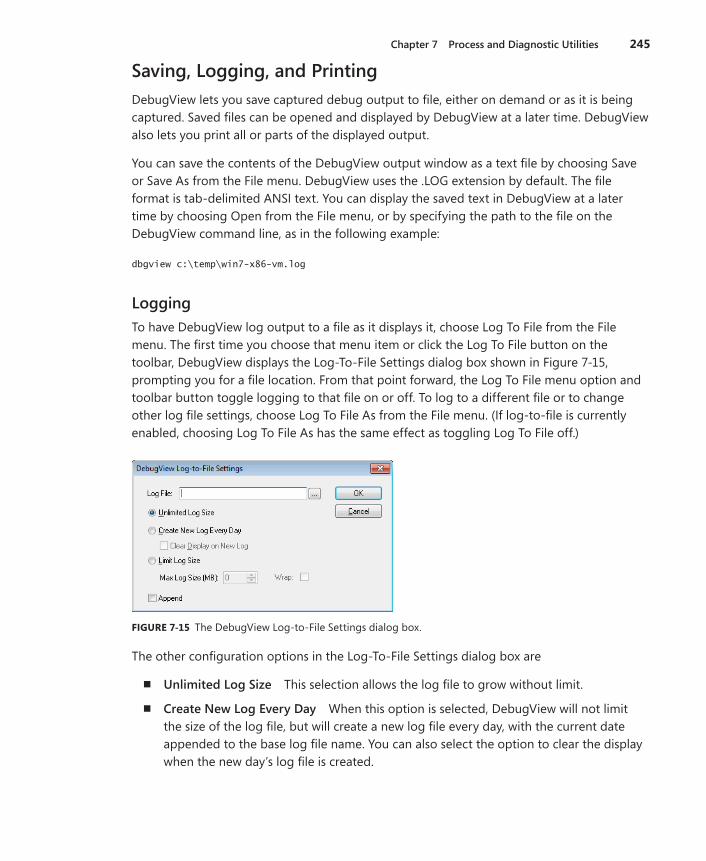
Chapter 7 Process and Diagnostic Utilities 245
Saving, Logging, and PrintingDebugView lets you save captured debug output to file, either on demand or as it is being captured. Saved files can be opened and displayed by DebugView at a later time. DebugView also lets you print all or parts of the displayed output.
You can save the contents of the DebugView output window as a text file by choosing Save or Save As from the File menu. DebugView uses the .LOG extension by default. The file format is tab-delimited ANSI text. You can display the saved text in DebugView at a later time by choosing Open from the File menu, or by specifying the path to the file on the DebugView command line, as in the following example:
dbgview c:\temp\win7-x86-vm.log
LoggingTo have DebugView log output to a file as it displays it, choose Log To File from the File menu. The first time you choose that menu item or click the Log To File button on the toolbar, DebugView displays the Log-To-File Settings dialog box shown in Figure 7-15, prompting you for a file location. From that point forward, the Log To File menu option and toolbar button toggle logging to that file on or off. To log to a different file or to change other log file settings, choose Log To File As from the File menu. (If log-to-file is currently enabled, choosing Log To File As has the same effect as toggling Log To File off.)
FIGURE7-15 The DebugView Log-to-File Settings dialog box.
The other configuration options in the Log-To-File Settings dialog box are
■ Unlimited Log Size This selection allows the log file to grow without limit.
■ Create New Log Every Day When this option is selected, DebugView will not limit the size of the log file, but will create a new log file every day, with the current date appended to the base log file name. You can also select the option to clear the display when the new day’s log file is created.
246 Part II Usage Guide
■ Limit Log Size When this option is selected, the log file will not grow past the size limit you specify. DebugView will stop logging to the file at that point, unless you also select the Wrap option. With Wrap enabled, DebugView will wrap around to the beginning of the file when the file’s maximum size is reached.
If Append is not selected and the target log file already exists, DebugView truncates the existing file when logging begins. If Append is selected, DebugView appends to the existing log file, preserving its content.
If you are monitoring debug output from multiple remote computers and enable logging to a file, all output is logged to the one file you specify. Ranges of output from different com-puters are separated with a header that indicates the name of the computer from which the subsequent lines were recorded.
Logging options can also be controlled by using the command-line options listed in Table 7-2:
TABLE7-2 Command-LineOptionsforLogging
Option Description–l logfile Logs output to the specified logfile
–m n Limits log file to n MB
–p Appends to the file if it already exists; otherwise, overwrites it
–w Used with –m, wrap to the beginning of the file when the maximum size is reached
–n Creates a new log file every day, appending the date to the file name
–x Used with –n, clears the display when a new log file is created
PrintingChoose Print or Print Range from the File menu to print the contents of the display to a printer. Choose Print Range if you want to print only a subset of the sequence numbers dis-played, or choose Print if you want to print all the output records. Note that capture must be disabled prior to printing.
The Print Range dialog box also lets you specify whether or not sequence numbers and time stamps will be printed along with the debug output. Omitting these fields can save page space if they are not necessary. The settings you choose are used in all subsequent print operations.
To prevent wrap-around when output lines are wider than a page, consider using landscape mode instead of portrait when printing.

Chapter 7 Process and Diagnostic Utilities 247
Remote MonitoringDebugView has remote monitoring capabilities that allow you to view debug output generated on remote systems. DebugView can connect to and monitor multiple remote computers and the local computer simultaneously. You can switch the view to see output from a computer by selecting it from the Computer menu as shown in Figure 7-16, or you can cycle through them by pressing Ctrl+Tab. The active computer view is identified in the title bar and by an arrow icon in the Computer menu. Alternatively, you can open each computer in a separate window and view their debug outputs simultaneously.
FIGURE7-16 DebugView monitoring two remote computers and the local computer.
To perform remote monitoring, DebugView runs in agent mode on the remote system, sending debug output it captures to a central DebugView viewer that displays the output. Typically, you will start DebugView in agent mode on the remote system manually. In some circumstances, the DebugView viewer can install and start the remote agent component automatically, but with host-based firewalls now on by default, this is usually impractical.
To begin remote monitoring, press Ctrl+R or choose Connect from the Computer menu to display a computer connection dialog box. Enter the name or IP address of the remote com-puter, or select a previously-connected computer from the drop-down list, and click OK. DebugView will try to install and start an agent on that computer; if it cannot, DebugView tries to find and connect to an already-running, manually-started agent on the computer. If its attempt is successful, DebugView begins displaying debug output received from that computer, adding the remote computer name to the title bar and to the Computer menu.
To begin monitoring the local computer, choose Connect Local from the Computer menu. Be careful not to connect multiple viewers to a single computer because the debug output will be split between those viewers.
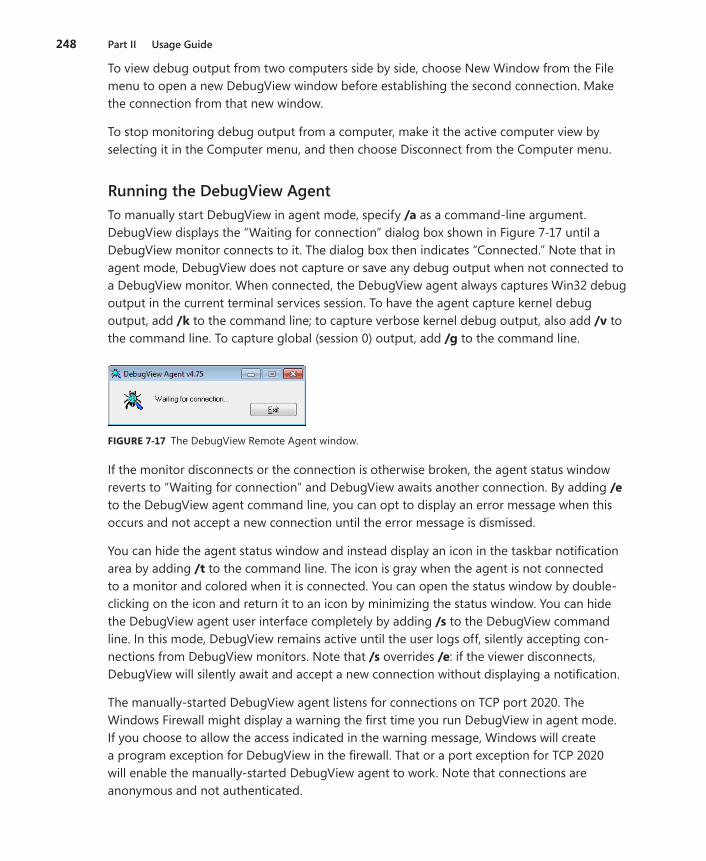
248 Part II Usage Guide
To view debug output from two computers side by side, choose New Window from the File menu to open a new DebugView window before establishing the second connection. Make the connection from that new window.
To stop monitoring debug output from a computer, make it the active computer view by selecting it in the Computer menu, and then choose Disconnect from the Computer menu.
Running the DebugView AgentTo manually start DebugView in agent mode, specify /a as a command-line argument. DebugView displays the “Waiting for connection” dialog box shown in Figure 7-17 until a DebugView monitor connects to it. The dialog box then indicates “Connected.” Note that in agent mode, DebugView does not capture or save any debug output when not connected to a DebugView monitor. When connected, the DebugView agent always captures Win32 debug output in the current terminal services session. To have the agent capture kernel debug output, add /k to the command line; to capture verbose kernel debug output, also add /v to the command line. To capture global (session 0) output, add /g to the command line.
FIGURE7-17 The DebugView Remote Agent window.
If the monitor disconnects or the connection is otherwise broken, the agent status window reverts to “Waiting for connection” and DebugView awaits another connection. By adding /e to the DebugView agent command line, you can opt to display an error message when this occurs and not accept a new connection until the error message is dismissed.
You can hide the agent status window and instead display an icon in the taskbar notification area by adding /t to the command line. The icon is gray when the agent is not connected to a monitor and colored when it is connected. You can open the status window by double-clicking on the icon and return it to an icon by minimizing the status window. You can hide the DebugView agent user interface completely by adding /s to the DebugView command line. In this mode, DebugView remains active until the user logs off, silently accepting con-nections from DebugView monitors. Note that /s overrides /e: if the viewer disconnects, DebugView will silently await and accept a new connection without displaying a notification.
The manually-started DebugView agent listens for connections on TCP port 2020. The Windows Firewall might display a warning the first time you run DebugView in agent mode. If you choose to allow the access indicated in the warning message, Windows will create a program exception for DebugView in the firewall. That or a port exception for TCP 2020 will enable the manually-started DebugView agent to work. Note that connections are anonymous and not authenticated.
Chapter 7 Process and Diagnostic Utilities 249
The agent automatically installed and started on the remote computer by the viewer is implemented as a Windows service. Therefore, it runs in terminal services session 0, where it can monitor only kernel and global Win32 debug output; it cannot monitor debug out-put from interactive user sessions outside of session 0. Also, it listens for a connection on a random high port, which isn’t practical when using a host-based firewall. In most cases, the manually started DebugView agent will generally be much more reliable and is the recommended way to monitor debug output remotely.
When using the agent automatically installed by the monitor, the state of global capture, Win32 debug capture, kernel capture, and pass-through for the newly established remote session are all adopted from the current settings of the DebugView viewer. Changes you make to these settings on the viewer take effect immediately on the monitored computer.
LiveKdLiveKd allows you to use kernel debuggers to examine a snapshot of a live system without booting the system in debugging mode. This can be useful when kernel-level troubleshoot-ing is required on a machine that wasn’t booted in debugging mode. Certain issues might be hard to reproduce, so rebooting a system can be disruptive. On top of that, booting a computer in debug mode changes how some subsystems behave, which can further compli-cate analysis. In addition to not requiring booting with debug mode enabled, LiveKd allows the Microsoft kernel debuggers to perform some actions that are not normally possible with local kernel debugging, such as creating a full memory dump file.
In addition to examining the local system, LiveKd supports the debugging of Hyper-V guest virtual machines (VMs) externally from the Hyper-V host. In this mode, the debugger runs on the Hyper-V host and not on the guest VMs, so there is no need to copy any files to the target VM or configure the VM in any way.
LiveKd creates a snapshot dump file of kernel memory, without actually stopping the kernel while the snapshot is captured. LiveKd then presents this simulated dump file to the kernel debugger of your choosing. You can then use the debugger to perform any operations on this snapshot of live kernel memory that you could on any normal dump file.
Because LiveKd relies on physical memory to back the simulated dump, the kernel debugger might run into situations in which data structures are in the middle of being changed by the system and are inconsistent. Each time the debugger is launched, it starts with a fresh view of the system state. If you want to refresh the snapshot, quit the debugger (with the q com-mand), and LiveKd will ask you whether you want to start it again. If the debugger enters a loop in printing output, press Ctrl+C to interrupt the output, quit, and rerun it. If it hangs, press Ctrl+Break, which will terminate the debugger process and ask you whether you want to run the debugger again.
250 Part II Usage Guide
LiveKd RequirementsLiveKd supports all x86 and x64 versions of Windows. It must be run with administrative rights, including the Debug privilege.
LiveKd depends on the Debugging Tools for Windows, which must be installed on the same machine before you run LiveKd. The URL for the Debugging Tools for Windows is http://www.microsoft.com/whdc/devtools/debugging/default.mspx. The Debugging Tools installer used to be a standalone download, but it is now incorporated into the Windows SDK. To get the Debugging Tools, you must run the SDK installer and select the Debugging Tools options you want. Among the options are the Debugging Tools redistributables, which are the standalone Debugging Tools installers, available for x86, x64, and IA64. These work well if you want to install the Debugging Tools on other machines without running the SDK installer.
LiveKd requires that kernel symbol files be available. These can be downloaded as needed from the Microsoft public symbol server. If the system to be analyzed does not have an Internet connection, see the “Online Kernel Memory Dump Using LiveKd” sidebar to learn how to acquire the necessary symbol files.
Running LiveKdThe LiveKd command-line syntax is
livekd [-w | -k debugger-path | -o dumpfile] [[-hvl] | [-hv VMName][-p]] [debugger options]
Table 7-3 summarizes the LiveKd command-line options, which are then discussed in more detail.
TABLE7-3 LiveKdCommand-LineOptions
Option Description–w Runs WinDbg.exe instead of Kd.exe
–k debugger-path Runs the specified debugger instead of Kd.exe
–o dumpfile Saves a kernel dump to the dumpfile instead of launching a debugger
–hvl From Hyper-V host, lists the GUIDs and names of available guest VMs
–hv VMName From Hyper-V host, debugs the VM identified by GUID or name
–p From Hyper-V host, pauses the target VM while capturing the dump (recommended for use with –o)
debugger options Additional command-line options to pass to the kernel debugger
Chapter 7 Process and Diagnostic Utilities 251
By default, LiveKd takes a snapshot of the local computer and runs Kd.exe. The –w and –k options let you specify WinDbg.exe or any other debugger instead of Kd.exe. LiveKd passes any additional command-line options that you specify on to the debugger, followed by –z and the path to the simulated dump file.
To debug a Hyper-V virtual machine from the host, specify –hv and either the friendly name or the GUID of the VM. To list the names and GUIDs of the available VMs, run LiveKd with the –hvl option. Note that you can debug only one VM on a host at a time.
With the –o option, LiveKd just saves a kernel dump of the target system to the specified dumpfile and doesn’t launch a debugger. This option is useful for capturing system dumps for offline analysis. If the target is a Hyper-V VM, you can also add –p to the command line to pause the VM while the snapshot is being captured in order to get a completely consistent snapshot.
If you are launching a debugger and don’t specify –k and a path to a debugger, LiveKd will find Kd.exe or WinDbg.exe if it is in one of the following locations:
■ The current directory when you start LiveKd
■ The same directory as LiveKd
■ The default installation path for the Debugging Tools (“%ProgramFiles%\Debugging Tools for Windows (x86)” on x86 or “%ProgramFiles%\Debugging Tools for Windows (x64)” on x64)
■ A directory specified in the PATH variable
If the _NT_SYMBOL_PATH environment variable has not been configured, LiveKd will ask if you want it to configure the system to use Microsoft’s symbol server, and then it will ask for the local folder in which to download symbol files (C:\Symbols by default).
Refer to the Debugging Tools documentation regarding how to use the kernel debuggers.
Note The debugger will complain that it can’t find symbols for LiveKdD.SYS. This is expected because I have not made symbols for LiveKdD.SYS available. The lack of these symbols does not affect the behavior of the debugger.
LiveKd ExamplesThis command line debugs a snapshot of the local computer, passing parameters to WinDbg to write a log file and not to display the Save Workspace? dialog box:
livekd -w -Q -logo C:\dbg.txt
252 Part II Usage Guide
This command line captures a kernel dump of the local computer and does not launch a debugger:
livekd -o C:\snapshot.dmp
When run on a Hyper-V host, this command lists the virtual machines available for debugging; it then shows sample output:
C:\>livekd -hvl Listing active Hyper-V partitions... Hyper-V VM GUID Partition ID VM Name ------------------------------------ ------------ ------- 3187CB6B-1C8B-4968-A501-C8C22468AB77 29 WinXP x86 (SP3) 9A489D58-E69A-48BF-8747-149344164B76 30 Win7 Ultimate x86 DFA26971-62D7-4190-9ED0-61D1B910466B 28 Win7 Ultimate x64
You can then use either a GUID or a VM name from the listing to specify the VM to debug. This command pauses the “Win7 Ultimate x64” VM from the example and captures a kernel dump of that system, resuming the VM after the dump has been captured:
livekd -p -o C:\snapshot.dmp -hv DFA26971-62D7-4190-9ED0-61D1B910466B
Finally, this command debugs a snapshot of the “WinXP x86 (SP3)” VM using Kd.exe:
livekd -hv "WinXP x86 (SP3)"
OnlineKernelMemoryDumpUsingLiveKdHow many times have you had to acquire a kernel memory dump, but you or your customer (quite rightly) refused to have the target system attached to the Internet, preventing the downloading of required symbol files? I have had that dubious pleasure far too often, so I decided to write down the process for my future reference.
The key problem is that you need to get the correct symbol files for the kernel memory dump. At a minimum, you must have symbols for Ntoskrnl.exe. Just downloading the symbol file packages from WHDC or MSDN for your operating system and service pack version is not quite good enough, because files and corresponding symbols might have been changed by updates since the service pack was released.
Here is the process I follow:
■ Copy Ntoskrnl.exe and any other files for which you want symbols from the System32 folder on the computer to be debugged to a folder (for example, C:\DebugFiles) on a computer with Internet access.
■ Install the Debugging Tools for Windows on the Internet-facing system.
Chapter 7 Process and Diagnostic Utilities 253
■ From a command prompt on that system, run Symchk to download symbols for the files you selected into a new folder. The command might look like this:
symchk /if C:\DebugFiles\*.* /s srv*C:\DebugSymbols*http://msdl.microsoft.com/download/symbols
■ Copy the downloaded symbols (for example, the C:\DebugSymbols folder in the previous example) from the Internet-facing system to the original system.
■ Install the Debugging Tools for Windows on the computer from which you require a kernel memory dump, and copy LiveKd.exe into the same folder with the debuggers. Add this folder to the PATH.
■ With administrator privileges, open a command prompt and set the environ-ment variable _NT_SYMBOL_PATH to the folder containing symbol files. For example:
SET _NT_SYMBOL_PATH=C:\DebugSymbols
■ At the command prompt, run LiveKd-w-QtostartWinDbg.
■ When the WinDbg prompt appears, type the following command to create a full memory dump:
.dump /f c:\memory.dmp
You need to make sure there is enough space on this drive.
■ Type q to quit WinDbg and then n to quit LiveKd.
You should find the full memory dump in C:\memory.dmp, which you can compress and deliver for analysis.
Note This sidebar is adapted from a blog post by Carl Harrison. Carl’s blog is at http://blogs.technet.com/carlh.
ListDLLsListDLLs is a console utility that displays information about DLLs loaded in processes on the local computer. It can show you all DLLs in use throughout the system or in specific pro-cesses, and it can let you search for processes that have a specific DLL loaded. It is also useful for verifying which version of a DLL a process has loaded and from what path. It can also flag DLLs that have been relocated from their preferred base address or that have been replaced after they have been loaded.
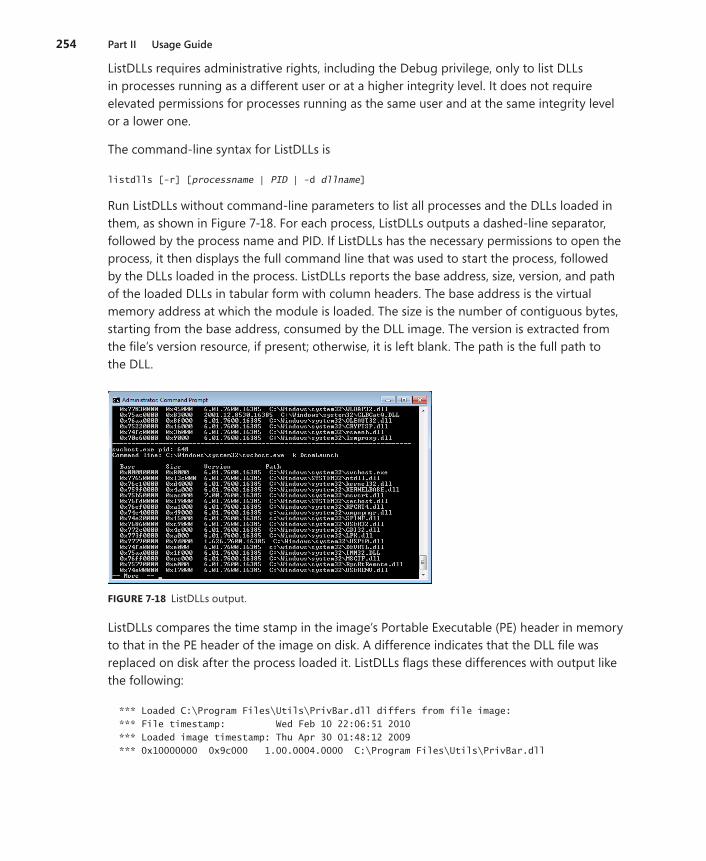
254 Part II Usage Guide
ListDLLs requires administrative rights, including the Debug privilege, only to list DLLs in processes running as a different user or at a higher integrity level. It does not require elevated permissions for processes running as the same user and at the same integrity level or a lower one.
The command-line syntax for ListDLLs is
listdlls [-r] [processname | PID | -d dllname]
Run ListDLLs without command-line parameters to list all processes and the DLLs loaded in them, as shown in Figure 7-18. For each process, ListDLLs outputs a dashed-line separator, followed by the process name and PID. If ListDLLs has the necessary permissions to open the process, it then displays the full command line that was used to start the process, followed by the DLLs loaded in the process. ListDLLs reports the base address, size, version, and path of the loaded DLLs in tabular form with column headers. The base address is the virtual memory address at which the module is loaded. The size is the number of contiguous bytes, starting from the base address, consumed by the DLL image. The version is extracted from the file’s version resource, if present; otherwise, it is left blank. The path is the full path to the DLL.
FIGURE7-18 ListDLLs output.
ListDLLs compares the time stamp in the image’s Portable Executable (PE) header in memory to that in the PE header of the image on disk. A difference indicates that the DLL file was replaced on disk after the process loaded it. ListDLLs flags these differences with output like the following:
*** Loaded C:\Program Files\Utils\PrivBar.dll differs from file image: *** File timestamp: Wed Feb 10 22:06:51 2010 *** Loaded image timestamp: Thu Apr 30 01:48:12 2009 *** 0x10000000 0x9c000 1.00.0004.0000 C:\Program Files\Utils\PrivBar.dll
Chapter 7 Process and Diagnostic Utilities 255
ListDLLs reports only DLLs that are loaded as executable images. Unlike Process Explorer’s DLL View (discussed in Chapter 3), it does not list DLLs or other files or file mappings loaded by the image loader as data, including DLLs that are loaded for resources only.
The –r option flags DLLs that have been relocated to a different virtual memory address from the base address specified in the image.2 With –r specified, a DLL that has been relocated will be preceded in the output with a line reporting the relocation and the image base address. The following example output shows webcheck.dll with an image base address of 0x00400000 but loaded at 0x01a50000:
### Relocated from base of 0x00400000: 0x01a50000 0x3d000 8.00.6001.18702 C:\WINDOWS\system32\webcheck.dll
To limit which processes are listed in the output, specify a process name or PID on the command line. If you specify a process name, ListDLLs reports only on processes with an image name that matches or begins with the name you specify. For example, to list the DLLs loaded by all instances of Internet Explorer, run the following command:
listdlls iexplore.exe
ListDLLs will show each iexplore.exe process and the DLLs loaded in each. If you specify a PID, ListDLLs shows the DLLs in that one process.
To identify the processes that have a particular DLL loaded, add –d to the command line followed by the full or partial name of the DLL. ListDLLs searches all processes that it has permission to open and inspect the full path of each of its DLLs. If the name you specified appears anywhere in the path of a loaded DLL, ListDLLs outputs the information for the process and for the matching DLLs. For example, to search for all processes that have loaded Crypt32.dll, run the following command:
listdlls -d crypt32
You can use this option not only to search for DLLs by name, but for folder locations as well. To list all DLLs that have been loaded from the Program Files folder hierarchy, you can run this command:
listdlls -d "program files"
2 With Address Space Layout Randomization (ASLR), introduced in Windows Vista, an ASLR-compatible DLL’s base address is changed at first load after each boot. ListDLLs reports a DLL as relocated only if it is loaded in a pro-cess to a different address from its preferred ASLR address in that boot session because of a conflict with another module.
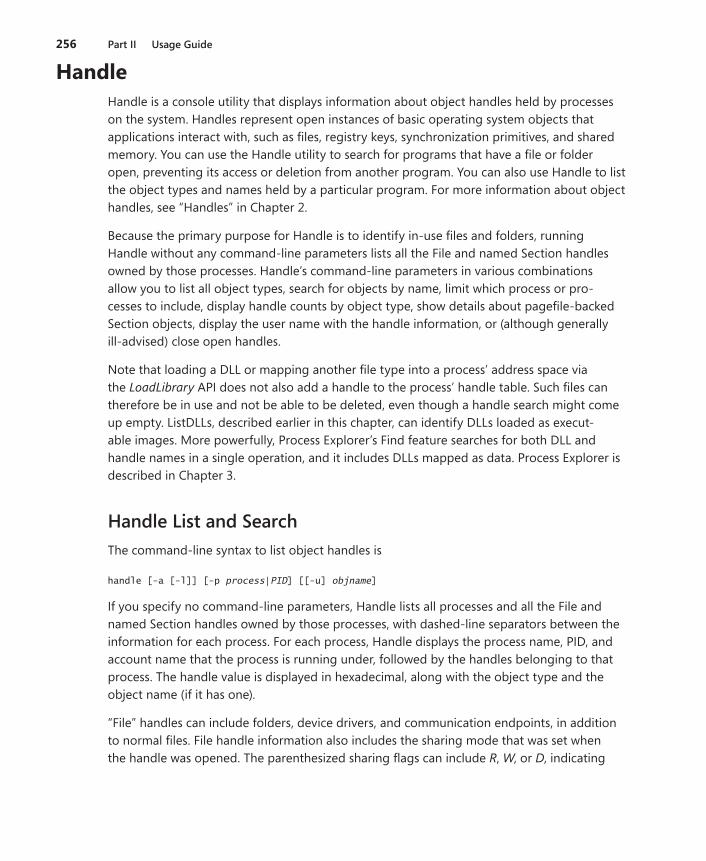
256 Part II Usage Guide
HandleHandle is a console utility that displays information about object handles held by processes on the system. Handles represent open instances of basic operating system objects that applications interact with, such as files, registry keys, synchronization primitives, and shared memory. You can use the Handle utility to search for programs that have a file or folder open, preventing its access or deletion from another program. You can also use Handle to list the object types and names held by a particular program. For more information about object handles, see “Handles” in Chapter 2.
Because the primary purpose for Handle is to identify in-use files and folders, running Handle without any command-line parameters lists all the File and named Section handles owned by those processes. Handle’s command-line parameters in various combinations allow you to list all object types, search for objects by name, limit which process or pro-cesses to include, display handle counts by object type, show details about pagefile-backed Section objects, display the user name with the handle information, or (although generally ill- advised) close open handles.
Note that loading a DLL or mapping another file type into a process’ address space via the LoadLibrary API does not also add a handle to the process’ handle table. Such files can therefore be in use and not be able to be deleted, even though a handle search might come up empty. ListDLLs, described earlier in this chapter, can identify DLLs loaded as execut-able images. More powerfully, Process Explorer’s Find feature searches for both DLL and handle names in a single operation, and it includes DLLs mapped as data. Process Explorer is described in Chapter 3.
Handle List and SearchThe command-line syntax to list object handles is
handle [-a [-l]] [-p process|PID] [[-u] objname]
If you specify no command-line parameters, Handle lists all processes and all the File and named Section handles owned by those processes, with dashed-line separators between the information for each process. For each process, Handle displays the process name, PID, and account name that the process is running under, followed by the handles belonging to that process. The handle value is displayed in hexadecimal, along with the object type and the object name (if it has one).
“File” handles can include folders, device drivers, and communication endpoints, in addition to normal files. File handle information also includes the sharing mode that was set when the handle was opened. The parenthesized sharing flags can include R, W, or D, indicating
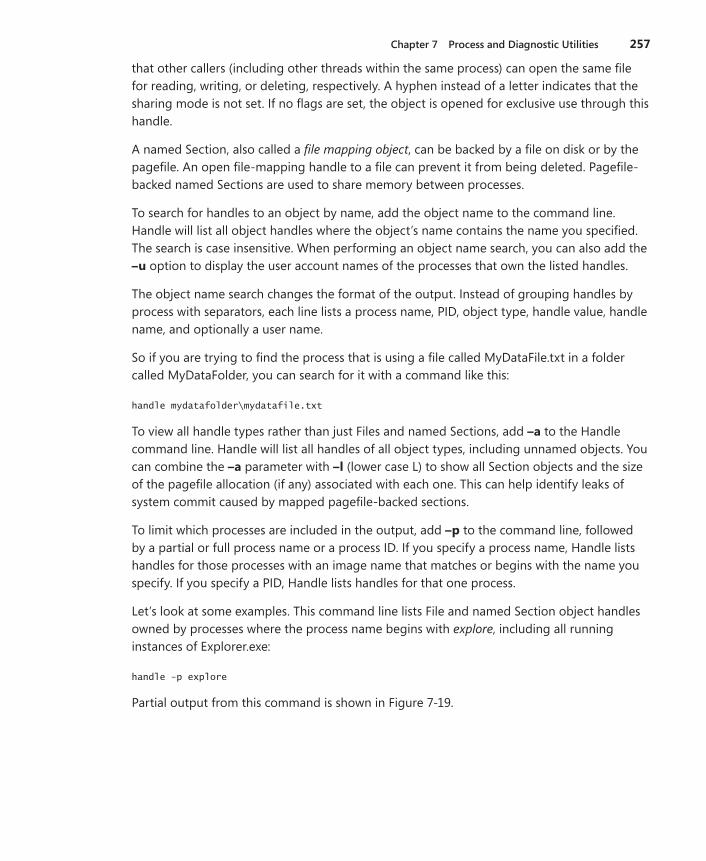
Chapter 7 Process and Diagnostic Utilities 257
that other callers (including other threads within the same process) can open the same file for reading, writing, or deleting, respectively. A hyphen instead of a letter indicates that the sharing mode is not set. If no flags are set, the object is opened for exclusive use through this handle.
A named Section, also called a file mapping object, can be backed by a file on disk or by the pagefile. An open file-mapping handle to a file can prevent it from being deleted. Pagefile-backed named Sections are used to share memory between processes.
To search for handles to an object by name, add the object name to the command line. Handle will list all object handles where the object’s name contains the name you specified. The search is case insensitive. When performing an object name search, you can also add the –u option to display the user account names of the processes that own the listed handles.
The object name search changes the format of the output. Instead of grouping handles by process with separators, each line lists a process name, PID, object type, handle value, handle name, and optionally a user name.
So if you are trying to find the process that is using a file called MyDataFile.txt in a folder called MyDataFolder, you can search for it with a command like this:
handle mydatafolder\mydatafile.txt
To view all handle types rather than just Files and named Sections, add –a to the Handle command line. Handle will list all handles of all object types, including unnamed objects. You can combine the –a parameter with –l (lower case L) to show all Section objects and the size of the pagefile allocation (if any) associated with each one. This can help identify leaks of system commit caused by mapped pagefile-backed sections.
To limit which processes are included in the output, add –p to the command line, followed by a partial or full process name or a process ID. If you specify a process name, Handle lists handles for those processes with an image name that matches or begins with the name you specify. If you specify a PID, Handle lists handles for that one process.
Let’s look at some examples. This command line lists File and named Section object handles owned by processes where the process name begins with explore, including all running instances of Explorer.exe:
handle -p explore
Partial output from this command is shown in Figure 7-19.
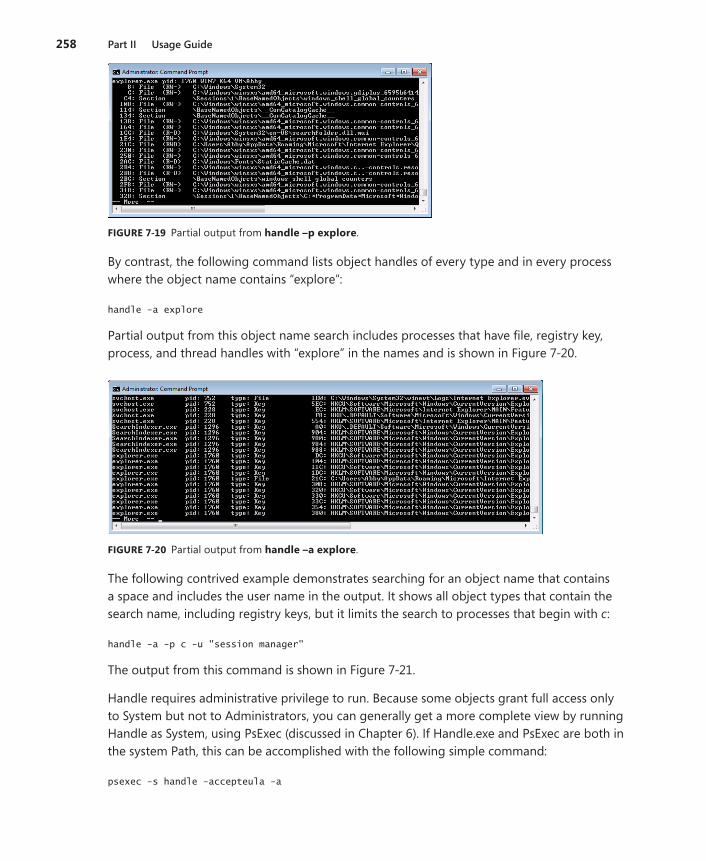
258 Part II Usage Guide
FIGURE7-19 Partial output from handle–pexplore.
By contrast, the following command lists object handles of every type and in every process where the object name contains “explore”:
handle -a explore
Partial output from this object name search includes processes that have file, registry key, process, and thread handles with “explore” in the names and is shown in Figure 7-20.
FIGURE7-20 Partial output from handle–aexplore.
The following contrived example demonstrates searching for an object name that contains a space and includes the user name in the output. It shows all object types that contain the search name, including registry keys, but it limits the search to processes that begin with c:
handle -a -p c -u "session manager"
The output from this command is shown in Figure 7-21.
Handle requires administrative privilege to run. Because some objects grant full access only to System but not to Administrators, you can generally get a more complete view by running Handle as System, using PsExec (discussed in Chapter 6). If Handle.exe and PsExec are both in the system Path, this can be accomplished with the following simple command:
psexec -s handle -accepteula -a
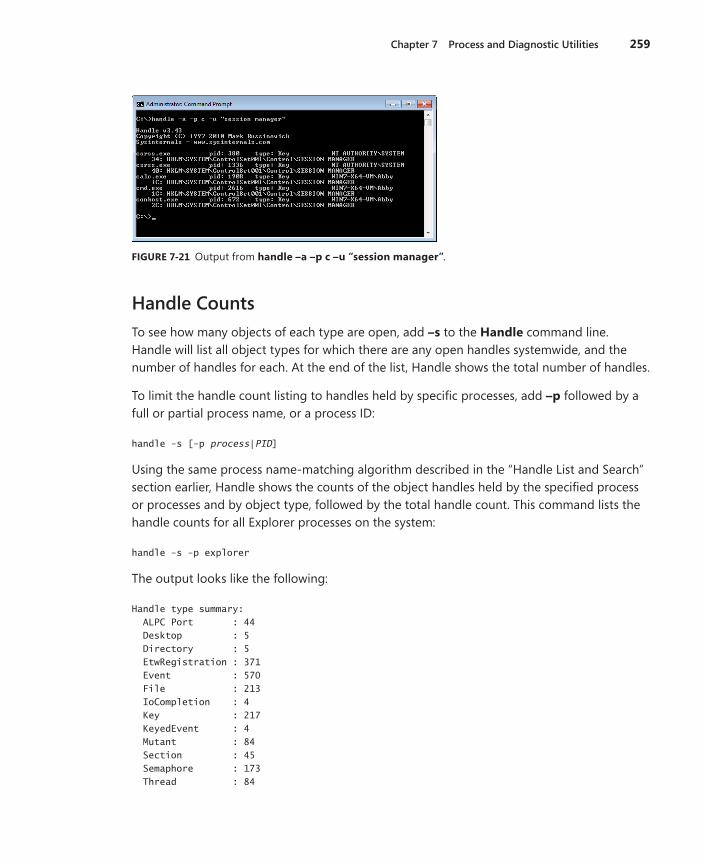
Chapter 7 Process and Diagnostic Utilities 259
FIGURE7-21Output from handle–a–pc–u“sessionmanager”.
Handle CountsTo see how many objects of each type are open, add –s to the Handle command line. Handle will list all object types for which there are any open handles systemwide, and the number of handles for each. At the end of the list, Handle shows the total number of handles.
To limit the handle count listing to handles held by specific processes, add –p followed by a full or partial process name, or a process ID:
handle -s [-p process|PID]
Using the same process name-matching algorithm described in the “Handle List and Search” section earlier, Handle shows the counts of the object handles held by the specified process or processes and by object type, followed by the total handle count. This command lists the handle counts for all Explorer processes on the system:
handle -s -p explorer
The output looks like the following:
Handle type summary: ALPC Port : 44 Desktop : 5 Directory : 5 EtwRegistration : 371 Event : 570 File : 213 IoCompletion : 4 Key : 217 KeyedEvent : 4 Mutant : 84 Section : 45 Semaphore : 173 Thread : 84
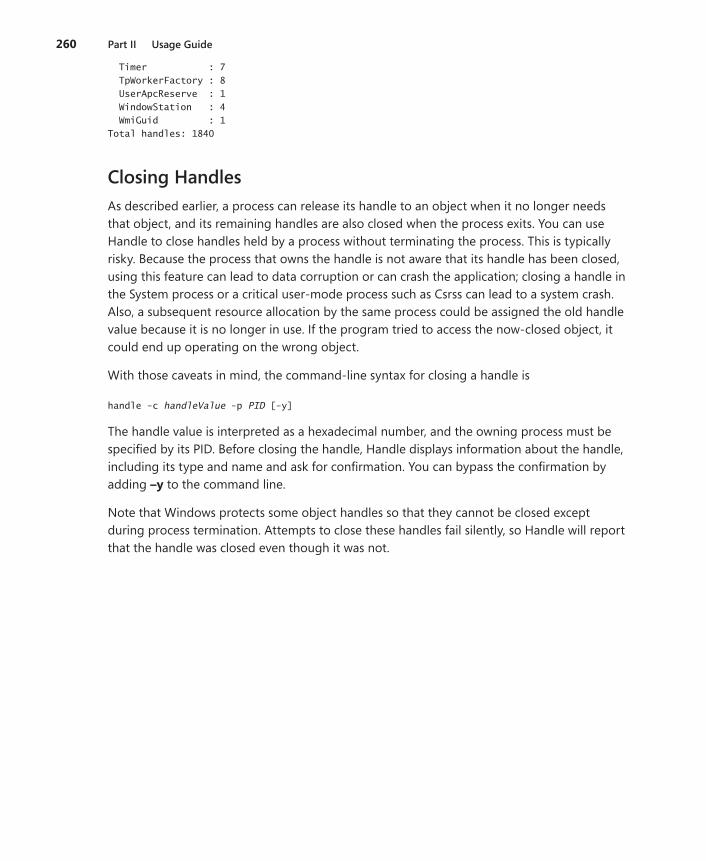
260 Part II Usage Guide
Timer : 7 TpWorkerFactory : 8 UserApcReserve : 1 WindowStation : 4 WmiGuid : 1 Total handles: 1840
Closing HandlesAs described earlier, a process can release its handle to an object when it no longer needs that object, and its remaining handles are also closed when the process exits. You can use Handle to close handles held by a process without terminating the process. This is typically risky. Because the process that owns the handle is not aware that its handle has been closed, using this feature can lead to data corruption or can crash the application; closing a handle in the System process or a critical user-mode process such as Csrss can lead to a system crash. Also, a subsequent resource allocation by the same process could be assigned the old handle value because it is no longer in use. If the program tried to access the now-closed object, it could end up operating on the wrong object.
With those caveats in mind, the command-line syntax for closing a handle is
handle -c handleValue -p PID [-y]
The handle value is interpreted as a hexadecimal number, and the owning process must be specified by its PID. Before closing the handle, Handle displays information about the handle, including its type and name and ask for confirmation. You can bypass the confirmation by adding –y to the command line.
Note that Windows protects some object handles so that they cannot be closed except during process termination. Attempts to close these handles fail silently, so Handle will report that the handle was closed even though it was not.
261
Chapter 8
Security UtilitiesThis chapter describes a set of Sysinternals utilities focused on Microsoft Windows security management and operations:
■ SigCheck is a console utility for verifying file digital signatures, listing file hashes, and viewing version information
■ AccessChk is a console utility for searching for objects—such as files, registry keys, and services—that grant permissions to specific users or groups, as well as providing detailed information on permissions granted.
■ AccessEnum is a GUI utility that searches a file or registry hierarchy and identifies where permissions might have been changed.
■ ShareEnum is a GUI utility that enumerates file and printer shares on your network and who can access them.
■ ShellRunAs is a shell extension that restores the ability to run a program under a different user account on Windows Vista.
■ Autologon is a GUI utility that lets you configure a user account for automatic logon when the system boots.
■ LogonSessions is a console utility that enumerates active Local Security Authority (LSA) logon sessions on the current computer.
■ SDelete is a console utility for securely deleting files or folder structures and erasing data in unallocated areas of the hard drive.
SigCheckSigCheck is a multipurpose console utility for performing security-related functions on one or more files or a folder hierarchy. Its primary purpose is to verify whether files are digitally signed with a trusted certificate. As Figure 8-1 shows, SigCheck can also report catalog and image signer information, calculate file hashes using several hash algorithms, and display extended version information. It can also display a file’s embedded manifest, scan folders for unsigned files, and report results in comma-separated value (CSV) format.
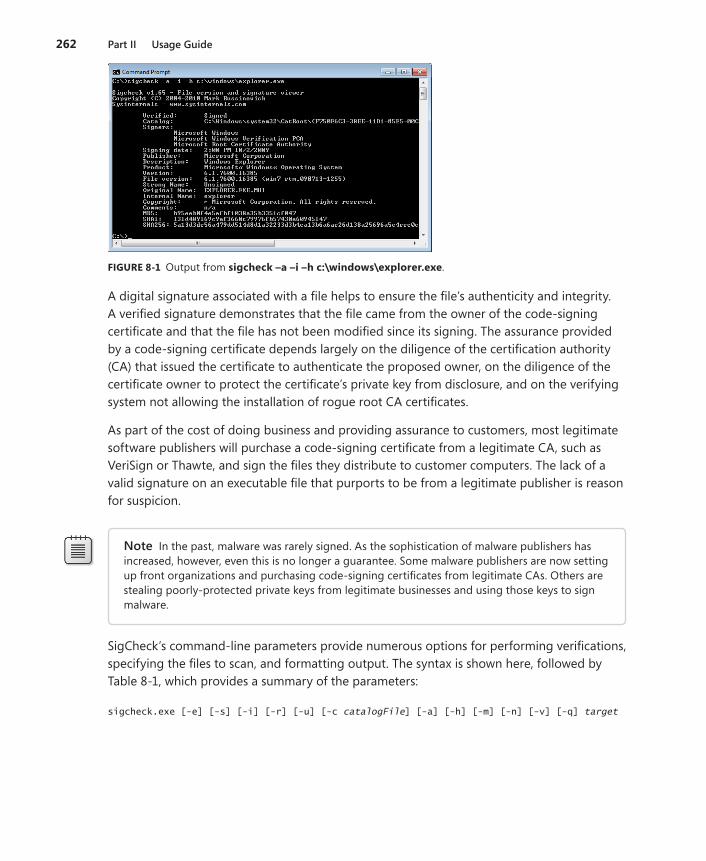
262 Part II Usage Guide
FIGURE8-1Output from sigcheck–a–i–hc:\windows\explorer.exe.
A digital signature associated with a file helps to ensure the file’s authenticity and integrity. A verified signature demonstrates that the file came from the owner of the code-signing certificate and that the file has not been modified since its signing. The assurance provided by a code-signing certificate depends largely on the diligence of the certification authority (CA) that issued the certificate to authenticate the proposed owner, on the diligence of the certificate owner to protect the certificate’s private key from disclosure, and on the verifying system not allowing the installation of rogue root CA certificates.
As part of the cost of doing business and providing assurance to customers, most legitimate software publishers will purchase a code-signing certificate from a legitimate CA, such as VeriSign or Thawte, and sign the files they distribute to customer computers. The lack of a valid signature on an executable file that purports to be from a legitimate publisher is reason for suspicion.
Note In the past, malware was rarely signed. As the sophistication of malware publishers has increased, however, even this is no longer a guarantee. Some malware publishers are now setting up front organizations and purchasing code-signing certificates from legitimate CAs. Others are stealing poorly-protected private keys from legitimate businesses and using those keys to sign malware.
SigCheck’s command-line parameters provide numerous options for performing verifications, specifying the files to scan, and formatting output. The syntax is shown here, followed by Table 8-1, which provides a summary of the parameters:
sigcheck.exe [-e] [-s] [-i] [-r] [-u] [-c catalogFile] [-a] [-h] [-m] [-n] [-v] [-q] target
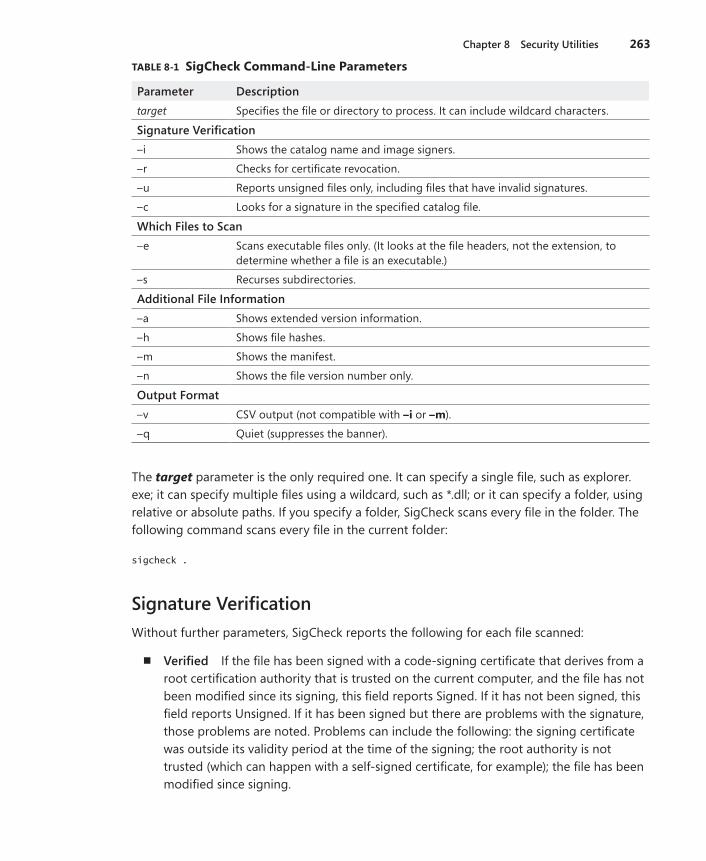
Chapter 8 Security Utilities 263
TABLE8-1 SigCheckCommand-LineParameters
Parameter Descriptiontarget Specifies the file or directory to process. It can include wildcard characters.
Signature Verification–i Shows the catalog name and image signers.
–r Checks for certificate revocation.
–u Reports unsigned files only, including files that have invalid signatures.
–c Looks for a signature in the specified catalog file.
Which Files to Scan–e Scans executable files only. (It looks at the file headers, not the extension, to
determine whether a file is an executable.)
–s Recurses subdirectories.
Additional File Information–a Shows extended version information.
–h Shows file hashes.
–m Shows the manifest.
–n Shows the file version number only.
Output Format–v CSV output (not compatible with –i or –m).
–q Quiet (suppresses the banner).
The target parameter is the only required one. It can specify a single file, such as explorer.exe; it can specify multiple files using a wildcard, such as *.dll; or it can specify a folder, using relative or absolute paths. If you specify a folder, SigCheck scans every file in the folder. The following command scans every file in the current folder:
sigcheck .
Signature VerificationWithout further parameters, SigCheck reports the following for each file scanned:
■ Verified If the file has been signed with a code-signing certificate that derives from a root certification authority that is trusted on the current computer, and the file has not been modified since its signing, this field reports Signed. If it has not been signed, this field reports Unsigned. If it has been signed but there are problems with the signature, those problems are noted. Problems can include the following: the signing certificate was outside its validity period at the time of the signing; the root authority is not trusted (which can happen with a self-signed certificate, for example); the file has been modified since signing.
264 Part II Usage Guide
■ Signing date Shows the date on which the file was signed. This field shows n/a if the file has not been signed.
■ Publisher The Company Name field from the file’s version resource, if found.
■ Description The Description field from the file’s version resource, if found.
■ Product The Product Name field from the file’s version resource, if found.
■ Version The Product Version field from the file’s version resource, if found. Note that this is from the string portion of the version resource, not the binary value that is used for version comparison.
■ File version The File Version field from the file’s version resource, if found. Note that this, too, is from the string portion of the version resource.
To show additional signature details, add –i to the command line. Using this parameter shows the following two additional fields if the file’s signature is valid:
■ Catalog Reports the file in which the signature is stored. In many cases, the file indicated will be the same as the file that was signed. However, if the file was catalog-signed, the signature will be stored in a separate, signed catalog file. Many files that ship with Windows are catalog-signed. Catalog-signing can improve performance in some cases, but it’s particularly useful for signing nonexecutable files that have a file format that does not support embedding signature information.
■ Signers Shows the Subject CN name from the code-signing certificate and from the CA certificates in its chain.
By default, SigCheck does not check whether the signing certificate has been revoked by its issuer. To verify that the signing certificate and the certificates in its chain have not been revoked, add –rto the command line. Note that revocation checking can add significant net-work latency to the signature check, because SigCheck has to query certificate revocation list (CRL) distribution points.
To focus your search only for unsigned files, add –u to the command line. SigCheck then scans all specified files, but it reports only those that are not signed or that have signatures that cannot be verified.
Windows maintains a database of signature catalogs to enable quick lookup of signature information based on a file hash. If you want to verify a file against a catalog file that is not registered in the database, specify the catalog file on the SigCheck command line with the –c option.
Which Files to ScanMost nonexecutable files are not digitally signed with code-signing certificates. Some nonexecutable files that ship with Windows and that are never modified might be
Chapter 8 Security Utilities 265
catalog-signed, but data files that can be updated—including initialization files, registry hive backing files, document files, and temporary files—are never code-signed. If you scan a folder that contains a large number of such files, you might have difficulty finding the unsigned executable files that are usually of greater interest. To filter out these false positives, you could search just for *.exe, then *.dll, then *.ocx, then *.scr, and so on. The problem with that approach isn’t all the extra work or that you might miss an important extension. The problem is that an executable file with a .tmp extension, or any other extension, or no exten-sion at all can still be launched! And malware authors often hide their files from inspection by masquerading under apparently innocuous file extensions.
So instead of filtering on file extensions, add –e to the SigCheck command line to scan only executable files. When you do, SigCheck will verify whether the file is an executable before verifying its signature and ignore the file if it’s not. Specifically, SigCheck checks whether the first two bytes are MZ. All 16-bit, 32-bit, and 64-bit Windows executables—including applications, DLLs, and system drivers—begin with these bytes. SigCheck ignores the file extension, so executables masquerading under other file extensions still get scanned.
To search a folder hierarchy instead of a single folder, add –s to the SigCheck command line. SigCheck then scans files matching the target parameter in the folder specified by target parameter (or in the current folder if target doesn’t specify a folder) and in all subfolders. The following command scans all *.dll files in and under the C:\Program Files folder:
sigcheck -s "c:\program files\*.dll"
Additional File InformationAdd the –a option to extract additional information from every file scanned. Adding –a augments the SigCheck output with these fields:
■ Strong Name If the file is a .NET assembly and has a strong-name signature, this field reports Signed; otherwise, it shows Unsigned. (.NET’s strong-name signing is independent of certificate-based code-signing and does not imply any level of trust.
■ Original Name The Original Name field from the file’s version resource, if found.
■ Internal Name The Internal Name field from the file’s version resource, if found.
■ Copyright The Copyright field from the file’s version resource, if found.
■ Comments The Comments field from the file’s version resource, if found.
A hash is a statistically unique value generated from a block of data using a cryptographic algorithm, such that a small change in the data results in a completely different hash. Because a good hash algorithm makes it computationally infeasible using today’s technology to modify the data without modifying the hash, hashes can be used to detect changes to data from corruption or tampering. If you add the –h option, SigCheck calculates and
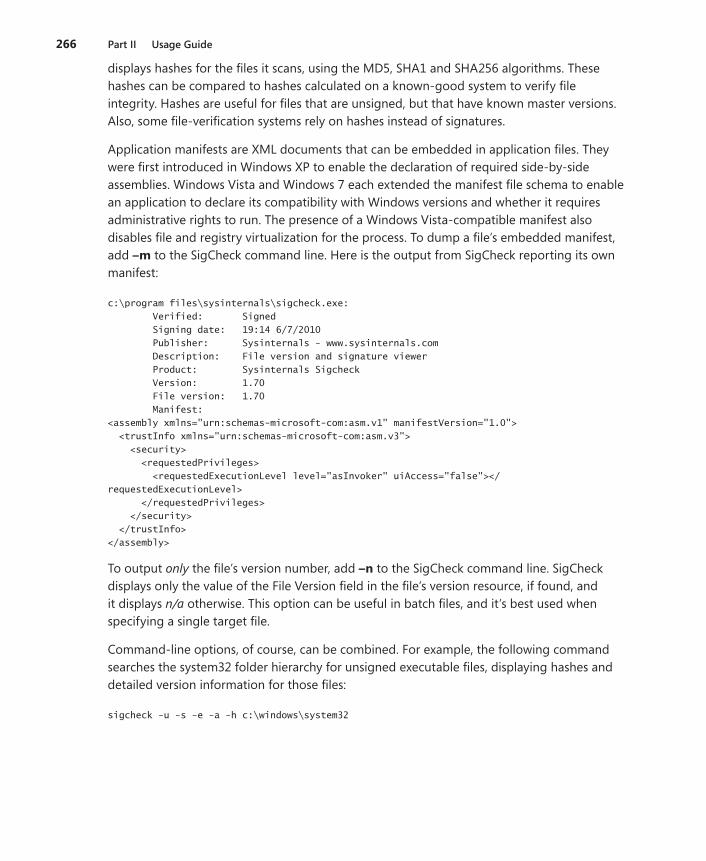
266 Part II Usage Guide
displays hashes for the files it scans, using the MD5, SHA1 and SHA256 algorithms. These hashes can be compared to hashes calculated on a known-good system to verify file integrity. Hashes are useful for files that are unsigned, but that have known master versions. Also, some file-verification systems rely on hashes instead of signatures.
Application manifests are XML documents that can be embedded in application files. They were first introduced in Windows XP to enable the declaration of required side-by-side assemblies. Windows Vista and Windows 7 each extended the manifest file schema to enable an application to declare its compatibility with Windows versions and whether it requires administrative rights to run. The presence of a Windows Vista-compatible manifest also disables file and registry virtualization for the process. To dump a file’s embedded manifest, add –m to the SigCheck command line. Here is the output from SigCheck reporting its own manifest:
c:\program files\sysinternals\sigcheck.exe: Verified: Signed Signing date: 19:14 6/7/2010 Publisher: Sysinternals - www.sysinternals.com Description: File version and signature viewer Product: Sysinternals Sigcheck Version: 1.70 File version: 1.70 Manifest: <assembly xmlns="urn:schemas-microsoft-com:asm.v1" manifestVersion="1.0"> <trustInfo xmlns="urn:schemas-microsoft-com:asm.v3"> <security> <requestedPrivileges> <requestedExecutionLevel level="asInvoker" uiAccess="false"></requestedExecutionLevel> </requestedPrivileges> </security> </trustInfo> </assembly>
To output only the file’s version number, add –n to the SigCheck command line. SigCheck displays only the value of the File Version field in the file’s version resource, if found, and it displays n/a otherwise. This option can be useful in batch files, and it’s best used when specifying a single target file.
Command-line options, of course, can be combined. For example, the following command searches the system32 folder hierarchy for unsigned executable files, displaying hashes and detailed version information for those files:
sigcheck -u -s -e -a -h c:\windows\system32
Chapter 8 Security Utilities 267
Output FormatSigCheck normally displays its output as a formatted list, as shown in Figure 8-1. To report output as comma-separated values (CSVs) to enable import into a spreadsheet or database, add –v to the SigCheck command line. SigCheck outputs column headers according to the file information you requested through other command-line options, followed by a line of comma-separated values for each file scanned. Note that the –v option cannot be used with the –i or –m option.
You can suppress the display of the SigCheck banner with the –q option. Removing these lines can help with batch-file processing of SigCheck output as well as with CSV output.
AccessChkAccessChk is a console utility that reports effective permissions on securable objects, account rights for a user or group, or token details for a process. It can search folder or registry hierarchies for objects with read or write permissions granted (or not granted) to a user or group, or it can display the raw access control list for securable objects.
What Are “Effective Permissions”?Effective permissions are permissions that a user or group has on an object, taking into account group memberships, as well as permissions that might be specifically denied. For example, consider the C:\Documents and Settings folder on a Windows 7 computer, which is actually a junction that exists for application compatibility purposes. It grants full control to Administrators and to System, and Read permissions to Everyone. However, it also specifically denies List Folder permissions to Everyone. If MYDOMAIN\Abby is a member of Administrators, Abby’s effective permissions include all permissions except for List Folder; if MYDOMAIN\Abby is a regular user, and thus an implicit member of Everyone, Abby’s permissions include just the Read permissions except List Folder.
Windows includes the Effective Permissions Tool in the Advanced Security Settings dialog box that is displayed by clicking the Advanced button in the permissions editor for some object types. The Effective Permissions Tool calculates and displays the effective permis-sions for a specified user or group on the selected object. AccessChk uses the same APIs as Windows and can perform the same calculations, but for many more object types and in a scriptable utility. AccessChk can report permissions for files, folders, registry keys, processes, and any object type defined in the Windows object manager namespace, such as directories, sections and semaphores.
268 Part II Usage Guide
Note that the “effective permissions” determination in Windows is only an approximation of the actual permissions that a logged-on user would have. Actual permissions might be different because permissions can be granted or denied based on how a user logs on (for example, interactively or as a service); logon types are not included in the effective permis-sions calculation. Share permissions, and local group memberships and privileges are not taken into account when calculating permissions on remote objects. In addition, there can be anomalies with the inclusion or exclusion of built-in local groups (See Knowledge Base article 323309 at http://support.microsoft.com/kb/323309.) In particular, I recently came across an undocumented bug involving calculation of permissions for the Administrators group. And finally, effective permissions can depend on the ability of the user performing the calcula-tions to read information about the target user from Active Directory. (See Knowledge Base article 331951 at http://support.microsoft.com/kb/331951.)
Using AccessChkThe basic syntax of AccessChk is
accesschk [options] [user-or-group] objectname
The objectname parameter is the securable object to analyze. If the object is a container, such as a file system folder or a registry key, AccessChk will report on each object in that container instead of on the object itself. If you specify the optional user-or-group parameter, AccessChk will report the effective permissions for that user or group; otherwise it will show the effective access for all accounts referenced in the object’s access control list (ACL).
By default, the objectname parameter is interpreted as a file system object, and can include ? and * wildcards. If the object is a folder, AccessChk reports the effective permission for all files and subfolders within that folder. If the object is a file, AccessChk reports its effective permissions. For example, here are the effective permissions for c:\windows\explorer.exe on a Windows 7 computer:
c:\windows\explorer.exe RW NT SERVICE\TrustedInstaller R BUILTIN\Administrators R NT AUTHORITY\SYSTEM R BUILTIN\Users
For each object reported, AccessChk summarizes permissions for each user and group referenced in the ACL, displaying R if the account has any Read permissions, W if the account has any Write permissions, and nothing if it has neither.
Named pipes are considered file system objects; use the “\pipe\” prefix to specify a named pipe path, or just “\pipe\” to specify the container in which all named pipes are defined: accesschk\pipe\ reports effective permissions for all named pipes on the computer; accesschk\pipe\srvsvc reports effective permissions for the srvsvc pipe, if it exists.
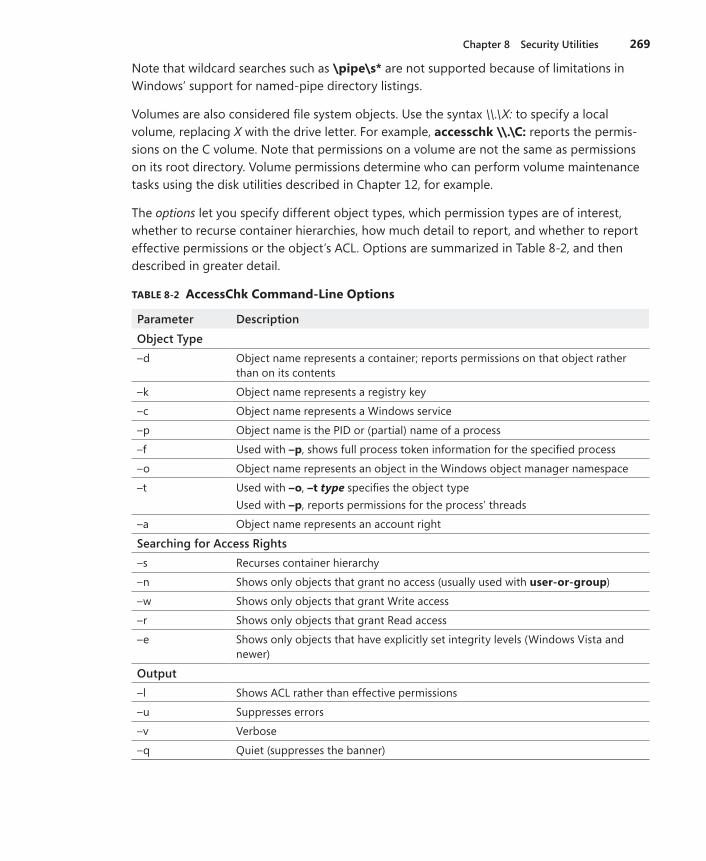
Chapter 8 Security Utilities 269
Note that wildcard searches such as \pipe\s* are not supported because of limitations in Windows’ support for named-pipe directory listings.
Volumes are also considered file system objects. Use the syntax \\.\X: to specify a local volume, replacing X with the drive letter. For example, accesschk\\.\C: reports the permis-sions on the C volume. Note that permissions on a volume are not the same as permissions on its root directory. Volume permissions determine who can perform volume maintenance tasks using the disk utilities described in Chapter 12, for example.
The options let you specify different object types, which permission types are of interest, whether to recurse container hierarchies, how much detail to report, and whether to report effective permissions or the object’s ACL. Options are summarized in Table 8-2, and then described in greater detail.
TABLE8-2 AccessChkCommand-LineOptions
Parameter DescriptionObject Type–d Object name represents a container; reports permissions on that object rather
than on its contents
–k Object name represents a registry key
–c Object name represents a Windows service
–p Object name is the PID or (partial) name of a process
–f Used with –p, shows full process token information for the specified process
–o Object name represents an object in the Windows object manager namespace
–t Used with –o, –ttype specifies the object typeUsed with –p, reports permissions for the process’ threads
–a Object name represents an account right
Searching for Access Rights–s Recurses container hierarchy
–n Shows only objects that grant no access (usually used with user-or-group)
–w Shows only objects that grant Write access
–r Shows only objects that grant Read access
–e Shows only objects that have explicitly set integrity levels (Windows Vista and newer)
Output–l Shows ACL rather than effective permissions
–u Suppresses errors
–v Verbose
–q Quiet (suppresses the banner)
270 Part II Usage Guide
Object TypeAs mentioned, if the named object is a container—such as a file system folder, a registry key, or an object manager directory—AccessChk reports on the objects within that container rather than on the container itself. To have AccessChk report on the container object, add the –d option to the command line. For example, accesschkc:\windows reports effective permissions for every file and subfolder in the Windows folder; accesschk-dc:\windows reports the permissions on the Windows folder. Similarly, accesschk. reports permissions on everything in the current folder, while accesschk-d. reports permissions on the current folder only. As a final example, accesschk* reports permissions on all objects in the current folder, while accesschk-d* reports permissions only on subfolder objects in the current folder.
To inspect permissions on a registry key, add –k to the command line. You can specify the root key with short or full names (for example, HKLM or HKEY_LOCAL_MACHINE), and you can follow the root key with a colon (:), as Windows PowerShell does. (Wildcard characters are not supported.) All of the following equivalent commands report the permissions for the subkeys of HKLM\Software\Microsoft:
accesschk -k hklm\software\microsoft
accesschk -k hklm:\software\microsoft
accesschk -k hkey_local_machine\software\microsoft
Add –d to report permissions just for HKLM\Software\Microsoft but not for its subkeys.
To report the permissions for a Windows service, add –c to the command line. Specify * as the object name to show all services, or scmanager to check the permissions of the Service Control Manager. (Partial name or wildcard matches are not supported.) For example, accesschk–clanmanserver reports permissions for the Server service on a Windows 7 computer, and this is its output:
lanmanserver RW NT AUTHORITY\SYSTEM RW BUILTIN\Administrators R NT AUTHORITY\INTERACTIVE R NT AUTHORITY\SERVICE
This command reports the permissions specifically granted by each service to the “Authenticated Users” group:
accesschk -c "authenticated users" *
In the context of services, W can refer to permissions such as Start, Stop, Pause/Continue, and Change Configuration, while R includes permissions such as Query Configuration and Query Status.
Chapter 8 Security Utilities 271
To view permissions on processes, add –p to the command line. The object name can be either a process ID (PID) or a process name, such as “explorer.” AccessChk will match partial names: accesschk–pexp will report permissions for processes with names beginning with “exp”, including all instances of Explorer. Specify * as the object name to show permissions for all processes. Note that administrative rights are required to view the permissions of processes running as another user or with elevated rights. The following output is what you can expect to see for an elevated instance of Cmd.exe on a Windows 7 computer, using accesschk–p3048:
[3048] cmd.exe RW BUILTIN\Administrators RW NT AUTHORITY\SYSTEM
Combine –p with –t to view permissions for all the threads of the specified process. (Note that the t option must come after p in the command line.) Looking at the same elevated instance of Cmd.exe, accesschk–pt3048 reports:
[3048] cmd.exe RW BUILTIN\Administrators RW NT AUTHORITY\SYSTEM [3048:7148] Thread RW BUILTIN\Administrators RW NT AUTHORITY\SYSTEM R Win7-x86-VM\S-1-5-5-0-248063-Abby
The process has a single thread with ID 7148, with permissions similar to that of the containing process.
Combine –p with –f to view full details of the process token. For each process listed, AccessChk will show the permissions on the process token, and then show the token user, groups, group flags, and privileges.
You can view permissions on objects in the object manager namespace—such as events, semaphores, sections and directories—with the –o command line switch. To limit output to a specific object type, add –t and the object type. For example, the following command reports effective permissions for all objects in the \BaseNamedObjects directory:
accesschk -o \BaseNamedObjects
The following command reports effective permissions only for Section objects in the \BaseNamedObjects directory:
accesschk -o -t section \BaseNamedObjects
If no object name is provided, the root of the namespace directory is assumed. WinObj, described in Chapter 14, “System Information Utilities,” provides a graphical view of the object manager namespace.
272 Part II Usage Guide
Although they aren’t securable objects per se, privileges and account rights can be reported by AccessChk with the –a option. Privileges grant an account a systemwide capability not associated with a specific object, such as SeBackupPrivilege, which allows the account to bypass access control to read an object. Account rights determine who can or cannot log on to a system and how. For example, SeRemoteInteractiveLogonRight must be granted to an account in order to log on via Remote Desktop. Privileges are listed in access tokens, while account rights are not.
I’ll demonstrate usage of the –a option with examples. Note that AccessChk requires administrative rights to use the option. Use * as the object name to list all privileges and account rights and the accounts to which they are assigned:
accesschk -a *
An account name followed by * lists all the privileges and account rights assigned to that account. For example, the following command displays those assigned to the Power Users group (it is interesting to compare the results of this from a Windows XP system and a Windows 7 system):
accesschk -a "power users" *
Finally, specify the name of a privilege or account right to list all the accounts that have it. (Again, you can use accesschk–a* to list all privileges and account rights.) The following command lists all the accounts that are granted SeDebugPrivilege:
accesschk -a sedebugprivilege
Searching for Access RightsOne of AccessChk’s most powerful features is its ability to search for objects that grant access to particular users or groups. For example, you can use AccessChk to verify whether anything in the Program Files folder hierarchy can be modified by Users, or whether any services grant Everyone any Write permissions.
The –s option instructs AccessChk to search recursively through container hierarchies, such as folders, registry keys, or object namespace directories. The –n option lists objects that grant no access to the specified account. The –r option lists objects that grant Read permis-sions, and –w lists objects that grant Write permissions. Finally, on Windows Vista and newer, –e shows objects that have an explicitly set integrity label, rather than the implicit default of Medium integrity and No-Write-Up.
Chapter 8 Security Utilities 273
Let’s consider some examples:
■ Search the Windows folder hierarchy for objects that can be modified by Users:
accesschk -ws Users %windir%
■ Search for global objects that can be modified by Everyone:
accesschk -wo everyone \basenamedobjects
■ Search for registry keys under HKEY_CURRENT_USER that have an explicit integrity label:
accesschk -kse hkcu
■ Search for services that grant Authenticated Users any Write permissions:
accesschk -cw "Authenticated Users" *
■ List all named pipes that grant anyone Write permissions:
accesschk -w \pipe\*
■ List all object manager objects under the \sessions directory that do not grant any access to Administrators:
accesschk -nos Administrators \sessions
This last example points out another powerful feature of AccessChk. Clearly, to view the permissions of an object, you must be granted the Read Permissions permission for that object. And just as clearly, there are many objects throughout the system that do not grant any access to regular users; for example, each user’s profile contents are hidden from other nonadministrative users. To report on these objects, AccessChk must be running with elevated/administrative rights. Yet there are some objects that do not grant any access to Administrators but only to System. So that it can report on these objects when an adminis-trative token is insufficient, AccessChk duplicates a System token from the Smss.exe process and impersonates it to retry the access attempt. Without that feature, the previous example would not work.
Output OptionsInstead of reporting just R or W to indicate permissions, you can view verbose permissions by adding –v to the AccessChk command line. Beneath each account name, AccessChk lists the specific permissions using the symbolic names from the Windows SDK. These are the
274 Part II Usage Guide
effective permissions reported with the –v option for %SystemDrive%\ on a Windows 7 system:
C:\ Medium Mandatory Level (Default) [No-Write-Up] RW BUILTIN\Administrators FILE_ALL_ACCESS RW NT AUTHORITY\SYSTEM FILE_ALL_ACCESS R BUILTIN\Users FILE_LIST_DIRECTORY FILE_READ_ATTRIBUTES FILE_READ_EA FILE_TRAVERSE SYNCHRONIZE READ_CONTROL W NT AUTHORITY\Authenticated Users FILE_ADD_SUBDIRECTORY
The verbose output shows that Administrators and System have full control, Users have Read access, and Authenticated Users additionally have the ability to create subfolders within that folder.
Instead of showing effective permissions, you can display the object’s actual access control list (ACL) with the –l (lower case L) option. Here is the ACL for the “C:\Documents and Settings” junction on Windows 7 that was described at the beginning of the AccessChk section. Each access control entry (ACE) is listed in order, identifying a user or group, whether access is allowed or denied, and which permissions are allowed or denied. If present, ACE flags are shown in square brackets, indicating inheritance settings. If [INHERITED_ACE] is not present, the ACE is an explicit ACE.
C:\Documents and Settings Medium Mandatory Level (Default) [No-Write-Up] [0] Everyone ACCESS_DENIED_ACE_TYPE FILE_LIST_DIRECTORY [1] Everyone ACCESS_ALLOWED_ACE_TYPE FILE_LIST_DIRECTORY FILE_READ_ATTRIBUTES FILE_READ_EA FILE_TRAVERSE SYNCHRONIZE READ_CONTROL [2] NT AUTHORITY\SYSTEM ACCESS_ALLOWED_ACE_TYPE FILE_ALL_ACCESS [3] BUILTIN\Administrators ACCESS_ALLOWED_ACE_TYPE FILE_ALL_ACCESS
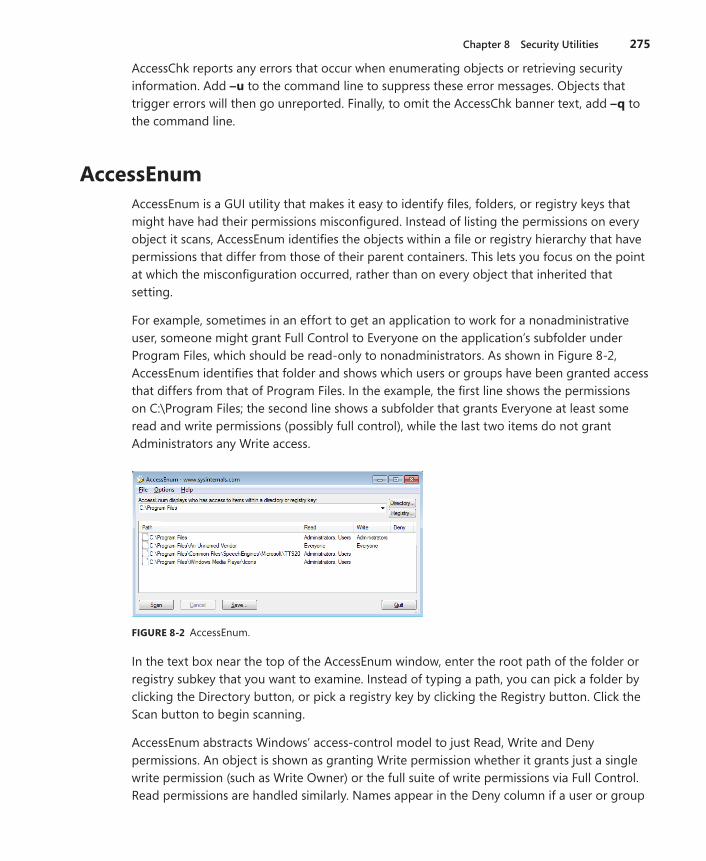
Chapter 8 Security Utilities 275
AccessChk reports any errors that occur when enumerating objects or retrieving security information. Add –u to the command line to suppress these error messages. Objects that trigger errors will then go unreported. Finally, to omit the AccessChk banner text, add –q to the command line.
AccessEnumAccessEnum is a GUI utility that makes it easy to identify files, folders, or registry keys that might have had their permissions misconfigured. Instead of listing the permissions on every object it scans, AccessEnum identifies the objects within a file or registry hierarchy that have permissions that differ from those of their parent containers. This lets you focus on the point at which the misconfiguration occurred, rather than on every object that inherited that setting.
For example, sometimes in an effort to get an application to work for a nonadministrative user, someone might grant Full Control to Everyone on the application’s subfolder under Program Files, which should be read-only to nonadministrators. As shown in Figure 8-2, AccessEnum identifies that folder and shows which users or groups have been granted access that differs from that of Program Files. In the example, the first line shows the permissions on C:\Program Files; the second line shows a subfolder that grants Everyone at least some read and write permissions (possibly full control), while the last two items do not grant Administrators any Write access.
FIGURE8-2 AccessEnum.
In the text box near the top of the AccessEnum window, enter the root path of the folder or registry subkey that you want to examine. Instead of typing a path, you can pick a folder by clicking the Directory button, or pick a registry key by clicking the Registry button. Click the Scan button to begin scanning.
AccessEnum abstracts Windows’ access-control model to just Read, Write and Deny permissions. An object is shown as granting Write permission whether it grants just a single write permission (such as Write Owner) or the full suite of write permissions via Full Control. Read permissions are handled similarly. Names appear in the Deny column if a user or group
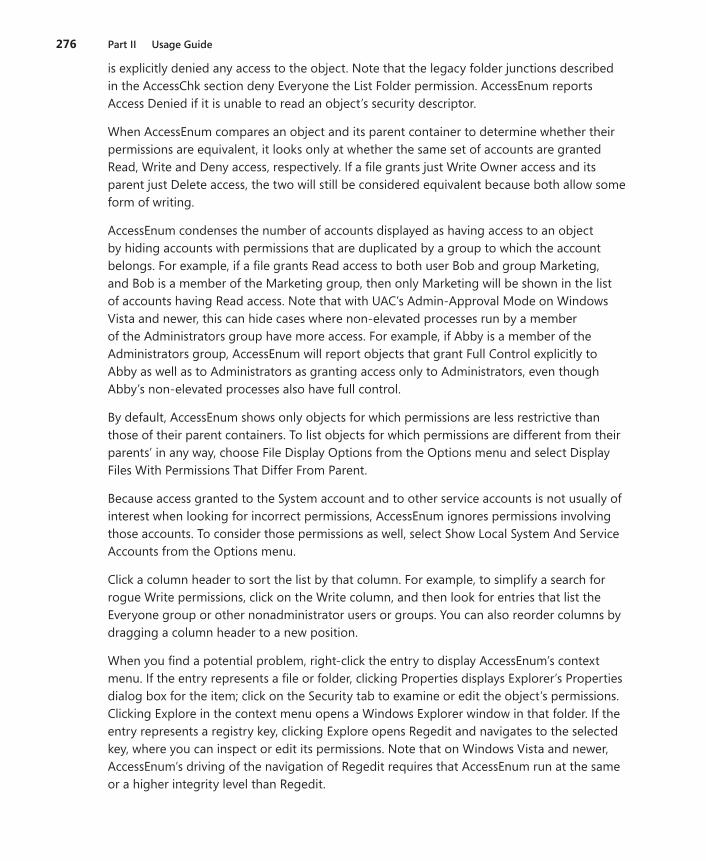
276 Part II Usage Guide
is explicitly denied any access to the object. Note that the legacy folder junctions described in the AccessChk section deny Everyone the List Folder permission. AccessEnum reports Access Denied if it is unable to read an object’s security descriptor.
When AccessEnum compares an object and its parent container to determine whether their permissions are equivalent, it looks only at whether the same set of accounts are granted Read, Write and Deny access, respectively. If a file grants just Write Owner access and its parent just Delete access, the two will still be considered equivalent because both allow some form of writing.
AccessEnum condenses the number of accounts displayed as having access to an object by hiding accounts with permissions that are duplicated by a group to which the account belongs. For example, if a file grants Read access to both user Bob and group Marketing, and Bob is a member of the Marketing group, then only Marketing will be shown in the list of accounts having Read access. Note that with UAC’s Admin-Approval Mode on Windows Vista and newer, this can hide cases where non-elevated processes run by a member of the Administrators group have more access. For example, if Abby is a member of the Administrators group, AccessEnum will report objects that grant Full Control explicitly to Abby as well as to Administrators as granting access only to Administrators, even though Abby’s non-elevated processes also have full control.
By default, AccessEnum shows only objects for which permissions are less restrictive than those of their parent containers. To list objects for which permissions are different from their parents’ in any way, choose File Display Options from the Options menu and select Display Files With Permissions That Differ From Parent.
Because access granted to the System account and to other service accounts is not usually of interest when looking for incorrect permissions, AccessEnum ignores permissions involving those accounts. To consider those permissions as well, select Show Local System And Service Accounts from the Options menu.
Click a column header to sort the list by that column. For example, to simplify a search for rogue Write permissions, click on the Write column, and then look for entries that list the Everyone group or other nonadministrator users or groups. You can also reorder columns by dragging a column header to a new position.
When you find a potential problem, right-click the entry to display AccessEnum’s context menu. If the entry represents a file or folder, clicking Properties displays Explorer’s Properties dialog box for the item; click on the Security tab to examine or edit the object’s permissions. Clicking Explore in the context menu opens a Windows Explorer window in that folder. If the entry represents a registry key, clicking Explore opens Regedit and navigates to the selected key, where you can inspect or edit its permissions. Note that on Windows Vista and newer, AccessEnum’s driving of the navigation of Regedit requires that AccessEnum run at the same or a higher integrity level than Regedit.
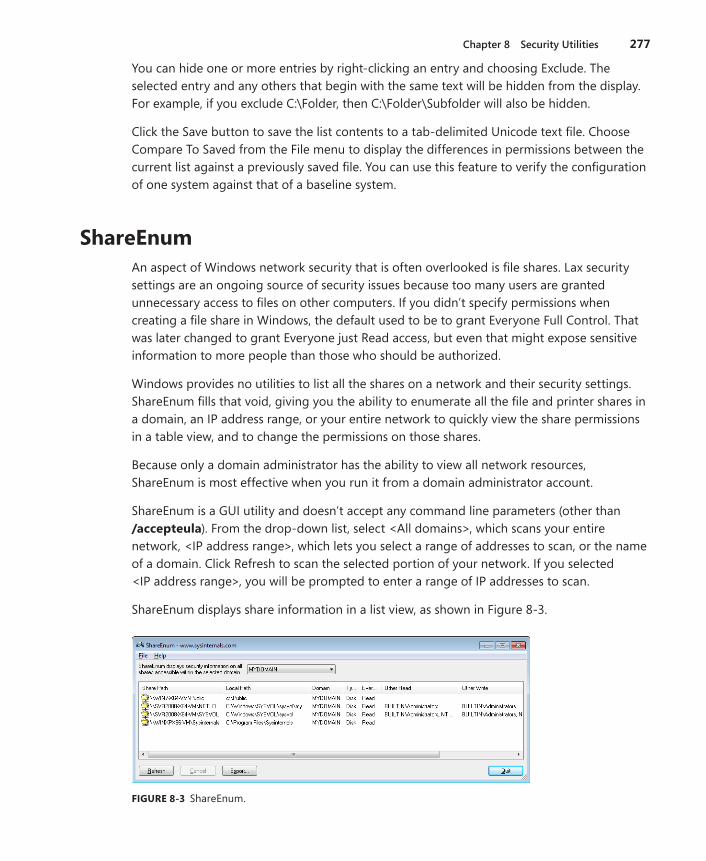
Chapter 8 Security Utilities 277
You can hide one or more entries by right-clicking an entry and choosing Exclude. The selected entry and any others that begin with the same text will be hidden from the display. For example, if you exclude C:\Folder, then C:\Folder\Subfolder will also be hidden.
Click the Save button to save the list contents to a tab-delimited Unicode text file. Choose Compare To Saved from the File menu to display the differences in permissions between the current list against a previously saved file. You can use this feature to verify the configuration of one system against that of a baseline system.
ShareEnumAn aspect of Windows network security that is often overlooked is file shares. Lax security settings are an ongoing source of security issues because too many users are granted unnecessary access to files on other computers. If you didn’t specify permissions when creating a file share in Windows, the default used to be to grant Everyone Full Control. That was later changed to grant Everyone just Read access, but even that might expose sensitive information to more people than those who should be authorized.
Windows provides no utilities to list all the shares on a network and their security settings. ShareEnum fills that void, giving you the ability to enumerate all the file and printer shares in a domain, an IP address range, or your entire network to quickly view the share permissions in a table view, and to change the permissions on those shares.
Because only a domain administrator has the ability to view all network resources, ShareEnum is most effective when you run it from a domain administrator account.
ShareEnum is a GUI utility and doesn’t accept any command line parameters (other than /accepteula). From the drop-down list, select <All domains>, which scans your entire network, <IP address range>, which lets you select a range of addresses to scan, or the name of a domain. Click Refresh to scan the selected portion of your network. If you selected <IP address range>, you will be prompted to enter a range of IP addresses to scan.
ShareEnum displays share information in a list view, as shown in Figure 8-3.
FIGURE8-3 ShareEnum.
278 Part II Usage Guide
Click on a column header to sort the list by that column’s data, or drag the column headers to reorder them. ShareEnum displays the following information about each share:
■ Share Path The computer and share name
■ Local Path The location in the remote computer’s file system that the share exposes
■ Domain The computer’s domain
■ Type Whether the share is a file share (Disk), a printer share (Printer), or Unknown.
■ Everyone Permissions that the share grants to the Everyone group, categorized as Read, Write, Read/Write, or blank if no permissions are granted to the Everyone group
■ Other Read Entities other than the Everyone group that are granted Read permission to the share
■ Other Write Entities other than the Everyone group that are granted Change or Full Control permissions to the share
■ Deny Any entities that are explicitly denied access to the share
Click the Export button to save the list contents to a tab-delimited Unicode text file. Choose Compare To Saved from the File menu to display the differences in permissions between the current list and a previously exported file.
To change the permissions for a share, right-click it in the list and choose Properties. ShareEnum displays a permissions editor dialog box for the share. To open a file share in Windows Explorer, right-click the share in the list and choose Explore from the popup menu.
ShellRunAsIn Windows XP and Windows Server 2003, you could run a program as a different user by right-clicking the program in Windows Explorer, choosing Run As from the context menu, and entering alternate credentials in the Run As dialog box. This feature was often used to run a program with an administrative account on a regular user’s desktop. Beginning with Windows Vista, the Run As menu option was replaced with Run As Administrator, which triggers UAC elevation. For those who had used the Run As dialog box to run a program under a different account without administrative rights, the only remaining option was the less-convenient Runas.exe console utility. To restore the capabilities of the graphical RunAs interface with added features, I co-wrote ShellRunAs with Jon Schwartz of the Windows team.
Note Some features of ShellRunAs were restored in Windows 7. Holding down Shift while right-clicking a program or shortcut adds Run As A Different User to the context menu.
ShellRunAs lets you start a program with a different user account from a context menu entry, displaying a dialog box to collect a user name and password (shown in Figure 8-4) or
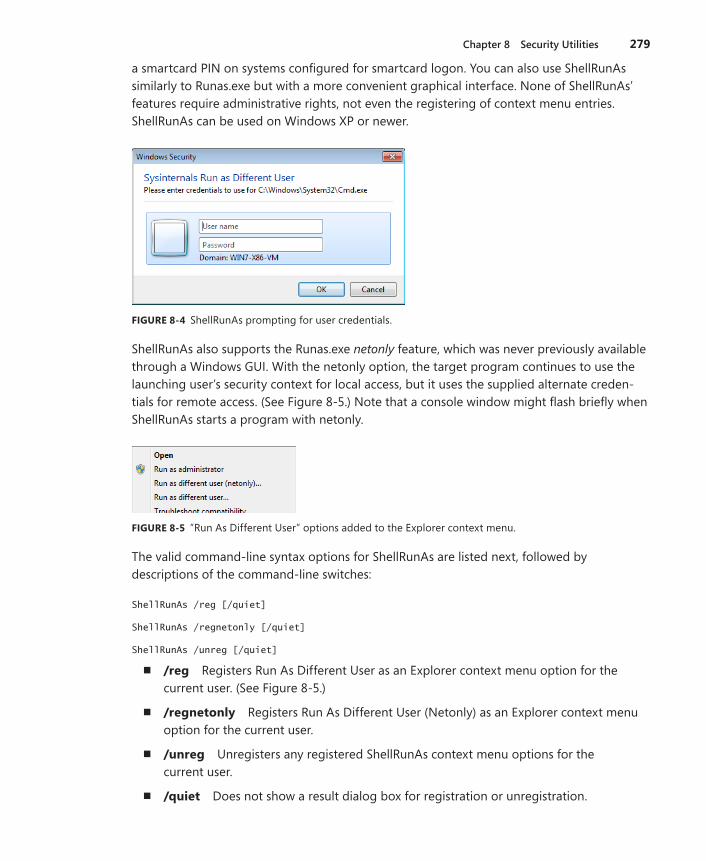
Chapter 8 Security Utilities 279
a smartcard PIN on systems configured for smartcard logon. You can also use ShellRunAs similarly to Runas.exe but with a more convenient graphical interface. None of ShellRunAs’ features require administrative rights, not even the registering of context menu entries. ShellRunAs can be used on Windows XP or newer.
FIGURE8-4 ShellRunAs prompting for user credentials.
ShellRunAs also supports the Runas.exe netonly feature, which was never previously available through a Windows GUI. With the netonly option, the target program continues to use the launching user’s security context for local access, but it uses the supplied alternate creden-tials for remote access. (See Figure 8-5.) Note that a console window might flash briefly when ShellRunAs starts a program with netonly.
FIGURE8-5 ”Run As Different User” options added to the Explorer context menu.
The valid command-line syntax options for ShellRunAs are listed next, followed by descriptions of the command-line switches:
ShellRunAs /reg [/quiet]
ShellRunAs /regnetonly [/quiet]
ShellRunAs /unreg [/quiet]
■ /reg Registers Run As Different User as an Explorer context menu option for the current user. (See Figure 8-5.)
■ /regnetonly Registers Run As Different User (Netonly) as an Explorer context menu option for the current user.
■ /unreg Unregisters any registered ShellRunAs context menu options for the current user.
■ /quiet Does not show a result dialog box for registration or unregistration.
280 Part II Usage Guide
ShellRunAs [/netonly] program [arguments]
This syntax allows the direct launching of a program from the ShellRunAs command line. With /netonly, you can specify that the credentials collected should be used only for remote access.
AutologonThe Autologon utility enables you to easily configure Windows’ built-in autologon mechanism, which automatically logs on a user at the console when the computer starts up. To enable autologon, simply run Autologon, enter valid credentials in the dialog box, and click the Enable button. You can also pass the user name, domain, and password as command-line arguments, as shown in the following example:
autologon Abby MYDOMAIN Pass@word1
The password is encrypted in the registry as an LSA secret. The next time the system starts, Windows will try to use the entered credentials to log on the user at the console. Note that Autologon does not verify the submitted credentials, nor does it verify that the specified user account is allowed to log on to the computer. Also note that although LSA Secrets are en-crypted in the registry, a user with administrative rights can easily retrieve and decrypt them.
To disable autologon, run Autologon and click the Disable button or press the Escape key. To disable autologon one time, hold down the Shift key during startup at the point where the logon would occur. Autologon can also be prevented via Group Policy.
Autologon is supported on Windows XP and newer, and requires administrative privileges.
LogonSessionsThe LogonSessions utility enumerates active logon sessions created and managed by the Local Security Authority (LSA). A logon session is created when a user account or service account is authenticated to Windows. Authentication can occur in many ways. Here are some examples:
■ Via an interactive user logon at a console or remote desktop dialog box
■ Through network authentication to a file share or a Web application
■ By the service control manager using saved credentials to start a service
■ Via the Secondary Logon service using Runas.exe
■ Simply “asserted” by the operating system, as is done with the System account and for NT AUTHORITY\ANONYMOUS LOGON, which is used when performing actions on behalf of an unauthenticated user or an “identify” level impersonation token.
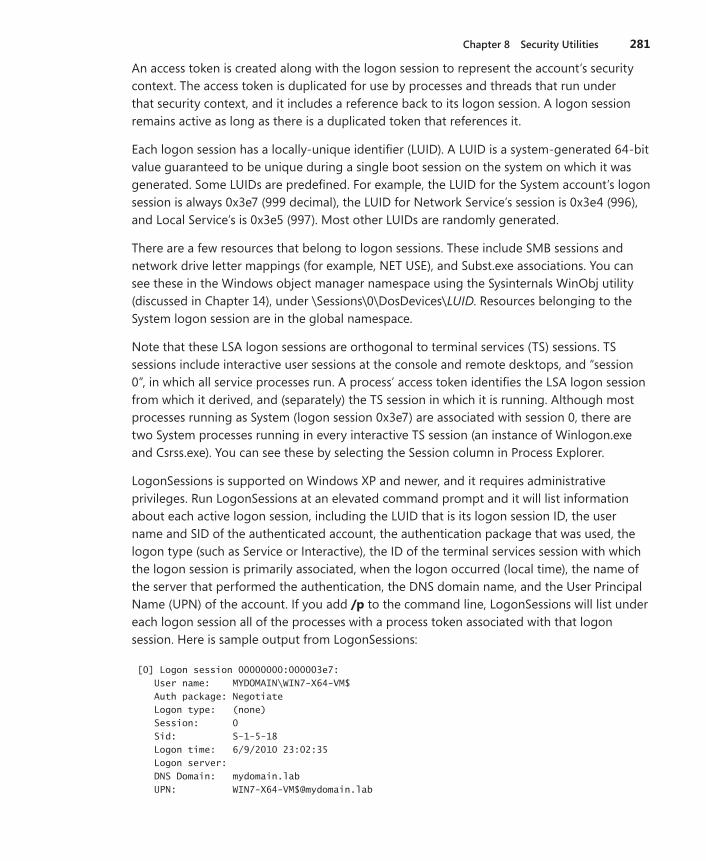
Chapter 8 Security Utilities 281
An access token is created along with the logon session to represent the account’s security context. The access token is duplicated for use by processes and threads that run under that security context, and it includes a reference back to its logon session. A logon session remains active as long as there is a duplicated token that references it.
Each logon session has a locally-unique identifier (LUID). A LUID is a system-generated 64-bit value guaranteed to be unique during a single boot session on the system on which it was generated. Some LUIDs are predefined. For example, the LUID for the System account’s logon session is always 0x3e7 (999 decimal), the LUID for Network Service’s session is 0x3e4 (996), and Local Service’s is 0x3e5 (997). Most other LUIDs are randomly generated.
There are a few resources that belong to logon sessions. These include SMB sessions and network drive letter mappings (for example, NET USE), and Subst.exe associations. You can see these in the Windows object manager namespace using the Sysinternals WinObj utility (discussed in Chapter 14), under \Sessions\0\DosDevices\LUID. Resources belonging to the System logon session are in the global namespace.
Note that these LSA logon sessions are orthogonal to terminal services (TS) sessions. TS sessions include interactive user sessions at the console and remote desktops, and “session 0”, in which all service processes run. A process’ access token identifies the LSA logon session from which it derived, and (separately) the TS session in which it is running. Although most processes running as System (logon session 0x3e7) are associated with session 0, there are two System processes running in every interactive TS session (an instance of Winlogon.exe and Csrss.exe). You can see these by selecting the Session column in Process Explorer.
LogonSessions is supported on Windows XP and newer, and it requires administrative privileges. Run LogonSessions at an elevated command prompt and it will list information about each active logon session, including the LUID that is its logon session ID, the user name and SID of the authenticated account, the authentication package that was used, the logon type (such as Service or Interactive), the ID of the terminal services session with which the logon session is primarily associated, when the logon occurred (local time), the name of the server that performed the authentication, the DNS domain name, and the User Principal Name (UPN) of the account. If you add /p to the command line, LogonSessions will list under each logon session all of the processes with a process token associated with that logon session. Here is sample output from LogonSessions:
[0] Logon session 00000000:000003e7: User name: MYDOMAIN\WIN7-X64-VM$ Auth package: Negotiate Logon type: (none) Session: 0 Sid: S-1-5-18 Logon time: 6/9/2010 23:02:35 Logon server: DNS Domain: mydomain.lab UPN: [email protected]
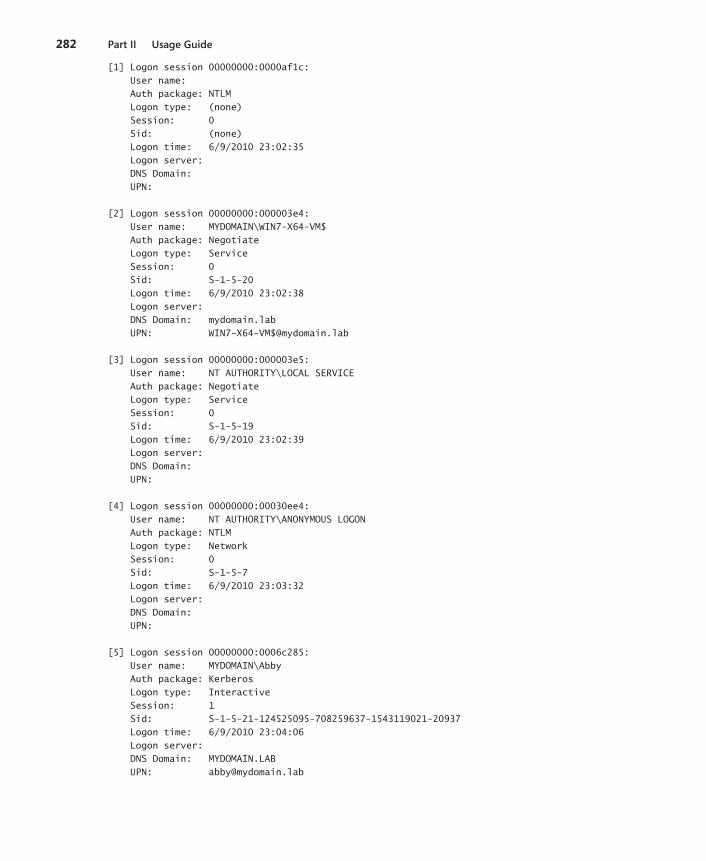
282 Part II Usage Guide
[1] Logon session 00000000:0000af1c: User name: Auth package: NTLM Logon type: (none) Session: 0 Sid: (none) Logon time: 6/9/2010 23:02:35 Logon server: DNS Domain: UPN: [2] Logon session 00000000:000003e4: User name: MYDOMAIN\WIN7-X64-VM$ Auth package: Negotiate Logon type: Service Session: 0 Sid: S-1-5-20 Logon time: 6/9/2010 23:02:38 Logon server: DNS Domain: mydomain.lab UPN: [email protected] [3] Logon session 00000000:000003e5: User name: NT AUTHORITY\LOCAL SERVICE Auth package: Negotiate Logon type: Service Session: 0 Sid: S-1-5-19 Logon time: 6/9/2010 23:02:39 Logon server: DNS Domain: UPN: [4] Logon session 00000000:00030ee4: User name: NT AUTHORITY\ANONYMOUS LOGON Auth package: NTLM Logon type: Network Session: 0 Sid: S-1-5-7 Logon time: 6/9/2010 23:03:32 Logon server: DNS Domain: UPN: [5] Logon session 00000000:0006c285: User name: MYDOMAIN\Abby Auth package: Kerberos Logon type: Interactive Session: 1 Sid: S-1-5-21-124525095-708259637-1543119021-20937 Logon time: 6/9/2010 23:04:06 Logon server: DNS Domain: MYDOMAIN.LAB UPN: [email protected]
Chapter 8 Security Utilities 283
[6] Logon session 00000000:000709d3: User name: MYDOMAIN\Abby Auth package: Kerberos Logon type: Interactive Session: 1 Sid: S-1-5-21-124525095-708259637-1543119021-20937 Logon time: 6/9/2010 23:04:06 Logon server: DNS Domain: MYDOMAIN.LAB UPN: [email protected]
Because the System and Network Service accounts can authenticate with the credentials of the computer account, the names for these accounts appear as domain\computer$ (or workgroup\computer$ if they’re not domain-joined). The logon server will be the computer name for local accounts and can be blank when logging on with cached credentials.
Also note that on Windows Vista and newer with User Account Control (UAC) enabled, two logon sessions are created when a user interactively logs on who is a member of the Administrators group,1 as you can see with MYDOMAIN\Abby in entries [5] and [6] in the preceding sample. One logon session contains the token representing the user’s full rights, and the other contains the filtered token with powerful groups disabled and powerful privileges removed. This is the reason that when an administrator elevates, the drive-letter mappings that are present for the non-elevated processes aren’t defined for the elevated ones. You can see these and other per-session data by navigating to \Sessions\0\DosDevices\LUID in WinObj, described in Chapter 14. (Also see Knowledge Base article 937624 (available at http://support.microsoft.com/kb/937624) for information about configuring EnableLinkedConnections.)
SDeleteObject reuse protection is a fundamental policy of the Windows security model. This means that when an application allocates file space or virtual memory it is unable to view data that was previously stored in that space. Windows zero-fills memory and zeroes the sectors on disk where a file is placed before it presents either type of resource to an application. Object reuse protection does not dictate that the space that a file occupies be zeroed when it is deleted, though. This is because Windows is designed with the assumption that the operating system alone controls access to system resources. However, when the operating system is not running it is possible to use raw disk editors and recovery tools to view and recover data that the operating system has deallocated. Even when you encrypt files with Windows’ Encrypting File System (EFS), a file’s original unencrypted file data might be left on the disk after a new encrypted version of the file is created. Space used for temporary file storage might also not be encrypted.
1 More accurately, two logon sessions are created if the user is a member of a well-known “powerful” group or is granted administrator-equivalent privileges such as SeDebugPrivilege.
284 Part II Usage Guide
The only way to ensure that deleted files, as well as files that you encrypt with EFS, are safe from recovery is to use a secure delete application. Secure delete applications overwrite a deleted file’s on-disk data using techniques that are shown to make disk data unrecover-able, even if someone is using recovery technology that can read patterns in magnetic media that reveal weakly deleted files. SDelete (Secure Delete) is such an application. You can use SDelete both to securely delete existing files, as well as to securely erase any file data that exists in the unallocated portions of a disk (including files you have already deleted or encrypted). SDelete implements the U.S. Department of Defense clearing and sanitizing standard DOD 5220.22-M, to give you confidence that after it is deleted with SDelete, your file data is gone forever. Note that SDelete securely deletes file data, but not file names located in free disk space.
Using SDelete SDelete is a command-line utility. It works on Windows XP and newer and does not require administrative rights. It uses a different command-line syntax for secure file deletion and for erasing content in unallocated disk space. To securely delete one or more files or folder hierarchies, use this syntax:
sdelete [-p passes] [-a] [-s] [-q] file_spec
The file_spec can be a file or folder name, and it can contain wildcard characters. The –p option specifies the number of times to overwrite each file object. The default is one pass. The –a option is needed to delete read-only files. The –s option recurses subfolders to delete files matching the specification or to delete a folder hierarchy. The –q option (quiet) suppresses the listing of per-file results. Here are some examples:
REM Securely deletes secret.txt in the current folder sdelete secret.txt
REM Securely deletes all *.docx files in the current folder and subfolders sdelete -s *.docx
REM Securely deletes the C:\Users\Bob folder hierarchy sdelete -s C:\Users\Bob
To securely delete unallocated disk space on a volume, use this syntax:
sdelete [-p passes] [-z|-c] [d:]
There are two ways to overwrite unallocated space: the –c option overwrites it with random data, while the –z option overwrites it with zeros. The –c option supports DoD compliance; the –z option makes it easier to compress and optimize virtual hard disks. The –p option specifies the number of times to overwrite the disk areas. If the drive letter is not specified, the current volume’s unallocated space is cleansed. Note that the colon must be included in the drive specification.
Chapter 8 Security Utilities 285
Note The Windows Cipher/W command is similar in purpose to SDelete–c, writing random data over all hard drive free space outside of the Master File Table (MFT).
Note that during free-space cleaning, Windows might display a warning that disk space is running low. This is normal, and the warning can be ignored. (The reason this happens will be explained in the next section.)
How SDelete WorksSecurely deleting a file that has no special attributes is relatively straightforward: the secure delete program simply overwrites the file with the secure delete pattern. What is trickier is to securely delete compressed, encrypted, or sparse files, and securely cleansing disk free spaces.
Compressed, encrypted and sparse files are managed by NTFS in 16-cluster blocks. If a program writes to an existing portion of such a file, NTFS allocates new space on the disk to store the new data, and after the new data has been written NTFS deallocates the clusters previously occupied by the file. NTFS takes this conservative approach for reasons related to data integrity, and (for compressed and sparse files) in case a new allocation is larger than what exists (for example, the new compressed data is larger than the old compressed data). Thus, overwriting such a file will not succeed in deleting the file’s contents from the disk.
To handle these types of files SDelete relies on the defragmentation API. Using the defragmentation API, SDelete can determine precisely which clusters on a disk are occupied by data belonging to compressed, sparse and encrypted files. When SDelete knows which clusters contain the file’s data, it can open the disk for raw access and overwrite those clusters.
Cleaning free space presents another challenge. Because FAT and NTFS provide no means for an application to directly address free space, SDelete has one of two options. The first is that—like it does for compressed, sparse and encrypted files—it can open the disk for raw access and overwrite the free space. This approach suffers from a big problem: even if SDelete were coded to be fully capable of calculating the free space portions of NTFS and FAT drives (something that’s not trivial), it would run the risk of collision with active file oper-ations taking place on the system. For example, say SDelete determines that a cluster is free, and just at that moment the file system driver (FAT, NTFS) decides to allocate the cluster for a file that another application is modifying. The file system driver writes the new data to the cluster, and then SDelete comes along and overwrites the freshly written data: the file’s new data is gone. The problem is even worse if the cluster is allocated for file system metadata because SDelete will corrupt the file system’s on-disk structures.
286 Part II Usage Guide
The second approach, and the one SDelete takes, is to indirectly overwrite free space. First, SDelete allocates the largest file it can. SDelete does this using noncached file I/O so that the contents of the NT file system cache will not be thrown out and replaced with use-less data associated with SDelete’s space-hogging file. Because noncached file I/O must be sector (512-byte) aligned, there might be some left over space that isn’t allocated for the SDelete file even when SDelete cannot further grow the file. To grab any remaining space, SDelete next allocates the largest cached file it can. For both of these files, SDelete performs a secure overwrite, ensuring that all the disk space that was previously free becomes securely cleansed.
On NTFS drives, SDelete’s job isn’t necessarily through after it allocates and overwrites the two files. SDelete must also fill any existing free portions of the NTFS MFT (Master File Table) with files that fit within an MFT record. An MFT record is typically 1 KB in size, and every file or directory on a disk requires at least one MFT record. Small files are stored entirely within their MFT record, while files that don’t fit within a record are allocated clusters outside the MFT. All SDelete has to do to take care of the free MFT space is allocate the largest file it can; when the file occupies all the available space in an MFT record, NTFS will prevent the file from getting larger, because there are no free clusters left on the disk (they are being held by the two files SDelete previously allocated). SDelete then repeats the process. When SDelete can no longer even create a new file, it knows that all the previously free records in the MFT have been completely filled with securely overwritten files.
To overwrite the file name of a file that you delete, SDelete renames the file 26 times, each time replacing each character of the file’s name with a successive alphabetic character. For instance, the first rename of sample.txt would be to AAAAAA.AAA.
The reason that SDelete does not securely delete file names when cleaning disk free space is that deleting them would require direct manipulation of directory structures. Directory structures can have free space containing deleted file names, but the free directory space is not available for allocation to other files. Hence, SDelete has no way of allocating this free space so that it can securely overwrite it.