Embed Size (px)
Citation preview
S a m p l e B u s i n e s s P l a n A P P E N D I X A
741Appendix A I Sample Business Plan
Business PlanSeptember 2005
Prepared by Benjapon Jivasantikarn
This business plan has been submitted on a confidential basis. It may not be reproduced, distributed or stored without explicit permission.
CONFIDENTIAL
Source: Used by permission of Benjapon’s.
CHE-LONGENECKER-11-0214-APPENDIX A.indd 741 04/08/11 8:49 PM
Not For Sale
© C
enga
ge L
earn
ing.
All
right
s res
erve
d. N
o di
strib
utio
n al
low
ed w
ithou
t exp
ress
aut
horiz
atio
n.
742 Appendix A I Sample Business Plan
CONFIDENTIAL
Table of ContentsI. Executive Summary
1.1 The Opportunity 7431.2 The Company 7431.3 The Growth Plan 7441.4 The Team 7441.5 The Financials 744
II. The Industry, Target Customers, and Competitors2.1 The Restaurant Industry 7452.2 Fast Casual Segment 7462.3 Asian Food 7462.4 Target Customer 7462.5 Competitors 7472.6 Competitive Advantage 748
III. The Company3.1 Company Overview 7483.2 The Menu 7483.3 The Store Layout 749
IV. The Marketing Plan4.1 Marketing Objectives 7504.2 Targeting and Positioning 7504.3 Market Penetration 7514.4 Pricing Strategy 7514.5 Marketing Mix 751
V. The Operations Plan5.1 Location 7525.2 Hours of Operation 7535.3 Employee Hiring and Training 7535.4 The Production 7535.5 Facilities and Equipment 7535.6 Suppliers 753
VI. The Development Plan 754
VII. The Growth Plan 755
VIII. The Team8.1 Launch Team 7558.2 Board of Advisors 755
IX. The Financial Plan9.1 Single Store Financials 7569.2 Capital Requirements 7589.3 Franchising Revenues and Costs 7589.4 Overall Financial Performance 760
CHE-LONGENECKER-11-0214-APPENDIX A.indd 742 04/08/11 8:49 PM
Not For Sale
© C
enga
ge L
earn
ing.
All
right
s res
erve
d. N
o di
strib
utio
n al
low
ed w
ithou
t exp
ress
aut
horiz
atio
n.
743Appendix A I Sample Business Plan
CONFIDENTIAL
I. Executive Summary
1.1 ThE OPPOrTuNITy1) Thai food is one of the fastest growing food trends in the U.S. and is rapidly
moving into the mainstream.1
2) Americans are leading a busier lifestyle and thus rely more on meals outside the home. Restaurants account for 46% of total food dollars spent,2 up from 44.6% in 1990 and 26.3% in 1960.3 By 2010, 53% of food dollars will be spent on away-from-home sources.4
3) Americans are demanding better quality food and are willing to pay for that quality. As a result, fast food establishments have recently added premium items to their menu. For example, Arby’s has a line of “Market Fresh” items;5 Carl’s Jr. offers “The Six Dollar Burger.”6
The fast casual segment emerged to meet the demands for better-quality foods at a slightly higher price than that of fast food. Despite the immense popularity of Asian food, and Thai food in particular, the fast casual segment is dominated by cafes/bak-eries (Panera Bread, Au Bon Pain) and Mexican (Chipotle Grill, Baja Fresh, Qdoba). In recent years, however, Asian fast casual players have begun to emerge in various regions in the U.S. Such players include Mama Fu’s, Nothing but Noodles, and Pei Wei Asian Diner, but are still considered regional players.
Therefore, customers are limited in choices:
Thai food patrons are currently limited to full-service restaurant options, requiring more time and money than fast food or fast casual options.
Busy consumers are currently limited to hamburgers, sandwiches, pizzas, and Mexican, when it comes to fast-served options.
1.2 ThE COmPANy
Benjapon’s is a fast-casual restaurant serving fresh Thai food, fast, at afford-able prices, in a fun and friendly atmosphere. We will open our first location in February 2006, with future plans to grow through franchising.
The restaurant will be counter-order and table-service with an average ticket price of $8.50. Store hours are from 11am–10pm, seven days a week. We expect 40% of our business to come from take-out orders.
The company will offer Thai culture and food “information fun facts” on the menu, the packaging, and as part of the restaurant décor to enhance the overall experience.
Our target customers are urban, 18–35 year-old college students and young working professionals.
1 Packaged Facts, Marketresearch.com, 2003.2 “Restaurant Industry Report,” The Freedonia Group, Inc. 2003.3 “Restaurant Industry Report” Standard and Poor’s, 2003.4 National Restaurant Association5 Arby’s website: www.arbys.com6 Carl’s Jr. website: www.carlsjr.com
CHE-LONGENECKER-11-0214-APPENDIX A.indd 743 04/08/11 8:49 PM
Not For Sale
© C
enga
ge L
earn
ing.
All
right
s res
erve
d. N
o di
strib
utio
n al
low
ed w
ithou
t exp
ress
aut
horiz
atio
n.
744 Appendix A I Sample Business Plan
CONFIDENTIAL
The size of the restaurant will be approximately 1,500 square feet with 50 seats. The first location will be selected from one of the bustling neighborhood squares in the cit-ies of Somerville or Cambridge, Massachusetts, due to proximity to the target market.
1.3 ThE GrOwTh PlAN
Our plan is to grow via franchising after opening two company-owned stores. We plan to first saturate the Greater Boston Area, and move towards national expansion via Area Development Agreements. According to our calculations, the city of Boston can support three to five stores, while the Greater Boston Area can support twenty stores.
1.4 ThE TEAm
management Team:Benjapon Jivasantikarn, Founder and Owner—Six years of experience in finance and business incentives at KPMG, a Big Four professional services firm. MBA, Magna Cum Laude, from Babson College. Douglass Foundation Graduate Business Plan Competi-tion Finalist. Sorensen Award for Entrepreneurial and Academic Excellence.
Zack Noonprasith, General Manager—Six years experience in financial services. Five years experience in restaurant management.
Supranee Siriaphanot, Chef—Over 15 years experience as Thai restaurant owner and chef in the U.S.
Board of Advisors:Rick Hagelstein—Lifelong successful entrepreneur. Founder and CEO of The Sigma Food Group, a marketing, manufacturing, food, property, and hotel development com-pany in the Asia Pacific. The Sigma Food Group is the Asia Pacific franchisee of several major U.S. fast-food chains.
Steve Sabre—Co-founder of Fast Lube, Inc. and expert in entrepreneurship and franchising.
Hull Martin—Former venture capitalist in the restaurant industry and current advisor to start-up ventures.
1.5 ThE FINANCIAlSWe estimate an initial required investment of $550,000. The following are our summary financials for a five-year forecast period.
Year 1 Year 2 Year 3 Year 4 Year 5Summary Financials ($) # Company-Owned Stores 1 1 2 2 2 # Franchises Sold — — — 3 13 # Franchises in Operations — — — — 3 Revenue 691,200 881,280 1,977,592 2,293,859 2,874,559 Gross Profit 451,080 601,749 1,380,195 1,623,578 2,122,505 EBIT (110,145) 74,104 129,202 363,687 525,670 EBITDA (72,526) 111,723 204,440 430,592 592,575 Net Earnings (138,145) 48,904 81,602 196,068 296,922 Cash 109,784 168,277 561,526 751,112 989,152 Total Equity (28,179) 20,725 302,327 498,395 795,317 Total Debt 350,000 315,000 595,000 525,000 385,000
CHE-LONGENECKER-11-0214-APPENDIX A.indd 744 04/08/11 8:49 PM
Not For Sale
© C
enga
ge L
earn
ing.
All
right
s res
erve
d. N
o di
strib
utio
n al
low
ed w
ithou
t exp
ress
aut
horiz
atio
n.
745Appendix A I Sample Business Plan
CONFIDENTIAL
Year 1 Year 2 Year 3 Year 4 Year 5Profitability Gross Profit % 65.3% 68.3% 69.8% 70.8% 73.8% EBIT % –15.9% 8.4% 6.5% 15.9% 18.3% EBITDA % –10.5% 12.7% 10.3% 18.8% 20.6% Net Earnings % –20.0% 5.5% 4.1% 8.5% 10.3% Returns Return on Assets –37.1% 12.2% 8.0% 16.8% 21.8% Return on Equity 490.2% 236.0% 27.0% 39.3% 37.3% Return on Capital (LT Debt + Equity) –42.9% 14.6% 9.1% 19.2% 25.2%
II. The Industry, Target Customers, and Competitors
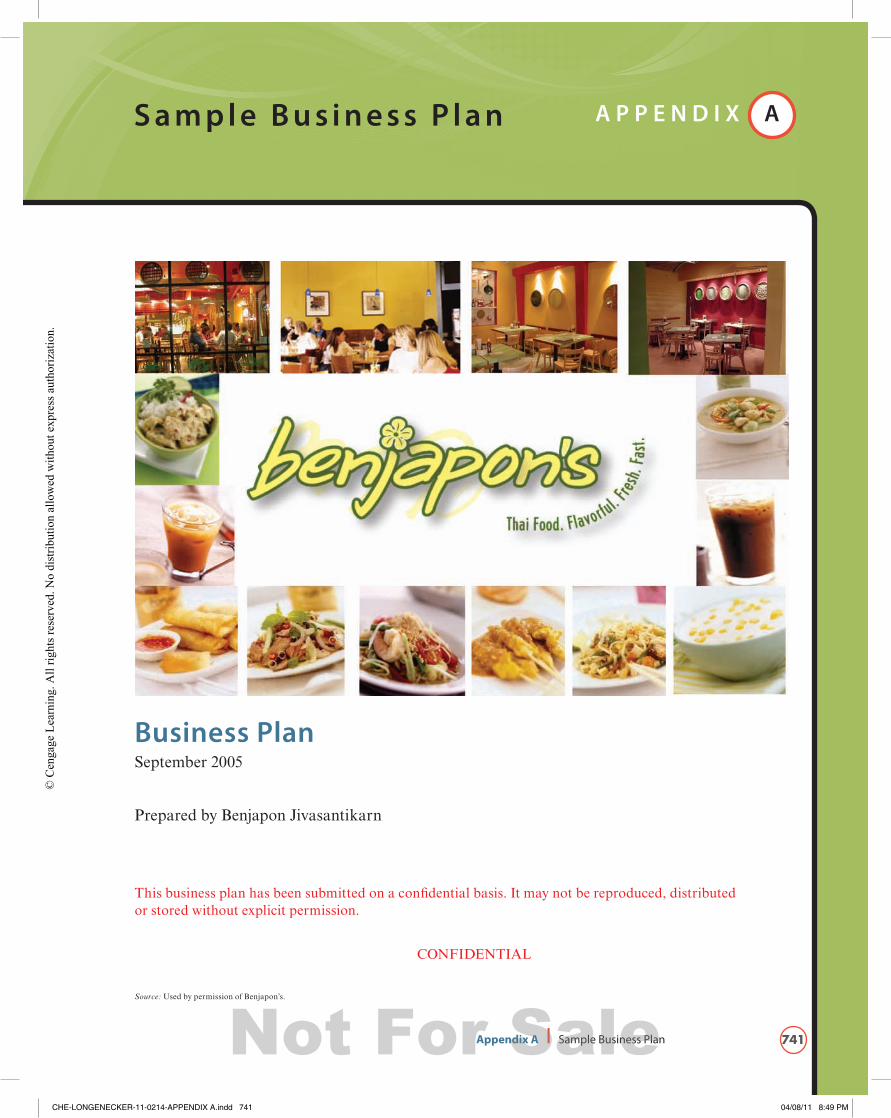
2.1 ThE rESTAurANT INDuSTry
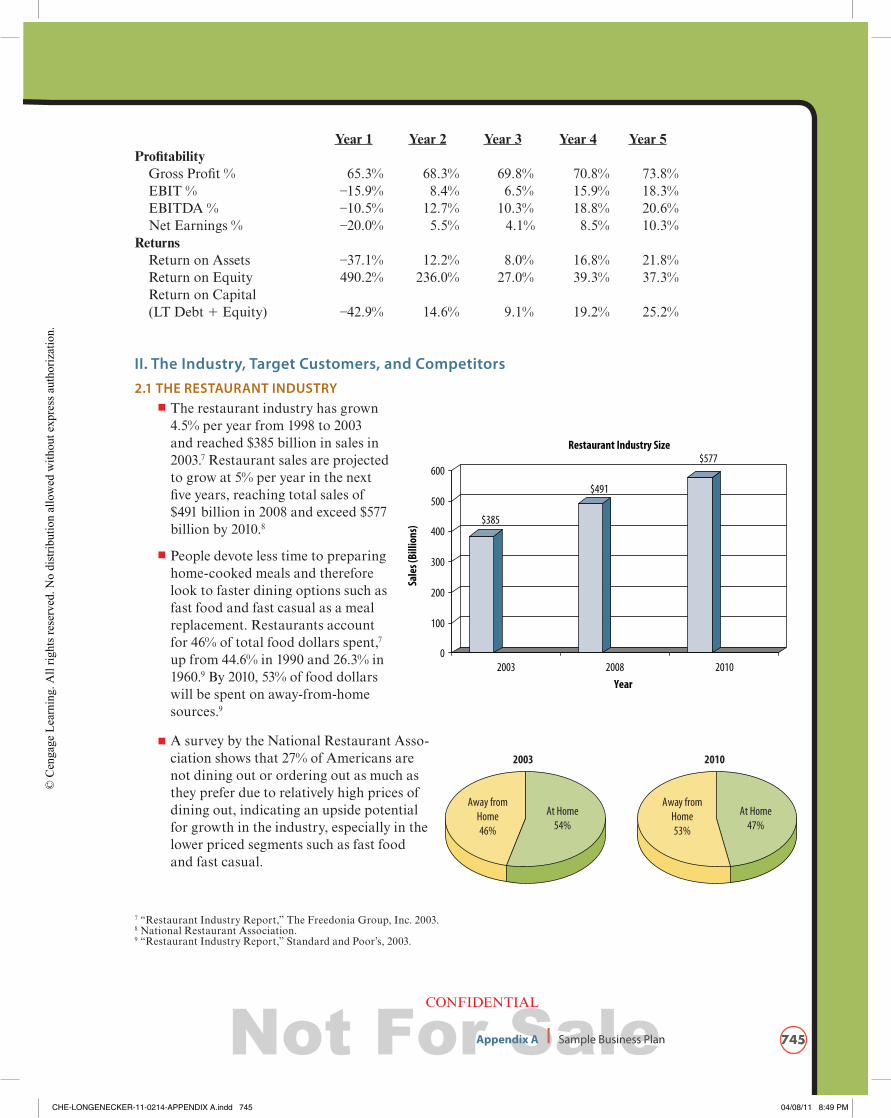
The restaurant industry has grown 4.5% per year from 1998 to 2003 and reached $385 billion in sales in 2003.7 Restaurant sales are projected to grow at 5% per year in the next five years, reaching total sales of $491 billion in 2008 and exceed $577 billion by 2010.8
People devote less time to preparing home-cooked meals and therefore look to faster dining options such as fast food and fast casual as a meal replacement. Restaurants account for 46% of total food dollars spent,7
up from 44.6% in 1990 and 26.3% in 1960.9 By 2010, 53% of food dollars will be spent on away-from-home sources.9
A survey by the National Restaurant Asso-ciation shows that 27% of Americans are not dining out or ordering out as much as they prefer due to relatively high prices of dining out, indicating an upside potential for growth in the industry, especially in the lower priced segments such as fast food and fast casual.
7 “Restaurant Industry Report,” The Freedonia Group, Inc. 2003.8 National Restaurant Association.9 “Restaurant Industry Report,” Standard and Poor’s, 2003.
$385
$491
$577
0
100
200
300
400
500
600
Sale
s (Bi
llion
s)
2003 2008 2010
Year
Restaurant Industry Size
20102003
At Home54%
Away fromHome46%
At Home47%
Away fromHome53%
CHE-LONGENECKER-11-0214-APPENDIX A.indd 745 04/08/11 8:49 PM
Not For Sale
© C
enga
ge L
earn
ing.
All
right
s res
erve
d. N
o di
strib
utio
n al
low
ed w
ithou
t exp
ress
aut
horiz
atio
n.
746 Appendix A I Sample Business Plan
CONFIDENTIAL
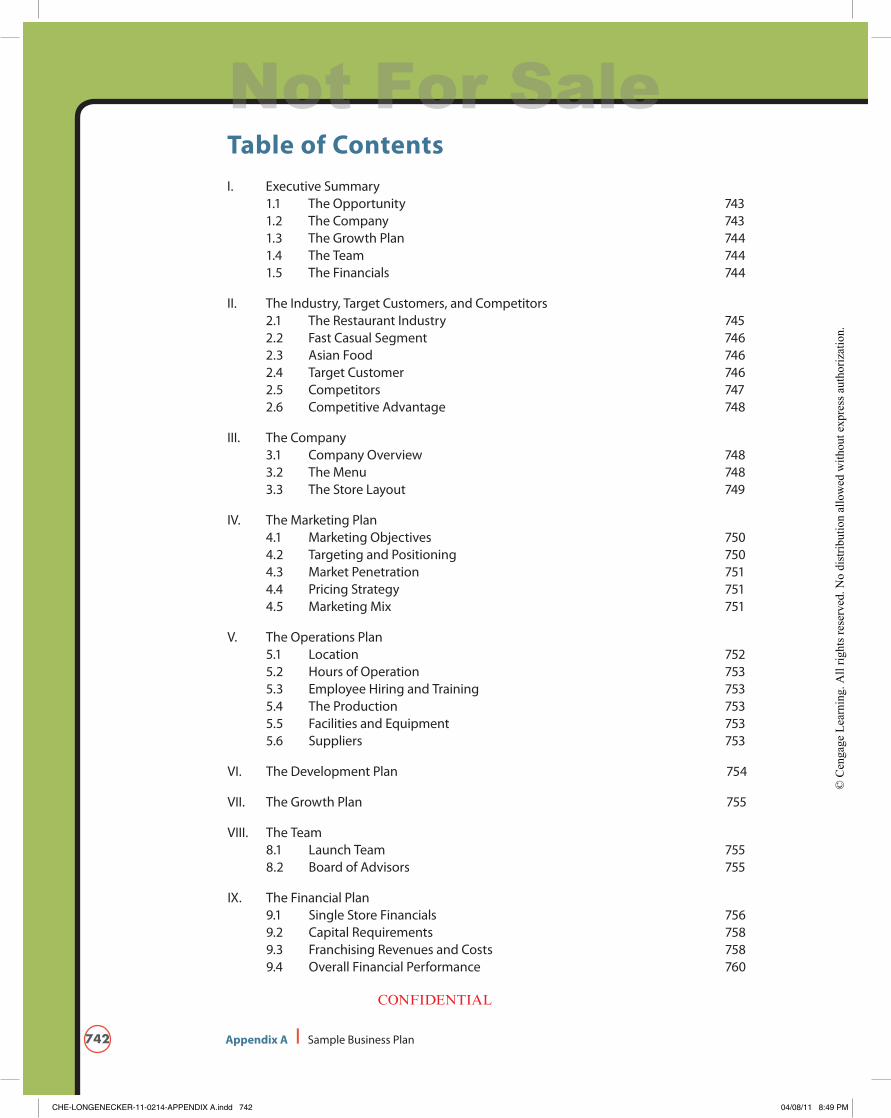
2.2 FAST CASuAl SEGmENT
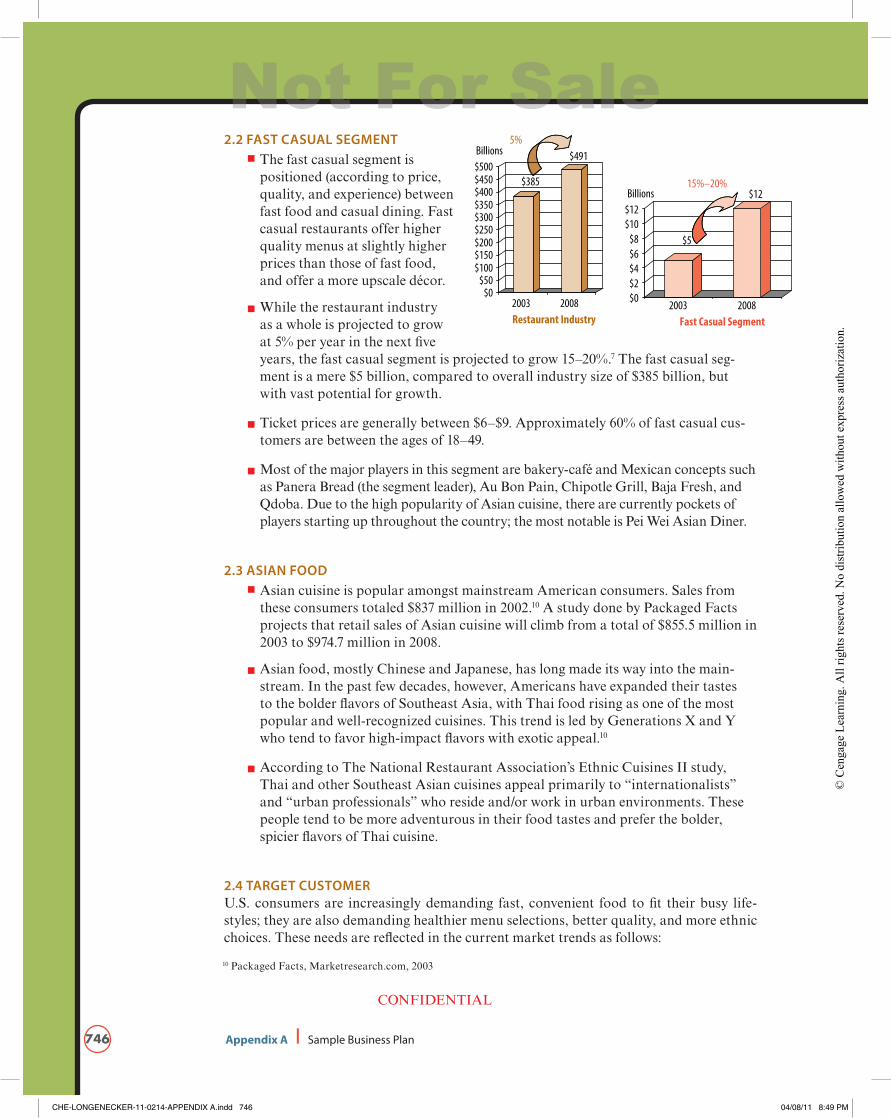
The fast casual segment is positioned (according to price, quality, and experience) between fast food and casual dining. Fast casual restaurants offer higher quality menus at slightly higher prices than those of fast food, and offer a more upscale décor.
While the restaurant industry as a whole is projected to grow at 5% per year in the next five years, the fast casual segment is projected to grow 15–20%.7 The fast casual seg-ment is a mere $5 billion, compared to overall industry size of $385 billion, but with vast potential for growth.
Ticket prices are generally between $6–$9. Approximately 60% of fast casual cus-tomers are between the ages of 18–49.
Most of the major players in this segment are bakery-café and Mexican concepts such as Panera Bread (the segment leader), Au Bon Pain, Chipotle Grill, Baja Fresh, and Qdoba. Due to the high popularity of Asian cuisine, there are currently pockets of players starting up throughout the country; the most notable is Pei Wei Asian Diner.
2.3 ASIAN FOOD
Asian cuisine is popular amongst mainstream American consumers. Sales from these consumers totaled $837 million in 2002.10 A study done by Packaged Facts projects that retail sales of Asian cuisine will climb from a total of $855.5 million in 2003 to $974.7 million in 2008.
Asian food, mostly Chinese and Japanese, has long made its way into the main-stream. In the past few decades, however, Americans have expanded their tastes to the bolder flavors of Southeast Asia, with Thai food rising as one of the most popular and well-recognized cuisines. This trend is led by Generations X and Y who tend to favor high-impact flavors with exotic appeal.10
According to The National Restaurant Association’s Ethnic Cuisines II study, Thai and other Southeast Asian cuisines appeal primarily to “internationalists” and “urban professionals” who reside and/or work in urban environments. These people tend to be more adventurous in their food tastes and prefer the bolder, spicier flavors of Thai cuisine.
2.4 TArGET CuSTOmErU.S. consumers are increasingly demanding fast, convenient food to fit their busy life-styles; they are also demanding healthier menu selections, better quality, and more ethnic choices. These needs are reflected in the current market trends as follows:
10 Packaged Facts, Marketresearch.com, 2003
$0$50
$100$150$200$250$300$350$400$450$500
2003 2008 $0$2$4$6$8
$10$12
2003 2008Restaurant Industry
$385
$4915%
15%–20%
$5
$12
Billions
Billions
Fast Casual Segment
CHE-LONGENECKER-11-0214-APPENDIX A.indd 746 04/08/11 8:49 PM
Not For Sale
© C
enga
ge L
earn
ing.
All
right
s res
erve
d. N
o di
strib
utio
n al
low
ed w
ithou
t exp
ress
aut
horiz
atio
n.
747Appendix A I Sample Business Plan
CONFIDENTIAL
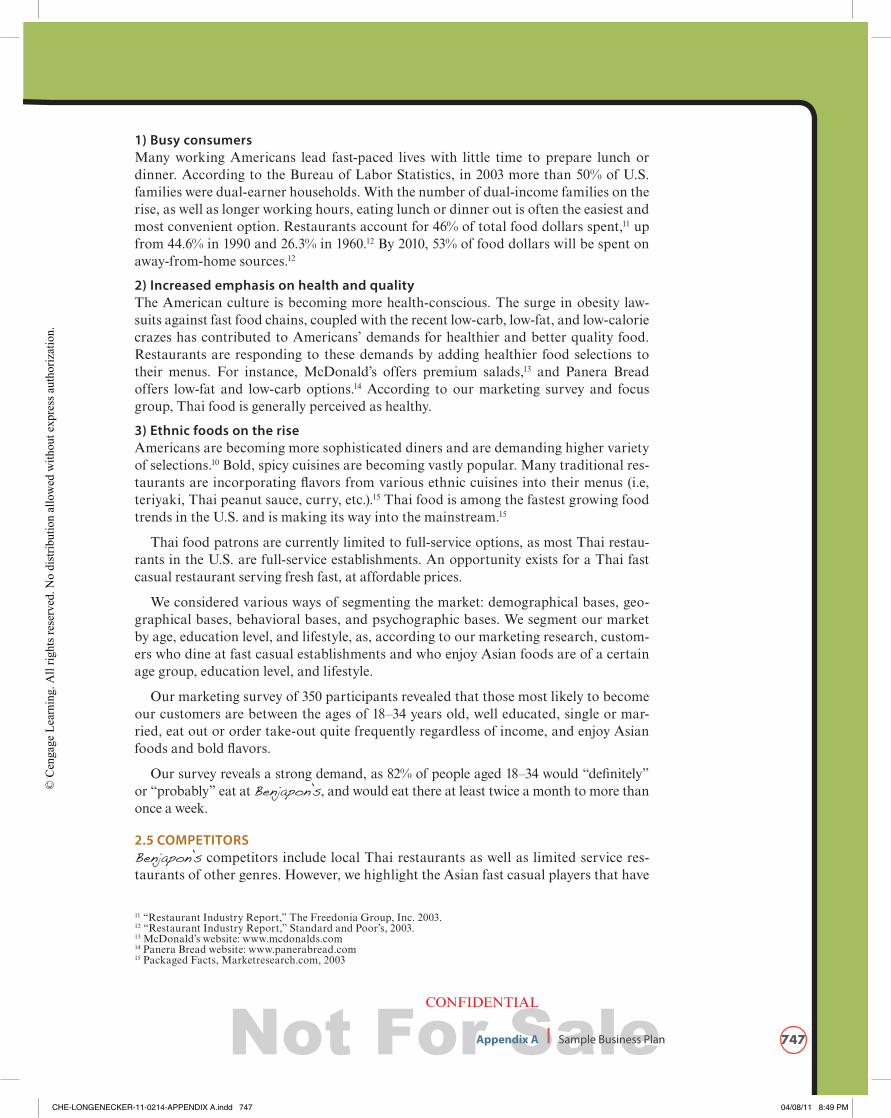
1) Busy consumersMany working Americans lead fast-paced lives with little time to prepare lunch or dinner. According to the Bureau of Labor Statistics, in 2003 more than 50% of U.S. families were dual-earner households. With the number of dual-income families on the rise, as well as longer working hours, eating lunch or dinner out is often the easiest and most convenient option. Restaurants account for 46% of total food dollars spent,11 up from 44.6% in 1990 and 26.3% in 1960.12 By 2010, 53% of food dollars will be spent on away-from-home sources.12
2) Increased emphasis on health and qualityThe American culture is becoming more health-conscious. The surge in obesity law-suits against fast food chains, coupled with the recent low-carb, low-fat, and low-calorie crazes has contributed to Americans’ demands for healthier and better quality food. Restaurants are responding to these demands by adding healthier food selections to their menus. For instance, McDonald’s offers premium salads,13 and Panera Bread offers low-fat and low-carb options.14 According to our marketing survey and focus group, Thai food is generally perceived as healthy.
3) Ethnic foods on the riseAmericans are becoming more sophisticated diners and are demanding higher variety of selections.10 Bold, spicy cuisines are becoming vastly popular. Many traditional res-taurants are incorporating flavors from various ethnic cuisines into their menus (i.e, teriyaki, Thai peanut sauce, curry, etc.).15 Thai food is among the fastest growing food trends in the U.S. and is making its way into the mainstream.15
Thai food patrons are currently limited to full-service options, as most Thai restau-rants in the U.S. are full-service establishments. An opportunity exists for a Thai fast casual restaurant serving fresh fast, at affordable prices.
We considered various ways of segmenting the market: demographical bases, geo-graphical bases, behavioral bases, and psychographic bases. We segment our market by age, education level, and lifestyle, as, according to our marketing research, custom-ers who dine at fast casual establishments and who enjoy Asian foods are of a certain age group, education level, and lifestyle.
Our marketing survey of 350 participants revealed that those most likely to become our customers are between the ages of 18–34 years old, well educated, single or mar-ried, eat out or order take-out quite frequently regardless of income, and enjoy Asian foods and bold flavors.
Our survey reveals a strong demand, as 82% of people aged 18–34 would “definitely” or “probably” eat at Benjapon’s, and would eat there at least twice a month to more than once a week.
2.5 COmPETITOrSBenjapon’s competitors include local Thai restaurants as well as limited service res-taurants of other genres. However, we highlight the Asian fast casual players that have
11 “Restaurant Industry Report,” The Freedonia Group, Inc. 2003.12 “Restaurant Industry Report,” Standard and Poor’s, 2003.13 McDonald’s website: www.mcdonalds.com14 Panera Bread website: www.panerabread.com15 Packaged Facts, Marketresearch.com, 2003
CHE-LONGENECKER-11-0214-APPENDIX A.indd 747 04/08/11 8:49 PM
Not For Sale
© C
enga
ge L
earn
ing.
All
right
s res
erve
d. N
o di
strib
utio
n al
low
ed w
ithou
t exp
ress
aut
horiz
atio
n.
748 Appendix A I Sample Business Plan
CONFIDENTIAL
emerged in recent years as our benchmark companies and future potential competitors on an expansion scale. Our Asian fast casual competitors include the following:
Mama Fu’s: A Pan-Asian fast casual cuisine with ten stores and over 200 franchises sold. Founded in 2002, the first few stores are located mainly in the South and Mid-West. The average ticket price is about $7.50 for lunch and $10.50 for dinner. Mama Fu’s provides counter order and table delivery.
Noodles & Co.: A global noodle fast casual concept that focuses on healthy selections of noodles, salad, and grilled items. The company currently has 58 restaurants in six states focusing on the West, Mid-West, and Atlantic region. The company plans to franchise 240 new stores in the next four years.
Nothing But Noodles: A fast casual global noodle concept similar to Noodles & Co. The company emphasizes fresh ingredients. The company was founded in 2001 and has sold over 300 franchises, focusing on the South, Mid-West, and Northwest.
Pei Wei: A Pan-Asian fast casual sister restaurant to PF Chang’s. The company has over 50 stores, all company-owned. Pei Wei is located in the West and Southwest.
2.6 COmPETITIvE ADvANTAGEOur competitive advantage lies in our ability to consistently deliver our brand promise of flavorful, fresh, fast, fun, and friendly, through every customer touch point. We will develop standardized kitchen and front-end operations, which will subsequently lower costs and enable us to develop a franchising model.
III. The Company
3.1 COmPANy OvErvIEw
Benjapon’s is a fast casual restaurant serving fresh Thai food, fast, at affordable prices, in a fun, friendly atmosphere.
The restaurant will be counter-order, table-service style with an average ticket price of $8.50. Store hours will be from 11am–10pm, daily. We expect 40% of our business to come from take-out orders.
Our quality of service is a key point of differentiation. Thailand is known as “The Land of Smiles” and our hospitality is second to none. Benjapon’s will instill a cul-ture of superb customer service among all staff and employees, through a compre-hensive staffing and training program.
The size of the restaurant will be approximately 1,500 square feet with 50 seats.
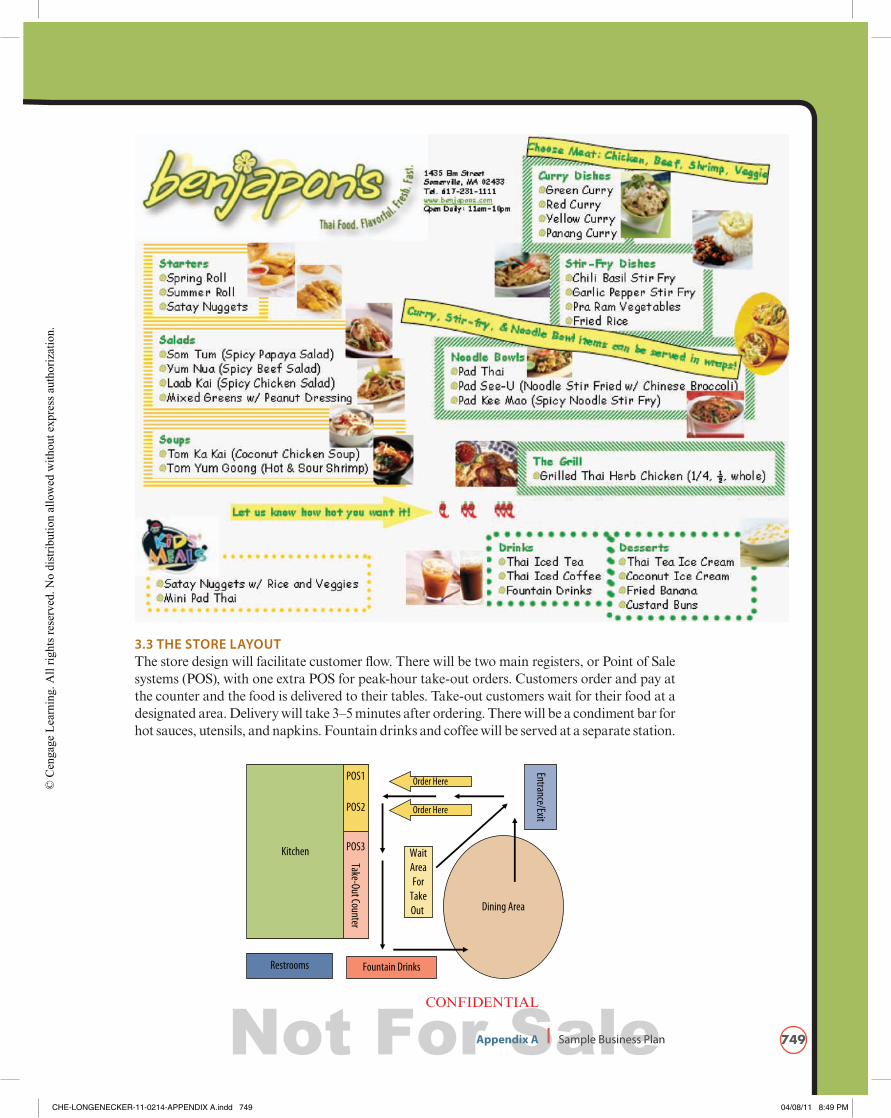
3.2 ThE mENuThe menu offers a familiar selection of Thai foods with description of ingredients and method of preparation for each dish. In addition, each menu item will be accompanied by a picture, to facilitate the decision-making of the customer and make the experience as stress-free as possible. Therefore, the menu selections will not be extensive, but lim-ited items that are familiar and exceptionally well-prepared. There will be a menu-board behind the ordering counter as well as a folded paper menu for take-out.
CHE-LONGENECKER-11-0214-APPENDIX A.indd 748 04/08/11 8:49 PM
Not For Sale
© C
enga
ge L
earn
ing.
All
right
s res
erve
d. N
o di
strib
utio
n al
low
ed w
ithou
t exp
ress
aut
horiz
atio
n.
749Appendix A I Sample Business Plan
CONFIDENTIAL
3.3 ThE STOrE lAyOuTThe store design will facilitate customer flow. There will be two main registers, or Point of Sale systems (POS), with one extra POS for peak-hour take-out orders. Customers order and pay at the counter and the food is delivered to their tables. Take-out customers wait for their food at a designated area. Delivery will take 3–5 minutes after ordering. There will be a condiment bar for hot sauces, utensils, and napkins. Fountain drinks and coffee will be served at a separate station.
Entrance/Exit
Kitchen
Fountain DrinksRestrooms
Dining Area
Order Here
-
Order Here
POS1
POS2
WaitAreaFor
TakeOut
POS3
Take-Out Counter
CHE-LONGENECKER-11-0214-APPENDIX A.indd 749 04/08/11 8:49 PM
Not For Sale
© C
enga
ge L
earn
ing.
All
right
s res
erve
d. N
o di
strib
utio
n al
low
ed w
ithou
t exp
ress
aut
horiz
atio
n.
750 Appendix A I Sample Business Plan
CONFIDENTIAL
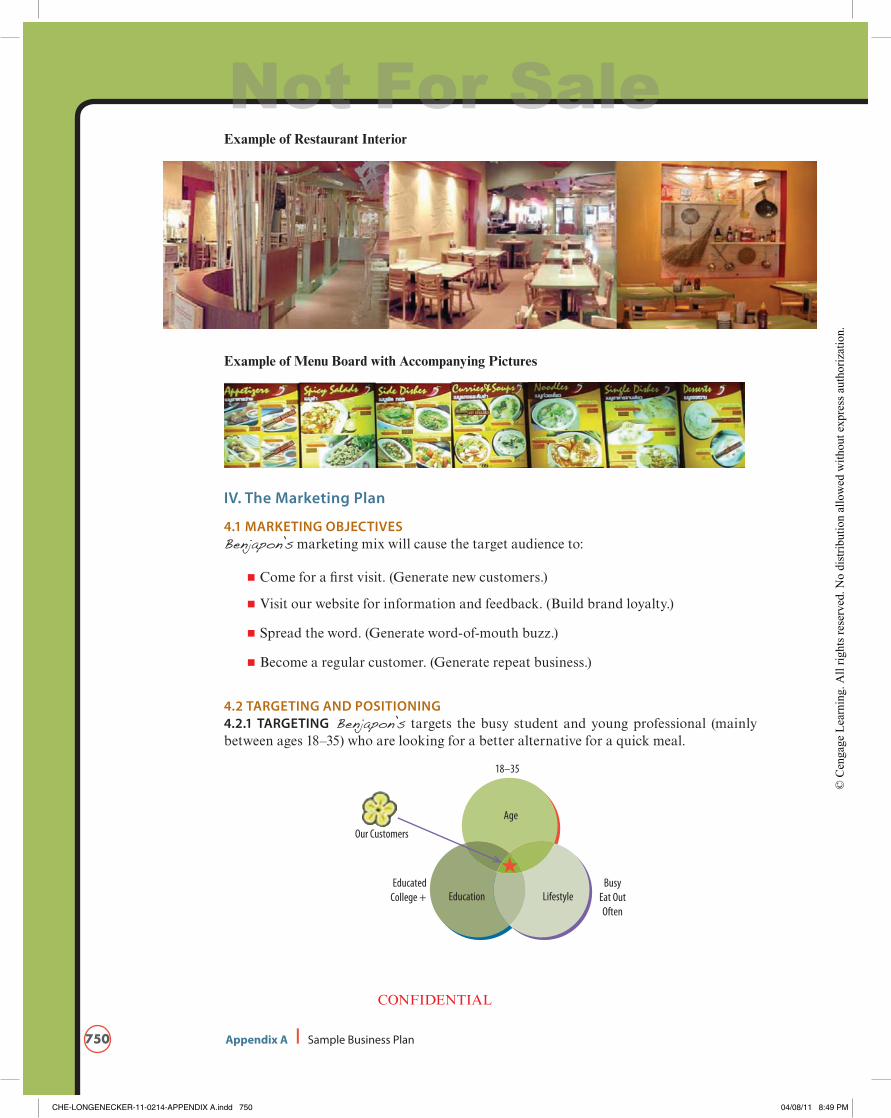
Example of Restaurant Interior
Example of Menu Board with Accompanying Pictures
Iv. The marketing Plan
4.1 mArkETING OBjECTIvESBenjapon’s marketing mix will cause the target audience to:
Come for a first visit. (Generate new customers.)
Visit our website for information and feedback. (Build brand loyalty.)
Spread the word. (Generate word-of-mouth buzz.)
Become a regular customer. (Generate repeat business.)
4.2 TArGETING AND POSITIONING4.2.1 TArGETING Benjapon’s targets the busy student and young professional (mainly between ages 18–35) who are looking for a better alternative for a quick meal.
Age
18–35
Education LifestyleBusy
Eat OutOften
EducatedCollege +
Our Customers
CHE-LONGENECKER-11-0214-APPENDIX A.indd 750 04/08/11 8:49 PM
Not For Sale
© C
enga
ge L
earn
ing.
All
right
s res
erve
d. N
o di
strib
utio
n al
low
ed w
ithou
t exp
ress
aut
horiz
atio
n.
751Appendix A I Sample Business Plan
CONFIDENTIAL
Our first location will be in the Somerville/Cambridge area, located near Tufts Univer-sity, Harvard University, and MIT. Both Somerville and Cambridge are populated with relatively young demographics. The median age of Somerville residents around Davis and Porter Squares is 30 years old.16 In addition, Somerville boasts a median family income and per capital income that are higher than national averages. The city of Cambridge also has a young demographic, with the largest group (38.6%) between 25–44 years old, followed by 18–24 years old at 21.2%. Cambridge boasts a highly educated population with over 65% of its residents over 25 years old achieving a bachelor’s degree or higher.17
4.2.2 POSITIONING Benjapon’s is positioned as
“A Thai Fast Casual restaurant that offers the busy customer a flavorful, fresh, fast, and fun dining experience.”
Our marketing survey reveals a strong demand, as 82% of people aged 18–34 would “defi-nitely” or “probably” eat at Benjapon’s.
4.3 mArkET PENETrATION The store will be located in an area with high visibility and heavy foot and car traffic, with cumulative attraction of nearby retailers and entertainment. We expect to generate high pre-store opening interest from local residents and students, via direct mailing of menu and coupons, and postings of flyers (count-down to opening day).
Our Financial Plan in Section IX provides further details on the costs involved in our marketing budget.
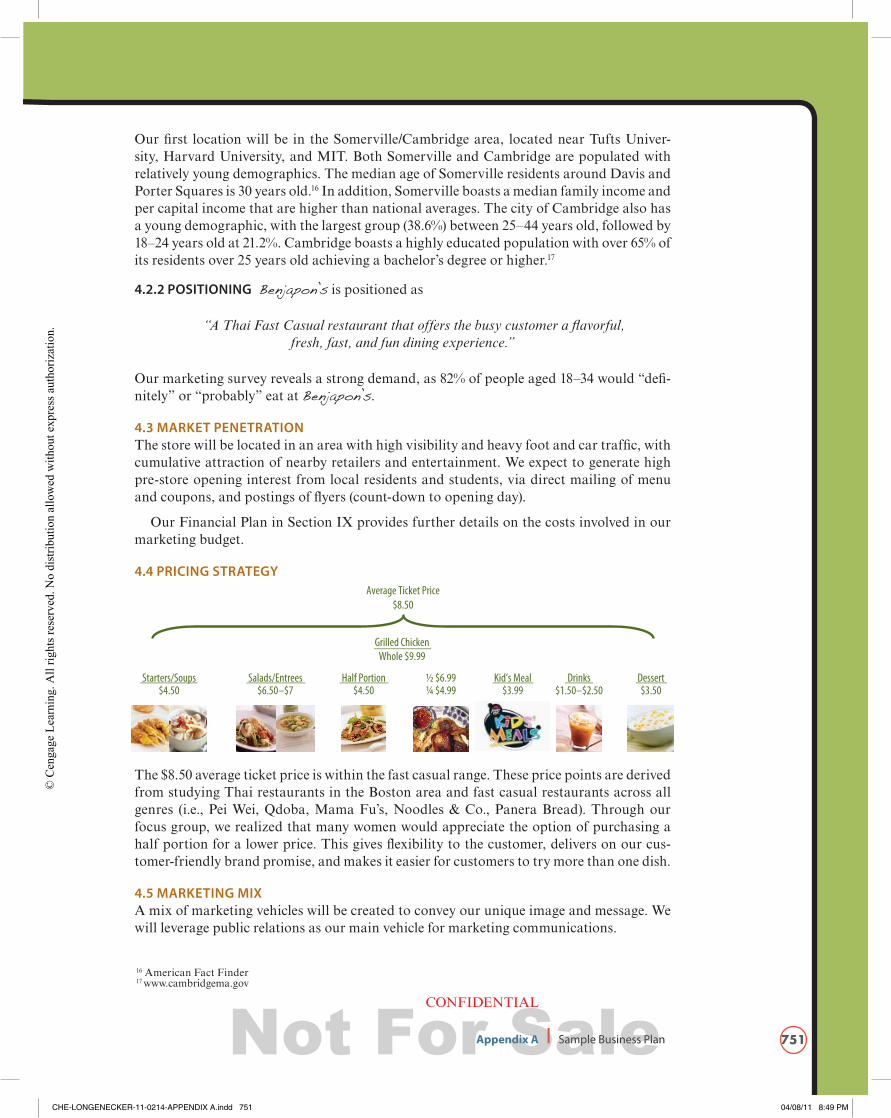
4.4 PrICING STrATEGy
Grilled ChickenWhole $9.99
Starters/Soups$4.50
Salads/Entrees$6.50–$7
Half Portion$4.50
Drinks$1.50–$2.50
Dessert$3.50
½ $6.99¼ $4.99
Kid’s Meal$3.99
Average Ticket Price$8.50
The $8.50 average ticket price is within the fast casual range. These price points are derived from studying Thai restaurants in the Boston area and fast casual restaurants across all genres (i.e., Pei Wei, Qdoba, Mama Fu’s, Noodles & Co., Panera Bread). Through our focus group, we realized that many women would appreciate the option of purchasing a half portion for a lower price. This gives flexibility to the customer, delivers on our cus-tomer-friendly brand promise, and makes it easier for customers to try more than one dish.
4.5 mArkETING mIXA mix of marketing vehicles will be created to convey our unique image and message. We will leverage public relations as our main vehicle for marketing communications.
16 American Fact Finder17 www.cambridgema.gov
CHE-LONGENECKER-11-0214-APPENDIX A.indd 751 04/08/11 8:49 PM
Not For Sale
© C
enga
ge L
earn
ing.
All
right
s res
erve
d. N
o di
strib
utio
n al
low
ed w
ithou
t exp
ress
aut
horiz
atio
n.
752 Appendix A I Sample Business Plan
CONFIDENTIAL
1) Print media: Local newspapers, magazines and student publications.
2) Broadcast media: Local programming and radio stations.
3) Local colleges: Communication with local colleges.
4) Direct mail: Mail menu and coupons to local residential neighborhoods. See our Financial Plan in Section IX for details on mailing costs.
5) Become part of community: Community involvement and donations.
Our strategy is to build the Benjapon’s brand by delivering a consistent message to our customers at every touch point. Everything we do will be associated with Thai food that is flavorful, fresh, fast, fun, and friendly. Our goal is to have top of mind awareness with customers and to build a brand that commands a loyal following.
v. The Operations Plan
5.1 lOCATIONOur strategy is to locate in a convenient location close to our target market. The following are our criteria for location:
5.1.1 rEAl ESTATE CrITErIA1) Population
We aim to locate near our target market of 18–35 year-old students and young working professionals who are well-educated and busy, and earn above average income. The following are our criteria:
Locate near target market. That is: Near college or university, and Near residential area populated by young working professionals, and Near local businesses.
High concentration of daytime population: 10,000 within a one mile radius
Residential population: 15,000 within one mile or 60,000 within three miles
Income: Median household income in the top 30% for the MSA (Metropolitan Sta-tistical Area)
Per capita income 20% greater than MSA average
2) Traffic volume We favor locations with high foot traffic, and to a lesser degree, vehicle traffic.
Thus we elect to locate near such synergistic retailers that draw foot traffic such as other restaurants, entertainment, daily needs shopping, as well as daytime employment.
3) Site visibility The site should be easily spotted by a walking or driving target customer from
both sides of the street across all seasons.
4) Site neighbors
The site should be surrounded by other synergistic businesses to draw foot traffic.
The site should be located near other restaurant of other genres in order to at-tract the “food” crowd.
CHE-LONGENECKER-11-0214-APPENDIX A.indd 752 04/08/11 8:49 PM
Not For Sale
© C
enga
ge L
earn
ing.
All
right
s res
erve
d. N
o di
strib
utio
n al
low
ed w
ithou
t exp
ress
aut
horiz
atio
n.
753Appendix A I Sample Business Plan
CONFIDENTIAL
5) The site
High visibility site of approximately 1,500 square feet Location specific parking not required. Although we rely more on foot traffic, street parking should be reasonably available.
5.1.2 POTENTIAl lOCATION According to our criteria, we are working with realtors and specifi-cally focusing on the various “Squares” in the cities of Somerville and Cambridge. That is, Davis Square, Porter Square, Inman Square, Union Square, Kendall Square, and Harvard Square.
5.2 hOurS OF OPErATIONThe restaurant will be open for lunch and dinner, daily. Service will begin at 11:00am and end at 10:00pm. The restaurant will be closed for Christmas, Thanksgiving, New Year’s Eve and Day, and the Fourth of July.
5.3 EmPlOyEE hIrING AND TrAININGWe will develop a comprehensive hiring and training manual. Kitchen employees will be hired based on prior experience in Asian, preferably Thai, kitchens. Supranee Siriaphanot, former chef and owner of a Thai restaurant in Texas, and Ron Noonprasith, a chef and res-taurant owner in Thailand, will both join the team as head chefs. They will be responsible for training kitchen staff and standardizing our processes.
5.4 ThE PrODuCTIONThe kitchen will be closed from customers’ view to create a cleaner look and feel. Food pro-duction in the initial store will be headed by a chef and will be standardized and measurable, facilitating the training process for our kitchen staff. The kitchen comprises 40% of the store space and is closed from customers’ view. The kitchen computer receives the information ordered from the front registers.
5.4.1 EmPlOyEESFull-Time Employees: Initially, we need three full-time employees – the founder, a store manager, and a chef.Hourly Employees: We need four hourly employees present (plus the three full-time employees). During non-peak hours, we need one hourly employee, along with the three full-time employees.
5.5 FACIlITIES AND EquIPmENTSpace: We will focus on leasing a space that is approximately 1,500 square feet and that is formerly a restaurant and needs only minor modifications.
Equipment: Equipment will be purchased and installed by one of the following companies:
The Boston Showcase company, who can also provide assistance with the restaurant design and architecture.
Seidman Brothers.
5.6 SuPPlIErS
We will source our meat and vegetables from Sysco or Performance Food Group.
We will purchase our cleaning supplies from Sysco or PFG. We will reorder supplies on an as-needed basis.
We will purchase smallware from Sysco or US Foodservice.
CHE-LONGENECKER-11-0214-APPENDIX A.indd 753 04/08/11 8:49 PM
Not For Sale
© C
enga
ge L
earn
ing.
All
right
s res
erve
d. N
o di
strib
utio
n al
low
ed w
ithou
t exp
ress
aut
horiz
atio
n.
754 Appendix A I Sample Business Plan
CONFIDENTIAL
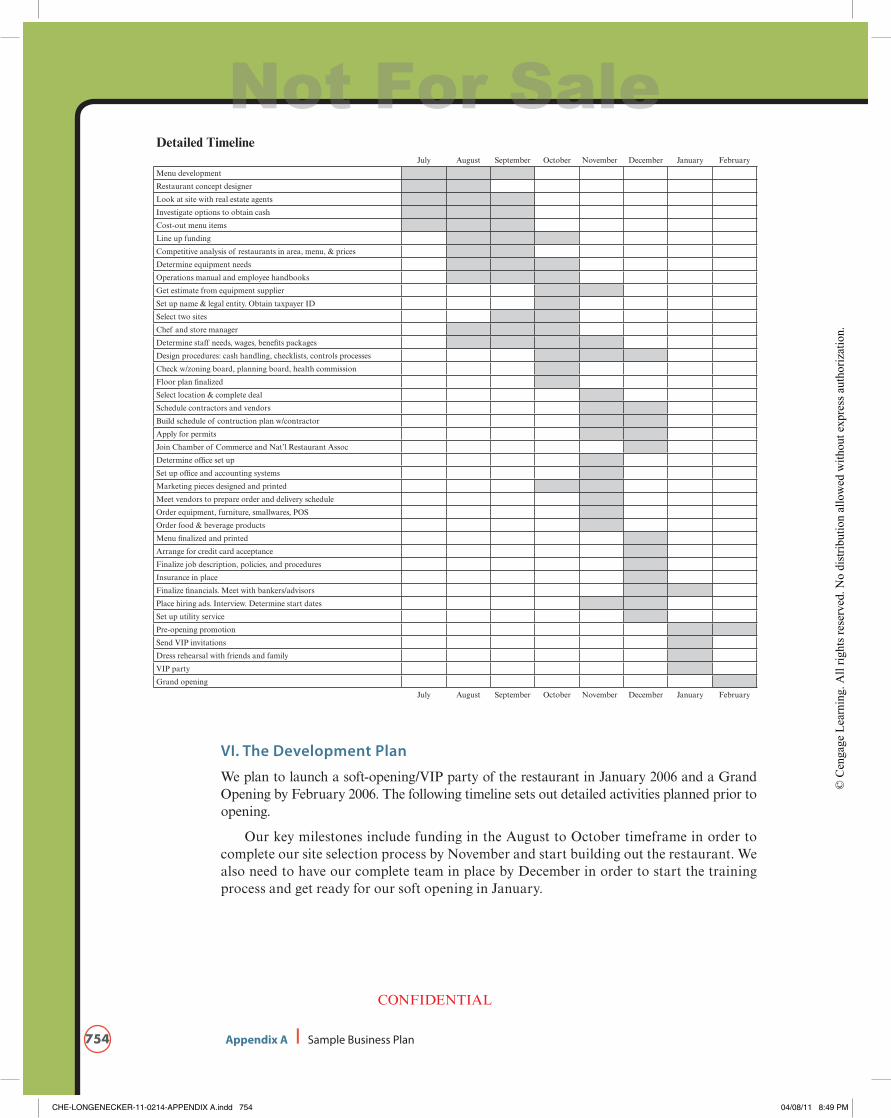
vI. The Development Plan
We plan to launch a soft-opening/VIP party of the restaurant in January 2006 and a Grand Opening by February 2006. The following timeline sets out detailed activities planned prior to opening.
Our key milestones include funding in the August to October timeframe in order to complete our site selection process by November and start building out the restaurant. We also need to have our complete team in place by December in order to start the training process and get ready for our soft opening in January.
Detailed TimelineJuly August September October November December January February
Menu development
Restaurant concept designer
Look at site with real estate agents
Investigate options to obtain cash
Cost-out menu items
Line up funding
Competitive analysis of restaurants in area, menu, & prices
Determine equipment needs
Operations manual and employee handbooks
Get estimate from equipment supplier
Set up name & legal entity. Obtain taxpayer ID
Select two sites
Chef and store manager
Determine staff needs, wages, benefits packages
Design procedures: cash handling, checklists, controls processes
Check w/zoning board, planning board, health commission
Floor plan finalized
Select location & complete deal
Schedule contractors and vendors
Build schedule of contruction plan w/contractor
Apply for permits
Join Chamber of Commerce and Nat’l Restaurant Assoc
Determine office set up
Set up office and accounting systems
Marketing pieces designed and printed
Meet vendors to prepare order and delivery schedule
Order equipment, furniture, smallwares, POS
Order food & beverage products
Menu finalized and printed
Arrange for credit card acceptance
Finalize job description, policies, and procedures
Insurance in place
Finalize financials. Meet with bankers/advisors
Place hiring ads. Interview. Determine start dates
Set up utility service
Pre-opening promotion
Send VIP invitations
Dress rehearsal with friends and family
VIP party
Grand opening
July August September October November December January February
CHE-LONGENECKER-11-0214-APPENDIX A.indd 754 04/08/11 8:49 PM
Not For Sale
© C
enga
ge L
earn
ing.
All
right
s res
erve
d. N
o di
strib
utio
n al
low
ed w
ithou
t exp
ress
aut
horiz
atio
n.
755Appendix A I Sample Business Plan
CONFIDENTIAL
vII. The Growth Plan
Our plan is to grow via franchising after opening two company-owned stores.
The plan is to start selling franchises in the fourth year of operations. In the third year of operations, the second store is to be opened and plans are set to build an infrastructure to support the franchising strategy.
We plan to grow nationwide via franchising after meeting our goals for the local areas.
vIII. The Team
8.1 lAuNCh TEAmFounder: Benjapon Jivasantikarn is a 2005 fellow and MBA graduate of Babson Col-lege, the nation’s #1 program for entrepreneurship. Prior to graduate school, Benjapon worked for six years at KPMG (a Big Four professional services firm) in San Francisco in business incentives and valuations. Although her background is in finance, her pas-sion lies in the foodservice industry. Throughout her undergraduate years in Texas, she worked in a Thai restaurant, gaining operations and customer service experience. She also worked at Panera Bread part-time during graduate school to gain further insight into the fast casual business. She was a finalist in the Douglass Graduate Busi-ness Plan Competition and won the Sorensen Award for Entrepreneurial and Aca-demic Excellence.
General Manager: Zack Noonprasith has six years’ experience in financial services and five years’ experience in restaurant management. Zack will work with the founder on day-to-day operations and on developing and standardizing the system in prepara-tion for replication and franchising.
Chef: Supranee Siriaphanot was a co-founder and chef of a Thai restaurant in Texas for over 15 years. She will oversee food preparation in the kitchen and develop standardized processes, as well as train part-time staff on those processes.
8.2 BOArD OF ADvISOrS
Rick Hagelstein Mr. Hagelstein, a life-long successful entrepreneur, is the founder and CEO of The Minor Group, a hospitality and leisure, food service, and lifestyle company in Thailand and Asia Pacific. The Minor Group comprises two companies: Minor International and Minor Corporation. The Minor International is the Thai franchisee of Burger King, Swensen’s, Dairy Queen, and Sizzler. After ending a Pizza Hut franchising relationship with Yum! Brands, the Minor Food Group founded The Pizza Company which now owns 75% of the pizza market in Thailand and is expand-ing to franchised locations throughout Asia.
Steve Sabre Dr. Sabre is a franchising expert and is a recognized leader in defining the field of entrepreneurship. He co-founded Jiffy Lube International and subsequently
CHE-LONGENECKER-11-0214-APPENDIX A.indd 755 04/08/11 8:49 PM
Not For Sale
© C
enga
ge L
earn
ing.
All
right
s res
erve
d. N
o di
strib
utio
n al
low
ed w
ithou
t exp
ress
aut
horiz
atio
n.
756 Appendix A I Sample Business Plan
CONFIDENTIAL
founded and served as chairman and CEO of American Oil Corporation, which he sold in 1991. As an educator, he has authored numerous business cases and coau-thored the following books: Franchising: Pathway to Wealth Creation, Business Plans for the 21st Century, and New Venture Creation for the 21st Century. Dr. Sabre has con-sulted for major corporations such as Fidelity Investments, Intel Corporation, IBM Corporation, and Allied Domecq.
Hull Martin Dr. Martin is the Chair of the Entrepreneurship Department and Edith Y. Babson Term Chair in Entrepreneurship. Martin’s primary research areas include the venture capital process and entrepreneurial growth strategies. Dr. Martin actively consults with entrepreneurs and small business startups. He is a former venture capi-talist with experience in the restaurant field.
IX. The Financial Plan
9.1 SINGlE STOrE FINANCIAlSIn this section, we discuss the unit economics of our first store.
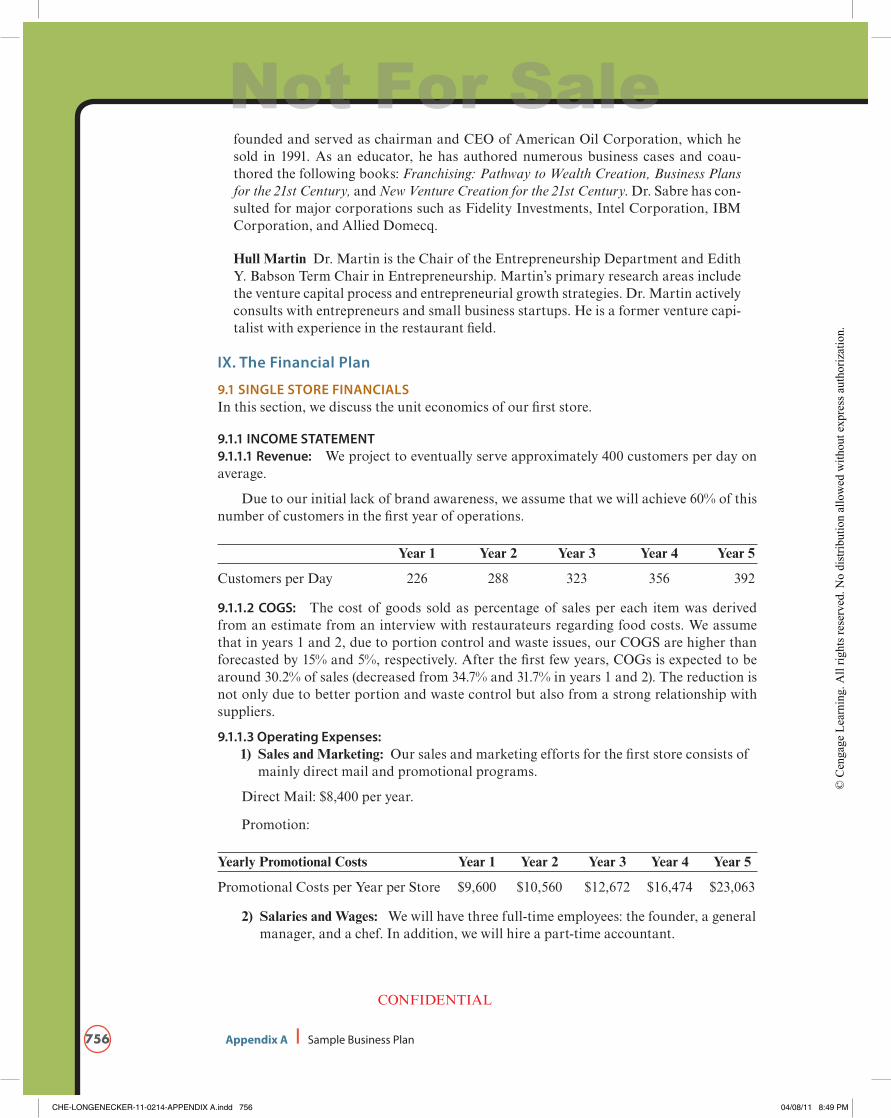
9.1.1 INCOmE STATEmENT9.1.1.1 revenue: We project to eventually serve approximately 400 customers per day on average.
Due to our initial lack of brand awareness, we assume that we will achieve 60% of this number of customers in the first year of operations.
Year 1 Year 2 Year 3 Year 4 Year 5
Customers per Day 226 288 323 356 392
9.1.1.2 COGS: The cost of goods sold as percentage of sales per each item was derived from an estimate from an interview with restaurateurs regarding food costs. We assume that in years 1 and 2, due to portion control and waste issues, our COGS are higher than forecasted by 15% and 5%, respectively. After the first few years, COGs is expected to be around 30.2% of sales (decreased from 34.7% and 31.7% in years 1 and 2). The reduction is not only due to better portion and waste control but also from a strong relationship with suppliers.
9.1.1.3 Operating Expenses:1) Sales and Marketing: Our sales and marketing efforts for the first store consists of
mainly direct mail and promotional programs.
Direct Mail: $8,400 per year.
Promotion:
Yearly Promotional Costs Year 1 Year 2 Year 3 Year 4 Year 5
Promotional Costs per Year per Store $9,600 $10,560 $12,672 $16,474 $23,063
2) Salaries and Wages: We will have three full-time employees: the founder, a general manager, and a chef. In addition, we will hire a part-time accountant.
CHE-LONGENECKER-11-0214-APPENDIX A.indd 756 04/08/11 8:49 PM
Not For Sale
© C
enga
ge L
earn
ing.
All
right
s res
erve
d. N
o di
strib
utio
n al
low
ed w
ithou
t exp
ress
aut
horiz
atio
n.
757Appendix A I Sample Business Plan
CONFIDENTIAL
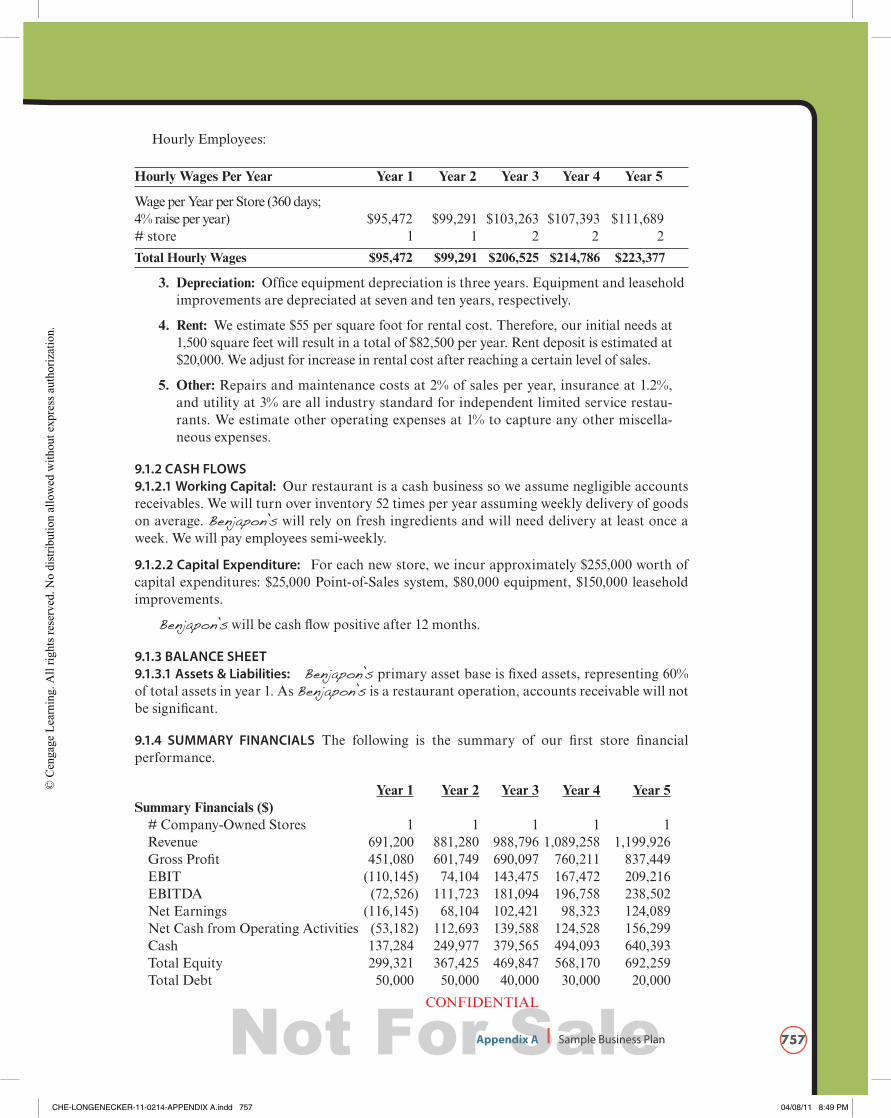
Hourly Employees:
Hourly Wages Per Year Year 1 Year 2 Year 3 Year 4 Year 5
Wage per Year per Store (360 days; 4% raise per year) $95,472 $99,291 $103,263 $107,393 $111,689# store 1 1 2 2 2
Total Hourly Wages $95,472 $99,291 $206,525 $214,786 $223,377
3. Depreciation: Office equipment depreciation is three years. Equipment and leasehold improvements are depreciated at seven and ten years, respectively.
4. Rent: We estimate $55 per square foot for rental cost. Therefore, our initial needs at 1,500 square feet will result in a total of $82,500 per year. Rent deposit is estimated at $20,000. We adjust for increase in rental cost after reaching a certain level of sales.
5. Other: Repairs and maintenance costs at 2% of sales per year, insurance at 1.2%, and utility at 3% are all industry standard for independent limited service restau-rants. We estimate other operating expenses at 1% to capture any other miscella-neous expenses.
9.1.2 CASh FlOwS9.1.2.1 working Capital: Our restaurant is a cash business so we assume negligible accounts receivables. We will turn over inventory 52 times per year assuming weekly delivery of goods on average. Benjapon’s will rely on fresh ingredients and will need delivery at least once a week. We will pay employees semi-weekly.
9.1.2.2 Capital Expenditure: For each new store, we incur approximately $255,000 worth of capital expenditures: $25,000 Point-of-Sales system, $80,000 equipment, $150,000 leasehold improvements.
Benjapon’s will be cash flow positive after 12 months.
9.1.3 BAlANCE ShEET9.1.3.1 Assets & liabilities: Benjapon’s primary asset base is fixed assets, representing 60% of total assets in year 1. As Benjapon’s is a restaurant operation, accounts receivable will not be significant.
9.1.4 SummAry FINANCIAlS The following is the summary of our first store financial performance.
Year 1 Year 2 Year 3 Year 4 Year 5Summary Financials ($) # Company-Owned Stores 1 1 1 1 1 Revenue 691,200 881,280 988,796 1,089,258 1,199,926 Gross Profit 451,080 601,749 690,097 760,211 837,449 EBIT (110,145) 74,104 143,475 167,472 209,216 EBITDA (72,526) 111,723 181,094 196,758 238,502 Net Earnings (116,145) 68,104 102,421 98,323 124,089 Net Cash from Operating Activities (53,182) 112,693 139,588 124,528 156,299 Cash 137,284 249,977 379,565 494,093 640,393 Total Equity 299,321 367,425 469,847 568,170 692,259 Total Debt 50,000 50,000 40,000 30,000 20,000
CHE-LONGENECKER-11-0214-APPENDIX A.indd 757 04/08/11 8:49 PM
Not For Sale
© C
enga
ge L
earn
ing.
All
right
s res
erve
d. N
o di
strib
utio
n al
low
ed w
ithou
t exp
ress
aut
horiz
atio
n.
758 Appendix A I Sample Business Plan
CONFIDENTIAL
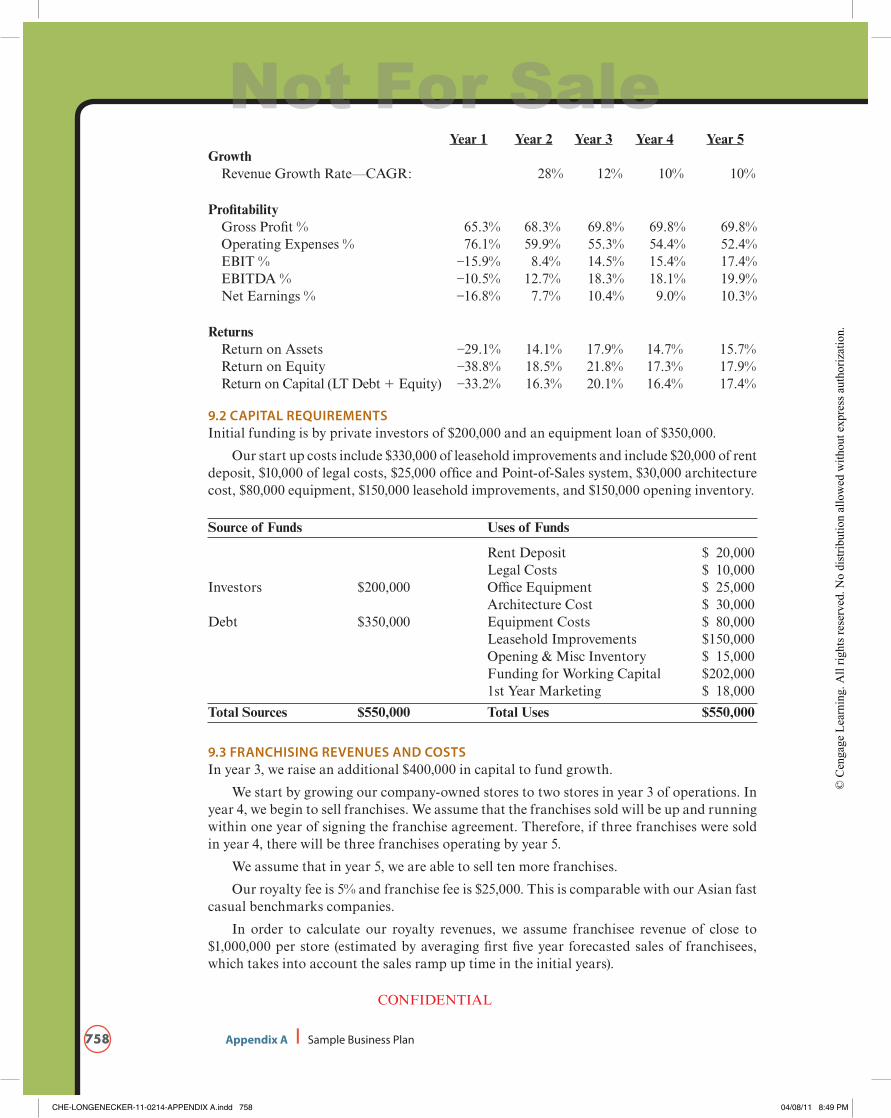
Year 1 Year 2 Year 3 Year 4 Year 5Growth Revenue Growth Rate—CAGR: 28% 12% 10% 10%
Profitability Gross Profit % 65.3% 68.3% 69.8% 69.8% 69.8% Operating Expenses % 76.1% 59.9% 55.3% 54.4% 52.4% EBIT % –15.9% 8.4% 14.5% 15.4% 17.4% EBITDA % –10.5% 12.7% 18.3% 18.1% 19.9% Net Earnings % –16.8% 7.7% 10.4% 9.0% 10.3%
Returns Return on Assets –29.1% 14.1% 17.9% 14.7% 15.7% Return on Equity –38.8% 18.5% 21.8% 17.3% 17.9% Return on Capital (LT Debt + Equity) –33.2% 16.3% 20.1% 16.4% 17.4%
9.2 CAPITAl rEquIrEmENTSInitial funding is by private investors of $200,000 and an equipment loan of $350,000.
Our start up costs include $330,000 of leasehold improvements and include $20,000 of rent deposit, $10,000 of legal costs, $25,000 office and Point-of-Sales system, $30,000 architecture cost, $80,000 equipment, $150,000 leasehold improvements, and $150,000 opening inventory.
Source of Funds Uses of Funds
Rent Deposit $ 20,000 Legal Costs $ 10,000Investors $200,000 Office Equipment $ 25,000 Architecture Cost $ 30,000Debt $350,000 Equipment Costs $ 80,000 Leasehold Improvements $150,000 Opening & Misc Inventory $ 15,000 Funding for Working Capital $202,000 1st Year Marketing $ 18,000
Total Sources $550,000 Total Uses $550,000
9.3 FrANChISING rEvENuES AND COSTSIn year 3, we raise an additional $400,000 in capital to fund growth.
We start by growing our company-owned stores to two stores in year 3 of operations. In year 4, we begin to sell franchises. We assume that the franchises sold will be up and running within one year of signing the franchise agreement. Therefore, if three franchises were sold in year 4, there will be three franchises operating by year 5.
We assume that in year 5, we are able to sell ten more franchises.
Our royalty fee is 5% and franchise fee is $25,000. This is comparable with our Asian fast casual benchmarks companies.
In order to calculate our royalty revenues, we assume franchisee revenue of close to $1,000,000 per store (estimated by averaging first five year forecasted sales of franchisees, which takes into account the sales ramp up time in the initial years).
CHE-LONGENECKER-11-0214-APPENDIX A.indd 758 04/08/11 8:49 PM
Not For Sale
© C
enga
ge L
earn
ing.
All
right
s res
erve
d. N
o di
strib
utio
n al
low
ed w
ithou
t exp
ress
aut
horiz
atio
n.
759Appendix A I Sample Business Plan
CONFIDENTIAL
Year 3 Year 4 Year 5
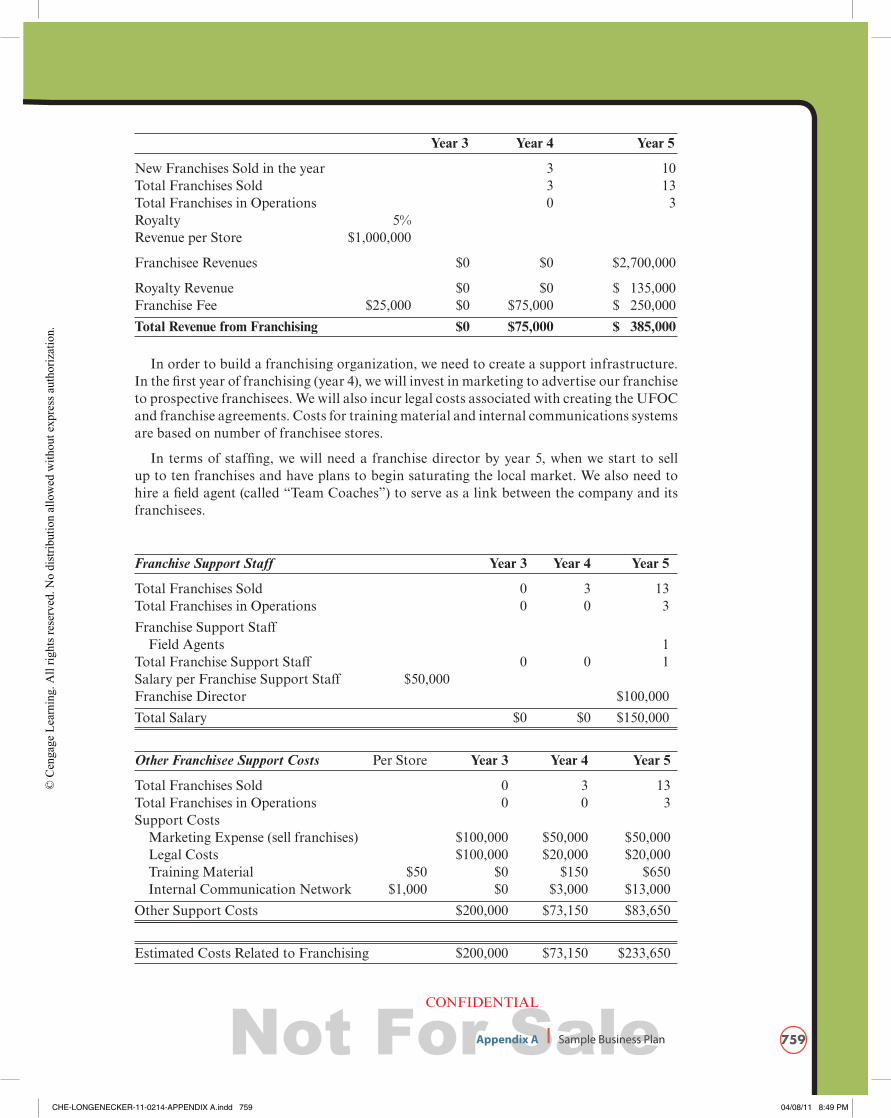
New Franchises Sold in the year 3 10Total Franchises Sold 3 13Total Franchises in Operations 0 3Royalty 5% Revenue per Store $1,000,000
Franchisee Revenues $0 $0 $2,700,000
Royalty Revenue $0 $0 $ 135,000Franchise Fee $25,000 $0 $75,000 $ 250,000
Total Revenue from Franchising $0 $75,000 $ 385,000
In order to build a franchising organization, we need to create a support infrastructure. In the first year of franchising (year 4), we will invest in marketing to advertise our franchise to prospective franchisees. We will also incur legal costs associated with creating the UFOC and franchise agreements. Costs for training material and internal communications systems are based on number of franchisee stores.
In terms of staffing, we will need a franchise director by year 5, when we start to sell up to ten franchises and have plans to begin saturating the local market. We also need to hire a field agent (called “Team Coaches”) to serve as a link between the company and its franchisees.
Franchise Support Staff Year 3 Year 4 Year 5
Total Franchises Sold 0 3 13Total Franchises in Operations 0 0 3
Franchise Support Staff Field Agents 1Total Franchise Support Staff 0 0 1Salary per Franchise Support Staff $50,000Franchise Director $100,000
Total Salary $0 $0 $150,000
Other Franchisee Support Costs Per Store Year 3 Year 4 Year 5
Total Franchises Sold 0 3 13Total Franchises in Operations 0 0 3Support Costs Marketing Expense (sell franchises) $100,000 $50,000 $50,000 Legal Costs $100,000 $20,000 $20,000 Training Material $50 $0 $150 $650 Internal Communication Network $1,000 $0 $3,000 $13,000
Other Support Costs $200,000 $73,150 $83,650
Estimated Costs Related to Franchising $200,000 $73,150 $233,650
CHE-LONGENECKER-11-0214-APPENDIX A.indd 759 04/08/11 8:49 PM
Not For Sale
© C
enga
ge L
earn
ing.
All
right
s res
erve
d. N
o di
strib
utio
n al
low
ed w
ithou
t exp
ress
aut
horiz
atio
n.
760 Appendix A I Sample Business Plan
CONFIDENTIAL
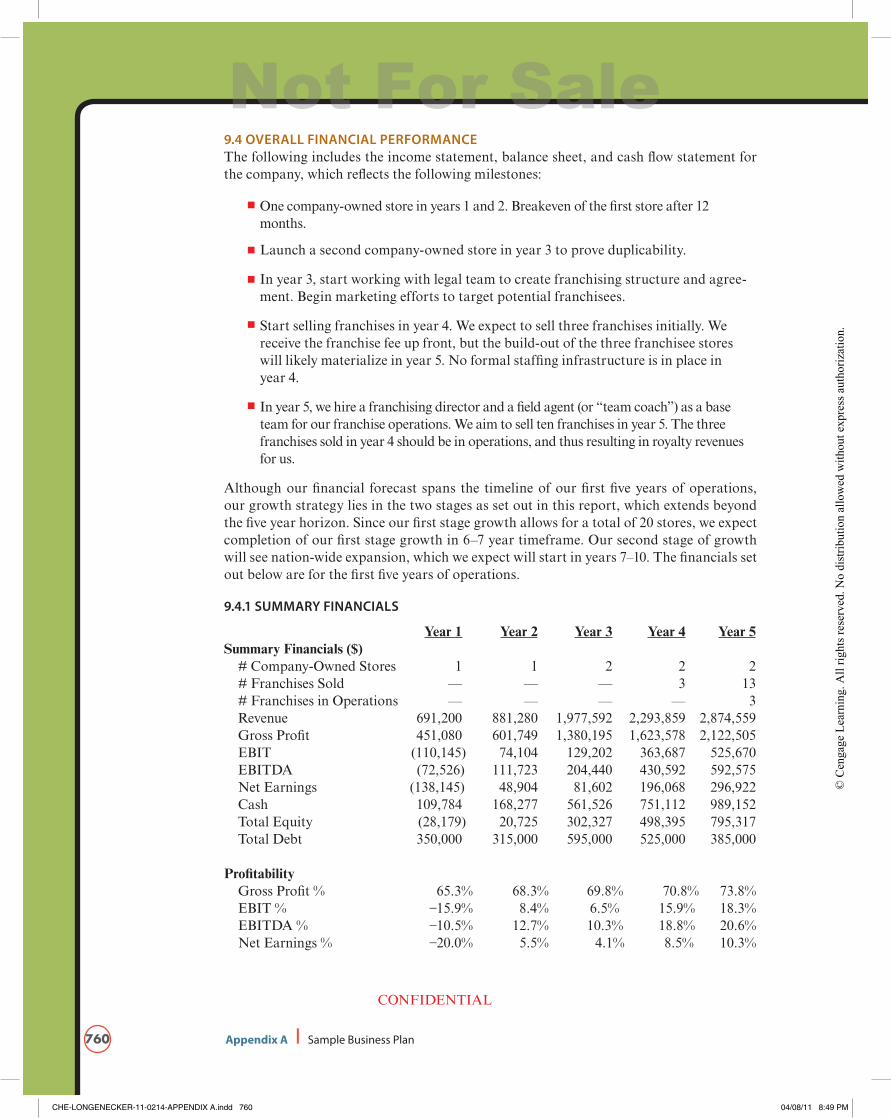
9.4 OvErAll FINANCIAl PErFOrmANCEThe following includes the income statement, balance sheet, and cash flow statement for the company, which reflects the following milestones:
One company-owned store in years 1 and 2. Breakeven of the first store after 12 months.
Launch a second company-owned store in year 3 to prove duplicability.
In year 3, start working with legal team to create franchising structure and agree-ment. Begin marketing efforts to target potential franchisees.
Start selling franchises in year 4. We expect to sell three franchises initially. We receive the franchise fee up front, but the build-out of the three franchisee stores will likely materialize in year 5. No formal staffing infrastructure is in place in year 4.
In year 5, we hire a franchising director and a field agent (or “team coach”) as a base team for our franchise operations. We aim to sell ten franchises in year 5. The three franchises sold in year 4 should be in operations, and thus resulting in royalty revenues for us.
Although our financial forecast spans the timeline of our first five years of operations, our growth strategy lies in the two stages as set out in this report, which extends beyond the five year horizon. Since our first stage growth allows for a total of 20 stores, we expect completion of our first stage growth in 6–7 year timeframe. Our second stage of growth will see nation-wide expansion, which we expect will start in years 7–10. The financials set out below are for the first five years of operations.
9.4.1 SummAry FINANCIAlS
Year 1 Year 2 Year 3 Year 4 Year 5Summary Financials ($) # Company-Owned Stores 1 1 2 2 2 # Franchises Sold — — — 3 13 # Franchises in Operations — — — — 3 Revenue 691,200 881,280 1,977,592 2,293,859 2,874,559 Gross Profit 451,080 601,749 1,380,195 1,623,578 2,122,505 EBIT (110,145) 74,104 129,202 363,687 525,670 EBITDA (72,526) 111,723 204,440 430,592 592,575 Net Earnings (138,145) 48,904 81,602 196,068 296,922 Cash 109,784 168,277 561,526 751,112 989,152 Total Equity (28,179) 20,725 302,327 498,395 795,317 Total Debt 350,000 315,000 595,000 525,000 385,000
Profitability Gross Profit % 65.3% 68.3% 69.8% 70.8% 73.8% EBIT % –15.9% 8.4% 6.5% 15.9% 18.3% EBITDA % –10.5% 12.7% 10.3% 18.8% 20.6% Net Earnings % –20.0% 5.5% 4.1% 8.5% 10.3%
CHE-LONGENECKER-11-0214-APPENDIX A.indd 760 04/08/11 8:49 PM
Not For Sale
© C
enga
ge L
earn
ing.
All
right
s res
erve
d. N
o di
strib
utio
n al
low
ed w
ithou
t exp
ress
aut
horiz
atio
n.
761Appendix A I Sample Business Plan
CONFIDENTIAL
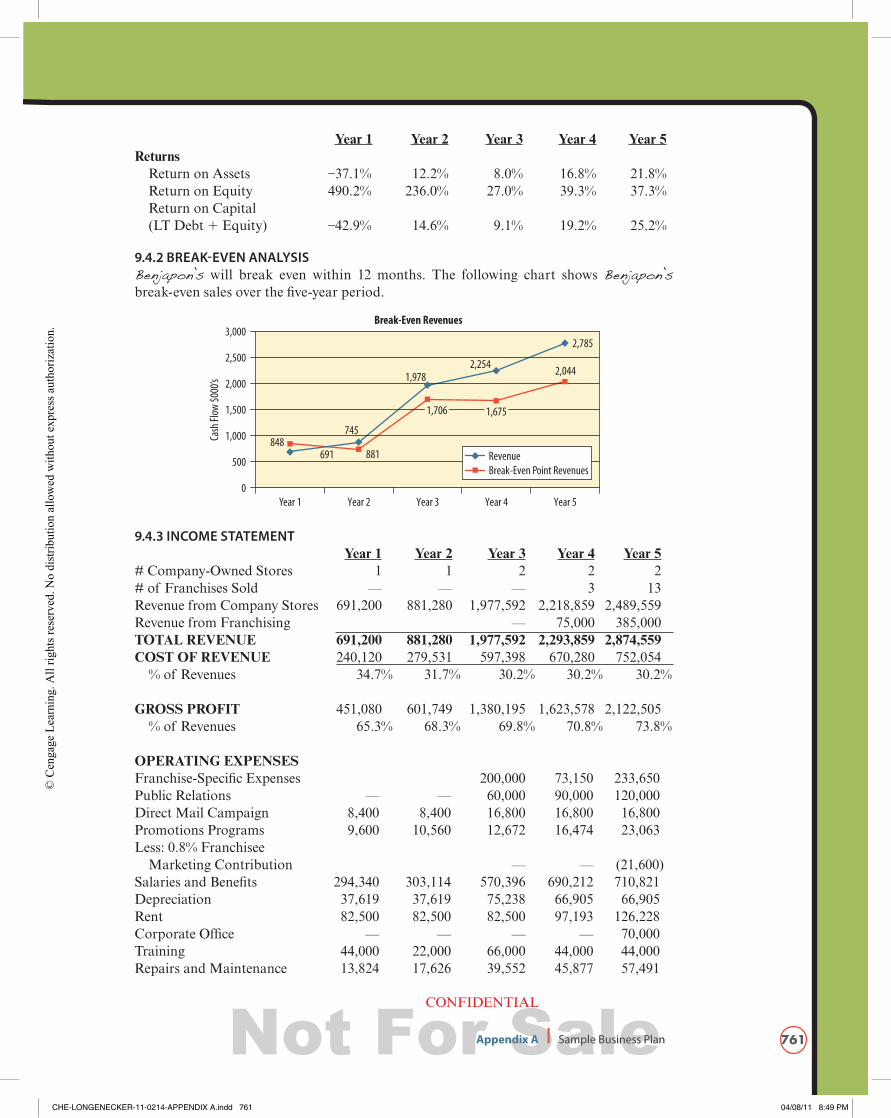
Year 1 Year 2 Year 3 Year 4 Year 5Returns Return on Assets –37.1% 12.2% 8.0% 16.8% 21.8% Return on Equity 490.2% 236.0% 27.0% 39.3% 37.3% Return on Capital (LT Debt + Equity) –42.9% 14.6% 9.1% 19.2% 25.2%
9.4.2 BrEAk-EvEN ANAlySISBenjapon’s will break even within 12 months. The following chart shows Benjapon’s break-even sales over the five-year period.
0
500691
848881
745
1,9782,254 2,044
2,785
Break-Even Revenues
Year 1 Year 2 Year 3 Year 4 Year 5
1,000
1,500
2,000
2,500
3,000
Cash
Flow
$000
’s
RevenueBreak-Even Point Revenues
1,706 1,675
9.4.3 INCOmE STATEmENT Year 1 Year 2 Year 3 Year 4 Year 5# Company-Owned Stores 1 1 2 2 2# of Franchises Sold — — — 3 13Revenue from Company Stores 691,200 881,280 1,977,592 2,218,859 2,489,559Revenue from Franchising — 75,000 385,000TOTAL REVENUE 691,200 881,280 1,977,592 2,293,859 2,874,559COST OF REVENUE 240,120 279,531 597,398 670,280 752,054 % of Revenues 34.7% 31.7% 30.2% 30.2% 30.2%
GROSS PROFIT 451,080 601,749 1,380,195 1,623,578 2,122,505 % of Revenues 65.3% 68.3% 69.8% 70.8% 73.8%
OPERATING EXPENSESFranchise-Specific Expenses 200,000 73,150 233,650Public Relations — — 60,000 90,000 120,000Direct Mail Campaign 8,400 8,400 16,800 16,800 16,800Promotions Programs 9,600 10,560 12,672 16,474 23,063Less: 0.8% Franchisee Marketing Contribution — — (21,600)Salaries and Benefits 294,340 303,114 570,396 690,212 710,821Depreciation 37,619 37,619 75,238 66,905 66,905Rent 82,500 82,500 82,500 97,193 126,228Corporate Office — — — — 70,000Training 44,000 22,000 66,000 44,000 44,000Repairs and Maintenance 13,824 17,626 39,552 45,877 57,491
CHE-LONGENECKER-11-0214-APPENDIX A.indd 761 04/08/11 8:49 PM
Not For Sale
© C
enga
ge L
earn
ing.
All
right
s res
erve
d. N
o di
strib
utio
n al
low
ed w
ithou
t exp
ress
aut
horiz
atio
n.
762 Appendix A I Sample Business Plan
CONFIDENTIAL
Year 1 Year 2 Year 3 Year 4 Year 5
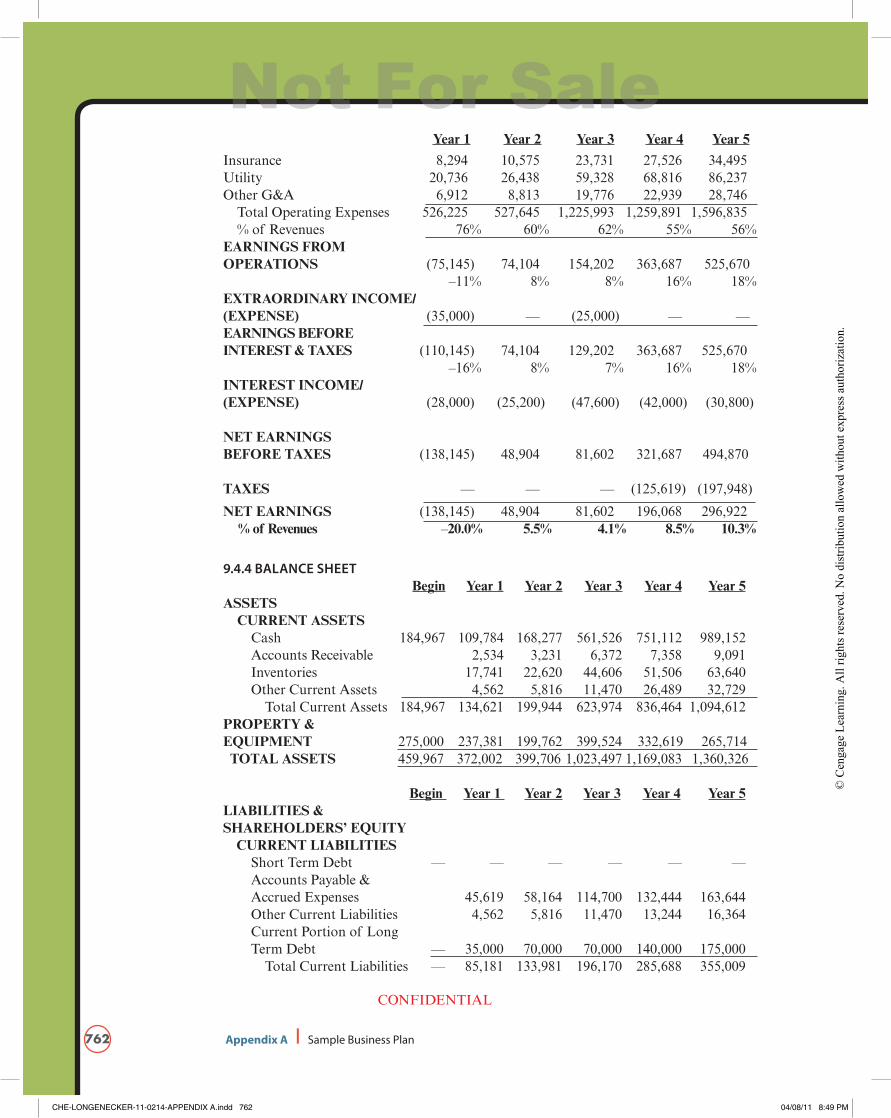
Insurance 8,294 10,575 23,731 27,526 34,495Utility 20,736 26,438 59,328 68,816 86,237Other G&A 6,912 8,813 19,776 22,939 28,746 Total Operating Expenses 526,225 527,645 1,225,993 1,259,891 1,596,835 % of Revenues 76% 60% 62% 55% 56% EARNINGS FROM OPERATIONS (75,145) 74,104 154,202 363,687 525,670 –11% 8% 8% 16% 18% EXTRAORDINARY INCOME/ (EXPENSE) (35,000) — (25,000) — —EARNINGS BEFORE INTEREST & TAXES (110,145) 74,104 129,202 363,687 525,670 –16% 8% 7% 16% 18% INTEREST INCOME/ (EXPENSE) (28,000) (25,200) (47,600) (42,000) (30,800)
NET EARNINGS BEFORE TAXES (138,145) 48,904 81,602 321,687 494,870
TAXES — — — (125,619) (197,948)
NET EARNINGS (138,145) 48,904 81,602 196,068 296,922 % of Revenues –20.0% 5.5% 4.1% 8.5% 10.3%
9.4.4 BAlANCE ShEET Begin Year 1 Year 2 Year 3 Year 4 Year 5ASSETS CURRENT ASSETS Cash 184,967 109,784 168,277 561,526 751,112 989,152 Accounts Receivable 2,534 3,231 6,372 7,358 9,091 Inventories 17,741 22,620 44,606 51,506 63,640 Other Current Assets 4,562 5,816 11,470 26,489 32,729 Total Current Assets 184,967 134,621 199,944 623,974 836,464 1,094,612 PROPERTY & EQUIPMENT 275,000 237,381 199,762 399,524 332,619 265,714 TOTAL ASSETS 459,967 372,002 399,706 1,023,497 1,169,083 1,360,326
Begin Year 1 Year 2 Year 3 Year 4 Year 5LIABILITIES & SHAREHOLDERS’ EQUITY CURRENT LIABILITIES Short Term Debt — — — — — — Accounts Payable & Accrued Expenses 45,619 58,164 114,700 132,444 163,644 Other Current Liabilities 4,562 5,816 11,470 13,244 16,364 Current Portion of Long Term Debt — 35,000 70,000 70,000 140,000 175,000 Total Current Liabilities — 85,181 133,981 196,170 285,688 355,009
CHE-LONGENECKER-11-0214-APPENDIX A.indd 762 04/08/11 8:49 PM
Not For Sale
© C
enga
ge L
earn
ing.
All
right
s res
erve
d. N
o di
strib
utio
n al
low
ed w
ithou
t exp
ress
aut
horiz
atio
n.
763Appendix A I Sample Business Plan
CONFIDENTIAL
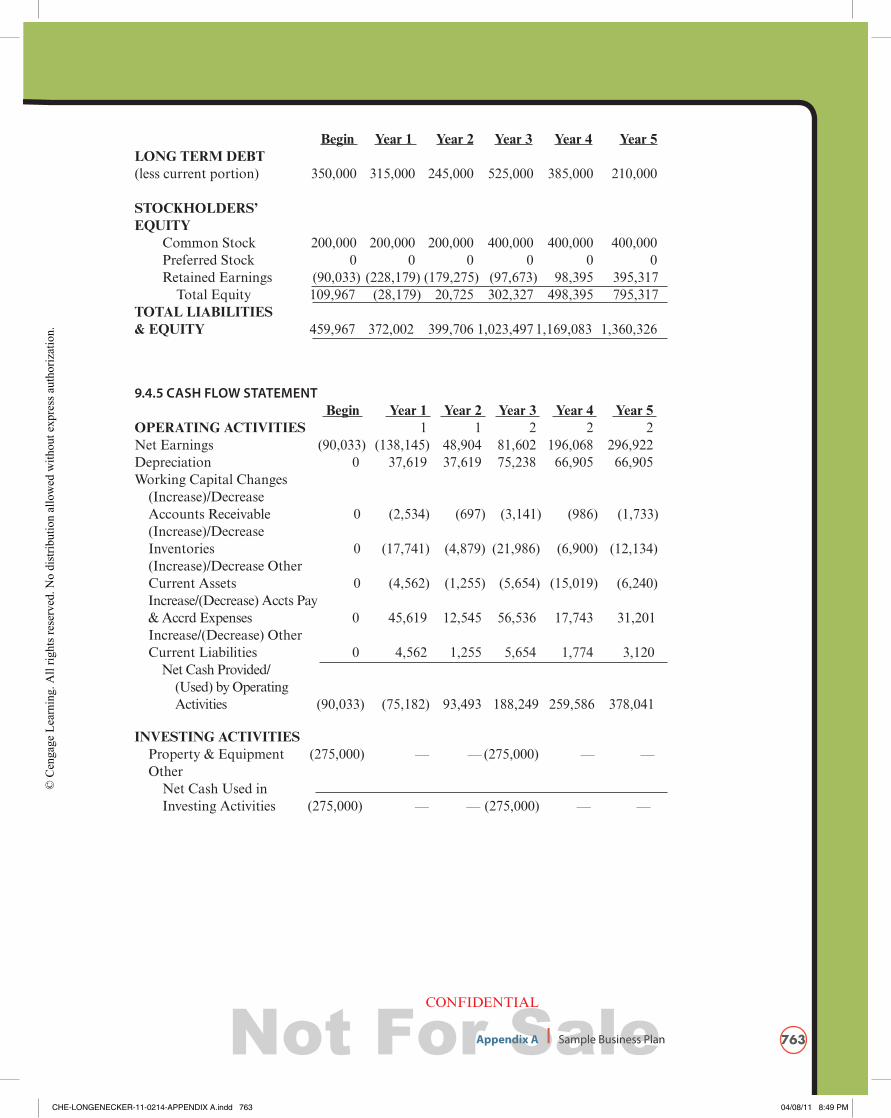
Begin Year 1 Year 2 Year 3 Year 4 Year 5LONG TERM DEBT (less current portion) 350,000 315,000 245,000 525,000 385,000 210,000
STOCKHOLDERS’ EQUITY Common Stock 200,000 200,000 200,000 400,000 400,000 400,000 Preferred Stock 0 0 0 0 0 0 Retained Earnings (90,033) (228,179) (179,275) (97,673) 98,395 395,317 Total Equity 109,967 (28,179) 20,725 302,327 498,395 795,317 TOTAL LIABILITIES & EQUITY 459,967 372,002 399,706 1,023,497 1,169,083 1,360,326
9.4.5 CASh FlOw STATEmENT Begin Year 1 Year 2 Year 3 Year 4 Year 5 OPERATING ACTIVITIES 1 1 2 2 2Net Earnings (90,033) (138,145) 48,904 81,602 196,068 296,922Depreciation 0 37,619 37,619 75,238 66,905 66,905Working Capital Changes (Increase)/Decrease Accounts Receivable 0 (2,534) (697) (3,141) (986) (1,733) (Increase)/Decrease Inventories 0 (17,741) (4,879) (21,986) (6,900) (12,134) (Increase)/Decrease Other Current Assets 0 (4,562) (1,255) (5,654) (15,019) (6,240) Increase/(Decrease) Accts Pay & Accrd Expenses 0 45,619 12,545 56,536 17,743 31,201 Increase/(Decrease) Other Current Liabilities 0 4,562 1,255 5,654 1,774 3,120 Net Cash Provided/ (Used) by Operating Activities (90,033) (75,182) 93,493 188,249 259,586 378,041
INVESTING ACTIVITIES Property & Equipment (275,000) — — (275,000) — — Other Net Cash Used in Investing Activities (275,000) — — (275,000) — —
CHE-LONGENECKER-11-0214-APPENDIX A.indd 763 04/08/11 8:49 PM
Not For Sale
© C
enga
ge L
earn
ing.
All
right
s res
erve
d. N
o di
strib
utio
n al
low
ed w
ithou
t exp
ress
aut
horiz
atio
n.
764 Appendix A I Sample Business Plan
CONFIDENTIAL
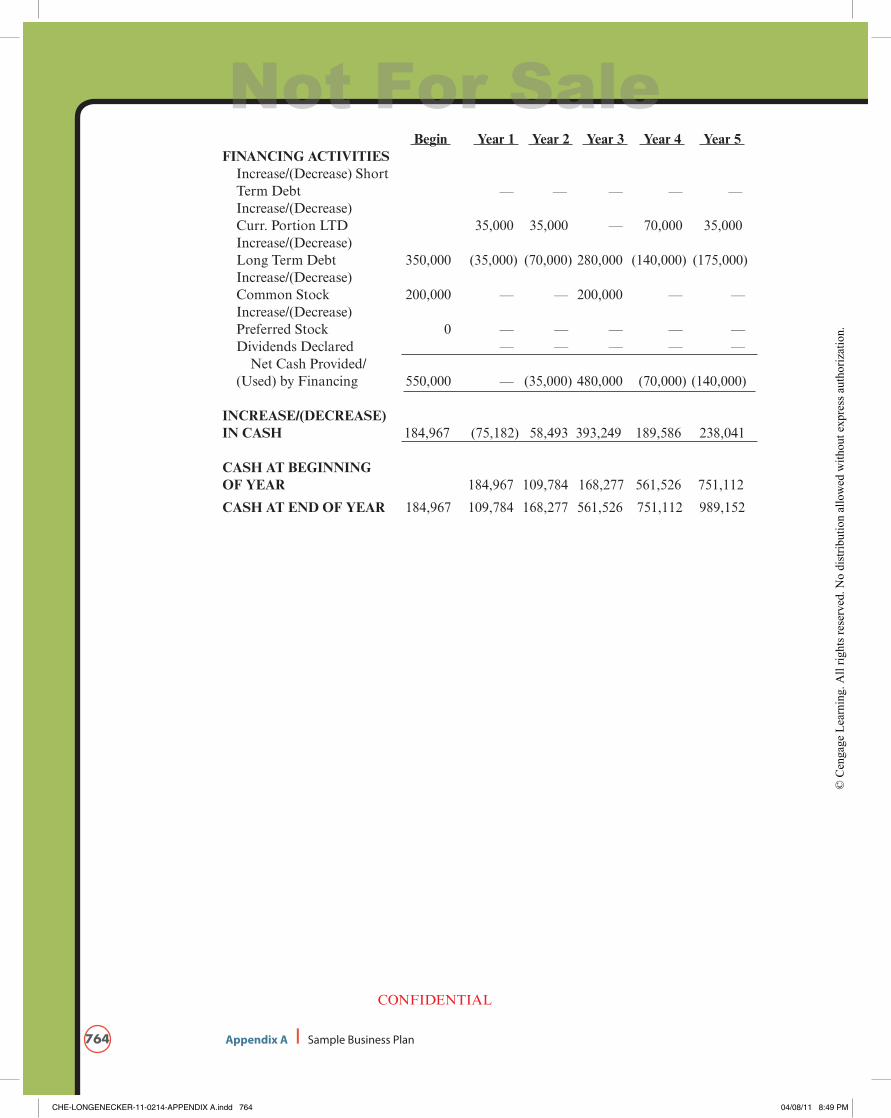
Begin Year 1 Year 2 Year 3 Year 4 Year 5 FINANCING ACTIVITIES Increase/(Decrease) Short Term Debt — — — — — Increase/(Decrease) Curr. Portion LTD 35,000 35,000 — 70,000 35,000 Increase/(Decrease) Long Term Debt 350,000 (35,000) (70,000) 280,000 (140,000) (175,000) Increase/(Decrease) Common Stock 200,000 — — 200,000 — — Increase/(Decrease) Preferred Stock 0 — — — — — Dividends Declared — — — — — Net Cash Provided/ (Used) by Financing 550,000 — (35,000) 480,000 (70,000) (140,000)
INCREASE/(DECREASE) IN CASH 184,967 (75,182) 58,493 393,249 189,586 238,041
CASH AT BEGINNING OF YEAR 184,967 109,784 168,277 561,526 751,112
CASH AT END OF YEAR 184,967 109,784 168,277 561,526 751,112 989,152
CHE-LONGENECKER-11-0214-APPENDIX A.indd 764 04/08/11 8:49 PM
Not For Sale
© C
enga
ge L
earn
ing.
All
right
s res
erve
d. N
o di
strib
utio
n al
low
ed w
ithou
t exp
ress
aut
horiz
atio
n.