Embed Size (px)
Citation preview


Sample Accounts
Ms Sample Portfolio Account
ANNUAL REPORT
1 JULY 2018 to 30 JUNE 2019
JUNE 2019 Sample AccountsMs Sample Portfolio Account Shaw and Partners Limited | Holder of AFSL Number 236048 | ABN 24 003 221 583 | Participant of ASX Limited, Chi-X Australia Pty Limited

Portfolio valuation
Asset QuantityAvg unit cost
$Actual cost
$Unit price
$Market value
$
Portfolioweight
%Gain/loss
$Gain/loss
%Est income (a)
$Est yield (b)
%ASX Listed
AGL AGL ENERGY LIMITED. FPO 9,920 13.19 130,844.80 20.01 198,499.20 6.44% 67,654.40 51.71% 11,705.60 5.9%AXP AIRXPANDERS INC. CHESS DEPOSITORY
INTERESTS 1:3 - DELISTED FROM THEASX 28.08.2019
50,000 0.50 25,000.00 0.035 1,750.00 0.06% -23,250.00 -93% - -
BHP BHP GROUP LIMITED FPO 4,500 28.9777 130,399.48 41.16 185,220.00 6% 54,820.52 42.04% 13,855.51 7.48%BLG BLUGLASS LIMITED FPO 175,000 0.13 22,750.00 0.155 27,125.00 0.88% 4,375.00 19.23% - -CIM CIMIC GROUP LIMITED FPO 6,000 20.28 121,680.00 44.77 268,620.00 8.71% 146,940.00 120.76% 8,700.00 3.24%CQE CHARTER HALL SOCIAL
INFRASTRUCTURE REIT UNITS FULLYPAID
23,760 1.1553 27,450.00 3.64 86,486.40 2.8% 59,036.40 215.07% 1,900.80 2.2%
CSL CSL LIMITED FPO 2,200 85.7227 188,590.00 215.00 473,000.00 15.33% 284,410.00 150.81% 5,459.01 1.15%MQG MACQUARIE GROUP LIMITED FPO 2,141 52.3495 112,080.23 125.39 268,459.99 8.7% 156,379.76 139.52% 11,454.35 4.27%NAB NATIONAL AUSTRALIA BANK LIMITED
FPO8,039 24.9866 200,867.63 26.72 214,802.08 6.96% 13,934.45 6.94% 15,917.22 7.41%
NABPD NATIONAL AUSTRALIA BANK LIMITEDCAP NOTE 3-BBSW+4.95% PERP NON-CUM RED T-07-22
1,500 100.00 150,000.00 106.978 160,467.00 5.2% 10,467.00 6.98% 7,302.45 4.55%
NVL NATIONAL VETERINARY CARE LTD FPO 25,000 1.00 25,000.00 2.18 54,500.00 1.77% 29,500.00 118% 750.00 1.38%OMN ONEMARKET LIMITED FPO - DELISTED
FROM ASX 02/12/2019405 1.354 548.37 0.75 303.75 0.01% -244.62 -44.61% - -
STW SPDR S&P/ASX 200 FUND ETF UNITSFULLY PAID
1,500 40.89 61,335.00 61.39 92,085.00 2.99% 30,750.00 50.13% 3,845.37 4.18%
SYD SYDNEY AIRPORT FULLY PAIDORDINARY/UNITS STAPLED SECURITIES
20,700 4.4314 91,731.00 8.04 166,428.00 5.4% 74,697.00 81.43% 7,762.50 4.66%
TWE TREASURY WINE ESTATES LIMITED FPO 6,800 6.1118 41,560.00 14.92 101,456.00 3.29% 59,896.00 144.12% 2,380.00 2.35%URW UNIBAIL-RODAMCO-WESTFIELD CDI
20:1 FOREIGN EXEMPT XPAR2,980 13.1686 39,242.42 10.27 30,604.60 0.99% -8,637.82 -22.01% 883.79 2.89%
S1234567: Ms Sample Portfolio Account Portfolio valuation
As at 30 Jun 2019
Shaw and Partners Limited Page 2

Portfolio valuation continued
Asset QuantityAvg unit cost
$Actual cost
$Unit price
$Market value
$
Portfolioweight
%Gain/loss
$Gain/loss
%Est income (a)
$Est yield (b)
%ASX Listed
WAM WAM CAPITAL LIMITED FPO 30,000 1.91 57,300.00 2.02 60,600.00 1.96% 3,300.00 5.76% 4,650.00 7.67%Totals 1,426,378.93 2,390,407.02 77.49% 964,028.09 67.59% 96,566.60 4.04%Hong Kong Stock Exchange
3988.HKG BANK OF CHINA ORD 20,000 0.6256 12,512.99 0.6016 12,032.33 0.39% -480.66 -3.84% 1,540.09 12.8%HKD 3.2999 66,000.00
941.HKG CHINA MOBILE ORD 8,000 13.2452 105,961.33 12.9712 103,769.73 3.36% -2,191.60 -2.07% 4,489.01 4.33%HKD 71.1499 569,200.00
Totals 118,474.32 115,802.06 3.75% -2,672.26 -2.26% 6,029.10 5.21%NASDAQ
TSLA.NSM TESLA MOTORS ORD 250 307.2811 76,820.28 318.2964 79,574.10 2.58% 2,753.82 3.58% - -USD 223.46 55,865.00
Totals 76,820.28 79,574.10 2.58% 2,753.82 3.58% - -SIX SWISS EXCHANGE AG
NESN.VTX NESTLE N ORD 1,000 107.0782 107,078.24 147.4594 147,459.39 4.78% 40,381.15 37.71% 3,574.86 2.42%CHF 101.06 101,060.00
Totals 107,078.24 147,459.39 4.78% 40,381.15 37.71% 3,574.86 2.42%Managed Funds
FSF0035AU CFS DEVELOPING COMPANIES 20,000 1.9117 38,233.40 2.3094 46,188.00 1.5% 7,954.60 20.81% 830.00 1.8%VAN0003AU VANGUARD INTERNATIONAL SHARES
INDEX60,000 1.40 84,000.00 2.3066 138,396.00 4.49% 54,396.00 64.76% 6,742.30 4.87%
Totals 122,233.40 184,584.00 5.99% 62,350.60 51.01% 7,572.30 4.1%Cash
+HKDCASH HONG KONG DOLLAR CASH ACCOUNT 21,768 0.1794 3,905.11 0.1823 3,968.48 0.13% 63.37 1.62% - -+SGB ST GEORGE CASH MANAGEMENT
ACCOUNT128,958.82 1.00 128,958.82 1.00 128,958.82 4.18% - - 1,934.38 1.5%
+USDCASH US$ Cash Account 391 1.3734 537.01 1.4244 556.94 0.02% 19.93 3.71% - -
S1234567: Ms Sample Portfolio Account Portfolio valuation
As at 30 Jun 2019
Shaw and Partners Limited Page 3

Portfolio valuation continued
Asset QuantityAvg unit cost
$Actual cost
$Unit price
$Market value
$
Portfolioweight
%Gain/loss
$Gain/loss
%Est income (a)
$Est yield (b)
%CashTotals 133,400.94 133,484.24 4.33% 83.30 0.06% 1,934.38 1.45%
Portfolio totals 1,984,386.11 3,051,310.81 98.92% 1,066,924.70 53.77% 115,677.24 3.79%
Income declared but not paid 33,324.47 33,324.47 1.08%
Net portfolio totals 2,017,710.58 3,084,635.28 100% 1,066,924.70 53.77% 115,677.24 3.75%
Exchange rates usedAUD/CHF as at 30/06/2019 1.45913AUD/HKD as at 30/06/2019 0.18231AUD/USD as at 30/06/2019 1.4244
(a) Estimated incomeThis estimation is based on historical returns and should not be regarded as an accurate indication of future earnings.
(b) Estimated yield percentageThe estimated yield is the estimated income as a percentage of the market value.
S1234567: Ms Sample Portfolio Account Portfolio valuation
As at 30 Jun 2019
Shaw and Partners Limited Page 4

Movement in value $
Starting market value 3,010,595.06 Net addition - Realised and unrealised gains/losses 54,740.14 Total income net of foreign tax paid 117,811.24 Total expenses - Forex movements 250.61Ending market value 3,084,635.28Movement in value 74,040.22
Value versus cumulative net investment
2700
2800
2900
3000
3100
$ '0
00s
30Ju
n 18
13Ju
l 18
26Ju
l 18
10Aug
18
24Aug
18
08Sep
18
22Sep
18
05Oct
18
19Oct
18
02Nov
18
16Nov
18
30Nov
18
14Dec
18
28Dec
18
14Ja
n 19
28Ja
n 19
11 Feb
19
25Feb
19
11 M
ar 19
25Mar
19
07Apr
19
21Apr
19
06 M
ay 19
20May
19
04Ju
n 19
17Ju
n 19
30Ju
n 19
Portfolio value Cumulative net investment
Portfolio returns $
Realised and unrealised gains/losses 54,740.14 Total income 119,546.60 Franking credits 30,834.92 Forex movements 250.61Total dollar return before expenses 205,372.27 Total expenses -Total dollar return after expenses 205,372.27
Periods to 30 Jun 2019 Since01/07/2018
Portfolio return after expenses (TWR) 3.58%
Returns over time
-8%
-6%
-4%
-2%
0%
2%
4%
30Ju
n 18
13Ju
l 18
26Ju
l 18
09 Aug
18
23Aug
18
07Sep
18
20 Sep
18
02 O
ct 18
15Oct
18
28Oct
18
11 N
ov 18
25Nov
18
09Dec
18
22Dec
18
06Ja
n 19
19Ja
n 19
02Feb
19
16Feb
19
02Mar
19
15Mar
19
28Mar
19
09Apr
19
22 Apr
19
07May
19
21May
19
04Ju
n 19
17Ju
n 19
30Ju
n 19
Cumulative TWR after expensesThe portfolio's inception date for performance calculation purposes is 28 Oct 1997.Loans (if applicable) have been excluded from portfolio performance calculations.Portfolio total dollar and percentage returns are inclusive of franking credits. Percentage returns have been calculated using the Time Weighted Return (TWR) method.
S1234567: Ms Sample Portfolio Account Portfolio performance
01 Jul 2018 to 30 Jun 2019
Shaw and Partners Limited Page 5

Net portfolio value $3,084,635.28
Asset classActual cost
$Market value
$Gain/loss
$% Net
portfolio valueDomestic Shares 1,221,382.93 2,155,430.26 934,047.34 69.88%International Shares 411,372.84 482,981.55 71,608.71 15.66%Domestic Listed Property 27,450.00 86,486.40 59,036.40 2.8%International Listed Property 39,242.42 30,604.60 -8,637.82 0.99%Domestic Fixed Interest 150,000.00 160,467.00 10,467.00 5.2%Cash & Equivalents 168,262.39 168,665.47 403.07 5.47%Total portfolio value 2,017,710.58 3,084,635.28 1,066,924.70 100%
0% 20% 40% 60% 80% 100%
Cash & Equivalents
Domestic Fixed Interest
International Listed Property
Domestic Listed Property
International Shares
Domestic SharesPortfolio % allocation
S1234567: Ms Sample Portfolio Account Asset class allocation
As at 30 Jun 2019
Shaw and Partners Limited Page 6

Assessable incomeAustralian incomeInterest Interest -
Interest exempt from NRWT -Total interest -
Dividends Unfranked 5,630.40Unfranked CFI 14,100.02Total unfranked 19,730.42Franked 67,162.33Franking credits 28,783.84Total dividends 115,676.59
Trust income Franked distributions 3,437.66Franking credits 1,937.05Gross franked distributions 5,374.71Other trust income (a) 4,950.28Total trust income 10,324.99
Total Australianincome
126,001.58
Foreign income
Other Other foreign source income 14,004.04Total other 14,004.04
Total foreign income 14,004.04
Net capital gain (b) 5,471.83
Total assessableincome 145,477.45
(a) Share of net income from trusts (excluding gross franked distributions, foreign income, capital gains, and non-assessable amounts).For more details, refer to the 'Trust income' section of the Income transactions report.(b) For more details, refer to the 'Summary of CGT gains/losses' section of the Realised CGT report.
DeductionsThere were no deductions recorded in this period.
Tax offsets, credits and NCMIFranking creditsDividends Franking credits 28,783.84
Less franking credits denied -28,783.84
Trust income Franking credits 1,937.05Less franking credits denied -
1,937.05Total franking credits 30,720.89
Foreign tax (a)
Dividends 1,319.24
Trust income Other 416.12416.12
Total foreign tax 1,735.36
(a) Foreign tax withheld from or paid in respect of foreign-source income that was derived during the income year. While foreign taxwithheld or paid may be taken into account when calculating any entitlement to a foreign income tax offset (FITO), it does notnecessarily equate to the FITO entitlement.
Shaw and Partners Limited
S1234567: Ms Sample Portfolio Account Tax summary
01 Jul 2018 to 30 Jun 2019
Page 7
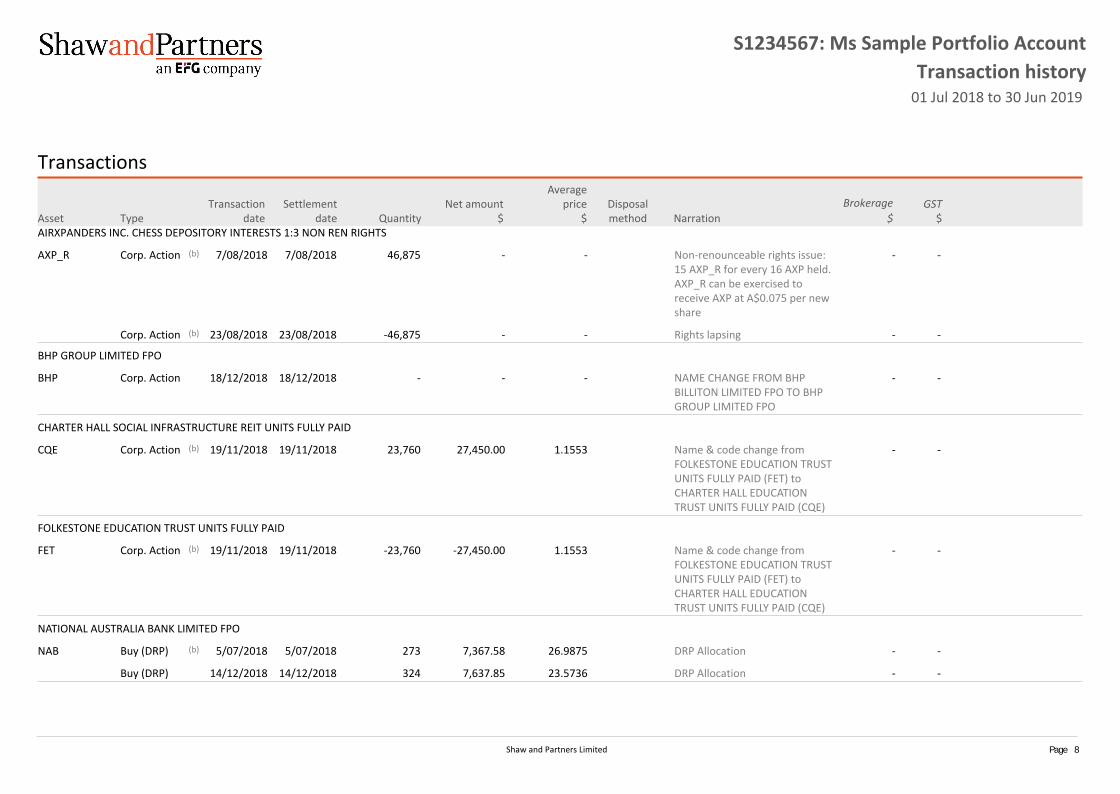
Transactions
Asset TypeTransaction
dateSettlement
date QuantityNet amount
$
Averageprice
$Disposalmethod Narration
Brokerage$
GST$
AIRXPANDERS INC. CHESS DEPOSITORY INTERESTS 1:3 NON REN RIGHTS
AXP_R Corp. Action (b) 7/08/2018 7/08/2018 46,875 - - Non-renounceable rights issue:15 AXP_R for every 16 AXP held.AXP_R can be exercised toreceive AXP at A$0.075 per newshare
- -
Corp. Action (b) 23/08/2018 23/08/2018 -46,875 - - Rights lapsing - -
BHP GROUP LIMITED FPO
BHP Corp. Action 18/12/2018 18/12/2018 - - - NAME CHANGE FROM BHPBILLITON LIMITED FPO TO BHPGROUP LIMITED FPO
- -
CHARTER HALL SOCIAL INFRASTRUCTURE REIT UNITS FULLY PAID
CQE Corp. Action (b) 19/11/2018 19/11/2018 23,760 27,450.00 1.1553 Name & code change fromFOLKESTONE EDUCATION TRUSTUNITS FULLY PAID (FET) toCHARTER HALL EDUCATIONTRUST UNITS FULLY PAID (CQE)
- -
FOLKESTONE EDUCATION TRUST UNITS FULLY PAID
FET Corp. Action (b) 19/11/2018 19/11/2018 -23,760 -27,450.00 1.1553 Name & code change fromFOLKESTONE EDUCATION TRUSTUNITS FULLY PAID (FET) toCHARTER HALL EDUCATIONTRUST UNITS FULLY PAID (CQE)
- -
NATIONAL AUSTRALIA BANK LIMITED FPO
NAB Buy (DRP) (b) 5/07/2018 5/07/2018 273 7,367.58 26.9875 DRP Allocation - -
Buy (DRP) 14/12/2018 14/12/2018 324 7,637.85 23.5736 DRP Allocation - -
S1234567: Ms Sample Portfolio Account Transaction history01 Jul 2018 to 30 Jun 2019
Shaw and Partners Limited Page 8

Transactions continued
Asset TypeTransaction
dateSettlement
date QuantityNet amount
$
Averageprice
$Disposalmethod Narration
Brokerage$
GST$
(b) These transactions are yet to be confirmed.
Summary of transactions
Net amount$
Brokerage$
GST$
GST claimable$
Unsettledas at 30 Jun 2019
$ Acquisitions 15,005.43 - - - - Disposals - - - - - Corporate actions - -
- - - -
Turnover - Average portfolio value from 01/07/18 to 30/06/19 2,990,896.14 % Turnover -
Turnover: The lesser of Acquisitions or Disposals% Turnover: Turnover divided by the Average portfolio value
S1234567: Ms Sample Portfolio Account Transaction history01 Jul 2018 to 30 Jun 2019
Shaw and Partners Limited Page 9

Disposals of CGT assetsThere were no CGT asset disposals within the period.
Trust CGT distributions
AssetTaxdate
Gross gain (a)$
Discounted gain (a)(b)$
Indexed gain (a)$
Other gain (a)$
CGT gain/loss$
Pre-CGT gain/loss$
CHARTER HALL SOCIAL INFRASTRUCTURE REIT UNITS FULLY PAIDCQE 28/12/2018 73.82 36.91 - - 36.91 -
28/03/2019 73.82 36.91 - - 36.91 -27/06/2019 73.82 36.91 - - 36.91 -
CQE totals 221.46 110.73 - - 110.73 -FOLKESTONE EDUCATION TRUST UNITS FULLY PAIDFET 27/09/2018 73.80 36.90 - - 36.90 -FET totals 73.80 36.90 - - 36.90 -CFS DEVELOPING COMPANIESFSF0035AU 14/09/2018 39.20 19.60 - - 19.60 -
14/09/2018 19.61 - - 19.61 19.61 -14/12/2018 352.96 176.48 - - 176.48 -14/12/2018 176.47 - - 176.47 176.47 -29/03/2019 156.88 78.44 - - 78.44 -29/03/2019 78.43 - - 78.43 78.43 -28/06/2019 2,584.34 1,292.17 - - 1,292.17 -28/06/2019 1,292.17 - - 1,292.17 1,292.17 -
FSF0035AU totals 4,700.06 1,566.69 - 1,566.68 3,133.37 -SPDR S&P/ASX 200 FUND ETF UNITS FULLY PAIDSTW 27/06/2019 162.90 81.45 - - 81.45 -STW totals 162.90 81.45 - - 81.45 -VANGUARD INTERNATIONAL SHARES INDEXVAN0003AU 28/09/2018 1,092.32 546.16 - - 546.16 -
31/12/2018 910.74 455.37 - - 455.37 -29/03/2019 924.44 462.22 - - 462.22 -28/06/2019 1,291.26 645.63 - - 645.63 -
VAN0003AU totals 4,218.76 2,109.38 - - 2,109.38 -
Trust CGT distribution totals 9,376.98 3,905.15 - 1,566.68 5,471.83 -
S1234567: Ms Sample Portfolio Account Realised CGT
01 Jul 2018 to 30 Jun 2019
Shaw and Partners Limited Page 10

(a) These amounts include distributed capital gain tax credits. Refer to the Taxable income section for a detailed breakdown.(b) A discount of 50% has been applied as determined by the portfolio's tax type.
Summary of CGT gains/lossesTotal
$Discounted
$Indexed
$Other
$Losses available to offset Carried forward from prior years -
Current year losses -Total -
CGT gains Disposals of CGT assets - - - -Trust CGT distributions 9,376.98 7,810.30 - 1,566.68CGT gain before losses applied 9,376.98 7,810.30 - 1,566.68Losses applied - - - -CGT gain after losses applied 9,376.98 7,810.30 - 1,566.68Discount applied (a) -3,905.15 -3,905.15 NA NA
Net capital gain 5,471.83 3,905.15 - 1,566.68
(a) The 'CGT gain after losses applied' amount multiplied by a 50% CGT discount rate appropriate to the tax entity type of the portfolio.
S1234567: Ms Sample Portfolio Account Realised CGT
01 Jul 2018 to 30 Jun 2019
Shaw and Partners Limited Page 11

Unrealised CGT gains/losses Capital gain using the differentcalculation methods
AssetTaxdate
Purchasedate Quantity
Actual cost$
Adjustedcost (a)
$
Indexedcost
$
Marketvalue
$Gross gain
$
Discountedgain (b)
$
Indexedgain
$Other gain
$CGT gain (c)
$CGT loss
$
CGT exemptgain/loss
$BANK OF CHINA ORD3988.HKG 15/10/2009 15/10/2009 20,000 12,512.99 12,512.99 NA 12,032.33 - NA NA NA NA -480.66 NA3988.HKG totals 20,000 12,512.99 12,512.99 NA 12,032.33 - NA NA NA NA -480.66 NA
CHINA MOBILE ORD941.HKG 03/01/2010 03/01/2010 5,000 51,407.53 51,407.53 NA 64,856.08 13,448.55 6,724.28 NA NA 6,724.28 NA NA
05/05/2015 05/05/2015 3,000 54,553.80 54,553.80 NA 38,913.65 - NA NA NA NA -15,640.15 NA941.HKG totals 8,000 105,961.33 105,961.33 NA 103,769.73 13,448.55 6,724.28 NA NA 6,724.28 -15,640.15 NA
AGL ENERGY LIMITED. FPOAGL 25/06/2009 24/11/2014 9,920 130,844.80 130,844.80 NA 198,499.20 67,654.40 33,827.20 NA NA 33,827.20 NA NAAGL totals 9,920 130,844.80 130,844.80 NA 198,499.20 67,654.40 33,827.20 NA NA 33,827.20 NA NA
AIRXPANDERS INC. CHESS DEPOSITORY INTERESTS 1:3 - DELISTED FROM THE ASX 28.08.2019AXP 05/06/2015 22/06/2015 50,000 25,000.00 25,000.00 NA 1,750.00 - NA NA NA NA -23,250.00 NAAXP totals 50,000 25,000.00 25,000.00 NA 1,750.00 - NA NA NA NA -23,250.00 NA
BHP GROUP LIMITED FPOBHP 27/05/2010 27/05/2010 500 18,293.50 18,293.50 NA 20,580.00 2,286.50 1,143.25 NA NA 1,143.25 NA NA
13/03/2015 13/03/2015 4,000 112,105.98 112,105.98 NA 164,640.00 52,534.02 26,267.01 NA NA 26,267.01 NA NABHP totals 4,500 130,399.48 130,399.48 NA 185,220.00 54,820.52 27,410.26 NA NA 27,410.26 NA NA
BLUGLASS LIMITED FPOBLG 22/04/2016 28/04/2016 175,000 22,750.00 22,750.00 NA 27,125.00 4,375.00 2,187.50 NA NA 2,187.50 NA NABLG totals 175,000 22,750.00 22,750.00 NA 27,125.00 4,375.00 2,187.50 NA NA 2,187.50 NA NA
CIMIC GROUP LIMITED FPOCIM 21/04/2015 24/04/2015 6,000 121,680.00 121,680.00 NA 268,620.00 146,940.00 73,470.00 NA NA 73,470.00 NA NACIM totals 6,000 121,680.00 121,680.00 NA 268,620.00 146,940.00 73,470.00 NA NA 73,470.00 NA NA
CHARTER HALL SOCIAL INFRASTRUCTURE REIT UNITS FULLY PAIDCQE 09/10/2013 19/11/2018 23,760 27,450.00 26,085.96 NA 86,486.40 60,400.44 30,200.22 NA NA 30,200.22 NA NACQE totals 23,760 27,450.00 26,085.96 NA 86,486.40 60,400.44 30,200.22 NA NA 30,200.22 NA NA
CSL LIMITED FPOCSL 16/01/2015 16/01/2015 1,200 99,600.00 99,600.00 NA 258,000.00 158,400.00 79,200.00 NA NA 79,200.00 NA NA
15/10/2015 15/10/2015 1,000 88,990.00 88,990.00 NA 215,000.00 126,010.00 63,005.00 NA NA 63,005.00 NA NACSL totals 2,200 188,590.00 188,590.00 NA 473,000.00 284,410.00 142,205.00 NA NA 142,205.00 NA NA
CFS DEVELOPING COMPANIES
S1234567: Ms Sample Portfolio Account Unrealised
As at 30 Jun 2019
Shaw and Partners Limited Page 12

Unrealised CGT gains/losses continued Capital gain using the differentcalculation methods
AssetTaxdate
Purchasedate Quantity
Actual cost$
Adjustedcost (a)
$
Indexedcost
$
Marketvalue
$Gross gain
$
Discountedgain (b)
$
Indexedgain
$Other gain
$CGT gain (c)
$CGT loss
$
CGT exemptgain/loss
$FSF0035AU 05/01/2003 05/01/2003 20,000 38,233.40 35,068.14 NA 46,188.00 11,119.86 5,559.93 NA NA 5,559.93 NA NAFSF0035AU totals 20,000 38,233.40 35,068.14 NA 46,188.00 11,119.86 5,559.93 NA NA 5,559.93 NA NA
MACQUARIE GROUP LIMITED FPOMQG 24/06/2011 02/01/2014 1,005 30,504.23 30,504.23 NA 126,016.95 95,512.72 47,756.36 NA NA 47,756.36 NA NA
30/03/2015 30/03/2015 136 9,996.00 9,996.00 NA 17,053.04 7,057.04 3,528.52 NA NA 3,528.52 NA NA29/01/2016 29/01/2016 1,000 71,580.00 71,580.00 NA 125,390.00 53,810.00 26,905.00 NA NA 26,905.00 NA NA
MQG totals 2,141 112,080.23 112,080.23 NA 268,459.99 156,379.76 78,189.88 NA NA 78,189.88 NA NA
NATIONAL AUSTRALIA BANK LIMITED FPONAB 22/11/2010 22/11/2010 2,500 57,494.83 57,494.83 NA 66,800.00 9,305.17 4,652.59 NA NA 4,652.59 NA NA
06/07/2011 06/07/2011 87 2,012.82 2,012.82 NA 2,324.64 311.82 155.91 NA NA 155.91 NA NA19/12/2011 19/12/2011 100 2,176.35 2,176.35 NA 2,672.00 495.65 247.83 NA NA 247.83 NA NA19/04/2012 19/04/2012 2,687 65,127.32 65,127.32 NA 71,796.64 6,669.32 3,334.66 NA NA 3,334.66 NA NA16/07/2012 16/07/2012 220 4,616.14 4,616.14 NA 5,878.40 1,262.26 631.13 NA NA 631.13 NA NA18/12/2012 18/12/2012 214 4,820.16 4,820.16 NA 5,718.08 897.92 448.96 NA NA 448.96 NA NA16/07/2013 16/07/2013 186 5,215.06 5,215.06 NA 4,969.92 - NA NA NA NA -245.14 NA18/12/2013 18/12/2013 170 5,643.83 5,643.83 NA 4,542.40 - NA NA NA NA -1,101.43 NA08/07/2014 08/07/2014 183 5,918.98 5,918.98 NA 4,889.76 - NA NA NA NA -1,029.22 NA16/12/2014 16/12/2014 197 6,086.12 6,086.12 NA 5,263.84 - NA NA NA NA -822.28 NA03/07/2015 03/07/2015 193 6,285.16 6,285.16 NA 5,156.96 - NA NA NA NA -1,128.20 NA15/12/2015 15/12/2015 234 6,435.15 6,435.15 NA 6,252.48 - NA NA NA NA -182.67 NA05/07/2017 05/07/2017 230 6,901.29 6,901.29 NA 6,145.60 - NA NA NA NA -755.69 NA13/12/2017 13/12/2017 241 7,128.99 7,128.99 NA 6,439.52 - NA NA NA NA -689.47 NA05/07/2018 05/07/2018 273 7,367.58 7,367.58 NA 7,294.56 - NA NA NA NA -73.02 NA14/12/2018 14/12/2018 324 7,637.85 7,637.85 NA 8,657.28 1,019.43 NA NA 1,019.43 1,019.43 NA NA
NAB totals 8,039 200,867.63 200,867.63 NA 214,802.08 19,961.57 9,471.08 NA 1,019.43 10,490.51 -6,027.12 NA
NATIONAL AUSTRALIA BANK LIMITED CAP NOTE 3-BBSW+4.95% PERP NON-CUM RED T-07-22NABPD 07/07/2016 07/07/2016 1,500 150,000.00 150,000.00 NA 160,467.00 10,467.00 5,233.50 NA NA 5,233.50 NA NANABPD totals 1,500 150,000.00 150,000.00 NA 160,467.00 10,467.00 5,233.50 NA NA 5,233.50 NA NA
NESTLE N ORDNESN.VTX 18/08/2015 07/03/2016 1,000 107,078.24 107,078.24 NA 147,459.39 40,381.15 20,190.58 NA NA 20,190.58 NA NANESN.VTX totals 1,000 107,078.24 107,078.24 NA 147,459.39 40,381.15 20,190.58 NA NA 20,190.58 NA NA
NATIONAL VETERINARY CARE LTD FPONVL 29/07/2015 14/08/2015 25,000 25,000.00 25,000.00 NA 54,500.00 29,500.00 14,750.00 NA NA 14,750.00 NA NA
S1234567: Ms Sample Portfolio Account Unrealised
As at 30 Jun 2019
Shaw and Partners Limited Page 13

Unrealised CGT gains/losses continued Capital gain using the differentcalculation methods
AssetTaxdate
Purchasedate Quantity
Actual cost$
Adjustedcost (a)
$
Indexedcost
$
Marketvalue
$Gross gain
$
Discountedgain (b)
$
Indexedgain
$Other gain
$CGT gain (c)
$CGT loss
$
CGT exemptgain/loss
$NVL totals 25,000 25,000.00 25,000.00 NA 54,500.00 29,500.00 14,750.00 NA NA 14,750.00 NA NA
ONEMARKET LIMITED FPO - DELISTED FROM ASX 02/12/2019OMN 07/06/2018 31/05/2018 405 548.37 548.37 NA 303.75 - NA NA NA NA -244.62 NAOMN totals 405 548.37 548.37 NA 303.75 - NA NA NA NA -244.62 NA
SPDR S&P/ASX 200 FUND ETF UNITS FULLY PAIDSTW 08/07/2010 08/07/2010 1,500 61,335.00 60,397.37 NA 92,085.00 31,687.63 15,843.82 NA NA 15,843.82 NA NASTW totals 1,500 61,335.00 60,397.37 NA 92,085.00 31,687.63 15,843.82 NA NA 15,843.82 NA NA
SYDNEY AIRPORT FULLY PAID STAPLED SECURITIES - SALSYD_SAL 13/01/2014 13/01/2014 1,700 4,398.75 4,398.75 NA 12,105.75 7,707.00 3,853.50 NA NA 3,853.50 NA NA
18/08/2014 18/08/2014 10,000 33,737.80 33,737.80 NA 71,210.28 37,472.48 18,736.24 NA NA 18,736.24 NA NA18/12/2014 18/12/2014 9,000 34,967.51 34,967.51 NA 64,089.25 29,121.74 14,560.87 NA NA 14,560.87 NA NA
SYD_SAL totals 20,700 73,104.06 73,104.06 NA 147,405.28 74,301.22 37,150.61 NA NA 37,150.61 NA NA
SYDNEY AIRPORT FULLY PAID STAPLED SECURITIES - SAT 1SYD_SAT1 13/01/2014 13/01/2014 1,700 1,942.25 1,940.12 NA 1,562.25 - NA NA NA NA -377.87 NA
18/08/2014 18/08/2014 10,000 9,262.20 9,250.20 NA 9,189.72 - NA NA NA NA -60.48 NA18/12/2014 18/12/2014 9,000 7,422.49 7,411.73 NA 8,270.75 859.02 429.51 NA NA 429.51 NA NA
SYD_SAT1 totals 20,700 18,626.94 18,602.05 NA 19,022.72 859.02 429.51 NA NA 429.51 -438.35 NA
TESLA MOTORS ORDTSLA.NSM 27/05/2016 27/05/2016 250 76,820.28 76,820.28 NA 79,574.10 2,753.82 1,376.91 NA NA 1,376.91 NA NATSLA.NSM totals 250 76,820.28 76,820.28 NA 79,574.10 2,753.82 1,376.91 NA NA 1,376.91 NA NA
TREASURY WINE ESTATES LIMITED FPOTWE 16/09/2015 16/09/2015 6,000 37,080.00 37,080.00 NA 89,520.00 52,440.00 26,220.00 NA NA 26,220.00 NA NA
04/11/2015 17/11/2015 800 4,480.00 4,480.00 NA 11,936.00 7,456.00 3,728.00 NA NA 3,728.00 NA NATWE totals 6,800 41,560.00 41,560.00 NA 101,456.00 59,896.00 29,948.00 NA NA 29,948.00 NA NA
UNIBAIL-RODAMCO-WESTFIELD CDI 20:1 FOREIGN EXEMPT XPARURW 16/01/2014 08/06/2018 76 536.85 536.85 NA 780.52 243.67 121.84 NA NA 121.84 NA NA
02/06/2015 08/06/2018 958 10,166.64 10,166.64 NA 9,838.66 - NA NA NA NA -327.98 NA07/06/2018 08/06/2018 1,946 28,538.93 28,538.93 NA 19,985.42 - NA NA NA NA -8,553.51 NA
URW totals 2,980 39,242.42 39,242.42 NA 30,604.60 243.67 121.84 NA NA 121.84 -8,881.49 NA
VANGUARD INTERNATIONAL SHARES INDEXVAN0003AU 29/07/2013 29/07/2013 60,000 84,000.00 83,990.60 NA 138,396.00 54,405.40 27,202.70 NA NA 27,202.70 NA NA
S1234567: Ms Sample Portfolio Account Unrealised
As at 30 Jun 2019
Shaw and Partners Limited Page 14

Unrealised CGT gains/losses continued Capital gain using the differentcalculation methods
AssetTaxdate
Purchasedate Quantity
Actual cost$
Adjustedcost (a)
$
Indexedcost
$
Marketvalue
$Gross gain
$
Discountedgain (b)
$
Indexedgain
$Other gain
$CGT gain (c)
$CGT loss
$
CGT exemptgain/loss
$VAN0003AU totals 60,000 84,000.00 83,990.60 NA 138,396.00 54,405.40 27,202.70 NA NA 27,202.70 NA NA
WAM CAPITAL LIMITED FPOWAM 21/10/2014 21/10/2014 30,000 57,300.00 57,300.00 NA 60,600.00 3,300.00 1,650.00 NA NA 1,650.00 NA NAWAM totals 30,000 57,300.00 57,300.00 NA 60,600.00 3,300.00 1,650.00 NA NA 1,650.00 NA NA
Totals 1,850,985.17 1,845,483.95 NA2,917,826.57 1,127,305.01 563,142.82 NA 1,019.43 564,162.25 -54,962.39 NA
(a) Variances between Adjusted cost and Actual costWhere the 'Market value' in respect of the CGT parcel is equal to or less than its reduced cost base, its reduced cost base is disclosed as the adjusted cost; otherwise, its cost base is disclosed as the adjusted cost. For more details, refer to the 'Adjusted cost' section of theUnrealised report.(b) Gains calculated using discounted methodThe unrealised 'CGT gain' calculated using the discount method, after having applied the 50% CGT discount rate appropriate to the tax entity type of this portfolio.(c) CGT gain calculation methodThe CGT gain is based on what is optimal for the disposal method selected.The CGT gain calculated from a less than optimal method is shown in italics for information purposes only and is excluded from the totals for the portfolio.NA is shown if a calculation method is not applicable.(d) Unrealised CGT gain or CGT lossThe unrealised CGT gain or CGT loss is the difference between the adjusted cost and the market value at the date requested. For short options, the unrealised CGT gain or CGT loss is the market value of the option at the date requested. (The option premium received is shownas a realised CGT gain in the ‘Realised CGT’ section.)CGT gains or CGT losses are not comparable with performance gains/losses, which are based on changes in value for a performance period.
Adjusted cost Adjustments Adjusted cost (a)
AssetMarket value
$ Purchase date Tax date QuantityActual cost (b)
$Tax deferred (c)
$Tax free (d)
$
AMIT cost basenet amount -
excess (e)$
AMIT cost basenet amount -
shortfall (f)$
Cost base (g)$
Reduced costbase (h)
$CHARTER HALL SOCIAL INFRASTRUCTURE REIT UNITS FULLY PAIDCQE 86,486.40 19/11/2018 09/10/2013 23,760 27,450.00 1,382.60 - 1,476.64 1,495.20 26,085.96 26,085.96CQE totals 86,486.40 23,760 27,450.00 1,382.60 - 1,476.64 1,495.20 26,085.96 26,085.96
CFS DEVELOPING COMPANIESFSF0035AU 46,188.00 05/01/2003 05/01/2003 20,000 38,233.40 3,165.26 - - - 35,068.14 35,068.14FSF0035AU totals 46,188.00 20,000 38,233.40 3,165.26 - - - 35,068.14 35,068.14
S1234567: Ms Sample Portfolio Account Unrealised
As at 30 Jun 2019
Shaw and Partners Limited Page 15

Adjusted cost Adjustments Adjusted cost (a)
AssetMarket value
$ Purchase date Tax date QuantityActual cost (b)
$Tax deferred (c)
$Tax free (d)
$
AMIT cost basenet amount -
excess (e)$
AMIT cost basenet amount -
shortfall (f)$
Cost base (g)$
Reduced costbase (h)
$SPDR S&P/ASX 200 FUND ETF UNITS FULLY PAIDSTW 92,085.00 08/07/2010 08/07/2010 1,500 61,335.00 714.35 8.91 223.28 - 60,397.37 60,388.46STW totals 92,085.00 1,500 61,335.00 714.35 8.91 223.28 - 60,397.37 60,388.46
SYDNEY AIRPORT FULLY PAID STAPLED SECURITIES - SAT 1SYD_SAT1 1,562.25 13/01/2014 13/01/2014 1,700 1,942.25 2.13 - - - 1,940.12 1,940.12
9,189.72 18/08/2014 18/08/2014 10,000 9,262.20 12.00 - - - 9,250.20 9,250.208,270.75 18/12/2014 18/12/2014 9,000 7,422.49 10.76 - - - 7,411.73 7,411.73
SYD_SAT1 totals 19,022.72 20,700 18,626.94 24.89 - - - 18,602.05 18,602.05
VANGUARD INTERNATIONAL SHARES INDEXVAN0003AU 138,396.00 29/07/2013 29/07/2013 60,000 84,000.00 - - 2,237.75 2,228.35 83,990.60 83,990.60VAN0003AU totals 138,396.00 60,000 84,000.00 - - 2,237.75 2,228.35 83,990.60 83,990.60
Totals 382,178.12 229,645.34 5,287.10 8.91 3,937.67 3,723.55 224,144.12 224,135.21
(a) Where the 'Market value' of the CGT parcel is equal to or less than its reduced cost base, its reduced cost base is disclosed as the adjusted cost in the 'Unrealised CGT gains/losses' section of the Unrealised report; otherwise, its cost base is disclosed as the adjusted cost inthe 'Unrealised CGT gains/losses' section of the Unrealised report.(b) The actual cost of the CGT parcel is its purchase cost, adjusted for all CGT events (other than CGT events E4 and E10) that have happened to it. For more details, refer to the Transaction history report. For details specific to CGT event E4, refer to footnotes (c) and (d). Fordetails specific to CGT event E10, refer to footnotes (e) and (f).(c) In respect of the income entitlements of a fixed trust that was not an attribution managed investment trust (a non-AMIT) at the time of the entitlement, the tax-deferred amount is the cumulative value of tax-deferred amounts (being the non-assessable part of the incomeentitlements, excluding all amounts calculated under section 104-71 ITAA 1997) in respect of the CGT parcel that, at the time of the income entitlement, did not exceed the CGT parcel's cost base. CGT event E4 requires that both the cost base and reduced cost base of the CGTparcel be reduced by this amount.(d) In respect of the income entitlements of a fixed trust that was not an attribution managed investment trust (a non-AMIT) at the time of the entitlement, the tax-free amount is the cumulative value of tax-free amounts (being the non-assessable part of the incomeentitlements as calculated under subsection 104-71(3) ITAA 1997) in respect of the CGT parcel that, at the time of the income entitlement, did not exceed the CGT parcel's reduced cost base. CGT event E4 requires that the reduced cost base of the CGT parcel be reduced bythis amount.(e) In respect of the income entitlements of an attribution managed investment trust (AMIT), the AMIT cost base net amount - excess amount is the cumulative value of excess amounts (as calculated under paragraph 104-107C(a) ITAA 1997) in respect of the CGT parcel that, atthe time of the income entitlement, did not exceed the CGT parcel's cost base. CGT event E10 requires that both the cost base and reduced cost base of the CGT parcel be reduced by this amount.(f) In respect of the income entitlements of an attribution managed investment trust (AMIT), the AMIT cost base net amount - shortfall amount is the cumulative value of shortfall amounts (as calculated under paragraph 104-107C(b) ITAA 1997) in respect of the CGT parcel.CGT event E10 requires that both the cost base and reduced cost base of the CGT parcel be increased by this amount.(g) The cost base equals the actual cost, adjusted for amounts relating to: tax deferred; AMIT cost base net amount - excess; and AMIT cost base net amount - shortfall.(h) The reduced cost base equals the actual cost, adjusted for amounts relating to: tax deferred; tax free; AMIT cost base net amount - excess; and AMIT cost base net amount - shortfall.
S1234567: Ms Sample Portfolio Account Unrealised
As at 30 Jun 2019
Shaw and Partners Limited Page 16

Unrealised non-CGT gains/lossesExchange rate movements
Opendate
Gain/loss$
Forexcurrency
Forexamount
Open cost$
Market value$
HONG KONG DOLLAR CASH ACCOUNT+HKDCASH 30/09/2015 -15.24 HKD 12,200.00 2,239.40 2,224.16
24/06/2016 78.61 HKD 9,568.00 1,665.71 1,744.32+HKDCASH totals 63.37 21,768.00 3,905.11 3,968.48
US$ Cash Account+USDCASH 20/10/2015 19.93 USD 391.00 537.01 556.94+USDCASH totals 19.93 391.00 537.01 556.94
Unrealised gain/loss 83.30 4,442.12 4,525.42
Totals 83.30
S1234567: Ms Sample Portfolio Account Unrealised
As at 30 Jun 2019
Shaw and Partners Limited Page 17

Income transactions (a)
Asset Tax dateInterest
$Unfranked
$Franked
$
Frankingcredits
entitlement$
OtherAust
$
Grossforeign
$
Trustcap gains
$Non-assess
$
Grossexcl
frankingcredits
$
Austtaxes
$
Foreigntaxes
$
Expenseswithheld
$
Assessnon-
receiv$
Cash$
DRP$
To bereceived
$
Dividends
AGL ENERGY LIMITED. FPOAGL 21/09/2018 - 1,249.92 4,999.68 2,142.72 - - - - 6,249.60 - - - - 6,249.60 - -
22/03/2019 - 1,091.20 4,364.80 1,870.63 - - - - 5,456.00 (b) - - - - 5,456.00 - -AGL totals - 2,341.12 9,364.48 4,013.35 - - - - 11,705.60 - - - - 11,705.60 - -
BHP GROUP LIMITED FPOBHP 25/09/2018 - - 3,984.54 1,707.66 - - - - 3,984.54 (b) - - - - 3,984.54 - -
30/01/2019 - - 6,357.34 2,724.57 - - - - 6,357.34 - - - - 6,357.34 - -26/03/2019 - - 3,513.63 1,505.84 - - - - 3,513.63 - - - - 3,513.63 - -
BHP totals - - 13,855.51 5,938.07 - - - - 13,855.51 - - - - 13,855.51 - -
CIMIC GROUP LIMITED FPOCIM 04/07/2018 - - 4,500.00 1,928.57 - - - - 4,500.00 (b) - - - - 4,500.00 - -
04/10/2018 - - 4,200.00 1,800.00 - - - - 4,200.00 (b) - - - - 4,200.00 - -CIM totals - - 8,700.00 3,728.57 - - - - 8,700.00 - - - - 8,700.00 - -
CSL LIMITED FPOCSL 12/10/2018 - 2,812.02 - - - - - - 2,812.02 - - - - 2,812.02 - -
12/04/2019 - 2,646.99 - - - - - - 2,646.99 (b) - - - - 2,646.99 - -CSL totals - 5,459.01 - - - - - - 5,459.01 - - - - 5,459.01 - -
MACQUARIE GROUP LIMITED FPOMQG 03/07/2018 - 3,768.16 3,083.04 1,321.30 - - - - 6,851.20 (b) - - - - 6,851.20 - -
18/12/2018 - 2,531.73 2,071.42 887.75 - - - - 4,603.15 (b) - - - - 4,603.15 - -MQG totals - 6,299.89 5,154.46 2,209.05 - - - - 11,454.35 - - - - 11,454.35 - -
NATIONAL AUSTRALIA BANK LIMITED FPONAB 05/07/2018 - - 7,367.58 3,157.53 - - - - 7,367.58 (b) - - - - - 7,367.58 -
14/12/2018 - - 7,637.85 3,273.36 - - - - 7,637.85 - - - - - 7,637.85 -NAB totals - - 15,005.43 6,430.89 - - - - 15,005.43 - - - - - 15,005.43 -
NATIONAL AUSTRALIA BANK LIMITED CAP NOTE 3-BBSW+4.95% PERP NON-CUM RED T-07-22
Shaw and Partners Limited
S1234567: Ms Sample Portfolio Account Taxation income
01 Jul 2018 to 30 Jun 2019
Page 18

Income transactions (a)continued
Asset Tax dateInterest
$Unfranked
$Franked
$
Frankingcredits
entitlement$
OtherAust
$
Grossforeign
$
Trustcap gains
$Non-assess
$
Grossexcl
frankingcredits
$
Austtaxes
$
Foreigntaxes
$
Expenseswithheld
$
Assessnon-
receiv$
Cash$
DRP$
To bereceived
$
Dividends
NABPD 09/07/2018 - - 1,831.20 784.80 - - - - 1,831.20 (b) - - - - 1,831.20 - -08/10/2018 - - 1,835.25 786.54 - - - - 1,835.25 - - - - 1,835.25 - -07/01/2019 - - 1,800.90 771.81 - - - - 1,800.90 (b) - - - - 1,800.90 - -08/04/2019 - - 1,835.10 786.47 - - - - 1,835.10 (b) - - - - 1,835.10 - -
NABPD totals - - 7,302.45 3,129.62 - - - - 7,302.45 - - - - 7,302.45 - -
NATIONAL VETERINARY CARE LTD FPONVL 27/09/2018 - - 750.00 321.43 - - - - 750.00 - - - - 750.00 - -NVL totals - - 750.00 321.43 - - - - 750.00 - - - - 750.00 - -
SYDNEY AIRPORT FULLY PAID STAPLED SECURITIES - SALSYD_SAL 14/08/2018 - 2,773.80 - - - - - - 2,773.80 (b) - - - - 2,773.80 - -
14/02/2019 - 2,856.60 - - - - - - 2,856.60 - - - - 2,856.60 - -SYD_SAL totals - 5,630.40 - - - - - - 5,630.40 - - - - 5,630.40 - -
TREASURY WINE ESTATES LIMITED FPOTWE 05/10/2018 - - 1,156.00 495.43 - - - - 1,156.00 - - - - 1,156.00 - -
05/04/2019 - - 1,224.00 524.57 - - - - 1,224.00 (b) - - - - 1,224.00 - -TWE totals - - 2,380.00 1,020.00 - - - - 2,380.00 - - - - 2,380.00 - -
WAM CAPITAL LIMITED FPOWAM 26/11/2018 - - 2,325.00 996.43 - - - - 2,325.00 - - - - 2,325.00 - -
26/04/2019 - - 2,325.00 996.43 - - - - 2,325.00 - - - - 2,325.00 - -WAM totals - - 4,650.00 1,992.86 - - - - 4,650.00 - - - - 4,650.00 - -
Totals - 19,730.42 67,162.33 28,783.84 - - - - 86,892.75 - - - - 71,887.32 15,005.43 -
Foreign dividends
BANK OF CHINA ORD3988.HKG 08/08/2018 - - - - - 726.50 - - 726.50 (b) - 108.98 - - 617.52 - -
18/06/2019 - - - - - 785.10 - - 785.10 (b) - 117.76 - - 667.34 - -
Shaw and Partners Limited
S1234567: Ms Sample Portfolio Account Taxation income
01 Jul 2018 to 30 Jun 2019
Page 19

Income transactions (a)continued
Asset Tax dateInterest
$Unfranked
$Franked
$
Frankingcredits
entitlement$
OtherAust
$
Grossforeign
$
Trustcap gains
$Non-assess
$
Grossexcl
frankingcredits
$
Austtaxes
$
Foreigntaxes
$
Expenseswithheld
$
Assessnon-
receiv$
Cash$
DRP$
To bereceived
$
Foreign dividends
3988.HKG totals - - - - - 1,511.60 - - 1,511.60 - 226.74 - - 1,284.86 - -
CHINA MOBILE ORD941.HKG 27/09/2018 - - - - - 2,575.29 - - 2,575.29 (b) - - - - 2,575.29 - -
26/06/2019 - - - - - 2,046.98 - - 2,046.98 (b) - 204.70 - - 1,842.28 - -941.HKG totals - - - - - 4,622.27 - - 4,622.27 - 204.70 - - 4,417.57 - -
NESTLE N ORDNESN.VTX 17/04/2019 - - - - - 3,393.51 - - 3,393.51 (b) - 509.03 - - 2,884.48 - -NESN.VTX totals - - - - - 3,393.51 - - 3,393.51 - 509.03 - - 2,884.48 - -
UNIBAIL-RODAMCO-WESTFIELD CDI 20:1 FOREIGN EXEMPT XPARURW 12/04/2019 - - - - - 1,262.56 - - 1,262.56 (b) - 378.77 - - 883.79 - -URW totals - - - - - 1,262.56 - - 1,262.56 - 378.77 - - 883.79 - -
Totals - - - - - 10,789.94 - - 10,789.94 -1,319.2
4 --
9,470.70 - -
Trust income
CHARTER HALL SOCIAL INFRASTRUCTURE REIT UNITS FULLY PAIDCQE 28/12/2018 49.67 - - - 457.75 - 73.82 369.16 950.40 (b) - - - - 950.40 - -
28/03/2019 49.67 - - - 457.75 - 73.82 369.16 950.40 (b) - - - - 950.40 - -27/06/2019 49.67 - - - 457.75 - 73.82 369.16 950.40 (b) - - - - - - 950.40
CQE totals 149.01 - - - 1,373.25 - 221.46 1,107.48 2,851.20 - - - - 1,900.80 - 950.40
FOLKESTONE EDUCATION TRUST UNITS FULLY PAIDFET 27/09/2018 49.68 - - - 457.76 - 73.80 369.16 950.40 - - - - 950.40 - -FET totals 49.68 - - - 457.76 - 73.80 369.16 950.40 - - - - 950.40 - -
CFS DEVELOPING COMPANIESFSF0035AU 14/09/2018 0.02 0.14 0.63 5.24 - - 39.21 - 40.00 (b) - - - - 40.00 - -
14/12/2018 0.14 1.18 5.69 47.12 0.04 - 352.95 - 360.00 (b) - - - - 360.00 - -
Shaw and Partners Limited
S1234567: Ms Sample Portfolio Account Taxation income
01 Jul 2018 to 30 Jun 2019
Page 20

Income transactions (a)continued
Asset Tax dateInterest
$Unfranked
$Franked
$
Frankingcredits
entitlement$
OtherAust
$
Grossforeign
$
Trustcap gains
$Non-assess
$
Grossexcl
frankingcredits
$
Austtaxes
$
Foreigntaxes
$
Expenseswithheld
$
Assessnon-
receiv$
Cash$
DRP$
To bereceived
$
Trust income
29/03/2019 0.06 0.52 2.53 20.94 0.02 - 156.87 - 160.00 (b) - - - - 160.00 - -28/06/2019 1.05 8.70 41.65 345.05 0.26 - 2,584.34 - 2,636.00 (b) - - - - - - 2,636.00
FSF0035AU totals 1.27 10.54 50.50 418.35 0.32 - 3,133.37 - 3,196.00 - - - - 560.00 - 2,636.00
SPDR S&P/ASX 200 FUND ETF UNITS FULLY PAIDSTW 27/09/2018 5.85 96.89 1,236.49 546.80 30.78 21.84 - 6.32 1,398.17 (b) - 1.77 - - 1,396.40 - -
28/12/2018 1.68 139.35 669.46 302.62 - 6.37 - - 816.86 (b) - 0.83 - - 816.03 - -28/03/2019 41.20 56.75 856.60 380.78 42.25 31.89 - 30.12 1,058.81 (b) - 2.27 - - 1,056.54 - -27/06/2019 37.13 80.86 624.61 288.50 172.81 13.79 162.90 62.37 1,154.47 (b) - 2.18 - - - - 1,152.29
STW totals 85.86 373.85 3,387.16 1,518.70 245.84 73.89 162.90 98.81 4,428.31 - 7.05 - - 3,268.97 - 1,152.29
SYDNEY AIRPORT FULLY PAID STAPLED SECURITIES - SAT 1SYD_SAT1 14/08/2018 1,054.59 - - - - - - 1.11 1,055.70 - - - - 1,055.70 - -
14/02/2019 1,075.27 - - - - - - 1.13 1,076.40 - - - - 1,076.40 - -SYD_SAT1 totals 2,129.86 - - - - - - 2.24 2,132.10 - - - - 2,132.10 - -
VANGUARD INTERNATIONAL SHARES INDEXVAN0003AU 28/09/2018 0.46 - - - 28.59 621.44 1,092.32 - 1,742.81 (b) - 57.22 - 893.36 792.23 - -
31/12/2018 0.34 - - - - 586.22 910.74 - 1,497.30 (b) - 84.13 - - 1,413.17 - -29/03/2019 0.37 - - - 24.35 619.36 924.44 - 1,568.52 (b) - 83.39 - - 1,485.13 - -28/06/2019 0.57 - - - 18.36 1,313.19 1,291.26 823.21 3,446.59 (b) - 184.33 - - - - 3,262.26
VAN0003AU totals 1.74 - - - 71.30 3,140.21 4,218.76 823.21 8,255.22 - 409.07 - 893.36 3,690.53 - 3,262.26
Totals 2,417.42 384.39 3,437.66 1,937.05 2,148.47 3,214.10 7,810.29 2,400.90 21,813.23 - 416.12 - 893.36 12,502.80 - 8,000.95
Income transactiontotals 2,417.42 20,114.81 70,599.99 30,720.89 2,148.47 14,004.04 7,810.29 2,400.90 119,495.92 -1,735.3
6 -893.36
93,860.82 15,005.43 8,000.95
(a) The income transactions disclosed in this report are recognised on a tax-derivation basis. For more details about each column, refer to the corresponding sub-section under the Income - additional information section.(b) These income amounts are yet to be confirmed.
Shaw and Partners Limited
S1234567: Ms Sample Portfolio Account Taxation income
01 Jul 2018 to 30 Jun 2019
Page 21

Non-CGT gains/lossesThere were no non-CGT gains/losses within the period.
Income transactions - additional information
Interest
Asset Tax dateInterest(a)
$
Interest exemptfrom NRWT(b)
$
Interesttotal
$CHARTER HALL SOCIAL INFRASTRUCTURE REIT UNITS FULLY PAIDCQE 28/12/2018 49.67 - 49.67
28/03/2019 49.67 - 49.67 27/06/2019 49.67 - 49.67
CQE totals 149.01 - 149.01 FOLKESTONE EDUCATION TRUST UNITS FULLY PAIDFET 27/09/2018 49.68 - 49.68 FET totals 49.68 - 49.68 CFS DEVELOPING COMPANIESFSF0035AU 14/09/2018 0.02 - 0.02
14/12/2018 0.14 - 0.14 29/03/2019 0.06 - 0.06 28/06/2019 1.05 - 1.05
FSF0035AU totals 1.27 - 1.27 SPDR S&P/ASX 200 FUND ETF UNITS FULLY PAIDSTW 27/09/2018 5.85 - 5.85
28/12/2018 1.68 - 1.68 28/03/2019 41.20 - 41.20 27/06/2019 34.46 2.67 37.13
STW totals 83.19 2.67 85.86 SYDNEY AIRPORT FULLY PAID STAPLED SECURITIES - SAT 1SYD_SAT1 14/08/2018 1,054.59 - 1,054.59
14/02/2019 1,075.27 - 1,075.27
Shaw and Partners Limited
S1234567: Ms Sample Portfolio Account Taxation income
01 Jul 2018 to 30 Jun 2019
Page 22

Income transactions - additional information continued
Interest
Asset Tax dateInterest(a)
$
Interest exemptfrom NRWT(b)
$
Interesttotal
$SYD_SAT1 totals 2,129.86 - 2,129.86 VANGUARD INTERNATIONAL SHARES INDEXVAN0003AU 28/09/2018 0.46 - 0.46
31/12/2018 0.34 - 0.34 29/03/2019 0.37 - 0.37 28/06/2019 0.57 - 0.57
VAN0003AU totals 1.74 - 1.74
Totals 2,414.75 2.67 2,417.42
(a) The amount of interest that is subject to non-resident withholding tax (NRWT).(b) The amount of interest that is not subject to non-resident withholding tax (NRWT).
Unfranked amounts - Unfranked CFI income component
Tax dateTotal Unfranked
$Unfranked Non CFI
$Unfranked CFI
$AGL 21/09/2018 1,249.92 - 1,249.92
22/03/2019 1,091.20 - 1,091.20 AGL totals 2,341.12 - 2,341.12 CSL 12/10/2018 2,812.02 - 2,812.02
12/04/2019 2,646.99 - 2,646.99 CSL totals 5,459.01 - 5,459.01 FSF0035AU 14/09/2018 0.14 0.10 0.04
14/12/2018 1.18 0.86 0.32 29/03/2019 0.52 0.38 0.14 28/06/2019 8.70 6.33 2.37
FSF0035AU totals 10.54 7.67 2.87 MQG 03/07/2018 3,768.16 - 3,768.16
Shaw and Partners Limited
S1234567: Ms Sample Portfolio Account Taxation income
01 Jul 2018 to 30 Jun 2019
Page 23

Income transactions - additional information continued
Unfranked amounts - Unfranked CFI income component
Tax dateTotal Unfranked
$Unfranked Non CFI
$Unfranked CFI
$18/12/2018 2,531.73 - 2,531.73
MQG totals 6,299.89 - 6,299.89 STW 27/09/2018 96.89 35.17 61.72
28/12/2018 139.35 18.42 120.93 28/03/2019 56.75 41.16 15.59 27/06/2019 80.86 4.64 76.22
STW totals 373.85 99.39 274.46
Totals 14,484.41 107.06 14,377.35
Trust capital gains (a) Discount method (b) Indexation method (c) Other method (d)
Asset Tax date
Non-assessable
gains(e)
$TAP(f)
$
NTAP net offoreign tax
(g)
$
NTAPforeign tax
(h)
$TAP(f)
$
NTAP net offoreign tax
(g)
$
NTAPforeign tax
(h)
$TAP(f)
$
NTAP net offoreign tax
(g)
$
NTAPforeign tax
(h)
$
Trustcapital
gainstotal
$
Taxableforeigncapitalgains(i)
$CQE 28/12/2018 36.91 36.91 - - - - - - - - 73.82 -
28/03/2019 36.91 36.91 - - - - - - - - 73.82 -27/06/2019 36.91 36.91 - - - - - - - - 73.82 -
CQE totals 110.73 110.73 - - - - - - - - 221.46 -
FET 27/09/2018 36.90 36.90 - - - - - - - - 73.80 -FET totals 36.90 36.90 - - - - - - - - 73.80 -
FSF0035AU 14/09/2018 - - 19.60 - - - - - 19.61 - 39.21 -14/12/2018 - - 176.48 - - - - - 176.47 - 352.95 -29/03/2019 - - 78.44 - - - - - 78.43 - 156.87 -28/06/2019 - - 1,292.17 - - - - - 1,292.17 - 2,584.34 -
FSF0035AU totals - - 1,566.69 - - - - - 1,566.68 - 3,133.37 -
STW 27/06/2019 81.45 25.72 55.73 - - - - - - - 162.90 -STW totals 81.45 25.72 55.73 - - - - - - - 162.90 -
VAN0003AU 28/09/2018 546.16 - 546.16 - - - - - - - 1,092.32 -31/12/2018 455.37 - 455.37 - - - - - - - 910.74 -
Shaw and Partners Limited
S1234567: Ms Sample Portfolio Account Taxation income
01 Jul 2018 to 30 Jun 2019
Page 24

Income transactions - additional information continuedTrust capital gains (a) Discount method (b) Indexation method (c) Other method (d)
Asset Tax date
Non-assessable
gains(e)
$TAP(f)
$
NTAP net offoreign tax
(g)
$
NTAPforeign tax
(h)
$TAP(f)
$
NTAP net offoreign tax
(g)
$
NTAPforeign tax
(h)
$TAP(f)
$
NTAP net offoreign tax
(g)
$
NTAPforeign tax
(h)
$
Trustcapital
gainstotal
$
Taxableforeigncapitalgains(i)
$29/03/2019 462.22 - 462.22 - - - - - - - 924.44 -28/06/2019 645.63 - 645.63 - - - - - - - 1,291.26 -
VAN0003AU totals 2,109.38 - 2,109.38 - - - - - - - 4,218.76 -
Totals 2,338.46 173.35 3,731.80 - - - - - 1,566.68 - 7,810.29 -
(a) Trust capital gains: For attribution managed investment trusts (AMITs), these are the trust capital gains attributed to members. For non-AMITs, these are the present entitlements to the net trust income comprised of net capital gains and CGT concession amounts.(b) Discount method: Capital gains made by the trust in respect of CGT assets that were held for at least twelve months at the time of the CGT event that gave rise to the capital gain, and in respect of which the trust has not chosen to use the indexation method (if applicable)to calculate the capital gain. The sum of the discount method components equals the capital gains after having applied a CGT discount of 50%.(c) Indexation method: Capital gains made by the trust in respect of CGT assets that were acquired prior to 11:45 a.m. (by legal time in the Australian Capital Territory) on 21 September 1999 (and that had been held for at least twelve months at the time of the CGT event thatgave rise to the capital gain), and in respect of which the trust has chosen to use the indexation method to calculate the capital gain.(d) Other method: Capital gains made by the trust in respect of CGT assets that were held for less than twelve months at the time of the CGT event that gave rise to the capital gain.(e) Non-assessable gains: For attribution managed investment trusts (AMITs), members are to be treated as having included (in their attributed amount) a capital gain of double the trust discount capital gain; thus, the non-assessable amount for AMITs is the additionalmember amount required to double the trust discount capital gain (referred to as the 'AMIT CGT gross up amount', this amount is equal to the sum of the discount method components). For non-AMITs, the non-assessable amount is the CGT concession amount (as calculatedunder sub-section 104-71(4) ITAA 1997).(f) TAP: Capital gains made by the trust in respect of CGT assets that were taxable Australian property (TAP). For capital gains calculated using the discount method, this is the capital gain after having applied a CGT discount of 50%.(g) NTAP net of foreign tax: Capital gains made by the trust in respect of CGT assets that were not taxable Australian property (NTAP), less any NTAP foreign tax. For capital gains calculated using the discount method, this is the capital gain after first having applied a CGTdiscount of 50%, and then subtracting any NTAP foreign tax.(h) NTAP foreign tax: Foreign tax paid by the trust in respect of capital gains made by the trust in respect of foreign CGT assets.(i) Taxable foreign capital gains: The grossed-up value of capital gains from foreign CGT assets. This amount is for information purposes only, as foreign capital gains are already reflected in the combined value of 'NTAP net of foreign tax' and 'NTAP foreign tax' amounts. This'Taxable foreign capital gains' amount may be useful for the purpose of determining the extent to which the combined value of 'NTAP net of foreign tax' and 'NTAP foreign tax' amounts has been derived from a foreign source, and, accordingly, the extent to which any NTAPforeign tax amounts count towards the calculation of the portfolio holder's entitlement, if any, to a foreign income tax offset (FITO).
Non-assessable amounts (a) Attribution managed investment trusts (AMIT) Non-AMIT
Asset Tax date
Exemptincome
$
Non-assessable
non-exempt$
Other non-assessable
(b)
$
Taxdeferred
$Tax exempt
$
Taxfree
$
Non-assessable
total$
CQE 28/12/2018 - - 369.16 - - - 369.1628/03/2019 - - 369.16 - - - 369.1627/06/2019 - - 369.16 - - - 369.16
CQE totals - - 1,107.48 - - - 1,107.48
FET 27/09/2018 - - 369.16 - - - 369.16
Shaw and Partners Limited
S1234567: Ms Sample Portfolio Account Taxation income
01 Jul 2018 to 30 Jun 2019
Page 25

Income transactions - additional information continuedNon-assessable amounts (a) Attribution managed investment trusts (AMIT) Non-AMIT
Asset Tax date
Exemptincome
$
Non-assessable
non-exempt$
Other non-assessable
(b)
$
Taxdeferred
$Tax exempt
$
Taxfree
$
Non-assessable
total$
FET totals - - 369.16 - - - 369.16
STW 27/09/2018 - - 6.32 - - - 6.3228/03/2019 - - 30.12 - - - 30.1227/06/2019 - - 62.37 - - - 62.37
STW totals - - 98.81 - - - 98.81
SYD_SAT1 14/08/2018 - - - 1.11 - - 1.1114/02/2019 - - - 1.13 - - 1.13
SYD_SAT1 totals - - - 2.24 - - 2.24
VAN0003AU 28/06/2019 - - 823.21 - - - 823.21VAN0003AU totals - - 823.21 - - - 823.21
Totals - - 2,398.66 2.24 - - 2,400.90
(a) Non-assessable amounts do not include non-assessable amounts in respect of trust capital gains (i.e. the AMIT CGT gross-up amout or the CGT concession amount). The non-assessable amounts relating to AMIT CGT gross-up amounts and CGT concession amounts aredisclosed in the 'Trust capital gains' sub-section under the Income - additional information section.(b) For attribution managed investment trusts (AMITs), 'Other non-assessable' amounts are the reconciliation adjustments required to account for the amount by which the present entitlements to the net accounting income of the trust for the income year exceed the trustincome attributed to the member under section 276-80 ITAA 1997 for the income year.
Capital Withholding tax Asset Transaction Date Capital withholding tax Totals -
Foreign investment taxes(a) NTAP foreign tax(b)
Asset Tax date
Foreign tax(c)
$
Discountmethod
$
Indexationmethod
$
Othermethod
$
Foreign taxestotal
$BANK OF CHINA ORD3988 08/08/2018 108.98 - - - 108.98
Shaw and Partners Limited
S1234567: Ms Sample Portfolio Account Taxation income
01 Jul 2018 to 30 Jun 2019
Page 26

Income transactions - additional information continuedForeign investment taxes(a) NTAP foreign tax(b)
Asset Tax date
Foreign tax(c)
$
Discountmethod
$
Indexationmethod
$
Othermethod
$
Foreign taxestotal
$18/06/2019 117.76 - - - 117.76
3988 totals 226.74 - - - 226.74 CHINA MOBILE ORD941 26/06/2019 204.70 - - - 204.70 941 totals 204.70 - - - 204.70 NESTLE N ORDNESN 17/04/2019 509.03 - - - 509.03 NESN totals 509.03 - - - 509.03 SPDR S&P/ASX 200 FUND ETF UNITS FULLY PAIDSTW 27/09/2018 1.77 - - - 1.77
28/12/2018 0.83 - - - 0.83 28/03/2019 2.27 - - - 2.27 27/06/2019 2.18 - - - 2.18
STW totals 7.05 - - - 7.05 UNIBAIL-RODAMCO-WESTFIELD CDI 20:1 FOREIGN EXEMPT XPARURW 12/04/2019 378.77 - - - 378.77 URW totals 378.77 - - - 378.77 VANGUARD INTERNATIONAL SHARES INDEXVAN0003AU 28/09/2018 57.22 - - - 57.22
31/12/2018 84.13 - - - 84.13 29/03/2019 83.39 - - - 83.39 28/06/2019 184.33 - - - 184.33
VAN0003AU totals 409.07 - - - 409.07
Totals 1,735.36 - - - 1,735.36
(a) Foreign taxes withheld from or paid in respect of foreign investment income are recognised at the tax-derivation date of the foreign investment income from which they are withheld or in respect of which they are paid, regardless of whether or not the withholding event orpayment occurs after the tax-derivation date.(b) The amount of foreign tax paid in respect of capital gains made in respect of foreign CGT assets. For more details, refer to the 'Distributed capital gains' section of the Income - additional information schedule.(c) The amount of foreign tax paid in respect of foreign investment income, other than foreign capital gains.
Shaw and Partners Limited
S1234567: Ms Sample Portfolio Account Taxation income
01 Jul 2018 to 30 Jun 2019
Page 27

Income transactions - additional information continued
Gross foreign income
Tax date
AttributedCFC income(a)
$
Foreignincome net
of tax(b)
$Foreign tax
$
Aust frankingcredits from
NZ co
Grossforeignincome
total$
Assetcurrency (if
not AUD)Asset currency
amount
NZ frankingcredits from
NZ co3988 08/08/2018 - 617.52 108.98 - 726.50 HKD 3,596.50 -
18/06/2019 - 667.34 117.76 - 785.10 HKD 3,584.06 -3988 totals - 1,284.86 226.74 - 1,511.60 7,180.56 -
941 27/09/2018 - 2,575.29 - - 2,575.29 HKD 14,608.00 -26/06/2019 - 1,842.28 204.70 - 2,046.98 HKD 10,015.20 -
941 totals - 4,417.57 204.70 - 4,622.27 24,623.20 -
NESN 17/04/2019 - 2,884.48 509.03 - 3,393.51 CHF 2,082.50 -NESN totals - 2,884.48 509.03 - 3,393.51 2,082.50 -
STW 27/09/2018 - 20.07 1.77 - 21.84 - -28/12/2018 - 5.54 0.83 - 6.37 - -28/03/2019 - 29.62 2.27 - 31.89 - -27/06/2019 - 11.61 2.18 - 13.79 - -
STW totals - 66.84 7.05 - 73.89 - -
URW 12/04/2019 - 883.79 378.77 - 1,262.56 - -URW totals - 883.79 378.77 - 1,262.56 - -
VAN0003AU 28/09/2018 - 564.22 57.22 - 621.44 - -31/12/2018 - 502.09 84.13 - 586.22 - -29/03/2019 - 535.97 83.39 - 619.36 - -28/06/2019 - 1,128.86 184.33 - 1,313.19 - -
VAN0003AU totals - 2,731.14 409.07 - 3,140.21 - -
Totals - 12,268.68 1,735.36 - 14,004.04 33,886.26 -
(a) The attributable income of a controlled foreign company (CFC).(b) Foreign-source assessable income (other than attributed CFC income and distributed capital gains in respect of foreign CGT assets), less foreign tax.
Shaw and Partners Limited
S1234567: Ms Sample Portfolio Account Taxation income
01 Jul 2018 to 30 Jun 2019
Page 28

Income transactions - additional information continued
Income accrued in previous period
Asset Tax datePaymentdate
Totalincome
$Cash
$DRP
$
Taxwithheld
$
Frankingcredits
$
Foreignincome tax
offsets$
FET 29/06/2018 20/07/2018 896.94 896.94 - - - -FSF0035AU 30/06/2018 09/07/2018 270.00 270.00 - - 124.07 -STW 28/06/2018 11/07/2018 576.71 576.41 - - 125.46 0.30VAN0003AU 30/06/2018 09/07/2018 3,229.06 3,051.77 - - - 177.29Totals 4,972.71 4,795.12 - - 249.53 177.59
NCMIThere were no amounts recorded in this period.
Income summary (a)
Interest$
Unfranked$
Franked$
Frankingcredits
$
OtherAust
$
Grossforeign
$
Trustcap gains
$Non-assess
$
Grossexcl
frankingcredits
$
Austtaxes
$
Foreigntaxes
$
Expenseswithheld
$
Assessnon-
receiv$
Cash$
DRP$
To bereceived
$Income transactions
Dividends - 19,730.42 67,162.33 28,783.84 - - - - 86,892.75 - - - - 71,887.32 15,005.43 -Foreign dividends - - - - - 10,789.94 - - 10,789.94 - 1,319.2
4- - 9,470.70 - -
Trust income 2,417.42 384.39 3,437.66 1,937.05 2,148.47 3,214.10 7,810.29 2,400.90 21,813.23 - 416.12 - 893.36 12,502.80 - 8,000.95
Totals 2,417.42 20,114.81 70,599.99 30,720.89 2,148.47 14,004.04 7,810.29 2,400.90 119,495.92 -1,735.3
6 - 893.36 93,860.82 15,005.43 8,000.95
Totals for allincome 2,417.42 20,114.81 70,599.99 30,720.89 2,148.47 14,004.04 7,810.29 2,400.90 119,495.92 - 1,735.3
6 - 893.36 93,860.82 15,005.43 8,000.95
(a) The income disclosed in this report is recognised on a tax-derivation basis. For more details, refer to the corresponding section of the Income transactions report.
Shaw and Partners Limited
S1234567: Ms Sample Portfolio Account Taxation income
01 Jul 2018 to 30 Jun 2019
Page 29

Income transactions declared but not paid
Asset Ex-date Tax date Payment date
Incometo be paid
$
Taxwithheld
$
Frankingcredits
$Foreign tax
$
DividendsCIMIC GROUP LIMITED FPOCIM 13/06/2019 4/07/2019 4/07/2019 5,160.00 - 2,211.43 -CIM totals 5,160.00 - 2,211.43 -
MACQUARIE GROUP LIMITED FPOMQG 13/05/2019 3/07/2019 3/07/2019 7,707.60 - 1,486.47 -MQG totals 7,707.60 - 1,486.47 -
NATIONAL AUSTRALIA BANK LIMITED FPONAB 14/05/2019 3/07/2019 3/07/2019 6,672.37 - 2,859.59 -NAB totals 6,672.37 - 2,859.59 -
NATIONAL AUSTRALIA BANK LIMITED CAP NOTE 3-BBSW+4.95% PERP NON-CUM RED T-07-22NABPD 27/06/2019 8/07/2019 8/07/2019 1,747.05 - 748.74 -NABPD totals 1,747.05 - 748.74 -
SYDNEY AIRPORT FULLY PAID STAPLED SECURITIES - SALSYD_SAL 27/06/2019 15/08/2019 15/08/2019 4,036.50 - - -SYD_SAL totals 4,036.50 - - -
Totals 25,323.52 - 7,306.23 -
Trust incomeCHARTER HALL SOCIAL INFRASTRUCTURE REIT UNITS FULLY PAIDCQE 27/06/2019 27/06/2019 19/07/2019 950.40 - - -CQE totals 950.40 - - -
CFS DEVELOPING COMPANIESFSF0035AU 28/06/2019 28/06/2019 5/07/2019 2,636.00 - 345.05 -FSF0035AU totals 2,636.00 - 345.05 -
SPDR S&P/ASX 200 FUND ETF UNITS FULLY PAIDSTW 27/06/2019 27/06/2019 11/07/2019 1,152.29 - 288.50 2.18STW totals 1,152.29 - 288.50 2.18
S1234567: Ms Sample Portfolio Account Income declared but not paid
As at 30 Jun 2019
Shaw and Partners Limited Page 30

Income transactions declared but not paid continued
Asset Ex-date Tax date Payment date
Incometo be paid
$
Taxwithheld
$
Frankingcredits
$Foreign tax
$
Trust incomeVANGUARD INTERNATIONAL SHARES INDEXVAN0003AU 28/06/2019 28/06/2019 1/07/2019 3,262.26 - - 184.33VAN0003AU totals 3,262.26 - - 184.33
Totals 8,000.95 - 633.55 186.51
Total declared but not paid 33,324.47 - 7,939.78 186.51
S1234567: Ms Sample Portfolio Account Income declared but not paid
As at 30 Jun 2019
Shaw and Partners Limited Page 31

ExpensesThere were no expenses within the period.
S1234567: Ms Sample Portfolio Account Expenses
01 Jul 2018 to 30 Jun 2019
Shaw and Partners Limited Page 32

Important noticesGeneral noticesGeneralThis report is published by Shaw and Partners Limited ABN 24 003 221 583, AFSL 236048 (“Shaw”) in good faith based on the facts known to it at the time of preparation and does not purport tocontain all relevant information in respect of the financial products to which it relates. Shaw provides no warranty of accuracy or reliability in relation to any information contained in this report.If you are not the intended recipient, you must not use or disclose the information in this report in anyway, please forward the email to [email protected] and delete theoriginal. To the extent permitted by law, Shaw, its officers, agents and employees accept no responsibility for any loss or damage whatsoever arising in any way from any representation orinformation expressly or impliedly published in or in relation to this report, notwithstanding any error or omission including negligence. Shaw or its authorised representatives may also receivefees or brokerage from dealing in financial products, see Shaw’s Financial Services Guide for information about the services offered by Shaw available at http://www.shawandpartners.com.au/.International TradingSecurities may be purchased or sold in currencies other than the Australian dollar, and both transactions and asset valuations may be reported in the Australian dollar equivalent at a currentmarket rate. Some of this information, including foreign corporate actions and their consequences, may be provided by third party sources, and is offered by Shaw in good faith with nowarranty as to taxation or other financial impact.This report is NOT intended to be adviceThe information provided on this report is not intended to influence any person in making a decision in relation to a particular financial product, class of financial products, or any interest ineither. Taxation is only one of the matters that must be considered when making a decision in relation to a financial product. However, to the extent that advice is provided on this report, itdoes not take into account any person's particular objectives, financial situation or needs. These should be considered to determine the appropriateness of the advice, before acting on it.
TaxationCGT for Exchange Traded Options (ETO's)When the writer grants an option, the premium received represents a capital gain pursuant to CGT event D2 (except if the writer is the company granting the options over its own shares ordebentures or by the trustee of a unit trust over its own units or debentures). Also, there is no discount on capital gain pursuant to CGT event D2 (applicable to any entity). Should the optionsubsequently be exercised, the capital gain that the grantor would otherwise have made from writing the option under CGT Event D2 mentioned above is disregarded. The premium however,will be recognised when calculating the subsequent disposal of the underlying shares CGT Event A1 either as: • A reduction in the cost base of the underlying asset in the case of a put option or• Part of the capital proceeds in the case of a call option upon disposal of the shares by the grantor. Accordingly, an amended assessment from the Australian Taxation Office may need to berequested for the prior year to reduce the CGT event D2 capital gain that arose in the prior year. In relation to the options, the unrealised CGT report covers possible CGT consequences that mayeventuate if the options are traded on an active market or the options are closed out. The taxation treatment of ETOs is complex and will depend, among other things, on whether transactionsare made by a trader, speculator, hedger or investor and whether they are made by individuals, trusts, complying superannuation funds or companies. Further, the specific tax rules for thetaxation of financial arrangements (TOFA) contained in Division 230 of the 1997 Income Tax Assessment Act may apply to certain taxpayers. Shaw does not provide tax advice and you shouldconsult with your accountant or other professional adviser with regards to the tax consequences of your transactions.Company Options and Rights on Pre CGT AssetsHolders of rights or options issued in respect of pre-CGT securities, who take up their entitlement to purchase the underlying security, should ensure that in addition to the consideration paidfor this security, the cost base of the underlying security also includes the market value of the right or option at the exercise date. The automated system for rights and options will only includethe consideration paid to acquire the security in its cost base.

Important notices continuedTaxationCorporate Shareholders and Share BuybacksCorporate shareholders i.e. companies who make a CGT loss as a result of a share buyback may have that loss denied or reduced as a result of section 159GZZZQ of the Income Tax AssessmentAct 1936. The automated system for input of share buybacks does not take into account this provision. Shareholders to whom this provision applies should obtain their own taxation advice.Foreign Income Tax Offsets on Foreign Listed SecuritiesFor dividends paid to Australian residents on foreign listed securities, foreign income tax offsets will be calculated based on the tax treaty between Australia and the security’s country ofdomicile. For countries that do not have a current tax treaty with Australia, the default rate will be applied. A foreign income tax offset is only calculated and reported on dividends where thegross dividend rate has been received from the data provider. If the dividend rate is received net or free of tax rate, no foreign income tax offset will be applied. Clients should also seek theirown taxation advice where required.Section 115-45. CGT DiscountingUsers should be aware of the existence of section 115-45 which potentially denies the CGT discount concession upon the sale of shares in a company or interest in a trust where the taxpayerwould not have been allowed CGT discounting on the majority of the CGT assets by cost and value in the company or trust had a CGT event happened to those assets. Clients to whom thissituation applies should also seek their own taxation advice.Superannuation Funds - Assets held at 30/06/1988Assets held by superannuation funds at 30 June 1988 including those acquired before 19 September 1985 are subject to special transitional measures that mean the assets are deemed to havebeen acquired on 30 June 1988. For these assets, the capital gain or loss that is realised upon disposal may be impacted by the market value of the asset at 30 June 1988. The automated systemfor calculating capital gains tax will only take into account the cost of the asset, not the market value as at 30 June 1988. To override the cost base with the market value, the cost base for theparcels can be edited in the Transaction screen. Holders to whom these transitional measures apply should obtain their own taxation advice.
ValuationEstimated IncomeIn the Report, an estimate is provided of the annual dividend yield for each security, as well as an estimate of the income you may receive. Future dividend yields are based on the historicaldividend paid for each security divided by the current share price. Estimated income set out in the Report is an estimate only, and is not a guarantee of future income. If you have any queriesregarding the estimated income for your portfolio, please contact your adviser.Fixed Income SecuritiesCertain fixed interest securities are quoted on a $1 per unit basis, rather than $100 per unit, with the number of units held adjusted to arrive at the correct valuation. Valuations for fixed incomesecurities are sourced from specialised providers as many fixed income securities are not traded on a listed market.Opening and Closing BalancesThe opening value shown in the Portfolio Performance Report may differ from the closing value reported last quarter. Any such discrepancy is a result of: actual distribution amounts differingfrom accrual information available at the time the previous report was prepared; fund or trust valuations which were not finalised until after the previous report was prepared; or additionalassets being added to your portfolio with an effective date prior to the opening balance date.Unlisted Security ValuationsUnlisted securities are reported at cost, unless an alternative valuation has been provided. The fair value of unlisted securities may be different to the amount reported and you should discussthis with your adviser.

Sydney | Head OfficeLevel 7, Chifley Tower 2 Chifley Square Sydney NSW 2000
Tel: +61 2 9238 1238Toll Free: 1800 636 625
Melbourne Level 36 120 Collins StreetMelbourne VIC 3000
Telephone: 03 9268 1000Toll Free: 1800 150 009
Brisbane Level 28 111 Eagle StreetBrisbane QLD 4000
Telephone: 07 3036 2500Toll Free: 1800 463 972
Adelaide Level 23 91 King William StreetAdelaide SA 5000
Telephone: 08 7109 6000Toll Free: 1800 636 625
Canberra Level 7 54 Marcus Clarke StreetCanberra ACT 2600
Telephone: 02 6113 5300Toll Free: 1800 636 625
Perth Level 20 108 St Georges TerracePerth WA 6000
Telephone: 08 9263 5200Toll Free: 1800 198 003
NoosaSuite 11a Q Place2 Quamby PlaceNoosa Heads QLD 4567
Telephone: 07 3036 2570Toll Free: 1800 271 201