Embed Size (px)
Citation preview

ISSN 2385-2755
Working papers
(Dipartimento di scienze sociali ed economiche)
[online]
SAPIENZA – UNIVERSITY OF ROME P.le Aldo Moro n.5 – 00185 Roma T (+39) 06 49910563 F (+39) 06 49910231 CF 80209930587 - P.IVA 02133771002
WORKING PAPERS SERIES
DIPARTIMENTO DI
SCIENZE SOCIALI ED ECONOMICHE
n. 6/2017
Samaritan Bundles: Inefficient Clustering in
NGO Projects
Author/s:
Gani Aldashev, Marco Marini, Thierry Verdier

Samaritan Bundles: InefficientClustering in NGO Projects∗
Gani Aldashev† Marco Marini‡ Thierry Verdier§
March 2017
Abstract
We build a model with non-governmental organizations competing through fundraisingfor donations and choosing their project types. Donors’ willingness to give differs acrossproject types. Each NGO chooses whether to compete in the larger donation market orto monopolize the smaller one. The resulting equilibrium configuration crucially depends onthe asymmetry in potential donation market size and on donors’ perceived substitutability orcomplementarity between giving to two different projects. We analyze the welfare propertiesof the decentralized equilibrum and characterize the conditions under which such equilibriumis inefficient. We also develop a variant of the model with inter-temporal choices of NGOs,analyze settings where NGOs can coordinate their fundraising activities and/or project typechoices, extend the model to allow for spillovers between NGO fundraising activities, andillustrate the mechanisms of the model with several case studies.
Keywords: non-governmental organizations, fundraising, foreign aid, clustering.JEL codes: L31, D64, F35, L13.
∗We thank audiences at CIRIEC International Conference (Antwerp), SITE (Stockholm) and N.G.O. workshop(Frankfurt) for useful suggestions. Financial support from the Labex OSE, FNRS (FRFC grant 7106145 "Altruismand NGO performance"), and from CIRIEC International is gratefully acknowledged.
†Universite libre de Bruxelles (ULB), ECARES, and CRED, University of Namur. Mailing address: 50 AvRoosevelt, CP 114/04, 1050 Brussels, Belgium. Email: [email protected].
‡University of Rome La Sapienza and CREI. Mailing Address: Department of Social and Economic Sciences,Piazzale Aldo Moro, 5, 00185, Rome, Italy. Email: [email protected].
§Corresponding author: PSE and Ecole des Ponts Paris-Tech , PUC-Rio, CEPR. Mailing address: PSE, 48Boulevard Jourdan, 75014 Paris, France. Email: [email protected].
1
"The greatest tension for the thoughtful Northern NGO today lies in the attempt
to balance fundraising messages for a public most easily moved by short-term disaster
appeals, with recognition that longer-term development depends on the willingness of
that same public to support difficult and costly structural change." (Smillie 1995: 137)
"The ’humanitarian Gresham’s Law’ is derived from the decoupling of aid agencies’
hard and soft interests (their institutional interests versus their stated aims). It states:
in a situation of unregulated private humanitarian activity, ’debased’ humanitarianism
will drive out the ’authentic version." (De Waal 1997: 138)
1 Introduction
Non-govermental organizations (NGOs) have become key actors in development assistance over
the last decades. Currently, they represent a major channel through which aid projects are imple-
mented in developing countries, in several large sectors of public good provision (health, education,
poverty relief, environmental protection, human rights, gender equality, etc.).1 In terms of their
financing, NGOs rely on a mix of sources, including public funds. However, the key feature of
NGOs is their active engagement in fundraising campaigns to mobilize voluntary donations from
private citizens.
Despite the generalized optimism associated with NGO activities in developing countries (e.g.
Robinson and Riddell, 1995; Nancy and Yontcheva, 2006), several researchers have documented
that on many occasions these organizations allocate their resources and projects inefficiently. Koch
et al. (2009) analyze the international allocation of NGO aid, using data on 61 large NGOs from
various OECD countries, and find that NGOs mostly follow other NGOs in their choices of where
to carry out their projects. In other words, NGO aid is "clustered". They also find that NGOs
tend, in general, to select recipient countries with traits common to the headquarter countries of
NGOs (for instance, headquarter and beneficiary countries have the same religion, share common
colonial history, etc.).
Figure 1 shows the distribution of NGOs aid (for these 61 large organizations) in 2005, in per
capita terms, across the world. One can clearly see that the this distribution is highly uneven:
six countries received more than 9 euro per capita of NGO aid, whereas 28 countries received less
than 0.5 euros per capita.
[Figure 1 about here]
Similar patterns of NGO aid clustering occur also at a sub-national level. Fruttero and Gauri
(2005) document that NGOs in Bangladesh (especially those focusing on microfinance) tend to1Werker and Ahmed (2008) and Aldashev and Navarra (2014) survey salient facts concerning the development
NGO sector.
2

cluster geographically within the country. Barr and Fafchamps (2006) find evidence for excessive
geographic clustering of NGOs in Uganda, whereas Öhler (2013) documents such clustering of
NGO projects in regions within Cambodia.
The left panel of Figure 2 illustrates the distribution of NGO office density across Tanzanian
regions, whereas its right panel shows the poverty levels for these regions. Two regions (Arusha
and Dar-es-Salaam) have more than 30 NGO offices; however, these regions have the lowest relative
poverty rates within the country. On the other hand, the poorest areas of the country exhibit the
lowest density of NGO offices.2
[Figure 2 about here]
Clustering occurs not only in geographic terms, but also in the type of projects. For instance,
Smillie (1995: 136) describes that in the early 1980s, one of most successful type of projects in
which numerous NGOs engaged was child sponsorship. Gauri and Galef (2005) document that
in mid-2000s, most NGOs in Bangladesh were at least in part engaged in micro-credit services.
Similar clustering patterns have been extensively documented in the inter-temporal dimension (e.g.
Mattei, 2005). During certain humanitarian crises, too many NGOs rush to carry out emergency
activities whereas too few take care of post-emergency reconstruction work. During some other
crises (especially when the attention of the international community is turned to other events),
contrarily, almost no NGOs act sufficiently early, which aggravates the crisis, and a large number
of NGOs start acting late.
These findings confirm the numerous ethnographic accounts of NGO practitioners and inves-
tigative journalists that decry such inefficiencies in the international NGO sector (see Smillie,
1995; De Waal, 1997; Dichter, 2003; Mattei, 2005; Werly, 2005; Polman, 2010; among others). For
instance, Smillie (1995) writes:
"The ’pornography of poverty’ [is] the use of starving babies and other emotive
imagery to coax, cajole, and bludgeon donations from a guilt-ridden Northern pub-
lic... [The problem is] not that starving babies don’t exist, but that such pictures,
repeated year after year, create an image of horror and helplessness that far outweigh
reality. This is generally recognized by most NGOs to be counter-productive in terms
of creating understanding and awareness for longer-term development assistance." (p.
136)
On the other hand, there exist other contexts where NGOs seem to be able to coordinate on
the types of projects which results in a relatively efficient division of tasks and responsibilities.
2Koch (2009: 184) shows that a very similar picture emerges when one looks at the location of projects (andnot just offices) across a sub-set of regions for which data are available.
3
The coordinated or joint fundraising appeals in the United States, the Netherlands, the United
Kingdom, Belgium, and other countries is perhaps the leading example (Smillie, 1995; Aldashev et
al., 2014; Similon, 2015). Beyond fundraising, there are also multiple cases of NGO coordination
"in the field" (see ICVA, 2015).
Why does inefficient clustering of NGO projects occur in some cases, while efficient coordination
results in some others? What kind of interventions in aid policy design can help to alleviate this
problem? In this paper, we build a simple model that provides an analytical framework to address
these questions. In our model, there are two NGOs and two possible types of projects. We
build on the idea that NGOs are motivated by "warm-glow" desire to carry out larger projects,
but have to compete for donations, through time-costly fundraising activities. Before launching
fundraising campaigns, the NGOs non-cooperatively choose the types of their projects. The two
project types might differ in terms donors’ willingness to give, one type representing the relatively
larger donation market. If NGOs carry out the same type of projects (in the larger market),
donors perceive the projects as substitutes, which intensifies the competition for donations. Thus,
at the project type choice stage, each NGO faces a simple trade-off: entering the same (larger)
market as the rival but facing tougher competition versus monopolizing the smaller market. The
resulting equilibrium configuration crucially depends on the asymmetry in potential donation
market size and on donors’ perceived substitutability or complementarity between giving to the two
projects. We then analyze the welfare properties of the decentralized equilibrum and characterize
the conditions under which such equilibrium is inefficient. We also develop a variant of our
basic model with inter-temporal choices of NGOs, study what happens when NGOs are able
to coordinate their fundraising activities and/or project type choices, and extend the model to
allow for spillovers between NGO fundraising activities. Finally, we provide four case studies that
illustrate the main mechanisms of our model.
We contribute to the growing literature on the economics of NGOs. Besley and Ghatak (2001)
present a general model of optimal ownership of public goods (government versus NGO), focusing
on the key role of incompleteness of contracts in foreign aid and the non-excludable nature of
project benefits. The above-mentioned paper by Fruttero and Gauri (2005) is the first to model
the rational decision of geographic location of NGOs under alternative assumptions about their
motivations. Aldashev and Verdier (2009, 2010) build models of horizontally-differentiated NGO
competition on the markets for donations, while Aldashev et al. (2014) show the conditions under
which NGOs are able to overcome the excessive competition and coordinate their fundraising
activities in a stable fashion. Burger et al. (2015) focus on the optimal regulatory policies of
NGOs under asymmetric information concerning the level of altruism of NGO founders. Heyes and
Martin (2015) study the equilibrium breadth of NGO missions in a model where NGOs compete
for donations through the choice of mission statements. Auriol and Brilon (2014) and Aldashev
4

et al. (2017) study the self-selection of motivated agents into the NGO sector. Scharf (2014)
studies the relative efficiency of the equilibrium entry/selection of NGOs into the competitive
market under alternative financing schemes, whereas Krasteva and Yildirim (2016) analyze how
the adverse selection into NGO sector depends on the sector size and the donors’ information costs
about NGO quality. Our paper contributes to this literature by providing a simple but flexible
model of NGO choice of activity type, which can encompass a rich set of choices that NGOs
competing for donations undertake in real-life contexts.
2 Basic model
2.1 Setup
Donors. Consider an economy with a continuum of atomistic donors of unitary size. Donors
consume a numeraire good and receive a warm-glow benefit (à la Andreoni, 1989) from giving to
two projects carried out by two non-govermental organizations, denoted l = 1> 2. The beneficiaries
of these projects are located in a developing country; for simplicity, we assume that they do not
undertake any action.
Denoting the income of a donor with L, her budget constraint can be written as
F +2X
l=1
gl = L> (1)
where F denotes the consumption of numeraire, g = (gl)l=1>2 is a vector of donations to the two
projects.
Donors’ preferences are described by a linear-quadratic utility function (Singh and Vives, 1984):
X(F> g) = F +2X
l=1
$lgl −1
2
2X
l=1
g2l − eglgm= (2)
The interpretation of the key parameters is as follows. $l stands for the "willingness to give" of
the donor to the project l . The donor might be willing to give if, for instance, she is familiar with
the cause and considers it as important. This could also include the emotional drive to give if the
cause involves helping beneficiaries that the donor considers as particularly needy or close to her
along some dimension (ethnicity, religion, race).3 Thus, $l depends positively on the awareness of
the donor about the cause, its perceived importance for her, and the degree to which she identifies
with the beneficiaries.3Fong and Luttmer (2009) find, using the data from the U.S. survey following the Hurricane Katrina, that the
donors who strongly identify with their own racial group give substantially more when victims are of the same race,as compared to the donors who do not feel very close to their own group.
5

The parameter e ∈ (−1> 1) measures the degree of substitution (or complementarity) betweendonations to two NGOs, and captures the extent to which a donor considers the projects of two
NGOs as (dis)similar to each other, i.e. the "loyalty" of the donor to the NGO ’brands’. This
depends both on the characteristics of the donor and those of the NGOs. For instance, if the
donor mostly cares about the social prestige or social norm associated with giving (and less about
the identity of the NGO to which she donates), e would be close to 1. Contrarily, the donor
that is strongly familiar with the different organizations and cares about their identity, would
consider giving to the projects of the two NGOs as poor substitutes (thus e is close to zero).
Moreover, if the origins or the operating methods of the two NGOs differ strongly, the donor
plausibly considers them as highly distinct. This occurs, for instance, if the NGOs are born from
different religious affiliations, or if they use highly divergent methods in advancing their causes
(e.g. militant approach of Greenpeace versus the more conservative one of the World Wildlife
Fund). Similarly, for e ? 0, the donor perceives giving to the two NGOs as complementary and
considers her giving to one NGO implying the rationale to give also to the other NGO.
Non-governmental organizations. We assume that each NGO is run by an impurely al-
truistic (again, as in Andreoni (1989)) social entrepreneur who receives a "warm-glow" utility
increasing in the output of her NGO. This implies that the objective function of an NGO is to
maximize the output of its project. The production technology of the project of NGO l has two
inputs, funds Il and time � l :4
Tl(Il> � l) = Il · � l= (3)
Each social entrepreneur has an endowment of 1 unit of time. She divides this time between
working on the project and conducting fundraising campaigns:
1 = � l + |l> (4)
where |l denotes the amount of time devoted to fundraising. The fundraising effort |l spent by
NGO l influences the weights $l of donors (and thus the amount given to the NGO’s project):
$l = $ + |l> (5)
where $ denotes the baseline weight of giving (i.e. the weight that the donor attaches to giving
to a project, in the absence of fundraising).
The NGOs are legally non-profit organizations: they are barred by law from distributing the
unspent revenues (Hansmann, 1980; Weisbrod, 1988). Consequently, each social entrepreneur puts
all the funds that she collects (net of the financial costs) into the project. Denoting, byGl = gl(1),
4The fact that returns to scale are increasing does not affect the main results: the analysis remains the samewith any Cobb-Douglas production function.
6

the donations collected by NGO l, the non-distribution constraint can be formally expressed as
Gl = i + fGl + Il,
where 0 ≤ f ? 1 is the financial cost of collecting a unitary donation, i A 0 is the fixed cost of
the project, and Il is the amount invested into the project. The non-distribution constraint pins
down the amount of funds that the NGO invests into its project:
Il = (1− f)Gl − i= (6)
Project types. The project of NGO l can be of two types, which we denote with nl = D>E.
These types generally capture the differentiation of NGO projects along a certain dimension, which
can be geographic (i.e. projects in same/different countries or regions with a country), temporal
in fundraising (i.e. conducting campaigns in the same/different moments of the year), temporal
in projects (emergency relief versus long-run reconstruction), technology used (relying more/little
on local inputs and staff), etc.
Let n1n2 stand for the configuration (pair) of project types. If both NGOs select the same type,
i.e. n1n2 = DD or n1n2 = EE , donors perceive giving to the two NGOs’ projects as substitutes
(or complements); in that case the parameter e, expressing the degree of substitutability (or
complementarity) of giving to the two NGOs, takes a positive (negative) value. Contrarily, if each
NGO selects a project of a different type (i.e. n1n2 = DE or n1n2 = ED), the donors perceive them
as fully independent and the two NGOs operate as if they were each in a monopolistic donation
market (and e = 0). Each project type nl = D>E is characterized by its own specific baseline
"willingness-to-give" $n. We assume 1 ≤ $n ≤ 2, to rule out zero donations (which would resultunder $n ? 1) and no fundraising by NGOs (which would occur if $n A 2).5
Timing. The sequence of actions is as follows. At stage 1, each NGO (simultaneously and
non-cooperatively) chooses the type of its project. At stage 2, NGOs (simultaneously and non-
cooperatively) set their fundraising efforts |l and |m. At stage 3, donors decide on their donations,
NGOs collect the donations and produce.6
5These constraints on the willingness-to-give $n guarantee the existence of positive donations and positivefundraising levels at the symmetric fundraising equilibria, the ones occurring under the equilibrium choice ofprojects (see Section 2.2.3).
6In Section 4, we present a variant of the model in which we explicitly focus on the inter-temporal dimensionand where NGOs can choose the type of the projects sequentially.
7

2.2 Equilibrium Analysis
2.2.1 Donations
Consider a given choice of project types and fundraising efforts by NGOs. Given these, by (1) and
(2), a donor’s constrained optimal donation choice satisfies the first-order condition
$l − gl − egm| {z }MB of giving to l
= 1|{z}MC of giving to l
for l = 1> 2 and m 6= l.
The marginal benefit of giving to NGO l falls with gl and diminishes or increases in gm depending
on the sign of e. Moreover, the marginal benefit of giving to l falls with gm faster when donations to
the two projects are closer substitutes ( e approaching 1). For e ? 0 the marginal benefit of giving
to project l increases with gm, meaning that the donor perceives a donation to the two projects as
complementary.
From this first-order condition we obtain the individual donor’s giving to NGO l:
gl =$l − (1− e)− e$m
1− e2= (7)
Substituting (5) into (7), we obtain, for every l = 1> 2 and m 6= l, the donation function
gl = �+ �|l + �|m> (8)
where
� =$ − 11 + e
−i
1− f> � =
1
1− e2> � = −
e
1− e2= (9)
Then, using (3), (6), and (8), the objective function of the NGO l can be expressed as a
function of its fundraising effort and of the effort of its rival:
Tl (|l> |m) = (1− f) (�+ �|l + �|m)(1− |l)= (10)
It is easy to notice that, according to (9) and (10),
CTl (|l> |−l)
C|m= � (1− f) (1− |l) Q 0 for e R 0,
andC2Tl (|l> |−l)
C|lC|m= −�(1− f) R 0 for e R 0. (11)
Thus, when projects are considered as substitutes by donors (e A 0), the NGOs impose negative
externalities on each other’s output through fundrasing, and their fundraising efforts are strategic
complements (in other words, an increase in the rival’s fundraising raises the incentives for an NGO
to devote more time to fundraising). Contrarily, when donors view the projects as complementary
(e ? 0), the NGOs impose positive externalities on each other’s output, and fundraising efforts
are strategic substitutes: higher fundraising by the rival NGO increases the donations given to l
and reduces its incentive to divert an additional unit of time from the project to the fundraising
activity.
8

2.2.2 Fundraising
Each NGO sets its fundraising effort level to maximize its objective function
max|l
Tl (|l> |−l) = max|l
(1− f) (�+ �|l + �|m)(1− |l)= (12)
The resulting first-order conditions for an interior maximum are, for l = 1> 2 :
CTl (|l> |m)
C|l= �(1− f)(1− |l)| {z }
marginal benefit of fundraising
− (1− f)(�+ �|l + �|m)| {z }marginal cost of fundraising
= 0> (13)
implying that the NGO equates the marginal benefit of fundraising (in terms of project output) to
its marginal (opportunity) cost. Intuitively, spending one incremental unit of time for fundraising
raises additional �(1 − f) amount of funds, which, given the time left for the project, maps into
�O(1 − f)(1 − |l) more of project output. On the other hand, this incremental unit of time is
taken away from working on the project, and this reduction in time of project work costs Gl units
of output. A rational NGO entrepreneur allocates her time between the two activities so as to
equate the two values.
Using symmetry, one easily obtains the following equilibrium fundraising effort level for l =
1> 2.7
|∗l = 1− $
µ1− e
2− e
¶= (14)
Equilibrium fundraising decreases with the initial awareness level of donors $ : more generous
donations make funds less scarce in the production function of NGOs, which induces them to
devote less time to fundraising.
Contrarily, equilibrium fundraising increases with the substitutability of the two NGOs for
donors, e: more substitutable NGO projects make the competition for funds more intense, which,
ceteris paribus, reduces the funds of each NGO. This makes funds in the production function more
scarce, and thus increases the net marginal benefit of fundraising, inducing NGOs to devote more
time to this activity. Finally, when projects are complements (for e ? 0), a free-riding effect is
in place: more effort in fundraising by the rival stimulates less effort by an NGO in equilibrium.
As e tends to −1, the positive externalities in fundraising become larger and the free-riding effectgets stronger, driving down the equilibrium fundraising.
The corresponding equilibrium payoff is
Tl (|∗) =
(1− f) (1− e)$2
(1 + e) (2− e)2= (15)
7Henceforth, for ease of exposition (and without loss of generality), we normalize i to zero (which simply scalesdown the value of � and does not play any relevant role for the results of the paper).
9

One easily sees that the equilibrium output decreases monotonically with e: the more resources
are diverted away from the project towards fundraising, the less project output is produced in
equilibrium.
2.2.3 Choice of projects
Consider now the first-stage choice on the type of projects nl = D>E . Each NGO compares the
payoff it obtains when the two projects "cluster", as in (15), that is, for n1n2 = DD or n1n2 = EE,
Tl (|∗) =
(1− f) (1− e)$2nl(1 + e) (2− e)2
> (16)
to the one obtained under the monopoly markets, for n1n2 = DE or n1n2 = ED,
Tl (|∗) =
(1− f)$2nl4
= (17)
Therefore, at stage 1, the NGOs play a simultaneous-move game in project type choice that
can be represented in the following normal form:
To determine the best-response choices, consider NGO 1. Suppose its rival chooses the project
of type D . In that case, by (16)-(17), NGO 1’s choice of project type reduces to the comparison
1√1− e2
2(1− e)
2− e| {z }K(e)
$D ≷ $E.
Similarly, suppose NGO 2 chooses type- E project. Then, the NGO 1 compares
1√1− e2
2(1− e)
2− e| {z }K(e)
$E ≷ $D= (18)
Given that the decision faced by NGO 2 is symmetric, this allows us to easily characterize
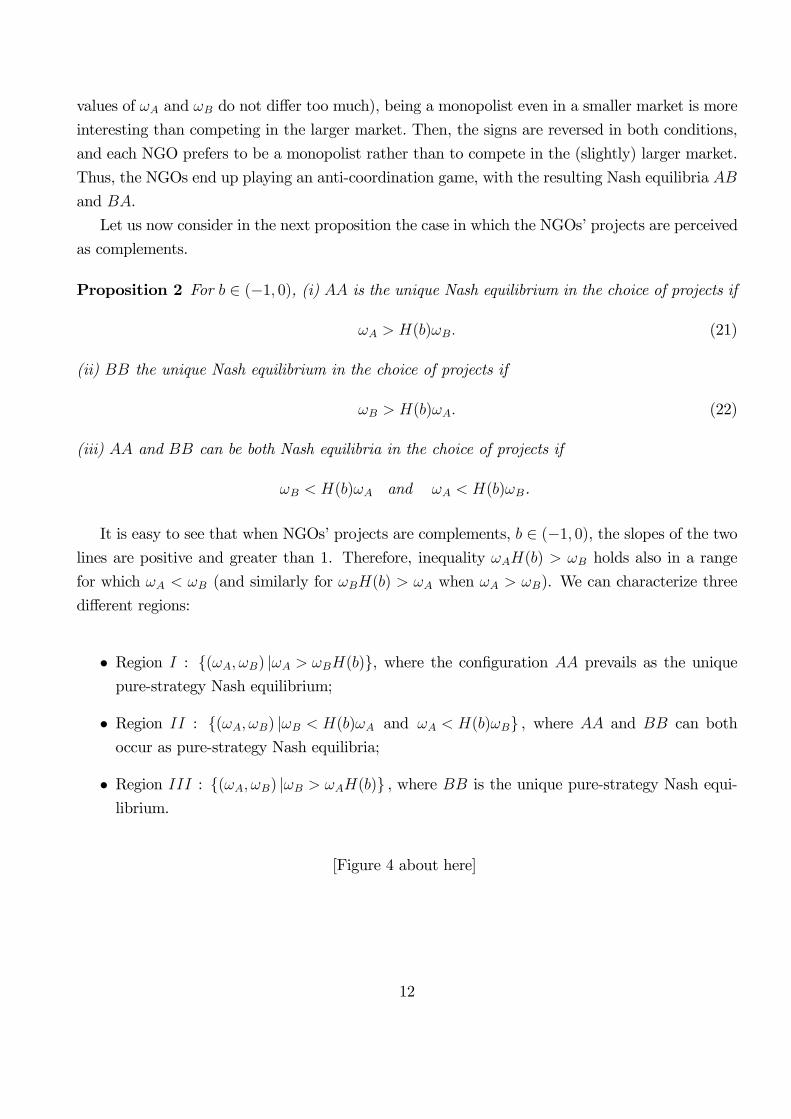
equilibria in the choice of projects. Propositions 1 and 2 summarize this characterization.
Proposition 1 For e ∈ [0> 1) : (i) DD is the unique Nash equilibrium in the choice of projects if
$E ? K(e)$D (19)
(ii) EE is the unique Nash equilibrium if
$D ? K(e)$E (20)
(iii) DE and ED are Nash equilibria in pure strategies in the choice of projects if8
$E ≥ K(e)$D and $D ≥ K(e)$E.
8In addition, case (iii) has a third, mixed-strategy equilibrium.
10

Figure 3 describes the range of pure strategy Nash equilibria in the plane ($D> $E) for the case
in which projects are perceived as substitutes. Line (DD) is given by the equation
$E = K(e)$D,
such that below this line the configurationDD arises as a Nash equilibrium in the choice of projects.
Similarly, the line (EE) is described by
$D = K(e)$E,
such that above this line the configuration EE arises as a Nash equilibrium. When the two NGOs
select the same project (DD or EE) and they are perceived as substitutes by donors (e ∈ (0> 1))the slopes of the two lines are positive and always smaller than 1, since K(e) tends to 1 for e→ 0
and tends to zero for e → 1. Therefore, K(e)$D A $E implies both $D A $E and $D A K(e)$E
and this means that the condition (19) determines the uniqueness of project equilibrium (here
DD). The same can be said for condition (20). In this case, given that the two lines start at the
origin, they divide the ($D> $E) plane into three regions, as follows:
• Region L : {($D> $E) |$DK(e) A $E}, where the configuration DD prevails as the unique
pure-strategy Nash equilibrium;
• Region LL : {($D> $E) |$D ≥ K(e)$E and $E ≥ K(e)$D} , where DE and ED are both pure-strategy Nash equilibria;
• Region LLL : {($D> $E) |$EK(e) A $D} , where EE prevails as the unique pure-strategy
Nash equilibrium.
[Figure 3 about here]
The intuition behind the result is as follows. For e ∈ (0> 1) NGO projects are viewed as
substitutes by donors. When deciding about the type of its project, each NGO compares the
output it would obtain by being in a larger duopoly donation market (where it has to compete with
its rival and face the business-stealing effect) to the one obtained in a monopoly in the alternative
but smaller market. If the first market (say, D) is potentially much bigger than the second because
of the difference in the pre-existing awareness level $ of donors, the market size effect dominates
the competition effect (i.e. the condition (19) is satisfied). Then, both NGOs prefer to choose the
type D, which results in the configuration DD being the unique Nash equilibrium. The same logic
applies when the condition (20) is satisfied, and thus the configuration EE becomes the unique
Nash equilibrium. Instead, when the donation markets are of relatively comparable size (i.e. the
11
values of $D and $E do not differ too much), being a monopolist even in a smaller market is more
interesting than competing in the larger market. Then, the signs are reversed in both conditions,
and each NGO prefers to be a monopolist rather than to compete in the (slightly) larger market.
Thus, the NGOs end up playing an anti-coordination game, with the resulting Nash equilibria DE
and ED.
Let us now consider in the next proposition the case in which the NGOs’ projects are perceived
as complements.
Proposition 2 For e ∈ (−1> 0), (i) DD is the unique Nash equilibrium in the choice of projects if
$D A K(e)$E= (21)
(ii) EE the unique Nash equilibrium in the choice of projects if
$E A K(e)$D= (22)
(iii) DD and EE can be both Nash equilibria in the choice of projects if
$E ? K(e)$D and $D ? K(e)$E.
It is easy to see that when NGOs’ projects are complements, e ∈ (−1> 0), the slopes of the twolines are positive and greater than 1. Therefore, inequality $DK(e) A $E holds also in a range
for which $D ? $E (and similarly for $EK(e) A $D when $D A $E). We can characterize three
different regions:
• Region L : {($D> $E) |$D A $EK(e)}, where the configuration DD prevails as the unique
pure-strategy Nash equilibrium;
• Region LL : {($D> $E) |$E ? K(e)$D and $D ? K(e)$E} , where DD and EE can both
occur as pure-strategy Nash equilibria;
• Region LLL : {($D> $E) |$E A $DK(e)} , where EE is the unique pure-strategy Nash equi-
librium.
[Figure 4 about here]
12

The results of Proposition 2 mainly depend on the fact that in this case the two NGOs always
prefer to compete in the same market than being a monopolist. This comes from the positive
externalities that NGO fundraising activities generate on the donations collected by the rival.
Moreover, in region LL it can now occur that the NGOs are trapped in an "bad equilibrium", in
which they have both chosen project D when the awareness level $E A $D (i.e. the market D is
potentially the smaller one) or, alternatively, project E when $E ? $D.
Note that, according to Propositions 1 and 2, we observe non-clustering in projects only in
region LL under e A 0. This means that NGOs specializing in different project types is essentially
driven by the fact that NGOs’ projects are perceived as substitutes in terms of donors’ awareness
and that the NGOs’ desire to avoid competiting with each other for donations is sufficiently strong.
Importantly, this "specialization in causes" disappears whenever some exogenous event makes one
of the causes particularly salient in the eyes of donors (even if this may have little to do with the
importance of the cause or the underlying need) and then clustering is likely to emerge.
We can now make a simple comparative statics analysis. Consider the case e A 0. A decrease
in the substitutability of giving between two NGOs, e, rotates both lines towards the 45◦ line.
Thus, clustering is more likely to occur when donors become more "loyal" to individual NGOs.
This happens because the weakening competition between NGOs makes the potential size of the
donation market a relatively more important consideration. At the limit, when e→ 0, the region
LL completely disappears: when NGOs effectively do not compete with each other for donations,
they only care about entering the larger market, and we observe non-clustering outcome only in
the knife-edge case of perfectly identical initial awareness of donors.
This comparative statics result provides an interesting testable implication. Consider two large
international NGOs (one religious and one secular) that collect funds in two countries, for the same
causes. Suppose the level of religiosity in one country is higher than in the other. Our above result
implies that in the more religious country, donors have a stronger feeling of loyalty towards the
religious NGO, and thus, the intensity of competition is weaker, than in the less religious country.
Thus, we should more likely observe clustering by the two NGOs (in terms of their project choice)
in the more religious country.
Consider now the case of complementary donations, e ? 0. Our analysis suggests that when the
perceived complementarity of giving to the two projects increases (e approaches −1), clusteringremains always the unique outcome. In addition, however, the miscoordination of NGOs (i.e.
being trapped in the potentially smaller donation market) becomes possible. Consider any point
(on Figure 4) located below the 45◦ line but above the (EE) line. At such a point, donors’ latent
willingness-to-give to project D is higher than to project E. However, both NGOs choosing a
project of type E is a Nash equilibrium: if NGO l believes that m would (for some reason)
choose project type E, then l prefers to do the same rather than choosing D. This is because the
13

complementarity in the donations is sufficiently strong to outweigh the size-of-market incentive
for l to choose project D.
3 Welfare
As discussed in the introduction, the critiques raised by NGO practitioners concerning the clus-
tering behavior of NGOs underline the inefficiencies that emerge from the uncoordinated project
choices by NGOs. However, what is the exact origin of these inefficiencies? Addressing this ques-
tion and analyzing the claims concerning the inefficiency of decentralized choices of NGOs and
donors needs an explicit specification of the social welfare function, which in this context with
endogenous donors’ preferences is non-trivial, as we explain below.
There are two main difficulties with a full welfare analysis. First, concerning the utility of
donors, the presence of a warm-glow component poses a well-known conceptual problem. How
should their welfare be evaluated, given that the actions of NGOs de facto modify their preferences?
This problem is similar to the one arising in the welfare analysis of (non-informative) advertising.
One solution to this problem was proposed by Dixit and Norman (1978). It consists in fixing
the pre-advertising identity of the consumers, and using this benchmark to evaluate the post-
advertising outcomes. We adopt this solution here. Specifically, we fix the pre-fundraising identity
of the donors and evaluate the decentralized equilibrium outcomes against this benchmark:
ZG = X(F> g;$).
Second, how do we compare the utility of donors with the utility of the beneficiaries of NGOs’
projects? As the latter play no active role in the model, we could assume that their welfare is
appropriately represented by some aggregate index ZQ combining the projects outputs of the
NGO entrepreneurs ZQ = ](Tl (|l> |m) ;Tm (|m> |l)). A simple measure could for instance be the
sum of these outputs ZQ = Tl (|l> |m) + Tm (|m> |l) . Social welfare would then be written as
VZ = ZQ + �ZG with � reflecting implicitly the relative weight of the the donors’ welfare as
compared to the NGOs beneficiaries’ welfare.
Obviously how far the resulting decentralized equilibria characterized in the previous section
differ from a welfare maximizing allocation, and whether there is a scope for policy interventions
to improve social welfare is likely to depend on the value of � (as well as on the aggregate index
](=> =) function of NGO ouputs describing the recipients’ welfare). In what follows we provide such
a comparison for the simple utilitarian case where � = 1 and ZQ = Tl (|l> |m) +Tm (|m> |l).
Given the symmetry of NGOs in terms of technology and endowments, to evaluate the impli-
cations of decentralized equilibria, it suffices to consider three cases: (i) no clustering, (ii) both
14

NGOs’ projects are of type D ; (iii) both are of type E. The social welfare maximization then
consists in comparing the maximum social welfare attainable in each of the three cases.
The potential inefficiencies occurring in the various decentralized equilibria are summarized by
the next proposition, whose proof is relegated in the Appendix.
Proposition 3 (i) For e ∈ [0> 1), there is a range of willingness-to-give ($D> $E) such that the
decentralized selection of projects by NGOs is sub-optimal and characterized by excessive clustering.
(ii) For e ∈ (−1> 0), there is a range of willingness-to-give ($D> $E) such that the decentralized
selection of projects by NGOs are sub-optimal and characterized by miscoordination in the choice
of project.
Proof. See the Appendix.As proven in the Appendix, at the optimal fundrasing choice,
VZ◦
DD A VZ◦
ED (23)
for
$E ? $DK◦(e) (24)
and, similarly,
VZ◦
EE A VZ◦
DE (25)
for
$D ? $EK◦(e)> (26)
where
K◦(e) =
1
2+
p($D − $2D) (16e
2 − 16)− 4e2 + 44 (e+ 1)
.
Thus, comparing (24) and (26) with the Nash equilibrium NGOs project choice (expressions (19)
and (20)) it emerges that
K◦(e) ? K(e) for e ∈ (0> 1) (27)
and, conversely,
K◦(e) A K(e) for e ∈ (0>−1). (28)
Expression (27) says that when the NGOs’ projects (DD) or (EE) are perceived as substitutes
(e A 0) by the donors, the welfare-maximizing choice of projects would imply non-clustering
for a broader range of $D and $E than at the decentralized equilibrium. Grey areas in Figure 5
depict the combination ($D> $E) of willingness-to-give to the two projects for which a decentralized
choice of projects causes a social welfare loss due to an excessive clustering towards the project
that guarantees more visibility and, thus, more donations.
15
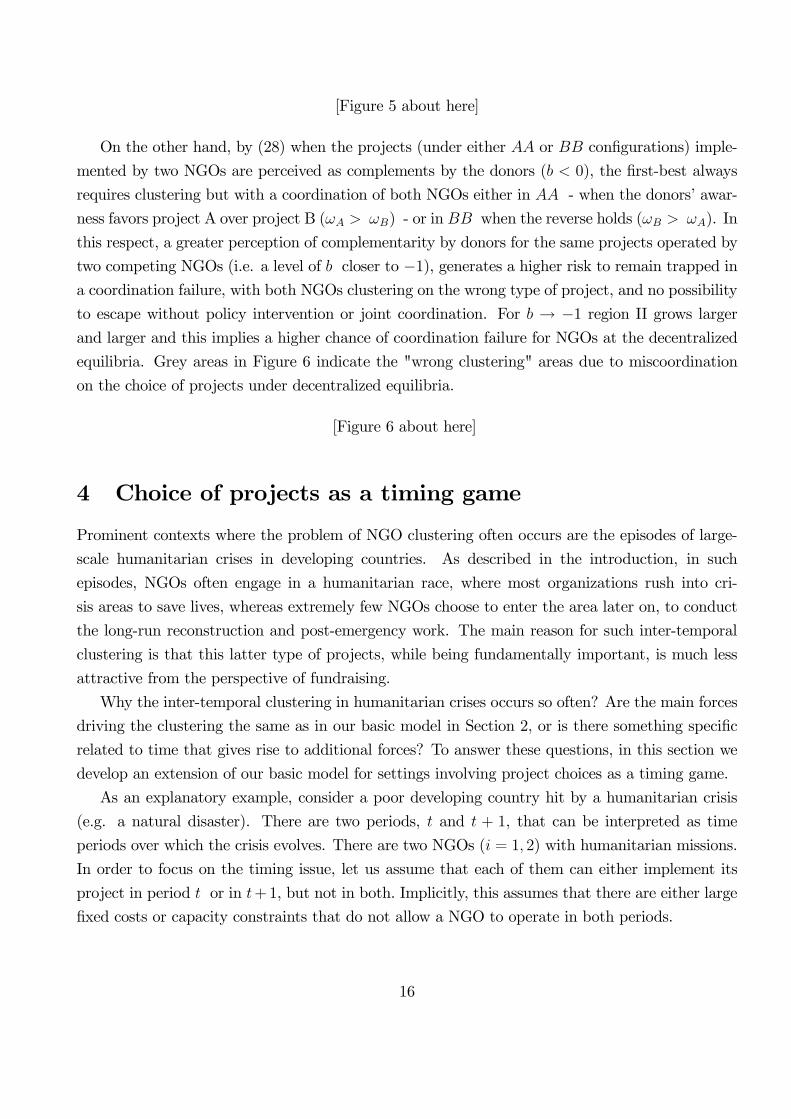
[Figure 5 about here]
On the other hand, by (28) when the projects (under either DD or EE configurations) imple-
mented by two NGOs are perceived as complements by the donors (e ? 0), the first-best always
requires clustering but with a coordination of both NGOs either in DD - when the donors’ awar-
ness favors project A over project B ($D A $E) - or in EE when the reverse holds ($E A $D). In
this respect, a greater perception of complementarity by donors for the same projects operated by
two competing NGOs (i.e. a level of e closer to −1), generates a higher risk to remain trapped ina coordination failure, with both NGOs clustering on the wrong type of project, and no possibility
to escape without policy intervention or joint coordination. For e → −1 region II grows largerand larger and this implies a higher chance of coordination failure for NGOs at the decentralized
equilibria. Grey areas in Figure 6 indicate the "wrong clustering" areas due to miscoordination
on the choice of projects under decentralized equilibria.
[Figure 6 about here]
4 Choice of projects as a timing game
Prominent contexts where the problem of NGO clustering often occurs are the episodes of large-
scale humanitarian crises in developing countries. As described in the introduction, in such
episodes, NGOs often engage in a humanitarian race, where most organizations rush into cri-
sis areas to save lives, whereas extremely few NGOs choose to enter the area later on, to conduct
the long-run reconstruction and post-emergency work. The main reason for such inter-temporal
clustering is that this latter type of projects, while being fundamentally important, is much less
attractive from the perspective of fundraising.
Why the inter-temporal clustering in humanitarian crises occurs so often? Are the main forces
driving the clustering the same as in our basic model in Section 2, or is there something specific
related to time that gives rise to additional forces? To answer these questions, in this section we
develop an extension of our basic model for settings involving project choices as a timing game.
As an explanatory example, consider a poor developing country hit by a humanitarian crisis
(e.g. a natural disaster). There are two periods, w and w + 1, that can be interpreted as time
periods over which the crisis evolves. There are two NGOs (l = 1> 2) with humanitarian missions.
In order to focus on the timing issue, let us assume that each of them can either implement its
project in period w or in w+1, but not in both. Implicitly, this assumes that there are either large
fixed costs or capacity constraints that do not allow a NGO to operate in both periods.
16

The utility function of the donor takes into account the existence of two periods and now
becomes
X(F> gw> gw+1) = Fw +2X
l=1
$lgwl −
S2l=1(gwl)
2
2− egw1g
w2 +
+�
"Fw+1 +
2X
l=1
$lgw+1l −
S2l=1(g
w+1l )
2
2− egw+11 gw+12 − �
¡gw1 + gw2
¢ ¡gw+11 + gw+12
¢#,
where $l denotes the utility weight of donation to the project of NGO l, gwl the amount given to
NGO l if its project is carried out in period w, and gw+1l the amount given to NGO l if its project
is carried out in w+ 1. Let also Fw and Fw+1 denote the consumption of the numéraire in the two
periods.
The utility function of the donor in this modified model contains the following key parameters.
Similar to the basic model, e denotes the degree of substitutability or complementarity of giving
to the projects of two NGOs, if these projects are carried out in the same period. The time-
discounting factor � ∈ (0> 1) captures the degree of patience of the donor, whereas � measuresthe degree of donor’s "aid fatigue" (if � A 0) or donor’s habit formation of giving (if � ? 0).
Intuitively, � A 0 when a donor that has given to an NGO in period w feels a lower marginal utility
from giving in period w + 1: this has been documented in experiments, for instance, by Donkers
et al. (2017). Similarly, � ? 0 when a donor that has given to an NGO in period w feels a higher
marginal utility from giving in period w + 1, which can occur, for instance, if the donor starts to
become more familiar with the organizations to which she has given in the past.
The intertemporal budget constraint of the donor is
L ≡ Lw +Lw+11 + u
= Fw +Fw+1
1 + u+
2X
l=1
gwl +2X
l=1
gw+1l
1 + u,
where u denotes the real interest rate. For simplicity, assume that the subjective discount factor
is equal to the objective (market) one, i.e. � = 11+u. Then, the objective function of the donor
simply becomes
X = L −2X
l=1
gwl − �2X
l=1
gw+1l +2X
l=1
$lgwl −
S2l=1(gwl)
2
2− egw1g
w2 +
+�
"2X
l=1
$lgw+1l −
S2l=1(g
w+1l )
2
2− egw+11 gw+12 − �
¡gw1 + gw2
¢ ¡gw+11 + gw+12
¢#.
The sequence of actions is now modified as follows. At the beginning of period w, each NGO
chooses (simultaneously and non-cooperatively) whether it will implement its project in w or in
w + 1. The NGO(s) that has (have) decided to implement its (their) project in w then set its
17

(their) fundraising efforts at this time. Donors decide on their donations to this (these) NGOs,
rationally anticipating the fundraising occurring in w+ 1, if any. The collection of donations and
the production of the project output occurs at this stage. Similarly in w+1, the NGO(s) that has
(have) decided to implement its (their) project in w+1 set its (their) fundraising effort(s). Donors
give to this (these) NGO(s) and then the implementation of project output(s) occurs.
Waiting is costly, as the humanitarian crisis deepens in the absence of action. Specifically, we
assume that the NGOs’ payoffs in period w + 1 is multiplied by a factor � ? 1 if no project gets
implemented in period w. Moreover, we assume that the baseline willingness to give $ is the same
in both periods.9
Note that in case the two NGOs cluster temporally (i.e. both produce in w or both produce
in w+ 1), when choosing their fundraising efforts they play a simultaneous-move game. Instead, if
they do not cluster (one NGO implements its project in w whereas the other implements in w+1),
they play a Stackelberg duopoly game in fundraising. Moreover, donors are rational and take this
into account. As we will see, this has non-trivial consequences for the analysis, given that the
preferences of donors are not time separable.
4.1 Naive NGOs
Suppose (for the moment) that NGOs are "naive" in their inter-temporal reasoning, i.e. when
considering the non-clustering equilibria they act as if they played a sequential game without
taking into account the strategic effects of being Stackelberg leader or follower. We consider this
so as to explore which new results arise because of the inter-temporal nature of the game. Later,
we will consider the fully-rational sequential decisions taken by NGOs and will see what additional
results the sequential- versus simultaneous-game trade-offs will deliver. The game in project type
choice becomes now representable as follows: where superscript q stands for "naive", indicated
only in sequential strategy profiles w and w + 1 , denoting the fact that projects are implemented
in these periods.
Constructing the NGOs payoffs in the main diagonal of this matrix is easy. If both NGOs act
in period w , no project is operational (and thus donors do not give) in period w + 1. Then, the
game is very similar to the one analyzed in the basic model and
Tw>w =O (1− f)$2 (1− e)
(1 + e) (2− e)2.
Similarly, if both NGOs operate in period w + 1 , no donations are given in period w, and the
9Once the logic of the model is understood, it is easy to relax this assumption and see how the equilibria getaffected if $ declines over time ($w+1 ? $w) or if it is increasing ($w+1 A $w).
18
only difference with respect to the above case is that the payoffs of NGOs are reduced by �:
Tw+1>w+1 = �O (1− f)$2 (1− e)
(1 + e) (2− e)2.
Things are slightly different in case of non-clustering. If one NGO operates in w while the other
in w+ 1, a donor’s utility function takes the form
X = L − gw1 − �gw+12 + $1gw1 −
(gw1)2
2+ �
"$2g
w+12 −
¡gw+12
¢2
2− �gw1g
w+12
#.
For "naive" NGOs, this simply implies playing a game in fundraising efforts in a market where
donors’ parameter of substitutability of giving to the two projects is �� (instead of e). Then, it is
straightforward to obtain the payoffs of the two NGOs as:
Tqw+1>w = Tq
w>w+1 =O (1− f)$2 (1− ��)
(1 + ��) (2− ��)2= (29)
Notice that expression (29) monotonically decreases with ��. This implies that if e A �� (see
Figure 7), then the Nash equilibrium is necessarily asymmetric: either (w+1> w) or (w> w+1) will be
played in the endogenous timing game. Intuitively, this is because the intensity of competition in
same-period projects (as captured by the substitutability parameter e in donors’ utility function)
is higher than that of the inter-temporal competition (i.e. the competition between projects run in
different periods). This inter-temporal competition is driven by donors’ patience (�) and by their
"aid fatigue" (�). In other words, if a donor is relatilvely likely to give in period w+ 1 even after
having given in period w (which is captured by � being relatively small) or the donor is relatively
impatient (� is relatively low), the NGOs understand that should they conduct their projects in
two different periods, the donor would not consider giving to their project as close substitutes.
Contrarily, operating in the same period intensifies the fundraising competition, which in turn
harms the output levels of NGO projects. This comparison thus induces them to opt for competing
in the different-period projects, and thus not to cluster temporally.
[Figure 7 about here]
If e ? ��, then two possibilities emerge. If the output of NGOs deteriorates strongly enough
across periods (in the absence of any projects in period w ), i.e. if � is sufficiently small, then the
unique Nash equilibrium in the choice-of-timing game is (w> w). This is because the intensity of
same-period competition is smaller than that of inter-temporal competition, and the deterioration
effect is so strong that playing w is still the best-response to the rival NGO’s choice w + 1. In
other words, competing in different-period projects is still better than playing in the (much worse)
19

period w+1. Then, playing w is the dominant strategy, which delivers the unique Nash equilibrium
(w> w).
Instead, if the deterioration is not too strong (� is relatively close to 1), we obtain two Nash
equilibria in pure strategies: (w> w) and (w+ 1> w+ 1).
4.2 NGOs playing à la Stackelberg
When the NGOs take into account the strategic effect coming from their sequential fundraising,
we can easily compute the Stackelberg fundraising effort for the NGO playing as leader: (v stands
for "Stackelberg")
|vw =1
2
4− $ (2− ��)− �2�2 (2− $)
2− �2�2,
and that for the follower
|vw+1 =1
4
8− $ (4− 2e)− �2�2 (4 + ��$ − 3$)2− �2�2
,
with associated project outputs, respectively given by
Tvw>w+1
¡|vw > |
vw+1
¢=
1
8
O (1− f)$2 (1− ��) (2 + ��)2
(1 + ��)¡2− �2�2
¢ >
Tvw+1>w
¡|vw > |
vw+1
¢=
1
16
O (1− f)$2 (1− ��)¡�2�2 − 2�� − 4
¢2
(1 + ��)¡2− �2�2
¢2 .
Now the equilibria of this game are characterized as follows:
Proposition 4 (i) For e ∈ [0> 1), the endogenous equilibrium timing of projects decided by NGOswill be sequential (with either (w> w+ 1) or (w+ 1> w)) for e ≥ �� A 0 and simultaneous for �� A
e A 0. (ii) For e ∈ (−1> 0), the endogenous equilibrium timing of projects decided by NGOs will besimultaneous (with either urgency bias (w> w) or delayed interventions (w+ 1> w+ 1)) for �� ? e ? 0
and sequential for 0 A e A ��.
What is the intuition for the above results? Consider first the case when projects are viewed
by donors as substitutes (e A 0). Since by definition the Stackelberg leader gains at least as
much as playing simultaneously, it must be true that Tvw>w+1 ≥ Tw+1>w+1 = �Tw>w. Moreover, using
the standard properties of the Stackelberg equilibrium, when fundraising activities are strategic
complements and best-replies positively sloped in the fundraising space (which holds for e A
0), the follower always obtains a higher payoff than the leader and, hence, higher than under
simultaneous play: Tvw+1>w A Tw>w. Therefore, when e = ��, the NGOs would always prefer to
20
sequence their equilibrium choices of projects, ending in one of these two equibria: (w> w+ 1) or
(w+ 1> w). Therefore, a simultaneous equilbrium can only arise when e ? ��. In Figure 8 this is
represented by a shift downward of the (SS) line, dividing simultaneous from sequential NGOs
project choice. Intuitively, when fundraising generates negative externalities (which is the case
when e A 0), NGOs find it profitable to postpone fundraising and a sequential selection of projects
arises even when the inter-temporal effect is relatively more intense than the market competition
effect, occurring under project clustering.
Alternatively, when NGOs projects are complements (e ? 0) and fundraising efforts are strate-
gic substitutes, due to the strategic property of the Stackelberg equilibrium, playing simultaneously
is in general more convenient than playing as a follower and, therefore, Tvw>w+1 ≥ Tw>w A Tv
w+1>w for
e = ��. In this case, an urgency bias (w> w) may occur even for e A ��, i. e. when the harming
market competition of project clustering is stronger than the inter-temporal effect. In Figure 9,
this strategic effect of the fundraising Stackelberg game is expressed by the (SS) line, now lying
above the 45 degree line.
[Figures 8 and 9 about here]
Note that compared to the case of naive NGOs, "sophisticated" NGOs understand that playing
sequentially induces a Stackelberg timing game. This opens up some additional strategic inter-
actions not only in competition intensity of fundraising efforts, but also in terms of the strategic
use of commitment to timing by the first NGO. This dimension therefore implies that, on top
of the comparison between the intensity of competition in same-period projects (as captured by
e) and the intensity of inter-temporal competition (as captured by ��), the equilibrium out-
come of that game depends as well on the strategic nature of fundraising competition (strategic
complementarity or substituability as captured by e ≶ 0).To sum up, this modified model shows that when NGOs decide on carrying out their projects
at an earlier or a later stage, the key determinant of the decentralized equilibrium lies in donors’
preferences. Specifically, the crucial point is how donors view giving to different NGOs’ projects
(i.e. how substitutable they are) within the same period as compared to giving today or tomorrow
(i.e. how substitutable is giving inter-temporally). The comparison of these two parameters
determines the relative intensity of competition between NGOs for donations (competing in the
same period versus competing inter-temporally), which in turn drives the temporal allocation of
the projects.
5 Coordination
So far, we have assumed away the possibility that NGOs might want to overcome the inefficiencies
by designing voluntary coordination agreements. This might be somewhat too pessimistic, as there
21
exist several real-life examples of successful coordination among NGOs. For instance, on multiple
occasions, understanding the downsides of excessive fundraising competition, NGOs united their
forces into umbrella organizations that conduct joint fundraising appeals. The most well-known
example is, perhaps, the American United Way (see Brilliant 1990 for a detailed history), but such
examples exist also in other countries, for instance, the Disaster Relief Agency created by Dutch
NGOs in 1993, Disasters Emergency Committee (DEC) in Britain, and Belgian National Center
for Development Cooperation (see Similon, 2015).
How does the analysis of our model change if one explicitly allows for NGO coordination? To
answer this question, in this section we study the outcomes arising when the NGOs can coordinate
their activities on fundraising efforts (at stage 2), project types (at stage 1), or both.
When NGOs coordinate, they need to have a their common objective function. We simply
assume that they wish to maximize the sum of the outputs of their projects.10
5.1 Horizontal coordination (in fundraising) between NGOs
Suppose now NGOs are able to construct coordination agreements, so as to jointly choose their lev-
els of fundraising effort, but their choice of project types remains decentralized (non-coordinated).
Essentially, this assumption applies well to settings where NGOs create umbrella fundraising or-
ganizations, but do not consider coordinating on project types feasible or desirable. What kind
of project configuration will emerge in equilibrium? And how does it differ from the fully non-
coordinated case?
The problem of the two NGOs becomes now
max|1>|2
T1 +T2=
The total output can then be written as
T = T1 +T2 = (1− f) [(�+ �|1 + �|2)(1− |1) + (�+ �|2 + �|1)(1− |2)]
and the first-order condition with respect to every l -th NGO fundraising effort |l for l = 1> 2 and
m 6= l isCT
C|l=1− e
1− e2(1− |l)−
µ$ − 11 + e
+|1 − e|m1− e2
¶= 0=
The difference with respect to the first-order condition for the non-coordinated case is that now the
marginal benefit of fundraising by a NGO is reduced (or increased) by e (the factor 1−e instead of10Alternatively we could have considered a more complicated index function of these projects outputs taking
eventually into account some degree of complementarity between these output levels. While this would significantlycomplicate the analytics, the basic feature that coordination allow NGOs to internalize part of the competitivebusiness stealing effect of fundraising will still be present in the analysis.
22

1), as the coordinated choice internalizes the business-stealing effect (or business-boosting effect)
it imposes on the funds (and thus on output) of the second NGO.
Given the symmetry, we easily obtain the following solution in fundraising levels:
|Fl = |Fm = 1−$n
2= (30)
Note that the level of fundraising it is smaller than in the non-coordinated case (14) for e A 0
(and bigger for e ? 0) except in the limit case of e = 0, when the two coincide. Intuitively, the
coordination agreement chooses the level of fundraising so as to fully internalize the business-
stealing (or business-boosting) effect.
Using (30), it is easy to obtain the values of total output for various configurations of project
types:
TDD = (1− f)$2D
2(1 + e)> TEE = (1− f)
$2E2(1 + e)
> TDE = (1− f)
µ$2D4+
$2E4
¶.
At the stage of project types, we assume that NGOs do not coordinate, and continue to choose
their projects in a decentralized fashion. Again, suppose NGO 2 chooses project type D . The
choice of NGO 1 is then driven by the comparison
$2D4(1 + e)
≷ $2E4,
which, analogously to the non-coordinated case, gives the (DDF) line
$E =1
√1 + e
$D.
Similarly, we obtain the (EEF) line
$D =1
√1 + e
$E.
Note that the slope of the (DDF) line is smaller than 1 but is larger than that of the (DD) line.
Figure 10 compares the equilibrium configurations emerging with and without horizontal co-
ordination for e A 0. The region LL get smaller. This means that, if NGOs are able to credibly
coordinate in terms of their fundraising efforts, we are more likely to observe clustering. Intu-
itively, as fundraising coordination weakens the business-stealing effect, the cost of entering the
same market is now smaller, and the main concern becomes that about the market size. Similarly,
for e ? 0, we obtain that the slope of the (DDF) line becomes steeper than that of the (DD) line,
therefore increasing the possibility of inefficient clustering (see Figure 11).
23
5.2 Full coordination in fundraising and project choice
Now, let’s allow the NGOs to coordinate both in terms of their fundraising and in the choice of
project types. In that case, they will jointly choose the configuration DD iff TDD A TEE and
TDD A TDE. The first condition is satisfied below the 45◦line, whereas the second is satisfied iff
$2D2(1 + e)
A$2D4+
$2E4
or if $E ? $D
r1− e
1 + e=
This gives us the equation for the lines (DDIF) and (EEIF)
$E = $D
r1− e
1 + eand $D = $E
r1− e
1 + e=
Notice that the (DDIF) line is always flatter than the (DD) line for e A 0 and steeper for e ? 0r1− e
1 + e?
1√1− e2
2(1− e)
2− eas 1 ?
2
2− e.
This means that if NGOs are able to coordinate at both stages, the area of clustering shrinks when
NGOs outputs are perceived as substitutes by donors (e A 0) and, similarly, the area of "bad"
clustering gets smaller when projects are perceived as complements (e ? 0).
We illustrate these results for e A 0 in Figure 10. Consider point ]. Without any coordination
or with coordination only in fundraising, at point ] we would observe the clustering configuration
DD. Contrarily, if NGOs are able to coordinate also the choice of projects, they would jointly
choose the configuration DE, and the NGO with project type D would compensate the NGO doing
project of type E for not switching to type- D project.
[Figures 10 and 11 about here]
Similarly, in Figure 11 for e ? 0, while a coordination in only fundraising can enlarge the area
of potential coordination failure (region II), a full coordination in both fundraising and choice of
projects would reduce it, with an obvious gain of efficiency. This point is briefly expressed in the
next proposition.
Proposition 5 While coordination between NGOs in fundraising only increases the possibilityof inefficient clustering equilibria (e A 0) and miscordination on project choice (e ? 0), full
cooperation in both fundraising and project choice by NGOs exerts the opposite effect on their
behaviour, reducing the chance of inefficient clustering (for e A 0) and miscordination on project
choice (e ? 0).
24

Thus, we see that under partial coordination the results are radically different from those un-
der full coordination. In other words, partial coordination (in fundraising, but not in project
types) increases the scope of clustering (or bad clustering) while full coordination reduces it. Intu-
itively, under partial coordination competition in second stage gets weaker, and thus the Prisoner’s
Dilemma (coordination game, respectively) problem of NGOs in the first stage gets worse, and
thus the parameter space in which clustering (bad clustering respectively) arises becomes larger.
Instead, full coordination completely eliminates the Prisoner’s Dilemma problem, allowing for
binding side transfers between NGOs: even in the case of relatively strong asymmetry in the sizes
of two donation markets, NGOs under full coordination can write an agreement to transfer value
between them, and they only have to worry about maximizing the total output.
6 Fundraising spillovers
Our basic model assumes that fundraising activities by one NGO have only an indirect and negative
impact on the funds collected by the other NGO, via the "business-stealing" effect. The existing
empirical and experimental evidence shows, however, that fundraising activities often generate
positive externalities. For instance, Van Diepen et al. (2009) find, using data on direct-mail
fundraising by large Dutch charities, that an individual charity’s donation solicitation by mail
increases the total size of the donation market. Intuitively, being contacted by one charity working
towards, for example, environmental issues, raises the awareness of the donor about those issues.
She now cares more about environment, and thus her marginal warm-glow utility from giving to
the other organization working on a similar project increases (compared to a scenario in which she
was not contacted by the first organization). Thus, the fundraising activities of one organization
have created positive spillovers for the donations collected by other organizations.11
In this section, we develop an extension of our model that analyzes how our main results change
when NGOs impose spillovers on each other through fundraising activities. For this, we assume
that the willingness to give to NGO l of an individual donor now depends on fundraising by l and
m in the following way:
$l = $ + |l +∆|m, (31)
where∆ ∈ [0> 1] represents the spillover effect that a NGO fundraising effort exerts on the visibilityof its rival. The donation function now becomes
gl = �+ �|l + �|m, (32)
11Using the U.S. data from PSID, Reinstein (2011) finds that such positive spillovers are present for small donors,whereas for larger ones, the negative "business-stealing" effect seems to dominate.
25

where
� =$ − 11 + e
> � =1− e∆
1− e2> � =
∆− e
1− e2= (33)
The size of parameter∆might depend on the nature of the cause towards which NGOs operate.
For instance, if the issue is relatively new and unknown to donors (e.g. in case of a humanitarian
emergency), a sollicitation to give by and NGO typically involves prodiving extensive information
about the cause or the problem to the donor. In such case, it is likely that the awareness-raising
spillovers between NGO fundraising activities are large. Moreover, ∆ depends on the dominant
technology of soliciting donations. If the fundraising technology allows for precise targeting of
potential donors on the basis of certain characteristics or behavior (as in case of online solicitations,
when targeting is made through professional marketing firms on the basis of consumption patterns
of potential donors), the spillovers are relatively small. Contrarily, if the technology does not allow
for targeting, as for instance in case of direct mailing, the spillovers are likely to be high. From
(33) it is easy to see that, for different values of e and ∆, the sign of � can be either positive or
negative and, therefore, fundrasing exerts positive (negative) externalities for ∆ A e (∆ ? e).
Concerning the project-type choice, similar to the basic model, we can assume that if both
NGOs select the same type, i.e. n1n2 = DD or n1n2 = EE, donors perceive giving to the two
projects as substitutes (or complements). Contrarily, if each NGO selects a project of a different
type (i.e. n1n2 = DE or n1n2 = ED), the donors perceive them as distinct and the two NGOs
operate as if they were in a monopolistic donation market, with � = 0. This is equal to assume that
the awareness spillovers in fundraising efforts are shaped by the project decision of the NGOs in
this way: if n1n2 = DD or n1n2 = EE, ∆DD = ∆EE = ∆, while in the case of two distinct projects
∆DE = ∆ED = 0, meaning that there are no interactions between the fundraising activities carried
out for the two projects. Finally, as before, we let each project nl = D>E be characterized by its
own specific baseline "willingness-to-give" $n.12
Consequently, when deciding on nl = D>E, each NGO compares the payoff it obtains when
the two projects "cluster", as in (15), that is, for n1n2 = DD or n1n2 = EE,
Tl (|∗l ) =
(1− f)� (�nl + � + �)2
(2� + �)2> (34)
to the one obtained under the monopoly markets, for n1n2 = DE or n1n2 = ED,
Tl (|∗l ) =
(1− f) (�nl + 1)2
4= (35)
Given (34) and (35) we can now easily characterize the equilibrium choices of the two NGOs
when � A 0.
12Again here 1 ≤ $n ≤ 2 is constrained to ensure the existence of interior equilibria for donors and NGOs.
26

Proposition 6 (i) DD is a Nash equilibrium in the choice of projects if and only if√� (�D + � + �)
2� + �A
�E + 1
2= (36)
(ii) EE is a Nash equilibrium if and only if√� (�E + � + �)
2� + �A
�D + 1
2= (37)
(iii) DE and ED are Nash equilibria in the choice of projects only if√� (�D + � + �)
2� + �≤
�E + 1
2and
√� (�E + � + �)
2� + �≤
�D + 1
2.
Proof. By straighforward manipulations of expressions (34)-(35).The intuition is simple and similar to the one in the basic model, with some caveats. When
deciding about the type of its project, each NGO compares the output it would obtain by being in
a duopoly market for donations (which, however, would expand because of the positive awareness
spillovers) to that obtained in a monopoly, but without the spillovers. When these spillovers
are sufficiently strong (as compared to the benefit of being a monopolist), the condition (36) is
satisfied. Then the former payoff dominates the latter, and both prefer to choose the type D (given
that the other NGO chooses D ), which results in the configuration DD being a Nash equilibrium.
The same logic applies when the condition (37) is satisfied, and thus the configurationEE becomes
a Nash equilibrium. Instead, when the spillovers are relatively small (as compared to the benefit
of being a monopolist) the signs are reversed in both conditions, each NGO tries to become a
monopolist; thus, the NGOs end up playing an anti-coordination game, with the resulting Nash
equilibria DE and ED.
Figure 12 describes the range of Nash equilibria in the plane ($D> $E). Line ( DD ) is given by
the equation
$E =
r1− e∆
1− e22∆(1− e)
2(1− e∆) +∆− e| {z }J(e>∆)
+
r1− e∆
1− e22(1− e)
2(1− e∆) +∆− e| {z }K(e>∆)
$D,
such that below this line the configurationDD arises as a Nash equilibrium in the choice of projects.
Similarly, the line (EE) is described by
$D = J(e>∆) +K(e>∆)$E,
such that above this line the configuration EE arises as a Nash equilibrium. It is easy to verify
that both the intercepts and the slopes of the two lines are positive, and that the slopes are smaller
than 1 . The two lines intersect at the point (H>H), where
H =2∆(1− e)
√1− e∆
√1− e∆ [2(1− e∆) +∆− e]− 2(1− e)
√1− e∆
.
27

Consequently, these two lines divide the ($D> $E) plane into four regions, as follows:
• Region L : {($D> $E) |$D A J+K$E and $E A J+K$D} , where the configurations DDand EE prevail as the pure-strategy Nash equilibria;
• Region LL : {($D> $E) |$D A J+K$E and $E ? J+K$D} , whereDD is the unique pure-strategy Nash equilibrium;
• Region LLL : {($D> $E) |$D ? J+K$E and $E A J+K$D} , where EE is the unique
pure-strategy Nash equilibrium;
• Region LY : {($D> $E) |$D ≤ J+K$E and $E ≤ J+K$D} , where DE and ED prevail
as the pure-strategy Nash equilibria.
[Figure 12 about here]
In terms of comparative statics, it is easy to verify that the intercept (J) and the slope (K)
of the two lines are increasing in ∆ and decreasing in e . Consequently, as shown in Figure 13,
the DD line shifts up and rotates counter-clockwise, whereas the EE line shifts to the right and
rotates clockwise. This leads to the expansion of regions L, LL, and LLL, and the shrinking of the
region LY .
[Figure 13 about here]
Thus, when the awareness spillovers (under the choice of the same type of projects) become
larger, the equilibrium clustering of the NGO projects becomes more prevalent. The same effect
obtains when the donors perceive the projects of the same type as more substitutable.
Finally, when ∆ ? e (and � ? 0), the slope of the line (AA) defined by K(e>∆) becomes
greater than one (and which of (BB) smaller than one) and, therefore, something analogous to the
analysis of Section 2 (for e ? 0) occurs. Since the slope of the two lines switch, as shown in Figure
14, NGOs’ miscoordination on project choices may now arise in two different regions, denoted I
and IV, and characterized, in turn by very low and very high baseline levels of willingness to give
to the two projects.
[Figure 14 about here]
28

7 Case studies
Our model delivers interesting testable predictions, for instance, concerning the effects of a change
in donors’ underlying willingness to give on NGOs’ choice of project types, or the effect of donors’
stronger "aid fatigue" on the inter-temporal clustering of NGO projects. Specifically, our model
predicts that in a setting where donors consider giving to NGO projects of the same type as
(imperfect) substitutes and NGOs initially conduct projects of different types, a large exogenous
change in the relative willingness to give would induce both NGOs to choose to run projects of the
same type (i.e. to cluster). It also predicts that in a setting where NGOs usually specialize inter-
temporally (one NGO acts early, whereas the other carries out its project later on), an increase in
donors’ "aid fatigue" (i.e. a faster decline in willingness-to-give in the second period after having
given in the first) would push NGOs to cluster temporally.
Conducting a rigorous empirical test of thes predictions is currently beyond reach, because of
data limitations. Such an exercise would require collecting data on NGOs’ project type decisions,
ideally in settings where there is a discontinuous exogenous change in donors’ willingness to give
to one of the project types of in donors’ "aid fatigue". Moreover, one would need to observe NGO
choices before and after the change. To the best of our knowledge, no data source containing such
measures exists for the moment. Therefore, we limit ourselves to presenting four case studies that
illustrate the main mechanisms of the model at work.
7.1 Biafra famine of 1968
The Biafra famine broke out in 1968 in the aftermath of the civil war between the Federal Military
Government of Nigeria and the secessionist Eastern region’s militants, mostly because of the
blocade by the former. The international community initially showed little interest in the famine,
and the international media covered it only marginally. As Alex de Waal (1997) writes:
”The famine first became news, almost wholly by accident, in June 1968, when
the war was already decided in military terms... The press had [initially] shown little
interest in the ‘famine story’. In fact the first journalist to take famine pictures never
got them published because his paper considered them of no news value...” (De Waal
1997: 73-74)
Only after some journalists took pictures of malnourished children in Biafran hospitals and
diffused them in the U.K., the attention of the international public turned to the crises; but this
interest became massive:
”For relief agencies, the impact of the first African famine to become world news was
electric... Immediately the press coverage began, Oxfam swung into action, breaking
29

ranks with the other members of the Disasters Emergency Committee (a club of leading
British relief NGOs formed to co-ordinate television fund-raising for disasters) and the
ICRC [International Committee of the Red Cross], with whom it had previously made
an agreement not to act unilaterally. It became operational in the field for only the
second time in its history” (De Waal 1997: 74-75)
The above desciption of the behavioral change of Oxfam, one of the largest international NGOs,
is illustrative of one key prediction of our model. Consider D-type projects as being conducted in
Biafra, while E-type projects conducted somewhere else. Initially, because of the lack of attention
to the Biafra crisis, $D was much lower than $E, and thus the equilibrium played by NGOs was
EE; in other words, Biafran crisis was a relatively neglected issue for NGO projects. The sudden
increase in the donors’ interest in the Biafran crisis implied a large discontinuous increase in the
latent willingness to give to the projects aimed at the emergency relief in Biafra (a sharp large
rise in $D). In response, and as predicted by our model, Oxfam (and numerous other NGOs)
changed its project type, breaking the market-sharing implicit agreement with other international
charities, and - more importantly - choosing to engage in type of project it would normally avoid
engaging in. The equilibrium play of NGOs became DD:
"The siege of Biafra of 1968-69, the Sahelian drought of 1974-5, and the Ethiopian
famine of 1984-6 proved financial watersheds for a number of private agencies [i.e.
NGOs] whose prior involvement in those parts of the world had been minimal or non-
existent" (Sogge and Zadek 1996: 80).
Several observers, including Smillie (1995), argue that this kind of rush by international NGOs
led to a highly inefficient outcome, in particular, because the sheer mass of aid and humanitarian
relief allowed the local political powerholders to exploit it for their means, which prolonged the
conflict: ”The airlift and the broader relief efforts was... an act of unfortunate and profound folly.
It prolonged the war by 18 months” (Smillie 1995: 104).
7.2 Ethiopian famine of 1984
Another key example of the behavioral change of NGOs in the context where our model seems to
apply comes from the 1984 Ethiopian case. Similarly to Biafra, it was a complex political situation
in which the combination of the drought and political problems created a famine. However, the
political manipulation of the situation by the Ethiopian dictator induced the official donors to
be wary of sending aid and, consequently, the private donors’ willingness to give was also muted.
However, as images of starving children reached the press, this changed dramatically:
30

"Until early 1984, international donors were justifiably sceptical about the Ethiopian Govern-
ment’s appeals for relief. There was evidence of both diversion of food aid and the strategic abuse
of relief to support counter-insurgency efforts in the south-east... In October 1984 the famine
suddenly became international news... " (De Waal 1997: 121)
What led to this rapid change and the consequent massive inflows of aid? De Waal points out
that it was a combination of the mediatization of the famine (during the Fall 1984) and the fact
that such attention reached its maximum close to Christmas:
"It is interesting to chart the way in which the famine progressed from its niche as a
news item and a campaign by relief agencies into an unprecedented international media
event with political repercussions in leading Western democracies. BandAid played a
key role in this: while not the first, it was the definitive media-charitable event. The
timing was crucial: Christmas is the fund-raising season for relief agencies and a time
of particular sensitivity in the public conscience" (De Waal 1997: 122).
Hancock (1989) also describes how this shock suddenly increased the attention of the donors
to give to humanitarian causes, and, importantly, how this induced one of the largest NGOs, the
World Vision, to enter into sharp competition for funds with the religious organizations during
the Christmas time:
”On 21 December 1984, unable to resist the allure of Ethiopian famine pictures,
World Vision ran an Australia-wide Christmas Special television show calling on the
public in that country to give it funds. In so doing it broke an explicit understand-
ing with the Australian Council of Churches that it would not run such television
spectaculars in competition with the ACC’s traditional Christmas Bowl appeal. Such
ruthless treatment of ’rivals’ pays, however: the American charity is, today, the largest
voluntary agency in Australia ...” (Hancock 1989: 17)
In terms of our model, this episode can be explained as follows. Donors consider giving to
charities during the Christmas time as a special act, different from giving in other periods. Let D
denote the Christmas-period donation market and E stand for the other-period donation market.
Before the famine broke out, the ACC and the World Vision ran their fundraising campaigns
in separate periods of the year, which can be interpreted as playing the configuration DE. The
famine shock, reaching its maximum media attention right before Christmas, strongly increased
the donors’ willingness to give to this cause during the Christmas period. This suddenly made
$D much larger than $E. Our model predicts that in this case, both NGOs should be running
their campaigns during Christmas, which implies that the World Vision should break its "non-
belligerence" coordination with the ACC. Moreover, by doing so, it should collect (much) more
donations than under coordination, which is in line with the last sentence of the quotation above.
31

7.3 Sierra Leone at the end of the 1991-2002 civil war
Our third case concerns the clustering of international NGOs in Sierra Leone, towards the end
of the 1991-2002 civil war. The numerous brutalities of the civil war led to a large number of
amputees, many of which lived in camps built and organized by international agencies. In her
book The Crisis Caravan, Linda Polman describes in detail one of such camps: Murray Town
Camp, that hosted "226 amputees, some with a couple of close relatives, 560 people in total...
In front of the gate was a small forest of notice boards... bearing the logos of aid organizations:
Médecins sans Frontières, CAUSE Canada, World Hope International, UNICEF, [and more]..."
(Polman 2010: 63).
Initially a “forgotten” crisis, Sierra Leone got the international media attention because of the
amputees’ camps. However, then this attention led to some unexpected dynamics. "Partly as a
result of media attention, Sierra Leone became the beneficiary of the largest UN pease mission and -
in terms of dollars per head of population - the largest humanitarian aid operation anywhere in the
world at the time. Around three hundred INGOs rushed to the little country. Even organizations
that were not there specifically to help amputees used photos of people in Murray Town Camp in
their fund-raising campaigns. ’It’s never been so easy to collect money as it is with the pictures
of these poor devils,’ said an INGO staff member in Freetown" (Polman 2010: 66)
The detailed description by Polman clearly indicates that while other types of projects were
highly needed in Sierra Leone, the massive willingness-to-give by donors (moved by media images,
especially those of children) to amputee projects implied that an inefficiently high number of
NGO activities and projects concentrated on this type, whereas other kinds of activities were
underfunded. This huge media attention and private aid inflows earmarked to this type of projects
created deeply perverse incentives:
"One [international] NGO had already offered to build a whole new neighborhood for them
at the edge of the city... [But] the amputees refused to leave... because in Murray Town Camp
it was easy for foreign journalists, donors, and aid organizations to find them. Nor that such
visitors could steer clear of the camp even if they wanted to. The amputees were the icons of
Sierra Leone’s civil war. Of all the war victims in West Africa, foreign aid workers tried hardest
to be associated with them" (Polman 2010: 64)
7.4 The 2004 Indian Ocean tsunami
On December 26, 2004, a tsunami of unprecedented power, triggered by the Sumatra-Andaman
undersea earthquake, hit the coastal areas of 14 countries in Asia and Africa (with Indonesia and
Sri Lanka receiving the strongest impact). It was one of the deadliest natural disasters in recent
history, killing close to 230 000 people and displacing over 1.75 million people. The scale of the
32
disaster, coinciding with it happening right after Christmas and fed by a large-scale international
media coverage, led to a massive humanitarian response, both through public and private channels.
The amount of private donations to international NGOs was huge: for example, Save the Children
USA received over 6 million USD in just four days, whereas Catholic Relief Services collected
over 1 million USD in three days. In total, U.S.-based charities raised about 1.6 billion USD for
tsunami relief (Wallace and Wilhelm 2005), whereas total international response (both public and
private) amounted to 17 billion USD (Jayasuriya and McCawley 2010).
This massive drive to give at the early stages of the disaster led an excessive focus on emergency
projects, where too many NGOs engaged in projects early on but rather few wanted to carry out the
post-crisis reconstruction and development projects. The report by the Joint Evaluation Report
of the Tsunami Evaluation Coalition states:
" Exceptional international funding provided the opportunity for an exceptional inter-
national response. However, the pressure to spend money quickly and visibly worked
against making the best use of local and national capacities... Many efforts and capac-
ities of locals and nationals were marginalized by an overwhelming flood of well-funded
international agencies (as well as hundreds of private individuals and organisations),
which controlled immense resources" (Telford et al. 2006: 18-19).
Why the dynamics of NGO aid led to such an inefficiency? The then head of the French Red
Cross, Jean-François Mattei notes that: "The particularity [of the tsunami donor appeals] resided
in this unique combination of democratization of information technologies, the ability of witnesses
to become vectors of immediately available images, the underlying violence of the phenomenon,
and its tragic evolution" (Mattei 2005: 41). He then suggests that the inefficiency had to do with
the fact that NGOs found it difficult to expain the donor public the complexity of the situation and
the need to finance also the long-run projects, going beyond the emergency needs: "Few observers
were aware of the complexity of this kind of engagement, that escapes the immediate perceptions
of the expectations of the public. This implies a feeling of disconnection between the image that
one has of the humanitarian [sector] and the reality found on the ground" (Mattei 2005: 12).
In the context of our model of section 4, the above citations suggest that NGOs considered
the media-driven generosity of donors massive in the short-run, but likely to dry up over time.
In other words, we are likely to be in the case with e ? �� (i.e. the within-period competition
being less of a concern for NGOs, as compared to the donors’ aid fatigue) and, moreover, given
the emergency, � was rather small (i.e. the situation deteriorated rather quickly). In such case,
our model predicts that the equilibrium would be in the form of urgency bias (w> w).
Interestingly, the tsunami case illustrates both the inter-temporal and spatial clustering prob-
lem, as the concentration of emergency projects in tsunami-hit areas went along with the relative
33

lack of attention to other areas of the world that were facing large need: ”There are also neigh-
boring countries that are touched by the same problem, sometimes even more that the country
on which the projectors are focused. One has to look also in the shadows cast by the projector
lights. The mobilization of public opinion can create terrible paradoxes: because of the emotions
and emergency feelings, the concentrated flow of international aid can worsen the sentiment of
neglect in the non-beneficiary areas. Thus, Darfour was erased by the tsunami, and then Niger by
the Katrina hurricane...” (Werly 2005: 136).
8 Conclusion
Reflecting over the deep problems of the internatonal NGO sector, Alex De Waal writes:
"Specific NGO successes mask strategic failures. NGOs tend to focus their efforts on
areas in which they have specialist skills, on which can make for good publicity, such
as feeding centres and orphanages. Crucial areas such as sanitation and public health
are relatively neglected. The charitable market is unable to fill the full spectrum of
relief needs" (De Waal 1997: 80).
This paper provided an economic analysis of this and related problems and to do so, it has
developed a model with non-governmental organizations competing through fundraising for dona-
tions and choosing their project types, where donors’ willingness to give might differ across project
types. We find that the resulting equilibrium configuration crucially depends on the asymmetry
in potential donation market size and on donors’ perceived substitutability or complementarity
between giving to two different projects. We have analyzed the welfare properties of the de-
centralized equilibrum and derived the conditions under which such equilibrium is sub-optimal,
characterized by excessive clustering (i.e. NGOs choosing the same project type). Two main
sources of inefficiency are (i) excessive fundraising competition as NGOs cluster when it is socially
optimal to choose opposite project types (un-cluster), and (ii) mis-coordination on the "smaller"
donation market. We also studied settings where NGOs can coordinate their fundraising and/or
project type choices, developed an application to inter-temporal choices of NGOs, and extended
the model to allow for spillovers between NGO fundraising activities.
Our analysis provides interesting implications for the decentralized competitive organization
of the foreign aid industry. It highlights the importance of donors’ perceptions about the causes
as a major source of difficulty of optimal coordination and efficient division of tasks between
development NGOs. This is particularly salient for NGOs operating during humanitarian crises,
where a strong asymmetry in donors’ awareness across different types of projects and the resulting
34
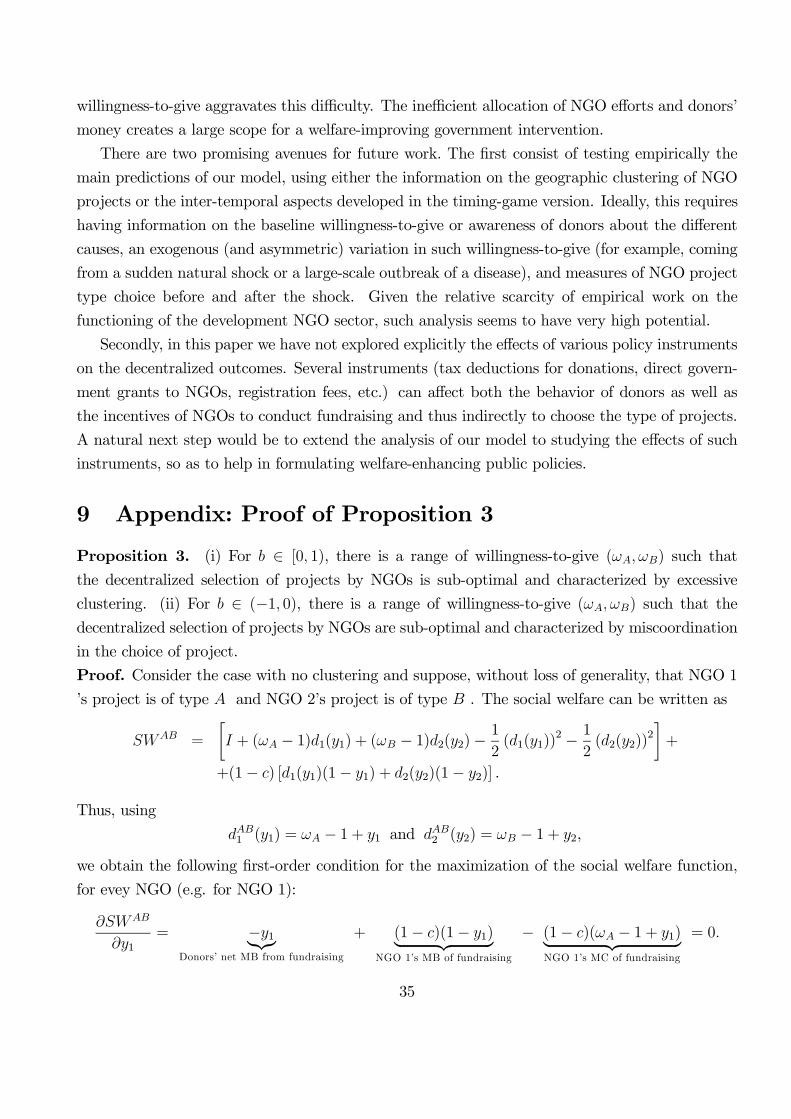
willingness-to-give aggravates this difficulty. The inefficient allocation of NGO efforts and donors’
money creates a large scope for a welfare-improving government intervention.
There are two promising avenues for future work. The first consist of testing empirically the
main predictions of our model, using either the information on the geographic clustering of NGO
projects or the inter-temporal aspects developed in the timing-game version. Ideally, this requires
having information on the baseline willingness-to-give or awareness of donors about the different
causes, an exogenous (and asymmetric) variation in such willingness-to-give (for example, coming
from a sudden natural shock or a large-scale outbreak of a disease), and measures of NGO project
type choice before and after the shock. Given the relative scarcity of empirical work on the
functioning of the development NGO sector, such analysis seems to have very high potential.
Secondly, in this paper we have not explored explicitly the effects of various policy instruments
on the decentralized outcomes. Several instruments (tax deductions for donations, direct govern-
ment grants to NGOs, registration fees, etc.) can affect both the behavior of donors as well as
the incentives of NGOs to conduct fundraising and thus indirectly to choose the type of projects.
A natural next step would be to extend the analysis of our model to studying the effects of such
instruments, so as to help in formulating welfare-enhancing public policies.
9 Appendix: Proof of Proposition 3
Proposition 3. (i) For e ∈ [0> 1), there is a range of willingness-to-give ($D> $E) such that
the decentralized selection of projects by NGOs is sub-optimal and characterized by excessive
clustering. (ii) For e ∈ (−1> 0), there is a range of willingness-to-give ($D> $E) such that the
decentralized selection of projects by NGOs are sub-optimal and characterized by miscoordination
in the choice of project.
Proof. Consider the case with no clustering and suppose, without loss of generality, that NGO 1’s project is of type D and NGO 2’s project is of type E . The social welfare can be written as
VZDE =
∙L + ($D − 1)g1(|1) + ($E − 1)g2(|2)−
1
2(g1(|1))
2 −1
2(g2(|2))
2
¸+
+(1− f) [g1(|1)(1− |1) + g2(|2)(1− |2)] .
Thus, using
gDE1 (|1) = $D − 1 + |1 and gDE2 (|2) = $E − 1 + |2,
we obtain the following first-order condition for the maximization of the social welfare function,
for evey NGO (e.g. for NGO 1):
CVZDE
C|1= −|1|{z}
Donors’ net MB from fundraising
+ (1− f)(1− |1)| {z }NGO 1’s MB of fundraising
− (1− f)($D − 1 + |1)| {z }NGO 1’s MC of fundraising
= 0=
35
We can compare it to the corresponding first-order condition for NGO 1 at the decentralized
equilibrium:CT1
C|1= (1− f)(1− |1)| {z }
NGO 1’s MB of fundraising
− (1− f)($D − 1 + |1)| {z }NGO 1’s MC of fundraising
= 0=
It is easy to observe that in the non-clustering equilibrium configuration, there is too much
fundraising as compared to the social optimum. The resulting socially optimal level of fundraising
is
|DE◦
1 =(1− f)(2− $D)
1 + 2(1− f),
and, similarly, for project E operated by NGO 2
|DE◦
2 =(1− f)(2− $E)
1 + 2(1− f).
The corresponding optimal values of social welfare under non-clustering scenarios (DE) and (ED)
are
VZ◦
DE = L +1
2
(($2D + $2E) (2− f)2 − 2 ($D + $E) (2− f) + 2)
(3− 2f)= (38)
Conversely, when the two NGOs cluster either by choosing project D or project E ( n1 = n2 =
n = D or n1 = n2 = n = E ), social welfare maximization implies maximizing the following
expression
VZnn =
∙L + ($n − 1)g1(|) + ($n − 1)g2(|)−
1
2(g1(|))
2 −1
2(g2(|))
2 − eg1(|)g2(|)
¸+
+(1− f) [g1(|)(1− |1) + g2(|)(1− |2)] .
In this case the optimal values of fundraising are
|nn◦
1 = |nn◦
2 =(1− f)(2− $n)
1 + 2(1− f).
The maximum social welfare under clustering is, therefore
VZ◦
nn = L +($2n (4− 4f+ f2)− $n (4− 2f) + 1)
(3− 2f) (e+ 1)= (39)
We can now compare the maxima in the three cases. Note first that
CVZ◦
nn
C$nA 0
and, therefore, the optimal welfare increases monotonically with the size of the donors’ market $n
. As a result,
VZ◦
DD R VZ◦
EE ⇔ $D R $E.
36
Also, for e = 0 and n = D>E :
VZ◦
nn R VZ◦
DE ⇔ $D R $E.
Therefore, when competition between NGOs is absent (e = 0), clustering is always socially efficient
and the optimal non-clustering area reduces to the 45◦ line, where $E = $D, (exactly as the line
$E = K(e) $D for e = 0). In addition, when projects are clustered, the welfare decreases with e:
CVZ◦
nn
Ce= −
(1 + f$n − 2$n)2
(3− 2f) (e+ 1)2? 0=
Moreover, using (38) and (39), and normalizing f = 0, it is straightforward to see that, in general,
at the optimal fundrasing choice,
VZ◦
DD A VZ◦
ED (40)
for
$E ? $DK◦(e) (41)
and, similarly,
VZ◦
EE A VZ◦
DE (42)
for
$D ? $EK◦(e)> (43)
where
K◦(e) =
1
2+
p($D − $2D) (16e
2 − 16)− 4e2 + 44 (e+ 1)
=
Comparing (24) and (26) with (19) and (20), shows that, in general,
K◦(e) ? K(e) for e ∈ (0> 1) (44)
and, conversely,
K◦(e) A K(e) for e ∈ (0>−1), (45)
implying the results of case (i) and (ii). The welfare comparisons for f A 0 are qualitatively similar
and are omitted to economize on space.
References
[1] Aldashev, G., M. Marini, and T. Verdier. 2014. Brothers in Alms? Coordination between
Nonprofits on Markets for Donations. Journal of Public Economics 117: 182-200.
[2] Aldashev, G., and C. Navarra. 2014. Development NGOs: Basic Facts. Working paper 1409,
CRED, University of Namur.
37

[3] Aldashev, G., and T. Verdier. 2009. When NGOs Go Global: Competition on International
Markets for Development Donations. Journal of International Economics 79: 198-210.
[4] Aldashev, G., and T. Verdier. 2010. Goodwill Bazaar: NGO Competition and Giving to
Development. Journal of Development Economics 91: 48-63.
[5] Aldashev, G., E. Jaimovich, and T. Verdier. 2017. Small is Beautiful: Motivational Allocation
in the Nonprofit Sector. Journal of the European Economic Association, forthcoming.
[6] Andreoni, J. 1989. Giving with Impure Altruism: Applications to Charity and Ricardian
Equivalence. Journal of Political Economy 97: 1447-1458.
[7] Auriol, E., and S. Brilon. 2014. Anti-social Behavior in Profit and Nonprofit Organizations.
Journal of Public Economics 117: 149-161.
[8] Barr, A., and Fafchamps, M. 2006. A Client-Community Assessment of the NGO Sector in
Uganda. Journal of Development Studies 42: 611-639.
[9] Besley, T., and M. Ghatak. 2001. Government versus Private Ownership of Public Goods.
Quarterly Journal of Economics 116: 1343-1372.
[10] Brilliant, E. 1990. The United Way: Dilemmas of Organized Charity. New York: Columbia
University Press.
[11] Burger, R., Dasgupta, I. and Owens, T. 2015. A Model of Nongovernmental Organization
Regulation with an Application to Uganda. Economic Development and Cultural Change 64:71-111.
[12] DeWaal, A. 1997. Famine Crimes: Politics and the Disaster Relief Industry in Africa. Bloom-
ington, IN: Indiana University Press.
[13] Dichter, T.W. 2003. Despite Good Intentions: Why Development Assistance to the Third
World Has Failed. Amherst, MA: University of Massachusetts Press.
[14] Dixit, A., V. Norman. 1978. Advertising and Welfare. Bell Journal of Economics 9: 1-17.
[15] Donkers, B., M. van Diepen, and P.H. Franses. 2017. Do charities get more when they ask
more often? Evidence from a unique field experiment. Journal of Behavioral and Experimental
Economics, forthcoming.
[16] Fong, C., and E. Luttmer. 2009. What Determines Giving to Hurricane Katrina Victims?
Experimental Evidence on Racial Group Loyalty. American Economic Journal: Applied Eco-
nomics 1: 64—87.
38

[17] Fruttero, A., and Gauri, V. 2005. The Strategic Choices of NGOs: Location Decisions in
Rural Bangladesh. Journal of Development Studies 41: 759-787.
[18] Gauri, V., and Galef, J. 2005. NGOs in Bangladesh: Activities, Resources, and Governance.
World Development33: 2045-2065.
[19] Hancock, G. 1989. Lords of Poverty. London, UK: Mandarin Press.
[20] Hansmann, H. 1980. The Role of Nonprofit Enterprise. Yale Law Journal 89: 835-901.
[21] Heyes, A. and Martin, S. 2015. NGO mission design. Journal of Economic Behavior & Orga-
nization 119: 197-210.
[22] ICVA (International Council of Voluntary Agencies). 2015. NGO Perspectives on Humanitar-
ian Response in Level 3 Crises. Available at: https://icvanetwork.org.
[23] Koch, D.-J. 2009. Aid from International NGOs: Blind Spots on The Aid Allocation Map.
London UK: Taylor & Francis.
[24] Koch, D.-J., A. Dreher, P. Nunnenkamp, and R. Thiele. 2009. Keeping a Low Profile: What
Determines the Allocation of Aid by Non-Governmental Organizations? World Development
37: 902—918.
[25] Krasteva, S. and Yildirim, H. 2016. Information, Competition, and the Quality of Charities.
Journal of Public Economics 144: 64-77.
[26] Mattei, J.-F. 2005. L’urgence humanitaire, et après? De l’urgence à l’action humanitaire
durable. Paris, Hachette.
[27] Nancy, G. and Yontcheva, B. 2006. Does NGO Aid Go to the Poor? Empirical Evidence from
Europe. IMF Working Paper No. 6-39.
[28] Öhler, H. 2013. Do Aid Donors Coordinate Within Recipient Countries? Discussion Paper
0539, Department of Economics, University of Heidelberg.
[29] Polman, L. 2010. The Crisis Caravan: What’s Wrong with Humanitarian Aid? New York,
NY: Picador.
[30] Reinstein, D.A., 2011. Does One Charitable Contribution Come At the Expense of Another?
BE Journal of Economic Analysis & Policy 11.
[31] Robinson, M. and Riddell, R.C. 1995. Non-Governmental Organizations and Rural Poverty
Alleviation. Oxford, UK: Oxford University Press.
39

[32] Scharf, K. 2014. Impure Prosocial Motivation in Charity Provision: Warm-Glow Charities
and Implications for Public Funding. Journal of Public Economics 114: 50-57.
[33] Similon, A. 2015. Self-Regulation Systems for NPO Coordination: Strengths and Weaknesses
of Label and Umbrella Mechanisms. Annals of Public and Cooperative Economics 86: 89-104.
[34] Singh, N., and X. Vives. 1984. Price and Quantity Competition in a Differentiated Duopoly.
RAND Journal of Economics 15: 546-554.
[35] Sogge, D., and S. Zadek. 1996. ’Laws’ of the Market? In: Sogge, D. (ed.), Compassion and
Calculation: The Business of Private Foreign Aid. London, Pluto Press.
[36] Smillie, I. 1995. The Alms Bazaar: Altruism Under Fire - Non-Profit Organizations and
International Development. London, UK: IT Publications.
[37] Van Diepen, M., B. Donkers, and P. Franses. 2009. Dynamic and Competitive Effects of Direct
Mailings: A Charitable Giving Application. Journal of Marketing Research 46: 120-133.
[38] Weisbrod, B. 1988. The Nonprofit Economy. Cambridge, MA: Harvard University Press.
[39] Werker, E. and Ahmed, F.Z., 2008. What Do Nongovernmental Organizations Do? Journal
of Economic Perspectives 22: 73-92.
[40] Werly, R. 2005. Tsunami, la vérité humanitaire. Paris: Sarment Les Edition du Jubilée.
40
Fig. 1: Worldwide distribution of NGO aid in 2005Source: Koch (2009) Figure 1 4Source: Koch (2009), Figure 1.4Notes: Hatched areas are non-recipient countries

Fig. 2: Distribution of NGO offices and poverty rates in 2006, acrossTanzanian regionsgSource: Koch (2009), Figure A9.1
(BB)ωB
Region II
Region III
BB
45°2
(AA)
R i I
BB
Region I1
AA
ωA1 2
Fig. 3: Nash equilibria in the choice of projects for b > 0

(AA)ωB
Region II
Region III
BB
45°2
(BB)
Region IIBB
Region I
1
Region I
AA
ωA1 2
Fig. 4: Nash equilibria in the choice of projects for b < 0

(BB)ωB
(BB°)
BB45°AB°
BA°2
(AA)
AB°BA°
AA (AA°)BA1
AA
ωA1 2
Fig. 5: Optimal vs. decentralized choice of projects: b > 0. Grey areas represent inefficient clustering

(AA)ωB
BBd
45°
BB°2
(BB)
andBB°
BB
AA°
AA and
1
AA°
ωA1 2
Fig. 6: Optimal vs. decentralized choice of projects: b < 0. Grey areas represent inefficient clustering

b(SS)
(t,t+1) or (t+1,t)
45°( )
(t,t) or (t+1,t+1)
(t,t)
P 1UG
Fig. 7: Sequential vs. simultaneous equilibriain the choice of projects with «naive» behaviour

b
45°
(SS)(t,t+1) or (t+1,t)
(t,t) or (t+1,t+1)
UG
Fig. 8: Sequential vs. simultaneous equilibria in the choice of projects with b > 0 and Stackelberg behaviour.

b (SS)(t,t+1) or (t+1,t)
45°
( ) ( )
(t,t) or (t+1,t+1)
G
Fig. 9: Sequential vs. simultaneous equilibria in the
UG
g q qchoice of projects with b < 0 and Stackelberg behaviour

(BB)ωB(BBC)
(BBFC)
45°
(AAC)Region II
underfundraising
2
(AA)Region II under no
coordination
coordination
(AAFC)Z
Region II under full
coordination1
ωA1 2
Fig. 10. Project choice with and without horizontal coordination: b > 0

(AA)ωB (AAFC)(AAC)
45°
(BBFC)Region II under full
coordination
2
(BB)Region II under no
coordination
(BBC)Z
Region II under
fundraisingcoordination
1
ωA1 2
Fig. 11: Project choice with and without horizontal coordination: b < 0
(BB)ωB
(AA)Region IVBB
2
Region IIIAB ; BABB
Region II
E
1
Region I
AAAA ; BB
1
Region I
ωAE1 2
Fig. 12: Nash equilibria in project choice in the presence of spillovers (J >0)
(BB) Region IVωB
2
(AA)Region IIIE’
2
Region II
E
1
Region I
1
Region I
ωAE E’ 21
Fig. 13: The effect of an increase in ∆ or a decrease in b

(AA)ωB
(BB)Region IVAA
2
Region IIIAA ; BBAA
Region II
E
1
Region I
BBAA ; BB
1
Region I
ωAE1 2
Fig. 14: Nash equilibria in project choice in the presence of spillovers (and J < 0)