Embed Size (px)
Citation preview
Wagner 1
Handle With Care: Examining the Relationship Between Empathy and Customer Satisfaction In
Retail Clinics by:
Samantha Wagner
Abstract
Since the turn of the 21st century, retail clinics (or colloquially, “quick clinics,”) have become an increasingly popular alternative to primary health care providers. However, there is limited quantitative research on factors that affect retail clinics and their operations. The well-known SERVQUAL model is a generally accepted framework in determining the elements of service quality that lead to customer satisfaction, and consists of a set of five different traits, one of them being empathy, or individualized attention (Parasuraman, et al., 1988). This thesis analyzes whether or not empathy has a significant impact on retail clinics’ perceived ability to provide quality care to its patients, as determined by a scenario-based role-playing experiment focusing on these areas. The findings from this research determined that while empathy impacts customer satisfaction from the patient perspective, it has a more complicated effect on the managerial perspective. Key Words: retail clinics, quick clinics, empathy, service management, managerial empathy, customer satisfaction Submitted under the faculty supervision of Professor Susan Goldstein, in partial fulfillment of the requirements for the Bachelor of Science in Business, magna cum laude, Carlson School of Management, University of Minnesota, Spring 2016.
Wagner 2
Section 1. Introduction
With the passage of the Affordable Care Act (ACA), retail clinics (or “quick clinics”) have
been examined as an alternative option to primary health care providers, who are projected to
experience increases in demand and limited resources. Many professionals and patients see retail
clinics, despite their claims to quick and high quality care, as a dubious option to primary care,
and many questions have been raised as to how retail clinics can provide equally reliable care
with a limited scope of service. While there has been increasing amounts of research on this
topic (Mehrotra, et al. 2008; Arthur, et al. 2015), very little quantitative analysis has been done
on retail clinics and how different factors influence how they operate.
Concurrently, over the past several years, there has been significant attention—academic or
practitioner—paid to service management and cracking the code surrounding “what customers
want” or “what customers value.” More importantly, however, is the increasing importance of
“the human element” in the service sector, as it’s become a bit of a buzzword to gaining
customer satisfaction. With regard to both of these aphorisms, many conflicting answers and
abstract opinions arise.
In the late 1980s, Parasuraman, Zeithaml, and Berry (1988), researchers from Duke and
Texas A&M, developed a model known as the SERVQUAL, or the RATER model, that
determined five dimensions of service quality that lead to customer satisfaction. These
dimensions included Reliability, Assurance, Tangibility, Empathy, and Responsiveness, and
contain highly specific definitions for each factor. For example, researchers defined empathy as
“caring, individualized attention the firm provides its customers” (Parasuraman, et. al., 1988, p.
149). However, although SERVQUAL was groundbreaking in its heyday, it has been
Wagner 3
continuously analyzed and broken down to determine which factors within SERVQUAL
mattered more than others, if any of those factors mattered at all.
Paying attention to the supposed importance of “the human element” in service
management, and as a means of providing initial quantitative insight into the retail clinic
industry, this thesis aspires to determine whether or not empathy has a significant relationship on
retail clinics’ perceived ability to provide quality care to its patients. In order to gain a
comprehensive answer to this question, this thesis examines empathy’s potential relationship
with retail clinic operations from both the customer and managerial perspectives, as well as
whether or not previous use of retail clinics influence empathetic behavior.
This thesis approaches these questions through a scenario-based behavioral experiment in
order to obtain primary-source insight. Furthermore, the conducted experiment uses a Qualtrics
survey as a tool to examine different situations in which empathy could relate to retail clinic
operations. Lastly, this thesis uses statistical analysis in order to properly quantify these
relationships.
Section 2. Literature Review
This section analyzes prior academic research in order to discuss numerous factors—both
interpersonal and non-interpersonal—that influence service management, and to determine what
relationship has been found between empathetic behavior and customer satisfaction in the service
industry. More specifically, this section will delve into tenets of relationship management and
other emotionally-driven influences in service management; related, but non-relationship-
oriented, explanatory factors in service management; and recent findings pertaining to empathy
in a managerial context. These sections will also address gaps within the given academic
research.
Wagner 4
Section 2.1 Relationship Management and Interpersonal Traits
Research on the relationship between service providers and their customers originally looked
to see if interpersonal relationships between service providers and customers were related to
positive financial results, and if so, which traits were responsible for those positive financial
results. Not only did this initial research conclude that such a relationship existed, but that
different interpersonal traits were necessary for both creating opportunities for sales, as well as
converting those opportunities into actual sales. To create opportunities for sales, service
providers needed to create trust and ability to fulfill customer needs; to convert said opportunities
into sales, however, service providers needed to demonstrate subject-matter expertise. (Crosby,
Evans & Cowles, 1990, p. 75-6).
Conversely, later research became more sophisticated with regard to data collection
techniques and explanatory factors analyzed, and became more focused on specific relationship-
oriented traits, specific services, and specific countries. For example, one of the more nuanced
traits studied involved affective commitment—also known as psychological identification and
psychological attachment with a given service provider—and its relationship to customer
satisfaction (and in turn, customer loyalty) in Hong Kong’s “tea restaurant” industry (Lai, 2015,
p. 118-38). In this particular study, Lai determined that affective commitment was key in turning
customer satisfaction into customer loyalty.
While these studies have done some exemplary work in determining the traits that influence
relationships between service providers and customers, two main issues are apparent. The first
issue is that many of the articles analyzed appear to focus on very intricate services that by their
very nature involve stronger interpersonal relationships with customers. Second, more recent
research appeared to focus on emerging markets due to their relevancy in the global economy.
Wagner 5
These emerging markets, like other countries, have cultural values that impact their preferences
in service management. Yet, some of these values may deviate drastically from Western values,
and may have influenced the results of the research. Lastly, these studies that focused on more
interpersonal traits did not explicitly analyze empathy as defined by Parasuraman et al. (1988) as
a potential factor in relationship management.
Section 2.2 Relationship Management and Non-Interpersonal Traits
In addition to relationship management centered around interpersonal factors, many academic
sources looked at a wide array of other variables—broadly defined here as “non-interpersonal”
variables—that relate to customer satisfaction and the provider-customer relationship. In some
cases, these studies were more focused on how information can influence the provider-customer
relationship and create a better customer experience. Glushko and Nomorosa (2013), for
example, created a conceptual framework that consisted of a potential technological operating
system to better fulfill customer preferences. This included a system that kept track of customer
preferences, how they searched for their preferences, potential service offerings that could be
adapted at any given time, previous service encounters, and service delivery (p. 29-34). In other
cases, however, experimenters isolated more physical traits, rather than distinctly information-
oriented ones. The work of Panda & Das (2014) went so far as to say that service tangibility—or
in layman’s terms, the physical layout and facilitating goods used to execute the service—was
more significant in determining customer satisfaction than empathy (p. 63).
However, there are limitations. The conceptual framework is difficult to prove and difficult
to determine the strongest models for driving high service quality. Such a conceptual framework
needs to go through experimentation or surveying to single out those models. Moreover, an
information-based system can only tell what a customer values from a technical standpoint, not
Wagner 6
an emotional one. In addition, the locations Panda & Das (2014) chose to collect information
from—four highly-populated cities in India, and only large hospitals and more reputable hotels
(p. 58)—could be a major limitation in their findings by ignoring possible sources of differences,
which may indicate that more interpersonal traits such as empathy could be of bigger
importance.
Section 2.3 Empathy, Managerial Preferences, and Self-Referential Bias
In recent years, researchers have been investigating the effects of managerial empathy—
defined in this case as the ability for a manager to put themselves in customers’ shoes in order to
understand their needs—on construing customer preferences (Parasuraman, et al., 1988). Initial
studies determine that managerial empathy, rather than helping managers understand what
customers want, actually enabled managers to allow their personal preferences as individuals to
cloud their decisions as managers, or in other words, create a self-referential bias (Hattula, et. al.,
2012, p. 1013-4). Later experiments took further steps into related topics, focusing on how
different levels of managerial empathy increase self-referential bias; whether or not managerial
empathy impacted their consideration of objective information (such as market research); and
whether or not there were any specific tactics that could be implemented in order to reign in self-
referential bias. Here, experimenters determined that the more empathetic a manager behaved,
the more likely they were to create self-referential bias in their decision making and ignore
objective information. However, if managers were given explicit instructions to not be
empathetic, they were more likely to suppress their consumer identity when making product
development and promotion decisions. (Hattula, et al., 2015, p. 235-252).
While these studies provided strong and comprehensive analysis into how managerial
empathy can affect one’s ability to accurately predict consumer preferences, there are some
Wagner 7
limitations to this research. First, the managerial implications for much of the research in this
topic emphasized that marketing managers were the most likely to benefit from the findings of
these studies, as the studies predominantly focused on managerial empathy’s impact on
marketing functions such as pricing and promotion. This ultimately inhibits the applicability of
the findings, as it is not explicitly clear if other business functions—such as operations
managers—could benefit from recognizing self-referential bias. Second, all of the experiments
that the research conducted focused on analyzing customer preferences for goods (cars, Rolex
watches, coffee, and so on) rather than services. This may not be reflective of most developed
countries, whose economies are service-oriented.
Section 2.4 Possible Contributions of New Research
Overall, based on the aforementioned previous research, it is evident that there are numerous
factors that have been shown to affect customer satisfaction, but it is unclear which factors have
more significant effects than others. More specifically, it is unclear what role empathy has in
service management, and whether or not it is a positive role. This thesis rectifies these gaps by
trying to address both explanatory and dependent factors from previous studies, provide an
accurate depiction of Western values, and strive for a controlled, experimental setting. With
regard to the general notion of empathy, this thesis focuses on interpersonal traits within service
provisions, while acknowledging the potential impact of non-interpersonal traits. In addition, this
research examines how previous findings on managerial empathy could affect service
provisions—in this case, within retail clinics—with the goal of determining how other business
functions could benefit from similar findings.
Section 3: Background on Retail Clinics
Wagner 8
When investigating the possible relationship between empathy and perceived customer
satisfaction, it was clear that a specific industry needed to be investigated more thoroughly.
Based on their inherently “high touch” nature, coupled with little quantitative research conducted
on this industry, retail clinics provided an ample opportunity to explore how empathy influences
different areas of operations. To clarify what retail clinics are, how they operate, and what
current research exists, this thesis provides a background section below.
The definition of retail clinics (or colloquially, “quick clinics”) is generally consistent
across various sources. For example, a 2009 definition provided by the Convenient Care
Association (CCA), a trade association for retail clinics and other healthcare companies that
specialize in accessible and affordable healthcare, defined retail clinics as healthcare clinics that
have “flexible hours, transparent pricing, and a limited number of health services in a convenient
setting.” (Arthur, et al. 2015, p. 431). Similarly, The Robert Wood Johnson Foundation defined
retail clinics as “ambulatory care sites typically located in and associated with brand-name
retailers…” (Bachrach, et al. 2015, p. 6).
Retail clinics, as their name suggests, are located in various retailers--which include
drugstores, “big-box” retailers, and grocery stores—and are predominantly staffed by physicians
assistants (PAs) and nurse practitioners (NPs) (Zamosky, 2014, p. 22; Mehrotra, et al. 2008,
Bachrach, et al. 2015, p. 6). As a result of their location, the majority of retail clinics are owned,
staffed, and operated by retailers, usually in partnership with regional health systems (Bachrach,
et al. 2015, p. 6). Generally, retail clinics provide acute care, focusing on a limited scope of
services, such as treatment of minor wounds and illnesses; administering vaccinations; and
performing basic physical examinations (Zamosky, 2014, p. 22; Mehrotra, et al. 2008, p. 1272;
Arthur, et al. 2015 p. 430; Pines, et al. 2013, p. 2158). However, at least two major retail clinic
Wagner 9
providers—CVS and Walgreens—have been expanding into disease management and chronic
care, to the opposition of major medical academies (Bachrach, et al. 2015, p. 9-10; Zamosky,
2014, p. 29, Lorenzetti, 2015, p. 22).
There are varying reasons as to why consumers are using retail clinics, with convenience
of time and location being a dominant factor in retail clinic use. Other factors include the lack of
needing to schedule an appointment, low cost, compared to other sources of care, and having no
usual source of care (Drug Store News 2015, p. 72; Zamosky, 2014, p. 23). Additionally, an
earlier comparative study between retail clinics, primary care physicians, and emergency
departments found that 60% of retail clinic users did not have a primary care physician
(Mehrotra, et al. 2008, p. 1279). Despite this, only 3% of the United States population is seeking
retail clinic care; this is due to location concentration in larger metropolitan areas, limited scope
of care, and questions regarding care quality (Zamosky, 2014, p.22-23). Efforts to help combat
the latter concern have predominantly involved partnering with regional health systems as a
means of increasing the retail clinic’s perception as a trusted healthcare provider. (Bachrach, et
al. 2015, p. 9).
With increased retail clinic usage, research on this topic has also increased. However, this
research predominantly consists of qualitative studies, comparative studies, or research-based
opinion articles in academic journals. (Pines, et al. 2013, p. 2157-2165; Mehrotra, et al. 2008, p.
1272-1282; Arthur, et al. 2015, p. 429-441). Consequentially, no quantitative studies were found
during literature searches. More specifically, research on the operations of retail clinics
predominantly focused on cost reduction strategies and recommendations for collaboration with
public health systems (Pines, et al. 2013, p.2160-4 ; Arthur, et al. 2015 p. 436-9). In contrast, no
academic articles were found on the process of receiving care at a retail clinic, or on retail clinic
Wagner 10
service management. With that said, this thesis plans on addressing this gap in academic research
by shedding light on a relatively new topic through a different research format.
Section 4: Methodology
Section 4.1: Hypothesis Statements and Justifications
One of the major implications from Panda & Das (2014) regarding the SERVQUAL
model was that streamlining or modifying services to make them more relatable to customers
would lead to a more favorable perceptual reaction from the customer (p. 63). Moreover, trade
publications and white papers note that the appeal of retail clinics include factors that directly
benefit the customer, such as convenience and flexibility (Zamosky, 2014; Bachrach et al. 2015,
p. 6-7).
Hypothesis 1 (H1): Empathy is related to customer satisfaction in retail (“quick”) clinics.
Previous studies have shown that there is self-referential bias in managers predicting
consumer preferences (Hattula, et al., 2012, p. 1013-4). In other words, managers have a
tendency to reflect and insert their own personal preferences as a consumer when determining
what customers value. However, this particular experiment focused on goods, with no evidence
indicating that the same result is shown in managers that provide services. Based on this lack of
evidence, it may be possible that self-referential biases may not occur in a service setting,
especially in a highly interpersonal industry such as the retail clinic industry.
Wagner 11
Hypothesis 2 (H2): Participants who have used retail clinics for medical care will be more
empathetic in terms of considering customer preferences when placed in a managerial setting
than those who have not.
Researchers recently conducted a study on managerial empathy in the luxury goods
industry, which determined that managerial empathy levels can backfire when predicting
consumer preferences, and that managers who try to put themselves into customers’ perspectives
tend to rely less on given market research. (Hattula, et al., 2015, p. 240). In this case, those who
do not normally use retail clinics as a primary source of health care may work harder to take a
consumer perspective, and thus are more likely to ignore market research when determining
consumer preferences.
Hypothesis 3 (H3): Participants who do not use retail clinics will be more likely to forgo
customer preferences in favor of personal preferences when placed in a managerial setting than
those who do.
Lastly, despite the increase in number of retail clinics, only 3% of the American
population setting uses retail clinics regularly. This is due to a wide array of factors, including
clinic location, scope of services provided, and ability of customers to trust the services
provided. (Zamosky, 2014, p. 22-3). This lack of use is crucial in determining whether or not
participants will be able to empathize with customers in a retail clinic setting, as those who use
do not use clinics often may have difficulty empathizing.
Wagner 12
Hypothesis 4: Participants’ combined recent retail clinic use and frequency of use predict a
manager’s ability to empathize with customers in a service setting.
Section 4.2: Measures and Variables
For all hypotheses, participant data was collected from a behavioral experiment using a
Qualtrics survey containing different sets of questions tailored to test each individual hypothesis.
The Qualtrics survey itself can be found in Appendix B.
Hypothesis 1:
To test H1, participants were given a questionnaire containing two different hypothetical
situations involving the retail clinic service experience from a customer perspective. The two
situations were similar in context, but contained different information indicating two different
retail clinic experiences. After reading each situation, participants were given a series of Likert
scale questions pertaining to each individual aspect of the retail clinic service process (i.e.
checking in, wait time, examination, etc.) as well as Likert scale questions pertaining to the retail
clinic experience as a whole.
The independent variable for H1 is represented as the type of information provided in the
hypothetical situations. Each situation was worded in a way to indicate high and low levels of
empathy, as well as to indicate different steps in the treatment process. For example, the high-
empathy situation involved being “greeted with a smile” upon check in, while the low-empathy
situation involved being “asked what symptoms [one] had” upon check-in.
The dependent variable for H1 is customer satisfaction, represented as CSAT. CSAT is
determined by averaging participant data on their respective Likert scale responses into an
Wagner 13
overall index. To confirm the reliability of this measurement, pairwise correlations were
conducted on 7 different Likert scale items for both the high and low empathy conditions.
Hypothesis 2 and Hypothesis 3:
To test H2 and H3, participants were given another set of situations in the same
questionnaire, this time focusing on a managerial perspective. Participants were given the task of
prioritizing five different aspects of retail clinic service—check in, waiting time, examination,
diagnosis, and treatment—by allocating 100 points between all five areas. In one scenario,
participants are required to allocate points at their own disposal. In the second scenario,
participants were given results a “patient survey” with given point values for the same five areas.
Like the first question, participants were asked again to allocate points while considering the
values given in the “survey.”
Additionally, both H2 and H3 have the same independent variables. The first independent
variable is represented qualitatively as whether or not a given question on the main questionnaire
contained the patient survey. Quantitatively, this is represented by the following dummy
variable: No = 0; Yes = 1. The second independent variable is represented by the participant’s
response to another questionnaire item, namely, whether or not they received retail clinic care in
the past. This is also represented by a dummy variable: No = 0, Yes = 1.
Dependent Variable for Hypothesis 2:
The dependent variable for H2 is the difference between participants’ rankings for each
area. This is represented by the change (delta, symbolized as Δ) from the value given in the
second question—which contained the “patient survey--to the value given in the first question,
which contained no “patient survey.” This was done for all five areas. For example, the
Wagner 14
difference Δ for the Friendly Check In factor is determined by the following expression: Friendly
Check In (2) – Friendly Check In (1).
Dependent Variable for Hypothesis 3:
The dependent variable for H3 is the difference between participants’ rankings for each
area compared to the values given in the “patient survey.” This is also represented by the change
(delta, symbolized as Δ) from the value given in the second question—which contained the
“patient survey--to the value given in the “patient survey” for a given area. As in the test for H2,
this measurement was also conducted for all five areas. For example, the difference Δ for
Friendly Check In is determined by the following expression: Friendly Check In (2) – Friendly
Check In (Survey).
Hypothesis 4:
To test H4, participants were given another set of questionnaire items. These items
consisted of three Likert Scale questions that followed the point allocation questions. The nature
of these questions involved the participant’s ability to put themselves into a customer
perspective. Participants were then given another set of questions that focused on their personal
retail clinic use, including whether or not they had received retail clinic care in the past, and the
frequency of their retail clinic use.
The independent variable for H4 is the participant’s overall retail clinic use, which is
expected to vary between each participant. Overall retail clinic use can be determined by the
aggregation of dummy variables from several different factors: whether or not a participant had
received retail clinic care in the past (No = 0, Yes = 1); and the frequency of their retail clinic use
(Never = 1; Rarely = 2; Sometimes = 3; Often = 4; Always = 5.
Wagner 15
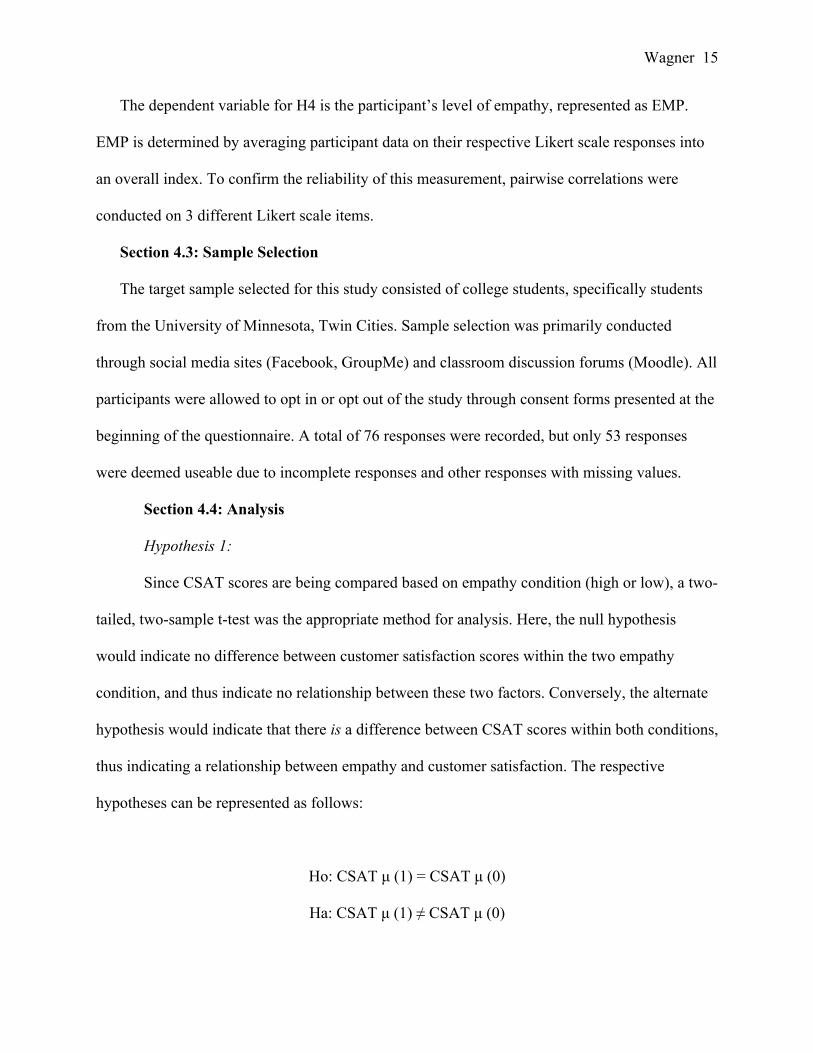
The dependent variable for H4 is the participant’s level of empathy, represented as EMP.
EMP is determined by averaging participant data on their respective Likert scale responses into
an overall index. To confirm the reliability of this measurement, pairwise correlations were
conducted on 3 different Likert scale items.
Section 4.3: Sample Selection
The target sample selected for this study consisted of college students, specifically students
from the University of Minnesota, Twin Cities. Sample selection was primarily conducted
through social media sites (Facebook, GroupMe) and classroom discussion forums (Moodle). All
participants were allowed to opt in or opt out of the study through consent forms presented at the
beginning of the questionnaire. A total of 76 responses were recorded, but only 53 responses
were deemed useable due to incomplete responses and other responses with missing values.
Section 4.4: Analysis
Hypothesis 1:
Since CSAT scores are being compared based on empathy condition (high or low), a two-
tailed, two-sample t-test was the appropriate method for analysis. Here, the null hypothesis
would indicate no difference between customer satisfaction scores within the two empathy
condition, and thus indicate no relationship between these two factors. Conversely, the alternate
hypothesis would indicate that there is a difference between CSAT scores within both conditions,
thus indicating a relationship between empathy and customer satisfaction. The respective
hypotheses can be represented as follows:
Ho: CSAT µ (1) = CSAT µ (0)
Ha: CSAT µ (1) ≠ CSAT µ (0)
Wagner 16
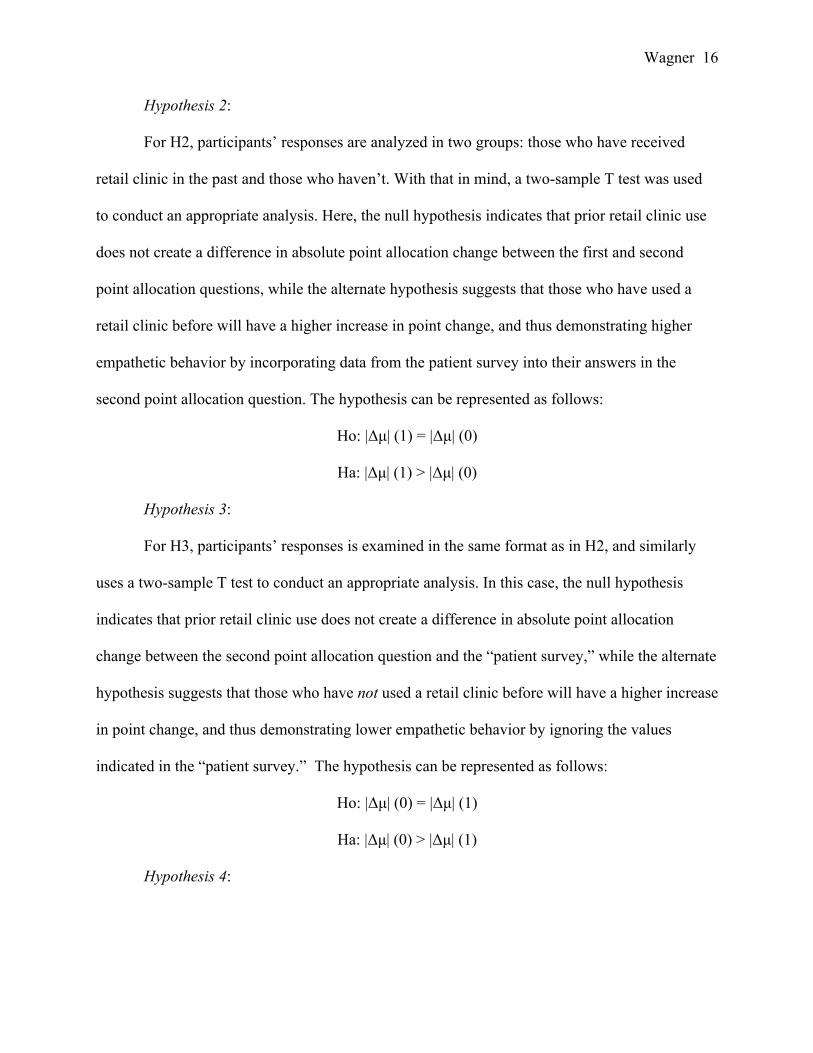
Hypothesis 2:
For H2, participants’ responses are analyzed in two groups: those who have received
retail clinic in the past and those who haven’t. With that in mind, a two-sample T test was used
to conduct an appropriate analysis. Here, the null hypothesis indicates that prior retail clinic use
does not create a difference in absolute point allocation change between the first and second
point allocation questions, while the alternate hypothesis suggests that those who have used a
retail clinic before will have a higher increase in point change, and thus demonstrating higher
empathetic behavior by incorporating data from the patient survey into their answers in the
second point allocation question. The hypothesis can be represented as follows:
Ho: |Δµ| (1) = |Δµ| (0)
Ha: |Δµ| (1) > |Δµ| (0)
Hypothesis 3:
For H3, participants’ responses is examined in the same format as in H2, and similarly
uses a two-sample T test to conduct an appropriate analysis. In this case, the null hypothesis
indicates that prior retail clinic use does not create a difference in absolute point allocation
change between the second point allocation question and the “patient survey,” while the alternate
hypothesis suggests that those who have not used a retail clinic before will have a higher increase
in point change, and thus demonstrating lower empathetic behavior by ignoring the values
indicated in the “patient survey.” The hypothesis can be represented as follows:
Ho: |Δµ| (0) = |Δµ| (1)
Ha: |Δµ| (0) > |Δµ| (1)
Hypothesis 4:
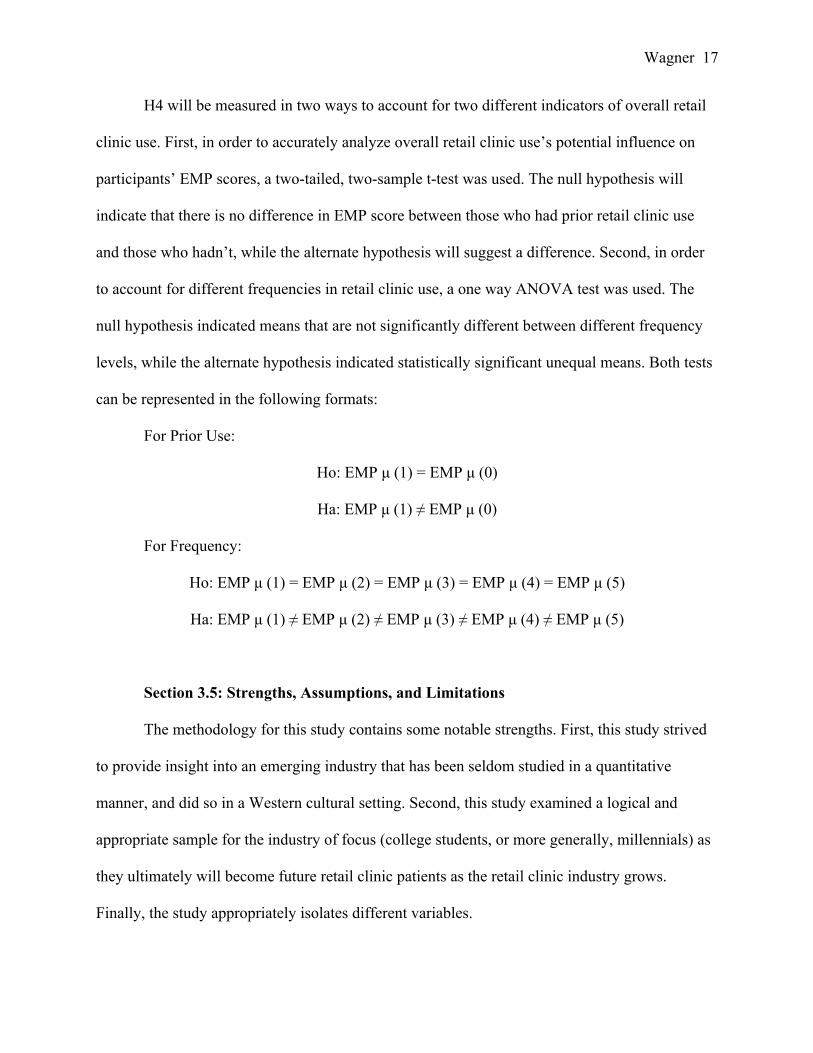
Wagner 17
H4 will be measured in two ways to account for two different indicators of overall retail
clinic use. First, in order to accurately analyze overall retail clinic use’s potential influence on
participants’ EMP scores, a two-tailed, two-sample t-test was used. The null hypothesis will
indicate that there is no difference in EMP score between those who had prior retail clinic use
and those who hadn’t, while the alternate hypothesis will suggest a difference. Second, in order
to account for different frequencies in retail clinic use, a one way ANOVA test was used. The
null hypothesis indicated means that are not significantly different between different frequency
levels, while the alternate hypothesis indicated statistically significant unequal means. Both tests
can be represented in the following formats:
For Prior Use:
Ho: EMP µ (1) = EMP µ (0)
Ha: EMP µ (1) ≠ EMP µ (0)
For Frequency:
Ho: EMP µ (1) = EMP µ (2) = EMP µ (3) = EMP µ (4) = EMP µ (5)
Ha: EMP µ (1) ≠ EMP µ (2) ≠ EMP µ (3) ≠ EMP µ (4) ≠ EMP µ (5)
Section 3.5: Strengths, Assumptions, and Limitations
The methodology for this study contains some notable strengths. First, this study strived
to provide insight into an emerging industry that has been seldom studied in a quantitative
manner, and did so in a Western cultural setting. Second, this study examined a logical and
appropriate sample for the industry of focus (college students, or more generally, millennials) as
they ultimately will become future retail clinic patients as the retail clinic industry grows.
Finally, the study appropriately isolates different variables.
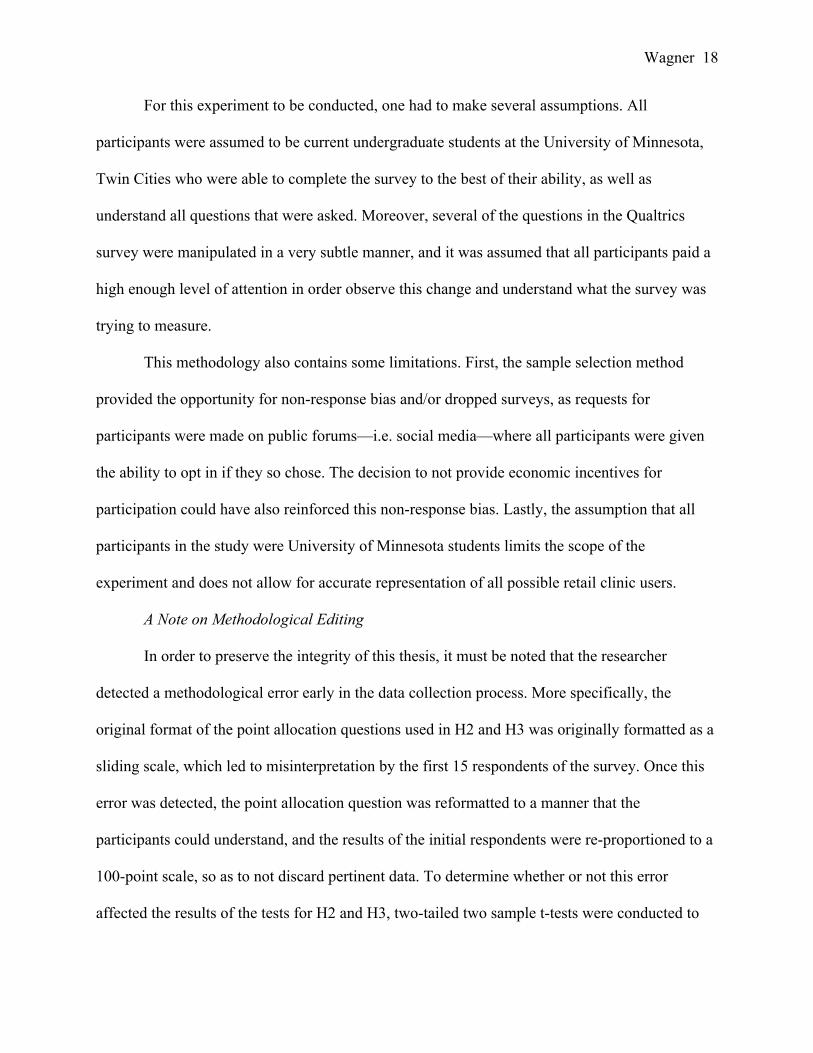
Wagner 18
For this experiment to be conducted, one had to make several assumptions. All
participants were assumed to be current undergraduate students at the University of Minnesota,
Twin Cities who were able to complete the survey to the best of their ability, as well as
understand all questions that were asked. Moreover, several of the questions in the Qualtrics
survey were manipulated in a very subtle manner, and it was assumed that all participants paid a
high enough level of attention in order observe this change and understand what the survey was
trying to measure.
This methodology also contains some limitations. First, the sample selection method
provided the opportunity for non-response bias and/or dropped surveys, as requests for
participants were made on public forums—i.e. social media—where all participants were given
the ability to opt in if they so chose. The decision to not provide economic incentives for
participation could have also reinforced this non-response bias. Lastly, the assumption that all
participants in the study were University of Minnesota students limits the scope of the
experiment and does not allow for accurate representation of all possible retail clinic users.
A Note on Methodological Editing
In order to preserve the integrity of this thesis, it must be noted that the researcher
detected a methodological error early in the data collection process. More specifically, the
original format of the point allocation questions used in H2 and H3 was originally formatted as a
sliding scale, which led to misinterpretation by the first 15 respondents of the survey. Once this
error was detected, the point allocation question was reformatted to a manner that the
participants could understand, and the results of the initial respondents were re-proportioned to a
100-point scale, so as to not discard pertinent data. To determine whether or not this error
affected the results of the tests for H2 and H3, two-tailed two sample t-tests were conducted to
Wagner 19
compare responses before and after the question formats were modified. With the exception of
the Thorough Examination and Accurate Diagnosis categories in H3—p = 0.033 and p = 0.036
respectively—there were no statistically significant differences at the 5% level between the
responses captured in the erroneous format and those captured in the accurate format. Despite
this information, the editing itself is considered to be a limitation of this research.
Section 5: Results
This section details the findings of this research in order to assess support for my
hypotheses.
Section 5.1: Findings of Hypothesis 1
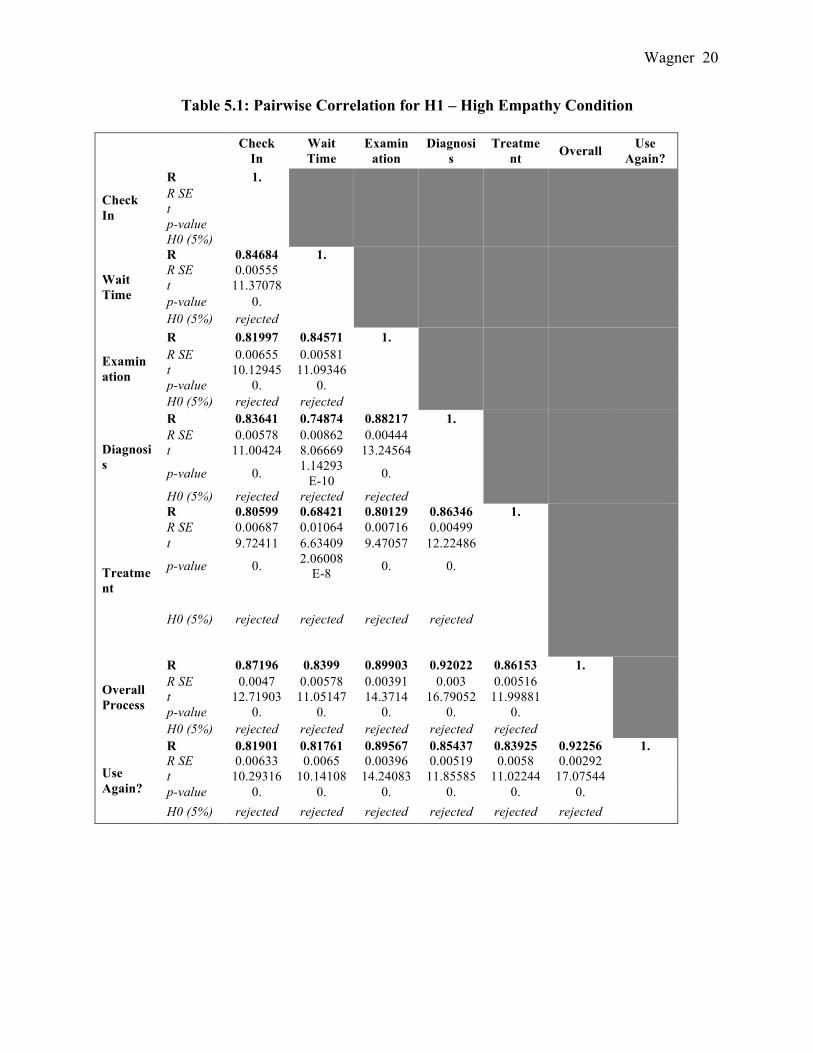
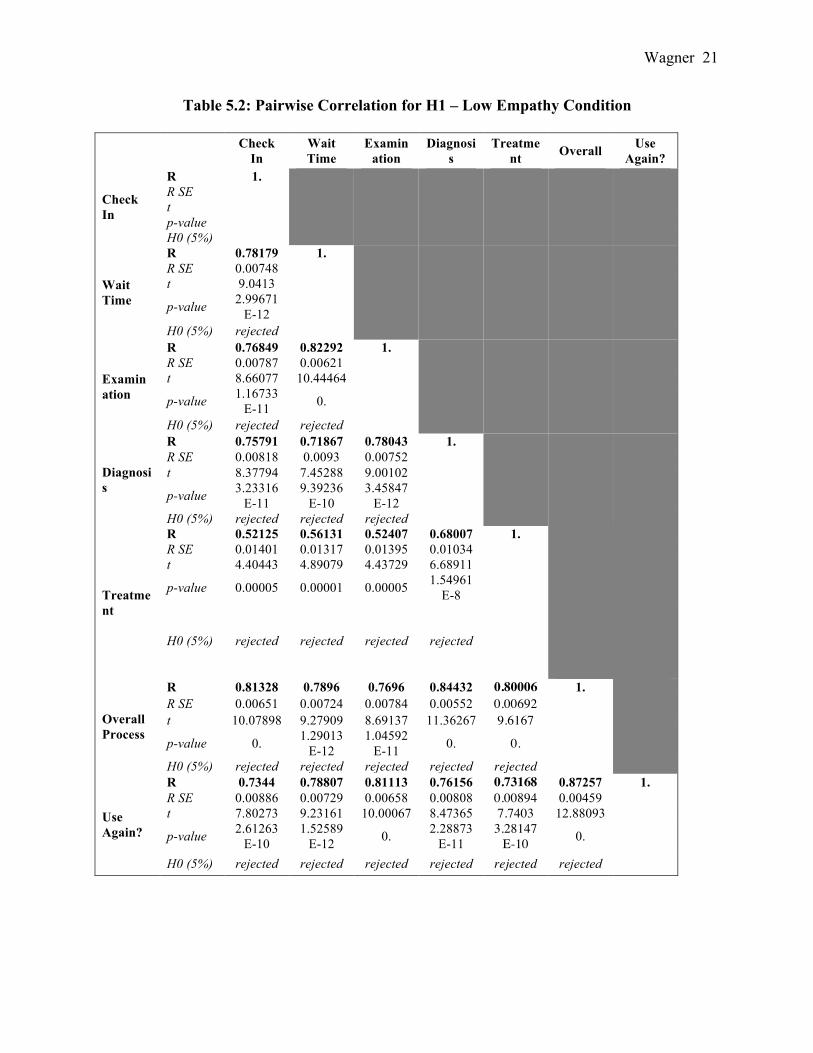
Before determining the results for H1, pairwise correlations were conducted to confirm
the reliability of the high and low empathy conditions across the 7 different Likert scale items
that would create the customer satisfaction (CSAT) index. All correlations were statistically
significant, confirming that both sets of pairwise correlations are reliable. Table 5.1 and Table
5.2 detail these pairwise correlations:
Wagner 20
Table 5.1: Pairwise Correlation for H1 – High Empathy Condition
Check In
Wait Time
Examination
Diagnosis
Treatment Overall Use
Again?
Check In
R 1.
R SE
t p-value H0 (5%)
Wait Time
R 0.84684 1.
R SE 0.00555
t 11.37078 p-value 0. H0 (5%) rejected
Examination
R 0.81997 0.84571 1.
R SE 0.00655 0.00581
t 10.12945 11.09346 p-value 0. 0. H0 (5%) rejected rejected
Diagnosis
R 0.83641 0.74874 0.88217 1.
R SE 0.00578 0.00862 0.00444
t 11.00424 8.06669 13.24564
p-value 0. 1.14293E-10 0.
H0 (5%) rejected rejected rejected
Treatment
R 0.80599 0.68421 0.80129 0.86346 1.
R SE 0.00687 0.01064 0.00716 0.00499
t 9.72411 6.63409 9.47057 12.22486
p-value 0. 2.06008E-8 0. 0.
H0 (5%) rejected rejected rejected rejected
Overall Process
R 0.87196 0.8399 0.89903 0.92022 0.86153 1.
R SE 0.0047 0.00578 0.00391 0.003 0.00516
t 12.71903 11.05147 14.3714 16.79052 11.99881 p-value 0. 0. 0. 0. 0. H0 (5%) rejected rejected rejected rejected rejected
Use Again?
R 0.81901 0.81761 0.89567 0.85437 0.83925 0.92256 1. R SE 0.00633 0.0065 0.00396 0.00519 0.0058 0.00292
t 10.29316 10.14108 14.24083 11.85585 11.02244 17.07544 p-value 0. 0. 0. 0. 0. 0. H0 (5%) rejected rejected rejected rejected rejected rejected
Wagner 21
Table 5.2: Pairwise Correlation for H1 – Low Empathy Condition
Check In
Wait Time
Examination
Diagnosis
Treatment Overall Use
Again?
Check In
R 1.
R SE
t p-value H0 (5%)
Wait Time
R 0.78179 1.
R SE 0.00748
t 9.0413
p-value 2.99671E-12
H0 (5%) rejected
Examination
R 0.76849 0.82292 1.
R SE 0.00787 0.00621
t 8.66077 10.44464
p-value 1.16733E-11 0.
H0 (5%) rejected rejected
Diagnosis
R 0.75791 0.71867 0.78043 1.
R SE 0.00818 0.0093 0.00752
t 8.37794 7.45288 9.00102
p-value 3.23316E-11
9.39236E-10
3.45847E-12
H0 (5%) rejected rejected rejected
Treatment
R 0.52125 0.56131 0.52407 0.68007 1.
R SE 0.01401 0.01317 0.01395 0.01034
t 4.40443 4.89079 4.43729 6.68911
p-value 0.00005 0.00001 0.00005 1.54961E-8
H0 (5%) rejected rejected rejected rejected
Overall Process
R 0.81328 0.7896 0.7696 0.84432 0.80006 1.
R SE 0.00651 0.00724 0.00784 0.00552 0.00692
t 10.07898 9.27909 8.69137 11.36267 9.6167
p-value 0. 1.29013E-12
1.04592E-11 0. 0.
H0 (5%) rejected rejected rejected rejected rejected
Use Again?
R 0.7344 0.78807 0.81113 0.76156 0.73168 0.87257 1. R SE 0.00886 0.00729 0.00658 0.00808 0.00894 0.00459
t 7.80273 9.23161 10.00067 8.47365 7.7403 12.88093
p-value 2.61263E-10
1.52589E-12 0. 2.28873
E-11 3.28147
E-10 0.
H0 (5%) rejected rejected rejected rejected rejected rejected
Wagner 22
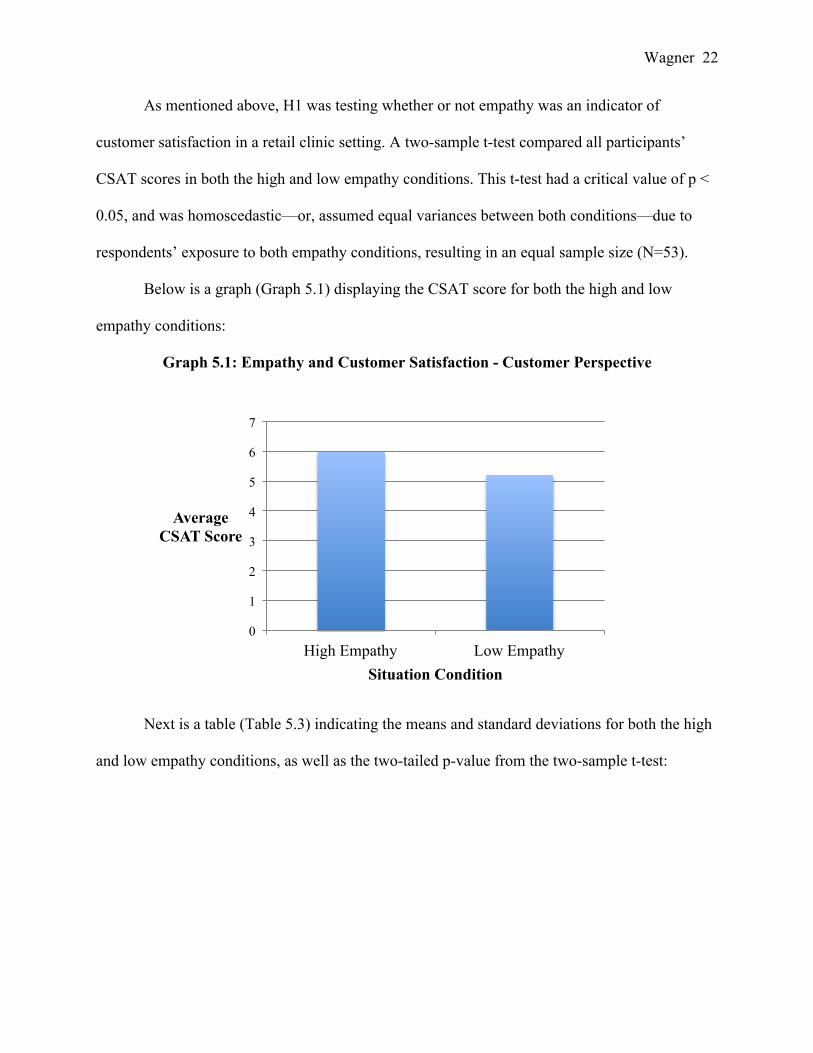
As mentioned above, H1 was testing whether or not empathy was an indicator of
customer satisfaction in a retail clinic setting. A two-sample t-test compared all participants’
CSAT scores in both the high and low empathy conditions. This t-test had a critical value of p <
0.05, and was homoscedastic—or, assumed equal variances between both conditions—due to
respondents’ exposure to both empathy conditions, resulting in an equal sample size (N=53).
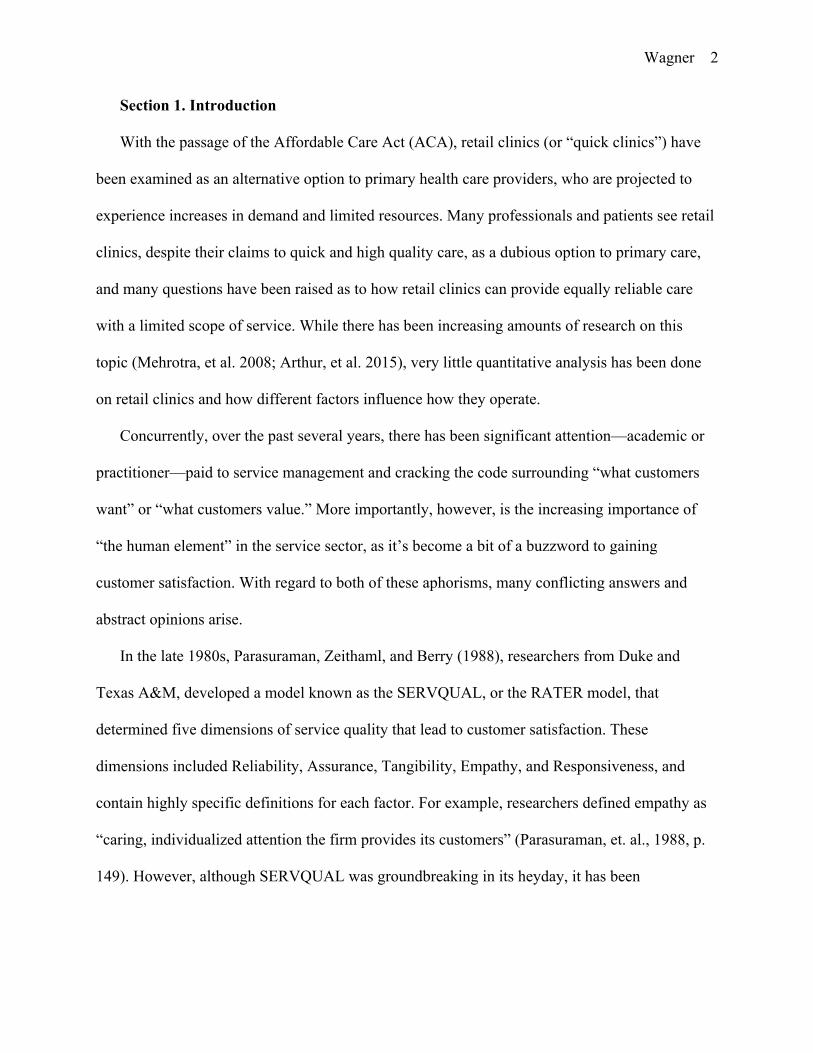
Below is a graph (Graph 5.1) displaying the CSAT score for both the high and low
empathy conditions:
Graph 5.1: Empathy and Customer Satisfaction - Customer Perspective
Next is a table (Table 5.3) indicating the means and standard deviations for both the high
and low empathy conditions, as well as the two-tailed p-value from the two-sample t-test:
0
1
2
3
4
5
6
7
High Empathy Low Empathy
Average CSAT Score
Situation Condition
Wagner 23
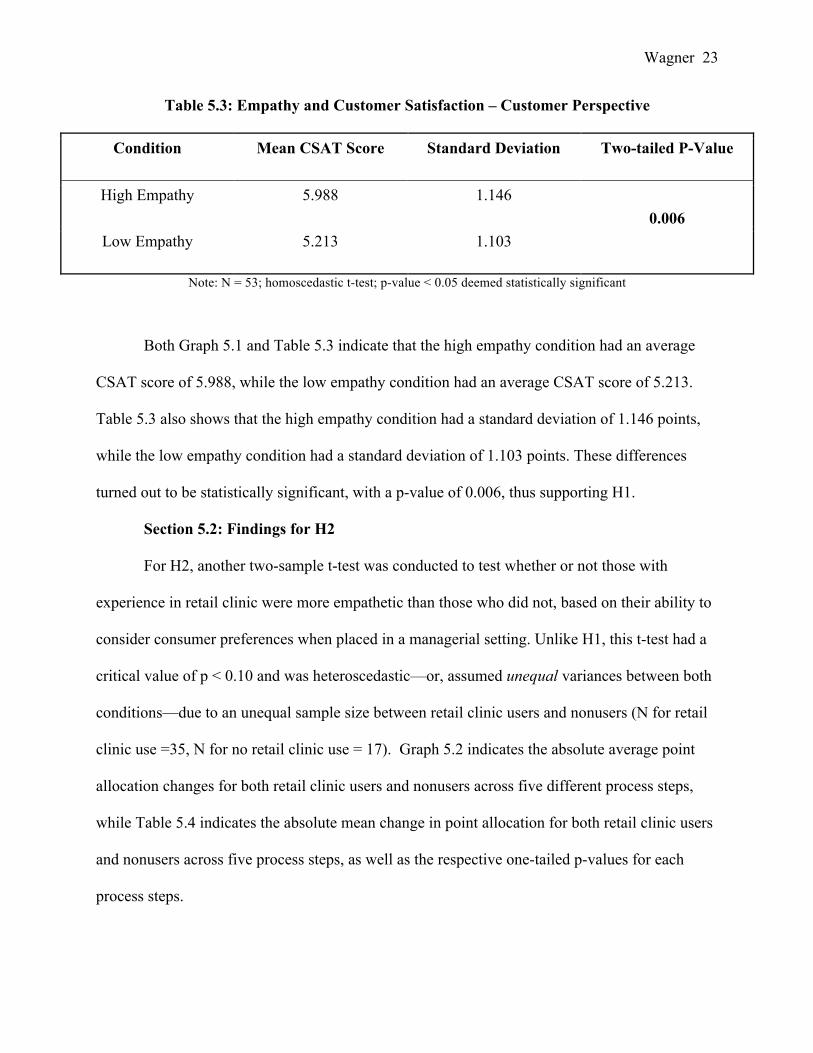
Table 5.3: Empathy and Customer Satisfaction – Customer Perspective
Condition Mean CSAT Score Standard Deviation Two-tailed P-Value
High Empathy 5.988 1.146 0.006
Low Empathy 5.213 1.103
Note: N = 53; homoscedastic t-test; p-value < 0.05 deemed statistically significant
Both Graph 5.1 and Table 5.3 indicate that the high empathy condition had an average
CSAT score of 5.988, while the low empathy condition had an average CSAT score of 5.213.
Table 5.3 also shows that the high empathy condition had a standard deviation of 1.146 points,
while the low empathy condition had a standard deviation of 1.103 points. These differences
turned out to be statistically significant, with a p-value of 0.006, thus supporting H1.
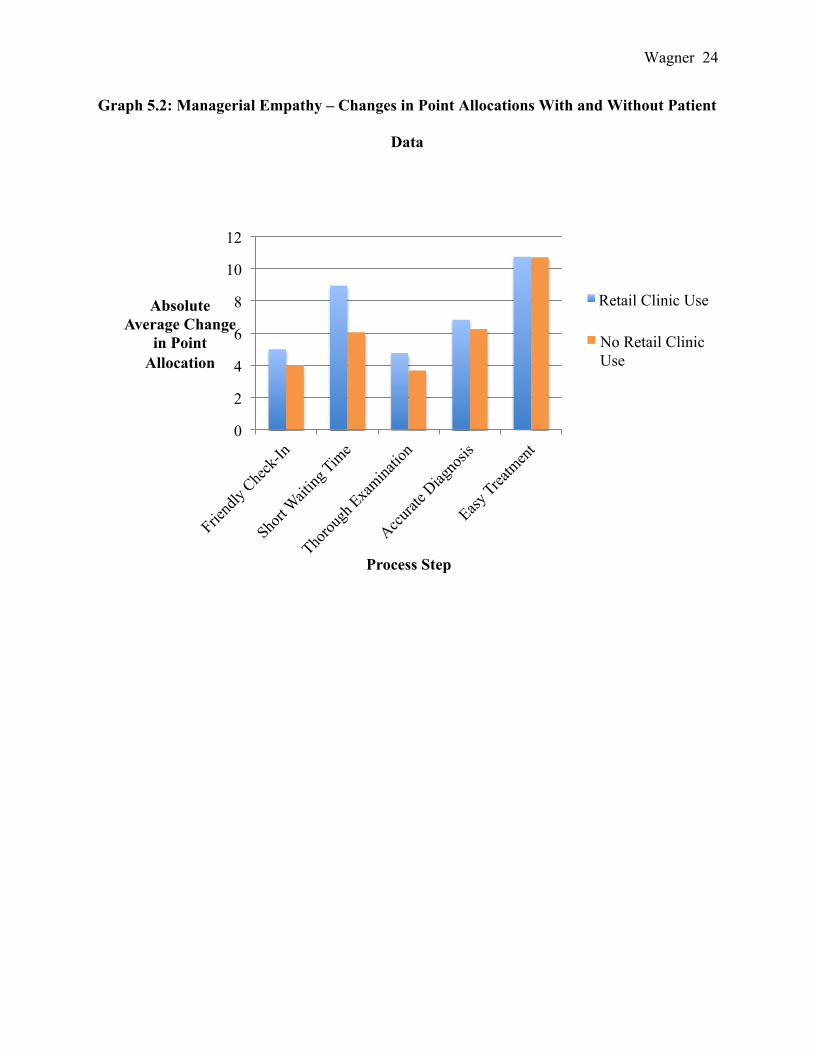
Section 5.2: Findings for H2
For H2, another two-sample t-test was conducted to test whether or not those with
experience in retail clinic were more empathetic than those who did not, based on their ability to
consider consumer preferences when placed in a managerial setting. Unlike H1, this t-test had a
critical value of p < 0.10 and was heteroscedastic—or, assumed unequal variances between both
conditions—due to an unequal sample size between retail clinic users and nonusers (N for retail
clinic use =35, N for no retail clinic use = 17). Graph 5.2 indicates the absolute average point
allocation changes for both retail clinic users and nonusers across five different process steps,
while Table 5.4 indicates the absolute mean change in point allocation for both retail clinic users
and nonusers across five process steps, as well as the respective one-tailed p-values for each
process steps.
Wagner 24
Graph 5.2: Managerial Empathy – Changes in Point Allocations With and Without Patient
Data
0
2
4
6
8
10
12
Absolute Average Change
in Point Allocation
Process Step
Retail Clinic Use
No Retail Clinic Use
Wagner 25
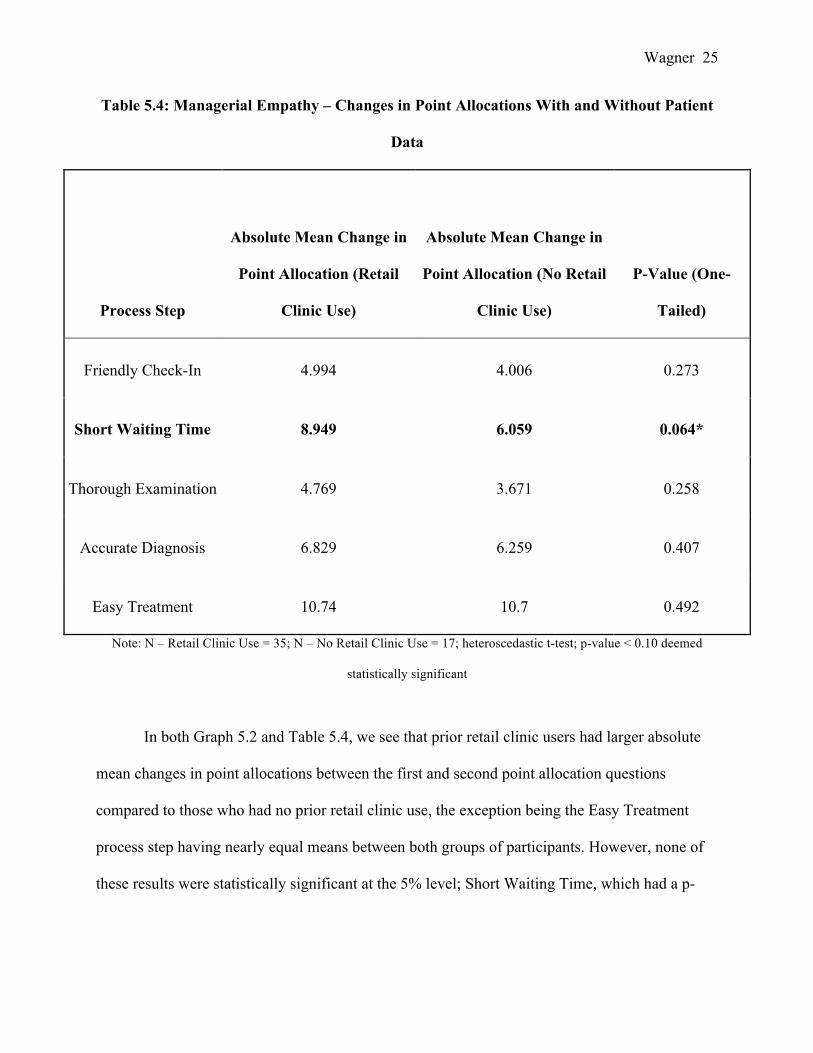
Table 5.4: Managerial Empathy – Changes in Point Allocations With and Without Patient
Data
Process Step
Absolute Mean Change in
Point Allocation (Retail
Clinic Use)
Absolute Mean Change in
Point Allocation (No Retail
Clinic Use)
P-Value (One-
Tailed)
Friendly Check-In 4.994 4.006 0.273
Short Waiting Time 8.949 6.059 0.064*
Thorough Examination 4.769 3.671 0.258
Accurate Diagnosis 6.829 6.259 0.407
Easy Treatment 10.74 10.7 0.492
Note: N – Retail Clinic Use = 35; N – No Retail Clinic Use = 17; heteroscedastic t-test; p-value < 0.10 deemed
statistically significant
In both Graph 5.2 and Table 5.4, we see that prior retail clinic users had larger absolute
mean changes in point allocations between the first and second point allocation questions
compared to those who had no prior retail clinic use, the exception being the Easy Treatment
process step having nearly equal means between both groups of participants. However, none of
these results were statistically significant at the 5% level; Short Waiting Time, which had a p-
Wagner 26
value of 0.064, is statistically significant at the 10% level. Therefore, H2 is only partially
supported.
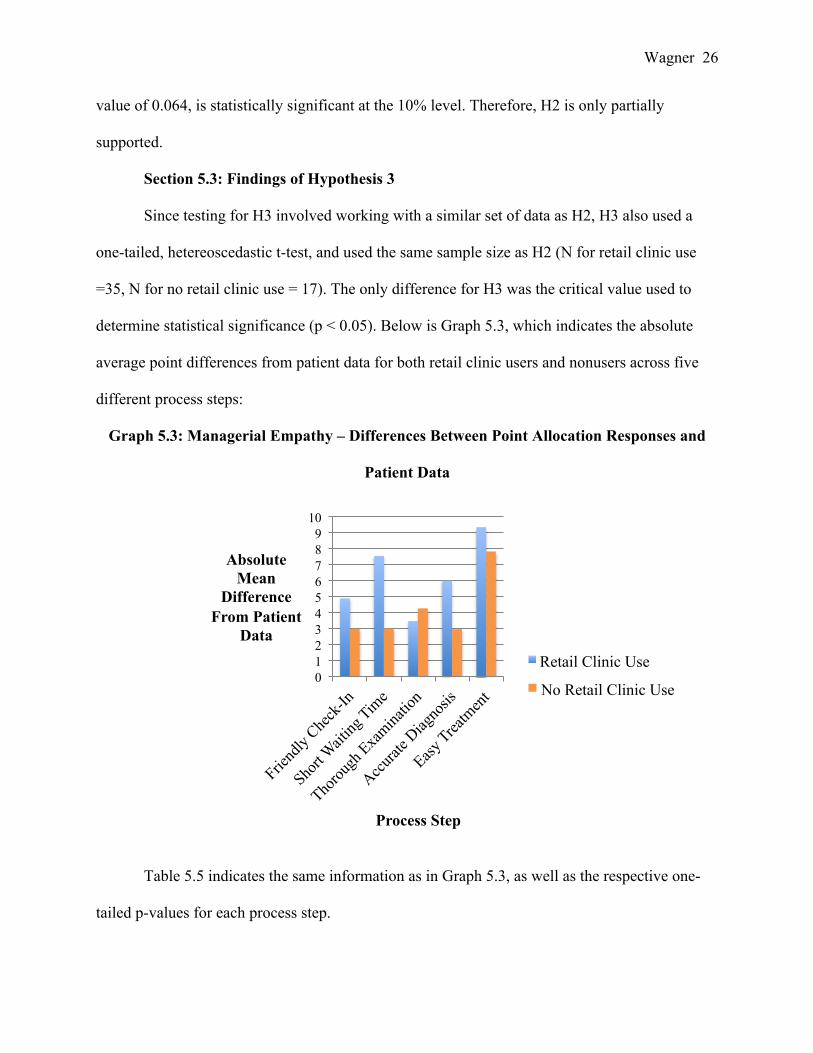
Section 5.3: Findings of Hypothesis 3
Since testing for H3 involved working with a similar set of data as H2, H3 also used a
one-tailed, hetereoscedastic t-test, and used the same sample size as H2 (N for retail clinic use
=35, N for no retail clinic use = 17). The only difference for H3 was the critical value used to
determine statistical significance (p < 0.05). Below is Graph 5.3, which indicates the absolute
average point differences from patient data for both retail clinic users and nonusers across five
different process steps:
Graph 5.3: Managerial Empathy – Differences Between Point Allocation Responses and
Patient Data
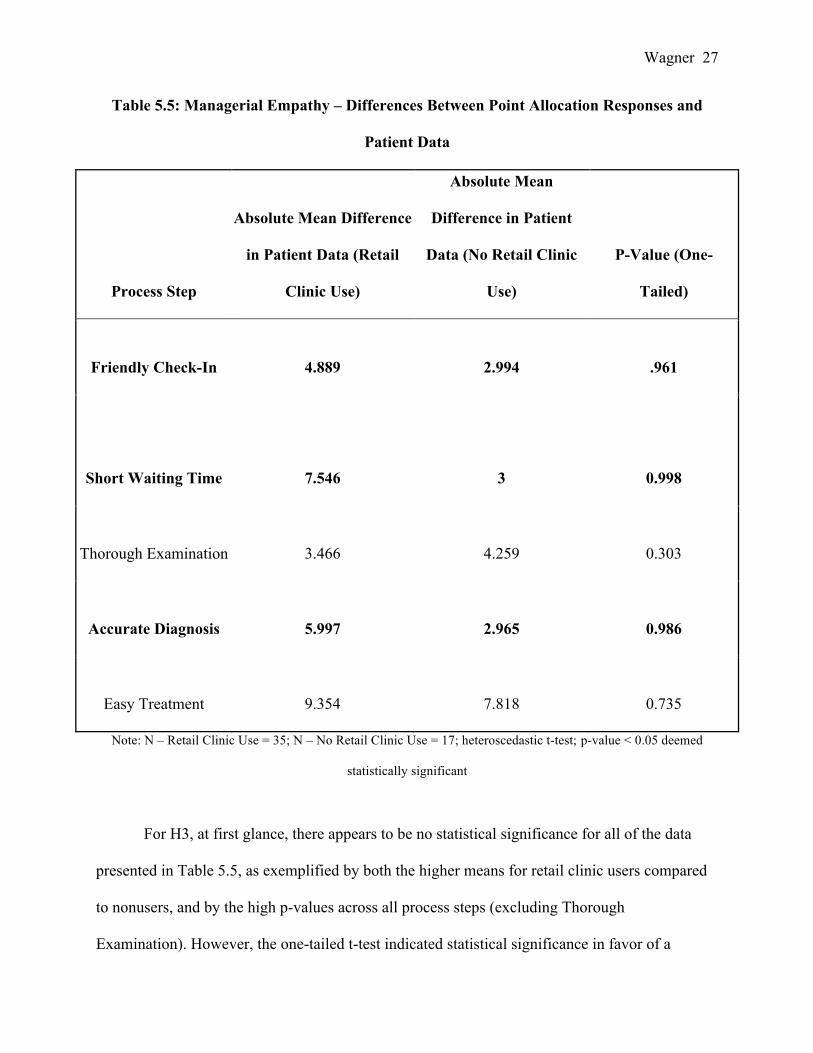
Table 5.5 indicates the same information as in Graph 5.3, as well as the respective one-
tailed p-values for each process step.
0 1 2 3 4 5 6 7 8 9
10
Absolute Mean
Difference From Patient
Data
Process Step
Retail Clinic Use
No Retail Clinic Use
Wagner 27
Table 5.5: Managerial Empathy – Differences Between Point Allocation Responses and
Patient Data
Process Step
Absolute Mean Difference
in Patient Data (Retail
Clinic Use)
Absolute Mean
Difference in Patient
Data (No Retail Clinic
Use)
P-Value (One-
Tailed)
Friendly Check-In 4.889 2.994 .961
Short Waiting Time 7.546 3 0.998
Thorough Examination 3.466 4.259 0.303
Accurate Diagnosis 5.997 2.965 0.986
Easy Treatment 9.354 7.818 0.735
Note: N – Retail Clinic Use = 35; N – No Retail Clinic Use = 17; heteroscedastic t-test; p-value < 0.05 deemed
statistically significant
For H3, at first glance, there appears to be no statistical significance for all of the data
presented in Table 5.5, as exemplified by both the higher means for retail clinic users compared
to nonusers, and by the high p-values across all process steps (excluding Thorough
Examination). However, the one-tailed t-test indicated statistical significance in favor of a
Wagner 28
mismatch between customer preferences and points allocated by retail clinic users, not nonusers,
for Friendly Check-In, Short Waiting Time, and Accurate Diagnosis. This statistical significance
is expressed by calculating (1-p), which indicates the p-value for the original hypothesis. So,
although H3 does not have support for retail clinic non-users, it does show support for previous
research. This connection will be detailed more thoroughly in the Discussion section.
Section 5.4: Findings for Hypothesis 4
As mentioned above, H4 wanted to determine whether or not overall retail clinic use
(both in terms of prior use and in terms of frequency of use) was an indicator of a manager’s
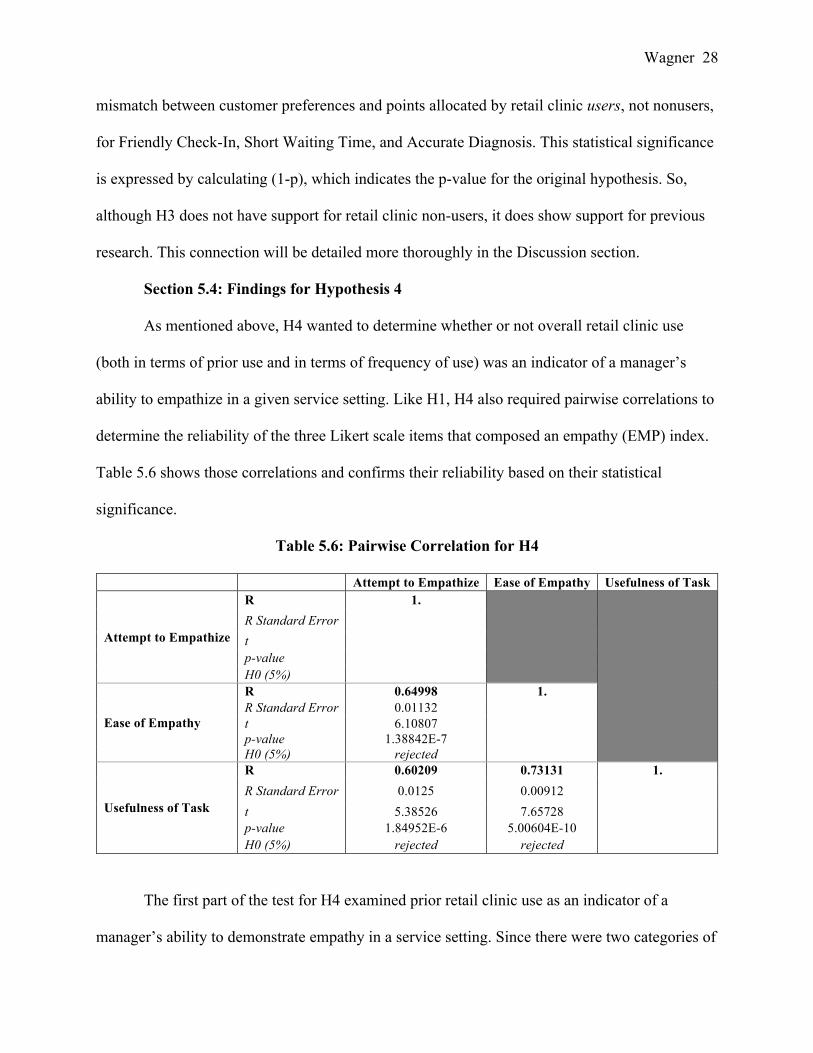
ability to empathize in a given service setting. Like H1, H4 also required pairwise correlations to
determine the reliability of the three Likert scale items that composed an empathy (EMP) index.
Table 5.6 shows those correlations and confirms their reliability based on their statistical
significance.
Table 5.6: Pairwise Correlation for H4
Attempt to Empathize Ease of Empathy Usefulness of Task
Attempt to Empathize
R 1.
R Standard Error
t p-value H0 (5%)
Ease of Empathy
R 0.64998 1. R Standard Error 0.01132
t 6.10807 p-value 1.38842E-7 H0 (5%) rejected
Usefulness of Task
R 0.60209 0.73131 1. R Standard Error 0.0125 0.00912
t 5.38526 7.65728 p-value 1.84952E-6 5.00604E-10 H0 (5%) rejected rejected
The first part of the test for H4 examined prior retail clinic use as an indicator of a
manager’s ability to demonstrate empathy in a service setting. Since there were two categories of
Wagner 29
prior retail clinic use (those who had and those who hadn’t), a two-sample t-test was conducted
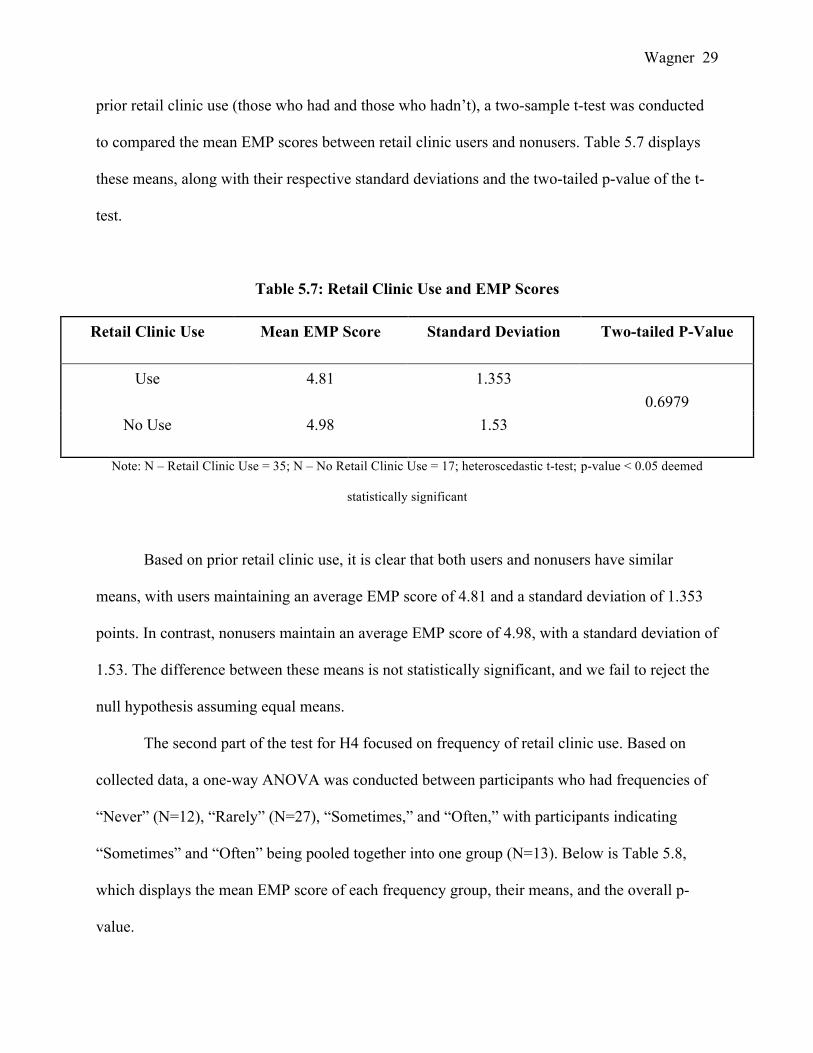
to compared the mean EMP scores between retail clinic users and nonusers. Table 5.7 displays
these means, along with their respective standard deviations and the two-tailed p-value of the t-
test.
Table 5.7: Retail Clinic Use and EMP Scores
Retail Clinic Use Mean EMP Score Standard Deviation Two-tailed P-Value
Use 4.81 1.353 0.6979
No Use 4.98 1.53
Note: N – Retail Clinic Use = 35; N – No Retail Clinic Use = 17; heteroscedastic t-test; p-value < 0.05 deemed
statistically significant
Based on prior retail clinic use, it is clear that both users and nonusers have similar
means, with users maintaining an average EMP score of 4.81 and a standard deviation of 1.353
points. In contrast, nonusers maintain an average EMP score of 4.98, with a standard deviation of
1.53. The difference between these means is not statistically significant, and we fail to reject the
null hypothesis assuming equal means.
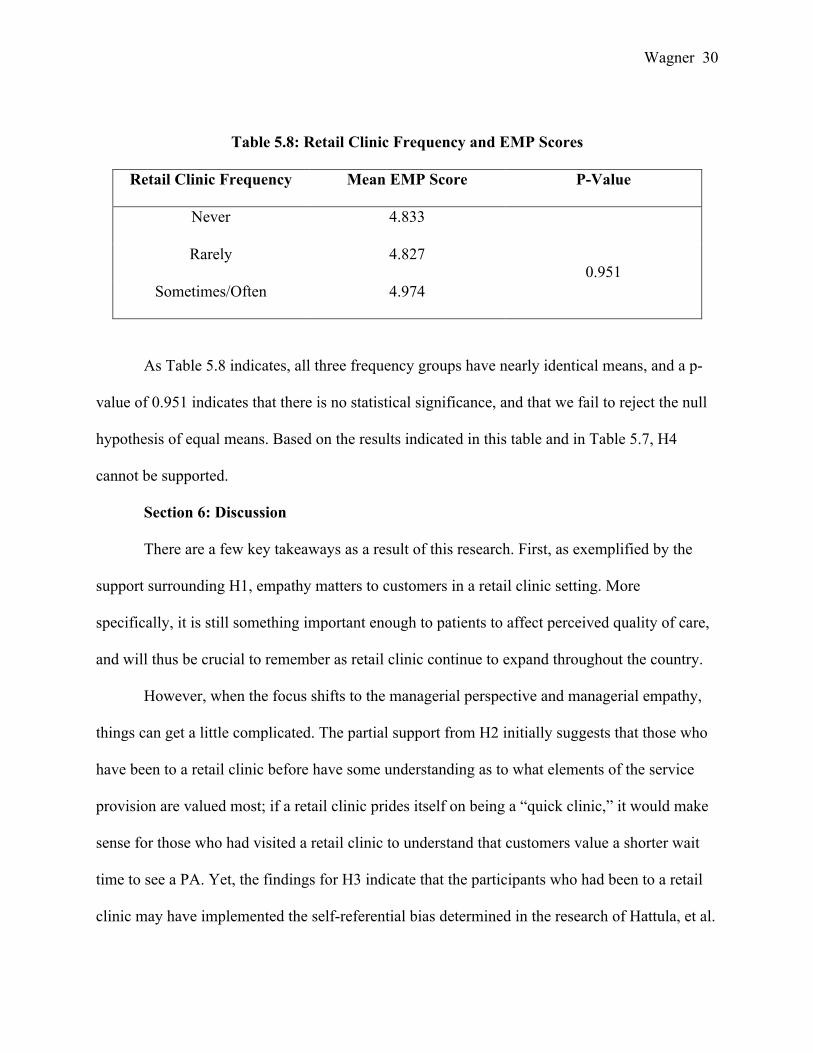
The second part of the test for H4 focused on frequency of retail clinic use. Based on
collected data, a one-way ANOVA was conducted between participants who had frequencies of
“Never” (N=12), “Rarely” (N=27), “Sometimes,” and “Often,” with participants indicating
“Sometimes” and “Often” being pooled together into one group (N=13). Below is Table 5.8,
which displays the mean EMP score of each frequency group, their means, and the overall p-
value.
Wagner 30
Table 5.8: Retail Clinic Frequency and EMP Scores
Retail Clinic Frequency Mean EMP Score P-Value
Never 4.833
0.951 Rarely 4.827
Sometimes/Often 4.974
As Table 5.8 indicates, all three frequency groups have nearly identical means, and a p-
value of 0.951 indicates that there is no statistical significance, and that we fail to reject the null
hypothesis of equal means. Based on the results indicated in this table and in Table 5.7, H4
cannot be supported.
Section 6: Discussion
There are a few key takeaways as a result of this research. First, as exemplified by the
support surrounding H1, empathy matters to customers in a retail clinic setting. More
specifically, it is still something important enough to patients to affect perceived quality of care,
and will thus be crucial to remember as retail clinic continue to expand throughout the country.
However, when the focus shifts to the managerial perspective and managerial empathy,
things can get a little complicated. The partial support from H2 initially suggests that those who
have been to a retail clinic before have some understanding as to what elements of the service
provision are valued most; if a retail clinic prides itself on being a “quick clinic,” it would make
sense for those who had visited a retail clinic to understand that customers value a shorter wait
time to see a PA. Yet, the findings for H3 indicate that the participants who had been to a retail
clinic may have implemented the self-referential bias determined in the research of Hattula, et al.
Wagner 31
(2015, p. 240). In turn, these participants may have ignored the hypothetical “patient survey” in
favor of trusting their own experiences as indicating of what customers wanted. Meanwhile, the
lack of support for H4 indicates that overall retail clinic use—exemplified here by prior retail
clinic use and frequency of retail clinic use—was not an indicator of whether or not someone
was able to express empathy in a given service setting, thus leaving additional opportunities to
explore what elements do affect a manager’s ability to demonstrate empathy in a service setting.
Moreover, people who focus on retail clinic operations—namely clinic managers, PAs
and NPs—can use the implications from this research as a means of building, improving, and
maintaining clinic operations. H3 highlights some specific areas within the retail clinic service
provision (check-in, wait time, and diagnosis) that may be more susceptible to self-referential
bias on behalf of clinic staff. This provides managers the ability to determine whether or not
these are areas that require improvement with regard to acknowledging customer needs, analyze
areas of each process step that could be clouded by managerial preferences, and re-tailor those
areas so as to better center on customer needs.
Lastly, as acknowledged within the Methodology section of this thesis, this research was
a first step, and thus there are some possible improvements that could be implemented in order to
improve upon this research. This could include more complex surveys that ask further questions
beyond satisfaction, or incorporate a different sample of individuals to determine any differences
in results between demographics.
Section 7: Conclusion
Overall, this initial quantitative look into the retail clinic industry came away with some
interesting findings. While it is clear that empathy still matters to retail clinic patients, a
manager’s previous experience with a retail clinic may affect their ability to best determine and
Wagner 32
accommodate customer preferences in specific areas of the retail clinic process. This opens the
door for clinic managers to better understand how certain factors of service quality ultimately
interact with the retail clinic business. Moreover, it may not be clear whether or not experience is
the most appropriate indicator of empathy, which leaves ample opportunity to explore indicators
that are appropriate.
Despite this, the methods for coming to these findings were imperfect and may not have
captured all possible users of retail clinics in an unbiased, error-free way. Fortunately, since this
is one of the first looks into quantitative research in this field, this thesis provides an important
first step into examining the retail clinic industry and the factors that influence it. As more
research on this industry is published, there will be more opportunities to get a more accurate
picture of this industry, and more information to determine how to best optimize retail clinic
operations.
Wagner 33
Reference List Arthur, B. C., Fisher, A. K., Shoemaker, S. J., Pozniak, A., & Stokley, S. (2015). Business Models, Vaccination Services, and Public Health Relationships of Retail Clinics: A Qualitative Study. Journal Of Healthcare Management, 60(6), 429-441. Bachrach, Deborah, Jonah Frohlich, Allison Garcimonde, and Keith Nevitt. "Building a Culture of Health: The Value Proposition of Retail Clinics." (n.d.): n. pag. Building a Culture of Health: The Value Proposition of Retail Clinics. Manatt Health and The Robert Wood Johnson Foundation, Apr. 2015. Web. Consumers visit retail clinics for convenience. (2015). Drug Store News, 37(8), 72. Crosby, L. A., Evans, K. A., & Cowles, D. (1990). Relationship quality in services selling: An interpersonal influence perspective. Journal Of Marketing, 54(3), 68. Dougherty, Dave, and Ajay Murthy. "What Service Customers Really Want." Harvard Business Review. Harvard Business School, 01 Sept. 2009. Web. 09 Mar. 2016. Glushko, R. J., & Nomorosa, K. J. (2013). Substituting information for interaction: A framework for personalization in service encounters and service systems. Journal Of Service Research, 16(1), 21-38. doi:10.1177/1094670512463967 Lai, I. W. (2015). The roles of value, satisfaction, and commitment in the effect of service quality on customer loyalty in Hong Kong–style tea restaurants. Cornell Hospitality Quarterly, 56(1), 118-138. doi:10.1177/1938965514556149 Lorenzetti, L. (2015). Betting Big on Health. Fortune, 171(6), 22. Mehrotra, A., Wang, M. C., Lave, J. R., Adams, J. L., & McGlynn, E. A. (2008). Retail Clinics, Primary Care Physicians, And Emergency Departments: A Comparison Of Patients' Visits. Health Affairs, 27(5), 1272-1282. doi:10.1377/hlthaff.27.5.1272 Panda, T. K., & Das, S. (2014). The role of tangibility in service quality and its impact on external customer satisfaction: A comparative study of hospital and hospitality sectors. IUP Journal Of Marketing Management, 13(4), 53-69. Parasuraman, A., Zeithaml, V., & Berry, L. (1988). SERVQUAL: A multiple-Item scale for measuring consumer perceptions of service quality. Journal of Retailing, 64(1), 12-40. Retrieved May 3, 2014. Pines, J. M., Newman, D., Pilgrim, R., & Schuur, J. D. (2013). Strategies For Integrating Cost-Consciousness Into Acute Care Should Focus On Rewarding High-Value Care. Health Affairs, 32(12), 2157-2165. doi:10.1377/hlthaff.2013.0685

Wagner 34
ZAMOSKY, L. (2014). What retail clinic growth can teach us about patient demand. Medical Economics, 91(1), 22-30.
Wagner 35
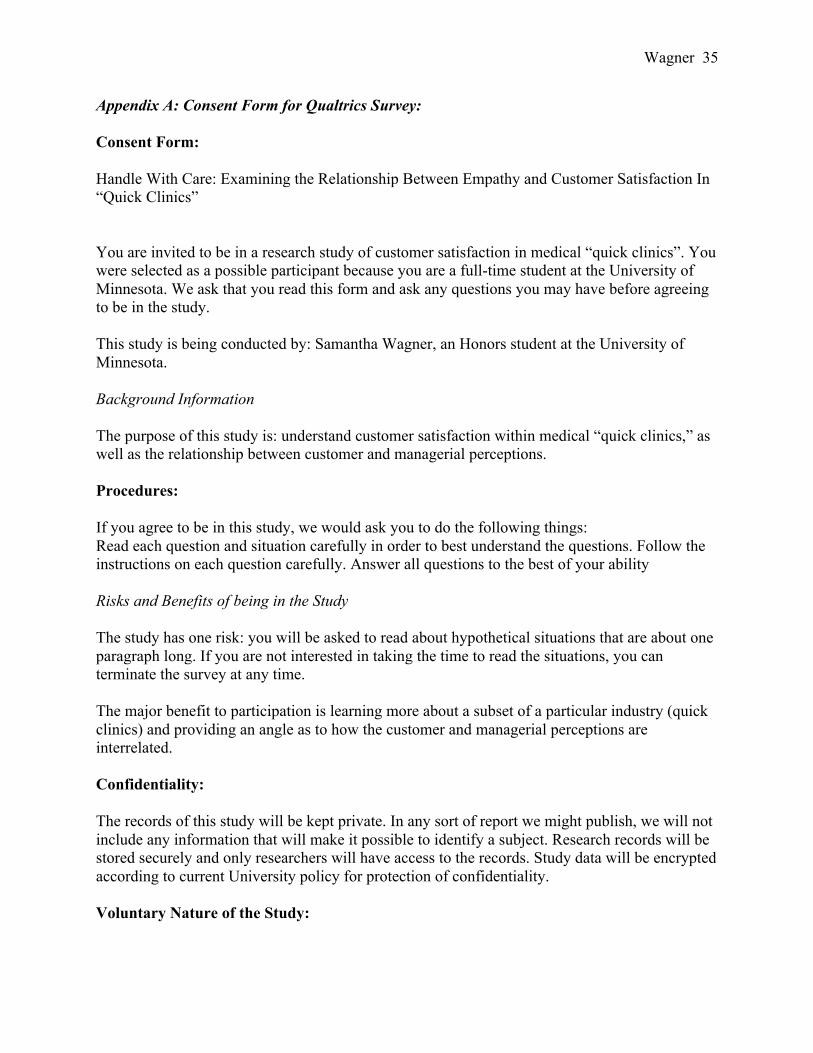
Appendix A: Consent Form for Qualtrics Survey: Consent Form: Handle With Care: Examining the Relationship Between Empathy and Customer Satisfaction In “Quick Clinics” You are invited to be in a research study of customer satisfaction in medical “quick clinics”. You were selected as a possible participant because you are a full-time student at the University of Minnesota. We ask that you read this form and ask any questions you may have before agreeing to be in the study. This study is being conducted by: Samantha Wagner, an Honors student at the University of Minnesota. Background Information The purpose of this study is: understand customer satisfaction within medical “quick clinics,” as well as the relationship between customer and managerial perceptions. Procedures: If you agree to be in this study, we would ask you to do the following things: Read each question and situation carefully in order to best understand the questions. Follow the instructions on each question carefully. Answer all questions to the best of your ability Risks and Benefits of being in the Study The study has one risk: you will be asked to read about hypothetical situations that are about one paragraph long. If you are not interested in taking the time to read the situations, you can terminate the survey at any time. The major benefit to participation is learning more about a subset of a particular industry (quick clinics) and providing an angle as to how the customer and managerial perceptions are interrelated. Confidentiality: The records of this study will be kept private. In any sort of report we might publish, we will not include any information that will make it possible to identify a subject. Research records will be stored securely and only researchers will have access to the records. Study data will be encrypted according to current University policy for protection of confidentiality. Voluntary Nature of the Study:
Wagner 36
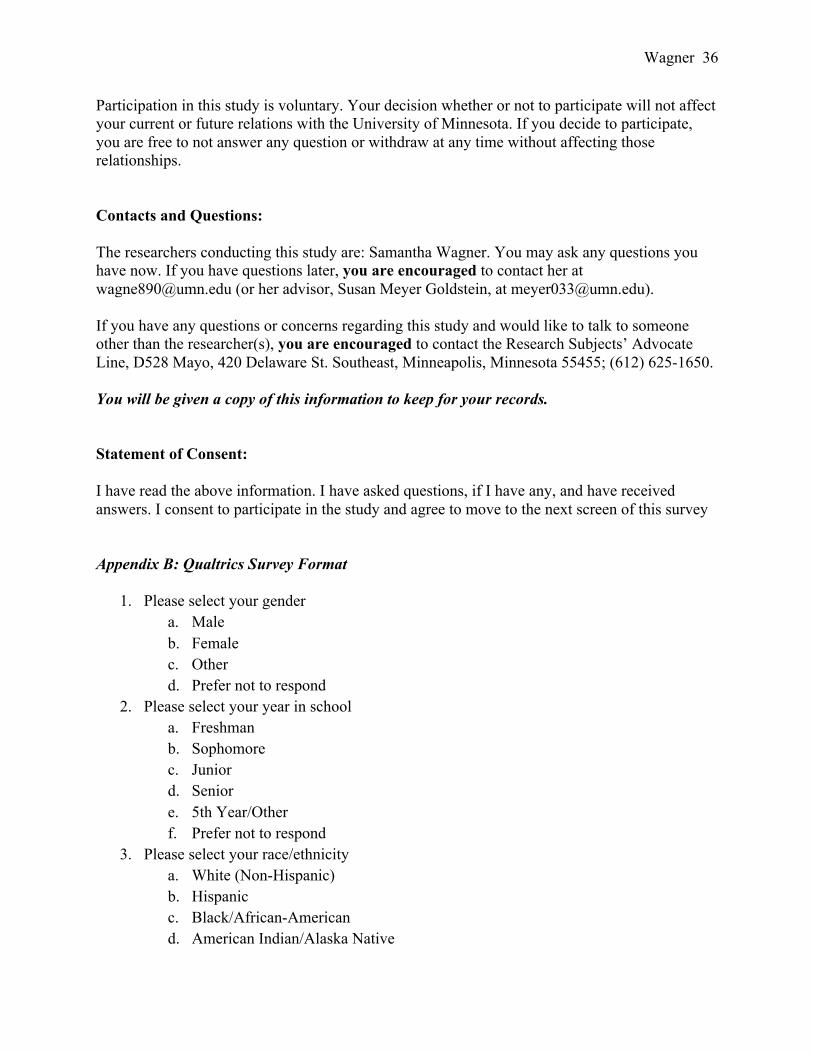
Participation in this study is voluntary. Your decision whether or not to participate will not affect your current or future relations with the University of Minnesota. If you decide to participate, you are free to not answer any question or withdraw at any time without affecting those relationships. Contacts and Questions: The researchers conducting this study are: Samantha Wagner. You may ask any questions you have now. If you have questions later, you are encouraged to contact her at [email protected] (or her advisor, Susan Meyer Goldstein, at [email protected]). If you have any questions or concerns regarding this study and would like to talk to someone other than the researcher(s), you are encouraged to contact the Research Subjects’ Advocate Line, D528 Mayo, 420 Delaware St. Southeast, Minneapolis, Minnesota 55455; (612) 625-1650. You will be given a copy of this information to keep for your records. Statement of Consent: I have read the above information. I have asked questions, if I have any, and have received answers. I consent to participate in the study and agree to move to the next screen of this survey Appendix B: Qualtrics Survey Format
1. Please select your gender a. Male b. Female c. Other d. Prefer not to respond
2. Please select your year in school a. Freshman b. Sophomore c. Junior d. Senior e. 5th Year/Other f. Prefer not to respond
3. Please select your race/ethnicity a. White (Non-Hispanic) b. Hispanic c. Black/African-American d. American Indian/Alaska Native
Wagner 37
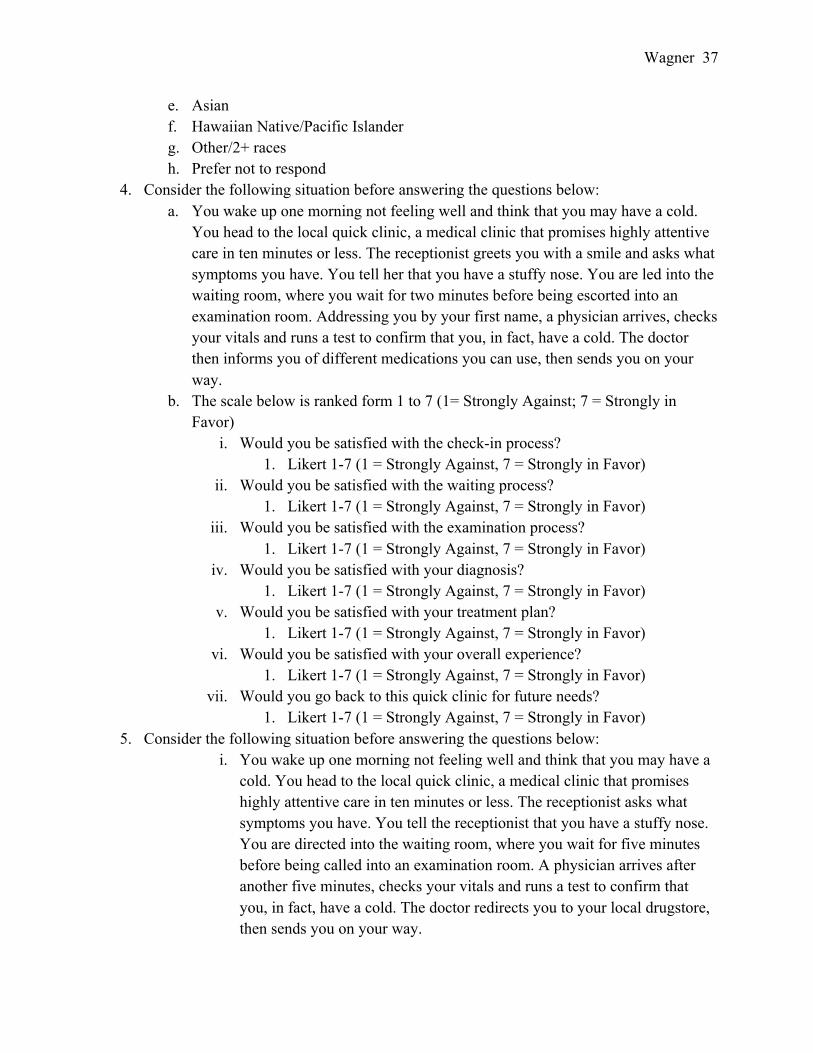
e. Asian f. Hawaiian Native/Pacific Islander g. Other/2+ races h. Prefer not to respond
4. Consider the following situation before answering the questions below: a. You wake up one morning not feeling well and think that you may have a cold.
You head to the local quick clinic, a medical clinic that promises highly attentive care in ten minutes or less. The receptionist greets you with a smile and asks what symptoms you have. You tell her that you have a stuffy nose. You are led into the waiting room, where you wait for two minutes before being escorted into an examination room. Addressing you by your first name, a physician arrives, checks your vitals and runs a test to confirm that you, in fact, have a cold. The doctor then informs you of different medications you can use, then sends you on your way.
b. The scale below is ranked form 1 to 7 (1= Strongly Against; 7 = Strongly in Favor)
i. Would you be satisfied with the check-in process? 1. Likert 1-7 (1 = Strongly Against, 7 = Strongly in Favor)
ii. Would you be satisfied with the waiting process? 1. Likert 1-7 (1 = Strongly Against, 7 = Strongly in Favor)
iii. Would you be satisfied with the examination process? 1. Likert 1-7 (1 = Strongly Against, 7 = Strongly in Favor)
iv. Would you be satisfied with your diagnosis? 1. Likert 1-7 (1 = Strongly Against, 7 = Strongly in Favor)
v. Would you be satisfied with your treatment plan? 1. Likert 1-7 (1 = Strongly Against, 7 = Strongly in Favor)
vi. Would you be satisfied with your overall experience? 1. Likert 1-7 (1 = Strongly Against, 7 = Strongly in Favor)
vii. Would you go back to this quick clinic for future needs? 1. Likert 1-7 (1 = Strongly Against, 7 = Strongly in Favor)
5. Consider the following situation before answering the questions below: i. You wake up one morning not feeling well and think that you may have a
cold. You head to the local quick clinic, a medical clinic that promises highly attentive care in ten minutes or less. The receptionist asks what symptoms you have. You tell the receptionist that you have a stuffy nose. You are directed into the waiting room, where you wait for five minutes before being called into an examination room. A physician arrives after another five minutes, checks your vitals and runs a test to confirm that you, in fact, have a cold. The doctor redirects you to your local drugstore, then sends you on your way.
Wagner 38
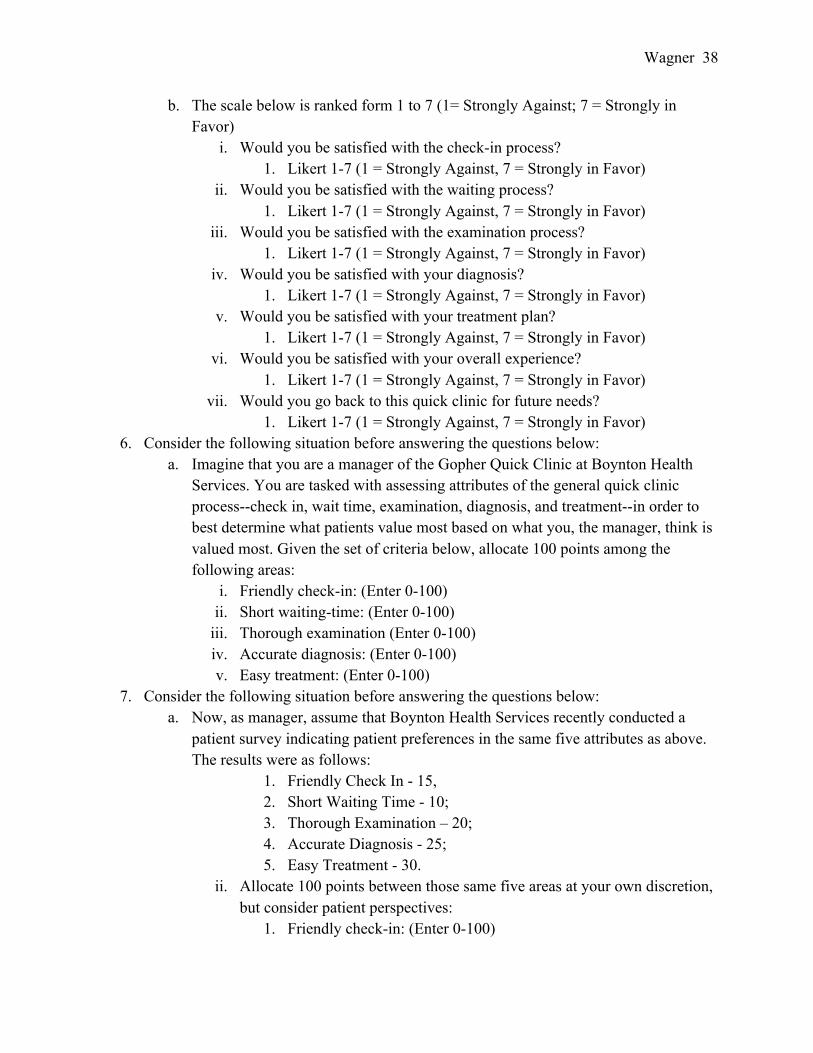
b. The scale below is ranked form 1 to 7 (1= Strongly Against; 7 = Strongly in Favor)
i. Would you be satisfied with the check-in process? 1. Likert 1-7 (1 = Strongly Against, 7 = Strongly in Favor)
ii. Would you be satisfied with the waiting process? 1. Likert 1-7 (1 = Strongly Against, 7 = Strongly in Favor)
iii. Would you be satisfied with the examination process? 1. Likert 1-7 (1 = Strongly Against, 7 = Strongly in Favor)
iv. Would you be satisfied with your diagnosis? 1. Likert 1-7 (1 = Strongly Against, 7 = Strongly in Favor)
v. Would you be satisfied with your treatment plan? 1. Likert 1-7 (1 = Strongly Against, 7 = Strongly in Favor)
vi. Would you be satisfied with your overall experience? 1. Likert 1-7 (1 = Strongly Against, 7 = Strongly in Favor)
vii. Would you go back to this quick clinic for future needs? 1. Likert 1-7 (1 = Strongly Against, 7 = Strongly in Favor)
6. Consider the following situation before answering the questions below: a. Imagine that you are a manager of the Gopher Quick Clinic at Boynton Health
Services. You are tasked with assessing attributes of the general quick clinic process--check in, wait time, examination, diagnosis, and treatment--in order to best determine what patients value most based on what you, the manager, think is valued most. Given the set of criteria below, allocate 100 points among the following areas:
i. Friendly check-in: (Enter 0-100) ii. Short waiting-time: (Enter 0-100)
iii. Thorough examination (Enter 0-100) iv. Accurate diagnosis: (Enter 0-100) v. Easy treatment: (Enter 0-100)
7. Consider the following situation before answering the questions below: a. Now, as manager, assume that Boynton Health Services recently conducted a
patient survey indicating patient preferences in the same five attributes as above. The results were as follows:
1. Friendly Check In - 15, 2. Short Waiting Time - 10; 3. Thorough Examination – 20; 4. Accurate Diagnosis - 25; 5. Easy Treatment - 30.
ii. Allocate 100 points between those same five areas at your own discretion, but consider patient perspectives:
1. Friendly check-in: (Enter 0-100)
Wagner 39
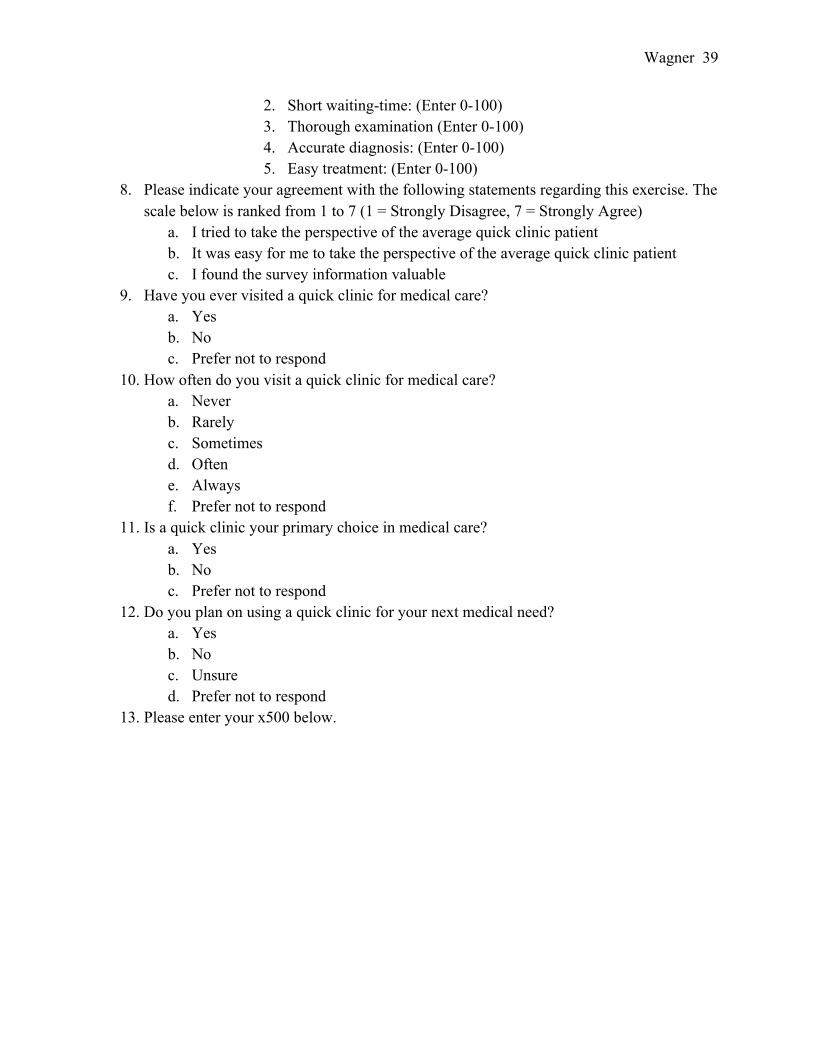
2. Short waiting-time: (Enter 0-100) 3. Thorough examination (Enter 0-100) 4. Accurate diagnosis: (Enter 0-100) 5. Easy treatment: (Enter 0-100)
8. Please indicate your agreement with the following statements regarding this exercise. The scale below is ranked from 1 to 7 (1 = Strongly Disagree, 7 = Strongly Agree)
a. I tried to take the perspective of the average quick clinic patient b. It was easy for me to take the perspective of the average quick clinic patient c. I found the survey information valuable
9. Have you ever visited a quick clinic for medical care? a. Yes b. No c. Prefer not to respond
10. How often do you visit a quick clinic for medical care? a. Never b. Rarely c. Sometimes d. Often e. Always f. Prefer not to respond
11. Is a quick clinic your primary choice in medical care? a. Yes b. No c. Prefer not to respond
12. Do you plan on using a quick clinic for your next medical need? a. Yes b. No c. Unsure d. Prefer not to respond
13. Please enter your x500 below.