Embed Size (px)
Citation preview
1 | P a g e
SAMA RESOURCES INC./RESSOURCES SAMA INC.
MANAGEMENT DISCUSSION AND ANALYSIS
FOR THE PERIOD ENDED MARCH 31, 2016
TSX.V: SME
INDEX
Background ..................................................................................................................................................................................... 2 Company Overview ......................................................................................................................................................................... 2 Overall Performance ....................................................................................................................................................................... 2 First Quarter and Recent Highlights ................................................................................................................................................ 2 Mineral Property Portfolio ................................................................................................................................................................ 3
Samapleu Property (PR123) ........................................................................................................................................................ 3 Mineral Resource .................................................................................................................................................................. 7
Lola Property .............................................................................................................................................................................. 12 Worofla Property ........................................................................................................................................................................ 14 Zérégouiné Property ................................................................................................................................................................... 14 Grata Property ............................................................................................................................................................................ 15
Nickel Industry Trends .................................................................................................................................................................. 15 Selected Financial Data ................................................................................................................................................................ 16 Results of Operations for the three months ended March 31, 2016 .............................................................................................. 17 Liquidity, Cash Flows and Capital Resources ............................................................................................................................... 17 Transactions with Related Parties ................................................................................................................................................. 18 Commitments ................................................................................................................................................................................ 19 Off-Balance Sheet Arrangements ................................................................................................................................................. 19 Conflicts of Interest ....................................................................................................................................................................... 19 Outstanding Share Data ................................................................................................................................................................ 19 Events after the Reporting Period ................................................................................................................................................. 20 Critical Accounting Policies and Estimates ................................................................................................................................... 20 Risks and Uncertainties ................................................................................................................................................................ 20 Corporate Governance .................................................................................................................................................................. 22 Cautionary Statement ................................................................................................................................................................... 22 Additional Information ................................................................................................................................................................... 23
2 | P a g e
Background
Sama Resources Inc./Ressources Sama Inc. (the “Company” or “Sama”) provides this Management Discussion and Analysis (“MD&A”) of financial position and results of operations as of May 26, 2016. This MD&A should be read in conjunction with the unaudited condensed interim consolidated financial statements for the period ended March 31, 2016, and notes thereto as well as the audited annual consolidated financial statements as at December 31, 2015, which have been prepared in accordance with International Financial Reporting Standards (“IFRS”). Except as otherwise disclosed, all dollar figures included therein and in the following MD&A are quoted in Canadian dollars. The Company has prepared this MD&A following the requirements of National Instrument 51-102, Continuous Disclosure Obligations. Company Overview
Sama is a Canadian-based mineral exploration and development business currently with activities in Africa. The Company was incorporated on July 11, 2006 under the Business Corporations Act of British Columbia. On February 5, 2007, the Company completed its initial public offering and the Company’s common shares began trading on the TSX Venture Exchange (the “TSX-V”) as a capital pool company on February 7, 2007. On November 17, 2009, the Company completed its qualifying transaction whereby the Company was granted the right to acquire 100% of the Bonanza Property from Terraco Gold Corp. (“Terraco”). On March 26, 2010, Sama acquired all of the issued and outstanding common shares of Sama Nickel Corporation (“Sama Nickel”), a Canadian-controlled private mineral exploration corporation and its wholly-owned subsidiary Sama Nickel Côte d’Ivoire SARL (“Sama CI”). As a result of this transaction, the Company acquired Sama Nickel’s 100% interest in the Samapleu Project (“Samapleu Property”) located in Côte d’Ivoire, Africa. The Company terminated its option to acquire the Bonanza Property on June 13, 2011. On May 13, 2013, the Company continued its jurisdiction of incorporation from British Columbia into the federal jurisdiction of Canada under the Canada Business Corporations Act and changed its name from Sama Resources Inc. to Sama Resources Inc/Ressources Sama Inc. Overall Performance
During the period ended March 31, 2016, the Company maintained its priority on the Samapleu Property located in Côte d’Ivoire, Africa. The exploration programs and technical disclosure for the Company are designed by Marc-Antoine Audet, P.Geo, PhD, President and Chief Executive Officer of Sama who is a ‘qualified person’, as defined by National Instrument 43-101, Standards for Disclosure for Mineral Projects (“NI 43-101”).
During the period, the Company continued to investigate new properties and mineral claims that show exploration potential and would create shareholder value. As well, the continued exploration success in the vicinity of the Samapleu Property is being continually monitored and evaluated. First Quarter and Recent Highlights
On January 5, 2016, the Company announced that it has obtained a new exploration license contiguous to the Samapleu license to explore for base metals over an 80 square kilometer land package in the Republic of Côte d’Ivoire, West Africa (the “Grata Permit”). The Grata Permit is 100% owned by Sama Nickel Côte d’Ivoire SARL, a fully owned subsidiary of the Company. The Grata Permit is located adjacent to the north-eastern boundary of the Samapleu exploration permit (PR 123). Sama believes that ultramafic sequences of the recently outlined large Yacouba Layered Complex which hosts the Samapleu Nickel-Copper-Palladium deposits, are extending within the Grata Permit and as such represent a prime target for nickel-copper-palladium mineralization. Surface exploration is ongoing and will be followed shortly with exploration holes.
3 | P a g e
Mineral Property Portfolio
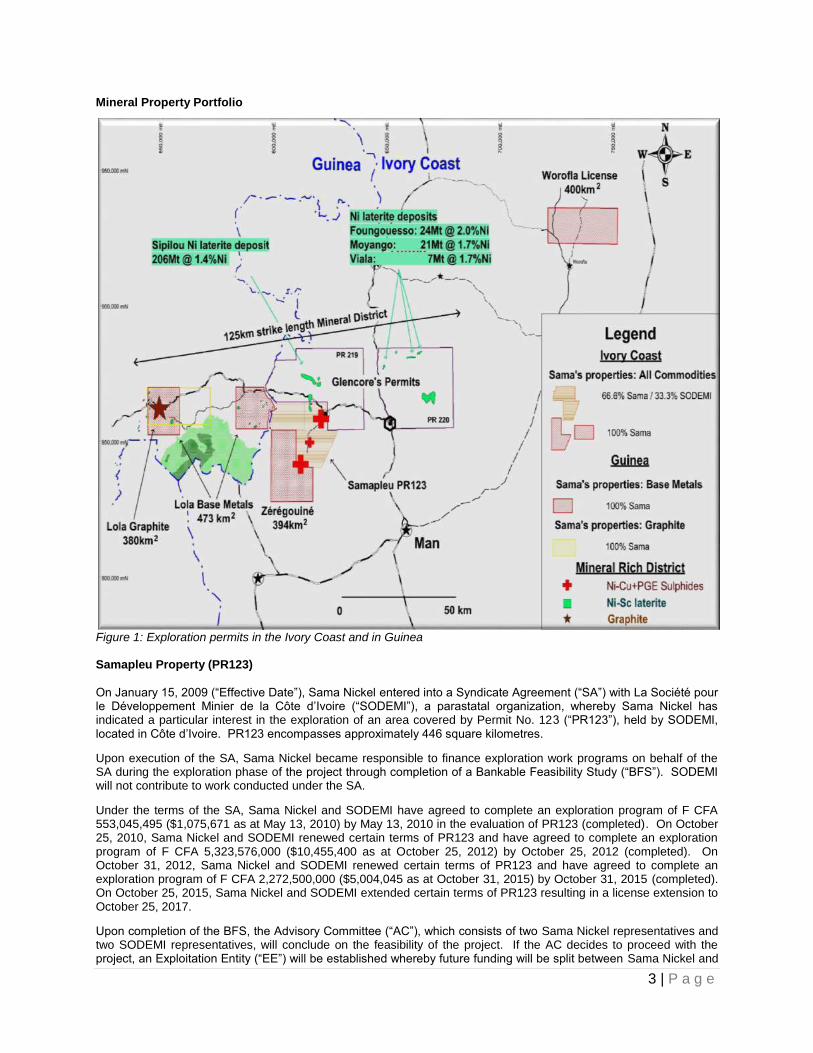
Figure 1: Exploration permits in the Ivory Coast and in Guinea Samapleu Property (PR123)
On January 15, 2009 (“Effective Date”), Sama Nickel entered into a Syndicate Agreement (“SA”) with La Société pour le Développement Minier de la Côte d’Ivoire (“SODEMI”), a parastatal organization, whereby Sama Nickel has indicated a particular interest in the exploration of an area covered by Permit No. 123 (“PR123”), held by SODEMI, located in Côte d’Ivoire. PR123 encompasses approximately 446 square kilometres.
Upon execution of the SA, Sama Nickel became responsible to finance exploration work programs on behalf of the SA during the exploration phase of the project through completion of a Bankable Feasibility Study (“BFS”). SODEMI will not contribute to work conducted under the SA.
Under the terms of the SA, Sama Nickel and SODEMI have agreed to complete an exploration program of F CFA 553,045,495 ($1,075,671 as at May 13, 2010) by May 13, 2010 in the evaluation of PR123 (completed). On October 25, 2010, Sama Nickel and SODEMI renewed certain terms of PR123 and have agreed to complete an exploration program of F CFA 5,323,576,000 ($10,455,400 as at October 25, 2012) by October 25, 2012 (completed). On October 31, 2012, Sama Nickel and SODEMI renewed certain terms of PR123 and have agreed to complete an exploration program of F CFA 2,272,500,000 ($5,004,045 as at October 31, 2015) by October 31, 2015 (completed). On October 25, 2015, Sama Nickel and SODEMI extended certain terms of PR123 resulting in a license extension to October 25, 2017.
Upon completion of the BFS, the Advisory Committee (“AC”), which consists of two Sama Nickel representatives and two SODEMI representatives, will conclude on the feasibility of the project. If the AC decides to proceed with the project, an Exploitation Entity (“EE”) will be established whereby future funding will be split between Sama Nickel and
4 | P a g e
SODEMI at 66.7% and 33.3%, respectively. The EE will reimburse SODEMI for any costs associated with previous exploration work conducted up to a maximum of F CFA 834,999,457 (approximately $1,880,419 as at March 31, 2016) and will reimburse Sama Nickel for costs associated with exploration work conducted between the Effective Date and the approval of the BFS subject to the approval of the AC.
The ownership of the EE shall be allocated as follows:
Sama Nickel 60% SODEMI 30% Côte d’Ivoire Government 10%
100%
If the AC decides not to proceed with the project, SODEMI may, at its sole discretion, terminate the SA and SODEMI would become the owner of all results of the exploration works and all studies associated with infrastructures, for no financial consideration. The Samapleu Property is subject to a 1% net smelter return royalty. Samapleu Nickel-Copper Type Mineralization
Since 2009, the Company’s regional exploration work highlights the prospective potential of the entire PR123 area. In addition to the Samapleu Main deposit and the nickel-cobalt rich laterite Sipilou South deposit, there were several mineralized sectors that have been identified within the PR123 area, including Sama’s discovered Samapleu Extension 1 deposit, the Yorodougou occurrence and the Yepleu occurrence as well as numerous massive chromite showings, all part of the newly discovered Yacouba Layered Complex.
The Samapleu and Yepleu deposits mineralization and geological characteristics are typical of a layered Pipe like Intrusion or conduit‐hosted nickel deposits These rare type of intrusions host the world’s largest nickel‐copper deposits such as: Jinchuan (515 million tonnes (“Mt”) at 1.06% nickel), Voisey Bay (137Mt at 1.68% nickel), Kabanga (52Mt at 2.65% nickel), Eagle (4.5Mt at 3.33% nickel), Eagle Nest (20Mt at 1.68% nickel), Kalatongke (24Mt at 0.68% nickel), and N’komati (2.8Mt at 2.08% nickel). The Yacouba’s mafic and ultramafic hosts were intruded within the older gneissic assemblage of the West Africa’s craton. It is interesting to note that the age for the Yacouba Layered Complex is almost the same as the large and mineral rich South-African Bushveld complex (host of the Ivanhoe’s large Flatreef palladium-Nickel deposit and numerous other chromite+ Platinoid Group Elements deposits as well as the nearby N’Komati nickel-copper-palladium deposit). Samapleu and Yepleu deposits are typical magmatic Nickel‐Copper‐ Plantinum group elements (“PGE”) deposits with
common metallurgical characteristics. Nickel and copper mineralization (pentlandite, chalcopyrite, combined with pyrrhotite, rarely pyrite) correspond to sulphide disseminations ranging from trace to 40% and semi-massive to massive (40% to 100% sulphides) sulphide rich lenses often spatially associated with highly breccia texture in pyroxenites mostly. The semi-massive and massive sulfide veins display a number of characteristics suggesting that they are part of a larger mineralizing system:
1. Extreme variations in nickel:copper ratio indicative of fractionation of sulfides.
2. Association with varied textured and brecciated facies.
3. Presence of an unusual texture called loop texture. Large pyrrhotite crystals (5 centimeters in diameter) are rimmed by smaller chalcopyrite and pentlandite that define a loop that encloses the pyrrhotite. These textures are seen at Norilsk and Voiseys Bay nickel-copper-PGE deposits.
4. Abundant sulfide inclusions (globules) within pyroxene crystal indicating sulfur (S) saturation took place before pyroxene crystallization (at depth).
It is to be noted that the mineralization is open at depth at the Samapleu deposits and remains mostly untested below 200 m from the surface. The mineralization is open at depth but also along strike at the Samapleu Extension 1. The Company’s regional compilation and exploration work highlights the very highly prospective potential of the whole area surrounding these known intersections.
5 | P a g e
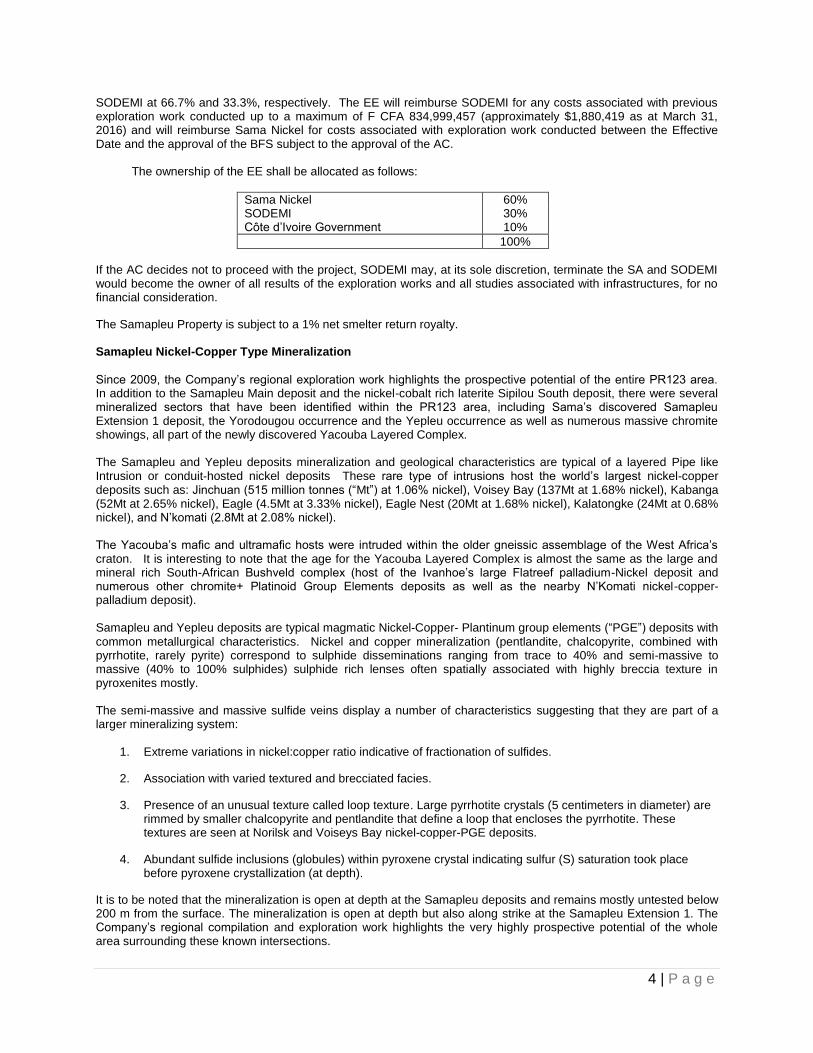
The Company also completed a 13,500 line/km airborne magnetometer and radiometric survey over the Samapleu Property and a portion of the Lola Property; 3,900 line/km of airborne helicopter time domain electromagnetic and magnetic survey (“HTEM”) at the Samapleu Property; and 60 line/km of InfiniTEM ground geophysical survey over Samapleu Main and Extension 1 deposits and the Yepleu Complex. More than 20 priority targets as potential for additional nickel-copper-platinum group elements mineralization have been outlined. Strong conductors were identified at the Samapleu Main and Samapleu Extension 1 deposits as well as along a corridor of more than 25 km oriented north-east. Sama’s drilling programs started in March 2010, by contracting Orex Africa SARL of Abidjan, Côte d’Ivoire, for the drilling requirement. Subsequently, during the course of 2010, Orex Africa SARL changed their name to Global Exploration Services SARL (“GES”). A track mounted YDX-3L wire line drill rig type was used throughout. A total of 211 boreholes for 22,795 m were drilled using these contractors. In 2013, Sama purchased their first Coreteck track mounted CSD1300G wire line drill rig. A second drill rig was purchased in 2014. Since then, all drilling activities were performed internally. Table 1 summarizes the drilling programs from July 2010 to July 2015.
Table 1: Drilling programs from July 2010 to July 2015
Area Contractor drilling Sama Drilling Total lengths
(m)
Borehole m Borehole m
Main Deposit 71 10,630 5 1,590 12,220
Samapleu Extension 1
44 7,044 20 4,513 11,557
Yepleu 20 4,042 4,042
Sipilou Sud Laterite 80 2,688 2,688
Yorodougou 4 735 2 291 1,026
Bounta North chromite
6 659 659
Santa 5 952 952
Regional 12 1,698 1,698
Total 2010-2015 211 22,795 58 12,047 34,842
Near surface exploration at the Samapleu Project (< 150 m deep) returned centrally located massive sulphide vein stock works encased in a thick halo of disseminated sulphide. Nickel and copper tenors of up to 4-5% and 6-8%, respectively, were obtained in massive sulphide material. Eleven boreholes were drilled testing the Tri-dimensional Conductivity Depth Imaging (“CDI”) targets. All high priority CDI targets could be related to the presence of mineralization in various concentrations including semi-massive to massive lenses within what Sama believes to be the mineralized trend extending at depth and also laterally. Hole SM44-693140 intercepted a continuous mineralized zone of 149 m grading 0.30% nickel 0.29% copper, 0.04% cobalt, 0.42 grams per tonne (“gpt”) palladium. The interval started 347 m from surface and included several semi-massive high grade sulphide lenses, including a 30 m combined interval grading 0.50% nickel, 0.89% copper and 0.83 gpt palladium within intercepts of up to 2.06% nickel and 1.54% nickel. Hole SM44-683140B intercepted a total of 91m of mineralized pyroxenite with several semi-massive to massive sulphide stringers and lenses before being terminated within the mineralization due to maximum depth capability of our drill rig. Tenors of up to 6.55% copper and an interval of 3.4 m grading 1.12% nickel, 0.50% copper and 1.61 gpt palladium were intercepted at the bottom of the hole which suggest that the mineralization continued at depth. Hole SM44-428267 intersected 54 m of mineralized pyroxenite, grading 0.96% nickel, 0.76% copper and 0.74 gpt palladium, including a combined 8.0 m of massive sulphide grading 4.08% nickel, 2.43% copper & 2.92 gpt palladium at the Samapleu Main deposit
6 | P a g e
Several holes should be deepened using a more powerful drilling rig in order to fully test the bottom of the pipe-like intrusion that forms the large fold and returns very strong conductivity responses over a strike length of 1.6 km and links the Samapleu Main and the Extension 1 deposits. Drilling results confirm the pipe-like intrusion as a 1.6 km long, large fold linking the Samapleu Main and the Extension 1 deposits and solidifies the geological model at depth. It is planned to perform a down hole electromagnetic survey (“DHTEM”) on hole SM34-626442 (618 m). Samapleu Extension 1 Deposit and the Newly Discovered SM34 Sector
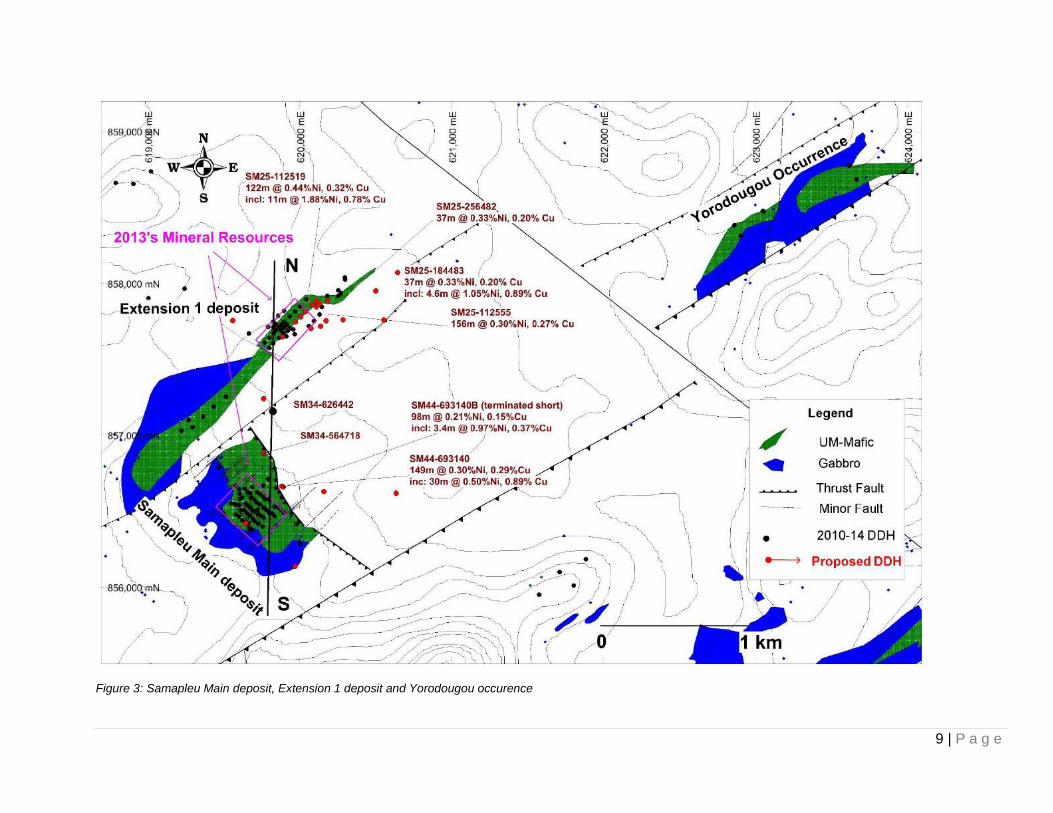
The Samapleu Extension 1 deposit was discovered by Sama in June 2010 and is located 1.3 km to the north of the Samapleu Main deposit. The surface expression of the ultramafic-mafic geological host of the Samapleu Extension 1 deposit and the newly discovered SM34 Sector is approximately 2,000 m long by 50 m to 200 m wide and is still open in both directions. The ultramafic-mafic host is oriented northeast-southwest. Sixty-four boreholes for 11,557 m were drilled since 2010 at the Samapleu Extension 1 deposit. Borehole SM24-112519 returned 122.0 m grading 0.44% nickel and 0.32% copper and 0.94 gpt of palladium, including 11.0 m @ 1.88% nickel, 0.78% copper and 2.84 gpt palladium; borehole SM25-080542 returned 38.5 m at 0.46% nickel and 0.50% copper and 0.85 gpt palladium and 0.12 gpt platinum; and borehole SM25-039587 returned 129.2 m at 0.26% nickel and 0.17% copper, including 0.41 gpt palladium and 0.06 gpt platinum. Yepleu Occurrence
On June 6, 2013, Sama announced the discovery of mineralized surface outcrops grading up to 1.39% nickel and 2.26% copper sulphide (tested using a hand-held Niton XRF analyzer) located 18 km southwest of the Samapleu nickel-copper Deposit. The discovery, named Yepleu, shows outcrops with up to 25% disseminated sulphide mineralization in mafic and ultramafic rocks and strong mineralization seen at surface on several other outcrops along a NW-SE strike length of 1.7 km, with some of them showing continuous mineralized horizon of up to 25 m strike length. The sector corresponds to a strong HTEM chargeability anomaly that covers an area of 6 km by 4 km and appears to be open to the west, southwest and south.
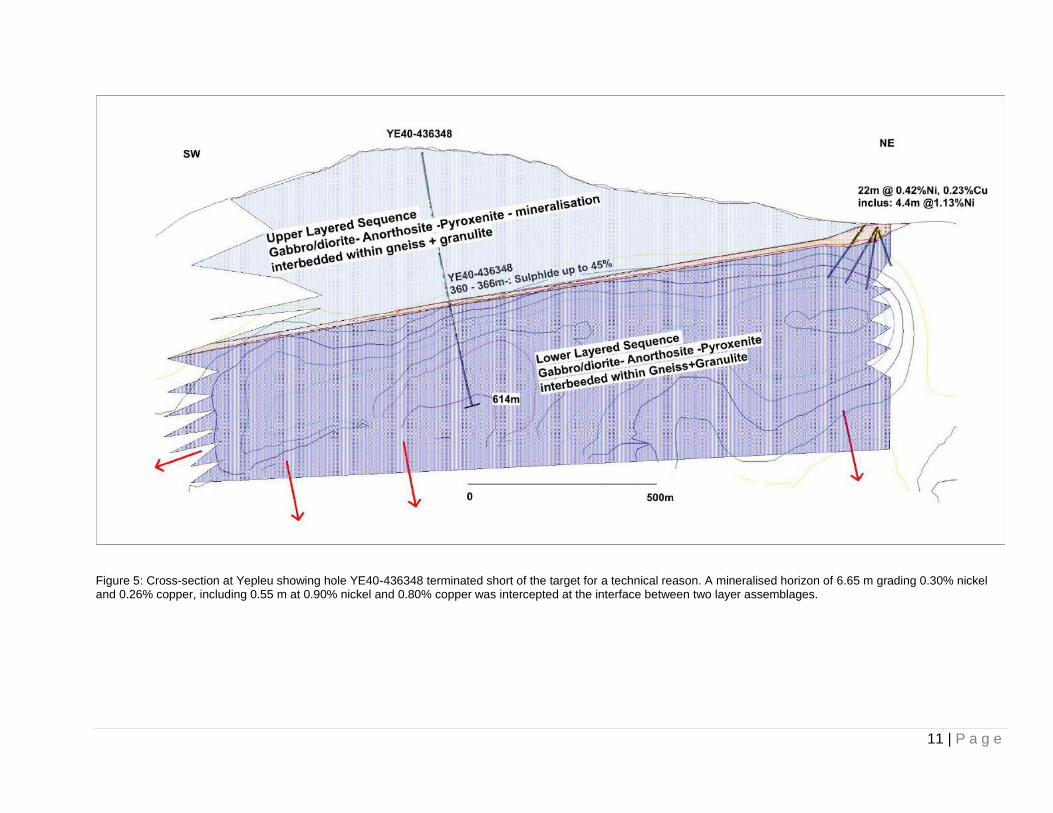
The disseminated mineralization is typically characterised by fine isolated grains to large granular aggregates of nickel, copper and iron sulphides. Sulphide phases observed so far include pyrrhotite, chalcopyrite, pentlandite and minor pyrite. Pentlandite occurs as inclusions in pyrrhotite. Disseminated sulphide occurs as fine grains of 0.5 to 1 millimetre in diameter, showing a high ratio of pyrrhotite versus chalcopyrite. Sulphide veinlets and fine filaments are also present. Composite grains of sulphide material are dominant, forming sulphide masses of odd shapes ranging from a few millimetres up to several centimetres in any one dimension. The semi-massive mineralization lenses show between 30% to 70% sulphide minerals. Hole YE40-438348 (614 m deep) drilled in November 2015 (Figures 4 & 5), aimed at testing the geophysical anomaly interpreted from the 2013 HTEM. As expected, the borehole intercepted a sub-horizontal sequence of 366 m thick of alternating diorite/anorthosite and mafic units, part of the Yacouba layered complex, intruding the Archean gneissic host rock and named the Upper Sequence. A mineralized horizon of 6 m of nickel-copper mineralization, ranging from disseminated to semi-massive sulfides material is located between 360.65 m and 367.30 m, marking the bottom contact of the Upper Sequence. Below 366 m, another layered sequence is present showing a package of diorite/anorthosite together with pyroxenite also intruding the gneissic host rock, named as the Lower Sequence. The borehole was terminated at 614 m for a technical reason, without reaching the targeted depth for the HTEM anomaly. The disseminated and semi-massive sulphide mineralization of borehole YE40-438348 is characterised by aggregates of nickel, copper and iron sulphides, named pentlandite, chalcopyrite and pyrrhotite, respectively. Pentlandite occurs together with pyrrhotite, while the chalcopyrite, being the third mineral of global abundance appears either mixed with the pentlandite or as late sulfide centimetric veins crosscutting the pentlandite-pyrrhotite material. Contacts between the semi-massive sulphide material and the surrounding quartzo-diorite with disseminated sulphides are irregular and sharp indicating that the semi-massive sulphide material has intruded the pyroxenite host originating from a source that is yet to be discovered. Preliminary results using a hand held Niton portable XRF analyser returned an interval of 6.65 m grading 0.30% nickel and 0.26% copper, including 0.55 m at 0.90% nickel and 0.80% copper. This mineralisation is identical in nature to the mineralisation observed near the
7 | P a g e
surface in all the other boreholes drilled in 2014 at the Yepleu prospect. A subset of the 2013 HTEM survey was re-interpreted by the Danish geophysical group Aarhus Geophysics using the Electromagnetic inversion methodology in order to validate Sama’s interpretation. Aarhus’ inversion model confirmed the presence of a conductor and also that the area in the vicinity of the borehole YE40-438348 is the most conductive in the Yepleu area. Sama is planning to perform a DHTEM in YE40-438348 in order to acquire more precision on the target at depth prior of executing the second borehole. It is expected for the DTHEM survey to take place in 2016. Mineral Resource
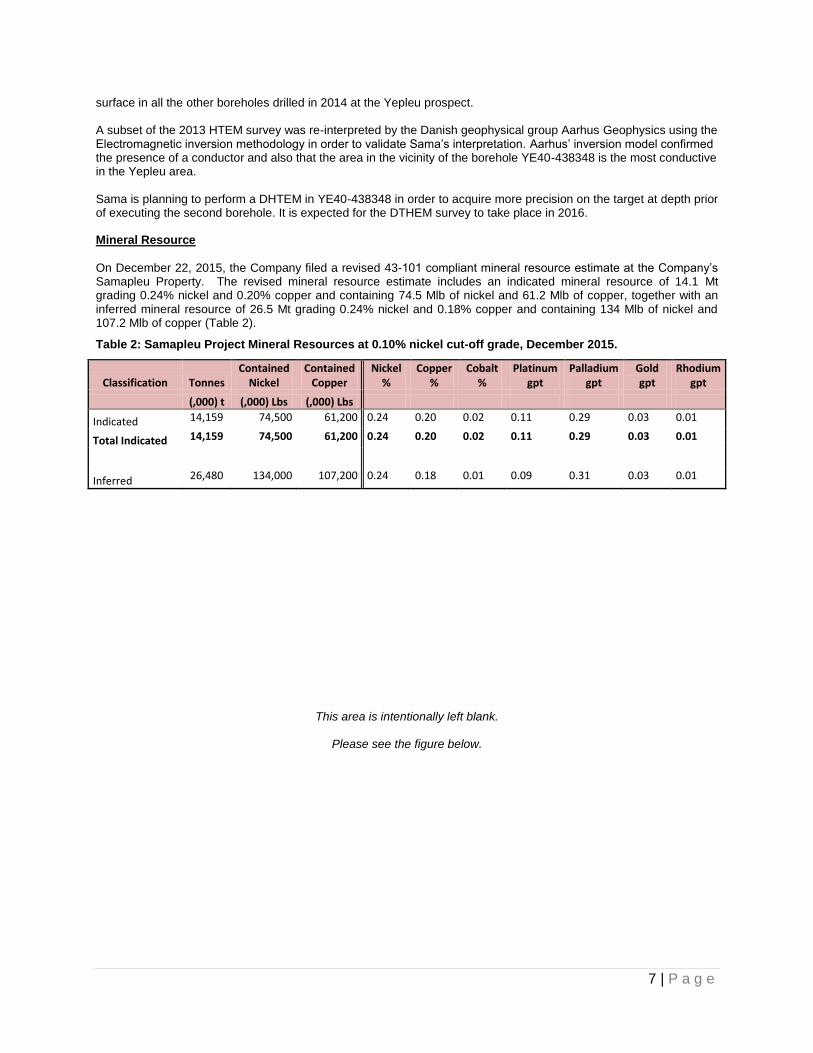
On December 22, 2015, the Company filed a revised 43-101 compliant mineral resource estimate at the Company’s Samapleu Property. The revised mineral resource estimate includes an indicated mineral resource of 14.1 Mt grading 0.24% nickel and 0.20% copper and containing 74.5 Mlb of nickel and 61.2 Mlb of copper, together with an inferred mineral resource of 26.5 Mt grading 0.24% nickel and 0.18% copper and containing 134 Mlb of nickel and 107.2 Mlb of copper (Table 2).
Table 2: Samapleu Project Mineral Resources at 0.10% nickel cut-off grade, December 2015.
Classification Tonnes Contained
Nickel Contained
Copper Nickel
% Copper
% Cobalt
% Platinum
gpt Palladium
gpt Gold gpt
Rhodium gpt
(,000) t (,000) Lbs (,000) Lbs
Indicated 14,159 74,500 61,200 0.24 0.20 0.02 0.11 0.29 0.03 0.01
Total Indicated 14,159 74,500 61,200 0.24 0.20 0.02 0.11 0.29 0.03 0.01
Inferred 26,480 134,000 107,200 0.24 0.18 0.01 0.09 0.31 0.03 0.01
This area is intentionally left blank.
Please see the figure below.
8 | P a g e
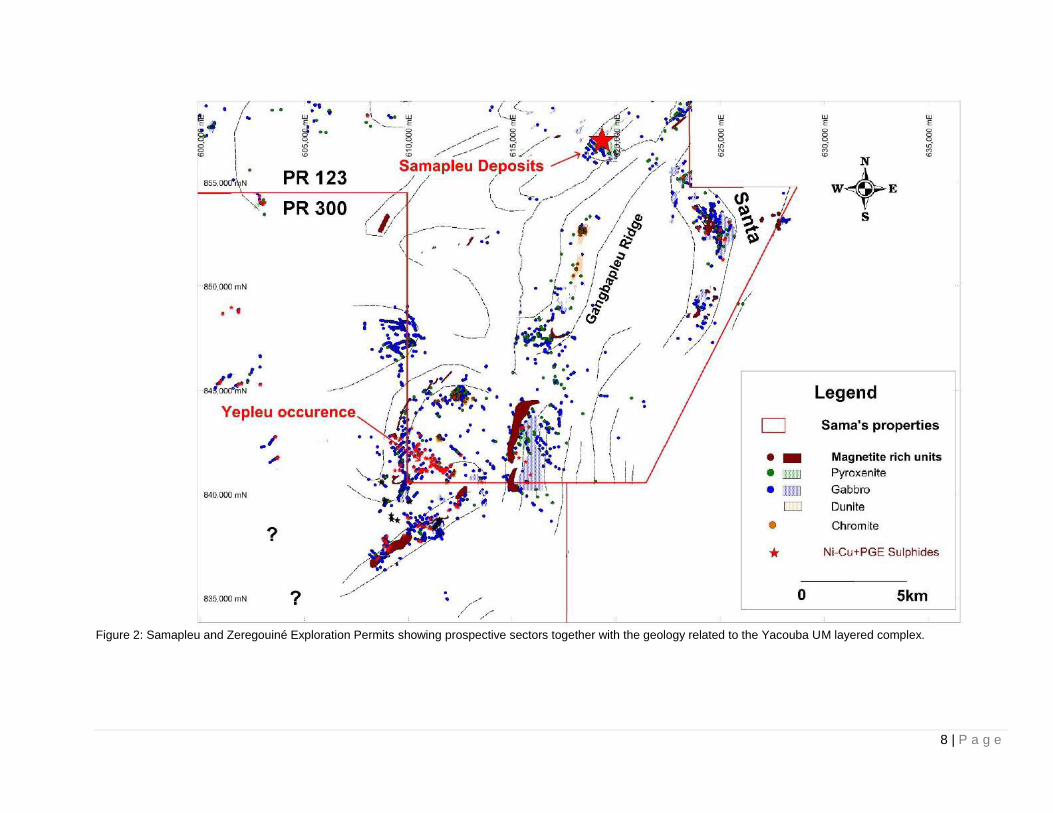
Figure 2: Samapleu and Zeregouiné Exploration Permits showing prospective sectors together with the geology related to the Yacouba UM layered complex.
9 | P a g e
Figure 3: Samapleu Main deposit, Extension 1 deposit and Yorodougou occurence
10 | P a g e
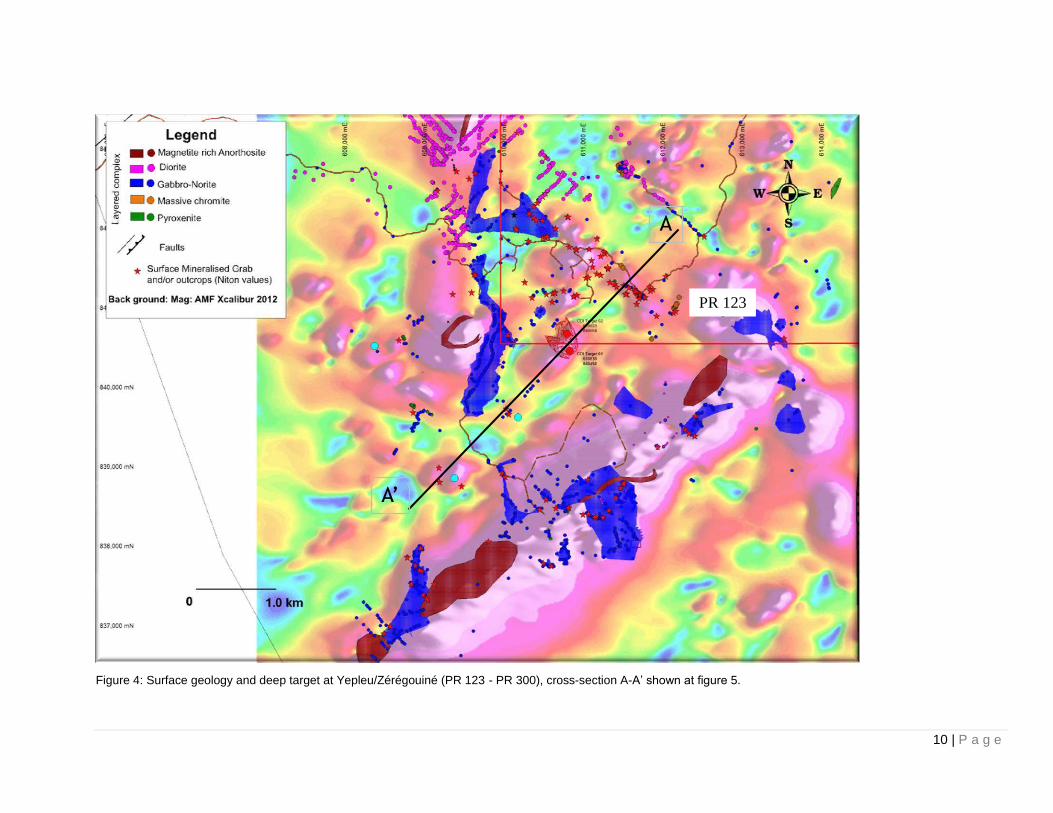
Figure 4: Surface geology and deep target at Yepleu/Zérégouiné (PR 123 - PR 300), cross-section A-A’ shown at figure 5.
A
A’
PR 123
11 | P a g e
Figure 5: Cross-section at Yepleu showing hole YE40-436348 terminated short of the target for a technical reason. A mineralised horizon of 6.65 m grading 0.30% nickel and 0.26% copper, including 0.55 m at 0.90% nickel and 0.80% copper was intercepted at the interface between two layer assemblages.
12 | P a g e
Sipilou South Nickel-Cobalt Laterite Mineralization
The Company has completed 80 boreholes for a total of 2,663 m at the portion of the Sipilou South laterite deposit that falls within PR123. Drilling has been performed on 200 m x 200 m spacing.
The Sipilou South nickel-cobalt laterite deposit is a typical example of nickel and cobalt rich laterites formed in a seasonally wet tropical climate on weathered and partially serpentinized peridotite. The nickel in such deposits is derived from altered olivine, pyroxene and serpentine that constitute the bulk of tectonically emplaced ultramafic oceanic crust and upper mantle rocks. Due to its location in a tropical environment, the Sipilou South nickel-cobalt laterite deposit is defined as a ‘wet’ laterite as opposed to laterites and palaeo-laterites found in arid and temperate climates.
For the three months ended March 31, 2016, the Company capitalized $128,700 at the Samapleu Property, resulting in total deferred exploration and mineral property costs of $17,770,511. Estimated expenditures: The current estimate for expenditures on the Samapleu Property (both corporate and capitalized expenditures) for the year ending December 31, 2016 is approximately $1,000,000.The expenditure estimate is contingent upon obtaining additional financing. Lola Property
On November 5, 2010, the Company obtained three licenses to explore a combined 1,212 square kilometers of
property in the Republic of Guinea, West Africa. On November 21, 2013, the Company obtained five new licenses to explore a combined 473 square kms within the previously held three licenses to explore a combined 1,212 square kilometers. The Company strategically reduced the Lola Property land package by 739 square kilometers. All five licenses have been renewed for a two year term.
The Lola Property is 100% owned by the Company and is located in eastern Guinea, adjacent to the Samapleu Property across the border in Côte d’Ivoire. The Lola Property area includes the entire extension of the geological environment of the Samapleu Property poly-metallic deposit and Sama’s nickel-cobalt-scandium laterite deposit in Côte d’Ivoire.
During the fifteen-month period ended December 31, 2015, management centralized its efforts in order to focus on its core exploration and evaluation assets; as a result, the Company recorded an impairment charge of $959,222 against the carrying value of the Lola Property, as there are no budgeted expenditures on this property in the foreseeable future and the licenses were not renewed at their expiration in November 2015. Lola Graphite Property
On September 2, 2013, the Company obtained four licenses to explore a combined 380 square kilometres of property
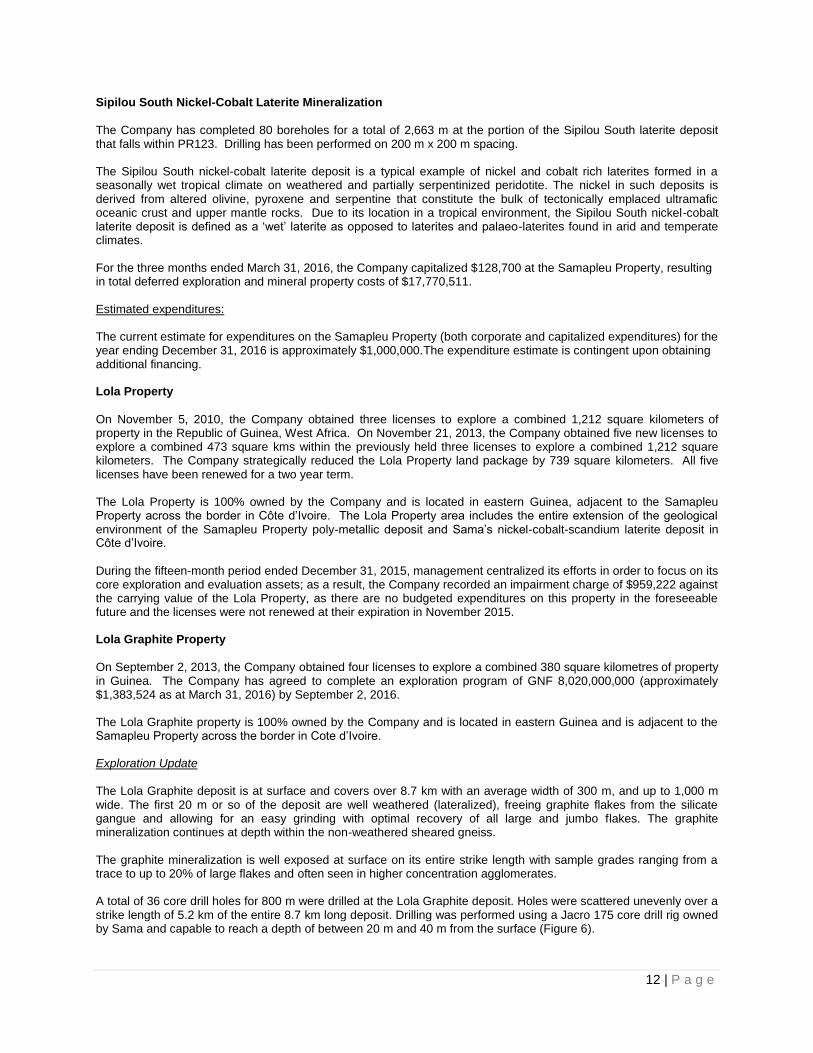
in Guinea. The Company has agreed to complete an exploration program of GNF 8,020,000,000 (approximately $1,383,524 as at March 31, 2016) by September 2, 2016. The Lola Graphite property is 100% owned by the Company and is located in eastern Guinea and is adjacent to the Samapleu Property across the border in Cote d’Ivoire. Exploration Update The Lola Graphite deposit is at surface and covers over 8.7 km with an average width of 300 m, and up to 1,000 m wide. The first 20 m or so of the deposit are well weathered (lateralized), freeing graphite flakes from the silicate gangue and allowing for an easy grinding with optimal recovery of all large and jumbo flakes. The graphite mineralization continues at depth within the non-weathered sheared gneiss. The graphite mineralization is well exposed at surface on its entire strike length with sample grades ranging from a trace to up to 20% of large flakes and often seen in higher concentration agglomerates. A total of 36 core drill holes for 800 m were drilled at the Lola Graphite deposit. Holes were scattered unevenly over a strike length of 5.2 km of the entire 8.7 km long deposit. Drilling was performed using a Jacro 175 core drill rig owned by Sama and capable to reach a depth of between 20 m and 40 m from the surface (Figure 6).
13 | P a g e
In 2014, metallurgical tests were performed on the two of Lola’s prominent mineralized facies, the oxide material and the underlying non-oxide material (below 20 m) with an emphasis on the oxide material. Several mineralogical and petrological studies were also performed by ActLab and through graduate studies at the University of Franche Conté, France. The oxide material returned a global recovery of 94-96% of graphite flakes producing a graphite concentrate with 78% of large and jumbo size flakes. Petrological investigations showed that muscovite and other silicate minerals remained attached to the graphite flakes, thereby affecting the purity of the concentrate. Washing the graphite concentrate in a solution made of sulphuric and HF acids, dissolved and removed muscovite and silicates minerals returning jumbo, large, medium and small flake concentrates to 99.1%, 99.2%, 99.6% and 100% Cg, respectively. For the three month period ended March 31, 2016, the Company capitalized $33,666 at the Lola Graphite Property, resulting in total deferred exploration and mineral property costs of $448,510.
Figure 6: Lola Graphite deposit showing Sama’s shallow boreholes and historical pits Estimated expenditures: The current estimate for expenditures on the Lola Graphite Property (both corporate and capitalized expenditures) for the year ending December 31, 2016 is approximately $450,000. The expenditure estimate is contingent upon obtaining additional financing.
14 | P a g e
Worofla Property
On November 7, 2012, the Company obtained Permit No. 301 (“PR301”) which covers 400 square kilometers
of
property in Côte d’Ivoire, Africa.
In accordance with PR301, the Company must incur expenditure commitments of F CFA 353,000,000 ($769,540 as at November 7, 2015) before November 7, 2015 (expenditure commitment not met). On October 13, 2015, the Company renewed certain terms of PR301 and has agreed to complete an exploration program of F CFA 390,590,000 ($879,609 as at March 31, 2016) by October 13, 2018. Upon renewal, the Worofla Property was reduced to 300 square kilometers. The Worofla Property is 100% owned by the Company and is located 130 kilometres northeast of the Samapleu Property. The Worofla Property was acquired based on its nickel-copper exploration potential. For the three month period ended March 31, 2016, the Company capitalized $192 at the Worofla Property, resulting in total deferred exploration and mineral property costs of $10,867.
Estimated expenditures: The current estimate for expenditures on the Worofla Property (both corporate and capitalized expenditures) for the year ending December 31, 2016 is approximately $20,000. The expenditure estimate is contingent upon obtaining additional financing. Zérégouiné Property
On December 19, 2012, the Company obtained Permit No. 300 (“PR300”) which covers 394 square kms
of property
in Côte d’Ivoire, West Africa. In accordance with PR300, the Company must incur expenditure commitments of F CFA 640,000,000 ($1,468,800 as at December 19, 2015) before December 19, 2015 (expenditure commitment not met). On October 13, 2015, the Company renewed certain terms of PR300 and has agreed to complete an exploration program of F CFA 614,000,000 ($1,382,728 as at March 31, 2016) by October 13, 2018. Upon renewal, the Zérégouiné Property was reduced to 290 square kilometers. The Zérégouiné Property is 100% owned by the Company and is adjacent to the Samapleu Property.
The Zérégouiné Property has been partially explored with surface mapping and geophysical surveys. The regional geological mapping and the HTEM survey have identified that the geological host of the newly discovered Yepleu nickel-copper-palladium mineralization extends to an area as vast as 6 km x 4 km. The Zeregouine Property newly found prospects is outlined by a 6.5 km long strong electromagnetic anomaly with numerous surface gossans and mineralized grab samples including the 8.4%Cu (Niton XRF analyzer). Borehole ZE16-233527, drilled down to a depth of 350 m, aimed at testing the presence of mineralized mafic to ultramafic members of the Yacouba complex responsible for the 6.5 kilometer long electro-magnetic anomaly outlined by the 2013 airborne survey. The borehole successfully intersected 210 m of prospective mafic member showing mineralization from disseminated to up to 20% sulphide. Downhole geophysical surveys together with additional drilling are needed to fully evaluate the prospect. For the three month period ended March 31, 2016, the Company capitalized $46,516 at the Zérégouiné Property, resulting in total deferred exploration and mineral property costs of $1,016,932. Estimated expenditures: The current estimate for expenditures on the Zérégouiné Property (both corporate and capitalized expenditures) for the year ending December 31, 2016 is approximately $1,500,000. The expenditure estimate is contingent upon obtaining additional financing.
15 | P a g e
Grata Property
On December 9, 2015, the Company obtained Permit No. 604 (“PR604”) which covers 80 square kilometres
of
property in Côte d’Ivoire.
In accordance with PR604, the Company must incur expenditure commitments of F CFA 663,000,000 (approximately $1,493,243 as at March 31, 2016) before December 9, 2019. The Grata Property is 100% owned by the Company and is located adjacent to the north-eastern boundary of the Samapleu Property. For the three month period ended March 31, 2016, the Company capitalized $46,709 at the Grata Property, resulting in total deferred exploration and mineral property costs of $46,709.
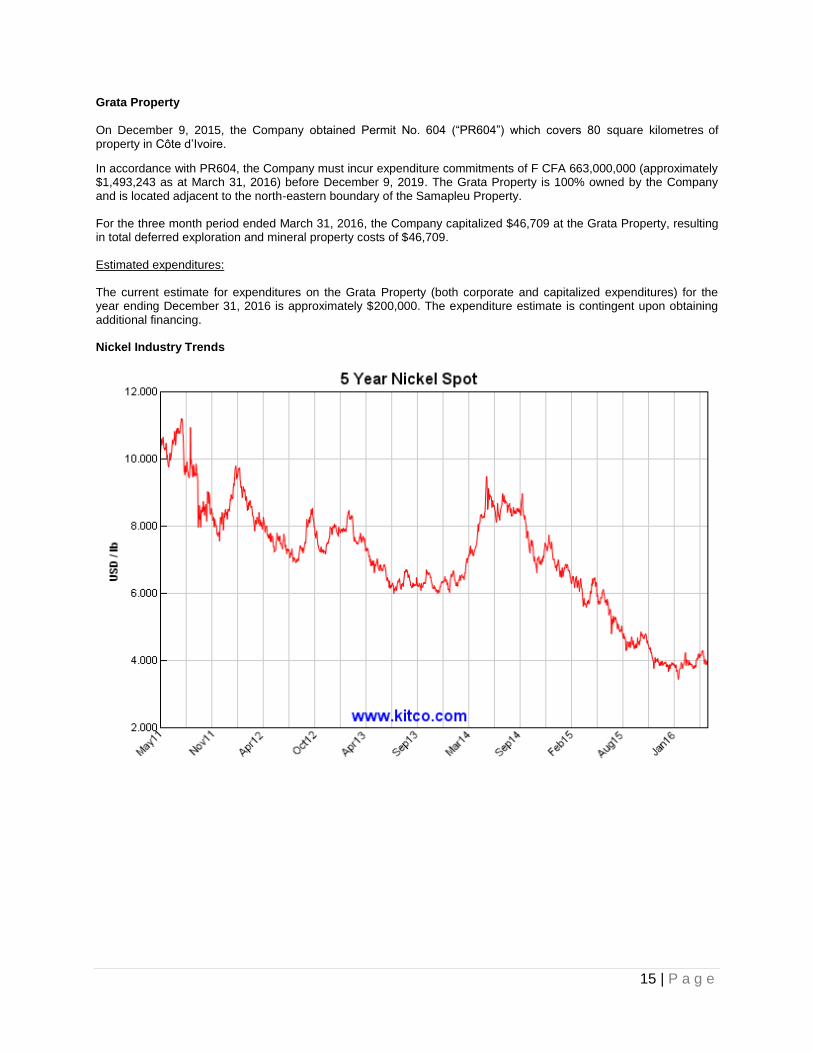
Estimated expenditures: The current estimate for expenditures on the Grata Property (both corporate and capitalized expenditures) for the year ending December 31, 2016 is approximately $200,000. The expenditure estimate is contingent upon obtaining additional financing. Nickel Industry Trends
16 | P a g e
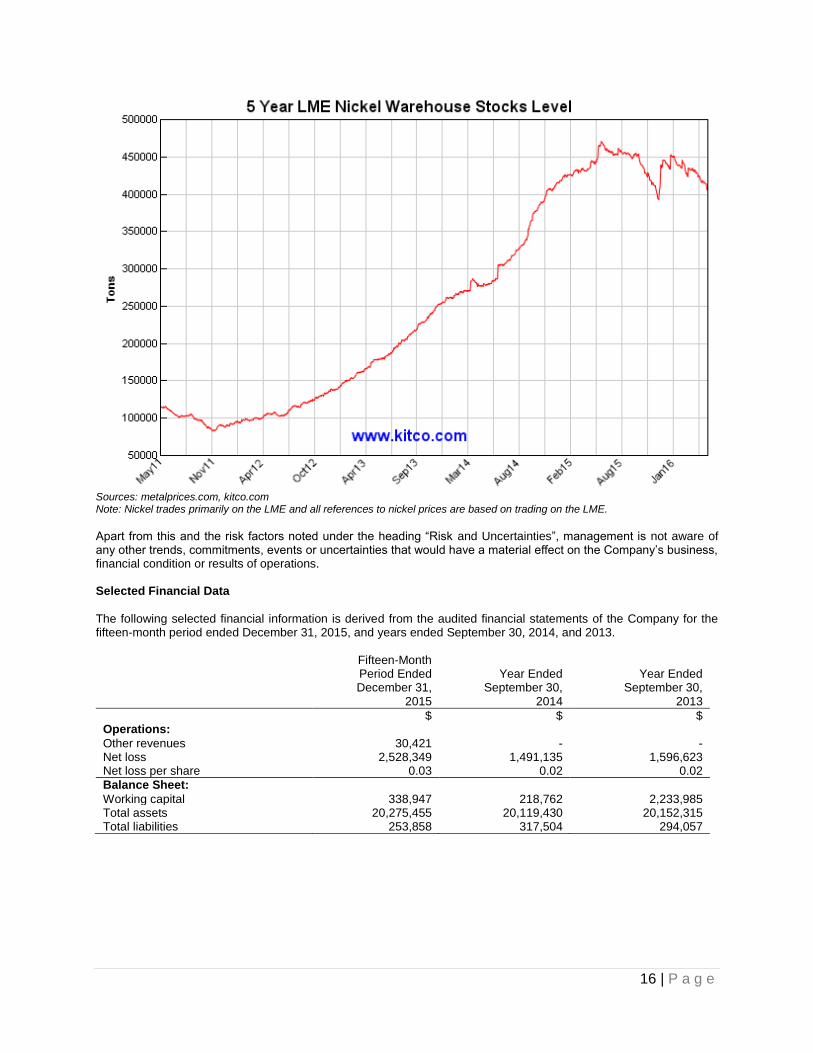
Sources: metalprices.com, kitco.com Note: Nickel trades primarily on the LME and all references to nickel prices are based on trading on the LME. Apart from this and the risk factors noted under the heading “Risk and Uncertainties”, management is not aware of any other trends, commitments, events or uncertainties that would have a material effect on the Company’s business, financial condition or results of operations. Selected Financial Data
The following selected financial information is derived from the audited financial statements of the Company for the fifteen-month period ended December 31, 2015, and years ended September 30, 2014, and 2013.
Fifteen-Month Period Ended December 31,
2015
Year Ended
September 30, 2014
Year Ended
September 30, 2013
$ $ $ Operations: Other revenues 30,421 - - Net loss 2,528,349 1,491,135 1,596,623 Net loss per share 0.03 0.02 0.02
Balance Sheet: Working capital 338,947 218,762 2,233,985 Total assets 20,275,455 20,119,430 20,152,315 Total liabilities 253,858 317,504 294,057
17 | P a g e
The following selected financial information is derived from the condensed interim consolidated financial statements of the Company prepared in accordance with IFRS.
Three Months Ended
March 31, 2016
Three Months Ended
December 31, 2015
Three Months Ended
September 30, 2015
Three Months Ended
June 30, 2015
Three Months Ended
March 31, 2015
Three Months Ended
December 31, 2014
Three Months Ended
September 30, 2014
Three Months Ended
June 30, 2014
$ $ $ $ $ $ $ $ Operations:
Revenues - 30,421 - - - - - -
Net income (loss) (224,549) (256,908) (1,256,793) (376,619) (276,660) (361,369) (339,989) (336,702) Net loss per share 0.00 0.00 0.01 0.00 0.00 0.00 0.00 0.00
Balance Sheet: Working capital* (11,837) 338,947 837,747 93,133 548,139 980,330 218,762 1,014,490
Total assets 20,090,550 20,275,455 20,495,827 20,565,027 20,776,122 21,172,385 20,119,430 20,265,416
*Working capital is a measure of current assets less current liabilities. Results of Operations for the three months ended March 31, 2016
For the three months ended March 31, 2016, the Company recorded a net loss of $224,549 versus a net loss of $276,660 incurred during the three months ended March 31, 2015. The decrease in net loss during the current quarter is due primarily to decreases in consulting ($35,782), insurance ($13,224), office supplies, utilities, and rent ($13,482), and travel ($22,793), as well as an increase in gross profit ($12,803). The decrease in consulting expense is primarily due to the cessation of certain advisory services and a reduction of consulting fees. The decrease in insurance expense is due to coverage changes in Africa, resulting in decreased premiums. The decrease in office supplies, utilities and rent is due to the closure of an office in Guinea, as well as a lower office rent amount for the Vancouver office. The decrease in travel expenditures is due to increased efforts to reduce expenditures. The increase in gross profit is due to the continuation of revenue generating contracts for bulldozing and other drilling preparation services, which commenced in November 2015. These decreases in net loss were partially offset by increases in professional fees ($18,603) and stock-based compensation ($23,278). The increase in professional fees is due from the allocation of audit fees recorded for the current period as a result of the recent change in year end from September 30 to December 31. The increase in stock-based compensation is due from the timing of stock option grants and the related vesting. Liquidity, Cash Flows and Capital Resources
Three months ended March 31
Sources and Uses of Cash 2016 2015 Cash used in operations prior to changes in working capital $ (173,039) (248,379) Changes in non-cash working capital (22,122) (72,871)
Cash used in operating activities (195,161) (321,250) Cash used in investing activities (174,328) (325,918) Cash provided by financing activities - 21,446
Change in cash and cash equivalents $ (369,489) $ (625,722)
Operating Activities For the three months ended March 31, 2016, cash used in operating activities, prior to changes in non-cash working capital, was $173,039 compared to $248,379 used in the three months ended March 31, 2015 (“Prior Three Month Period”). The decrease in cash used is due primarily to the decreased general and administrative cash expenditures as outlined under the “Results of Operations” section. For the three months ended March 31, 2016, non-cash working capital increased by $22,122, as compared to an increase of $72,871 for the Prior Three Month Period. The increase in non-cash working capital during the three month period ended March 31, 2016 is primarily the result of a decrease in accounts payable of $11,286, and an increase in taxes receivable of $6,185. For the three months ended March 31, 2016, cash used in operating activities was $195,161, compared to $321,250 for the Prior Three Month Period.
18 | P a g e
Investing Activities
For the three months ended March 31, 2016, cash used in investing activities was $174,328, which primarily reflects expenditures on mineral property interests. For the Prior Three Month Period, the total cash used for investing activities was $325,918, which also primarily reflects expenditures on the mineral property interests. Financing Activities
For the three months ended March 31, 2016, cash provided by financing activities was $Nil. In the Prior Three Month Period, cash provided by financing activities was $21,446. The Company’s principal source of liquidity is cash which is raised by way of the sale of common shares from treasury. Liquidity At March 31, 2016, the Company had a working capital deficit of $11,837 (December 31, 2015 - $338,947), which consisted of current assets of cash totaling $122,182 (December 31, 2015 - $491,671); $51,969 (December 31, 2015 - $45,784) in taxes receivable; $19,165 (December 31, 2015 - $7,682) in other amounts receivable and $30,593 (December 31, 2015 - $27,564) in prepaid expenses and deposits. Current liabilities included accounts payable and accrued liabilities of $243,297 (December 31, 2015 - $251,166), and unearned revenue of $Nil (December 31, 2015 - $2,692). The Company’s cash position is highly dependent on its ability to raise cash through financing to fund expenditures on its mineral properties. In order to finance the potential development of its mineral properties and cover administrative and overhead expenses, the Company may raise money through equity sales, from the exercise of convertible securities and from optioning exploration and evaluation assets. Many factors influence the ability to raise funds, including the economic climate for mineral exploration investment, the Company’s track record, and the experience and calibre of its management. Actual funding requirements may vary from those planned due to a number of factors. As results of exploration programs are determined and other opportunities become available, the Company may complete an external financing as required. Although Sama has been able to access external financing to date, there can be no assurance that funding will be available in the future or available on acceptable terms. Transactions with Related Parties
(a) Transactions with key management personnel:
During the three months ended March 31, 2016, the Company paid consulting fees of $22,336 (March 31, 2015 – $29,644) and office administration fees of $7,875 (March 31, 2015 – $11,250) to officers and directors or corporations controlled by officers and directors. During the three months ended March 31, 2016, the Company paid exploration and evaluation fees of $7,767 (March 31, 2015 – $37,001) to a corporation controlled by a director. All of these fees have been capitalized to the Company’s exploration and evaluation assets. During the three months ended March 31, 2016, the Company incurred stock-based compensation of $37,926 (March 31, 2015 – $12,431) to officers and directors.
As at March 31, 2016, $1,120 (December 31, 2015 - $14,539) is due to corporations controlled by a director or officer. These amounts are included in accounts payable and accrued liabilities.
(b) Transactions with other related parties:
During the three months ended March 31, 2016, the Company paid $4,065 (March 31, 2015 - $5,114) to corporations with a director or officers in common, for professional fees, office supplies, utilities and rent. During the three months ended March 31, 2016, the Company paid Nil (March 31, 2015 – a reversal of $13,000) in directors’ fees.
19 | P a g e
In addition to the above: The Company entered into a management services agreement with a company controlled by the President and Chief Executive Officer for the services of Marc-Antoine Audet to act as the Company’s Chief Executive Officer and President. The management service agreement provides for a base monthly fee of $15,147 and is effective as of November 24, 2010 (as amended on May 3, 2011, January 26, 2015 and April 19, 2016). The term of the management services agreement is indefinite, but the engagement of the management consultant and the agreement may be terminated by either party. The Company entered into a management services agreement with a company controlled by the Chief Financial Officer for the services of Bryan McKenzie to act as the Company’s Chief Financial Officer. The management service agreement provides for a base monthly fee of $6,798 and is effective as of May 8, 2013 (amended January 22, 2014). The term of the management services agreement is indefinite, but the engagement of the management consultant and the agreement may be terminated by either party.
Commitments
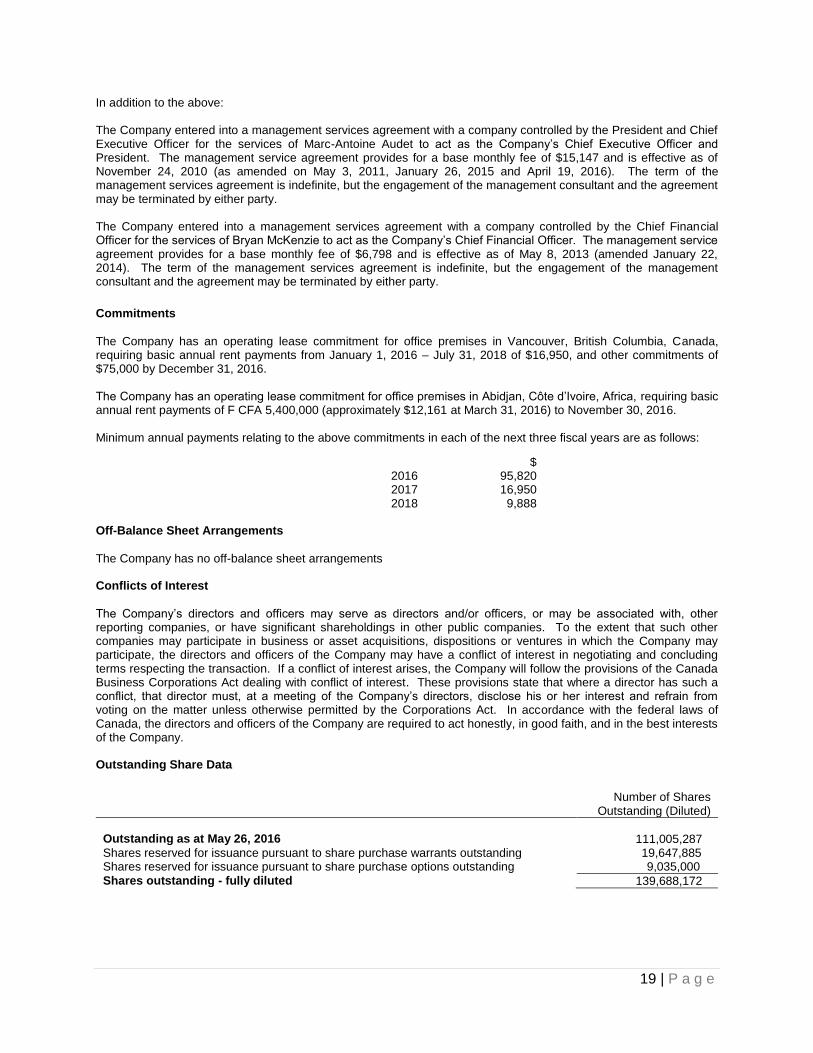
The Company has an operating lease commitment for office premises in Vancouver, British Columbia, Canada, requiring basic annual rent payments from January 1, 2016 – July 31, 2018 of $16,950, and other commitments of $75,000 by December 31, 2016. The Company has an operating lease commitment for office premises in Abidjan, Côte d’Ivoire, Africa, requiring basic annual rent payments of F CFA 5,400,000 (approximately $12,161 at March 31, 2016) to November 30, 2016. Minimum annual payments relating to the above commitments in each of the next three fiscal years are as follows:
$ 2016 95,820 2017 16,950 2018 9,888
Off-Balance Sheet Arrangements
The Company has no off-balance sheet arrangements Conflicts of Interest
The Company’s directors and officers may serve as directors and/or officers, or may be associated with, other reporting companies, or have significant shareholdings in other public companies. To the extent that such other companies may participate in business or asset acquisitions, dispositions or ventures in which the Company may participate, the directors and officers of the Company may have a conflict of interest in negotiating and concluding terms respecting the transaction. If a conflict of interest arises, the Company will follow the provisions of the Canada Business Corporations Act dealing with conflict of interest. These provisions state that where a director has such a conflict, that director must, at a meeting of the Company’s directors, disclose his or her interest and refrain from voting on the matter unless otherwise permitted by the Corporations Act. In accordance with the federal laws of Canada, the directors and officers of the Company are required to act honestly, in good faith, and in the best interests of the Company. Outstanding Share Data
Number of Shares
Outstanding (Diluted)
Outstanding as at May 26, 2016
111,005,287
Shares reserved for issuance pursuant to share purchase warrants outstanding 19,647,885 Shares reserved for issuance pursuant to share purchase options outstanding 9,035,000
Shares outstanding - fully diluted 139,688,172
20 | P a g e
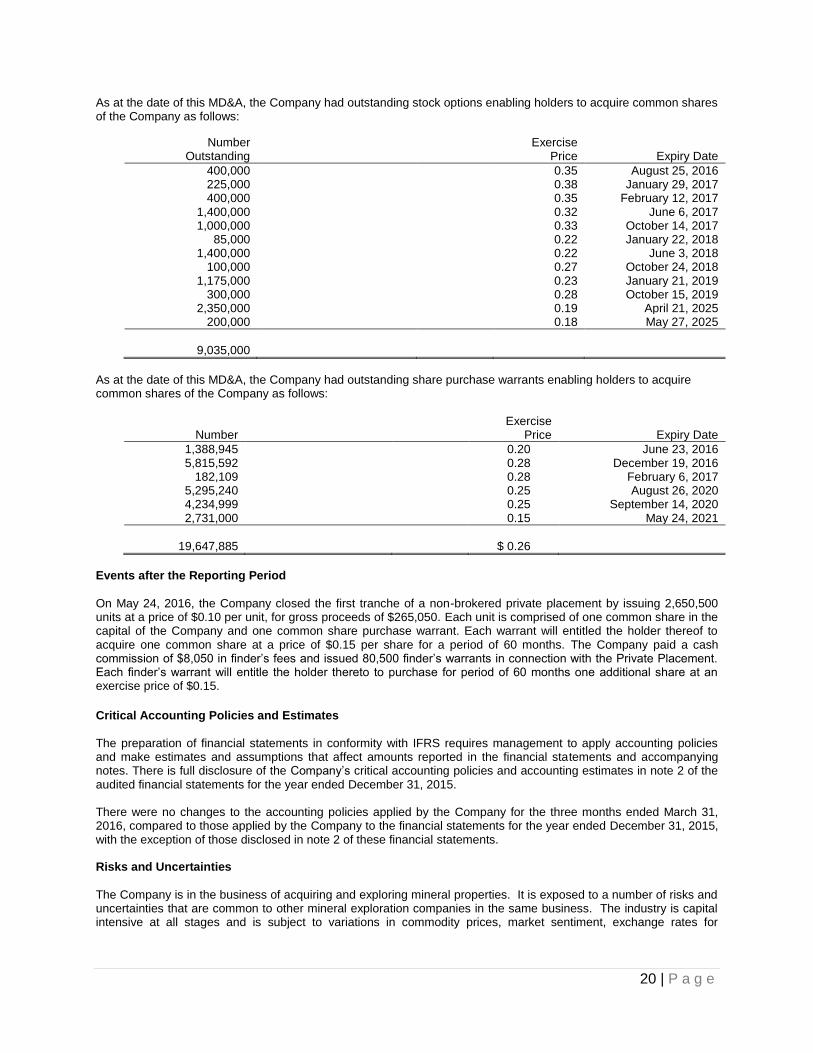
As at the date of this MD&A, the Company had outstanding stock options enabling holders to acquire common shares of the Company as follows:
Number Outstanding
Exercise Price
Expiry Date
400,000 0.35 August 25, 2016 225,000 0.38 January 29, 2017 400,000 0.35 February 12, 2017
1,400,000 0.32 June 6, 2017 1,000,000 0.33 October 14, 2017
85,000 0.22 January 22, 2018 1,400,000 0.22 June 3, 2018
100,000 0.27 October 24, 2018 1,175,000 0.23 January 21, 2019
300,000 0.28 October 15, 2019 2,350,000 0.19 April 21, 2025
200,000 0.18 May 27, 2025
9,035,000
As at the date of this MD&A, the Company had outstanding share purchase warrants enabling holders to acquire common shares of the Company as follows:
Number
Exercise Price
Expiry Date
1,388,945 0.20 June 23, 2016 5,815,592 0.28 December 19, 2016
182,109 0.28 February 6, 2017 5,295,240 0.25 August 26, 2020 4,234,999 0.25 September 14, 2020 2,731,000 0.15 May 24, 2021
19,647,885 $ 0.26
Events after the Reporting Period
On May 24, 2016, the Company closed the first tranche of a non-brokered private placement by issuing 2,650,500 units at a price of $0.10 per unit, for gross proceeds of $265,050. Each unit is comprised of one common share in the capital of the Company and one common share purchase warrant. Each warrant will entitled the holder thereof to acquire one common share at a price of $0.15 per share for a period of 60 months. The Company paid a cash commission of $8,050 in finder’s fees and issued 80,500 finder’s warrants in connection with the Private Placement. Each finder’s warrant will entitle the holder thereto to purchase for period of 60 months one additional share at an exercise price of $0.15.
Critical Accounting Policies and Estimates
The preparation of financial statements in conformity with IFRS requires management to apply accounting policies and make estimates and assumptions that affect amounts reported in the financial statements and accompanying notes. There is full disclosure of the Company’s critical accounting policies and accounting estimates in note 2 of the audited financial statements for the year ended December 31, 2015. There were no changes to the accounting policies applied by the Company for the three months ended March 31, 2016, compared to those applied by the Company to the financial statements for the year ended December 31, 2015, with the exception of those disclosed in note 2 of these financial statements. Risks and Uncertainties
The Company is in the business of acquiring and exploring mineral properties. It is exposed to a number of risks and uncertainties that are common to other mineral exploration companies in the same business. The industry is capital intensive at all stages and is subject to variations in commodity prices, market sentiment, exchange rates for
21 | P a g e
currency, inflation and other risks. The Company currently has no source of revenue other than interest on cash balances. The Company will rely mainly on equity financing to fund exploration activities on its mineral properties. The risks and uncertainties described in this section are not inclusive of all the risks and uncertainties to which the Company may be subject.
Early Stage – Need for Additional Funds
The Company has no history of profitable operations and its present business is at an early stage. As such, the Company is subject to many risks common to other companies in the same business, including under-capitalization, cash shortages and limitations with respect to personnel, financial and other resources and the lack of revenues. There is no assurance that the Company will be successful in achieving a return on shareholders’ investment and the likelihood of success must be considered in light of its early stage of operations. Exploration and Development
Mineral exploration and development is a speculative business, characterized by a number of significant risks including, among other things, unprofitable efforts resulting not only from the failure to discover mineral deposits, but also from finding mineral deposits that, though present, are of insufficient size and/or grade to return a profit from production. All of the mineral claims to which the Company has a right to acquire an interest are in the exploration stages only and are without a known body of commercial ore. Upon discovery of a mineralized occurrence, several stages of exploration and assessment are required before its economic viability can be determined. Development of the subject mineral properties would follow only if favorable results are determined at each stage of assessment. Few precious and base metal deposits are ultimately developed into producing mines. Supplies, Health and Infrastructure
The Company’s property interests are often located in remote, undeveloped areas and the availability of infrastructures such as surfaces access, skilled labour, healthy labour, fuel and power at an economic cost cannot be assured. These are integral requirements for exploration, production and development facilities on mineral properties. In Guinea, power may need to be generated onsite. Title Risks
Although the Company has exercised the usual due diligence with respect to determining title to properties in which it has a material interest, there is no guarantee that title to such properties will not be challenged or impugned. The Company’s mineral property interest may be subject to prior unregistered agreements, transfers, or native claims, and title may be affected by undetected defects. Environmental Regulations, Permits and Licenses
The Company’s operations are subject to various laws and regulations governing the protection of the environment, exploration, development, production, taxes, labour standards, occupational health, waste disposal, safety and other matters. Environmental legislation in most countries provides restrictions and prohibitions on spills, releases or emissions of various substances produced in association with certain mining industry operations, such as seepage from tailings disposal areas, which would result in environmental pollution. A breach of such legislation may result in the imposition of fines and penalties. In addition, certain types of operations require the submission and approval of environmental impact statements. Environmental legislation is evolving in a direction of stricter standards and enforcement, and higher fines and penalties for non-compliance. Environmental assessments of proposed projects carry a heightened degree of responsibility for companies and their directors, officers and employees. The cost of compliance with changes in governmental regulations has the potential to reduce the profitability of operations. The Company intends to fully comply with all environmental regulations. The Company believes that it is in compliance with all material laws and regulations which currently apply to its activities. However, there can be no assurance that all permits which the Company may require for its operations and exploration activities will be obtainable on reasonable terms or on a timely basis, or that such laws and regulations would not have an adverse affect on any mining project which the Company might undertake.
22 | P a g e
Competition and Agreements with Other Parties
The mining industry is intensely competitive in all its phases and the Company competes with other companies that have greater financial resources and technical capacity. Competition could adversely affect the Company’s ability to acquire suitable properties or prospects in the future. The Company may, in the future, be unable to meet its share of costs incurred under such agreements to which it is a party and it may have its interest in the properties subject to such agreements reduced as a result. Also, if other parties to such agreements do not meet their share of such costs, the Company may not be able to finance the expenditures required to complete recommended programs.
Economic Conditions
Unfavorable economic conditions may negatively impact the Company’s financial viability. Unfavorable economic conditions could also increase the Company’s financing costs, decrease net income or increase net loss, limit access to capital markets and negatively impact any of the availability of credit facilities to the Company. The Company’s activities are conducted in Africa. Consequently, the Company is subject to certain risks, including currency fluctuations and possible political or economic instability which may result in the impairment or loss of mining title or other mineral rights, and mineral exploration and mining activities may be affected in varying degrees by political stability and governmental regulations relating to the mining industry. Dependence on Management The Company is very dependent upon the personal efforts and commitment of its existing management. To the extent that management’s services would be unavailable for any reason, a disruption to the operations of the Company could result, and other persons would be required to manage and operate the Company. Operating Hazards and Risks
Mining operations involve many risks which even a combination of experience, knowledge and careful evaluation may not be able to overcome. In the course of exploration, development and production of mineral properties, certain risks, and in particular unexpected or unusual geological operating conditions, including rock bursts, cave-ins, fires, flooding and earthquakes, may occur. Operations in which the Company has a direct or indirect interest will be subject to all the hazards and risks normally incidental to exploration, development and production of mineral deposits, any of which could result in damage to or destruction of mines and other producing facilities, damage to life and property, environmental damage and possible legal liability for any or all damage. Although the Company maintains liability insurance in an amount which it considers adequate, the nature of these risks is such that liabilities could exceed policy limits, in which event the Company could incur significant costs that could have a materially adverse effect upon its financial conditions. Corporate Governance
Management of the Company is responsible for the preparation and presentation of the condensed interim and annual consolidated financial statements and notes thereto, MD&A and other information contained in this MD&A. Additionally, it is management’s responsibility to ensure the Company complies with the laws and regulations applicable to its activities. Cautionary Statement
The Company’s unaudited condensed interim consolidated financial statements for the three months ended March 31, 2016, and this accompanying MD&A contain statements that constitute “forward-looking statements” within the meaning of National Instrument 51-102, Continuous Disclosure Obligations of the Canadian Securities Administrators. Forward-looking statements often, but not always, are identified by the use of words such as “seek”, “anticipate”, “believe”, “plan”, “estimate”, “expect”, “targeting” and “intend” and statements that an event or result “may”, “will”, “should”, “could”, or “might” occur or be achieved and other similar expressions. Forward-looking statements in this MD&A include statements regarding the Company’s future exploration plans and expenditures, the satisfaction of rights and performance of obligations under agreements to which the Company is a part, the ability of the Company to hire and retain employees and consultants and estimated administrative assessment and other expenses. The forward-looking statements that are contained in this MD&A involve a number of risks and
23 | P a g e
uncertainties. As a consequence, actual results might differ materially from results forecast or suggested in these forward-looking statements. Some of these risks and uncertainties are identified under the heading “RISKS AND UNCERTAINTIES” in this MD&A. Additional information regarding these factors and other important factors that could cause results to differ materially may be referred to as part of particular forward-looking statements. The forward-looking statements are qualified in their entirety by reference to the important factors discussed under the heading “RISKS AND UNCERTAINTIES” and to those that may be discussed as part of particular forward-looking statements. Forward-looking statements involve known and unknown risks, uncertainties, assumptions and other factors that may cause the actual results, performance or achievements of the Company to be materially different from any future results, performance or achievements expressed or implied by the forward-looking statements. Factors that could cause the actual results to differ include market prices, exploration success, continued availability of capital and financing, inability to obtain required regulatory approvals and general market conditions. These statements are based on a number of assumptions, including assumptions regarding general market conditions, the timing and receipt of regulatory approvals, the ability of the Company and other relevant parties to satisfy regulatory requirements, the availability of financing for proposed transactions and programs on reasonable terms and the ability of third-party service providers to deliver services in a timely manner. Forward-looking statements contained herein are made as of the date of this MD&A and the Company disclaims any obligation to update any forward-looking statements, whether as a result of new information, future events or results or otherwise. There can be no assurance that forward-looking statements will prove to be accurate, as actual results and future events could differ materially from those anticipated in such statements. Accordingly, readers should not place undue reliance on forward-looking statements. Approval
The Audit Committee of the Company has approved the disclosure contained in this MD&A. Additional Information
Additional information relating to the Company is on SEDAR at www.sedar.com and at the Company’s website www.samaresources.com.