Embed Size (px)
Citation preview

SAM: Soft Tissue Sarcoma ASTRO
March 23rd 2013
Kaled M. Alektiar, M.D. Dept. Of Radiation Oncology
Memorial Sloan-Kettering Cancer Center

Disclosure: None

Randomized Trials in Extremity STS
• Amputation vs. surgery and radiotherapy – Rosenberg et al (NCI): Ann Surg 1982
• Surgery alone vs. surgery and radiotherapy – Pisters et al (MSKCC) BRT: JCO, 1996 – Yang et al (NCI) EBRT: JCO, 1998

Amputation vs. WLE+RT NCI Trial
27 ptsWLE+RT
16 ptsAmputation
43 ptsHigh grade STS
Extremity
Rosenberg et al Ann Surg, 1982

Local Control Overall Survival
NCI Amputation Trial

WLE+BRT vs. WLE Alone Trial
86 PTSNO BRT
78 PTSBRT
164 PTS STSEXTREMITY OR TRUNK
WLE
Pisters et al JCO, 1996

Local Control
Time (Months)
200180160140120100806040200
Pro
port
ion
Fre
e of
Loc
al R
ecur
renc
e
1.0
.8
.6
.4
.2
0.0
p = 0.039
Pisters et al JCO, 1996
Overall Survival
Time (Months)
200180160140120100806040200
Pro
porti
on S
urvi
ving
1.0
.8
.6
.4
.2
0.0
p= 0.28
BRT Randomized Trial
BRT NO BRT

WLE Alone vs. WLE+EBRT NCI Trial
44 PTSNO XRT
47 PTSPOST-OP XRT
91 PTS STSEXTREMITYWLE + CT
Yang et al JCO, 1998 ♣: CT for HG
♣
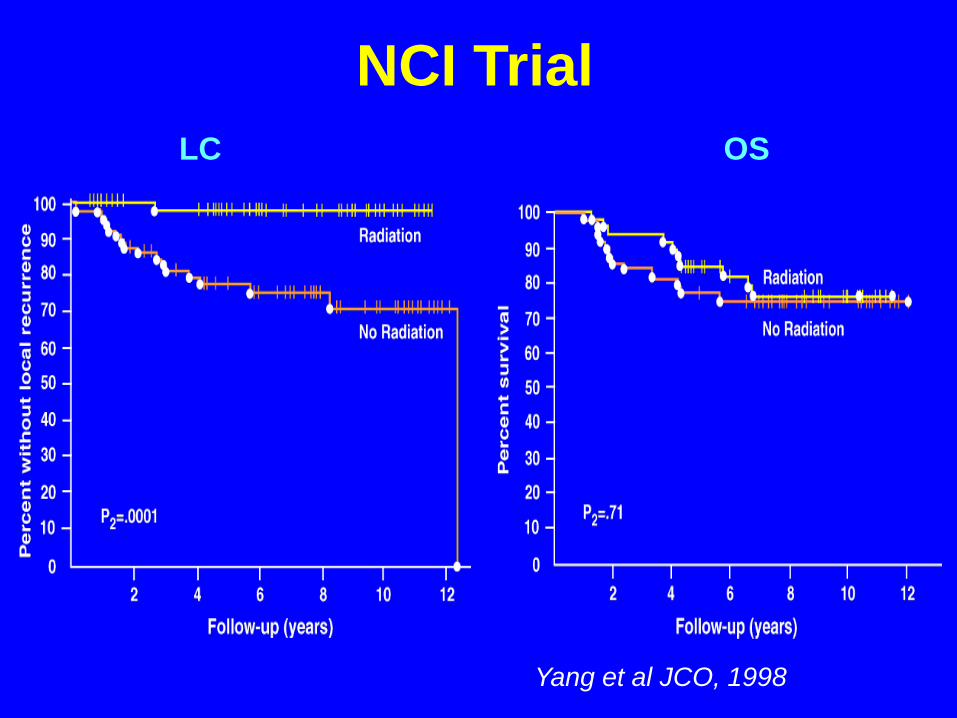
NCI Trial LC OS
Yang et al JCO, 1998

Patients on Two Ends of the Spectrum
Those with very poor local control
Those who are supposed to have good local control

Influence Of Positive Margin On Local Control
Negative Positive p-value
Preop EBRT1 91% 62% 0.005
BRT2 86% 74% 0.04
Postop EBRT3 79% 57% 0.07
1:Tanabe; Cancer 1994, 2:Alektiar; ASO 2002, 3: Suit, JCO 1988.
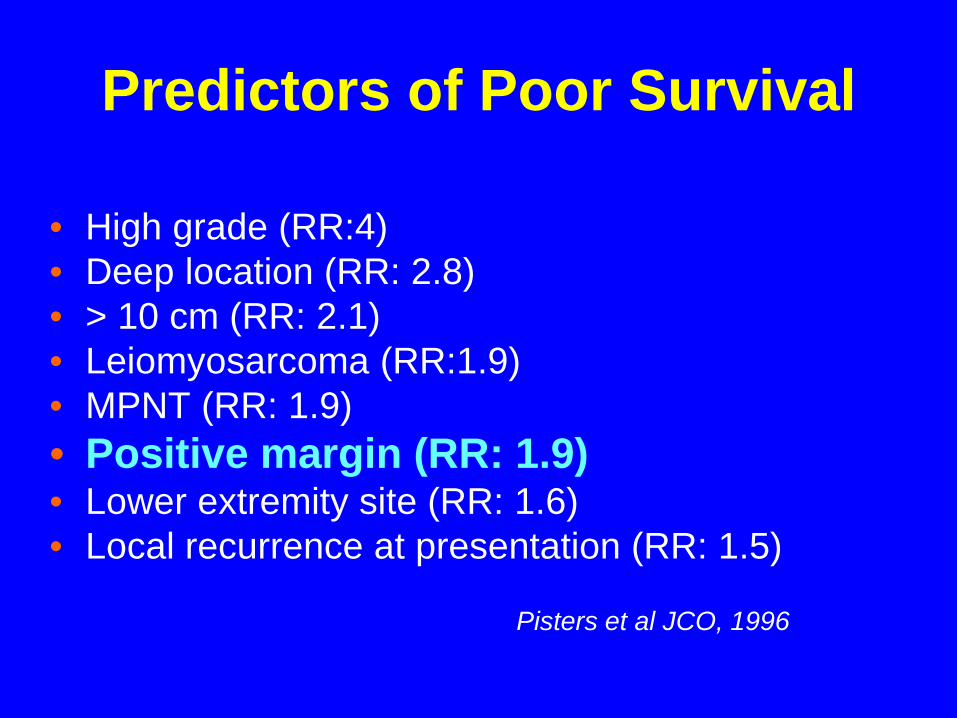
Predictors of Poor Survival
• High grade (RR:4) • Deep location (RR: 2.8) • > 10 cm (RR: 2.1) • Leiomyosarcoma (RR:1.9) • MPNT (RR: 1.9) • Positive margin (RR: 1.9) • Lower extremity site (RR: 1.6) • Local recurrence at presentation (RR: 1.5)
Pisters et al JCO, 1996

Pathologic Negative Re-excision: 200 pts with non-metastatic primary ext STS
S/P WLE and no RT
Cahlon O et al. Cancer 2008
RR p
Age ≥ 50 3.3 0.02
Stage III 3.4 0.01
Median F/U: 82 mo 5-year LR: 9% 5-y LR
None 4% 1 RF 12% 2 RF 31%

Surgery Alone in STS of the Extremity: Selected Series
Author (year) # of pts Selection L Fail D Fail
Karakousis (1986) 116 2 cm margin 10% NR
Rydholm (1991) 56 “Contained” 7% NR
Geer (1992) 117 T1, primary 8% 5%
Respondek (1997) 40 T1, primary 8% NR
Baldini (1999) 74 Not specified 7% 12%

Small (< 5 cm) HG STS Of The Extremity
Alektiar et al JCO 2002
204 Pts WLE
Negative margins
No RT 116/204 (57%)
pts
RT 88/204 (43%) pts

RT
No RT
n = 88 n = 116
p = 0.3
Small (< 5 cm) HG STS Of The Extremity LC & RT
0
20
40
60
80
100
0 5 10 15 20
Pro
po
rtio
n w
ith
Lo
ca
l Co
ntr
ol (
%)
Years

Central (axilla/groin)
Non-Central
n = 176
n = 28
p = 0.007
Small (< 5 cm) HG STS Of The Extremity LC & RT
0
20
40
60
80
100
0 5 10 15 20
Years
Pro
po
rtio
n w
ith
Lo
ca
l Co
ntr
ol (
%)

Cases 40 yo s/p WLE of STS of the thigh:
• 20 cm • Positive margin • Low grade • Well diff liposarcoma
#1 # 2
60 yo s/p WLE of STS of the forearm • 2cm • Negative but close margin • High grade • Leiomyosarcoma

Surgery Alone: Nomogram • 684 pts • Primary extremity STS • Non-metastatic • Treated with WLE • No adjuvant RT or CT
Cahlon O et al. Annl of Surg 2012.
0
0.2
0.4
0 5 10 15 20
• Median F/U: 58 mo • 3-yr LR: 11% • 5-yr LR: 13% •10 yr LR: 19%

Nomogram: 3 & 5 year Local Control: Concordance Probability Estimate (CPE): 0.74
Points 0 10 20 30 40 50 60 70 80 90 100
Age<=50
>50
Size<=5cm
>5cm
MarginNegative
Close or Positive
GradeLow
High
HistologyAtypical Lipoma or Well Diff
Others
Total Points 0 50 100 150 200 250 300 350 400 450
Predicted LR rate at year 30.1 0.2 0.3 0.4 0.5 0.6 0.7
Predicted LR rate at year 50.1 0.2 0.3 0.4 0.5 0.6 0.7 0.8
Recommend: No RT

60 yo s/p WLE of STS of the forearm • 2cm • Negative but close margin • High grade • Leiomyosarcoma
Case 2

Points 0 10 20 30 40 50 60 70 80 90 100
Age<=50
>50
Size<=5cm
>5cm
MarginNegative
Close or Positive
GradeLow
High
HistologyAtypical Lipoma or Well Diff
Others
Total Points 0 50 100 150 200 250 300 350 400 450
Predicted LR rate at year 30.1 0.2 0.3 0.4 0.5 0.6 0.7
Predicted LR rate at year 50.1 0.2 0.3 0.4 0.5 0.6 0.7 0.8
Recommend: RT

Wound Complications♣ NCIC TRIAL
• Reoperation • Hospital admission for IV antibiotics • Deep wound packing ≥ 120 days
O’Sullivan et al Lancet 2002
♣: Prospective data with criteria evaluated weekly to 4 months.

Timing: Preoperative vs. Postoperative RT NCIC
88/180 ptsPreoperative XRT
50 Gy
92/180 ptsPostoperative XRT
66 Gy
180 adult ptsStratified according to size of 10 cm
Randomized
O’Sullivan et al Lancet 2002

Wound Complications NCIC Trial
Preoperative XRT35% (31/88)
Postoperative XRT17% (16/92)
180 adult ptsWound complications
26% (47/180)
p = 0.01 O’Sullivan et al Lancet 2002

Preoperative vs. Postoperative RT NCIC
O’Sullivan et al Lancet 2002

HR of post-op to Log-rank pre-op with 95% CI p-value 1.2 (0.7-2.0) 0.48
Overall survival

Late Complications (> grade 2) NCIC Trial
Pre-op RT Post-op RT p
Fibrosis 31.5% 48.2% 0.07
Stiffness 17.8% 23.2% 0.51
Edema 15.1% 23.2% 0.26
Davis AM et al. Radiother Oncol 2005.

Function by Treatment Arm NCIC Trial
Pre-op RT Post-op RT p
MSTS 60 63 0.08
TESS 64 66 0.17
Davis AM et al. Radiother Oncol 2005.
Musculoskeletal Tumor Society Rating Scale Toronto Extremity Salvage Score

Influence of Site on Complications
103 ptsUpper ExtremityWound re-op 1%
266 ptsLower Extremity
Wound re-op 11%
369 ptsPrimary HG Extremity STS
WLE and RT at MSKCC
p = 0.002 Alektiar K M et al. IJROBP 2005
Two groups were comparable • Size: < vs. ≥ 5 cm • Prior excision • RT type: BRT vs. EBRT • Depth: deep vs. superficial • Margin status

Influence of Subsite: Thigh Compartment
Femur
Sciatic nerve
Femoral vessels
Rimner A et al. Cancer 2008

Complications & Thigh Compartment
Wound re-op Edema Neuropathy
Rimner A et al. Cancer 2008

Why IMRT in Extremity STS?

Can IMRT Reduce The Morbidity in STS?
Bone Fracture in STS Of Extremity
n RT Type % Fracture MSKCC1 UF2
NCI3
PMH4
369 BRT 4% 285 Preop 4% 145 Postop 6% 364 Preop & Postop 6%
1. Alektiar et al Ann Surg Oncol 2002 2. Helmsteder et al Clinc Ortho 2000 3. Stinson et al. IJROBP 1991 4. Holt et al. JBJS 2005

364 lower extremity EBRT and at PMH (1986-98); no chemo.
• Females (6% vs 2%, p = 0.02); > 55 yr (7% vs 1%, p = 0.004) • Cox: age, gender, and RT independent • Median fracture time: 44 mos (range, 12 to 153 months)
Fracture rates: Crude rates 5-yr frequency
Overall 6.3 % 4 %
High-dose (60-66 Gy) 10 % 7 %
Low-dose (50 Gy, 2 % 0.6 % generally pre-op) Holt et al. JBJS 2005

• 205 consecutive patients with thigh STS over 15–years (1982–1997) at MSKCC without bone invasion or bone resection
• 5-year actuarial fracture risk was 29% if resection included periosteum (P = 0.0001)
• Cox regression, entire group: Periosteal excision was the only independent factor
• Separate Cox model, periosteal stripping subset (n = 54): Female gender: 47% risk (P = 0.022) Chemotherapy: 45% risk (P = 0.020) Lin et al. Cancer 1998

Nomogram For RT-associated Femoral Fractures
Gortzak Y et al. Cancer 2010

Dosimetric Predictors of Fracture in Lower Extremity STS
Fracture pts Non fracture pts p
Mean Dose 45 ± 8 Gy 37 ± 11 Gy 0.01
Max. Dose 64±7 Gy 59 ± 8 Gy 0.02
V40 76 ± 17 % 64 ± 22% 0.01
Dickie CI et al IJROBP 2009.

IMRT 3-D
IMRT Dosimetric Advantages
%
GTV PTV
GTV PTV
Hong et al Int J Rad Oncol Biol Phys, 2004
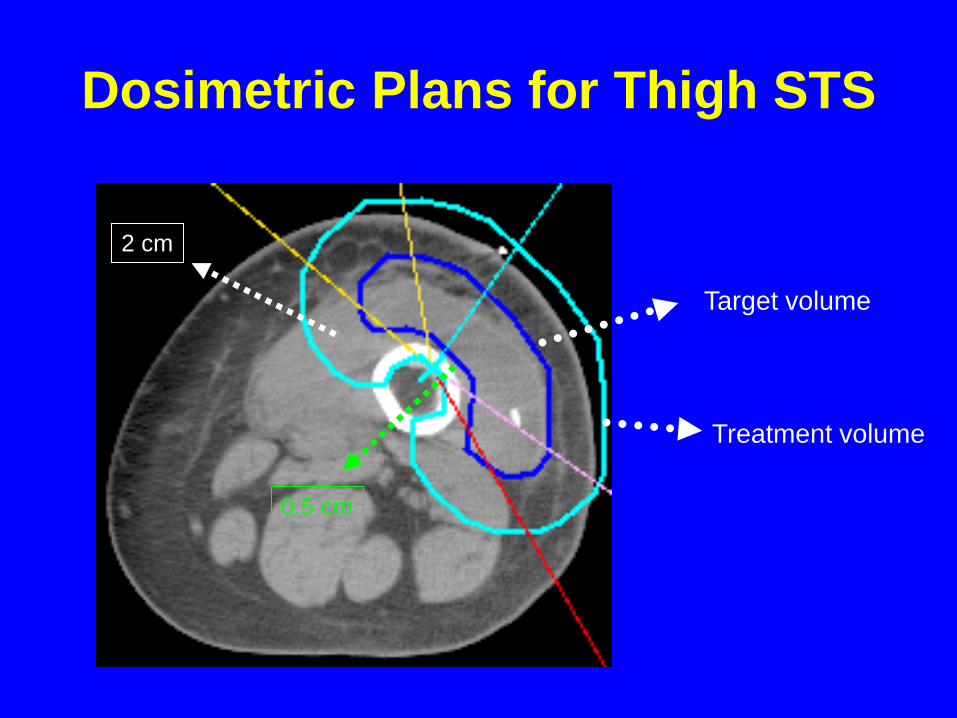
Dosimetric Plans for Thigh STS
Target volume
Treatment volume
2 cm
0.5 cm

IMRT Outcome Data: Preliminary Results for Primary STS
of The Extremity
# pts: 31 Site: Extremity Presentation: Primary STS Time period: 02/02- 03/05 Mean age: 58 (range: 30-80) Sex: 17F/14M
Alektiar KM et al. IJRPBP 2006

Tumors Characteristics % n
Grade High 77 24
Depth Deep 90 28
Tumor size >10 cm 74 23
Site Lower extremity 68 21

Surgery
% n
Complete gross resection 100 31
Positive/close margin 55 17
Periosteal stripping/bone resection 32 10
Neurolysis/nerve resection 65 20
Tissue transfer for wound closure 23 7

Indications For IMRT
• Preoperative IMRT: 7/31 • Preserve normal soft tissue

Indications For IMRT
• Post-op IMRT: 24/31 • To reduce high RT dose
to the whole extremity

Complications of IMRT (%) CTCAE
Grade Dermatitis Wound (non-infectious) Wound (infectious)
0 3 90 87
1 71 3 -
2 16 7 10
3 10 0 3

Complications of IMRT (%) CTCAE
Grade Edema Stiffness Neuropathy
0 68 62 67
1 19 19 28
2 13 19 5
3 0 0 0

Impact of IMRT on LC: Patient Population (n = 41)
n %
High grade 35 83%
> 10 cm 28 67%
Deep 38 90%
Positive/close 22 52%
Bone manipulated 11 26%
Nerve manipulated 25 60%
Alektiar KM et al. JCO 2008

Tumor Control Median Follow-up: 35 months
5-year 95% CI:
LC 94% 86-100
DMFS 62% 46-77
OS 65% 45-85 0
10
20
30
40
50
60
70
80
90
100
0 20 40 60 80Months
Prop
ortio
n Su
rviv
ing
LCDMOS
Alektiar KM et al. JCO 2008

Bone Fractures with IMRT
G1 G2
G3 G3

IMRT vs. BRT

BRT
Pisters et al JCO, 1996
Influence of Grade BRT Randomized Trial
Local Control
High Grade
Time (Months)
200180160140120100806040200
Pro
port
ion
Fre
e of
Loc
al R
ecur
renc
e
1.0
.8
.6
.4
.2
0.0
Local Control
Low Grade
Time (Months)
200180160140120100806040200
Pro
po
rtio
n F
ree
of
Lo
cal R
ecu
rre
nce
1.0
.8
.6
.4
.2
0.0
p = 0.43 p = 0.001
BRT NO BRT

NCI Trial
Yang et al JCO, 1998
LC in HG LC in LG

Type of RT and Time Period: Primary HG Extremity
0%
20%
40%
60%
80%
100%
1989-1994 1995-2000 2001-2006 2007-2011
IMRT3-DBRT

IMRT vs. BRT For Primary HG STS of the Extremity
63 IMRT2/02-12/06
50 Gy pre-op (10 pts)63 Gy post-op (53 pts)
71 BRT1/95-11/0345 Gy LDR
900-1000 cGy/day
All 134 ptsReceived RT at MSKCC
1/1/95-12/31/06
Alektiar KM et al. Cancer 2011

Size (cm) ≤ 10 >10
30 (48%) 33 (52%)
50(70%) 21 (30%)
0.005
Margin Negative Positive/close
32 (51%) 31 (49%)
57 (80%) 14 (20%)
0.006
Bone manipulation Yes No
19 (30%) 44 (70%)
9 (13%) 62 (87%)
0.02
Nerve manipulation Yes No
34 (54%) 29 (46%)
10 (14%) 61 (86%)
0.002
IMRT BRT p
Distribution of Variables
No significant difference based on age, sex, depth, site, and CT

Significant Wound Complications: i.e. IV Antibiotics or Re-operation
IMRT: 12/63 (19%)1/12 re-operation
BRT: 8/71 (11%)4/8 re-operation
All: 20/134 pts (15%)5/20 re-operation
♠
♠: p = 0.6
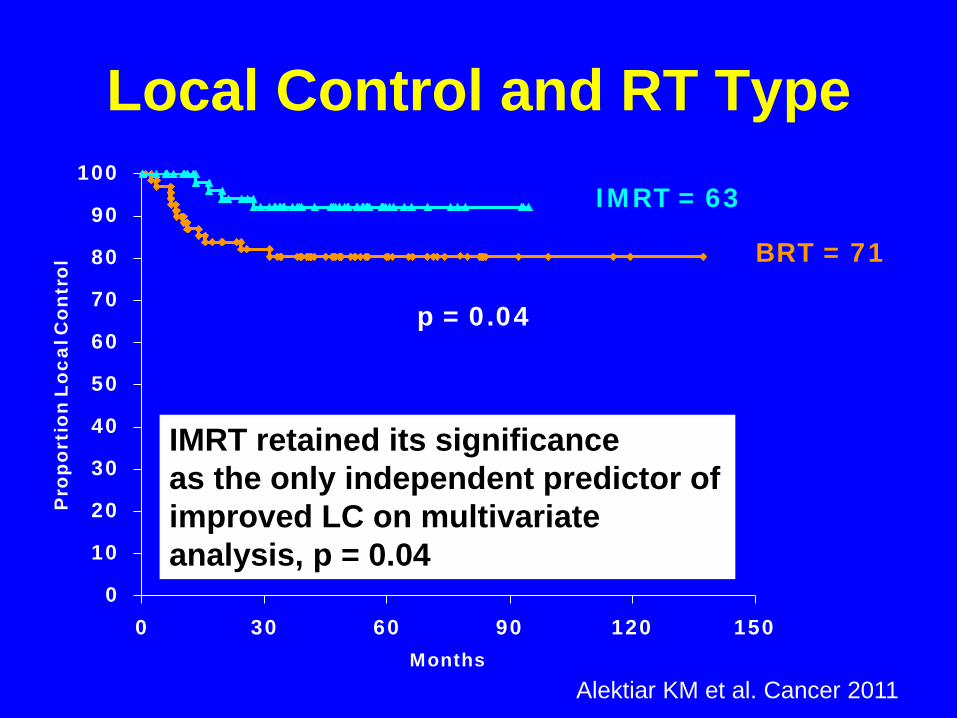
Local Control and RT Type
IMRT retained its significance as the only independent predictor of improved LC on multivariate analysis, p = 0.04
Alektiar KM et al. Cancer 2011
0
10
20
30
40
50
60
70
80
90
100
0 30 60 90 120 150
Pro
port
ion
Loca
l Con
trol
Months
BRT = 71
p = 0.04
IMRT = 63

Updated IMRT Data
104 pts 02/02- 05/08 Primary Extremity Median F/U: 48 mo Size > 10 cm: Only
predictor of poor LC (RR: 2; p = 0.04)
LC DM OS
Alektiar KM et al ASTRO 2011
0102030405060708090
100
0 50 100 150
Prop
ortio
n Su
rviv
ing
Months

IMRT Data Compared to EBRT
88/180 ptsPreoperative XRT
50 Gy
92/180 ptsPostoperative XRT
66 Gy
180 adult ptsStratified according to size of 10 cm
Randomized
O’Sullivan B et al Lancet 2002 34% of all pts were > 10 cm In IMRT study 52% were > 10 cm

Wound avoidance with IMRT: Phase II # of pts: 59 Med size: 9.5 cm High grade: 93% Deep: 98% Wound comp: 30.5%
O’Sullivan B et al Cancer 2013

IMRT Results: PMH # of pts: 59 Tumor size > 10 cm: 44% High grade: 93% Deep: 98% Median F/U: 49 months Local recurrence: 4/59 (6.8%) 5-year LR-free survival: 88.2%
O’Sullivan B et al Cancer 2013

Volume Delineation: Extent of STS Cells Beyond Main Tumor Mass
MRI-Histological Correlation Tissue sampled from tumor to margin
of resection in 6 planes Presence of tumor cells (<1 cm or
>1cm) from nearest tumor edge by light microscopy
White et al Int J Radiat Oncol Biol Phys, 2005
Tumor cells present outside of tumor in 10/15 cases (67%) < 1 cm from tumor = 6/15 > 1 cm from tumor = 4/15

O'Sullivan, et al In: Clinical target volumes in conformal radiotherapy and intensity modulated radiotherapy. Springer: 205-227, 2003.
Does Targeted RT in STS = Less Volume?
GTV ?
CTV

Tumor bed or GTV
CTV
(Tum
or b
ed/G
TV –
CTV
= 4
cm
)
PTV (CTV - PTV = 1 cm)
CTV (tumor bed/GTV – CTV = 1 cm)

Immobilization

Immobilization & Set-up Errors
31 LE STS treated with preop IMRT Interfractional & intrafractional motion measured using CBCT & optical localization system A 5 mm margin of expansion from CTV→PTV is adequate
Dickie C I et al IJROBP. 2010

Patterns of LR in Extremity STS
Scar
RT Field
Marginal LR
In-field LR
Distant LR

Relationship Between LR & RT Field
LR location
Surgical margin status RT scheduling
R0 (%) R1 + R2 ( %) Preop (%) Postop (%) Preop + Boost (%)
Total LR 32 (5.3) 28 (17.0) 32 (6.9) 16 (6.4) 12 (22.1)
In field 26 (4.3) 23 (14.0) 27 (5.8) 12 (4.8) 10 (18.5)
Marginal 0 (0) 2 (1.2) 1 (0.2) 0 (0) 1 (1.8)
Out of field 6 (1.0) 3 (1.8) 4 (0.9) 4 (1.6) 1 (1.8)
Dickie C et al. IJROBP 2012

Patterns of LR (8/104) & Original RT Fields


Volume of LR Receiving 95% of
Prescription Dose*
n %
In-field (completely inside D95%) 3 37.5
Marginal (crossed the D95%) 5 62.5
Distant (completely outside D95%) 0 0
* : Milano MT et al. IJROBP 2010

The Problem of Metastasis

1. 5-10% 2. 10-20% 3. 20-30% 4. > 30%
What is the reported 3-year survival for a 65 y/o male with MFH of the thigh diagnosed 1 year ago and now with lung metastasis ?

RESECTION OF PULMONARY METASTASIS
Complete resection
3-year survival
MSKCC 83% 23%
MDACC 75% 23%
Gadd et al Ann Surg 1993 Lanza et al Ann Thorac Surg 1991
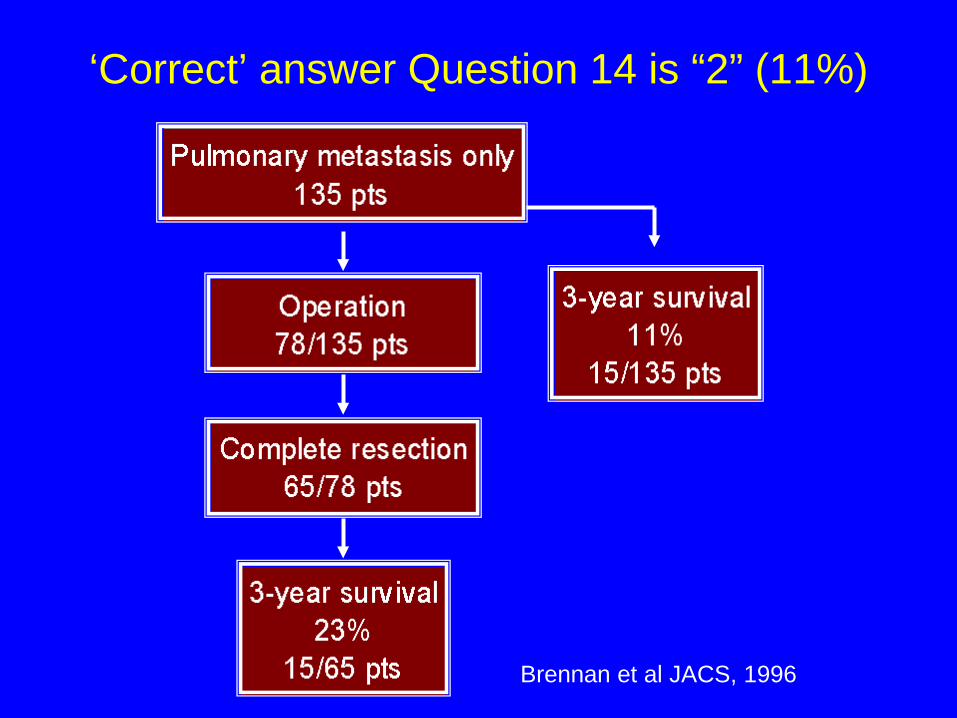
‘Correct’ answer Question 14 is “2” (11%)
Brennan et al JACS, 1996

Sarcoma Meta-analysis Collaboration, Lancet 1997
Adjuvant Chemotherapy Meta-Analysis: 1568 patients, 14 trials
p=0.12 p=0.0003
p=0.0001
p=0.016

Impact of CT on LC
Pervaiz N et al. Cancer 2009

Impact of CT on Distant Metastasis
Pervaiz N et al. Cancer 2009

Impact of CT on OS
Pervaiz N et al. Cancer 2009

CT vs. No CT: Extremity Stage III STS
LC DM DSS
Cormier JN et al. JCO 2004

The Lack of Duration of CT Benefit
Cormier JN et al. JCO 2004

RT/CT for Extremity STS: RTOG 9514
64 pts HG STS ≥ 8 cm 79% completed pre-op CT 59% completed all CT
Kraybill W et al JCO 2006

RTOG 9514: Update
Kraybill W et al Cancer 2010

Node Positive Presentation

Time (Months)
24020016012080400
Prop
ortio
n Su
rviv
ing
1.0
.8
.6
.4
.2
0.0
Soft Tissue Sarcoma Lymph Node vs Other Metastasis
Disease Specific Survival
MSKCC 7/1/82-12/31/00 n = 1051 p = 0.1
Lymph Node n = 160 Other n = 891

Prognosis of Isolated LN Metastases
Royal Marsden Behranwala et al Ann Surg Oncol 11, 2004
Princess Margaret Hospital Riad et al Clin Ortho,426, 2004
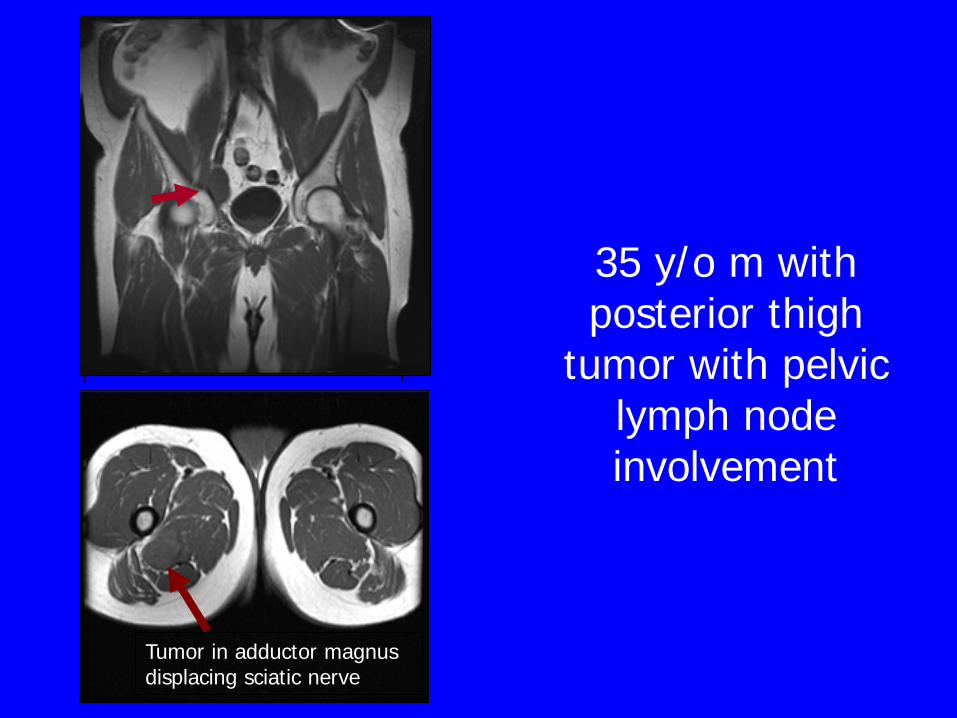
Tumor in adductor magnus displacing sciatic nerve
35 y/o m with posterior thigh
tumor with pelvic lymph node involvement

From: O'Sullivan, B., et al in Gunderson and Tepper, 2nd edition,2006

Advances in the Molecular Biology of STS is Coinciding with RT Technical
Advances Before IMRT 50 Gy 6 wks post-IMRT

Translocations in Myxoid Liposarcoma
Powers MP et al Mod Path 2010
FISH: Split or break apart signals
Bridge J. Univ of Nebraska
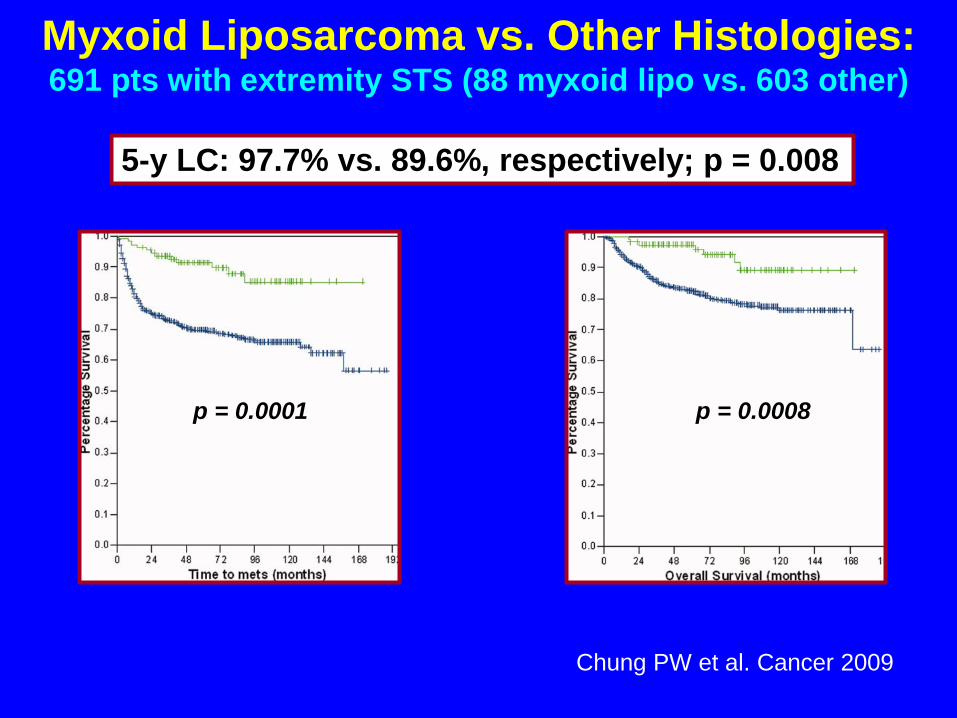
Myxoid Liposarcoma vs. Other Histologies: 691 pts with extremity STS (88 myxoid lipo vs. 603 other)
Chung PW et al. Cancer 2009
5-y LC: 97.7% vs. 89.6%, respectively; p = 0.008
p = 0.0001 p = 0.0008

Spine IGRT
• Spinal mets: T12 • Preop IGRT: 24 Gy • Resection: 6 weeks • Tumor necrosis: 95% • Histology: myxoid lipo.
Schwab et al. Cancer 2007

Genes Alterations in STS Histology Alteration Involved gene(s) %
Synovial t(X;18) (p11;q11) SYT-SSX1, SYT-SSX2 90%
DSRCT t(11;22) (p13;q12) EWS-WT1 90%
Alveolar RMS t(2;13) PAX3-FKHR 85%
Myxoid liposarcoma t(12;16) (q13;p11) TLS (FUS)-CHOP
75%
Myxoid chondrosarcoma t(9;22) (q22;q12) EWS-CHN (TEC) 75%
Clear cell sarcoma t(12;22) (q13;q12) EWS-ATF1 75%

Two groups of MFH: One (red bar) has an abundance of genes associated with muscle and less favorable prognosis The second group (blue bar) carries an inflammatory profile.
Baird D et al. Cancer Res 2005
Prognostic Significance of Gene Profiling within Histology

Barretina J et al Nat Genet. 2010
Copy Number Alterations in STS

Future of STS Treatment
Single Gene Thousands of Genes Genome Wide