Embed Size (px)
Citation preview
View Full Map
IPEDS ID: 217536
OPE ID: 00341100
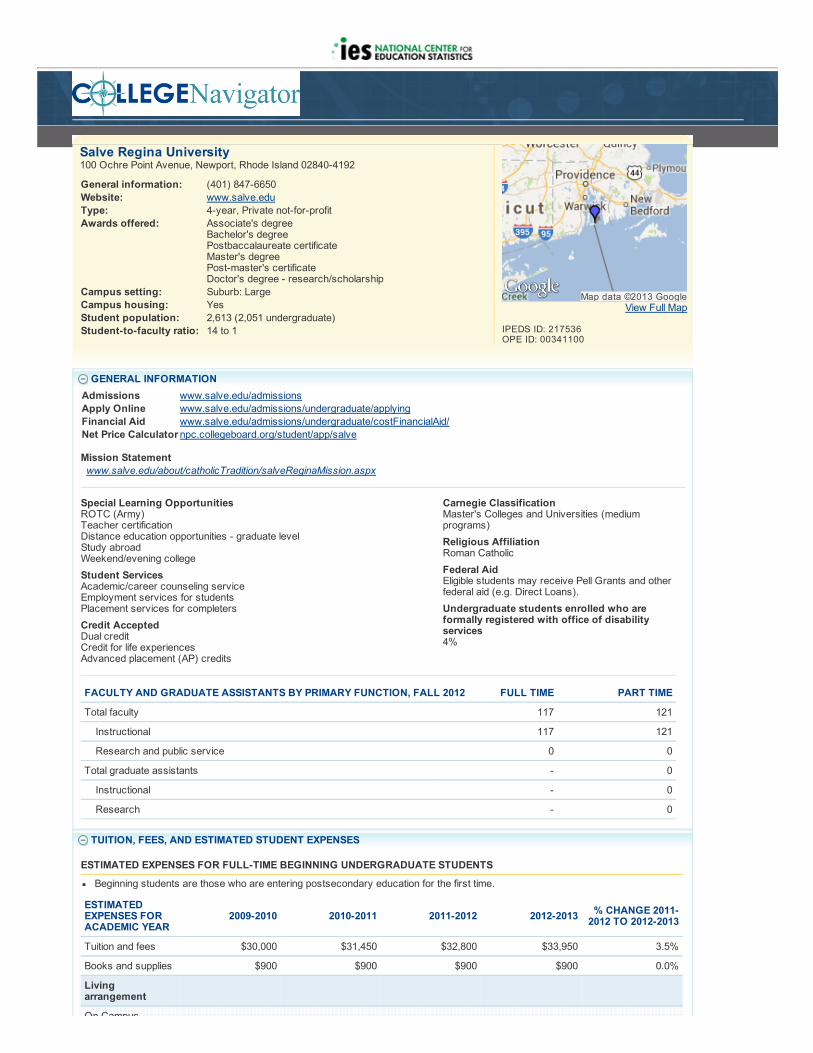
Carnegie ClassificationMaster's Colleges and Universities (medium
programs)
Religious AffiliationRoman Catholic
Federal AidEligible students may receive Pell Grants and other
federal aid (e.g. Direct Loans).
Undergraduate students enrolled who areformally registered with office of disabilityservices4%
General information: (401) 847-6650
Website: www.salve.edu
Type: 4-year, Private not-for-profit
Awards offered: Associate's degree
Bachelor's degree
Postbaccalaureate certificate
Master's degree
Post-master's certificate
Doctor's degree - research/scholarship
Campus setting: Suburb: Large
Campus housing: Yes
Student population: 2,613 (2,051 undergraduate)
Student-to-faculty ratio: 14 to 1
GENERAL INFORMATIONAdmissions www.salve.edu/admissions
Apply Online www.salve.edu/admissions/undergraduate/applying
Financial Aid www.salve.edu/admissions/undergraduate/costFinancialAid/
Net Price Calculatornpc.collegeboard.org/student/app/salve
Mission Statement www.salve.edu/about/catholicTradition/salveReginaMission.aspx
Special Learning OpportunitiesROTC (Army)
Teacher certification
Distance education opportunities - graduate level
Study abroad
Weekend/evening college
Student ServicesAcademic/career counseling service
Employment services for students
Placement services for completers
Credit AcceptedDual credit
Credit for life experiences
Advanced placement (AP) credits
FACULTY AND GRADUATE ASSISTANTS BY PRIMARY FUNCTION, FALL 2012 FULL TIME PART TIME
Total faculty 117 121
Instructional 117 121
Research and public service 0 0
Total graduate assistants - 0
Instructional - 0
Research - 0
TUITION, FEES, AND ESTIMATED STUDENT EXPENSES
ESTIMATED EXPENSES FOR FULL-TIME BEGINNING UNDERGRADUATE STUDENTS
Beginning students are those who are entering postsecondary education for the first time.
ESTIMATEDEXPENSES FORACADEMIC YEAR
2009-2010 2010-2011 2011-2012 2012-2013 % CHANGE 2011-2012 TO 2012-2013
Tuition and fees $30,000 $31,450 $32,800 $33,950 3.5%
Books and supplies $900 $900 $900 $900 0.0%
Livingarrangement
On Campus
Map data ©2013 Google
Salve Regina University100 Ochre Point Avenue, Newport, Rhode Island 02840-4192
On Campus
Room and board $10,950 $11,300 $11,600 $11,950 3.0%
Other $1,800 $1,800 $1,800 $1,800 0.0%
Off Campus
Room and board - - - $9,100 -
Other - - - $1,800 -
Off Campus with
Family
Other - - - $2,000 -
TOTAL EXPENSES 2009-2010 2010-2011 2011-2012 2012-2013 % CHANGE 2011-2012 TO 2012-2013
On Campus $43,650 $45,450 $47,100 $48,600 3.2%
Off Campus $30,900 $32,350 $33,700 $45,750 35.8%
Off Campus with
Family$30,900 $32,350 $33,700 $36,850 9.3%
MULTIYEAR TUITION CALCULATOR
AVERAGE GRADUATE STUDENT TUITION AND FEES FORACADEMIC YEAR 2012-2013
Tuition $8,010
Fees $80
ALTERNATIVE TUITION PLANS
TYPE OF PLAN OFFERED
Tuition guarantee plan
Prepaid tuition plan
Tuition payment plan X
Other alternative tuition plan
FINANCIAL AID
UNDERGRADUATE STUDENT FINANCIAL AID, 2011-2012
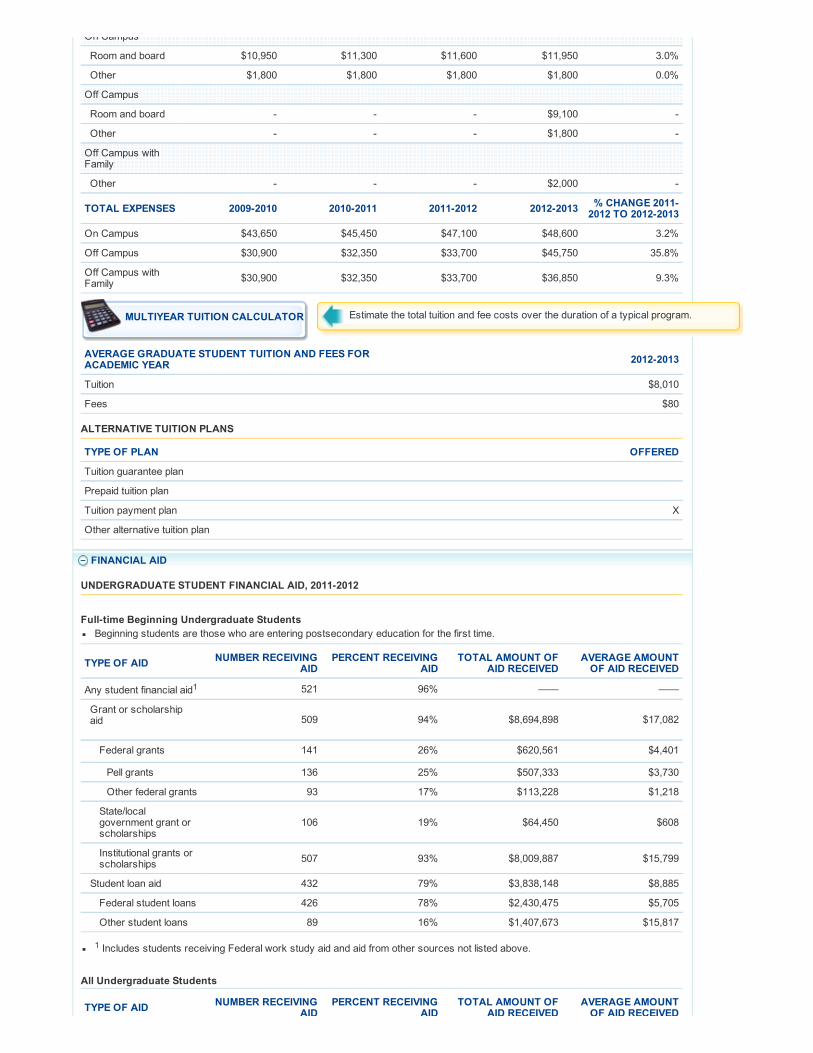
Full-time Beginning Undergraduate StudentsBeginning students are those who are entering postsecondary education for the first time.
TYPE OF AID NUMBER RECEIVINGAID
PERCENT RECEIVINGAID
TOTAL AMOUNT OFAID RECEIVED
AVERAGE AMOUNTOF AID RECEIVED
Any student financial aid1 521 96% —— ——
Grant or scholarship
aid 509 94% $8,694,898 $17,082
Federal grants 141 26% $620,561 $4,401
Pell grants 136 25% $507,333 $3,730
Other federal grants 93 17% $113,228 $1,218
State/local
government grant or
scholarships
106 19% $64,450 $608
Institutional grants or
scholarships507 93% $8,009,887 $15,799
Student loan aid 432 79% $3,838,148 $8,885
Federal student loans 426 78% $2,430,475 $5,705
Other student loans 89 16% $1,407,673 $15,817
1 Includes students receiving Federal work study aid and aid from other sources not listed above.
All Undergraduate Students
TYPE OF AID NUMBER RECEIVINGAID
PERCENT RECEIVINGAID
TOTAL AMOUNT OFAID RECEIVED
AVERAGE AMOUNTOF AID RECEIVED
Estimate the total tuition and fee costs over the duration of a typical program.

Visit this institution's net price calculator
AID AID AID RECEIVED OF AID RECEIVED
Grant or scholarshipaid1 1,729 85% $28,597,142 $16,540
Pell grants 503 25% $1,884,902 $3,747
Federal student loans 1,473 73% $10,150,611 $6,891
1 Grant or scholarship aid includes aid received, from the federal government, state or local government, the institution, and othersources known by the institution.
For more information on Student Financial Assistance Programs or to apply for financial aid via the web, visit Federal Student Aid.
NET PRICE
AVERAGE NET PRICE FOR FULL-TIME BEGINNING STUDENTS
Full-time beginning undergraduate students who were awarded grant or scholarship aid from federal, state or local
governments, or the institution.
2009-2010 2010-2011 2011-2012
Average net price $25,651 $28,852 $30,018
Full-time beginning undergraduate students who were awarded Title IV aid by income.
AVERAGE NET PRICE BY
INCOME2009-2010 2010-2011 2011-2012
$0 – $30,000 $15,518 $18,961 $23,047
$30,001 – $48,000 $16,219 $20,936 $22,544
$48,001 – $75,000 $18,391 $25,479 $26,143
$75,001 – $110,000 $24,290 $28,253 $29,538
$110,001 and more $32,499 $33,731 $34,813
Average net price is generated by subtracting the average amount of federal, state/local government, or institutional grant orscholarship aid from the total cost of attendance. Total cost of attendance is the sum of published tuition and required fees, booksand supplies, and the weighted average for room and board and other expenses.Beginning students are those who are entering postsecondary education for the first time.Title IV aid to students includes grant aid, work study aid, and loan aid. These include: Federal Pell Grant, Federal SupplementalEducational Opportunity Grant (FSEOG), Academic Competitiveness Grant (ACG), National Science and Mathematics Access toRetain Talent Grant (National SMART Grant), Teacher Education Assistance for College and Higher Education (TEACH) Grant,Federal Work-Study, Federal Perkins Loan, Subsidized Direct or FFEL Stafford Loan, and Unsubsidized Direct or FFEL StaffordLoan. For those Title IV recipients, net price is reported by income category and includes students who received federal aid even ifnone of that aid was provided in the form of grants. While Title IV status defines the cohort of student for which the data arereported, the definition of net price remains the same – total cost of attendance minus grant aid.
NET PRICE CALCULATOR
An institution’s net price calculator allows current and prospective students, families, and other consumers to estimate the net price ofattending that institution for a particular student.
npc.collegeboard.org/student/app/salve
ENROLLMENT
FALL 2012
TOTAL ENROLLMENT 2,613
Undergraduate enrollment 2,051
Undergraduate transfer-in enrollment 49
Graduate enrollment 562
UNDERGRADUATE ATTENDANCE STATUS UNDERGRADUATE STUDENT GENDER
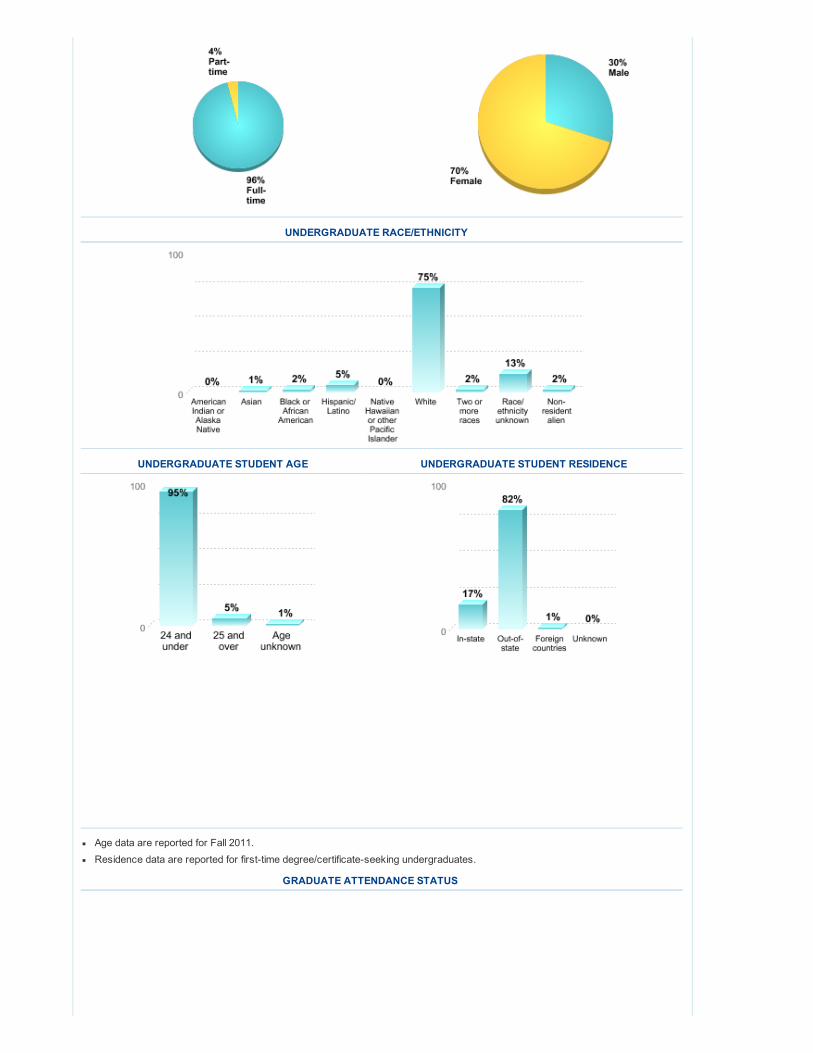
UNDERGRADUATE RACE/ETHNICITY
UNDERGRADUATE STUDENT AGE UNDERGRADUATE STUDENT RESIDENCE
Age data are reported for Fall 2011.Residence data are reported for first-time degree/certificate-seeking undergraduates.
GRADUATE ATTENDANCE STATUS

UNDERGRADUATE DISTANCE EDUCATION STATUS GRADUATE DISTANCE EDUCATION STATUS
ADMISSIONS
Undergraduate application fee (2012-2013): $50
UNDERGRADUATE ADMISSIONS FALL 2012
TOTAL MALE FEMALE
Number of applicants 4,824 1,502 3,322
Percent admitted 70% 64% 72%
Percent admitted who enrolled 16% 16% 17%
ADMISSIONS CONSIDERATIONS REQUIRED RECOMMENDED
Secondary school GPA X
Secondary school rank X
Secondary school record X
Completion of college-preparatory program X
Recommendations X
Admission test scores (SAT/ACT) X
TOEFL (Test of English as a Foreign language) X
TEST SCORES: FALL 2012 (ENROLLED FIRST-TIME STUDENTS)
STUDENTS SUBMITTING SCORES NUMBER PERCENT
SAT 333 60%
ACT 87 16%
TEST SCORES 25TH PERCENTILE* 75TH PERCENTILE**
NOTES:* 25% of students scored at or below
SAT Critical Reading 510 590
SAT Math 520 600
SAT Writing 510 600
ACT Composite 22 27
ACT English 21 27
ACT Math 20 26

** 25% of students scored above
Data apply to first-time degree/certificate-seeking students.Institutions are asked to report test scores only if they are required for admission.
The submission of standardized test scores is optional at Salve Regina University unless a student is considering a major inEducation or Nursing.
RETENTION AND GRADUATION RATES
FIRST-TO-SECOND YEAR RETENTION RATES
Retention rates measure the percentage of first-time students who are seeking bachelor's degrees who return to the institution tocontinue their studies the following fall.
RETENTION RATES FOR FIRST-TIME STUDENTS PURSUING BACHELOR'S DEGREES
Percentage of Students Who Began Their Studies in Fall 2011 and Returned in Fall 2012
OVERALL GRADUATION RATE AND TRANSFER-OUT RATE
The overall graduation rate is also known as the "Student Right to Know" or IPEDS graduation rate. It tracks the progress of studentswho began their studies as full-time, first-time degree- or certificate-seeking students to see if they complete a degree or otheraward such as a certificate within 150% of "normal time" for completing the program in which they are enrolled.
Some institutions also report a transfer-out rate, which is the percentage of the full-time, first-time students who transferred to anotherinstitution.
Note that not all students at the institution are tracked for these rates. Students who have already attended another postsecondaryinstitution, or who began their studies on a part-time basis, are not tracked for this rate. At this institution, 88 percent of enteringstudents were counted as "full-time, first-time" in 2012.
OVERALL GRADUATION AND TRANSFER-OUT RATES FOR STUDENTS WHO BEGAN THEIR STUDIES IN FALL 2006
Percentage of Full-time, First-Time Students Who Graduated or Transferred Out Within 150% of "Normal Time" toCompletion for Their Program
(*) Not all institutions report transfer-out rates.
BACHELOR'S DEGREE GRADUATION RATES
Bachelor’s degree graduation rates measure the percentage of entering students beginning their studies full-time and are planning toget a bachelor’s degree and who complete their degree program within a specified amount of time.
GRADUATION RATES FOR STUDENTS PURSUING BACHELOR'S DEGREES

Percentage of Full-time, First-time Students Who Graduated in the Specified Amount of Time
6-YEAR GRADUATION RATE BY GENDER FOR STUDENTS PURSUING BACHELOR'S DEGREES
Percentage of Full-time, First-time Students Who Began Their Studies in Fall 2006 and Received a Degree or Award Within150% of "Normal Time" to Completion for Their Program
6-YEAR GRADUATION RATE BY RACE/ETHNICITY FOR STUDENTS PURSUING BACHELOR'S DEGREES
Percentage of Full-time, First-time Students Who Began Their Studies in Fall 2006 and Received a Degree or Award Within150% of "Normal Time" to Completion for Their Program
PROGRAMS/MAJORS
COMPLETIONS (NUMBER OF AWARDS CONFERRED) 2011-2012Completions are the number of awards conferred by program and award level.
PROGRAM ASSOCIATE BACHELOR MASTER DOCTOR POSTGRADUATECERTIFICATE
Area, Ethnic, Cultural, Gender and Group Studies
American/United States Studies/Civilization - 2 - - -
Category total - 2 - - -
Biological And Biomedical Sciences
Biology/Biological Sciences, General - 22 - - -
Category total - 22 - - -
Business, Management, Marketing, and Related Support Services
Accounting - 13 - - -
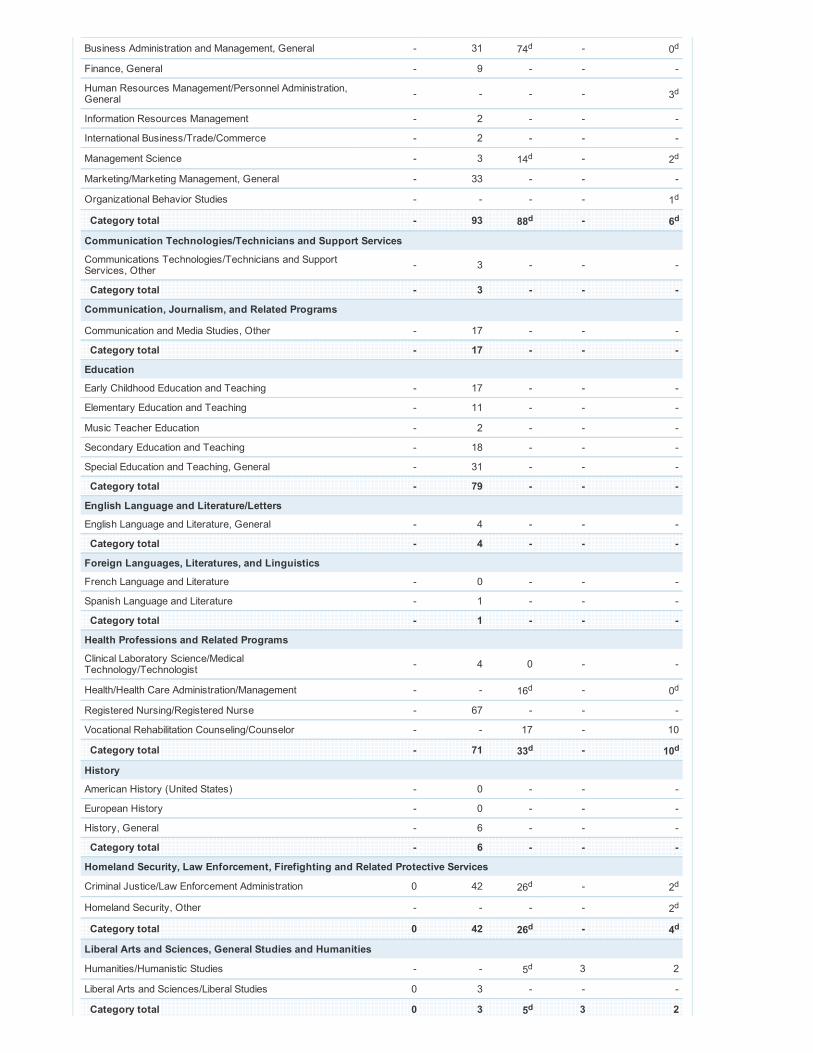
Business Administration and Management, General - 31 74d - 0d
Finance, General - 9 - - -
Human Resources Management/Personnel Administration,General - - - - 3d
Information Resources Management - 2 - - -
International Business/Trade/Commerce - 2 - - -
Management Science - 3 14d - 2d
Marketing/Marketing Management, General - 33 - - -
Organizational Behavior Studies - - - - 1d
Category total - 93 88d - 6
d
Communication Technologies/Technicians and Support Services
Communications Technologies/Technicians and SupportServices, Other - 3 - - -
Category total - 3 - - -
Communication, Journalism, and Related Programs
Communication and Media Studies, Other - 17 - - -
Category total - 17 - - -
Education
Early Childhood Education and Teaching - 17 - - -
Elementary Education and Teaching - 11 - - -
Music Teacher Education - 2 - - -
Secondary Education and Teaching - 18 - - -
Special Education and Teaching, General - 31 - - -
Category total - 79 - - -
English Language and Literature/Letters
English Language and Literature, General - 4 - - -
Category total - 4 - - -
Foreign Languages, Literatures, and Linguistics
French Language and Literature - 0 - - -
Spanish Language and Literature - 1 - - -
Category total - 1 - - -
Health Professions and Related Programs
Clinical Laboratory Science/MedicalTechnology/Technologist - 4 0 - -
Health/Health Care Administration/Management - - 16d - 0d
Registered Nursing/Registered Nurse - 67 - - -
Vocational Rehabilitation Counseling/Counselor - - 17 - 10
Category total - 71 33d - 10
d
History
American History (United States) - 0 - - -
European History - 0 - - -
History, General - 6 - - -
Category total - 6 - - -
Homeland Security, Law Enforcement, Firefighting and Related Protective Services
Criminal Justice/Law Enforcement Administration 0 42 26d - 2d
Homeland Security, Other - - - - 2d
Category total 0 42 26d - 4
d
Liberal Arts and Sciences, General Studies and Humanities
Humanities/Humanistic Studies - - 5d 3 2
Liberal Arts and Sciences/Liberal Studies 0 3 - - -
Category total 0 3 5d 3 2
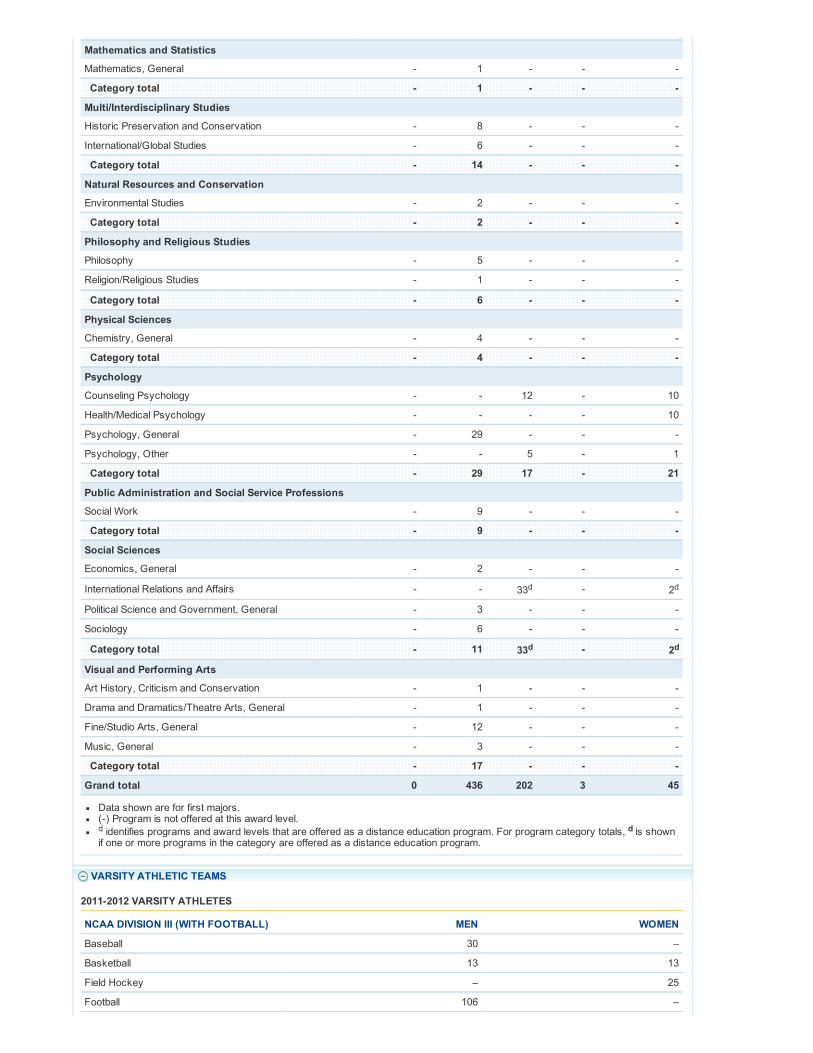
Data shown are for first majors.(-) Program is not offered at this award level.d identifies programs and award levels that are offered as a distance education program. For program category totals, d is shownif one or more programs in the category are offered as a distance education program.
Mathematics and Statistics
Mathematics, General - 1 - - -
Category total - 1 - - -
Multi/Interdisciplinary Studies
Historic Preservation and Conservation - 8 - - -
International/Global Studies - 6 - - -
Category total - 14 - - -
Natural Resources and Conservation
Environmental Studies - 2 - - -
Category total - 2 - - -
Philosophy and Religious Studies
Philosophy - 5 - - -
Religion/Religious Studies - 1 - - -
Category total - 6 - - -
Physical Sciences
Chemistry, General - 4 - - -
Category total - 4 - - -
Psychology
Counseling Psychology - - 12 - 10
Health/Medical Psychology - - - - 10
Psychology, General - 29 - - -
Psychology, Other - - 5 - 1
Category total - 29 17 - 21
Public Administration and Social Service Professions
Social Work - 9 - - -
Category total - 9 - - -
Social Sciences
Economics, General - 2 - - -
International Relations and Affairs - - 33d - 2d
Political Science and Government, General - 3 - - -
Sociology - 6 - - -
Category total - 11 33d - 2d
Visual and Performing Arts
Art History, Criticism and Conservation - 1 - - -
Drama and Dramatics/Theatre Arts, General - 1 - - -
Fine/Studio Arts, General - 12 - - -
Music, General - 3 - - -
Category total - 17 - - -
Grand total 0 436 202 3 45
VARSITY ATHLETIC TEAMS
2011-2012 VARSITY ATHLETES
NCAA DIVISION III (WITH FOOTBALL) MEN WOMEN
Baseball 30 –
Basketball 13 13
Field Hockey – 25
Football 106 –

Ice Hockey 28 21
Lacrosse 24 20
Soccer 24 24
Softball – 16
Tennis 9 11
Track and Field, Outdoor – 18
Track and Field, X-Country 7 20
Volleyball – 15
For further information on varsity athletic teams please visit the OPE Athletics Home Page.
ACCREDITATION
INSTITUTIONAL ACCREDITATION
AGENCY PERIODS OF ACCREDITATION STATUS
New England Association of Schools andColleges, Commission on Institutions ofHigher Education
12/1/1956 - Accredited
SPECIALIZED ACCREDITATION
AGENCY / PROGRAM PERIODS OF ACCREDITATION STATUS
Commission on Collegiate Nursing Education
Nursing (CNURED) - Nursing educationprograms at the baccalaureate degreelevels
(!)4/25/2013 - Accredited
National Association of Schools of Art and Design, Commission on Accreditation
Art and Design (ART) - Degree-grantingschools and departments and non-degree-granting programs
(!)9/1/1987 - Accredited
National League for Nursing Accrediting Commission
Nursing (NUR) - Baccalaureate program 12/1/1960 - Accredited
(!) Estimated dateFINANCIAL AID FOR POSTSECONDARY STUDENTS - Accreditation & Participation
CAMPUS SECURITY
2011 CRIME STATISTICS
ARRESTS - ON-CAMPUS 2009 2010 2011
Illegal weapons possession 0 0 0
Drug law violations 2 5 1
Liquor law violations 6 2 2
ARRESTS - ON-CAMPUS RESIDENCE HALLS ! 2009 2010 2011
Illegal weapons possession 0 0 0
Drug law violations 2 5 1
Liquor law violations 4 2 0
CRIMINAL OFFENSES - ON-CAMPUS 2009 2010 2011
Murder/Non-negligent manslaughter 0 0 0
Negligent manslaughter 0 0 0
Sex offenses - Forcible 2 1 3
Sex offenses - Non-forcible (incest and statutory rapeonly) 0 0 0
Robbery 0 0 0
Aggravated assault 0 0 0
Burglary 12 13 2
Motor vehicle theft 0 0 0
Arson 0 0 0
College Navigator Home | College Costs | Prepare | Financial Aid | Careers
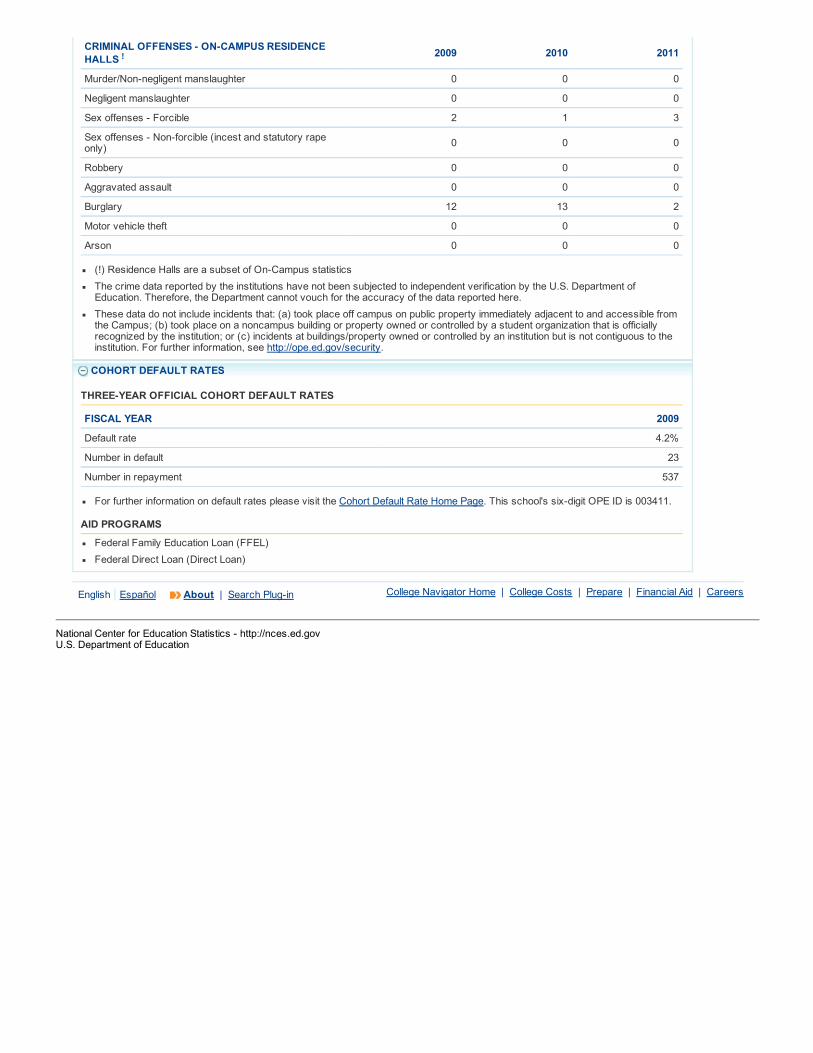
CRIMINAL OFFENSES - ON-CAMPUS RESIDENCEHALLS ! 2009 2010 2011
Murder/Non-negligent manslaughter 0 0 0
Negligent manslaughter 0 0 0
Sex offenses - Forcible 2 1 3
Sex offenses - Non-forcible (incest and statutory rapeonly) 0 0 0
Robbery 0 0 0
Aggravated assault 0 0 0
Burglary 12 13 2
Motor vehicle theft 0 0 0
Arson 0 0 0
(!) Residence Halls are a subset of On-Campus statisticsThe crime data reported by the institutions have not been subjected to independent verification by the U.S. Department ofEducation. Therefore, the Department cannot vouch for the accuracy of the data reported here.These data do not include incidents that: (a) took place off campus on public property immediately adjacent to and accessible fromthe Campus;; (b) took place on a noncampus building or property owned or controlled by a student organization that is officiallyrecognized by the institution;; or (c) incidents at buildings/property owned or controlled by an institution but is not contiguous to theinstitution. For further information, see http://ope.ed.gov/security.
COHORT DEFAULT RATES
THREE-YEAR OFFICIAL COHORT DEFAULT RATES
FISCAL YEAR 2009
Default rate 4.2%
Number in default 23
Number in repayment 537
For further information on default rates please visit the Cohort Default Rate Home Page. This school's six-digit OPE ID is 003411.
AID PROGRAMS
Federal Family Education Loan (FFEL)Federal Direct Loan (Direct Loan)
English | Español About | Search Plug-in
National Center for Education Statistics - http://nces.ed.govU.S. Department of Education