Embed Size (px)
Citation preview

2009 PPS UPDATE
Rob RalyeaSr Extension Associate
Food Science DepartmentCornell University
March 2009
Peanut Corporation of America
How NOT To Handle An Outbreak In Any Food Industry
Salmonellosis symptoms
• Fever• Diarrhea (may be bloody)• Nausea• Vomiting• Abdominal pain• Reactive arthritis (long term)• In severe cases, septicemia, endocarditis
Salmonellosis overview
• 40,000 laboratory-confirmed cases each year in the US
• Only an estimated 3% of Salmonella infections are laboratory-confirmed and reported to CDC
Salmonellosis outbreak: 2008-09
• As of February 22, 2009, 666 persons infected with the Salmonella Typhimuriumoutbreak strain have been reported in 45 states
• Illnesses began between September 1, 2008 and February 3, 2009
Cases Infected with the Outbreak Strain of Salmonella Typhimurium, United States, by State, as of February 22, 2009 at
9pm ET (n=666)
Source: http://www.cdc.gov/salmonella/typhimurium/map.html
Epidemic curve: Salmonellosis illnesses associated with PCA products Salmonellosis victims
• Age range: <1 to 98 years• Median age = 16, with 21% under age 5; 17% >
59• 48% female• 23% hospitalized• Nine deaths (Idaho, 1; Minnesota, 3; North
Carolina, 1; Ohio, 2; Virginia, 2)• Rates of hospitalization and mortality are
“typical” – strain does not appear to be unusually virulent
Anatomy of an outbreak• On November 10, 2008, the CDC noted a
small, highly dispersed cluster of 13 Salmonella Typhimurium isolates with an unusual “fingerprint” obtained from 12 states
• An epidemiological investigation was initiated on November 25
• On December 2, a second cluster of 41 Salmonella Typhimurium isolates was investigated
Pulsed-Field Gel Electrophoresis (PFGE) DNA fingerprints from Salmonella isolates obtained from patients
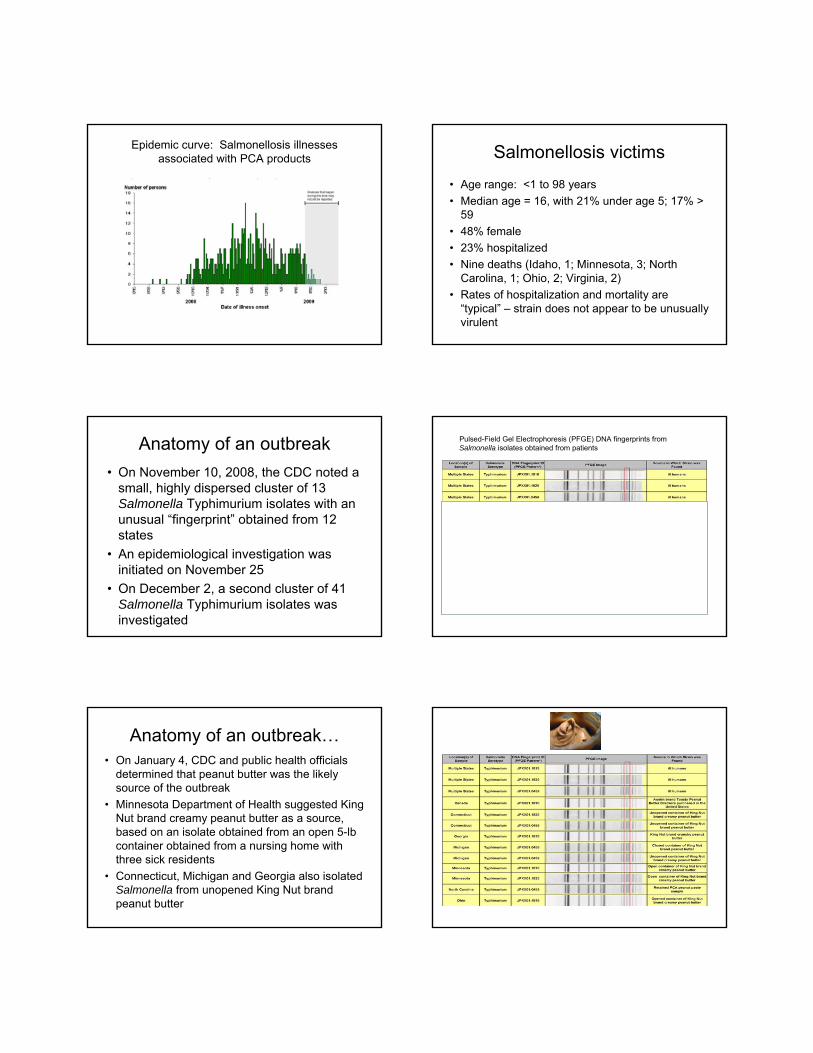
Anatomy of an outbreak…• On January 4, CDC and public health officials
determined that peanut butter was the likely source of the outbreak
• Minnesota Department of Health suggested King Nut brand creamy peanut butter as a source, based on an isolate obtained from an open 5-lb container obtained from a nursing home with three sick residents
• Connecticut, Michigan and Georgia also isolated Salmonella from unopened King Nut brand peanut butter
Further clarification….• Between January 17 and 19, 2009
telephone interviews were conducted with 95 victims and 405 case-control well persons
• Data analysis revealed an association between illness and consumption of pre-packaged peanut butter crackers (Austin and Keebler, both made by Kellogg, using peanut paste from the Peanut Corporation of America)
The recalls start…• On January 14, 2009, the Kellogg Company put a
precautionary hold on Keebler and Austin crackers; the products were recalled on January 16
• On January 28, PCA announced a voluntary recall of all peanuts and peanut products processed in Blakely, GA since 1/1/07. All production stopped on 1/28
• On February 6, Oregon public health officials determined that the human outbreak strain can also affect pets, with a laboratory-confirmed illness in a dog
• Plainview, TX plant closed on February 23 after contamination was discovered there. All products manufactured there since March 2005 recalled.
• More than 3,490 peanut-containing products have been recalled by a variety of companies
• PCA filed for bankruptcy protection as of Friday, Feb. 13
• On February 20, PCA informed customers who received products from its Georgia or Texas plants not to distribute or further use those products and to contact the FDA regarding the proper disposition of recalled products and any other matters related to the recall via the FDA recall coordinators. FDA and the Texas Department of State Health Services are working together to implement the PCA recall.
Americans clueless about food recalls….
• Although recall of peanut products have been in the news, many Americans don’t understand that cakes, snack bars, brownies, cookies and ice cream may be contaminated and have also been recalled
• 93% of 1,283 surveyed adults knew, in general, about peanut product recalls, but only half or fewer knew that some snack bars and cakes had been recalled
• ~25% new that some ice creams had been recalled; fewer knew thatjars of dry-roasted peanuts had been recalled
• ~25% believed that major national brands of peanut butter should be avoided
• >60% had only “some” or “very little” confidence that food manufacturers and government inspection systems can keep food safe
– Harvard Opinion Research in collaboration with the Centers for Disease Control and Prevention
Outside of the US, products have been distributed to…
• Aruba, Australia, the Bahamas, Bermuda, Canada, the Cayman Islands, Haiti, Italy, Jamaica, Japan, Korea, Malaysia, Mexico, the Netherlands, New Zealand, Norway, Sr. Maarten, St. Vincent and the Grenadines, Singapore, Slovenia, Spain, Turks and Caicos, and the United Kingdom
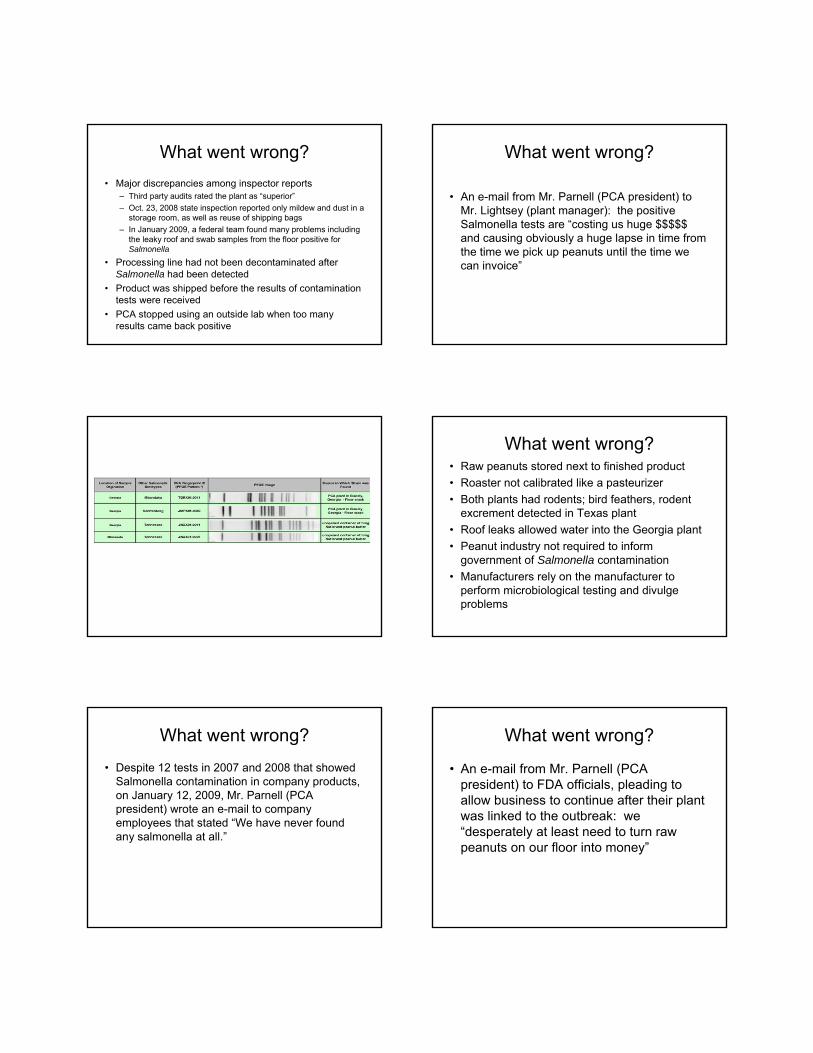
What went wrong?• Major discrepancies among inspector reports
– Third party audits rated the plant as “superior”– Oct. 23, 2008 state inspection reported only mildew and dust in a
storage room, as well as reuse of shipping bags– In January 2009, a federal team found many problems including
the leaky roof and swab samples from the floor positive for Salmonella
• Processing line had not been decontaminated after Salmonella had been detected
• Product was shipped before the results of contamination tests were received
• PCA stopped using an outside lab when too many results came back positive
What went wrong?
• An e-mail from Mr. Parnell (PCA president) to Mr. Lightsey (plant manager): the positive Salmonella tests are “costing us huge $$$$$ and causing obviously a huge lapse in time from the time we pick up peanuts until the time we can invoice”
What went wrong?• Raw peanuts stored next to finished product• Roaster not calibrated like a pasteurizer• Both plants had rodents; bird feathers, rodent
excrement detected in Texas plant• Roof leaks allowed water into the Georgia plant• Peanut industry not required to inform
government of Salmonella contamination• Manufacturers rely on the manufacturer to
perform microbiological testing and divulge problems
What went wrong?
• Despite 12 tests in 2007 and 2008 that showed Salmonella contamination in company products, on January 12, 2009, Mr. Parnell (PCA president) wrote an e-mail to company employees that stated “We have never found any salmonella at all.”
What went wrong?
• An e-mail from Mr. Parnell (PCA president) to FDA officials, pleading to allow business to continue after their plant was linked to the outbreak: we “desperately at least need to turn raw peanuts on our floor into money”

Hey, Mr Parnell……… Theater in Congress
• Representative Greg Walden, Republican from Oregon, brought in a large jar wrapped in yellow crime-scene tape and filled with peanut butter-containing cookies and crackers and asked PCA executives “Would either of you be willing to take the lid off and eat any of these products?”
• Both Mr. Parnell and Mr. Lightsey evoked the Fifth Amendment during testimony to the Subcommittee on Oversight and Investigations of the Committee on Energy and Commerce in the U.S. House of Representatives on February 11, 2009
Consequences• Sales of peanut butter dropped by ~25% in
January• Major brands (Jif, Peter Pan) are buying
advertisements to announce that their products are safe
• This tactic is generally avoided to prevent drawing more attention to the outbreak
• Peanut company is under criminal investigation, accused of knowingly shipping products that had tested positive
Consequences
• PCA CEO stripped of seat on a board that advises the government on peanut quality standards
Consequences
• FDA’s Dr. Stephen Sundlof is requesting new or enhanced authority in several areas:– Authority for FDA to issue preventive controls for
high-risk foods;– Authority for enhanced access to food records during
routine inspections to ensure that inspectors have access to all information that bears on product safety;
– Authority for FDA to require food facilities to renew their registrations every two years, and allow FDA to modify the registration categories
– Mandatory recall authority
Peanut related outbreaks have been uncommon….
• First outbreak in the US occurred in 2006-07, associated with Peter Pan peanut butter
• Only other reported outbreak occurred in Australia in 1996
Peanut butter factoidsPeanut butter was developed by a St. Louis physician in
1890 as an easily digested protein sourceSold as a nutrition supplement for several years; big hit at
1904 World’s FairGeorge Washington Carver, Tuskegee University,
developed more than 300 peanut byproducts in the early 20th century
Peanut butter and jelly became an “American standard”after PB&J found their way into Army K-rations during WWII.
Today, the typical American eats three pounds of peanut butter each year
What’s going on?
• Salmonella persist nearly indefinitely in high-fat, low-water-activity foods like peanut butter
• In such foods, Salmonella can withstand temperatures as high as 194 F (90 C) for 50 minutes
• Peanuts are typically roasted at ~350 F (180 C), but post-roasting processing may not be at such high temperatures
Take-home messages• Before you hit the send button on your e-mail, try to
imagine your text as a court document• This outbreak will have far-reaching consequences for
the food industry– Enhanced recall powers by the government?– Enhanced governmental access to records?– Mandatory reporting to government/customers of
positive tests?– Enhanced requirement to verify “safety” of ingredients
on the part of manufacturers (e.g., Kelloggs)?
• Consumers can use FDA’s online database* to see if foods are on the recall list. Those without Internet access may call 1-800-CDC-INFO (available 24 hours a day, seven days a week) for product recall information.
*http://www.fda.gov/oc/opacom/hottopics/salmonellatyph.html
• Interestingly enough, PCA TX was also certified as Organic– Organic doesn’t necessarily encompass ‘food
safety’
• How does this relate to the Dairy Industry???
Salmonella Outbreak
• Schwan’s Ice Cream – 1994– External Contamination Issues
• Relates to the Dairy Industry– Internal Contamination Issues
• Brine • Positive Air Pressure• Other Contamination Sources
Update on Fluid Milk Quality Research at
Cornell University
2008-09 Projects
• Milk Quality Improvement Program: core Voluntary Shelf-Life program and dairy industry outreach
• Evaluation of raw milk bacteriological tests for effective prediction of processed fluid milk quality (“the PI Project”)
• Feasibility of development of a single raw milk assay to predict shelf-life performance of pasteurized milk
NYS Milk Quality Improvement Program (MQIP)
• Objectives and Approach:– Monitor shelf life characteristics of commercially
processed and packaged NYS fluid milk products– Monitor NYS raw milk quality– Assist NYS dairy plants in identifying and correcting
handling and processing problems affecting dairy product quality
– Visit HTST fluid milk processing plants two times a year to collect products and as necessary to solve targeted problems
NYS Milk Quality Improvement Program Shelf Life Studies
• Sample preparation & test daysHold milk at 43o F and test at initial day, day 7, day 10 and day 14 (day 17 for selected plants)
• Tests performed– Microbiological (standard plate count, coliform
count)– Chemical (Freezing point, butter fat; initial day
only)– Flavor analysis/Sensory Testing
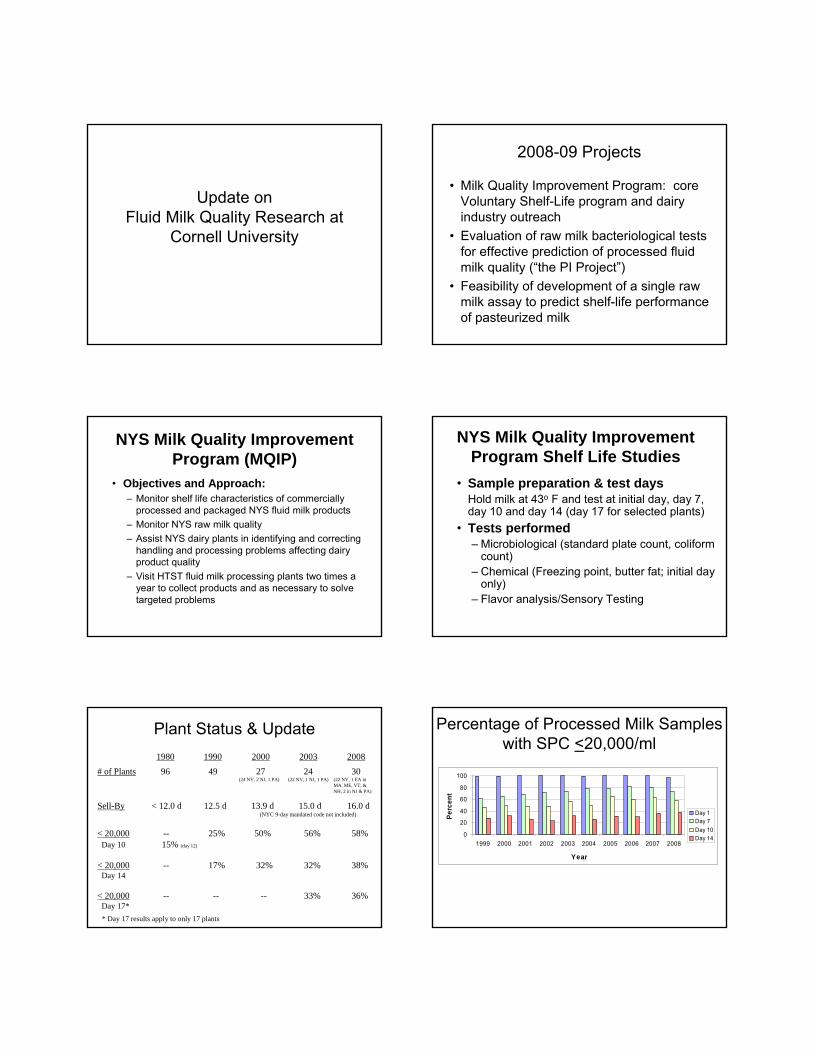
Plant Status & Update1980 1990 2000 2003 2008
# of Plants 96 49 27 24 30(24 NY, 2 NJ, 1 PA) (22 NY, 1 NJ, 1 PA) (22 NY, 1 EA in
MA, ME, VT, & NH, 2 in NJ & PA)
Sell-By < 12.0 d 12.5 d 13.9 d 15.0 d 16.0 d(NYC 9-day mandated code not included)
< 20,000 -- 25% 50% 56% 58%Day 10 15% (day 12)
< 20,000 -- 17% 32% 32% 38%Day 14
< 20,000 -- -- -- 33% 36%Day 17** Day 17 results apply to only 17 plants
Percentage of Processed Milk Samples with SPC <20,000/ml
0
20
40
60
80
100
1999 2000 2001 2002 2003 2004 2005 2006 2007 2008
Year
Perc
ent
Day 1Day 7Day 10Day 14
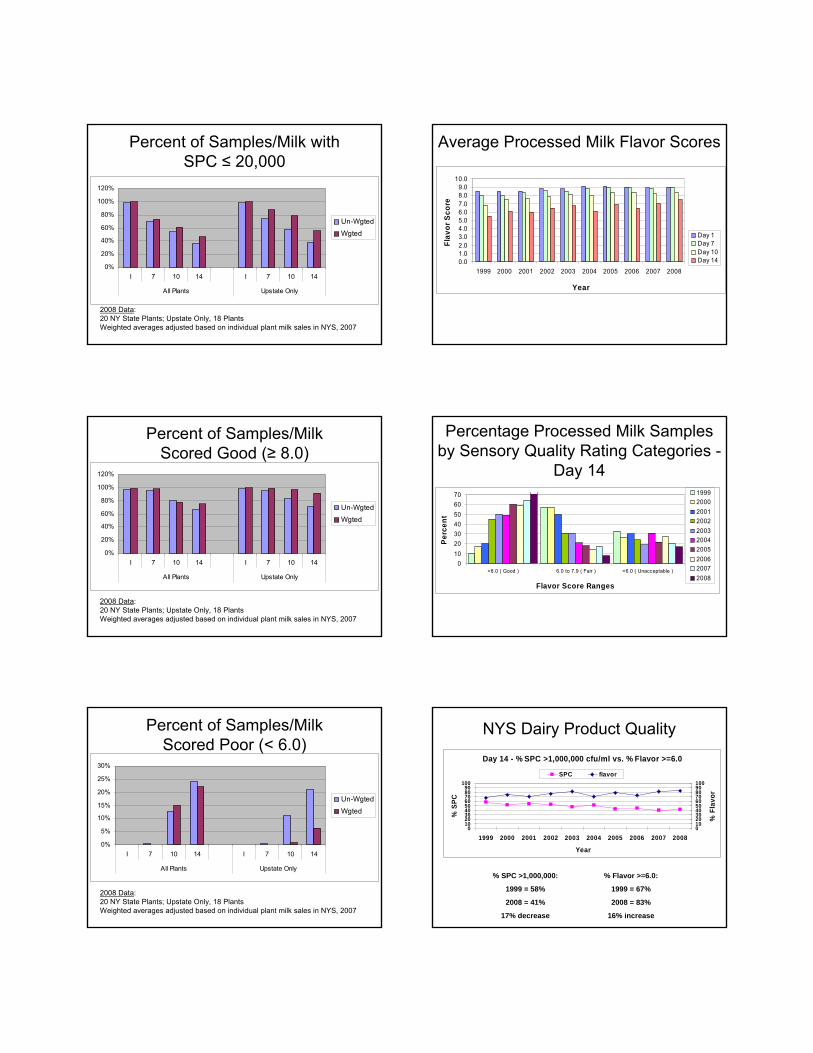
Percent of Samples/Milk with SPC ≤ 20,000
2008 Data:20 NY State Plants; Upstate Only, 18 PlantsWeighted averages adjusted based on individual plant milk sales in NYS, 2007
0%
20%
40%
60%
80%
100%
120%
I 7 10 14 I 7 10 14
All Plants Upstate Only
Un-Wgted
Wgted
Average Processed Milk Flavor Scores
0.01.02.03.04.05.06.07.08.09.0
10.0
1999 2000 2001 2002 2003 2004 2005 2006 2007 2008
Year
Flav
or S
core
Day 1Day 7Day 10Day 14
Percent of Samples/MilkScored Good (≥ 8.0)
0%
20%
40%
60%
80%
100%
120%
I 7 10 14 I 7 10 14
All Plants Upstate Only
Un-Wgted
Wgted
2008 Data:20 NY State Plants; Upstate Only, 18 PlantsWeighted averages adjusted based on individual plant milk sales in NYS, 2007
010203040506070
>8.0 ( Good ) 6.0 to 7.9 ( Fair ) <6.0 ( Unacceptable )
Flavor Score Ranges
Perc
ent
1999200020012002200320042005200620072008
Percentage Processed Milk Samples by Sensory Quality Rating Categories -
Day 14
Percent of Samples/MilkScored Poor (< 6.0)
2008 Data:20 NY State Plants; Upstate Only, 18 PlantsWeighted averages adjusted based on individual plant milk sales in NYS, 2007
0%
5%
10%
15%
20%
25%
30%
I 7 10 14 I 7 10 14
All Plants Upstate Only
Un-Wgted
Wgted
% Flavor >=6.0:
1999 = 67%
2008 = 83%
16% increase
% SPC >1,000,000:
1999 = 58%
2008 = 41%
17% decrease
Day 14 - % SPC >1,000,000 cfu/ml vs. % Flavor >=6.0
0102030405060708090
100
1999 2000 2001 2002 2003 2004 2005 2006 2007 2008
Year
% S
PC
0102030405060708090100
% F
lavo
r
SPC flavor
NYS Dairy Product Quality
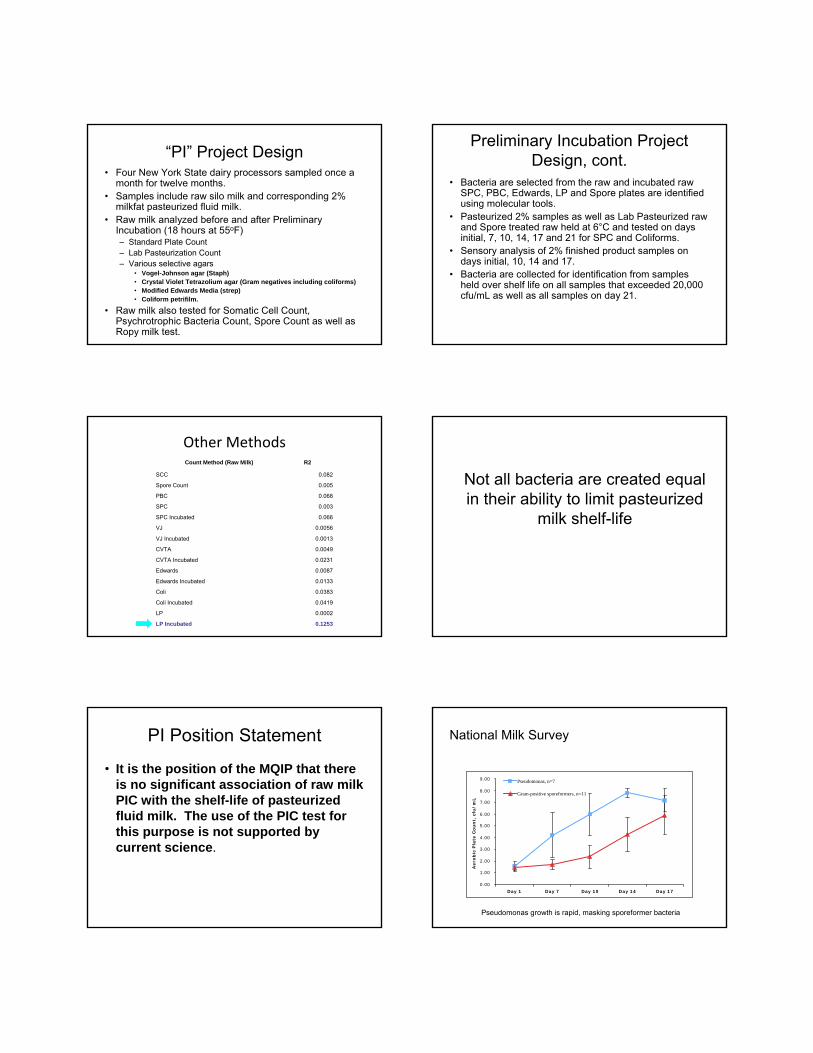
“PI” Project Design• Four New York State dairy processors sampled once a
month for twelve months.• Samples include raw silo milk and corresponding 2%
milkfat pasteurized fluid milk.• Raw milk analyzed before and after Preliminary
Incubation (18 hours at 55oF)– Standard Plate Count – Lab Pasteurization Count – Various selective agars
• Vogel-Johnson agar (Staph)• Crystal Violet Tetrazolium agar (Gram negatives including coliforms)• Modified Edwards Media (strep) • Coliform petrifilm.
• Raw milk also tested for Somatic Cell Count, Psychrotrophic Bacteria Count, Spore Count as well as Ropy milk test.
Preliminary Incubation ProjectDesign, cont.
• Bacteria are selected from the raw and incubated raw SPC, PBC, Edwards, LP and Spore plates are identified using molecular tools.
• Pasteurized 2% samples as well as Lab Pasteurized raw and Spore treated raw held at 6°C and tested on days initial, 7, 10, 14, 17 and 21 for SPC and Coliforms.
• Sensory analysis of 2% finished product samples on days initial, 10, 14 and 17.
• Bacteria are collected for identification from samples held over shelf life on all samples that exceeded 20,000 cfu/mL as well as all samples on day 21.
Count Method (Raw Milk) R2
SCC 0.082
Spore Count 0.005
PBC 0.068
SPC 0.003
SPC Incubated 0.066
VJ 0.0056
VJ Incubated 0.0013
CVTA 0.0049
CVTA Incubated 0.0231
Edwards 0.0087
Edwards Incubated 0.0133
Coli 0.0383
Coli Incubated 0.0419
LP 0.0002
LP Incubated 0.1253
Other Methods
Not all bacteria are created equal in their ability to limit pasteurized
milk shelf-life
PI Position Statement
• It is the position of the MQIP that there is no significant association of raw milk PIC with the shelf-life of pasteurized fluid milk. The use of the PIC test for this purpose is not supported by current science.
National Milk Survey
0.00
1.00
2.00
3.00
4.00
5.00
6.00
7.00
8.00
9.00
Day 1 Day 7 Day 10 Day 14 Day 17
Aero
bic
Pla
te C
ou
nt,
cfu
/m
L
Pseudomonas, n=7
Gram-positive sporeformers, n=11
Pseudomonas growth is rapid, masking sporeformer bacteria
National Milk Survey
0.00
1.00
2.00
3.00
4.00
5.00
6.00
7.00
8.00
9.00
A (Gram-negative) B (Gram-negative) C (Gram-positivesporeformer)
D (Gram-positivesporeformer)
NE Plant (Type of Bacterial Spoilage)
Day 1
Day 7
Day 10
Day 14
Day 17
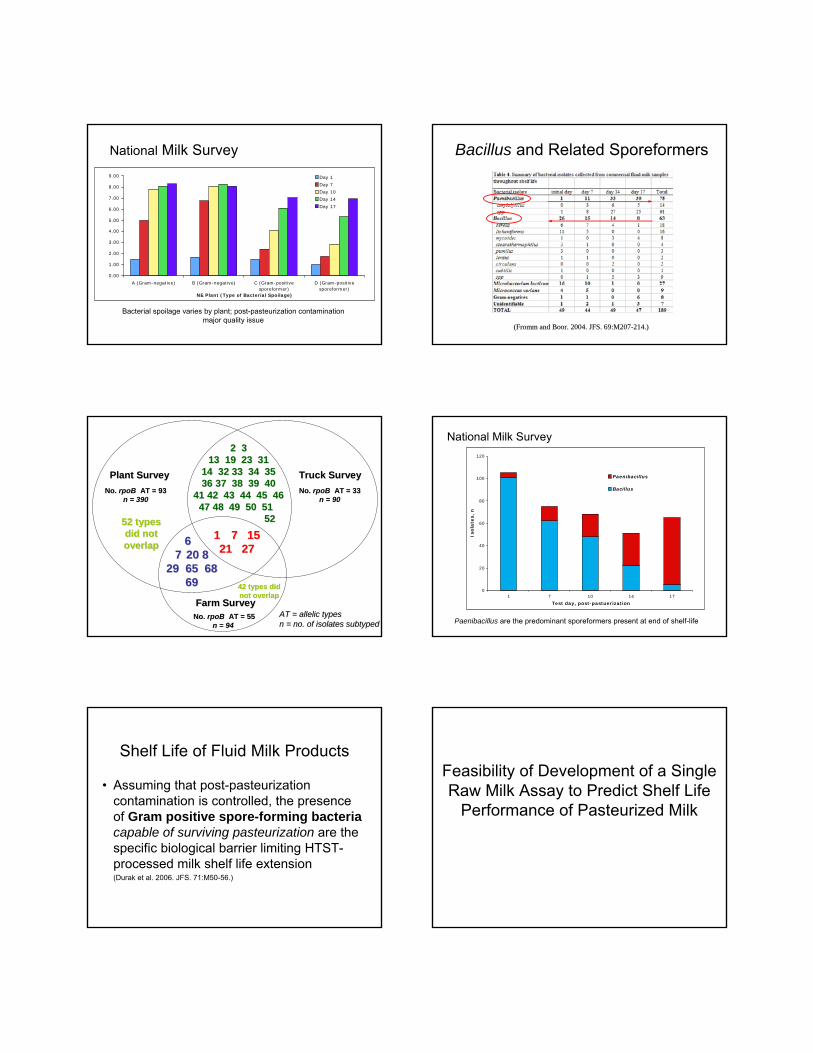
Bacterial spoilage varies by plant; post-pasteurization contamination major quality issue
Bacillus and Related Sporeformers
(Fromm and Boor. 2004. JFS. 69:M207(Fromm and Boor. 2004. JFS. 69:M207--214.)214.)
11 7 157 1521 2721 27
Plant SurveyPlant Survey
Farm SurveyFarm Survey
Truck SurveyTruck Survey
6677 20 820 8
29 65 6829 65 686969
22 331313 19 23 3119 23 31
1414 32 33 34 3532 33 34 353636 37 38 39 4037 38 39 40
4141 42 43 44 45 4642 43 44 45 464747 48 49 50 51 48 49 50 51
52 52
No. No. rpoBrpoB AT = 93AT = 93n = 390n = 390
No. No. rpoBrpoB AT = 33AT = 33n = 90n = 90
No. No. rpoBrpoB AT = 55AT = 55n = 94 n = 94
AT = allelic typesAT = allelic typesn = no. of isolates n = no. of isolates subtypedsubtyped
52 types 52 types did not did not overlapoverlap
42 types did 42 types did not overlapnot overlap
Paenibacillus are the predominant sporeformers present at end of shelf-life
National Milk Survey
0
20
40
60
80
100
120
1 7 10 14 17
Iso
late
s, n
Paenibacillus
Bacillus
Test day, post-pastuerization
Shelf Life of Fluid Milk Products
• Assuming that post-pasteurization contamination is controlled, the presence of Gram positive spore-forming bacteriacapable of surviving pasteurization are the specific biological barrier limiting HTST-processed milk shelf life extension (Durak et al. 2006. JFS. 71:M50-56.)
Feasibility of Development of a Single Raw Milk Assay to Predict Shelf Life
Performance of Pasteurized Milk

Preliminary incubation does not correlate to shelf-life, nor to spoilage by gram-positive
spore formers.• Low numbers of Paenibacillus in raw milk mean
that traditional methods for assessing raw milk quality will not predict processed product performance
• Novel, high sensitivity techniques:– Polymerase Chain Reaction can find DNA in
concentrations as low as 10-12g mL-1!Can we design a new method that will identify and target genes that are specific to the bacteria that spoil milk?
Bruno Xavier, PhD
TaqMan® Assay
33’’ 55’’
RR55’’ 33’’
33’’ 55’’
PrimerPrimer
ProbeProbeRR55’’ 33’’
TaqTaq
PCRPCRDNA Sample DNA Sample from Milkfrom Milk
RR55’’ 33’’+
ProbeProbe
Important: must reduce “noise”caused by the presence of other organisms in a complex sample
RR
The MQIP Culture Collection
• The MQIP has collected over 2,000 isolates during our previous studies.
• Currently we have a total of 683 Paenibacillusisolates identified, corresponding to 133 unique types.
• The DNA sequence data from the rpoB genes of these allelic types were analyzed to identify groups.
Purified DNA of 2 representatives from each group will be used to test the robustness of
the method.
16S all – 11/27/2008
Nucleotide Substitutions (x100)0
15.7
2468101214
r7-104_16s.seqr7-285_16s.seq
r7-305_16s.seqr7-225_16s.seqr5-811_16s.seqr7-093_16s.seqr7-035_16s.seqr7-244_16s.seq
r7-004_16s.seqr5-803_16s.seq
r7-047_16s.seqr7-271_16s.seq
r7-166_16s.seqr7-229_16s.seqr7-003_16s.seq
r7-009_16s.seqr7-236_16s.seqr7-281_16s.seq
r7-217_16s.seqr7-212_16s.seq
r7-248_16s.seqr5-962_16s.seq
r7-210_16s.seqr7-302_16s.seqr7-301_16s.seqr7-310_16s.seqr7-337_16s.seqr7-179_16s.seqr7-333_16s.seqr7-134_16s.seq
r7-128_16s.seqr7-204_16s.seq
r7-146_16s.seqr7-163_16s.seq
r7-273_16s.seqr7-312_16.seq
r7-198_16s.seqr7-313_16s.seq
r7-272_16s.seqr7-192_16s.seqr7-321_16s.seq
r7-216_16s2.seqr5-991_16s.seq
G1
G3
G4
G5
G6
G7
G8G9G10
G2
Optimizing Detection of Paenibacillus in Milk
Even if the probe works perfectly, other technical hurdlesremain to be solved, notably sample preparation.•Heat resistance of Paenibacillus allows us to:
1. Inactivate other contaminants in milk samplesusing conventional spore-treatment (80ºC/12min)
2. Incubate samples to enrich Paenibacillus population
Goal: optimize an enrichment process while simultaneously developing the TaqMan® protocol
Do Paenibacillus Share Unique Physiological Characteristics?Can Bacillus grow in milk at low temperature?
Most Bacillus isolates cannot grow below 7°C, but all Paenibacillus tested so far grow relatively well in milk even at 4°C.
Do Paenibacillus have a common metabolic characteristic that can be measured directly on a petri plate?
Viridyana TejadaStudent (Food Engineering)Tecnologico de Monterrey
Cecilie NielsenFood Engineer
Univ. of Copenhagen
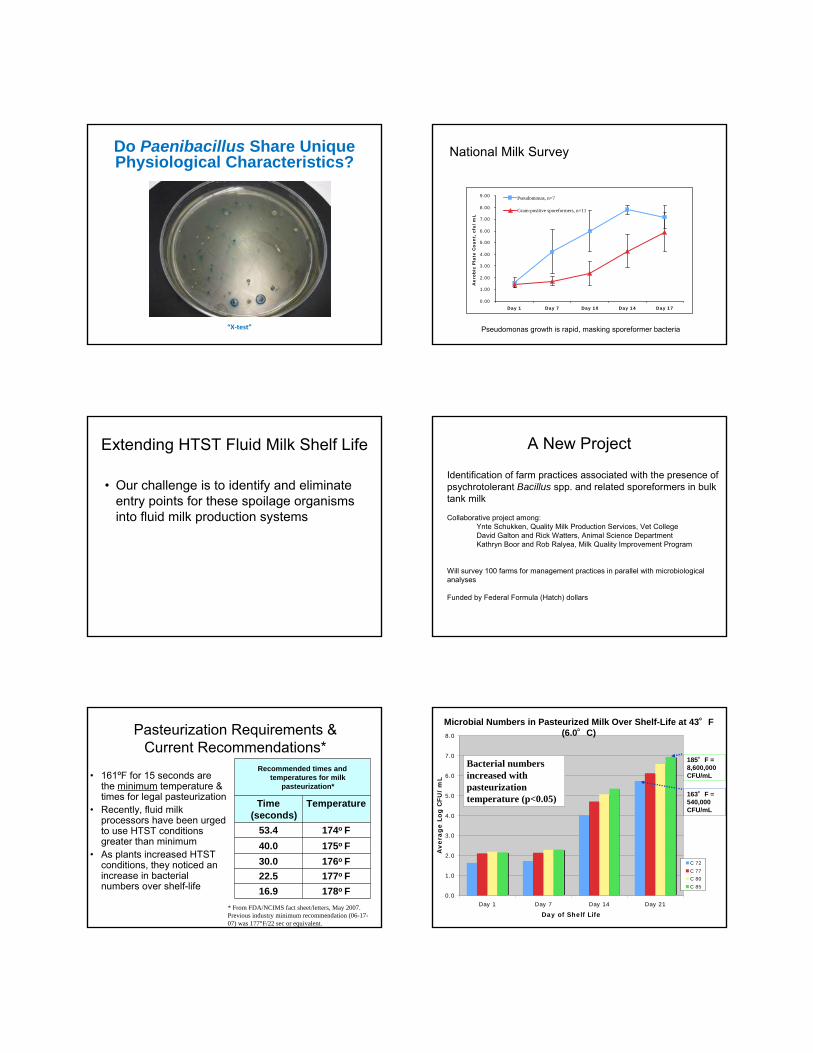
Do Paenibacillus Share Unique Physiological Characteristics?
“X‐test”
National Milk Survey
0.00
1.00
2.00
3.00
4.00
5.00
6.00
7.00
8.00
9.00
Day 1 Day 7 Day 10 Day 14 Day 17
Aero
bic
Pla
te C
ou
nt,
cfu
/m
L
Pseudomonas, n=7
Gram-positive sporeformers, n=11
Pseudomonas growth is rapid, masking sporeformer bacteria
Extending HTST Fluid Milk Shelf Life
• Our challenge is to identify and eliminate entry points for these spoilage organisms into fluid milk production systems
A New Project
Identification of farm practices associated with the presence ofpsychrotolerant Bacillus spp. and related sporeformers in bulk tank milk
Collaborative project among:Ynte Schukken, Quality Milk Production Services, Vet CollegeDavid Galton and Rick Watters, Animal Science DepartmentKathryn Boor and Rob Ralyea, Milk Quality Improvement Program
Will survey 100 farms for management practices in parallel with microbiologicalanalyses
Funded by Federal Formula (Hatch) dollars
Pasteurization Requirements & Current Recommendations*
• 161ºF for 15 seconds are the minimum temperature & times for legal pasteurization
• Recently, fluid milk processors have been urged to use HTST conditions greater than minimum
• As plants increased HTST conditions, they noticed an increase in bacterial numbers over shelf-life
Recommended times and temperatures for milk
pasteurization*
Time (seconds)
Temperature
53.4 174o F40.0 175o F 30.0 176o F 22.5 177o F 16.9 178o F
* From FDA/NCIMS fact sheet/letters, May 2007. Previous industry minimum recommendation (06-17-07) was 177°F/22 sec or equivalent.
0.0
1.0
2.0
3.0
4.0
5.0
6.0
7.0
8.0
Day 1 Day 7 Day 14 Day 21
Day of Shelf Life
Avera
ge L
og
CFU
/m
L
C 72
C 77
C 80
C 85
185°F = 8,600,000 CFU/mL
163°F = 540,000 CFU/mL
Bacterial numbers increased with pasteurization temperature (p<0.05)
Microbial Numbers in Pasteurized Milk Over Shelf-Life at 43°F (6.0°C)
Summary• Pasteurized fluid milk processed in upstate NY plants is of “good”
quality at 14 days post-pasteurization• Results from the PI test do not correlate with pasteurized fluid milk
quality. • Currently, no raw milk bacteriological test is predictive of pasteurized
milk performance. The lack of correlation between test results and product performance is compounded by post-pasteurization contamination of milk in the processing plant.
• Psychrotolerant sporeformers (Paenibacillus spp.) are the bacteria that limit shelf-life extension in conventionally pasteurized milk. These microbes are present in very low numbers in raw milk.
• Even measurement of psychrotolerant sporeformers present in raw milk will not predict pasteurized milk performance with reliability as long as pasteurized milk is re-contaminated in the processing plant
What do we need?• Control of post-pasteurization contamination in
the milk processing plant• An assay that will rapidly identify and quantify
psychrotolerant gram positive spore-forming bacteria with spoilage potential in raw milk
• A strategy for locating and eliminating these microbes in milk processing systems
• An integrated partnership between producers and processors to target and eliminate these microbes in milk production/processing systems
• Or an entirely new, “outside of the box”approach for processing fluid milk
Food Processing and Development Laboratory
http://www.foodscience.cornell.edu/cals/foodsci/research/FPDL/index.cfm
Walker Cone Bottom Processor• Capacity:100 gallons• Agitator Motor: 1 ½ h.p.
– 2 speed, 36 & 18 rpm, constant torque• Range 30-220F• Recording chart 20-220F
Butter Churn• 50 gallon butter churn
Cheese Equipment
• Kusel A-Frame Cheese Press
3 rows each side7—40# Wilson Hoops Per Row
42 Hoops—Total capacity
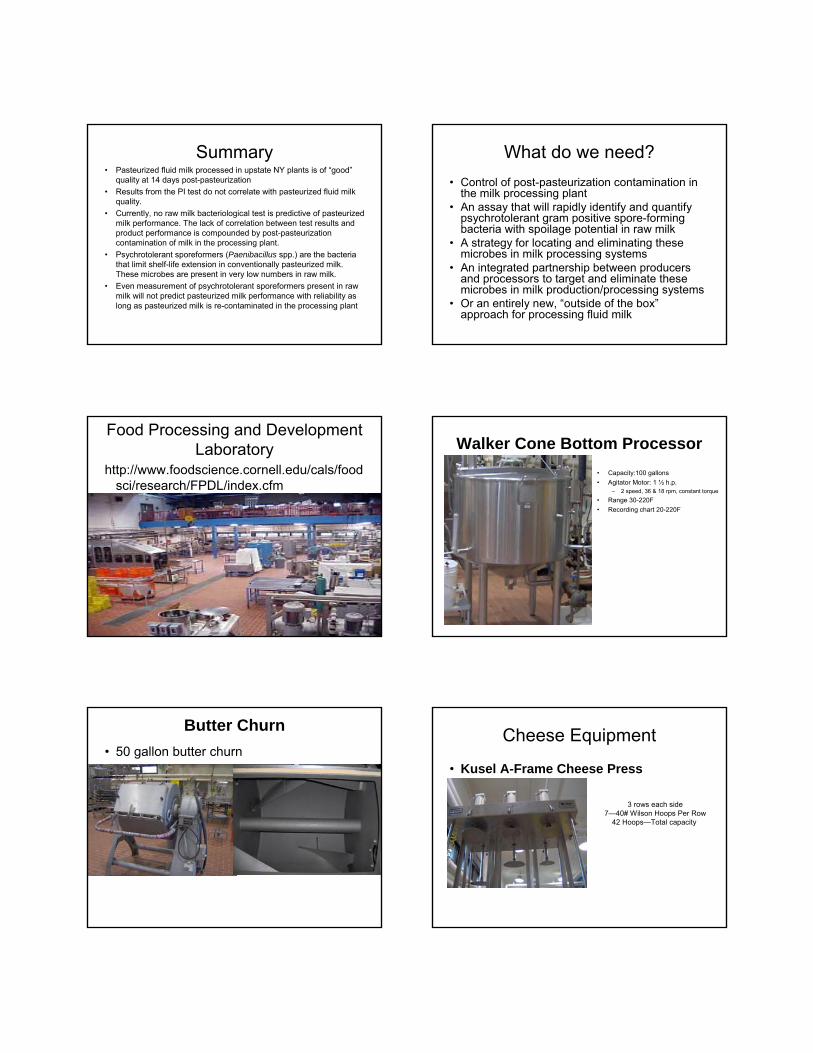
Cheese Vats Kusel cheese Vat
• Capacity: 50 gallons
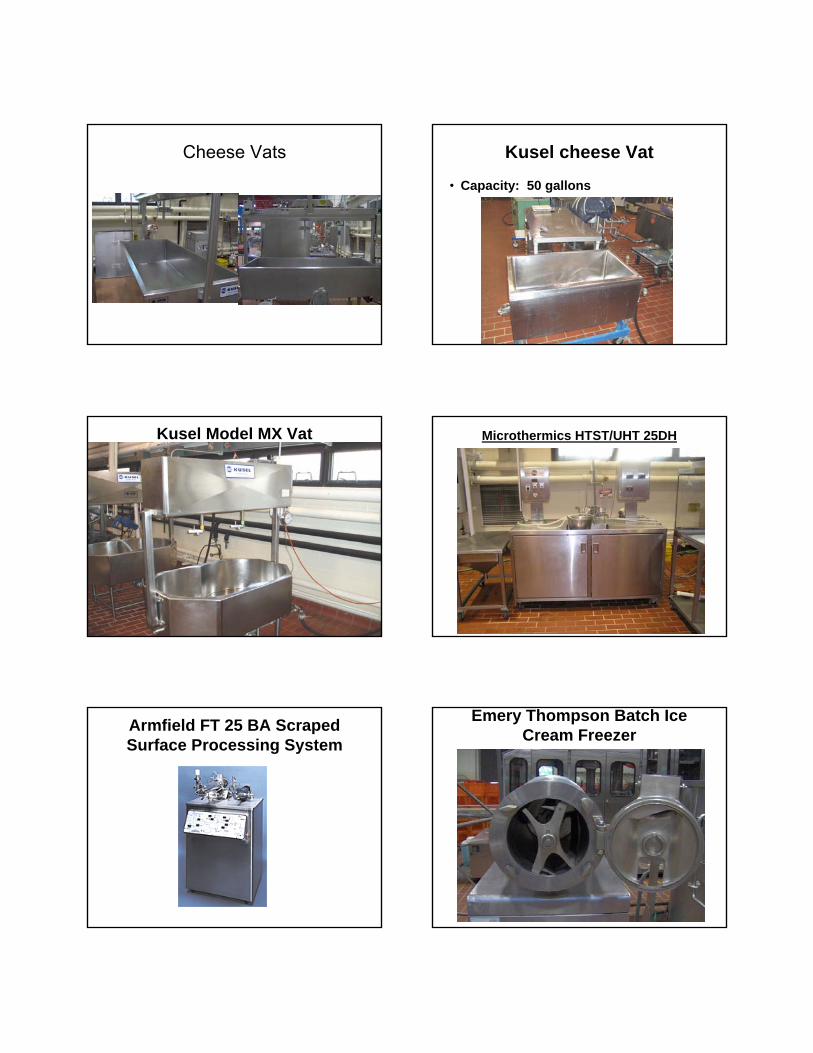
Kusel Model MX Vat
Microthermics HTST/UHT 25DH
Armfield FT 25 BA Scraped Surface Processing System
Emery Thompson Batch Ice Cream Freezer