Embed Size (px)
Citation preview
Technical Repbrt 92-1
A REVIEW OF LITERATURE RELATED TO MOVEMENTS OF ADUL T
SALMON AND STEELHEAD PAST DAMS AND THROUGH RESERVOIRS
IN THE LOWER SNAKE RIVER
T.C. Bjornn and C.A. Peery
u.s. Fish and Wildlife ServiceIdaho Cooperative Fish and Wildlife Research Unit
University of Idaho, Moscow, Idaho 83843
for
u.s. Army Corps of EngineersWalla Walla District
ADril 1992
Table of Contents
Abstract
1Introduction
1Study Area and Fish of Concern
5Factors Influencing Migrations
7Migration in Natural Rivers
15Migration Past Dams
16Entry Into Fishways
17
1820
21
24
Tailrace flow patternsPowerhouse dischargesPower peakingSpillway discharge patternsFishway entrances
25Migration Through Fishways
30Passage Through the Navigation Locks
30Fallback At Dams
38Migration In Reservoirs
42Flows
44Temperatures
44Turbidity
45Nitrogen Supersaturation
46Other Factors
48"Losses" During Migration
51Discussion
55Literature Cited
67Additional Related Uterature
Abstract
A synthesis of published and unpublished literature on the upstreammigration of adult salmon and steel head Oncorhynchus mykiss, with particularreference to passage through reservoirs and over dams, was prepared as partof an evaluation of fish passage through the lower Snake River. Most of theinformation on adult migrations in the Snake and Columbia rivers was collectedon chinook salmon 0. tshawytscha and steel head. The amount of flow,temperature and turbidity of the water, and partial barriers are natural factorsthat affect the rate of migration and survival of upstream migrants. Human-caused alterations in flow, temperatures, and turbidities through theconstruction of dams and creation of reservoirs may be beneficial ordetrimental to migrants, depending on the amount of change from natural andthe fishes' ability to adapt. Dams and reservoirs placed in the migration path ofadult salmon and steelhead usually create unique passage problems becausethe structures and discharges differ and the stocks of fish involved change from
one section of the river to the next.
Survival rates of adult salmon and steel head in the Snake and Columbiarivers were not assessed before the construction of dams, but someinformation on migration rates was obtained. In free-flowing rivers, salmonhave been observed migrating at rates up to 24 km/d (15 mild). Lesser rates ofmigration have been observed when rivers were turbid and in winter whensteel head suspend their migration till spring. Migration rates in reservoirsranged from 16 kmld for fall chinook salmon in Brownlee Reservoir, a largestorage pool, to 56 kmld for spring chinook salmon in Ice Harbor and Little
Goose reservoirs, run-of-the-river pools.
The time required for adult salmon and steelhead to migrate past damsvaries with the structure, flow, spill, powerhouse discharge, turbidities, and thepositioning of fishway entrances. Some fish approach and pass over a dam inless than a day, but the average reported time to pass a dam has ranged from1 to 5 d in several studies. Passage rates are slower when there are high flowsand spills that make it difficult for fish to find fishway entrances.
The fishways used by adult fish and the rate of passage is influenced bythe distribution of discharge from a dam and the effectiveness of the attractionflows at the fishway entrances. When there is little or no spill, few fish use thefishway entrances near the spillway. Small amounts of spill have been shownto increase use of entrances near spillways, but large amounts of spill cancompletely block some fishway entrances to fish use.
Discharges from the powerhouse can vary widely depending on the flow in
the river and power demand. During high flows all turbines may be running at
capacity, but at lower flows only 1 or 2 turbines may be used at the Snake
ii
River dams. The preferred turbines to operate for optimum fish passage hasbeen studied at some dams, but not well defined in a way that can beuniversally applied. If passage problems occur at a dam, then site specificstudies will probably be required.
Hydroelectric power peaking can affect adult fish migrating past damsthrough daily changes in discharge and by the volume of discharge duringperiods of peak power production. Rates of discharge change did not seem toaffect fish entry into the fishways, but passage rates were lower during peakdischarge periods than at lower discharge rates, presumably because the highdischarges made the fishway entrance attraction flows less efficient. The effecton fish of reducing discharges from selected dams to zero at night to conservewater for daytime power production has not been settled. Although fish arebelieved to move less at night, and would, therefore, be minimally affected byno flow through the reservoirs at night, the results of two studies are in conflict.A more extensive study of zero flow at night in the lower Snake River is
underway.
High volume spills at dams can delay fish in finding fishway entrances andlead to mortality. General guidelines for shaping the pattern of spill at each ofthe dams have been developed from site specific studies. Testing of spill andpowerhouse discharge patterns has not been conducted at all dams because ofthe cost and unreliable nature of spring runoff flows.
Considerable study has gone into the location and structure of fishwayentrances. Fishway entrances on either bank of the river, flanking the spillway,and along the powerhouse appear to give fish sufficient opportunities to enterfishways, except perhaps, when high flows create currents that obscure someentrances from the fish. Entrance size and depth, and discharges from theentrances appear adequate if attraction flows are good enough to lead the fishto the entrances. Fish can exit, as well as enter, the fishways at the entrances,and enough fish do so at some entrances to have a net entrance rate of zero orless. The extent of the problem is under study at the lower Snake River damsand a fishway fence designed to discourage fish from exiting certain entrancesis being tested.
Once fish enter the fishways, passage is relatively rapid, usually a matter ofa few hours, except that most fish move through the fishways during daytime.Fishways with 1 :10 slopes, vertical baffles, overflow weirs with submergedorifices, and velocities less than about 1 m/s allow the fish to ascend withminimal delays. A few fish have been observed to partially ascend and thenmove down and even exit fishways, before eventually reascending. Instancesof fish taking a long time to pass through a fishway often involve up and down
tit
movements, and may be related to other factors such as turbidity and gas
supersaturation.
The rate of fallback over a dam by adult salmon and steelhead varies withflow and spill, by dam, and species. Spring and summer chinook salmon havethe highest fallback rates (up to 30+%), particularly at dams with limitedpowerhouse capacity, because they migrate upstream during the spring runoff.The location of fishway exits in relation to the spillway is an important factor atsome dams. Fallback rates can also be high for steelhead (up to 20+%) atsome dams that are in the overwintering areas of the mid Columbia and lowerSnake rivers. Mortality rates of fallback fish have not been well documented,but a high percentage of tagged fish have been observed reascending dams.
Water temperatures influence the rates of migration of steel head andsalmon. High water temperatures have slowed the migrations of fall chinooksalmon and steel head into the Snake River during August and September, andperhaps affected the migration rates in the lower Columbia River. Steelheadalso slow their migration in late fall as water temperatures decline and they donot resume their migration to the spawning grounds until the following springwhen temperatures increase from the winter lows.
High concentrations of dissolved nitrogen were a persistent problem in thelower Snake River before all six turbines were installed at each dam and "flip-lips" to prevent deep plunging of spilled water were installed in the spillways.Nitrogen supersaturation at problem concentrations can occur when river flowsexceed the capacity of the powerhouses and the volume of spill (more thanabout 60 kcfs) makes the fiip-Iips ineffective.
A portion of the adult salmon and steelhead migrating to spawning groundsand hatcheries die enroute, and those losses can be both natural and human-caused. Discrepancies between counts of fish at dams have been relativelylarge in some instances, which has raised the concern about extraordinarylosses at some dams. Some of the discrepancies have been caused by highfallback rates with subsequent reascension at specific dams, and some can beaccounted for as fish caught by fishermen, fish spawning in the main stemrivers or entering tributaries. Howerver, significant portions of the discrepancycannot be accounted for in some areas and they may in fact be losses of fish toa variety of causes. Discrepancies between counts of steelhead at McNary ,Priest Rapids, and Ice Harbor dams have been large in some years and havenot been accounted for fully, an indication, that significant losses may occur insome years, mostly amoung fish destined to enter the Snake River .Discrepancies in counts of salmon and steelhead between the four SnakeRiver dams and losses in radio tracking studies have been relatively low.
iv
Introduction
Uterature (published and unpublishedarticles) on the passage of adult salmonand steel head Oncorhynchus mykiss atdams and through reservoirs wascollected, reviewed, and this synthesis wasprepared as part of a study of the passageof adults through the res:ervoirs and pastthe dams in the lower section of the SnakeRiver (Figure 1 ). The literature review, andan analysis of existing data for the lowerSnake River (Bjornn and Rubin 1992), andfield studies started in 1991 wereundertaken as part of the U.S. Army Corpsof Engineers research program todetermine if there was evidence of unusualdelays or losses at the four dams in thelower Snake River. In the field studies, theeffects of zero-flow at night, various spillpatterns, preferences for fishwayentrances, a fence in the fishways toreduce fishway fallout, and fallback overthe dams were to be evaluated.
Uterature on the migration of adultsalmon and steel head was collected byfirst searching lite-rature databases forreferences, collecting articles, checking thearticles for additional references, andfinally searching agency files for copies ofunpublished reports. Personnel of theCorps of Engineers, Oregon Department ofFish and Wildlife, and National MarineFisheries Service were especially helpfulin securing copies of unpublished reportsfrom their files. The Office of InformationTransfer of the U.S. Fish and WildlifeService searched databases and provideda list of references. More than 600 articleswere screened for information on theupstream migration of adult salmonids, andmany of those are included in the list ofliterature cited or the list of additionalreferences that have information relative topassage at dams and through reservoirs.
Study Area and Fish of Concern
referred to as spring, summer, and fallchinook salmon based on the time theyenter the Columbia River. The springchinook salmon enter the Columbia Riverduring March, April, and May. They crossBonneville Dam from mid March throughthe end of May, and Ice Harbor Dam abouttwo weeks later (Figure 2). The summerchinook salmon enter the river during lateMay, June, and July, pass Bonneville Damduring June and July, and pass Ice HarborDam from mid June to mid August. Thethird group, or fall chinook salmon, entersthe river starting in August and passesBonneville Dam primarily during lateAugust, September, and early October .
Three populations of adult chinooksalmon 0. tshawytscha and two ofsteel head enter the Snake River (Figure 1 )each year on their way to spawninggrounds and hatcheries in the tributaries.In earlier years, significant numbers ofcoho salmon 0. kisutch and sockeyesalmon 0. nerka entered the Snake River;the former have been declared extinct, andthe latter are in such low abundance thatthey have been listed as endangeredunder the Endangered Species Act.Chinook salmon destined to spawn in theSnake River basin, which have been listedas threatened, enter the Columbia Riverstarting in March and continue throughOctober. The three populations or runs are
2
-01'-=~cn
-'-~01
>-~
GI
~..cV)
~c....-i=-0uG
I.c~c-"'EfG~-.-0C0-~..U0-G
I.c~.c~-.C-"'...Ds..G
I>-~..
-.DE=-0UGI
.c~-.-0Q.
fG~
~
I""" ,---
.~.-;":
,-
.: ---:-~
---~
~
~
1~
~
3
~
~:
~
~
~
-WlO
~
H
~IIB
~
noo ~
~ >
§
,,-,I,,,,.,,,,I,\.\\
.,
.,?
,\,\,II,,I,
j
c
~c
m~m-
I
i-.:I)>~~C(/)!COEmC...
~m:I:!l;m-g.1:.
174
~~coE-aCD
~8c£-o!Jc~8~-a"Cc~I)
~(\i~~.QJ
u.
The fall run passes over Ice Harbor Dam inSeptember and early October (Figure 2).
group fish enter the Snake River as earlyas July. Most of the steel head, however,do not enter the Snake River untilSeptember because of high rivertemperatures, and the A- and B-group fishare mixed together by the time most ofthem enter the Snake River in fall (Figure
2).
Each of the three runs of chinooksalmon (spring, summer, and fall) enteringthe Snake River are made up of manyseparate stocks of fish that maintainedtheir identity and genetic integrity in thepast by spacial or temporal separationduring spawning. The spring and summerchinook salmon spawned in the tributariesto the Snake River, while the fall chinooksalmon spawned mainly in the main stemSnake River, with a few fish spawning inthe lower ends of a few major tributaries.In some of the tributaries, either spring- orsummer-run fish used the stream, but inothers, fish of both runs spawned. Instreams where fish of both runs werepresent, the spring chinook salmon arrivedfirst, spawned first, and usually spawnedupstream from the summer chinooksalmon.
In the Snake River basin, the A-groupsteel head were historically produced in thelower elevation tributaries (TucannonRiver, lower and smaller tributaries of theClearwater and Salmon Rivers, GrandeRonde River, Imnaha River, tributariesupstream from the mid Snake River dams,and spring fed streams such as the Lemhiand Pahsimeroi Rivers) where snowmeltrunoff was often in March and April. Thefish spawned in April. The B-groupsteel head were historically produced in thelarger high elevation trtbutaries of theClearwater and Salmon Rivers (North andSouth Forks of the Clearwater River ILochsa and Selway Rivers, South andMiddle Forks of the Salmon River, and theupper Salmon River near Stanley) wheresnowmelt runoff peaked in late MayorJune. The fish usually spawned in lateApril and May.
Steelhead that spawn in the tributariesof the Snake River enter the ColumbiaRiver beginning in June and continuethrough October. The steelhead aretermed summer steelhead because of theirtime of return to freshwater. The SnakeRiver steelhead are further divided into twogroups, the A-group that enters theColumbia River first and passes overBonneville Dam from June thr-ough lateAugust, and the B-group that enters laterand passes Bonneville Dam from lateAugust through October. The A-group fishare smaller than similar age class B-groupfish because they spend fewer months inthe ocean in the year they return to theriver. The two groups of fish proceed upthe Columbia River and some of the A-
Sockeye salmon destined for theSnake and upper Columbia basin streamsenter the Columbia River in early summer ,pass over Bonneville Dam primarily duringJune and July, and pass over McNaryDam in the latter half of June, July, andAugust. Sockeye salmon entering theSnake River crossed over Ice Harbor Damin late June and July. In years of relativelylarge runs into the Snake River (1963 and1964), some fish passed over Ice Harbor
4
migrations of adult salmon and steelheadrelative to their passage over the dams andthrough the reservoirs in the lower SnakeRiver. We have organized the sectionsfrom the fishes' perspective of migratingupstream and discuss the various factorsthat might affect their migration.
Dam in September and October. but thedestination of those fish is unknown.Sockeye salmon migrating to Redfish Lakeat the head of the Salmon River in Idahoarrived primarily during August (Bjornn etal. 1968) and were the fish that passedover Ice Harbor Dam in July.
In the following sections we presentthe information we have found on the
Factors Influencing Migrations
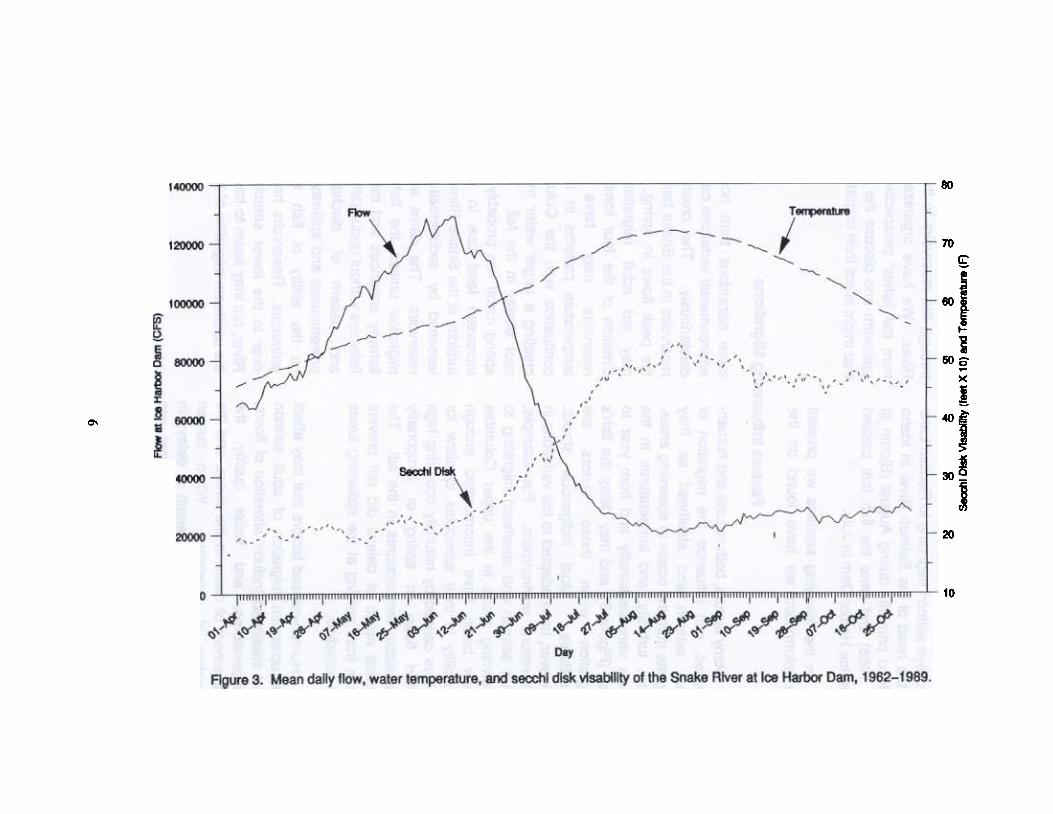
more hazardous than normal, then theenvironmental variations can affect the fishdeleteriously. The creation of storagereservoirs in the Snake basin has reducedthe peak flows in spring, a change thatmay aid adult migration past dams.Creation of the four lower Snake Riverreservoirs may have altered thetemperature pattern~ in the river at itsconfluence with the Columbia River bycreating a larger water mass that wouldcool slower in the fall. Turbidity of thespring runoff has probably increased withincreased land use in the basin, butturbidity at the Snake River mouth may belessened by sedimentation in the fourreservoirs. The dams are obstacles tomigration unless the fish can find thefishway entrances and move through thefishways without undue delay. The volumeand pattern of discharge from thepowerhouses and spillways has an effecton the ability of fish to find fishwayentrances. Reservoirs have replaced theriver in the lower stretch of the SnakeRiver, but they seem to have little effect onthe upstream migration of adults.
Many factors, both natural and human-caused, can influence the migration ofadult salmon and steelhead as theymigrate from the ocean to spawning areas.Flow, turbidity , and temperatures in therivers vary seasonally and from year toyear (Figure 3), and may delay the fish'smigration when those factors areunsuitable. Most indigenous stocks,however, have adapted to the variations inthe natural environment. For example,adult salmon and steelhead migrating tospawning areas in the upper ColumbiaRiver basin have incorporated enoughflexibility in their schedules to allow for
delays caused by naturally occurring highturbid flows in spring or temporarilyunsuitable temperatures in the fall. Thenormal range of delays did not preventthem from arriving at the spawning areas
on schedule.
Human-caused factors that may affectthe upstream migration of adult salmonand steelhead include alteration of flows,temperatures, and water quality, theplacement of dams in the rivers, and thecreation of reservoirs. When humanactivities increase the length of delays inmigration or create conditions that are
5
2(:I) 8J~
8J8dweJ.
JXJ8 (O
~ x
1881) AID
R88IA
~
I~
~
i ~
i
~
6
~0-
Migration in Natural Rivers
1955 and 1956, respectively. Chinooksalmon caught in the sport fisheryaveraged migration rates of 17.7 km/d in1954, and 19.3 km/d in 1956 and 1 ~57.Steel head averaged 16.1 and 11.3 km/dduring the spring, and 9.7 and 8.0 km/d inthe fall for the 1954-55 and 1955-56 fishruns, respectively. Sockeye salmonaveraged 19.3 km/d to a weir more than600 km upstream (Redfish Lake). Inanother early study (1955 and 1956)before dams were constructed in the lowerSnake River, Burck and Jones (1963)released 1,786 steel head at McNary Damto measure migration rates. Eighty-onesteel head were recovered at LewistonDam, 283 km upstream. The 30 fishtagged in January migrated at an averagerate of 3.2 km/d, 17 fish tagged in Februaryaveraged 3.9 km/d, and the 34 fish taggedin April averaged 12.2 km/d. Thesteel head tagged in the winter probablymoved little or none until spring.
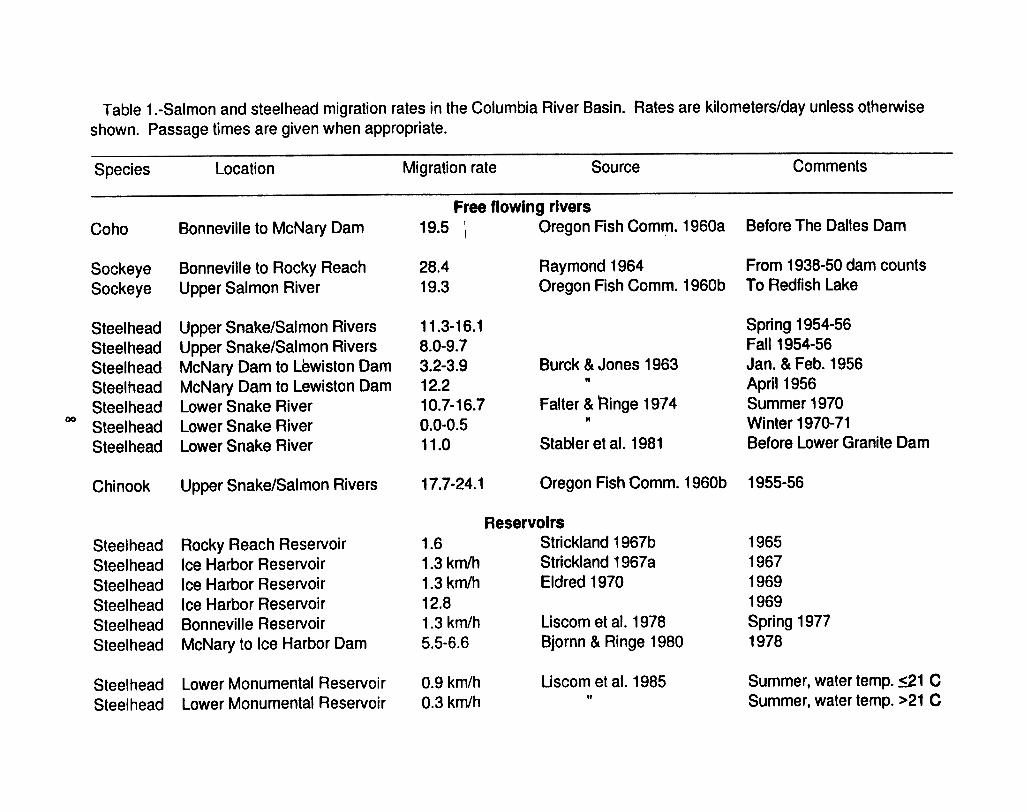
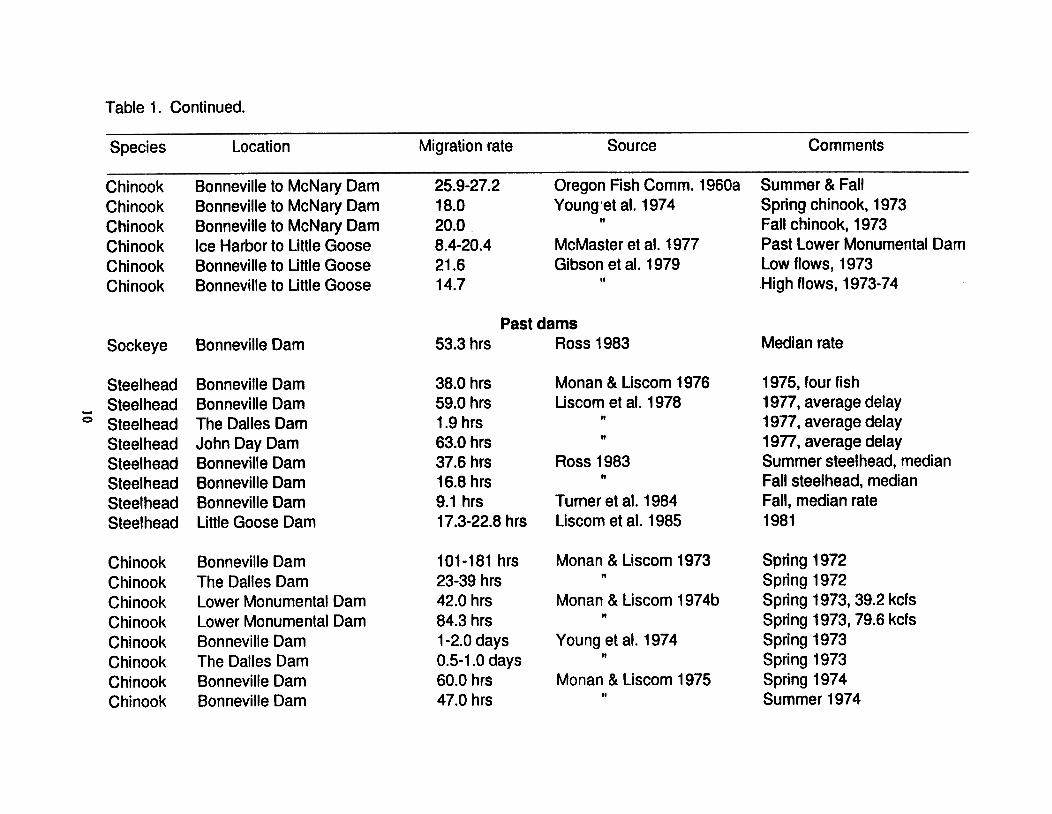
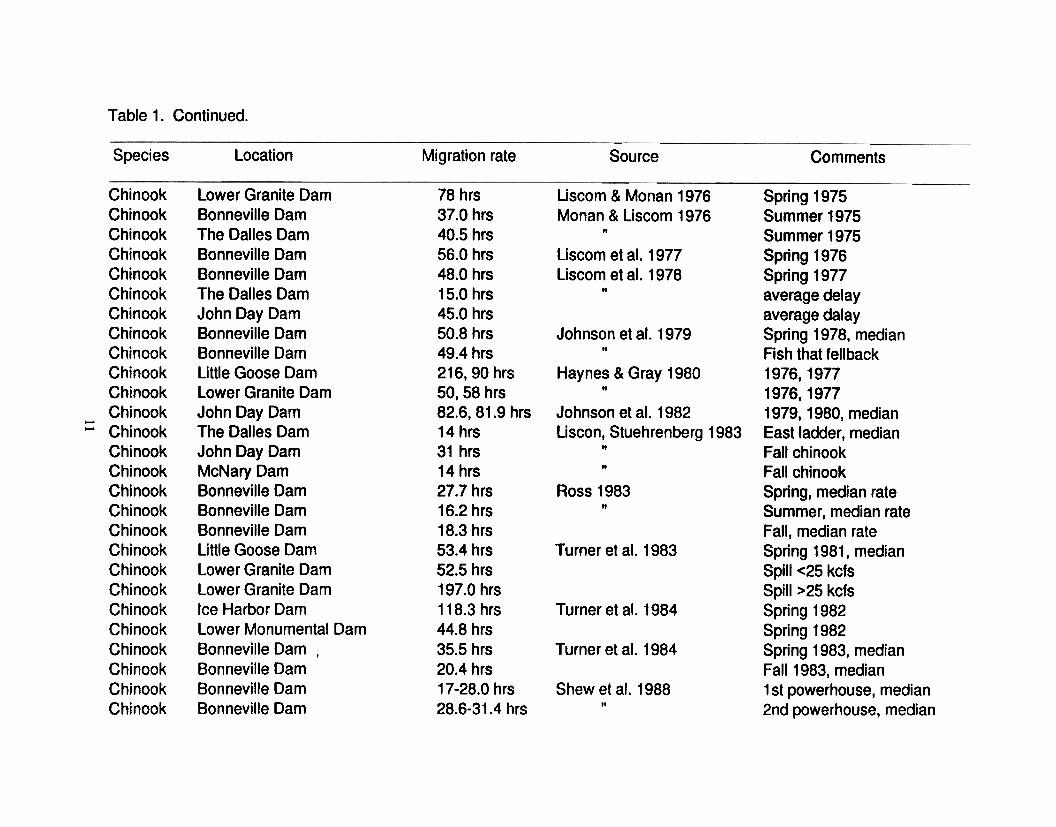
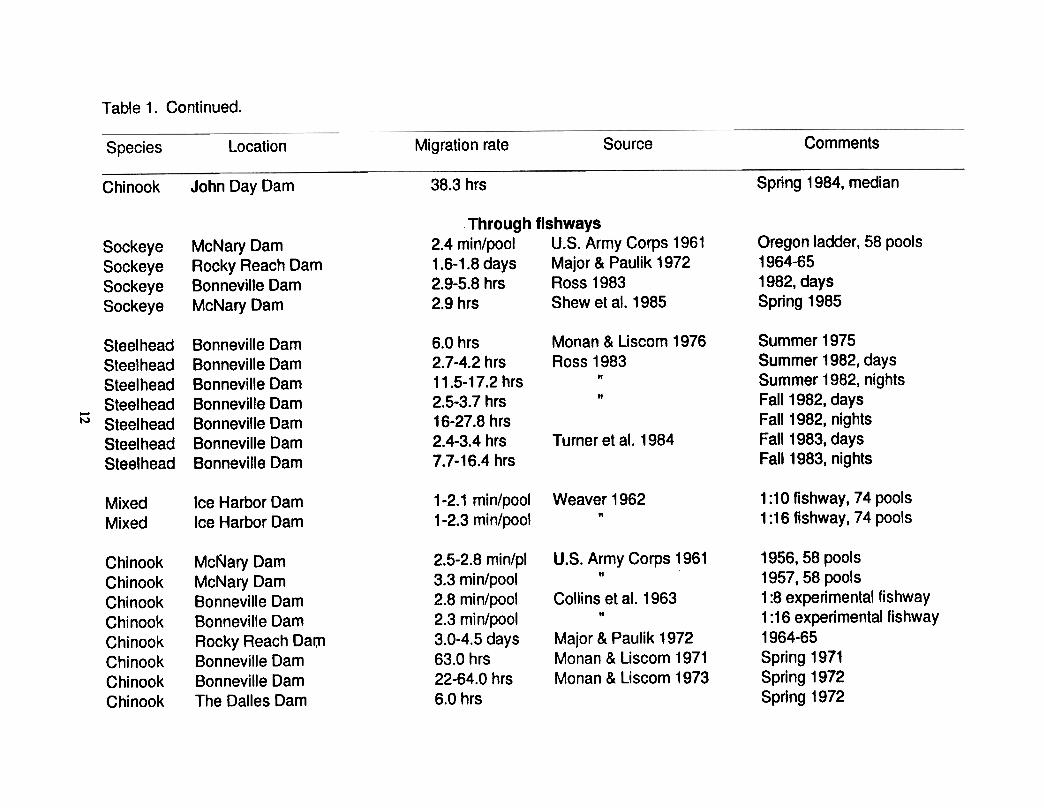
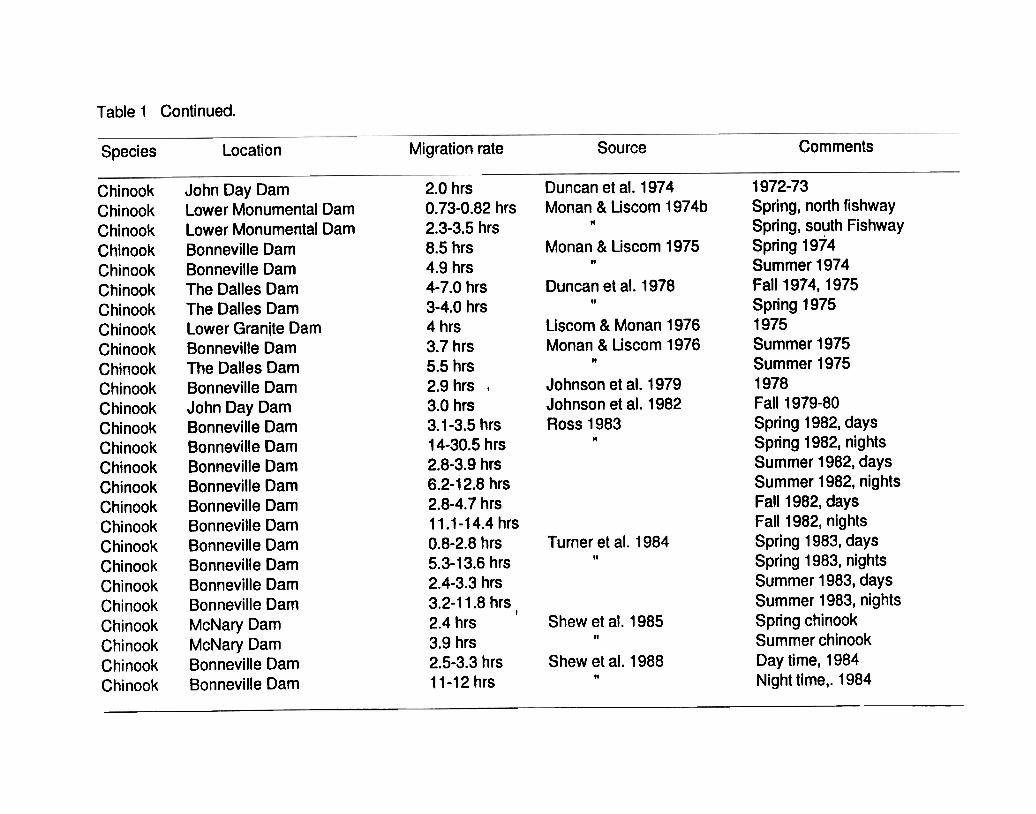
Adult salmon and steelhead havemigrated up the Columbia and Snakerivers for thousands of years and hadadapted to the natural seasonal cycles andvariations in flows and temperatures.Natural rates of upstream migration varyand depef]d on the species, stock,destination, and season of the year.Migration rates of salmon and steel headmoving up the Columbia and Snake rivershave been measured directly in a numberof studies, and incidentally observed inseveral other studies {Table 1 ).
In general, chinook salmon migratedupstream in the unimpounded Snake Riverand its tributaries at rates of 20-24 km/dduring spring and summer, steel head atrates of 1 0-16 km/d when activelymigrating in summer, early fall, or spring,but they had periods of almost nomovement in late fall and winter, andsockeye salmon migrated at rates of 19km/d in summer (Table 1 ). The path ofmigration in the rivers for chinook andsockeye salmon was not reported, butsteel head in the Snake River were mostoften found within 20-30 m of shore andnear the bottom.
The earliest study of migration rates inunimpounded Snake basin stream~ wasreported by the Oregon Fish Commission(1960b). Adult salmon and steel head werecollected and tagged at Lewiston, Idaho(5,824 chinook salmon, 5,273 steelhead,and 540 sockeye salmon) in 1954-1957and recovered in fyke nets at upstreamlocations, from spawning grounds, andfrom the sport fishery .Chinook salmonrecovered in upstream fyke nets averagedmigration rates of 20.9 and 24.1 km/d in
The effect of season and cold watertemperatures on steel head migration rateswas demonstrated by Falter and Ringe(1974) while tracking 84 steel head withradio transmitters through the Snake Riverupstream from the Lower Granite Dam sitein 1969, 1970, and 1971. From July toearly September, the steel head moved atrelatively constant rates 24 hours a day.
As the temperatures decreased from 21OC
to 3oC in the fall, the migration ratedecreased. Rates of 10.7 to 16.7 km/dwere measured in the summer and earlyfall, but as low as 0.5 km/d in the late fallfor steel head migrating from the LowerGranite Dam site to the Snake-Clearwaterconfluence. The steel head generally
Q)
C/)
.~Q)
.t::-0C
/)C
/)Q
)"'2:;)~~C
/)...Q
)-Q
)E..Q~Q
)...~C
/)Q
)-~a:c:.U
)~[D...Q
).~a:~:cE:;)0(.)Q
).t::-c
a).--
~C
/) .-
Q)
...-a.~
0
ca.oa.
.-~-~
c
C'Q
).-.t::E
~
"'Cc
~
Q)
Q)
>.t::
.--C
)Q
) Q
)Q
) ...
-~C/)
"'CC
/)c
Q)
~
Ec;o
Q)
E
C)
-~~
C/)
U)C
/)I
~~
c..Q
) .
-C..c ~
~
0
~.t::
C/)
Q)
(.)...:)o00 (/)
-c0>EEo(,)Q)
-(\1~c:o;(\1~0>
~U)
Q)
.(3Q)
0.00 cO;C
tI0O-J
EttSC0~"'(0:CQ
)..c.1-Q
)~0
-
Q)
mmo{00)~E.
EoU.r.(1)iI:
U)
c...0G
)c>>
Q
)-'-...0Qci0=!
--IL.
EcuC2::-cu
Zo~0-Q)
.>Q)
c:c:0£I)
~0>O..c.OO
C/)
-c::30OEtU
(1)"C
~O
tULt)-J
Ia:>.c
~C
/)m
;~
"C
E~
e 0
u..-
.r:;otUQ)
a:>-~
~Q
)>
O
.-oa:
a:c:o
o-EQ
)-=
tU
.>
00Q
) ~
c: Q
)c:
a.oa.
m~
.q-MromN
~(1) (1)
>->
-(1)
(1)~
~o o
o 0
0000 .0OCD
0),...EE.q-
OC
DO
O).c
,...(/)"C
iI:c:
c:0
0E
C)
>.<
1>(0 a:O
E
E(/)
(/) cu
cuc
cC
D
CD
>
>
C
CO
0
c:c:--(/)
(/)C
C
O
O~
~
E
E
-CD
C
D
CD
C
D
CD
---J-J»>C
U
CU
O
O
U
)U)--c:c:c:
--CD
CD
EE
CD
CD
CD
~~
CU
CU
~~
~C
UC
UC
CC
UC
UC
U
cc ccc
U)U
)2::-2::-U)U
)U)
CU
C
U
CD
CD
ZZ
CD
CD
CD
~~
()()~~
~=
>=
>~
~-J-J-J
..-1'--
Wl'--m
W
Lt)
cJ>0;>
~(\1'.:.90
"0(\1 ..0.
(\10 ..-a>
M
0..-
"0"0"0"0"0"0"0~
~~
~~
~~
Q)Q
)Q)Q
)Q)Q
)Q)
.c.c.c.c.c.c.c
"'Q)"'Q
)"'Q)"'Q
)"'Q)"'Q
)"'Q)
Q)Q
)Q)Q
)Q)Q
)Q)
00000000000000
(Y)
(00)~{1)Q
)c0J~z
~e:3m
~""'m~0>0>c.oc~=...0>
-"'ffiL1.
8
ECtS
cQ)
-.c:co
eco
Lt) ..-~
Lt) 0>
0,
I C
O
..-, I
Q)
~Lt)
.O>
°~Lt),.C
CO
..-' ~
O>
~Q
)Lt)...O>
q..-Lt)U
.0>Q
)..-~C
)0>~
..-E
=Q
)c..-
..,...
.~
=
.=E
E
'E
.E
a. C
tS
~
a. :)
.-Q)
(/)u.-')«(/)~m
..-CX
)0)..-
m-0>~0>:0(\1-00
..0OCD
0>..-EEoU.c(/)iI:c:o0)~0 U
)&
l)I&
l)&
l)0)U
)...Q
)>~coE"'i:a
(/)"0>~tUc(/)...8.c..=
>
vNI
f'-.."~o0c::2O
..cCtS
1'-1'-coco
mm
o1'-
"O"O
mcc..-
~~
"O~
~Q
)u
u 0
.~
.~
"0
-(/)(/)WO>...G
)0G
)a:
E...m
.-CO
...2:
.=
.=
.=
.=
OQ
)oooo.c
~2:2:2:2:~
a:Q
)Q)Q
)Q):I:
(/) (/)
(/) (/)
.cQ)Q
)Q)Q
)Q)
(,)a:a:a:a:.2m
Q
) O
Q)ooo--
a:.c.c.c=~
>
t;;..
>-m
mm
Q)m
~:I::I::I:C
:Z
(,) c:
oQ)Q
)Q)o.g
a:.2.2.2[D~
"0"0"0"0"0"0C
tS
CtS
C
tS
CtS
C
tS
CtS
Q)Q
)Q)Q
)Q)Q
)
..c:..c:..c:..c:..c:..c:
"Q)"Q
)"Q)"Q
)"Q)"Q
)
Q)Q
)Q)Q
)Q)Q
)
(/)(/)(/)(/)(/)(/)
O0000
0>r
~
O>
Q)
~C
).c:"'ffi[I:-Q
)~E
c:
O
c:o
O(/)
.-~
CD
""""""0)~0)
Ll)' 0)0)~
CX
>(0
(0 (0
(0 .~
"""
0) 0)
0) 0)
(/)0. 0)
~~
~~
~
..r:...r:. ..r:.
~-
-<0
t: E
E
.
~~
CX
)~~
<O
;C"J;C
"J;NC
"J;Ln;~
~~
~~
1t>
00~~cici
E
EQ
) Q
)--~
~
Q)
Q)
--tU
tU~
~
..:..:Q
) Q
)E
E
E
E~
~
(/)(/)
U)
cx:>m~m-0>E
=
O(..)U
)::J.c:.c:--E
E
~~O)(¥)
00'- '-
.0.0C
:: C
::Q
) Q
)C
/) C
/)Q
) Q
)a:a:
mm
--c: c:
Q)
Q)
E
E::)
::)c:
c:o
o~
~'- '-
Q)
Q)
~
~o
0-.J-.J
"0"0
CtS
C
tS
Q)
Q)
..c::..c::
"'Q)"'Q
)
Q)
Q)
--
(j)(j)
i::)c;cOO..-0>:0m..-
(/)(1)
.0~(/) c:o~(.)O-J 0>-eco;e0)
~ G>
(,)~~o00 (/)-c:0.>EEoO
~~
~~
~~
~~
~~
~~
~~
~~
~ooooooooooooooooooooooooooooooooooccccccccccccccccc
~~
~~
~~
~~
~~
~~
~~
~~
~
ooooooooooooooooo
00(0m..-M"0
r C
m
~
..-
~
E..r::.
o-0~
U)
C/)
O
.-~
r J
C:m
olSQ
)~c:=
=U
)~.S
? .~
c:
Q)Q
)ot=
~~
U')
, 0>~m-Q)
=0)c:~0>-
CoC
of"'"f"'"f"'"0)0)f"'"
0)
cE..-
tU
0-=
CutU
oU)-
~
.-Q)
-J ...
~~
~
EcU
)=otU
tUuc~U
)ou
::J~~
oCX
)
CX
)mm
~(¥).qoLt)
, ,
~C
X)C
X)C
X)C
X)
mm
>.m
mo>
m~
~cu~
~~
~
-a-a~-a~
~-a
Q)Q
)~Q
)--Q)
(1) Q
) Q
)
EC
:Q)Q
) E
ooc:-Q)Q
)oo
(1)--.CC
:C:
o.c---ca
(1) .-cu
-~
~
(1)
;:j~:t:(/}I-I-;:j
9
'C
a)tU
,...
Q)
0>..c:
..."'Q)
~
C\I
Q)
C\I
C\I
Q)
~oa) a)
Eh.-'...
-0>0>
1- 0>
.qo
C/)
0 E
~
qo
,... It)
Q)
,... .E
Q)~
oS
C\I
~
~ h.-
0>
h.- c
h.- ..c:
--(C
C
/) uf
C/) 1-
1- 0
1- O
tU
tU
O>
~
~o~
~
Q)~
C
/)(C(C
~
Q)'...
...~0-
EQ
)'...'...E
'... c...
~C
)=-C
) C
)'C
II C
) 1
tUtU
O
C
C
C
-It)it>
C
(C(C
(C
.C
~
..c: .C
E
.c
-=
,... ,...
.c E
,...
,... 'C
'C
a)
0>
C.o.2>
c.~
c.go>o>
C
.~0>
0>~
~0>
(/) ..J
:I: (/)
(/) .(/) (/)
(/) ~
~
'- '-
'-.0
.0 .0
2:. 2:.
2:.Q
) Q
) '-
Q)
{/) {/)
.-{/)'-
Q)
Q)o,-
Q)
'- '-
'- '-
'- .0
'- '-
a: '-
'- a:
2:. .0 '-
a:.=
.0
.0 .0
.0 .0
2:. .0 .0
-.0 .0
-Q)
2:. .0 -
~2:.2:.2:.2:.2:.Q
)2:.2:.~2:.2:.~
~Q
)2:.~Q
)Q
) Q
) Q
) Q
) Q
)Q
){/)
Q)
Q)
Q)
c Q
) Q
)Q
)c
a:Q
){/)
Q)
Q)
c{/)
{/) {/)
{/) {/)
{/) {/)
{/) {/)
{/){/)Q
)Q)Q
)Q)Q
)a:Q)Q
)EQ
)Q)E
~a:Q
)E~
a:
a: a:
a: a:
Q)
a: a:
~
a: a:
~
.2 Q
) a:
~Q
) Q
) Q
) Q
) Q
) {/)
Q)
'- C
Q
) Q
) C
ca
{/) '-
CQ
) 0-
.8°--°'-oQ
o
~~
~~
~~
0~'-~
~~
~~
0~~
cQ)Q
)Q)Q
)Q)~
Q)ca,-Q
)Q),-,-~
ca,-
3:cccccQ)C
:I:Q)ccQ
)Q)Q
):I:Q)
OcccccE
cQ)3:cc3:3:E
Q)3:
'- O
O
O
O
O
.-O
r,
O
O
O
O
O
.-, r,
Om
mm
mm
m~
m~
~m
m~
~~
~~
.c.cE
.c
«) v
(0""" E
~
E...c
...c ~
N
~(0
U')
~
U')0>
~
0.- U
').-(¥)
t:: (¥)
V
t:: ...
I I
~
I I
~
U')
.-(¥)",,"O>
oo .-(0
«),"';-(¥)0"';-
(0U')
..(0 .0U
') ..v
(oU')U
')N.-N
. ..-U
') ."""
..(0(0.
.-NN
.-N
N.-(¥)
NO
U')U
').-
<D
<D
0>..-Q)
(.)~
cu
<D
=
0>
cu
..-:s:
Ut-g
~E
o: c
m
E
o"C
>-
~"C
cu
oca:
:I::mU
t...0>...0Q
) .
Ut
NQ
) M
~M
a:>6ui~
wN
N..-
Q)Q
)Q)
>->
->-
Q)Q
)Q)
~~
~o
o o
o o
o(/)(/)(/)
..C:.E
..C:.
°CtS
°C
tS,
CtS
Q)
Q)
a: ~
a:
>.C
tS>
.~
z~
° °
o °
oa:~
a:o
o o
---
~~
~0>
">
">
Q)Q
)Q)
c:c:c:'C
: c:
c:o
o o
D)
D)
D)
°-c:~8 E
E
mm
c"00M
~<
0-I m
~C
Lt)Q)
m.c:
~I-
E-<
000<
0...m
mu.a..~
Q)
-
Q)
Q)
.2(/)
(/) as
00...O
O~
~~
...Q
)Q)Q
)-->-->.-=
..-=.0
-J-J-J
000---Q
) -00=
.c.c>
Q
)asas
C::I::I:
C:Q
)Q)
0 U
U
m--
"0"0"0~
~
~
Q)Q
)Q)
.c:.c:.c:
"'0)"'0)"'0)Q
)Q)Q
)---
000000
v<D
vaN
aC
\I~~
I I
IC
\I<D
CX
)aja>
: 0C
X>
0)~0>0)c:
~~c:c:oiIi ~
c: "ffi
o -
cn c:
~
0>0>
E
cn
cn :)
E.c
C:m
j ~
o"0
0>
0>
cn
~Lt)~
O~
, oo
o>m
-J~~
o-"U)'o>
o>"ffi~
EO
L.L.a..~
-0Q)
~c:;c:OOQ
):0C
tSt-
Q)
0:JO(/)co:;;ttSu0..J U)
-cQ)
EEoO(/)Q
).0Q
)0.
(/) Q)
~c:o~0)~
EE
EQ
)Q)Q
)m
mm
(/)(/)(/)000000
~~
~ooo
mm
m~
~~
ZZ
Z.9?9?.9?.
000==
=
~~
~::i::i::i
000000
.9?9?9?0.9?..9?.
~~
~-e~
~Q
)Q)Q
)mQ
)Q)
ccc:I:ccC
CC
cc
000 Q
)o
00
CD
CD
CD
-CD
CD
(\I...qo
, .
(\I o
mooC
';-'co, qo
..an
a>
0 .~
..qo
(\I~(\1a>
(\1~
~Otom,...EE..q:o
0"'""O
m,...
.c .
C/)-
.-~u..-
Q)
C
-=00)O
)CQ
) :]
'- 0
0>-
~~
~~
~~
000000000000c:c:c:c:c:c:
:2:2:2:2:2:2
000000
, , 0>0>
..-, .0>
~..-
--=0>
tU~
-0>
0>
--(/)c:-tU
O
~(/)
.0O
.-
~~ E~Q"'ffi
-(f)
c:,
Q)
.qo
m(f)E
,
, ~
I
C:(f)(f)
=~
mO
' '
~0
~m
m
u.O~
c:O
~
.-Q
) ~
(/)
...£g~~
~Q
) .-o
o o
EC
>..C
:..J-;:c:O
-
E
.c: =
0
~
"E>
~
a. ~
~
0
.-cncnU
.c J:I;
ECtS
C~.~c:c:om U)
....r:.
~(W)
U)
(W)
«>0)..-(/)(/)
(I) o
Ea:
m'C-(I)m0..
Q)
ecas
i~
<1>
>-
<1>
~ooU>
~m..-mE'
om0..-C
/)-.;~
CU
~'"Q
)C
E
=
~
m
oc
0O
C
/)~
~
EE
ES
EE
EE
Cmm
m
'\I
m
m
m
m
CC
CC
CC
CQ
).!?!?m
>-.!?!?!?~
==
-m=
==
o>
>
-a
C>
>
>
,n
Q)Q
)c
Q)Q
)Q)"""
c:c: c:C
:C:C
:
C:C
:Q).C
:C:C
:C:~
oo.c:o
ooo-m
ml-Jm
mm
~
~.c«>(1)
(1) (1)
(1) (1)
.
'-'-(1)'-'-'-(1)N.c.c,-.c.c.c,-N
oo.Coco«>
.cM
a;m0);cw
)r--:cO",,:r--:
CW
)U').-coC
W).-0).-
"'C"'C
"'C"'C
"'C"'C
"'C"'C
CtS
C
tS
CtS
C
tS
CtS
C
tS
CtS
C
tSQ
) Q
) Q
) Q
) Q
) Q
) Q
) Q
)..r:...r:...r:...r:...r:...r:...r:...r:.
"'Q)"'Q
)"'Q)"'Q
)"'Q)"'Q
)"'Q)"'Q
)Q
) Q
) Q
) Q
) Q
) Q
) Q
) Q
)
WW
WW
WW
WW
10
(¥)C
X)
0)&~(/)(/)0CI:
Cca:0Q
) C
~~
~E
.~~
~~
-ci"-gQ
)Q)Q
)mE
Q)
"C"C
"C.c
-.c
Q)
Q)
Q) -Q
)-ci"
eU
)C>
C>
C>
ca
;cacacaQ)Q
)cca
...Q)
Q)
Q)
U)
.c .-
:J»>
"C
S!.cacacaQ
)mQ
)~
~
~
~
E'U
)ELt),
, ,
E~
,
, =
=a>
m
m
m
m
,~
ca ca
m"..u.u
.q-Lt>00000)0)
-:-:as as
--0>
0>
-.E0>
O
E
(.)
.:=:.:3
(W)
, 0)..-Eo(,)(/)
:,:j
~c =
~c0~(1) (1)
...(1) >
-
.r.(1) >
-rn~
...(1)(1)rn"C(1)(1)
m.r
"Co
~m
.r..r. ..r..r.
'MO
MO
;T;""O
O~
1..C\JLt)..
OM
C\Jv
I .or-..
~C
\Jvm~
o(()v
~~
~~
~~
~~
0000000000000000cccccccc
:2:2:2:2:2:2:2:200000000 .c.qo
, 0)~Eouf/)::i~c:
:
~c:0~ rn rn
--o o
~~(\Ita
0)0)M
ro... v
(\I(\1MM
MM
V~
ro...ro...ro...ro...ro...ro...ro...~
0)0)0)0)0)0)0)...~
~~
~~
~~
Q)
C)C
)C)C
)C)C
)C)E
ccccccc.c
.c .c
.c .c
.c "C
E
Q.Q
.Q.Q
.Q.Q
.Q.~
(/)(/)(/)(/)(/)(/)(/)(/)E
Em
m
ccmm
--
EE
~~
EE
EE
mm
EE
mm
mm
Cc:;,:;,C
CC
CQ
) (/)
C
C
Q)
(/) Q
) Q
)-Q
)OO
-Q)--
--~~
- --
.>
m
~
~
.>
=ffi
.>
.>
Q)c'-'-Q
)-Q)Q
)C
Q
)Q)c~
ccC
Q)3:3:C
Q)C
CO
..r::.OO
O..r::.O
Om
l---J-Jml--m
m
~0)OP
-
""ffi-Q
) :
0)c::JO>-
in, m~Eoocn~~
-c: -
(tSc:O~
"0Q)
:)c;cOO~Q)
~m1--
(/)Q
).0~00 co;cao0-J 0>u...~0(/)0>-ec:o~'-0>
~ U>
-c:0>EEou
~~
~~
~~
~~
~~
~~
~~
~~
~~
~~
~~
~~
~~
~o
o o
o o
o o
o o
o o
o o
o o
o o
o o
o o
o o
o o
o o
o o
o o
o o
o o
o o
o o
o o
o o
o o
o o
o o
o o
o o
oc
c c
c c
c c
c c
c c
c c
c c
c c
c c
c c
c c
c c
c c
~~
~~
~~
~~
~~
~~
~~
~~
~~
~~
~~
~~
~~
~ooooooooooooooooooooooooooo
~
cncn
.c. cn..C
..c~0);
cncn ..C
v
~~
~~
~~
~~
o.c.~
~~
~~
~..c..c~
~~
o~~
.c..c..c..c..c..c..c..c.mC
X)C
X)cncncn.c..c..c..c..c.
O-.C
..C..C
.~M
-Ll) -~
~
~
..."
.c.~~
~~
~~
~~
~
-~.c..c..c.~
~~
~~
~~
~~
~~
~
CX
)~ow
CX
)Ll)Ll)Om
~O
Nv~
v~W
CX
)MN
m~
vLl)O~
cx)~
MvLl)v~
vLl)vNLl)C
X)~
~~
N~
~Ll)Ll)~
~v~
N~
N
<0<
0
0)0)~
~c E
(tS
Oc
oo
(/)
~::J
~~E
c=O
(tS
o c
(/) 0
::J~
f'.CD
f'.f'.0)0)~
~
mm
--0) 0)
EE
=o
oo
o(/)
(/)::J::J
m, mop-
m-Q)
co =
U)
c.c.o~
0CX
)0)~>
-e"~(I)
:0.>t::>
-C
tSJ:
11 M000>~0)~
C\JQ
)oo.c0>
c:
~
Q)
.~-.cC
tS
Q)
-:JQ)-
c:(,()o
-=
=U
) c:
c: 0
.c°
~:3
(¥)000)=
U)
U)
0[I:
MCX
>0>~"(U-0)0)c:
~
v000)
-ca-Q
)
Q)
c::J1-
EcaC
E
E
E
E
roca
Eca
Ecaca
EC
EE
EE
EE
EE
caCE
EE
EE
EcaC
CE
Q)E
EE
E
Q)cacacacaca
cacaCQ
) ca
cacacaCQ
)Q)caE
cacacaca
~C
CC
CC
caCC
Q)~
caCcaE
CC
CQ
)~~
C~
CC
CC
~
Q)
0 Q
) Q
) 0C
Q
) Q
) 0
~C
0C
Cca Q
) Q
) Q
) 0
~
~
~
~oQ
) Q
) Q
) Q
)~
-Q)--Q
)~--0~
~Q
)~
---0~~
0 ~
~~
~~
~ca~
~o~
ca~ca~
~~
~0~
~~
~~
~~
~
~Q
)C
Q)Q
)C
CQ
)Q)~
~C
CC
caQ)Q
)Q)~
~~
ca~Q
)Q)Q
)Q)
Q)C
~
~
C~
~
Q)C
C
cc~
Q
)Q):I:Q
)~~
~C
~
~
Q)
~
~
Q)..c.
~
~~
~
..c. Q
)..C.Z
O~
~
~
~
~
~Q
)~
~
~
~
~
oO
..c.OO
..c.o
OO
-oo
..c.o
000-00
00000
~m
~m
m~
~m
m~
~~
~~
~m
mm
~~
~~
~m
mm
m
..q-00m~"'(0-Q
)...Q
)c:...~1-
a:>a:>0)~m'"03=
~Q)
..r::.00 C
CttS
ttS
.-
.-"0
C
~
C
C
"0 Q
)
ttS
C
C
Q)
ttS
ttS
ttS
Q)
E.-ttS
ttS
E
"0 ttS
"0
"0 C
~
Q)..X
: "0"0
...5Q)Q
) Q
)ttS
~O
>E
(.) Q
) Q
) C
EE
.-Q)
C/)
&l)
&l)
>.
>.
ttS
E
E
ttS
=c
e "OQ
)C
/) :J
, ,
ttS
ttS
~
..c .-Q
) ~
C
/) ~
-:J
0
&l)m
m~
'Q
)-w
=Q
)~
~0
~~
..X:..X
:"0E
C~
o (.)N
NM
E
O
~,
, ,
..., 1-
1- Q
) °
0 Q
) ttS
W
~
~
W
W
W
~
...
m
~
~
m
m
"0 "0
m
-, ,
W
"0 0
O
E
~
.-m
--~
m
m
m
~
...Q)
~
G>
G
>~
~
Q)
Q)~
-a~~
~"0.S
.S
~G
>-g~
I£I£~~
~~
~
~
C)E
E
C
)C)2>
2>C
)-:5 ~
~
~
~~
~
C)E
E
C
)v A
C
)C)C
)m
0 °c..
cE
Ecc
c ~
~m
-~~
C
C
CC
C~
c...c
.c .c
G>
G
> .c
~
, ,
, C
/) =
=
.c E
=
.c
=
=
.c .~
.~
=
"0
c.. :J
:J c..
c.. >
>
c..
.~
m
m
m
ttS
ttS
ttS
c.. :J
ttS
c.. c..
c.. c..
c.. c..
ttS
"U)
CO
OO
OO
OO
OO
OttS
ttSO
O~
~~
~W
~~
OO
OO
~O
OO
OO
OO
OO
OO
O~
~N
"0Q)
:Jc:;c:OO~Q
)::0m1-
Q)
(,)~::JO00 U
)-c:0>EEoO
c=0".;;mu0-J 0.>-C
t1...co~...0>
~(f)Q
).(3Q
)a-
(/)
c:ca
:00)E-q-C
X)
0)~0>c:"c:0.00(/)'-
..r:.
CV
);«>ME~c>
-~c~.co~~o0c:2(,.)
(/)aoQ
.(0Ll).:0.)-0
Ll)-0
U)(O
~
>-0>
-~c:Ll)-0~o~
~
O)
0) ~
(\I
.§
O.)(C
CX
>Q
.O
~~
(/)ECtS
c E
E..r::.C
tSE
CtS
°CC
tSC
m..9?C
~a:
~
~C
tS>
-Q)C
tSz~
Ez
° o
o °
~a:m
~
0>0>
0>0>
>->
->->
-0)0)0)0)
~~
~~
o o
o o
o o
o o
00000000
..-<0
0>C
\I..-r U
)O>
Ll)
c C
X)
~0
.-0>
u"3..-
>-ttS
M~
EC
..CX
)ttSU
)«
~~
w
>
~
m
.oU»
~
(/) .m
U
) Q
)~
.O
..c.
'5=>
~a:(/)
~.cC')-
U)
~°>
-U)
O°ttS
~
c c.
.c-""L-
.s: C
X) C
X)
U)
r-E'...:Lr).C
I I
V<
OO
>O
>N
'...:NN
tomEo(,)(/)~
M00
~m
- -
--c: as
(/)
c: (/)
0 0
~a:
cn...cncn.r.cn~
cn......C
\I r
r..r.
..r. .r.
v
cnC\lf"'"f"'"aJ;V
.f"'"
.(D.r.
v. .I.. (W
)C
\I(W
) I
.., I
I I
Of"'"
.&l)
I vf"'"
(D
..
(DC
\I C
\I C
\lf"'"
EE
EE
EE
E(\3(\3(\3(\3(\3(\3(\3
0000000
~~
~~
~~
~.5:
.5: .5:
.5: .5:
.5: .5:
Q)Q
)Q)Q
)Q)Q
)Q)
c:c:c:c:c:c:c:c:c:c:c:c:c:c:0000000
mm
mm
mm
m
"'C"'C
"'C"'C
"'C"'C
"'C
mm
mm
mm
m
Q)Q
)Q)Q
)Q)Q
)Q)
.r:..r:..r:..r:..r:..r:..r:.
(/)(/)->
-.c~
.2>
-0 c:
(/) (/)
(/)-(/)-1l)
N
N
>-.c
>-.c
, «>
«>
~
.2>
~
.2>
0)0)0)-0 c:-oc:
12
~a:>m~m-0)~0)c:~~t-
~
~
00o o
0..0..
.qo.qo"""""'"'
>.>
.~
~
~
~.c.c~
~
0;0;
o<C
~~
~~00o
00.0.
--c c
"E
"E
..-(W)
NNI
I~
~
(\I(00>..-~Q
) :
~~E
Em
m
00~
~o
o.c.c~
~
m
mJ:J:Q
) Q
).£.£
-0-0Q
) Q
)x
x
~~
tomcne-ou>-
E=
«(/)=
>:e (/)
coo°>-
(/).-°
° °
m
~
Ec.C
.C."7"0..C
.---'""(/)0
a:>
.;: .;:
.;: Lt)
.c .(/)
~E
EE
~o~
.CLt)(Y
)a:>(Y
)0 .'0
(Y)
N
.N
(y)NN
(y)(oN(o
~~
~~
~~
~~
0000000000000000c:
c: c:
c: c:
c: c:
c::E
:E:E
:E:E
:E:E
:E00000000 MC
D0)~m-0>I/) :
.s:oo
>-
>-~
~
~
~.c
.c (/)
(/);;--~~
-(/)(/)-c:
--C:Q
)
OO
Q)E
O
O
E.-
..-NN
a. a..-
~
, ,
, ---0>
0>0>
CX
)CX
)Q)a.I.t)~
~~
1.t)1.t)a.X<
D--x
Q)
I C
)C)C
)
<D
' Q
) V
C:C
:C:
., ,...
<D
" M
' M
' C
X)
~
0>0>
..~
O>
a.a.a.
~~
~
cncncn--CW
),
, (\Im
m
, ~EE
~oo
.-o o
-fnfn:JC
(1j'-J-J
a..~~
~c:c:...(1j'
(1j'.2.
c: c:
(1j' o
0
~~
~E-
ca
EE
OE
E~
EE
caca..c:cacao
00(,)00
ca ca
Q)
Q)
ca Q
) Q
) (/)
OO
--Q)--Q
)--c:
---
~~
» »ca
~.
~-
Q)
Q)
>-
Q)
Q)
0cacacc~
cc.Z
Z
c
c (,)
c c
Q)
(,)(,)ooooo..c:~
~C
DC
Dc:C
DC
D~
"'Q)"'Q
)"'Q)"'Q
)"'Q)"'Q
)"'Q)
0>0>
0>0>
0>0>
0>
00000000000000
~
~
~
~C
\lC\I(W
')(W')
G>
G>
G>
«>«>
«>«>
EE
Em
mm
mE
EE
==
==
~~
~"'(U
"'(U"'(U
"'(Ucncncnu.u.u.u.
"00>~c:~c:OO..-0):0~1--
Q)
u...~0(/) U>
-c0>EEoO
Q)
"CU
...c:o~...0>
~(/)Q
).0Q
)0.
(J)
c:o;m(,)
..9
C/)
C/)
~
C/)
~
C/)
C/)
.cC/)
C/)f!:C
/)~C
/).CC
/)~C
/)~
C/)
C\I~
~
.c~.C
:~.qo~
.C~
.C
~C
/)a:>
.C
f!:f!: .c
.Ca:>
.C
..CC
O.C
a:>
.c~
C/)
.Ll')C/)C
/).C.C
C
/)C/)C
/)C/)Ll')Ln;m
.,
qoa:>
.M
.C/)C
/)M.C
~O
.~
~
~
~
~
~
.0
.C\I
.,- .M
.,-
~
~
.C\I
.c~M
.c.cOO
C/).c.C
.C.C
M~
M,-.qo~
C\I~
M,-.c.C
M-
I ..~
I
I I
I ,
I I
I I
I .
~~
~Ln;~
~~
.C~
Ln;~~
~~
~~
~~
~~
~~
~~
Ln;~N
ON
a:>.qo.qoM
.qoMLl')N
MM
,-NC
ON
,-OLl')N
MN
MN
,-
~~
~~
~~
~~
~~
~~
~~
~~
~~
~~
~~
~~
~~
o o
o o
o o
o o
o o
o o
o o
o o
o o
o o
o o
o o
o o
o o
o o
o o
o o
o o
o o
o o
o o
o o
o o
o o
o o
o o
c: c:
c: c:
c: c:
c: c:
c: c:
c: c:
c: c:
c: c:
c: c:
c: c:
c: c:
c: c:
c: c:
~~
~~
~~
~~
~~
~~
~~
~~
~~
~~
~~
~~
~~
oooooooooooooooooooooooooo
.0vr---
vmr mE
..-0.0-<
I)as
.---lQ
)otJC
-
asC-
0 as
C
C:)
0C
~
E
EC
tS C
tSC
C--E~
~
CtS
E~
~E
E55cE
5EE
EE
EE
EE
EE
EE
E
EE
E
C
tS
CtS
.\I
.\I Q
) C
tS
.\I C
tS
CtS
C
tS
CtS
C
tS
CtS
C
tS
CtS
C
tS
CtS
C
tS
CtS
C
tS~
~
~
C
C
C
C
.E
C
C
C
~
C
C
C
C
C
C
C
C
C
C
E
E
C
C
~55~
~~
~e~
~~
~~
~~
~~
~~
~~
~~
~~
~
CtS
~~
33~~
~3~
3CtS
3333333333~~
33c~
~Q
)Q)
cc~
Q)
cQ
)cQ)Q
)Q)Q
)Q)Q
)Q)Q
)Q)Q
)CtS
CtS
Q)Q
)
c:Q)Q
)C:C
: Q
)C:
C:c:C
:C:C
:C:C
:C:C
:C:C
:C:
c:c:
.c ~
~
c:
c: Q
) Q) ~
c:
Q) C
:.c c:
c: c:
c: c:
c: c:
c: c:
c:'76Zo
c: c:
ooooo.c.coo.coooooooooooo~~
oo~
~~
mm
~~
~m
~m
~m
mm
mm
mm
mm
m~
~m
m
il)'0>,..Eo(J(/)
~~c: =
mc:O~
«>, 0)~~-Q)
c =
m(,)c~0
coco,
, 0)0)
c: E
m
oc:
oo
C/)
~::J
~~Ec:=
0 m
o c:
C/)
0::J~
0)C\I
' a:>
0)0)
'"(0'"(0--(1)a.>
a.>
a:>
cc~O
O~
=000C
C
0
..C...C
.OO
Oa:
~~
>.
>.C
tS
fn fn
CtS
~
fnfn.E
fnfn.E~
.c fn-~
C)
fn->.C
).c
fn >
. .c
." .->
. .c
CtS
.-~
.q-
.A
.--C)
-0 ~
fn
-C)
-0 ~
0--
VI
LL. I.t)
." .-fn
-." .-~
.q-
,
; .q-,
I.t)I.t) -o~
NN
>..C
-o~M
Moo«>
m.c
-:5 .q-
, m
I.t)
, ,
o N
N
«>
«>
C
tS .2>
M
M
«>
«>
o
.5 m
~
't ~
-,
m
~
"'-- m
m
«>
«>
«>
m
m
-0
~
«>
«>
m
m
~
.c ~
:.
o o
oy- .1-
oy- oy-
I oy-
oy- ~
-~
~
.-O
~
Q
)~
fnm~
.q-m
~~
m
mm
~~
NN
mm
~~
.c~Q
)E
(¥) .~
~Q
)' O
Y-
Q)Q
) '
~O
Y-Q
)Q)«>
«>~
~Q
)Q)oQ
)E.-
to;- C
)C>
C)
EO
) C
)E
E0)
C)C
)E
EO
)O)
C)C
)E
E
C)E
.--N
~~
~
oy-~1.t)
«>oy-~
~
oy-~~
~
~
--
, .~
.~
.~
E
=
.~
,
E
E
, =
.~
.~
E
E
=
=
.~
.~
E
E
.~
E
>
. "E
>0)
c.. c..
c.. ~
C
tS
c.. 0)
~
~
0) C
tS
c.. c..
~
~
CtS
C
tS
c.. c..
~
~
c.. ~
C
tS .-
oy-WW
WW
LL.woy-W
Woy-LL.W
WW
WLL.LL.W
WW
WW
WC
Z
vCX
)0)..-
~-0) =
0)c:
~
Ll)a)0)~m-Q
) :
~Q)
..c.(/)
00000>~m-Q)
:
~Q)
..c:cn
moved upstream within 20 to 30 m of theshore and within 1.5 m of the bottom in theslow water velocities.
Additional information on the upstreammigration ability of sockeye salmon hasbeen obtained in other drainages and intest flumes. The swimming ability ofsockeye salmon as they moved upstreamwas evaluated in a 1956-57 experiment byforcing them to swim at constant velocitiesand temperatures in flumes until exhausted(Paulik and DeLacy 1958). Sockeyesalmon used in the tests were collected asthe peak of the run passed five locationson the Columbia and Wenatchee rivers;Bonneville, McNary, Rock Island,Tumwater, and White River dams. Paulikand DeLacy reported that the swimmingabilities of the sockeye salmon tended todecrease with the distance the fish hadmoved upstream from Bonneville Dam,and that fish exhausted during the dailytrials died sooner than control fish thatwere not tested. In the Karluk River ,Alaska, in 1945-46, Gard (1973) found thattagged sockeye salmon rJ1igrated at ratesof 4.7-5.3 km/d in the spring and 3.2-3.4km/d in the fall. Sockeye salmon wereobserved to migrate 9.5 to 39.7 km/d in theColumbia River in 1953-54 and 1962-63
(Major and MigheI11966).
Cool water temperatures in thesummer and early fall can also influencethe upstream migration of salmon andsteel head and lead to what appears asstraying. Steelhead destined for SnakeRiver tributaries upstream from theClearwater River mouth, were found toenter the Clearwater River in August andearly September when large discharges ofcool water from Dworshak Dam created atemperature difference between the Snakeand Clearwater rivers (Stabler et al. 1981 ).The fish eventually returned to the SnakeRiver and continued their migrationupstream. Steelhead migrating up thelower Columbia River have been observedmaking similar temporary detours into coolwater tributaries (notably the Little WhiteSalmon and Deschutes rivers).
Flows in the rivers also influence theupstream migrations of salmon andsteel head, but the effect of the flow cannotbe separated from that of the dam wherethe fish are counted. Davidson (1957)investigated the effects of floods on theColumbia River to chinook salmonmovements by comparing counts atBonneville Dam to changes in water levels.During 1939 and 1940, which hadmoderate spring runoffs (180-390 kcfs), thespring chinook salmon run was depictedby a smooth bell-shaped curve through theseason. The spring runoffs were high in1948 (400-1,000 kcfs) and 1949 (360-632
A similar detour into cool water by
chinook salmon was observed by Stableret al. (1981) in the Clearwater River in
1976. Prior to construction of Dworshak
Dam, the temperature of flows from the
North Fork of the Clearwater River weresimilar to those in the mainstream. In late
July and early August of 1976, however ,water released from Dworshak Dam was 1
to 7oC cooler than the mainstream
Clearwater River. Of the six radio taggedchinook salmon tracked through the
Clearwater-North Fork confluence area, all
six entered the North Fork at least once,
and remained in the North Fork for periods
ranging from 7 h to 10 d before resumingtheir migration upstream. Fish trackedprior to late July, when t~ere was not a
large variance in the temperature of the
two rivers, did not enter the North Fork.
14
kcfs). During those years the springchinook salmon counts dropped from4,000 fish/d to less than 100 fish/d duringthe peak floods. Fish counts thenincreased as the flows subsided.Davidson suggested that high turbiditiesand velocity barriers inhibited the upstreammovement. Similar effects were seen atRock Island Dam (Davidson 1957). Rapidincreases of flow tended to temporarily haltupstream movement of salmon at the dam,independent of the initial flow level,whereas a gradual increase in flows to 400kcfs seemed to have little effect onupstream movement. When flows reached500 kcfs movement was significantlyreduced, and stopped all together at 600
kcfs. In both of these cases, we do not
know if the migration would have been
delayed if the dam had not been there.
There was no evidence that flows inthe Columbia or Snake rivers have everdecreased to a point where upstreammovement would be limited. In smallertributaries, irrigation diversions havereduced flows to such low levels that fishcould not migrate upstream. In the RiverVefsna, Norway, Atlantic salmon would notmove upstream until flows were above 70kcfs (Jensen et al. 1986; Jensen et al.
1989).
Migration Past Dams
Passage conditions at dams can varyseasonally and annually. Aside from thephysical structure itself, the main featuresrestricting or enhancing passage of adultsalmonids over a dam are the operationalprocedures and the amount, timing anddistribution of water passed through thedam. The studies reviewed in this sectiondeal specifically with the affects of power-peaking flows, spill patterns, andpowerhouse discharge patterns on adultpassage at lower Columbia and SnakeRiver dams.
(1) there are suitable attraction flows tolead fish to the fishway entrances, (2) theentrances to fishways can be found andentered without difficulty , (3) fish migraterapidly through the fishways, and (4) thefish are not likely to fallback over the dam.However, adult passage at dams is notalways successfully accomplished. Flowsat the dams, turbidity of the water, theamount of water spilled, the pattern of spill,and the discharge through the turbines cancomplicate and reduce the efficiency ofadult fish passage at dams, asdemonstrated by the delays and mortalitiesof salmon and steel head observed at theColumbia and Snake River dams.
Successful passage of dams by adultsalmon and steel head migrating to thespawning grounds includes finding theentrances to the fishways amid the array ofcurrents that are often present. moving intoand up the fishways. and entering theforebay. and proceeding upstream withoutfalling back over the dams via thespillways or through the intakes to theturbines. Passage is most efficient when:
An extreme example of the loss thancan occur at a dam is that which occurredin 1968 at John Day Dam (underconstruction at that time), when most of theflow was spilled, supersaturation ofdissolved gases was high, and there wasan estimated loss of 20,000 spring and
IS
summer chinook salmon: An additional32% of fish migrating between John Dayand McNary dams were also estimated tohave been lost (Haas et al. 1969; Haas etal. 1976). Failure to find the fishwayentrances rapidly was reported as a partialcause of the losses.
Bonneville Dam adult migrants weredelayed 2 to 3 days in 1948 (Schoning andJohnson 1956),1 to 4 days during 1973-76(Gibson et al. 1979), 2 days in 1977(Uscom et al. 1978), 2 days in 1978(Johnson et al. 1979), 1 to 1.5 days in 1983(Turner et al. 1984), and 2 days in 1984(Shew at al. 1985). Similar delays werereported for chinook salmon at The Dallesand John Day dams (Monan and Uscom1973; Uscom et al. 1978; Gibson et al.1979; Johnson et al. 1982; Uscom andStuehrenberg 1983; Shew et al. 1985;Shew et al. 1988). Chinook salmonexperienced a 1 day delay at McNary Damin 1982 and 1985 (Liscom andStuehrenberg 1983; Shew et al. 1985).
Less severe delays of adult salmonidshave been reported for Snake Rjver dams,and the delays generally increased withriver flows. Spring chinook salmon trackedat Lower Monumental Dam during a 1973study investigating the effect of spillwaydeflectors on adult passage were delayedan average 42.0 h during low river flows(39.2 kcfs), and 84.3 h during high riverflows (76.9 kcfs) (Monan and Liscom1974a; Monan et al. 1979a). Estimates of mortalities of adult
salmon and steel head attempting to passdams are difficult to make and little hasbeen reported. Estimates of mortalities ofadult salmon at Columbia River dams haveranged from 4% to 29% (French andWahle 1966; Gibson et al. 1979; Merrel' etal. 1971; Weiss 1970; Young et al. 1978).In general. adult passage is more difficult(increased delays and mortalities) duringthe high spring runoff flows than duringlower flows (Merrell et al. 1971 ; Monan andUscom 1971 ; Liscom et al. 1979; Gibsonet al. 1979: Bjornn and Rubin 1992).
In 1976 and 1977, Haynes and Gray(1980) found the delay of chinook salmonwith transmitters averaged 216 and 90 h atLittle Goose Dam, and 50 and 58 h atLower Granite Dam for the two years,respectively. Flows were unusually low in
1977.
In a 1981 study (Turner et al. 1983),spring chinook salmon with radiotransmitters were delayed an average of37.4 h at Uttle Goose Dam. At LowerGranite dam, delays averaged 31.7 hduring low flows (spill <25 kcfs), and 176.3h during high flows (spill >25 kcfs). In
1982, a year with above average flows,median delays of radio-tracked springchinook salmon were 118.6 h at Ice HarborDam, and 44.8 h at Lower MonumentalDam (Turner et al. 1984).
Entry Into Fishways
The success of adult salmon andsteel head passage at Columbia and SnakeRiver dams is dependent on the migrantslocating the fishway entrances and movinginto and up the fishways without unduedelay {Clay 1961 ). Factors that influencethe efficiency of fish entry into the fishwaysinclude the flow conditions in the tailraceand near the entrances to the fishways,
Delays of chinook salmon have alsobeen measured at Columbia River damsthrough the use of tagged fish. At
16
and the physical characteristics of theentrance (size, shape, location, and flows).
to about 250 fish/d. At Lower MonumentalDam, the shifts in fishway use were larger .When flows through the powerhouse weredropped from 68 to 49 kcfs (28%reduction) and spill was increased from 0to about 14 kcfs, passage through thepowerhouse fishway decreased from about550 to less than 350 fish/d (40%reduction), but passage of salmonidsthrough the spillway fishway increasedfrom less than 100 to over 900 fish/d.Junge and Carnegie (1973) concluded thatpassage conditions for upstream migrantswere less than optimum when water wasdischarged only from the powerhouse.When a small amount of water was spilledto attract fish to the spillway fishway I theoverall rate of fish passage over the damincreased. Salmon and steel headapproaching the dam when all thedischarge was from the powerhouse wereapparently having difficulty locating thefishway entrances among the turbulentdischarges from the powerhouse.
TaIlrace flow panerns.- The tailrace isdefined in this report as the areadownstream from the dam that isinfluenced by discharges from the dam. themajority of which comes from the spillwayand/or powerhouse. The tailrace mayextend downstream several hundredmeters during periods of high flows. and toa lesser distance during low flows. Theamount of water passing a dam and theproportion passing over a spillway versusthrough the powerhouse create :the flowpatterns in the tailrace. and those patternsinfluence how easily fish find the entrancesto the fishways.
Typically, most of the Snake River flowis passed through the powerhouse of thedams, with periods of spill occurring mainlyduring the spring runoff season. Thedistribution of flows from the damsinfluences which fishway, and whichfishway entrances will be used by theupstream migrants to pass the dam. Theinfluence of powerhouse versus spillwaydischarges in shifting the use of fishwayentrances by salmon and steel head atSnake River dams was illustrated byJunge and Carnegie (1973). At Ice HarborDam, when all but 1 kcfs of the dischargeduring the July test period (flow averagedabout 76 kcfs) was through thepowerhouse, an average of 650 fish/d werecounted through the powerhouse fishwayand only minimal numbers used thenorth/spillway fishway (about 50 fish/d).When 20% (about 15 kcfs) of thepowerhouse flow was shifted to thespillway, passage through the powerhousefishway dropped slightly to 625 fish/d, butpassage in the spillway fishway increased
At Uttle Goose Dam in the spring of1981, all of the river flow (up to nearly 130kcfs) was passed through the powerhouse,except during the last four days of the 54-day study period. During the non-spillperiod the majority of the fish entered thefishway through the powerhouseentrances. But, during the period with spill(up to 60 kcfs), entry to the fishway shiftedto the spillway entrances (a confirmation ofthe observations by Junge and Carnegie in1972 that fish may have difficulty locatingthe powerhouse entrances to the fishway).At Lower Granite Dam in 1981, spilloccurred on 33 of the 54 day study. Duringthe period of non-spill the discharge fromthe powerhouse ranged from 50 to 85 kcfsand again the majority of the fish used thepowerhouse entrances to gain access to
17
the fishway. On days that spill occurredmost of the fish used the entrancesadjacent to the spillway until high spills(>50-60 kcfs) blocked access to thoseentrances.
dam contains a single fishway with aladder on the south shore. There are threeentrances to the fishway north of thespillway (NSE-1, NSE-2, NSE-3) and thepowerhouse has a total of 15 entrances,three at the north end (NPE-1, NPE-2, andNPE-3), ten submerged orifices along theface (four were in use during the study),and two at the south end (SSE-1, SSE-2).The south shore entrances lead directly tothe ladder, while the remaining entranceslead into a collection channel that runsunder the spillway and along thepowerhouse. Ice Harbor Dam is similar toLower Granite Dam, with the powerhouseadjacent to the south shore and thespillway north of the powerhouse, while atLower Monumental dam the positions arereversed. Ice Harbor and LowerMonumental dams have two fishways, onealong each shore. The fishway entrancesat these two dams are similar to thosedescribed for Uttle Goose and LowerGranite dams, except that Ice Harbor Damhas 12 submerged orifices at thepowerhouse (seven were used).
During the 1982 spring studyconducted at Ice Harbor and LowerMonumental dams flows were higher thanin 1981. At Ice Harbor Dam, where spillranged from 30 to 60 kcfs during most ofthe 59-day study period and powerhousedischarge ranged from 50 to 90 kcfs, aboutfour-fifths of the adult chinook salmonpassed over the dam via the south shore(powerhouse) fishway and one-fifth via thenorth shore fishway adjacent to thespillway. At Lower Monumental Dam in1982, discharges from the powerhouseranged from 20 to 100 kcfs and spillranged from 40 to 100 kcfs during thespring study period (Turner et al. 1984).About two-thirds of the fish passed overLower Monumental Dam via the northshore (powerhouse) fishway and one-thirdover the south shore fishway adjacent tothe spillway.
At Uttle Goose Dam in 1981. when allof the discharge (up to nearly 140 kcfs)was through the powerhouse. fish entryrates were highest at the southpowerhouse entrances. followed by thenorth powerhouse entrances. the northspillway entrances. and then the floatingorifices along the face of the powerhouse.During lower powerhouse discharge «90kcfs) fish entered all of the powerhouseentrances. but when discharges exceeded90 kcfs. the middle floating orificeentrances were little used.
Powerhouse discharges- Entrancesadult salmon and steelhead use to enter
fishways and the ease of entry can be
affected by the amount and distribution of
water discharged from powerhouses. The
shift in entrance use at dams under ~arious
powerhouse flow conditions was monitoredin 1981 and 1982 at the four lower Snake
River dams by placing electronic countingtunnels in each of the fishway entrances
(Turner et al. 1983; 1984).
At Uttle Goose and Lower Granitedams the powerhouses are adjacent to thesouth shore and the spillway is north of thepowerhouse, at about mid-channel. Each
At Lower Granite Dam in 1981, turbine
number 3 was not in service and there was
spill on 33 d of the 54-d study period.
18
During the period of no spill, dischargesfrom the powerhouse ranged from about50 to 85 kcfs, and the largest number offish entered the fishway at the southpowerhouse entrances, followed by northspillway, and then the north powerhouseentrances. A small number of fish enteredthrough the powerhouse floating orificeentrances. Although- no water wasdischarged from turbine 3 outlets, the gapin discharge did not result in increasednumbers of fish entering the fishwaythrough the floating orifices adjacent to thatunit. The chinook salmon with radiotransmitters approached the dams alongthe shore lines and tended to concentratedownstream from the- powerhouse,especially during zero to low spills (0 to 25kcfs). When there was spill, more of thefish approached the dam along the northside of the river and entered the fishwaythrough the entrances at the north end ofthe spillway, until very high spills (>50-60kcfs) blocked access to those entrances.
At Lower Monumental Dam in 1982,discharges from the powerhouse rangedfrom 20 to 100 kcfs and spill ranged from40 to 100 kcfs during the study period(Turner et al. 1984). The chinook salmonapproached the dam along the north shore,and of the fish entering the north shore{powerhouse) fishway, the largest numberentered the entrance at the north end of the
-powerhouse {48.3% of net entries). Fishalso entered the fishway via thepowerhouse floating orifice gates with fewfallouts. More fish fell out of the entrancesat the south end of the powerhouse thanentered.
Shifts in entrance use with shifts inpowerhouse flow have also been observedat Columbia River dams. For example, theentrances used by salmon and steel headto enter the fishways at John Day Damwas influenced by turbine discharge duringa 1972-73 study (Duncan et al. 1974):With full powerhouse discharges, the fishtended to move along the downstreamedge of the powerhouse outflow, and touse the outer entrances to the south shorefishway. At lower powerhouse discharges,fish entered the fishway according to thenumber and location of turbines beingused. For example, when units 1 through4 were shut down the number of fishentering orifices 1 through 4 decreased,but entry via orifice 5 increased. Use ofthe south-shore fishway entrance washighest when turbine number 1 (the closestturbine) had a discharge of 10 kcfs, butdecreased by 7% to 65% when operated at15 kcfs, and by 38% to 73% when theturbine was shut down. Duncan et al.(1974) concluded that the upwelling boilfrom turbine 1 at the 15 kcfs dischargelevel blocked access to the south entrance,but attraction to the entrance was
At Ice Harbor Dam in 1982, where spillranged from 30 to 60 kcfs during most ofthe study period (12 April to 9 June) andpowerhouse discharge ranged from 50 to90 kcfs, the highest entry rates of fish(mostly chinook salmon) into the fishwayswere at the entrances at the north end ofthe powerhouse (net entry (26.3% of total)(Turner et al. 1984). Fewer fish enteredthe other entrances to the powerhousefishway compared to those at the northend, but the fallout rate was low or nil. Onthe few days when powerhousedischarges were relatively low « 59.9kcfs) and spill increased, the fish tended tocongregate at the south end of thepowerhouse, and more fish used the southshore entrances (40% of net passage).
}9
peak power generation, and suddenchanges between the two conditions.Concerns about how these flowmanipulations affect the upstreammigrations of salmoJI and steelhead in theColumbia and Snake rivers prompted theinvestigation of salmonid behavior underpeaking conditions. The effects of zero-flow conditions on salmonid behavior willbe covered later in the section onmigrations through reservoirs.
completely eliminated when turbine 1 wasshut down. To reduce blockage to thefishway at high turbine discharge, Duncanet al. {1974) recommended that the southentrance be extended downstream awayfrom the turbine boil, or to close off thesouth entrance and use the firstsubmerged orifice gate as the primaryentrance to the fishway. -
In contrast to the results seen at JohnDay Dam, passage over the BradfordIsland fishway at Bonneville Dam was 8%higher when turbine number 1 was shutdown than when it was operating (11 kcfsmaximum flow) (Junge 1969). Thedifference between the entry behavior seenat the two dams was most likely related todifferences in the configuration of the twodams and the tailraces. Similar patterns offish approach to the powerhouses and useof entrances as reported for John DayDam (Duncan et al. 1974) were foundduring 1974-75 studies conducted at TheDalles Dam (Arndt et al. 1976; Duncan et
al. 1978).
A major concern of those investigatingthe effects of peaking flows on upstreammigration of salmonids was the effect thatthe altered powerhouse discharges andsudden discharge changes would have onpassage conditions at dams. For example,adult passage over Ice Harbor and LowerMonumental dams increased significantlyduring a 1972 study when flows wereshifted to the spillways to simulate a 40%flow reduction through the powerhouses(U.S. Army Corps of Engineers 1979c).The reduction of powerhouse dischargefrom 60 to 36 kcfs at Lower MonumentalDam resulted in fewer fish using the northshore (powerhouse) fishway t and more fishusing the spillway fishway, but a netdoubling of the number of fish passing over
the dam per day.
Cramer et al. (1959) found thatpassage over McNary Dam was notaffected by closure of the south entrance tothe powerhouse fishway during studiesconducted in 1955, 1957, and 1958. Theyconcluded that closure of one entranceincreased the attractive flows at the openentrances.
During peaking operations at TheDalles Dam in 1969 and 1970, spring andsummer salmonid passage was 13 to 50%higher on the weekends, whenpowerhouse discharges were reduced,than on weekdays. The spring salmonidpassage at Priest Rapids Dam rangedfrom 14 to 83% higher on weekends(powerhouse discharge < 1 00 kcfs) than on
weekdays (powerhouse discharge from115 to 125 kcfs) from 1966 to 1970 (Junge1971 ). Junge suggested that the
Power peaking.- Power peakinginvolves passing more water through thepowerhouse when the demand for power is
high (weekdays), and storing water behind
the dams when power demands are low (at
night and on weekends). The result of
peaking operations can range from total
cessations of river flows (zero flows)during water storage, to high flows during
20
flows released from Ice Harbor Dam couldfluctuate from 7.7 to 44.1 kcfs within a day.He found that on days when flows causedthe tailwater level to fluctuate by 1 .1 ft orless the passage of steel head over IceHarbor Dam was relatively constantthrough the day. During days whentailwater fluctuations were greater than 1.1ft steel head passage decreased, withnumbers peaking at certain times of theday, suggesting the fish were delayed incrossing the dam under certain conditions.In the Clearwater River, steel head radio-tracked during a 1980 study showed nounusual behavior when discharge changesof 1 I 2, or 3 ft/h from Dworshak Dam weretested (Bjornn and Ringe 1982). Wheninvestigating the effect of peaking flows onpassage at the The Dalles Dam collectionsystem, Arndt et al. (1976) found that entryto the fishways was not altered by rates ofchange of turbine discharge of 1 kcfs/3minutes and 1 kcfs/24 seconds.
increased turbulence below the dam duringthe high discharge obstructed entry to the
collection system.
Reduced powerhouse discharge alsoimproved the passage of fall chinooksalmon with radio transmitters (45 fish) atBonneville Dam during a 1973 studydesigned to investigate the effects ofpeaking on passage conditions (Monanand Uscom 1974a). Discharge from nineturbines were reduced by 1/2 to 2/3 ofnormal, starting from the end turbines andworking inward, resulting in increasedpassage of the fish with transmitters from1.3 fish/d at the normal turbine discharge(averaged 108 kcfs) to 1.9 fish/d atreduced levels (averaged 88.6 kcfs).
Peaking operations may alsocontribute to the mortalities occurring atdams. During a 1973 study of mortalityand delay of summer and fall chinooksalmon in the lower Columbia River,Young et al. (1974) suggested thatmortalities were higher on weekdays thanon weekends because of peaking flows. Ina similar study conducted in 1975, taggedsummer chinook salmon experiencedhigher mortality (21.3%) at John Day Damwith full loads of 20-23 kcfs at each of thethree turbines nearest the south fishwayentrance and no spill, than with reducedturbine discharges of 12-15 kcfs at each ofthree turbines and 72 kcfs spill (17.4% oftotal flow), although the difference was notsignificant (Young et al. 1977).
Spillway discharge panerns.-Wateris spilled through the spillways at damswhen the river flow exceeds the capacity ofthe powerhouse or the power demand, andwhen there are special requirements forspill such as downstream migrantpassage. When water is spilled the flowpatterns downstream from the dams arechanged. Fish are often attracted to thespillway discharges, which. may bebeneficial if the fish are led to fishwayentrances, or detrimental if they are not.Spilling of water at the dams is normallyassociated with high flows and sometimeshigh turbidities; the three factors combinedcan cause reduced passage efficiency. Inthis section we will review studies thatwere designed specifically to evaluate theeffect of spill volume and patterns on adult
passage at dams.
Secondary to the amount of flow
released, the rate of change of flowsreleased from dams and fish passage hasbeen a matter of concern, but the
relationship is not well understood. Duringa 1970 study, Wagner (1971) reported that
21
The effect that high flows and spill canhave on fish passage at the Snake Riverdams was further defined in 1981 and1982 studies. During 1981, 36 chinooksalmon outfitted with radio transmitterswere released at Lower Monumental Dam,and 8 were released upstream from UttleGoose Dam, and tracked until theycrossed Lower Granite Dam (Turner et al.1983). There were only four days of spill atUttle Goose Dam in 1981 during the 20April to 19 June period of study and thusmost of the fish passed the dam under no-spill conditions and were delayed only 1 to1.5 d. At Lower Granite Dam in 1981, spilloccurred on 33 of the 54 d study period,and fish were delayed in passing the damup to 7.5 d when spill exceeded 40 kcfs.During periods of low spill, and low riverflows, the delay was only 1 day. In 1982,the snowmelt runoff was larger thanaverage and there was spill throughout thestudy period at Ice Harbor and LowerMonumental dams (Turner et al. 1984).Thirty-one chinook salmon were outfittedwith radio transmitters and releaseddownstream from Ice Harbor Dam, andfour fish were released in the forebay, andall were tracked until they passed overLower Monumental Dam. Eight chinooksalmon with transmitters installed atBonneville Dam during a separate studywere also monitored. The delay in passingLower Monumental Dam during this periodwas an estimated 2 to 2.5 d.
The effect of spill pattern on passageof adult salmon was demonstrated at IceHarbor Dam. "Losses" (discrepancies infish counts) of spring chinook salmonbetween McNary , Priest Rapids and IceHarbor dams from 1962 to 1966 increasedwith increased river flows and wereassociated with poor passage conditions atIce Harbor Dam (Junge 1966a). From1963 to 1966 the standard practice at Iceharbor Dam was to use a uniform spillpattern, with gates 1 and 10 closed or onlyslightly opened, and gates 2 to 9 openedan equally large amount. Spring chinooksalmon losses during this period werehigh, ranging from 33.7 to 41.2%. In 1967a crowned spill pattern was used for flowsbetween 40 and 80 kcfs, and lossesdecreased to 26.4% (Junge 1967). Fromobservations made during the 1967season, Junge recommended a spillpattern for Ice Harbor Dam that used splitspills below 30 kcfs, a transition patternfrom 30 to 40 kcfs, and a crowned patternat spills larger than 40 kcfs. As river flowscontinue to increase the spill patterngradually became more uniform toaccommodate the flows. In 1968, the firstyear that the recommended spill schedulewas used, spring chinook salmon lossesreached their lowest level at 17% (Junge1969). From 1968 to 1975 the "losses" ofspring chinook salmon between McNary-Priest Rapids-Ice Harbor dams dropped toan average of 13% (Junge and Carnegie1976a). These losses were determined tobe independent of river flow and wereattributed to poor passage conditions atPriest Rapids Dam. The addition of threenew turbines to Ice harbor in 1976 requiredadjustment to the spill schedule, especiallyfor the higher flows (U.S. Army Corps of
Engineers 1979a).
Spill patterns have been developed forall the Columbia and Snake River damsbased on information available. Becauseof structural differences at each of theSnake River dams, the spill patterns arenot the same. Uttle Goose, LowerMonumental, and Lower Granite damseach contain eight spillbays and a more
22
channelized tailrace. which led Junge andCarnegie (1972; 1976a) to recommend amore uniform spill pattern at those damsversus the crowned pattern at Ice HarborDam.
Fish crossing from the slack water areainto the high velocity jet will most likely bekilled from the high shear force. High spillsin the end bays can create the greatest
problems by producing high velocities,turbulence, and vortexing that willcompletely block access to the fishwayentrances. High spills can also createcurrents that will misguide fish away fromthe entrances. When high spills combinewith turbine dis-charge standing waves canform which will block access to collectionsystem entrances. When spill through theend bays is too-low relative to the centralbays an eddy can form along the shorelinewhich can eliminate or even reverse flowdirection near the fishway entrance.
In a report to the U.S. Army Corps ofEngineers, Junge and Carnegie (1972)discussed in depth the guidelines thatshould be followed while developing spillpatterns for Columbia and Snake Riverdams. They explained that the amountand location of spill required to produceadequate passage conditions will vary withriver flow and powerhouse dischargelevels. In most cases, fishway entrancesflank the spillway. For fish to successfullylocate the entrances, fishway flows shouldbe uninterrupted and directed downstream.High turbulent flows near fishwaysentrances can mask the attraction flows,while misplaced flows can attract fish awayfrom the entrances and increase delays inentering the fishways. The optimalspillway flow will set up a velocity barrierangling toward the fishway entrances toguide fish to the fishway openings. Duringhigh river flows, Junge and Carnegierecommended that a crowned spill patternbe used whereby spill is highest throughthe central spillbays and decreasesoutwards to the end bays, forming a V-shaped flow pattern in the tailrace. Whenrelatively little spill occurs, a split spillpattern was recommended where the flowis concentrated in the end bays to enhanceattraction toward the fishway entrances.
Spill patterns have been developedfollowing the guidelines described aboveand used successfully at lower ColumbiaRiver dams. The major difference betweenColumbia and Snake River dams is thesize of the spillway. With the largerspillways at Columbia River dams amodified crowned spill pattern is usedwhere flows through the end three or fourbays is gradually reduced, but are keptgenerally uniform through the centralspillbays (Junge 1969; Junge and
Carnegie 1976a).
The addition of spillway deflectors todams in the 1970's required adjustments tothe spill schedules to maintain adequatepassage conditions. Spillway deflectorsare a lip added to the spillbay that deflectsthe water away from -tfle dam on thesurface of the tailrace to reduce gassupersaturation. Water flowing through thespillbays with deflectors have a highersurface velocity than that going throughspillbays without deflectors, and this led toquestionable passage conditions below
Spill conditions described by Junge
and Carnegie {1972) that should be
avoided include differences of gates
openings of four feet or more in adjacent
spillbays. This situation creates a slack
water area adjacent to a high velocity jet.
23
certain dams (Junge and Carnegie 1976b).During operational studies conducted atUttle Goose Dam in 1976, the high velocityflows from spillbays 2 through 7, which haddeflectors, were contained and passageimproved, by increasing the amount of spillpassing through the end bays, 1 and 8(U.S. Army Corps of Engineers 1979a).Similar methods for containing thedeflector flows have been used at the otherColumbia and Snake River dams. Spillwaydeflectors had no effect on salmonidmovements below dams (Monan et al.1979b; Monan and Uscom 1976).
Characteristics of fishway entrancesrelative to use by upstream migrating adultsalmon and steelhead have been studiedprimarily at Bonneville Dam and at theBonneville Fisheries-EngineeringResearch Laboratory (U.S. Army Corps ofEngineers 1953, 1956a, 1956b, 1960;Thompson et al. 1967; Weaver et al.1976}. At Bonneville Qam, orifices werefound to be more effective than overflowweirs as entrances to the powerhousefishway, especially during variable(peaking} flows. In 1954, passage overBonneville Dam-was 15.6% higher with 6 ftdeep orifices than with 10' 14, and 30 ftdeep orifices. At the Bonneville Dampowerhouse in 1955 and 1956, the use often submerged orifices (60 cfs each}produced higher passage rates than withsixteen or six orifices. Passage was alsofound to be higher when using largerorifices (7.5 x 2 ft, 99 cfs} than either small(5.58 x 1.33 ft, 45 cfs} or intermediate sized(6.67 x 1.5 ft, 60 cfs} orifices, with an 18inch head versus a 12 inch head at theorifices, vertically versus horizontallyorientated orifices, and lighted orifices overa dark, but that use of the dark orificeincreased with hydraulic head. At TheDalles Dam, optimal entry conditions withoverflow weirs occurred when using weirdepths of 7 to 9 ft and heads of 1 ft orgreater (Junge and Carnegie 1970:Duncan et al. 1978}.
Fishway entrances.- The best locationfor a fishway entrance is thought to be thefarthest upstream point reached by themigrating fish (Clay 1961 ). Sincesalmonids tend to move upstream alongthe shore, fishway entrances have beenplaced at the junction of the dam and theriver bank. This principle is illustrated atThe Dalles Dam where the powerhousetailrace forms a channel running along thesouth shore. Fish moving upstream alongthe Oregon shore are attracted by thepowerhouse flow into the tailrace area andare eventually guided to the east fishwayentrance at the upstream end of thechannel. Use of the east fishway entranceat The Dalles Dam during evaluationstudies of the collection system (1974-75)was found to be consistently high,especially during the summer and fallwhen most of the river flow was passedthrough the powerhouse (Duncan et al.1975; 1978). The large powerhouses usedat the Columbia and Snake river damswere expected to draw fish to the area ofthe turbine discharge, and thus promptedthe development of the fish collectionsystems along the face of the powerhouse.
Both the quantity and velocity of water
exiting the fishways ~~e important in
attracting fish to the entrances once theyhave moved to the vicinity of the
entrances. In his book on fishway design,Clay (1961) recommended that entrance
velocities be at least 4 fps but less than 8
fps to create optimal entry conditions.
These values were based on the behavior
24
several of the entrances. At little GooseDam, large numbers of fish exited thefishway via the south entrance and the twonorth powerhouse entrances (NPE 1 and2). Exit rates for Uttle Goose Dam(expressed as a percentage of the entryrate) were 12.5% for NSE, 65.3% at NPE-1 , 99.3% at NPE-2, 15.5% at the fourorifice gates combined, and 62.6% forSSE. At Lower Granite Dam, duringperiods of no spill, the largest numbers offish exited the fishway via the north andsouth entrances. During periods of spill,most of the fish entered via the northentrances and similar numbers exited thenorth, north powerhouse, and southentrances. The species of fish enteringand exiting the entrances was notdetermined.
and swimming ability of salmon andsteelhead. During a 1957 study at theBonneville Fisheries-EngineeringResearch Laboratory, steel head, and cohoand chinook salmon had a higherpreference for the higher velocities whenexposed to various combinations of flowsof 2, 3, 4, 6, and 8 fps, except that nodifference was found between 6 and 8 fps(Weaver 1963). Bell (1984) reported thatthe sustained swimming speeds (whichcan be maintained for a few minutes) forsteelhead, coho and chinook salmon wereabout 10 fps. An example of theimportance of flow quantity was illustratedby Junge and Carnegie (1970), when fishpassage through a fishway at The DallesDam dropped by half when flows in thefishway were halved.
The addition of side entrances (facinginto the spill basin) to the powerhousefishways at Lower Monumental (1972) andMcNary dams (1974) significantlyincreased salmonid passage over thesedams during periods of low spill. Passageover Lower Monumental Dam averaged60% higher through the powerhousefishway when the side entrance and onedownstream entrance was used versusboth downstream facing entrances (U.S.Army Corps of Engineers 1979b). Jungeand Carnegie (1973) recommended theuse of the side entrances at LowerMonumental and Uttle Goose dams duringperiods of no spill.
Migration Through Fishways
Fishways at the Columbia and SnakeRiver dams include the entrances,collection channels, ladder sections, andexits. Most fishways at Snake River damshave a 1 :10 slope, except for the 1 :16sloped powerhouse fishway used at IceHarbor Dam (Turner et al. 1983: 1984). Instudies conducted at the FisheriesEngineering Research Laboratory ,steel head and sockeye salmonsuccessfully passed through anexperimental 1 :8 sloped fishway (Collinsand Elling 1958; Connor et al. 1964),however, chinook salmon were stressedby passage through the 1 :8 fishway untilbaffles were added that induced the fish torest during ascents (Collins et al. 1963).Chinook salmon generally were attractedto the highest velocity flows (Weaver1968), but adult migrants (especially coho
The use of all entrances at SnakeRiver dams was evaluated in 1981 and1982 by Turner et al. (1983; 1984). At bothUttle Goose and Lower Granite dams in1981, the fishway entrance data wasconfounded by high rates of fallout (fishexiting the fishway via an entrance) at
25
and sockeye salmon) may tire duringextended climbs at flows of 4 fps or higherunless rest areas are provided (Delacy etal. 1956; Paulik et al. 1957). Flows as lowas 1 fps work well for passing steel head,chinook, and sockeye salmon throughtransportation channels, but requireauxiliary water to attract fish to thechannels (Gauley 1966). Fish will use thefishway with the best attraction flows (seeEntry Into Fishways).
velocities over weirs and through orificescould not be more than 3.0 m/s (10 ft/s)and should not be over about2.4 m/s, andsufficient low velocity areas should beavailable within the fishway to allowsalmonids to rest during the ascents. Forextended lengths of 1 ,000 ft or longer,flows should not be higher than 1.2 m/s.Gauley (1966) reported that chinooksalmon, steel head, and sockeye salmonwill readily pass through transportationchannels in flows as low as 0.3 m/s.
Flows, water velocities, and fishwaydesign have a major effect on thesuccessful passage by salmonids. Bell(1984) reported that adult salmon andsteel head are able to swim at cruisingspeed (about 1.2 m/s) for hours, and thatfaster speeds (up to 7 m/s) can only bemaintained for minutes or seconds. Theendurance of coho and sockeye salmonwas tested in 1956 and 1957 by forcingthem to swim at various speeds in either acircular rotating or straight flume (Delacy etal. 1956; Paulik et al. 1957; Paulik andDelacy 1957, 1958). Most sockeyesalmon tested could not maintain positionin velocities of 1.3 m/s (4.5 ft/s) longer than10 minutes, although some lasted up to 20minutes. Burst speed swimming bysockeye salmon of up to 3.35 m/s (10 to 11ft/s) was maintained for only a few seconds(Delacy et al. 1956). At 2.0 m/s (6.6 ft/s)the endurance of sockeye salmon from thelower Columbia River ranged from 153.7 to196.4 seconds, and at 2.9 m/s (9.4 ft/s) itranged from 59.2 to 64.9 seconds (Paulikand Delacy 1958). Coho salmon tested ina rotating flume at the University ofWashington could maintain their positionagainst a flow velocity of 1.1 m/s (3.2-3.6ft/s) for an average of 505 seconds (range= 185-1,032 seconds) (Paulik et al. 1957).
Delacy et al. (1956) suggested that
Ice Harbor and Lower Monumentaldams each have two fishways, one alongthe north shore and the other along thesouth shore. Uttle Goose and LowerGranite dams have a single fishway alongthe south shore. The north shore entranceat the latter two dams connects to thefishway via a lighted tunnel that passesunder the spillways. All the fishways havea slope of 1 :10, except the powerhousefishway at Ice Harbor which has a slope of1 :16 (Turner et al. 1984). Ice Harbor wasthe first dam constructed on the lowerSnake River (1961 ), and the first dam tohave a fishway with a 1 :10 slope. Previousto this Columbia River dams had beenconstructed mainly with 1 :16 slope (16 ftlong pools with a 1 ft rise between pools)fishways. The advantage of the steeper ,and narrower fishway is the reducedconstruction cost.
To determine if adult salmonids would
pass through 1 :10 slope fishways as well
as in 1 :16 fishways, a study was
conducted at the Fisheries EngineeringResearch Laboratory during 1960
(Thompson and Gauley 1965). During this
study chinook salmon, sockeye salmon,and steelhead were timed while ascending
a six-pool full scale model of the 1 :10
26
travel times with increased rise betweenpools in the 1 :8 fishways. When theexperiments were repeated in 1957, thepassage of individuals and groups ofsteel head. chinook and sockeye salmonwas either faster or not significantlydifferent through the 1 :8 fishway (1 ft rise)than through the 1 :16 fishway (Gauley andThompson 1962). Passage through the1 :8 fishway with a 1 ft rise between poolswas slower for chinook salmon (12.3 vs18.5 minutes) than through the 1 :16
fishway.
fishway. Thompson and Gauley reportedpassage times through the model wereabout 1.1 minutes/pool for steel head, 1.3minutes/pool for sockeye salmon, and 2.2minute/pool (and 1.5 minutes/pool throughthe half-width fishway) for chinook salmon,rates that were similar to passage ratesthrough a 1 :16 fishway. In 1961, the firstyear of operation of the fishways at IceHarbor Dam, the two fishways weredivided down the middle and the fishpassing up one side were timed through a74-pool section. Weaver (1962) found thatpassage times ranged from 67 to 152minutes through the one side of the 1 :10fishway, and from 80 to 168 minutesthrough the 1 :16 fishway.
To determine the effect of extendedascents in 1 :8 and 1 :16 fishways, theendless fishway was developed and usedin 1958 (Collins and Elling 1958). Theendless fishway consisted of an oval-shaped 16 pool fishway which simulated alonger fishway by circulating fish from thehighest (last) pool to the lowest (first) poolby means of a movable lock. During the1958 studies spring chinook and sockeyesalmon were timed through 6.5 circuits(104 ft rise) of both the 1 :8 and 1 :16endless fishways. Collins and Elling(1958) reported there was no difference inthe passage times of fish between the twofishways. During a similar study in 1959,the passage rate of 13 chinook salmonthrough the 1 :8 fishway was significantlyhigher (44.1 minutes/cycle) than through
the 1 :16 fishway (36.4 minutes/cycle)(Collins et al. 1963). When fish were notallowed to rest in the turn pools of the 1 :8fishway, travel times increased, and thechinook salmon especially, were found tobe stressed (increased blood lactatelevels). After the installation of bafflesreduced the turbulence in the pools, thechinook salmon were able to rest and nodifference was found in the blood lactatelevels of fish from the 1 :8 and 1 :16
These re~ults were not unexpectedbecause salmon and steelhead had movedup through 1 :8 slope fishways at the
Fisheries Engineering Research
Laboratory with little -difficulty (Gauley1960; Collins et al. 1962; Collins et al.1963). In 1956 studies, the passage rates
of groups of 20 steelhead or chinook
salmon through a six-pool, 1 :16 slopefishway (16 ft long pools with a 1 ft rise
between pools) were compared to three
1 :8 fishway designs; six, 8 ft long poolswith a 1 ft rise between pools, four 12 ft
pools with a 1.5 ft rise, and three 16 ft
pools with a 2 ft rise (Gauley 1960).Gauley (1960) found that steelheadtraveled faster through the 1 :8 fishway with
the 1 ft rise (10.21 minutes) than throughthe 1 :16 fishway (15.42 minutes), while
chinook salmon travelled slower throughthe 1 :8 fishway with the 1 ft rise (14
minutes) than through the 1 :16 fishway
(8.32 minutes). There were no differences
in the other comparisons of fish passage
through the 1 :16 and 1 :8 fishways,
although there was a trend for increased
27
the pools are 40 ft wide, 16 ft long, with a 1ft rise and 6 ft deep. Water flowed over theentire width of the weir and through onesubmerged orifice placed on alternatesides on successive weirs (Holmes andMorton 1939). During 1969 and 1970 anew fishway was designed at the FisheriesEngineering Research Laboratory whichpassed water through a vertical slot ratherthan over a weir or through an orifice(Monk et al. 1989). The vertical slot allowspassage throughout the water column, andis effective without adjustments duringfluctuating water levels. Sections of thevertical slot fishway were installed andthey functioned successfully at John DayDam (1970 and 1973) and at BonnevilleDam (1974) (Monk et al. 1989;Stuehrenberg et al. 1979; Weaver et al,
1976).
fishways (Collins et al. 1963). Extendedclimbs of 1,000 ft or more were alsocompleted by several steelhead, andchinook and sockeye salmon in the 1 :8and 1 :16 fishways with no observableeffects on the fish (Collins et al. 1962).
Columbia and Snake River fishwaysuse overflow weir designs in combinationwith submerged orifices. The Ice HarborDam fishway uses pools 1.6 ft wide, 10 ftlong, with a 1-ft rise between pools(Thompson and Gauley 1965). The weirbetween pools has 6-ft overflow sectionson the outer thirds and an 8-ft non-overflowsection in the central portion. The centralnon-overflow section of the weir isbordered by two 18-inch baffles facingupstream that <?reate a low velocity pocketwhere fish can rest. There are twosubmerged orifices, 18 inches square, ateither end of the weir. During tests of theweir design in 1960 .at the FisheriesEngineering Research laboratory , threeweir crest designs were tested; TheDalles-type or sloped crest, the McNary-type or rounded crest, and the planesurface ogee crest, of which the McNary-type crest produced the smoothest flowsand the lowest passage times (Thompsonand Gauley 1965). In the lab study it wasobserved that in the spring, chinooksalmon preferred to use the orifices to passup the ladder, but in the summer and fallmore fish passed over the weir. Steelheadpassing in the summer and fall preferredthe orifices, but sockeye salmonconsistently preferred to pass over theweirs. Velocities were about 1 fps at thesurface over the weirs and about 8 fpsthrough the orifices with 1 ft of head.
Passage through the fishways occursmainly during daylight hours, but apercentage of the fish will use the fishwaysat night. In 1973-74. Calvin (1975) found apositive relationship between night timecounts at lower Columbia River dams andthe counts from the previous day. which heused to develop a method for estimatingnight time passage at dams. For this studynight counts were made weekly during thepeak of each of the runs of spring. summerand fall chinook salmon, coho salmon,sockeye salmon. steel head and Americanshad, at the north and south countingstations at Bonneville. The Dalles, andJohn Day dams. Calvin found that the ratioof nightlday counts varied by dam.counting station, and species. Forexample. the ratio for spring chinooksalmon was 0.0583 for the north shore,and 0.0292 at the south shore atBonneville Dam. 0.1423 for the north shoreat The Dalles. and 0.0890 for the north
'"The earlier constructed dams used a
weir design such as at Bonneville Dam;
28
shore at John Day Dam (Calvin 1975).Fields et al. (1964) reported that about10% of the fish that used the east fishwayat The Dalles Dam during a 1963 studywere counted at night. During a similarstudyat McNary Dam, Fields et al. (1964)determined that fish counted over thesouth fishway at night were those that hadentered during the daylignt and no new fishentered the fishway after dark. During anadult passage evaluation study in 1985, 88chinook and sockeye salmon with radiotransmitters were tracked over McNaryDam, and 9 of the fish entered thefishways at night (Shew et al. 1985). Thenine fish waited until morning to exit thefishways, using an avera9.e of 11.7 fi topass through the fishways, versus 2 to 4 hfor fish that entered and passed throughthe fishway during the day.
transmitters were tracked at LowerMonumental Dam (Monan and Uscom1974b). The 20 fish were released in twogroups of 10 fish each, during averageriver flows of 39.2 ~cfs for the first ten fishreleased and 76.9 kcfs during the secondgroup. The 10 fish from the first grouprequired an average of 42 h to cross LowerMonumental Dam, of which an average of
-only 44 min were spent in the north-shore(powerhouse) fishway (8 fish) and 138 minin the south-shore (spillway) fishway (2fish). Eight of the fish from the secondrelease group passed the dam in anaverage of 84.3 h; 49 min in the north-shore fishway (5 fish), and 208 min in thesouth-shore fishway (3 fish).
Although the passage times throughthe fishways were not provided, Turner etal. (1984) did note that a number of fishmoved back down in the fishways afterpartial ascensions. Of 35 fish crossing IceHarbor Dam, 16 cases were observedwhere a fish partially ascended the fishwayand then backed down, perhaps partlybecause of trapping operations at the topof the ladder. There were 9 cases of fishbacking down the fishways at LowerMonumental Dam, 5 fish in the north-shorefishway and 4 in the south-shore fishway.In 1981, 2 of the 22 chinook salmontracked over Uttle Goose Dam wereknown to have backed down and left thefishway, but later crossed the dam, and 8fish backed down and left the LowerGranite fishway (Turner et al. 1983).
There is, however, record of at leastone salmon stock that used fishwaysexclusively at night. Fields et al. (1955)reported that sockeye salmon ascendedthe University of Washington fishway inSeattle mainly at night during a 1955 study.For the study period, 3 fish were countedduring daylight hours, 116 on dark nights,and 26 on nights when the fishway was lit.
In general, salmon and steelheadreadily migrate up through ladder sectionswith overflow weirs and submergedorifices, and sections with vertical-slotweirs (Monk et al. 1989; Stuehrenberg etal. 1979). Chinook salmon with radiotransmitters (17 fish) that were trackedover Lower Granite Dam in May and Juneof 1975 averaged 4 h to pass through thefishway versus an average of 73 h spent atthe dam (Uscom and Monan 1976).During a similar study conducted in May of1973, 20 chinook salmon with radio
Passage times similar to thoseobserved at Snake River dams have alsobeen recorded during fishway evaluationstudies at Columbia River dams. Springand fall chinook salmon and sockeyesalmon radio tracked over McNary Dam
29
crossing Bonneville Dam, and the timeswere reported to increase with river flows,and perhaps been related to the highnitrogen saturation levels (127 to 132%) inthe area during ttle study.(Monan andUscom 1971).
averaged 2.4, 3.9, and 2.9 h, respectively,
to pass through the fishways in a 1985
study (Shew et al. 1985). At John DayDam passage through the powerhousefishway by chinook salmon with radiotransmitters generally took less than 3 h
during a 1979-80 study (Johnson et al.
1982). Passage times through The DallesDam east fishway were estimated to be 3
to 4 h in the spring, and 4 to 7 h in the fall
during a 1974-75 evaluation of the
collection system (Duncan et al. 1978).
During similar studies at Bonneville Dam,
travel times through the fishways averaged2 to 4 h in 1978 (Johnson et al. 1979), 2.7to 5.1 h in 1982 (Ross 1983), and 3 to 4 h
in 1984 (Shew et al. 1988).-Passage ralesthrough the Bonneville Dam fishways did
not differ significantly between species,
season, or fishway used.
.Passage Through the Navigation Locks
A small number of upstream migratingfish bypass the fishways and pass damsthrough the navigational locks. Acomprehensive study was conducted atBonneville Dam to determine the numberof fish passing through the navigationallock during the 1969 migration season(Monan et al. 1970). For this study, fish inthe lock were sampled using a purseseine, tagged, released, and recaptured toget an estimate of the number of fishpassing through the lock during eachclosure. Monan et al. estimated that 213sockeye salmon (0.86%), 524 steel head(1.1%), and 745 chinook salmon (1.3%)passed through the navigational lockduring the 1969 season. In comparison, inan 1983 evaluation of the passage facilitiesat Ice Harbor Dam, two of the 37 (5.4%)radio tagged spring chinook salmontracked over the dam passed through thenavigational lock (Turner et al. 1984).During a similar study at John Day Dam in1985, two radio tagged chinook salmon(1.7%) were also tracked through thenavigational lock (Shew et al. 1985).
Fallback At Dams
Salmonids exiting fishways at the topof dams may not immediately continue tomove upstream. Whether this is becausethe fish are resting after ascending up theladder, or because they are temporarily
In some instances, the time fish take topass through a fishway has been longerthan usually reported. During chinooksalmon radio tracking studies to investigateareas of loss and delay at Bonneville Damin 1971 and 1972, Monan and Uscom
(1971; 1973) reported average passagetimes through the fishways of up to 64 h.These prolonged passage times appearedto be related to river flows. In 1972, 10 fishtracked during average river flows of 314kcfs required 101 h to cross BonnevilleDam, of which 22 h were spent in thefishways. During the second release eightchinook salmon crossed the dam in anaverage of 181 h, with 64 h in the fishways,and average river flows of 484 kcfs. Thelonger travel times through the fishwaysmay have been related to the highnumbers of fish (8/18) which backed backdown the ladders (Monan and Uscom1973). During 1971, 10 chinook salmonaveraged 63 h in the fishways while
30
confused by the sudden loss of guidingriver flow in the forebay of the dam isunknown. Fish milling about in the forebaycan move into the spillway or turbineintakes and be swept back over or throughthe dam, an event referred to as fallback.
Uttle Goose Dam fell back an average of1.6 times per fish.
During a spring 1975 studyinvestigating the effects of spillwaydeflectors on adult passage, 30 chinooksalmon were tracked at Lower GraniteDam during average spills of 105 kcfs(Uscom and Monan 1976). Of the 17 fishtracked over the dam, 3 (17.6%) fell backover the dam through the spillway. Allthree fish later recrossed the dam, but oneof the fish was observed to have severe
injuries.
Fallback has been documented at bothSnake and Columbia River dams (Table2). In May of 1964, 223 chinook salmonwith radio transmitters were released intothe fishways at Ice Harbor Dam -todetermine patterns of fallback, and 23 ofthe fish {10.3%) fell back through thespillway {Johnson 1964). Of the 159 fishthat crossed over the dam via the southshore fishway, 11 {6.9%) fell back, and 12of the 64 fish {18.7%) that passed up thenorth-shore fishway fell back. During thelow flow period {total flow < 150 kcfs, spill< 100 kcfs) the frequency of fallback was
3.5% from the south fishway and 18.7%from the north fishway. During the 8 d highflow period {flow > 150, spill > 100 kcfs) no
fish were released from the north fishway,but fallback from the south fishwayincreased to 15.5%, and significantly morefish approached the spillway during thehigh flows than during the lower flows. Ingeneral, fallbacks occurred through thespillbays closest to the fishway exits, andspecifically through bays 2 and 9. Thelower fallback through bays 1 and 10 wasprobably due to the smaller openings {1 to1.4 ft) of those gates during the study.Johnson estimated that about half of thefallback salmon reascended the dam afterdelays of 1 to 13 d.
In a 1981 radio tracking study, 258steel head and 32 chinook salmon weretracked from Lower Monumental to UttleGoose Dam during mid July throughSeptember (Uscom et al. 1985). Of the258 steel head released upstream fromLower Monumental Dam, 52 (20.1%) fellback through the navigational lock, theturbines, or down the fishways (there wasno spill at the time), and 23 of the fallbackfish were known to have recrossed thedam. Later, 157 of these steelheadcrossed Uttle Goose Dam, of which 6(3.8%) fell back (two twice), and 3recrossed the dam. Of the 32 chinooksalmon released, 3 (9.4%) fell back anddid not recross Lower Monumental Dam,and 1 of 13 (7.7%) later fell back andrecrossed Uttle Goose Dam.
Fallbacks were also recorded duringthe 1981 and 1982 fish passage
evaluations of the Snake River dams(Turner et al. 1983; 1984). In 1981 ,
chinook salmon were outfitted with radio
transmitters and released downstream
from Uttle Goose Dam and tracked until
they passed over Lower Granite Dam. Of
the 36 fish released, 22 crossed Uttle
In a 1976 and 1977 study to evaluatefallback at Little Goose Dam (Haynes andGray 1980), 14 of 35 chinook salmon withradio transmitters that were tracked over
31
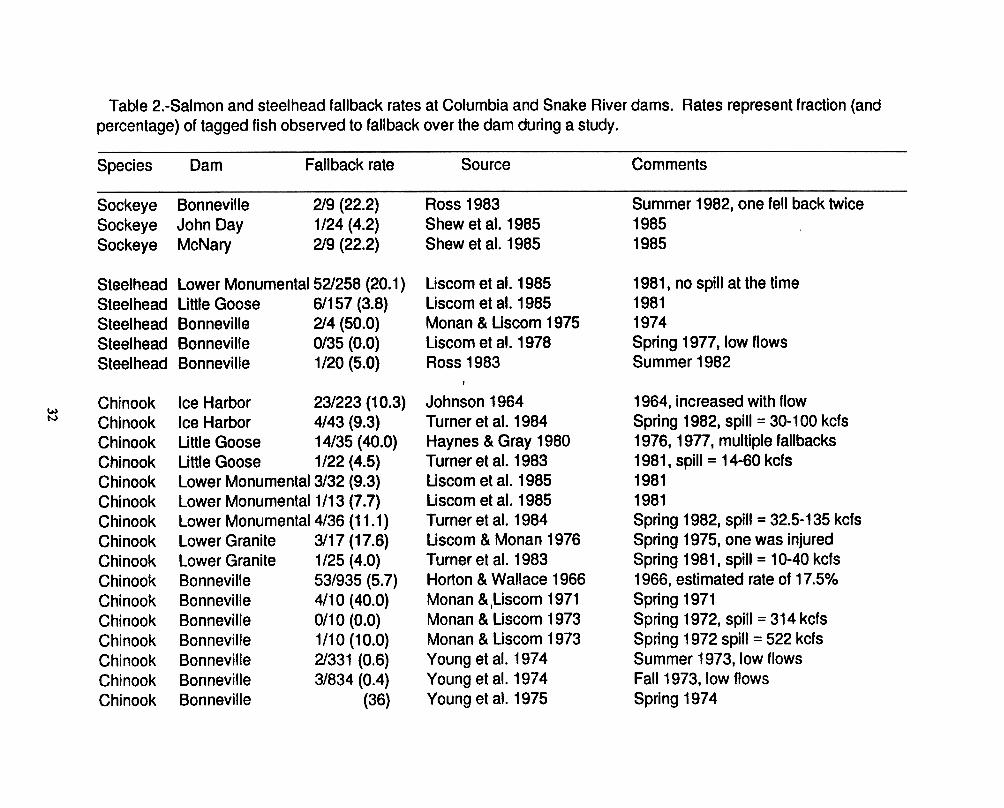
"0c:m-c:0;om~--c:Q)
C/)
Q)
~c..Q
)~C
/)Q
)-m[I:C
/)Em"0~Q
) .
>
>-
.-"0[I:
:J-Q
) C
/)~
m
mc:C>
U)
.S"0
~c:
:J
m"0
m
E.-m..C
"0E
Q
):J.c
--0 ~
OQ
)->m
0
C/)~
Q)
o-me..c
~=O~
m
o..c-=
"0~
Q
)"0
~m
Q
)Q
) C
/).c..c'"ffiOQ
).c-C
/)C
/) .--
"0"0c:
Q)
mc>
c:C>
0 m
E=
-0mU)-I
Q)
.C>
(\j m
Q)-
-c:..C
Q)
m
o1-
Q;
c..
Q)
u'-~o00cnQ)
.(3~00 E~Q Q)
-~~OCtS
..0"(ULL.
(/)-c:Q
)EEou
Q)
()
".!~()(\3'..0"'Q
)-Q
)cO(\I
CX
)m..-~Q
)
ELl')Ll')
EC
X)C
X)
~m
m(1>Q
)Q)Q
)>
->->
-Q
)Q)Q
)~
~~
(.) (.)
(.)o
0 0
000000
~>
.=
ca2::'~
Cca
~~
z~
.r.(,)oo~
aJ~~
---(\1(\1(\1N
~N
(\1-(\1-v-m
(\1mN
:;::: N
Lt)Lt)a>
a>m
m~
~(W
') ..
a>m
mm
--~
Q)Q
)
(/)~~
(/) Q
) Q
)O
..c...c.C
I:(/)(/)
11),...0)
1I)11)~a>
a>a>
E'...
0)0)00)~
~O
~..cn
.
-a-a::J-a~
"Q)"Q
)~"Q
)mE
EcE
~oo~
ocn0
O0-O
cn
cn (/)
cn 0
::J::J~::Ja:
-..-d-Na>
----M
O:O
:O:
a>-O
OLl)
Ll)' Ll)--
NLl)-Ll)O
~~
~~
~
m-C(1)
E:) (1)
5'B.9!.~
~
~0~
~~
...~(1)(1)(1)
~(1)C
CC
>-ccc
o~ooo
-J-Jmm
m
-0-0-0-0-0m
mm
mm
(1)(1)(1)(1)(1).r:..r:..r:..r:..r:.
"'Q)"'Q
)"'Q)"'Q
)"'Q)
Q)(1)(1)(1)(1)
0000000000
Q)
E
U)
; ~
Q)
o.r.
;
=
~C
tS
O--C
\I=
-a:>
a. f"..o>
U)
f" O
0>
...
c: ~
Q
)
-C>
E
~~
-q-C:
a:>
a:>
f".. .~
E
0>0>
0>a.:J~
(J)(J)
~~
~~
~~
~~
~~
~~
~~
~~
ooooooooooooooooooooooooooooooooc:
c: c:
c: c:
c: c:
c: c:
c: c:
c: c:
c: c:
c:~
~~
~~
~~
~~
~~
~~
~~
~oooooooooooooooo
-(y) --
d o
-0
m
-."' 0
-0 m
.q- m
~(y)
Ll)(Y)
..O~
.0.
..(y)
..q- 0.000-
(Y)0)-.q-0)
q-Ll).q-o C
\I-Ll) (Y
) v
C\I(Y
)(Y)C
\lC\I(Y
)m
Ll)O)O
OO
(Y)(Y
)~
.q-~C
\I(Y)..-(Y
)..-C\l~
(Y
)a),
, ~
-C
\I.q (Y
) q-(Y
)..-Ll)VO
..-~(Y
)
mm
m---c:c:c:Q
)Q)Q
)
EE
E~
~~
~
~
Q
) Q
) c:
c:
oo~~
§§§ee~~
~~
~~
~eeoo~
~~
~~
~~
~~
~~
~C
tSC
tS~
~
Q)Q
)Q)Q
)Q)Q
)Q)
J:J: Q
) Q
) Q
) Q
) Q
) Q
) Q
) c:
c: c:
c: c:
c: c:
--~
~
~
~
~
c: c:
c: c:
c: c:
c:Q
) Q
)==
>
>
>
>
>
°
° °
° °
° °
00 °
° °
O
°H\H
\H\H
\H\H
\H\
--~~
~~
~~
~~
~~
~~
~~
32
to C
O~
MM
O
, ~
, ,
, C
X)
0) ~
O)O
)O)
0) Il)Il)
~
~~
~..qo~
MC
X)C
X)..qocM
Q)
EE
E..qo..qo1l)
CX
»-CX
)O)O
)CX
)mC
X)o
, ,
, -0)-0)~
~O
)cO)~
oooO)O
)O)
...~~
~
~0~
-ooo~~
~co
., n
...; ..;
.~
.m
(/) (/)
(/) ...
~m
-mm
mm
~m
~~
~~
mm
m-~
-'"Q
) '"Q
) -~
x
...x- ...x
...x ---
cQ)(/)Q
) Q
) Q
)~~
~~
Q)Q
)Q)
o~Q
)~
EE
~E
~cccc---
-(/) Q
) c
Q)
O
O
Q)
O
Q)
O
m
m
m
c.c.c.
..2c>-C
OO
CoC
tccc:~~
~~
m
~
(/)
(/) ~
(/)
~
O
O
O
O
O
O
O
~~
~~
~~
~~
~I~
~~
~~
~
u>-
u>
(J
't>u>
~
u~o.e
~~
Lt)Q
)(JLt) u>
u>0(J
M~
~
.'t>-
otU
:;]
0,
.,(J~
.c
I ~
~
u>
Lt)c::"(f" -
O'-au>
..-,-
~C
\I~;0-'t>
C
\lu>°0
C\lO
.c::MQ
)~
MtU
Q
) M
Lt);~
::.. :g. 0
::.. ~
::..
e ::..
II ~
~
--<0
-Q
)---0
0,
Q)
Q.
:;] ~
Q
. c::
Q.
Q)
Q. .a. --;
u>U
>E
u>
ou>-
U>
u>M
~tU
N
"'--- II N
~
~
tUE
N
N
~
0 ~
Q)
CX
) ,~
-CX
) ,
CX
) ,
, ,
-, O
m'
=
mm
m;m
mm
M
m
c:: m
Q.
U>
Q
), .--C
)~
u>
C)
C)
C)
Q)-
C)
C)
C)
E
m
C)
"(f"C::<
0 C
::C::C
::<O
C::C
::C::
EC
::
".. .-"'--
".. '""'
~
,~
~
~
~
'""' ~
~
~
=
~
mQ
.mm
mm
Q.Q
.Q.m
Q.Q
.Q.:;]tU
Q.
w
ww
w
ww
ww
~w
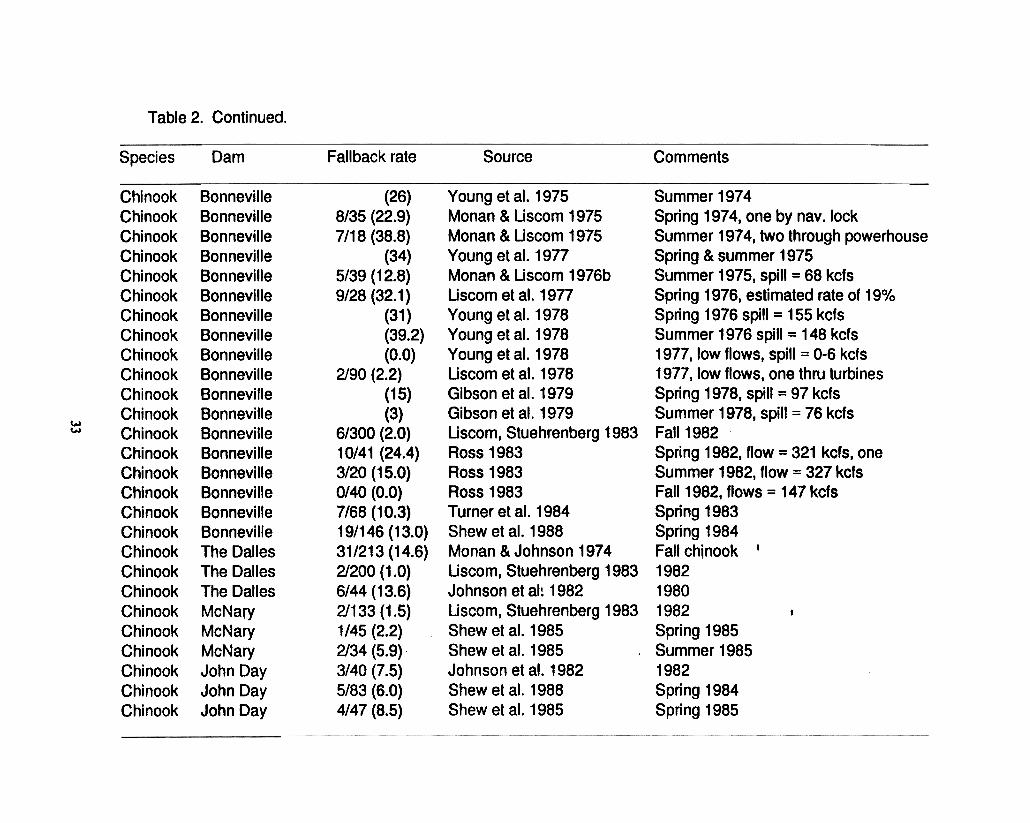
"'0(1):Jc~coO(\I(1)::0ca1-
EtUc Q
)u'-:JOcnC
/)Q
)
.0~00 Q)
-m...
~C,)
m::9mLL.
U)
-c:0)EEou
~~
~~
~~
~~
~~
~~
~~
~~
~~
mm
m
~~
~~
~
~
."
." ."
~~
~~
~~
~~
~~
~~
~~
~~
~~
~~
~tU
tUtU
CC
CC
CC
CC
CC
CC
CC
CC
CC
CC
CZ
ZC
CC
cccccccccccccccCC
CQ
)Q)Q
)76c.>c.>
..C:..C
:..C:
oooooooooooooooooo..c:..c:..c:~~
~ooo
mm
mm
mm
mm
mm
mm
mm
mm
mm
~~
~~
~~
JJJ
--N
- -~
~0-
-~-
-M~
---w
mm
~m
~~
m
.-~-O
~O
-M
OW
~
N.
.M
..MM
ON
~M
.~
.0
.~~
...N
m~
o~-N
m-N
N---
.--NN
~
.0 ~
M~
N
M
~M
N
--~
o~W
M-~
-N~
~W
m
O~
---~~
O-M
~
m
mm
0
o~oom
~N
O~
M~
~O
M~
~~
~
~
~
~0~
~~
m~
~~
~~
~~
~~
m~
~
m
~
W~
MO
~~
M~
W~
~~
M~
~
~~
~~
~~
~~
~~
~~
~~
~~
~~
~~
~~
~~
~~
~o
o o
o o
o o
o o
o o
o o
o o
o o
o o
o o
o o
o o
o o
o o
o o
o o
o o
o o
o o
o o
o o
o o
o o
o o
o o
o o
oc:
c: c:
c: c:
c: c:
c: c:
c: c:
c: c:
c: c:
c: c:
c: c:
c: c:
c: c:
c: c:
c: c:
~~
~~
~~
~~
~~
~~
~~
~~
~~
~~
~~
~~
~~
~uuuuuuuuuuuuuuuuuuuuuuuuuuu
33 (t) (t)
(t)a:>
a:>
a:>
m
m
m.c
~
v~
~L()L()
co C
) ~
C)
C)
,... ,...
,... ~
~
I ~
~
mm
m
Q
) ~
Q)C
\/Q)
C\/
~~
~
,... a:>
mm
.C
c:.Ca:>
.C
a:>
~E
E~
E'...~
~~
'...'...'...~
~a:>
o~m
~L()L()m
a:>L()
moom
omm
mm
mm
m~
m
a:>0~
~~
a:>a:>
~a:>
a:>~
OO
~O
~~
~~
~~
~~
~
mC
:~~
~m
m~
mm
00 0.
...Q)
~~
Q)C
UQ
)~~
CU
~~
~~
~~
~~
~~
~~
~~
2(t)(t)(t)~~
~2~
2~~
~~
~-~
~-~
~---~
~~
wa:>
a:>a:>
-cu~w
W
CU
CU
cucu
Q)~
~Q
)~...Q
)Q)Q
) -m
mm
Q)-~
-c:
---c:--C
)c:c:C)c:E
C)C
)C)E
C:C
:E~
~~
~Q
)c:EoE
Q)Q
)oQ)Q
)c:
~
~
c: ~
O
c:
c: c:
O
9 9
O
0 0
0 ~
~
~
O
~
O
~
~
~
~
~
:)O
O:)
0°:):):)°.c.c°000~
Q)
OO
~O
Q)Q
)~Q
)Q)
O
O
0 O
O
O
0
0 O
O
O
:)
~
0O
0 ~ ~
O~
~
>~
~>
~~
»>~
~~
~~
~~
~W
~~
J~W
WJW
W
Q)
U)
~o.s::. ~
~
0 U
) Q
)Q
) ~
Q
) c:
~
-U)c:
oU)
-U8.
U)o
~'t>
:e U
) u)'t>
O.s::.
't>Q
)~(.)~
~U
)'t>
-~-C
>
~"ta(.)~
~--~
.:i.,
~>
~
CD
~~
~02.:i.co
N.:i.
~e&
l)CO
-g&l)~
I1:5, '
N~
, :5rm
"-~I1=
Q)O
>II
~IIV
>-
-as .-
II-
II~
.CO
~=
EII=
a.c: =
~
~Q
) ~
~
a.-
=
.a. U
) 0
=
a. ~
.Q
II
c: .&
. ..,
U)
U)
.-U)
~
~
a. U
) 0
-U)
v o~
EE
~Q
) ~
CO
~
~
U
)~
;N~
&
l),
~,
, ~
,
00 ~
, ~
CD
O
CD
o>V
o>~
o>C
OC
Oo>
--CD
o>N
o>;~
V~
&
l)o>
V&
l),
.A
, ,
--, C
D
CD
C
D
0 C
D
CD
C
D~
0>
~
v.
~
0>
0>
~
~
~
0>
~
0>
~
~
0>
0>
0 0>
~
0>
0>
~
~
~
~~
~
~N
~
Nc:
~Q
) ~
Q
) ~
Q
) ~
~
Q
) 0
0 ~
Q
) C
D
~
Q)
CD
~
~
.-~
Q
) ~
~
EC
>E
C>
EC
>C
>E
--C>
EO
>C
>E
O>
C>
C>
.S::.
C>
E
C>
C>
c: c:
c:c: ~
~c:
~c:
~C
:C:(.)N
ON
C:
NC
:C:
E
.c: E
.c:
E
.~
.~
E
, ,
.~
E
=
.~
E
=
.c: .c:
=
CD
C
D
CD
.~
E
C
D
.~
.~~
a.~a.~
a.a.~o>
o>a.~
asa.~asa.a.asO
>O
>O
>a.~
o>a.a.
WW
WW
WW
WW
~~
WW
~W
W~
WW
~~
~~
WW
~W
W
Goose Dam, and 1 (4.5%) fish fell backand did not recross. Spills at Uttle GooseDam during this period ranged from 14 to60 kcfs. Twenty-five of these salmon latercrossed Lower Granite Dam, and 1 (4.2%)of those fell back and then recrossed thedam. Spills at Lower Granite Dam rangedfrom 10 to 40 kcfs. Of 43 spring chinookradio tracked in 1982, 4 (9.3%) fell backover Ice harbor Dam, and 1 laterreascended the fishway. The spills at IceHarbor ranged from 30 to 100 kcfs duringthe study. Of the 35 fish that crossedLower Monumental Dam, 4 (11.4%) fellback, and all recrossed the dam. Spill atLower Monumental Dam during the periodranged from 32.5 to 135 kcfs.
fish count discrepancies betweenColumbia River dams, 53 tagged springchinook salmon that were part of a groupof 935 fish released upstream from thedam during the spring of 1966, wereobserved at the Bonneville Dam countingstations (Horton and Wallace 1966).Horton and Wallace estimated totalfallback of spring chinook salmon to be17.5% in 1966, producing a counting errorof 16.5%.
In 1971, 4 of 15 spring chinook salmonwith radio transmitters released atBonneville Dam fell back over the dam(Monan and Uscom 1971 ). During asimilar study in 1972, 20 spring chinooksalmon with radio transmitters werereleased downstream from BonnevilleDam and monitored up to The Dalles Dam(Monan and Uscom 1973). None of thefirst 10 fish released downstream fromBonneville Dam fell back over the dam,even though six of the eight fish exiting theBradford Island fishway were trackedaround the tip of the island and across thespillway area of the forebay before theyturned and continued migrating upstream.Monan and Uscom suggested that thesefish were attracted to the spill area by acounter eddy which flowed upstream alongthe north shore of the island during lowflow conditions (314 kcfs). During thesecond release, 8 of 10 fish crossedBonneville Dam. Seven fish used theBradford Island fishway I and only 1 swamto the spillway and fell t~rC?ugh during flowsof 522 kcfs. The fallback fish laterrecrossed the dam. The eddy presentpreviously had evidently been eliminatedby the higher flows.
In a 1991 study of chinook salmon andsteel head migration in the lower SnakeRiver {Bjornn et al. 1992), severalsteel head captured at Ice Harbor dam,outfitted with radio transmitters, andreleased both upstream and downstreamfrom the dam were subsequently located inthe Columbia River upstream from themouth of the Snake River. Some of thefish returned to the Snake River again, butothers remained in the Columbia River.Large numbers of steel head {>9,OOO in1991) have also been observed fallingback at McNary Dam during the fall andearly winter {Paul Wagner, WashingtonDepartment of Wildife, personal
communication).
Fallback has also been reported at
Columbia River dams. The highest. andbest documented. fallback rates in the
Columbia River have been reported for
Bonneville Dam. The prevalence oftailbacks at Bonneville Dam seems to be
due to the unique configuration of the dam.
In an early study investigating sources of
During 1973. studies were initiated to
determine mortality. delay. and the effects
34
averaged 566 kcfs), 7 of 18 (39%) summerchinook salmon fell back at Bonneville, 5through the spillway and two through thepowerhouse, of which six recrossed thedam and one died. Two of four (50%)steelhead fell back through the spillway,and did not recross.
of peaking flows on adult passageconditions in the lower Columbia River .Spring, summer, and fall chinook salmonwere tagged and released at BonnevilleDam to be counted at upstream dams(Young et al. 1974). Of 331 summerchinook salmon and 834 fall chinooksalmon released upstream from BonnevilleDam, two a-"d three fish, respectively, wererecounted at the dam. None of the taggedspring chinook salmon released werereported as being captured a second timeat Bonneville Dam. Young et al. (1974)suggested that the low fallback rate (lessthan 1%) was due to the low flows thatyear (average daily was 134 kcfs). /
In 1975, Young et al. {1977) againfound fallback to be high at BonnevilleDam, 34% for tagged spring and summerchinook salmon. In a 1975 studyconducted with radio-tagged summerchinook salmon and steelhead toinvestigate sources of loss and delay andthe effects of peaking flows at Bonnevilleand Th-e Dalles dams {Monan and Uscom1976), 5 of 39- summer chinook salmontracked over Bonneville Dam fell back withspill ranging from 2 to 159 kcfs. Four of thefallback salmon later recrossed the dam.No fallbacks occurred at The Dalles Dam.
When the study was repeated in 1974,the fallback rate at Bonneville Dam wasestimated to be 36% for spring chinookand 26% for summer chinook salmon(Young et al. 1975). Again, most of thefallbacks were of fish exiting the BradfordIsland fishway. Young et al. (1975)suggested that fallbacks may be the majorsource of delays for migrating salmonids atBonneville Dam.
In April and May of 1976, an attemptwas made to decrease fallback atBonneville Dam by placing a 150 ft longdeflector net upstream from the BradfordIsland fishway exit (Uscom et al. 1977).The purpose of the net was to divert fishaway from the Bradford Island shoreline toprevent them from circling around to thespillway, as had been observed in previousstudies. The effectiveness of the deflectornet was tested by tracking 67 radio-taggedspring chinook salmon released at varioussites. Of the 28 fish released downstreamfrom Bonneville Dam, nine fell backthrough the spillway and sevenreascended the dam (one recrossed twiceand one recrossed three times). Of the 14fish released upstream from the BradfordIsland deflector net, nine moved to thespillway and four fell back. Four fish werereleased in mid-channel upstream from the
During a second 1974 study, springchinook salmon, summer chinook salmon,and steelhead were radio tracked atBonneville Dam to determine the effect offallback and spillway deflectors on adultpassage (Monan and Uscom j 975).During this study eight of the 35 (23%)spring chinook salmon tracked over thedam fell back, seven that had used theBradford Island fishway, and one theWashington-shore fishway. Seven of thefish passed back through the spillway andone through the ship lock, and all laterrecrossed the dam. Flows averaged 335kcfs during the spring segment of thestudy. During the early summer (flows
35
to the low flows and spill (0-6 kcfs) thatoccurred that year (Young et al. 1978).This result was verified by Uscom et al.(1978) during their spring 1977 radiotracking study investigating areas of lossand delay of salmonids betweenBonneville and John Day dams. Uscom etal. reported that of 90 spring chinooksalmon and 35 steelhead tracked acrossBonneville Dam, only 2 salmon (2%) fellback. One of these fish passed throughthe turbines and died, the second passedthrough the spillway and did not reascendthe dam. No steel head fell back atBonneville, and no tailbacks wereobserved at The Dalles or John Day dams.Uscom et al. noted that tagged fishentering tributaries tended to overshoot therivers by 12 to 15 miles. They suggestedthat tributary overshoot may be oneexplanation for tailbacks, that is, a fishcrossing a dam may have travelled too farupstream and thus returns backdownstream, over the dam, to enter itsnatal spawning tributary .
powerhouse and only one moved towardthe spillway I but did not fall through. Of thenine fish released from the Oregon shore,none swam near the spillway. Fourteen ofthe 28 fish released downstream from thedam exited from the Bradford Islandfishway, and 12 of those fish circledaround the island and continued on to thespillway. fall backs occurred across theentire spillway. Uscom et al. (1977)estimated fallback to be 19% during thespring 1976 study I 24% of the fish usingthe Washington-shore fishway and 18% ofthose using the Bradford Island fishway.They concluded thatihe deflector net wasineffective at reducing fallback, andsuggested moving the fishway exit closerto the Oregon shore to improve passageconditions at Bonneville Dam. -
In the late spring and summer of 1976,a similar study was conducted using alonger deflector net (250 ft) at the samelocation (Young et al. 1978). During thisstudy 1,000 fiag-tagged spring chinooksalmon and 957 summer chinook salmonwere released upstream and downstreamfrom the dam at similar locations as usedin the previous study. From theirobservations. Young et al. (1978)estimated fallback was 31% for springchinook salmon at 155 kcfs average spill,and 39.2% for summer chinook salmonduring average spills of 148 kcfs. -Therewas a 60-66% fallback rate for fishreleased upstream from the deflector netand 18% fallback for fish released from theOregon shore. The deflector net wasagain judged to be ineffective and anOregon shore exit for the fishway was
suggested.
Fallback was again observed duringthe spring and summer of 1978 (Gibson etal. 1979). In this study, 898 spring and 881summer chinook salmon were tagged withanchor tags and released upstream anddownstream from Bonneville Dam andcounted at Bonneville, The Dalles andJohn Day dams to determine mortality andfallback rates. Fallback was estimated tobe 15% for spring chinook salmon duringaverage spills of 97 kcfs, and 3% for
summer chinook salmon during averagespills of 76 kcfs. Deflector nets weretested at both fishways during this study.Gibson et al. concluded that the 106 m netplaced upstream from the Bradford Islandexit in 1978 was ineffective at reducingfallbacks, but a 122 m net placed parallel
Fallback at Bonneville Dam was found
to be negligible during 1977 , probably due
36
fell back « 1 %) at The Dalles Dam, ofwhich one fish died and the othercontinued downstream and fell overBonneville Dam. Two fish fell back (1.5%)at McNary Dam and reascended the
fishways.
to the north shore did seem to force fishexiting the Washington-shore fishway tomove further upstream away from thespillway. No fallback was observed atJohn Day Dam and fallback rates could notbe assessed at The Dalles Dam becauseof the fishery near the dam.
The adult passage facilities atBonneville Dam were evaluated again in1983 using 69 spring and 41 fall chinooksalmon, and 39 steel head outfitted withradio transmitters (Turner et al. 1984).Sixty-eight of the spring chinook salmonwere tracked over Bonneville Dam, ofwhich 7 (10.3%) fell back through thespillway. Six of these fish had come fromthe Bradford Island fishway (14.6% of allfish passing dam) and 1 from theWashington-shore fishway (3.6%). Noneof the fall chinook salmon or steel head fellback at the dam.
In 1982, two radio-tracking studieswere conducted at Bonneville Dam.During the first study, transmitters wereplaced in 170 salmon and steel head toevaluate the adult fish passage facilities atBonneville Dam (Ross 1983). Of the 41spring chinook salmon tracked over thedam, 10 (24.4%) fell back during averageflows of 321.2 kcfs (spill = 31 to 199 kcfs)
and 7 of the fallbacks recrossed the dam(one twice). Twenty summer chinooksalmon were -tracked over the dam, ofwhich 3 (15%) fell back through thespillway and reascended the dam. Of the20 steel head released in the summer, 1 of8 tracked over the dam while there wasspill (up to 108 kcfs) fell back over thedams, but none of the 12 tracked whenthere was no spill fell back over the dam.Two of 9 sockeye salmon (22%) also fellback over and recrossed (one sockeyecrossed twice) Bonneville Dam duringsummer flows that averaged 327.6 kcfs(spill = 2 to 250 kcfs). None of the 40 fall
chinook salmon, or the 14 steelheadoutfitted with transmitters in the fall fellback over the dam. Flows in the fall wereabout 147 kcfs with minimal spill (2.4 kcfs).In the second study, 286 fall chinooksalmon were outfitted with transmitters toidentify areas of loss and delay betweenBonneville and McNary dams (Uscom andStuehrenberg 1983). Six fish (2%) fellback at Bonneville Dam, two recrossed thedam, two returned to a hatchery , and twocontinued moving downstream. Two fish
During a 1984 study of adult passageat Bonneville and John Day dams, 146spring chinook salmon with radiotransmitters were tracked upstream.Nineteen fish fell back {13%) at BonnevilleDam, 12 from the Bradford Island fishwayand 7 from the Washington-shore fishway{Shew et al. 1988). All the fallback fishreascended the dam. Five fish {6%) fellback at John Day Dam and 2 recrossedthe dam.
Monan and Johnson (1974) studiedthe movements of 213 fall chinook salmonoutfitted with sonic transmitters todetermine the amount of tributary turnoffand spawning occurring between TheDalles and McNary dams. Thirty-one ofthe fish (29%) released upstream from TheDalles Dam were later found downstream.The fish that fell back may have beendestined for spawning areas or hatcheries
37
downstream from The Dalfes Dam, and themovement over The Dalles Dam was
temporary straying.
juvenile bypass. of which 1 chinook and 1
sockeye salmon recrossed the dam.
In summary , a significant number ofthe adult salmon and steel head passingover dams have been observed to fall backover certain dams. High fallback rates areusually associated with high river flowsand spill at the dams, and the location offishway exits relative to the spillways.Fallback at some dams may also be acorrection by some fish in their migrationpath. Some stocks of fish have a naturaltendency to wander during their migrationand may pass over dams or entertributaries that are not the most direct routeto their home streams (Bjornn et al. 1992).Uscom et al. (1979) concluded fromseveral fallback studies conducted from1971 through 1979, that fallback rates canbe high at times, but few fish are injured ordie as a direct result of falling back over adam. Adults falling back over a dam canlead to inaccurate fish counts at dams(positive bias), and migration times areincreased if the fish must reascend thedam.
In 1980, 44 spring chinook salmon withradio transmitters were released upstreamfrom The Daltes Dam and trackedupstream to evaluate the fish collectionsystem at John Day Dam (Johnson et at.1982). Six fish (13.6%) fell back over TheDalles Dam, and 3 recrossed the dam.Forty of these fish later crossed over JohnDay Dam, of which 3 fell back and 1recrossed that dam.
In 1985, spring and summer chinookand sockeye salmon with radiotransmitters were used to evaluate thepassage facilities at John Day and McNarydams (Shew et al. 1985). Four of 47(8.5%) spring chinook salmon, and 1 of 24sockeye salmon (4.2%) fell back over JohnDay Dam. At McNary Dam, 1 of 45 (2.2%)spring chinook salmon fell back throughthe spillway and that fish later recrossedthe dam. Two of 34 (5.9%) summerchinook salmon, and 2 of 9 (22%) sockeyesalmon fell back through the turbines or the
Migration In Reservoirs
The effect of impounding sections offree flowing Columbia and Snake rivers onthe migration rates and behavior of adultsalmon and steelhead appears to havebeen minimal. Migrants have not beenseriously disorientated by reduced currentsin run-of-river reservoirs. Adult salmonidspassed through the Snake River reservoirsat similar or faster rates than through theunimpounded river (Table 1; Stabler et al.1981 ; Trefethen and Sutherland 1968).Steelhead and chinook salmon typicallytraveled through the reservoirs during the
day, and along the shore lines in water 20to 30 ft deep (Eldred 1970; Strickland1967a; 1967b). Steelhead moved slowerand held longer in the reservoirs as thewater temperatures decreased in winter(Monan et al. 1970), and preferredoverwintering in free flowing stretches ofriver when possible (Stabler et al. 1981 ).
During an initial study in Septemberand October 1967, six steel head with sonictransmitters were tracked though the IceHarbor pool to determine their migrationbehavior within reservoirs (Strickland
38
swam slower, resting more often, andnearer the surface. Only one of the fourfish released in December moved awayfrom Ice Harbor Dam.
1967b). In general, the tagged steel headmoved away from Ice Harbor Dam (AM9.7, river mile) on the morning of release,and travelled along the south shore untilthey reached AM 22 to 26 that evening. Allthe fish stopped moving at night and heldin the deep mid-channel areas. The fishcontinued migrating upstream the nextmorning between sunrise and 11 am,moved along the south bank until reachingAM 33 to 40, and then stopped just beforereaching Lower Monumental Dam. Thesteel head tended to move near shore, inwater 6 to 9 m deep, and at a rate of 1.3km/h (16 to 24 km/d).
In 1975 and 1976, migration of adultsalmon and steel head was studied inLower Granite Reservoir following itsclosure in February of 1975 (Stabler et al.1981 ). In the summer of 1975, 31 chinooksalmon were outfitted with radio or sonictransmitters and tracked through theSnake-Clearwater rivers confluence area.Chinook salmon tracked in the summer(June and July) of 1975 had migrationrates of 1.2 kmlh in the impounded areas.Stabler et al. concluded that impoundmentby Lower Granite Dam did not produce adetrimental effect on salmon migrations insummer. While investigating the effect ofspillway deflectors on adult passage,Uscom and Monan (1976) reported thatchinook salmon with transmitters averaged1.6 kmlh between Little Goose and LowerGranite dams in the spring of 1975.
In a similar study completed in 1969with 20 steelhead outfitted with radiotransmitters and tracked within the IceHarbor pool, 8 were released in Septemberand October (3 of these were lost), 8 werereleased in November, and 4 werereleased in December (Eldred 1970;Monan et al. 1970). The migration pathsused by these fish were similar to thoseobserved in the 1967 study. The fishinitially moved upstream along the southshore to a milling area at AM 15. Fromthere they would move along the southbank to the second milling area at AM 21-23, where many would hold for the night.Between AM 24 and 25 the fish wouldcross over to the north shore, then crossback to the south shore at AM 27, andcontinue on to the next milling areabetween AM 29 and 31. The fish wouldcontinue upstream in this manner untilreaching Lower Monumental Dam. Thetagged steelhead generally swam within 3-30 m of shore, in water 6-12 m deep, andaveraged 1.26 km/h (12 to 50 km/d). InSeptember the fish swam fastest andnearer the bottom, but as temperaturesdroDDed in November and December they
Fifteen steel head were radio trackedfrom Lower Granite Dam in September andOctober of 1975 through the Snake-Clearwater confluence. Four of thesteel head that were destined to continueup the Snake River moved into theClearwater River, and stayed for 4 to 18 dbefore eventually re-entering- the SnakeRiver and continuing upstream, perhapsbecause the Clearwater River was coolerthan the Snake River during the early fall.Migration rates of the tagged steelheadaveraged 12.8 km/d, similar to ratesreported for this section of river prior toimpoundment (Falter and Ringe 1974).Time to travel through the reservoiraveraged 4 d. Prior to impoundment,steel head had used the Snake River for
Haynes and Gray (1980) reportedmigration rates of 2 to 5 km/h for 35chinook salmon with radio transmitters inthe Snake River during a 1976-77 study to
investigate delay and fallback at UttleGoose and Lower Granite dams.
overwintering. Following impoundment,some of the 25 steelhead outfitted withtransmitters overwintered in the uppersection of Lower Granite Reservoir I butmost of the fish moved further upstreaminto the free flowing river sections. Stableret al. (1981) concluded that impoundmentby Lower Granite Dam had altered thequality of this area as overwintering habitatfor steel head.
Bjornn and Ringe (1980) recorded themigration rates of steel head from McNaryDam up the Snake River during a 1978study investigating sources of loss anddelays in the McNary pool area duringsummer and fall. They found thatsteel head with radio transmitters averaged5.5 km/d to Ice Harbor Dam (96 fish), and7.8 to 10.4 km/d to Lower Granite Dam (87
fish).
In 1975 and 1976 studies of peakingflows and adult passage, McMaster et al.(1977) measured migration rates ofchinook salmon and steelhead in theSnake River. Of 12 chinook salmonreleased at Ice Harbor Dam in July withradio transmitters, 8 migrated to LowerMonumental Dam at rates of 11.1 to 35.6km/d, and 3 traveled to Uttle Goose Damat rates of 8.4 to 20.4 km/d. The migrationrate from Ice Harbor to Uttle Goose damsof 22 magnetically tagged chinook salmonreleased upstream from Ice Harbor Dam inJuly averaged 11.8 km/d with flows in theSnake River of <80 kcfs.
In their evaluation of adult passage atthe Snake River dams in 1981 and 1982,Turner et al. (1983; 1984) measuredmigration rates for spring chinook salmonof 56.3 km/d in the reservoir between UttleGoose and Lower Granite dams (21 fish),and 56.0 km/d from Ice Harbor to LowerMonumental Dam (38 fish).
In a 1991 study of spring and summerchinook salmon migration rates in thelower Snake River reservoirs (Bjornn et al.1992), fish with radio transmitters (n = 172-
211) migrated at rates of 56 to 62 km/d inthe reservoirs between the four dams.Migration rates of the salmon in the freeflowing rivers upstream from th-e reservoirswere about half that observed in thereservoirs. River flows and turbidity wererelative low in 1991.
The effects of reservoirs on salmonidmigrations have also been investigated inthe Columbia River. The effect of dams onthe migration rates of sockeye salmon wasstudied by Raymond (1966) through an
Migration rates for steelhead in 1975between Ice Harbor and LowerMonumental and Little Goose dams wasstudied during September throughNovember {McMaster et al. 1977). Of 48steel head with radio transmitters releasedat Ice Harbor Dam, 37 migrated to LowerMonumental Dam at an average rate of20.9 km/d, and 32 migrated to Uttle GooseDam at a rate of 16.7 km/d, the lesser ratereflected time to pass Lower MonumentalDam. The migration rate for 199magnetically-tagged steelhead betweenIce Harbor and Uttle Goose damsaveraged 12.5 km/d.
40
steel head released just upstream from thespillway, 23 fish were tracked 16 kmupstream until the signal was lost.Following release the fish moved awayfrom the dam at time intervals ranging from1 min to 5 h. Most of the fish travelledalong the Washington shore, in water of 9m depth or less, and at rates of about 2
km/h.
analysis of fish counts at dams from 1938to 1963. He found that sockeye salmonmigrated between Bonneville and RockIsland Dam in an average of 17 d (28.4km/d) during 1938-50 (no dams), and 19 d(25.3 km/d) during 1951-63 (up to threedams between Bonneville and Rock Islanddams). In summer 1948, Schoning andJohnson (1956) reported that 74 taggedchinook salmon travelled from BonnevilleDam to Celilo Falls in an average of 8. ~ d(9 km/d). In 1955, tagged spring chinooksalmon migrated from the mouth of theColumbia River to Celilo Falls at anaverage rate of 15.1 km/d (Wendler 1964).
A study was conducted in 1956 and1957 to assess the effect of The DallesDam on salmonid migrations (Oregon FishCommission 1960a). In 1956, prior tocompletion of The Dalles Dam, tagged fishreleased at Bonneville Dam and recoveredat McNary Dam had migration rates of 7.9km/d for spring chinook salmon, 25.1 km/dfor summer chinook salmon, 22.7 km/d forfall chinook salmon, 20 km/d for sockeyesalmon, 19.5 km/d for coho salmon, and14.6 km/d for steel head. After closure ofthe Dalles Dam in 1957 the migration rateswere 25.9 km/d for the summer chinooksalmon, 27.2 km/d for fall chinook salmon,and 27.8 km/d for sockeye. The highertravel rates during the second year of thestudy were attributed to more favorableriver conditions in 1957, and to theinundation of- Celilo Falls by The Dalles
pool.
From 1973 to 1978 in a study tomeasure migration rates of adult salmonand steelhead between Bonneville andUttle Goose dams (Gibson et al. 1979),23, 154 spring chinook and 8,297 summerchinook salmon, and 8,014 summersteel head were tagged and released fromthe Washington shore fishway atBonneville Dam. Migration rates forchinook salmon to Uttle Goose Damaveraged 21.6 km/d in 1973 (low flowyear), and 15.2 km/d and 14.7 km/d during1974 and 1975 (high flow years). Latespring chinook salmon tended to travelslower than early summer chinook salmonunder similar flow conditions. The degreeof overlap between the two chinooksalmon runs at Little Goose Dam was 15%in 1974 and 23% in 1975. Steelheadaveraged migration rates of 20.5 km/d inlate July, and 8.2 km/d in early August of1974. In 1973 spring chinook salmontravelled from Bonneville to McNary Damat rates of 18 km/d, and fall chinooksalmon migrated at 20 km/d (Young et al.1974). In 1974, the spring chinook salmonmoved between Bonneville and The Dallesdams at 21 km/d, and the summer chinooksalmon migrated at 12 km/d (Young et al.1975). In 1975, chinook salmon averaged50.8 km/d between John Day and McNarydams (Young et al. 1977). And in 1978,Gibson et al. (1979) reported that summer
In 1957, 43 adult salmonids were
outfitted with sonic transmitters and
tracked above Bonneville Dam to observethe movement patterns of salmonids in the
forebay of a dam {Johnson 1960). Of the37 fall chinook and 2 coho salmon, and 4
4}
chinook migrated between Bonneville andThe Dalles dams at 17.8 km/d.
{before Rocky Reach Dam wasconstructed) tagged sockeye salmonreleased at Rock Island Dam travelled atrates of 26.4 to 39.7 km/d to Zosel Dam,238 km upstream. Tagged sockeyesalmon covered the same distance at 9.5to 33.9 km/d in 1962 and 1963, aftercompletion of Rocky Reach Dam. Majorand Mighell concluded that Rocky ReachDam had little effect on migrating sockeyesalmon. In a 1965 study of steelhead,eight fish with sonic transmitters weretracked through Rocky Reach Reservoirand found to travel at an average rate of
1.6 km/h {Strickland 1967a). Eightsockeye salmon moved from Bonneville toRocky Reach Dam at rates of 16 to 32km/d in 1966, in a study to determinesources of salmonid losses in theColumbia River {Horton and Wallace
1966).
During the summer of 1975, 47summer chinook salmon and foursteel head were radio tracked overBonneville and The Dalles to determineareas of loss and delay and investigate theeffects of peaking flows on adult passagein the lower Columbia River (Monan andUscom 1976b). During this study 38chinook salmon and one steelhead weretracked from Bonneville Dam to The DallesDam in 30 h (2.5 km/h). In a similar studyin 1977 , Uscom et al. (1978) reportedtravel rates of 1.6 km/h for chinook salmonand 1.3 km/h for steelhead betweenBonneville and John Day dams.
The effects of Brownlee Reservoir, adeep storage reservoir, on upstreammigrations of fall chinook salmon wasassessed by releasing tagged salmon intothe Brownlee Dam forebay and in theSnake River upstream from the reserv-oirand then tracking the fish to the spawninggrounds (Trefethen and Sutherland 1968).These salmon migrated at average rates of16.8 km/d in 1960, and 16.1 km/d in 1962while traveling through the reservoir. Fifty-nine sonically tagged chinook salmonsuccessfully migrated through the reservoirat rates of 2 to 19 km/d. From surveys, itwas determined that there was nosignificant difference in the numbers of fishreaching the upriver spawning groundsbetween the two release sites (Raleigh andEbel 1968; Trefethen and Sutherland
1968).
A sonic tagging study was carried out-in 1965 to determine steel head migrationpatterns in Rocky Reach Reservoir(Strickland 1967a). Of the 18 taggedsteel head released, eight were trackedthrough the entire length of the reservoir.The tagged steelhead moved through thereservoir at rates of about 1.6 km/h.Migrations were interrupted by restingperiods lasting from 15 minutes to severalhours. They would also tend to rest moreand travel slower on reaching the fasterflowing waters near the head of thereservoir. Most of the fish swam near theshores in water 7.5 to 10.7 m deep.
Flows
The volume of water flowing throughrun-of-the-river type reservoirs has been amatter of concern for adult and juvenilesalmonid passage. Generally the concern
Tagged sockeye salmon were alsoused to determine the effects of RockyReach Dam on salmonid migrations (Majorand Mighell 1966). In 1953 and 1954
42
(10 or 20 kcfs), and uncontrolled flows(12.8 to 63 kcfs). They also found that thenumbers of fish counted at the three damsduring 1976 were not significantly differentbetween periods of zero and 20 kcfsnighttime flows.
for adult migrants has besn the low flowsduring part of each day that have beenreleased from dams to save water forelectrical power generation at daily periodswhen power demand is highest. Near-zeroflow at night has been proposed andpracticed in the lower Snake River .Because some adult salmon andsteel head slow their migration at night inthe Columbia and Snake rivers (Strickland1967b; Eldred 1970; Monan et al. 1970),managers theorized that reducing the flowsat night may have minimal effects onmigration rates. Others were concernedthat reduced flows might delay theupstream migration of the fish.
Zero nighttime flows in the SnakeRiver had been limited to 7 h at nightbetween December and March, a periodwhen few fish were migrating. The resultsreported by McMaster et al. {1977)prompted the Bonneville PowerAdministration to request an extension ofthe period when zero flows would beallowed to 9 h a night and to weekends,from August through April. This requestled to a more extensive radio-trackingstudy conducted in 1982 to investigate theeffect of zero flows at night on themigration of adult summer and fall chinooksalmon and steel head in the lower SnakeRiver {Uscom et al. 1985). In this study I258 steelhead and 32 chinook salmonwere tracked from Lower Monumental toUttle Goose Dam during alternatingperiods of zero flows {200 cfs or less)lasting 7 h nightly and up to 24 h on theweekends and normal nighttime flows.Uscom et al. found that travel times to UttleGoose Dam were significantly longerduring zero than during control flows. Thetagged steelhead averaged 120 h to reachUttle Goose Dam during zero flow periods,as compared to a mean of 79 h duringcontrol periods. Travel times for chinooksalmon averaged 70 h during zero flowsversus 40 h during control periods. Moreof the fish that reached Uttle Goose Damalso tended to move back downstream forperiods of time during zero nighttime flows{54%) than during normal flows {25%).Uscom et al. recommended that zero flows
An evaluation of zero flow at night fromtwo dams in the lower Snake Riveroccurred in 1975 and 1976 (McMaster etal. 1977). Alternating weeks of "normal"(10,000) versus zero flow at night was setup at Lower Monumental and Uttle Goosedams during the summer and fall of 1975.Chinook salmon and steel head weretagged (magnetic tags or radiotransmitters) and released to migratethrough the reservoirs during the two fiow-at-night conditions. Six of the 20 radio-tagged chinook salmon released in thesummer of 1975, and 27 of the 48 radio-tagged steelhead released in the fall weretracked from Ice Harbor, or LowerMonumental Dam, to Little Goose Dam.There were also 94 and 312 magnetic-tagged chinook salmon and steelheadreleased at Ice Harbor Dam, of which 28%and 67% were recovered at Uttle GooseDam, respectively. McMaster et al. (1977)concluded that there was no difference inthe behavior or migration rates of thetagged salmon and steelhead during the 8hour nighttime periods of near-zero flows(generally less than 200 cfs), control flows
43
periods of adultnot be used during
migrations.
High flows through reservoirs mayslow the upstream migration of salmon andsteelhead, especially when combined withhigh turbidity , but there is little evidenceavailable at present on the effects of higherflows. During a 1972 study, Monan andUscom (1973) radio tracked 14 springchinook salmon from Bonneville to TheDalles Dam at rates of 25.7 to 35.4 kmld inriver flows that ranged from 209 to 225kcfs, and three fish at rates of 8.0 to 12.9
kmld in flows of 417 kcfs.
Columbia and Snake rivers from mid-Julyto late August. During the summer thetemperature of Snake River waterincreases faster than Columbia Rivertemperatures. In July when concentrationsof fish were forming, Snake River
temperatures were 22OC, as compared to
17oC in the Columbia River. By 2 August,
the water temperature was 26oC in the
Snake River, and 22oC in the ColumbiaRiver. The blockage of fish diminished inlate August when water temperatures had
declined to 21oC in both rivers. At thepeak of the blockage in 1967 an estimated2,000 steel head were holding in theColumbia River near the mouth of theSnake River. Following the temperaturedecrease in early September, steel headcounts at Ice Harbor increased by nearlyan order of magnitude. The delays weredue to the high Snake River temperatures,which were near the lethal limit forsalmonids, but also by the differential oftemperatures in the two rivers.
Temperatures
Turbidity
Turbidity of the water passing a damalso affects adult fish passage; with highturbidities (secchi disk visibilities <0.6 m)the fish virtually cease migrating (Davidson1957; Bjornn and Rubin 1992), perhapsbecause of impaired visibility. Highturbidities often accompany the initial peakflows during the spring snowmelt runoff, sothat a combination of high flows and highturbidities often disrupt the upstreammigration of spring chinook salmon.
Water temperatures influence the rateof upstream migration and timing ofpassage of salmon and steelhead in theColumbia and Snake rivers. Chinooksalmon and steel head usually slow theirmigration in the Columbia River and delayentering the Snake River when watertemperatures are high in the summer andearly fall (Stuehrenberg et al. 1978). As fallproceeds and water temperatures drop, thefish resume their migration. The fallchinook salmon spawn and die, but thesteel head migrate part way to thespawning grounds before stopping theirmigration for the winter as temperatures
reach 4-SoC (Stabler et al. 1981 : Falter
and Ringe 1974).
During an early study (1967-68) of lossand delays of migrating salmonids in the
Columbia and Snake rivers, Stuehrenberget al. (1978) reported that summer chinooksalmon and steel head with radiotransmitters tended to congregate justdownstream from the confluence of the
44
Nitrogen Supersaturation
Hydroelectric development of theColumbia and Snake rivers produced anew hazard for upstream migrants in theform of nitrogen gas supersaturation in thewater. Water flowing over spillways andplunging into deep pools at the base ofdams increases the saturation of nitrogenin the water- (up to 146%, Ebel 1971 ; Grayand Haynes 1977) which led to significantmortalities and delays at Columbia andSnake River dams (Beiningen and Ebel1970; Ebel 1970). Chinook salmon thatmigrate deep in the -Columbia or Snakeriver reservoirs and then move up near thesurface may develop nitrogen gas bubbledisease if the waters are highly saturated(Ebel et al. 1975).
26 sites on the Columbia River fromAstoria to Grand Coulee Dam (includingIce Harbor Dam), from February toNovember. From his analysis Ebelconcluded that supersaturation conditionswere created by the entrainment of gasesfrom the deep plunging of water spilled atthe dams. This conclusion was confirmedduring test spills at Bonneville Dam in1966; nitrogen saturations increased from100% to 125% in the spilled water, whilesaturation levels in water from the forebayand tailraces downstream from the turbinedischarge remained constant. Theincrease in nitrogen saturation varied bydam and the levels were maintainedbetween dams due the lack of circulationand the warming of the surface water in theforebays. Nitrogen saturation levels variedseasonally in accordance with spillschedules. During February and Marchspill was low and nitrogen saturation levelswere normal at 100-105%. Spillsincreased in April and the saturation levelsranged from 110 to 132%. Peak spillingand saturation levels occurred in June andAugust (120 to 140%), and then declinedinto the fall. At Ice Harbor Dam, spillingand saturation levels peaked by mid-Mayand had declined by mid-June.
One of the early reports of nitrogensupersaturation was by Westgard (1964)who reported that 119% nitrogen saturationproduced blindness from gas bubbledisease in 34% of the adult spring chinooksalmon in the McNary spawning channel in1962. Blinded adults had difficultyspawning and an 82% higher pre-spawning mortality rate than fish notblinded. In this case the nitrogensaturation was due to the design of thewater inlet to the channel. Water enteringthe channel plunged over a weir, forcinggases into solution at depths.
Nitrogen supersaturation first becamea concern in 1965 when concentrations ashigh as 125% were measured in theColumbia River (Ebel 1970). Prompted bythis concern, a study was carried out in1966 and 1967 to determine the source ofthe supersaturation conditions and theeffects on migrant salmonids. In 1966 and19671 water samples were collected from
In the 1966 study, nitrogensupersaturation conditions were confirmedto exist in the Columbia and Snake rivers,but little incidence of gas bubble disease ormortalities of fish were observed. Eventsin 1968 at John Day Dam, however,illustrated the potential hazards tosalmonids of supersaturation conditions(Beiningen and Ebel 1970). John DayDam was closed in April of 1968, butbecause the powerhouse was notoperational the entire river flow waspassed over the spillway. John Day Damreservoir also created water temperatures
45
showed symptoms of gas bubble disease.About 30% of the adult fish that returned toRapid River Hatchery in July also showedsymptoms of gas bubble disease.
1 to -2oC higher than existed prior toimpoundment of this section of river. Thisresulted in nitrogen saturations of over125% from April through September, amuch longer period than supersaturationconditions normally occur in the ColumbiaRiver. Coincidental to the high spills,pump malfunctions at The Dalles Dam,and insufficient flows through the fishwaysat John Day Dam caused delays of largenumbers of spring and summer chinooksalmon, sockeye salmon, and steelhead atthese dams. The steelhead were delayedat least one month on their arrival to IceHarbor Dam. Delays of salmon andsteel head under high water temperaturesand supersaturation conditions resulted inlarge numbers of dead fish observedfloating downstream from The Dalles andJohn Day dams. It was estimated that20,000 summer chinook salmon were lostduring this period. Tissue samples fromsteel head and chinook salmon confirmedthe presence of gas bubble disease.
During a comprehensive review of theinformation related to nitrogensupersaturation and salmonid migrations inthe Columbia and Snake rivers, Ebel et al.(1975) stated that adult salmonids may beable to avoid lethal saturation levels byswimming deeper in the water column,below the critical zone. But when thesefish arrive at dams they must pass throughthe shallow (6- 7 ft) fishways where theywill be exposed to potentially lethalconditions. Spillway deflectors, whichprevent deep plunging of spilled water ,were recommended as the effectivemethod to reduce nitrogen saturation levelsat Columbia and Snake river dams.
Gray and Haynes (1977) reportedevidence that chinook salmon would swimdeeper in the water column duringsupersaturation conditions in the SnakeRiver. In the spring of 1976, chinooksalmon with radio transmitters that weretracked as they approached Little GooseDam generally swam at depths of 2 m.Nitrogen concentrations at this time werehigh (124-128%), but were below chinooksalmon tolerance levels below 1.5 to 2 mdepths. When nitrogen concentrationswere lower, in the fall of 1976 and spring of1977 , the tagged fish swam significantlycloser to the surface.
Nitrogen saturation levels were againmonitored in the Columbia and Snakerivers in 1970, from Uttle Goose Dam toAstoria (Ebel 1971 ). Concentrations in thelower Columbia River were lower than in1968-69, but saturations were higher in theSnake River. Nitrogen saturationsdownstream from Uttle Goose Dam weremeasured at 129% in April and 146% inJune. Nitrogen saturation levels droppedquickly after 21 July, concurrently with thedecrease of spill at Uttle Goose Dam from70 kcfs to 13 kcfs. Levels were back tonormal by mid-August. There was someevidence of the effects of thesupersaturation levels on adult migrants,as seen by the dead chinook salmon foundbetween Uttle Goose and LowerMonumental dams in July, some of which
Other Factors
Pollutants released from river-side
industry may also delay salmonidmigrations. In a study to determine if the
46
discharge from an aluminum plant locatedupstream from John Day Dam was relatedto delays of salmonids crossing the dam,Damkaer (1983) reported delays thataveraged 158 and 156 h during the springsof 1979 and 1980, respectively, delays thatwere longer than at other dams at thattime. Water samples were collected andanalyzed from 16 sites -around John DayDam in 1982 .Fluoride concentrations inthe forebay were 0.2 to 0.5 ppm in Apriland June, versus a normal level of 0.1ppm. Median passage times for chinooksalmon at John Day Dam in the fall of 1982were about one week, and Damkaer andDey (1985) reported "losses" betweenJohn Day and McNary clams averaging55%.
channel without fluoride. Of the coho
salmon tested, 36% of the fish moved upthe flume, and 66% of those chose the
non-fluoride channel. More of the chumsalmon moved up t-he channels (78%), and60% of those moving upstream chose thenon-fluoride channel.
In 1984, fluoride concentrations in the-torebay of John Day Dam were usually at0.1 to 0.2 ppm. The median passage timefor chinook salmon to cross the dam was40 h, and the losses between John Dayand McNary dams were similar to 1983levels (Damkaer and Dey 1985).Experiments were again conducted at BigBeef Creek. In these studies chinook andcoho salmon were exposed to twochannels, one with a fluoride level of 0.2ppm, and the other with normal water. Ofthe 97 chinook salmon, and the 51 cohosalmon tested, no preference was shownfor either channel.
Water samples were collected again in1983, focusing on the fluoride and heavymetals; cadmium, copper, lead, and zinc(Damkaer and Dey 1984). Fluoridesconcentrations were about one fourththose measured in 1982, because of a newtreatment waste system used at thealuminum plant in 1983, except duringSeptember and October when the newsystem malfunctioned. Losses of fallchinook salmon between John Day andMcNary dams had decreased to 11% in1983 (Damkaer and Dey 1985). Flumestudies were conducted in 1983 at BigBeef Creek to test the avoidance of chum,coho, and chinook salmon to 0.5 ppmfluoride concentrations. During these teststhe fish were exposed to two flumes, onewith fluoride added, and the other withnormal water. About half the chinooksalmon tested would not move up eitherflume, but of those that did, 75% chose the
The effect of chemicals added to therivers (like fluorides) and electrical fields atthe dams and along the powertransmission corridors could affect thehoming ability of salmon, although there isno evidence of homing disruption fromthose factors at this time. The discovery ofseemingly organized magnetic particles inthe head tissue of salmon (Mann et al.1988) gives rise to speculation that theparticles may playa role in orientation andhoming of fish and other organisms.Additional work is needed to determine ifthe particles playa role in homing, and ifthe role can be disrupted by externalfactors, such as the electrical fields neardams.
47

"Losses" During Migration
whether natural or human-caused. have
been high enough to be of concern.Although we have no estimates of fish
losses and migration delays before damswere constructed in the Columbia andSnake rivers, most people would agreethat losses occurred a Ad migration wasdelayed under certain Gonditions. Sincethe counting of fish began at the dams,discrepancies in counts between damshave been noted and several studies havebeen conducted to determine whatproportion of the discrepancies werelosses versus fish that could be accountedfor at hatcheries, harvest in fisheries, andspawning in tributaries.
Potential losses of fish destined toenter the Snake River were first evaluated
.by Junge (1966a) who compared fishcounts at McNary , Priest Rapids, and IceHarbor dams. From his analysis of the1962-66 fish counts, Junge concluded thatthe numbers of spring, summer, and fallchinook salmon and steel head counted atMcNary Dam that could not be accountedfor at Priest Rapids or Ice Harbor damswere relatively large, were mostly losses,and the losses were primarily from stocksoriginating in the Snake River. In that earlyperiod, 27-41% of the spring chinooksalmon, 8-27% of the summer chinooksalmon, and 0-51% of the fall chinooksalmon were not accounted for betweenthe three dams. The potential losses ofsteel head ranged from 29-45% of thecount at McNary Dam in the same area.At that time Junge (1966a) was concernedthat there might be a trend toward higherlosses.
The discrepancies in counts of adultsalmon and steel head between dams isusually a case of fewer fish counted at theupstream dam. The percentage of fish thatpassed over McNary Dam and could notbe accounted for at either Priest Rapids orIce Harbor dams from 1962 to 1978, forexample, ranged from 0 to 51% of thecount at McNary Dam for spring andsummer chinook salmon, and from 9 to45% for steel head (Junge 1966a;Stuehrenberg et at. 1978; Bjornn andRinge 1980). The fate of the unaccountedfor fish could include turnoff into tributariesbetween the dams, harvest by fishermen,spawning in the river between the dams(for some species), errors or incompletecounts at the dams, fallback at dams, anddeath of the fish between the dams. Insome cases a portion of the discrepancieswere caused by fallback of fish over one ofthe dams which caused the counts, if notadjusted, to be erroneous. Whatever thecause, the losses in some instances,
The causes for the losses in theMcNary-Ice Harbor area were attributed byJunge (1966a) to high flows and spill forspring and summer chinook salmon, andhigh temperatures of the Snake River forsteel head. Evidence was presented thathigh uniform spill from spillbays 2-9 at IceHarbor dams resulted in fewer fish passingthe dam. For summer chinook salmon,high losses occurred during periods oflower spill and flow. Use of improved spillpatterns (i.e. a crowned vs a uniform spillpattern) at Ice Harbor Dam tended to
48
Stuehrenberg et al. (1978) trackedspring and summer chinook salmon andsteel head with sonic transmitters in thelower Columbia and Snake rivers during1967 and 1968. They found that the sportfishery recaptured about 23% of the taggedspring chinook salmon released, 10% ofthe summer chinook salmon, and 29% ofthe steel head. Count discrepanciesbetween McNary and Ice Harbor-PriestRapids dams during the study period were15% for spring chinook salmon (1968only), 7% for summer chinook salmon, and17 to 35% for steel head. No other specificareas of loss could be identified.
1966a; 1966b;decrease losses (Junge
1967).
In a similar analysis of steel headcounts from 1962 to 1979, Bjornn andRinge (1980) reported an average annualdiscrepancy of 30% (26, 100 fish) betweenthe counts at McNary versus Priest Rapidsand Ice Harbor dams. After turnoffs intotributaries and hatcheries in the McNarypool were subtracted, the discrepancy stillamounted to 26% of the count at McNaryDam. Bjornn and Ringe (1980) came tothe same conclusion as Junge (1966a),that most of the unaccounted for steel headwere Snake River fish. During 1978,Bjornn and Ringe (1980) tracked 176 adultsteelhead with radio transmitters toinvestigate areas of loss and delay withinthe. McNary pool. In that year, thediscrepancy between counts at the threedams was 8.6%, the lowest level onrecord, but discrepancies were highdownstream from McNary Dam. No majorarea of loss was found in the 1978 trackingof steelhead. "Losses" between dams maybe due to the cumulative effect of several.factors acting on the fish throughout theirmigration. Probable sources of mortalitydiscussed by Bjornn and Ringe (1980)included injuries from the downstream gillnet fishery , heat stress, and delays at themouth of the Snake River and Ice HarborDam. Other sources of mortality includeillegal or unreported harvest, and deathfrom injuries from seal bites and sportfishing activities. Unaccounted for lossesassociated with dams have primarily beenattributed to fallback, counting error, andmortalities from physical injuries and stressincurred while crossing dams (Fredd 1966;Stuehrenberg et al. 1978).
In a recent analysis of fish countsbetween McNary , Priest Rapids, and IceHarbor dams (Bjornn and Rubin 1992),"loss" rates had not gone higher, thelosses still appeared to be mainly fish ofSnake River origin, and the Snake Riverfish made up a smaller percentage of thefish counted at McNary Dam. In the 1962-1973 period, the count of spring chinooksalmon at Priest Rapids Dam ranged from8 to 20% of the count at McNary Dam.Since 1973, the annual count of springchinook salmon at Priest Rapids Dam hasranged from 25 to 50% of the count atMcNary Dam, reflecting an increase in thenumber of fish passing Priest Rapids Dam(mean = 8, 700 fish 1963-1973 versus14,300 fish 1974-1989) and adecrease inthe number going up the Snake River(mean = 38,600 fish 1963-1973 versus
24,000 fish 1974-1989). For steelhead, thediscrepancies were lower in most of thelatter years, but the unaccounted-for-fishstill appeared to be mostly Snake River
fish.
In a study of passage conditions at
Uttle Goose and Lower Granite dams in
49
unaccounted-for-fish died, the mortalityrate for passing the two dams would havebeen 11% (4 of 35 released).
1981, Turner et al. (1983) tracked springchinook salmon with radio transmittersfrom Lower MOnumenta~ o Lower Granitedams until 19 June'. at 39 fish released atLower Monumental Dam'.f om 23 April to 1June, 1 movea up to the mouth of theTucannon River, 27 moved up to thetailrace of Uttle Goose Dam, 22 eventuallycrossed the dam, and 1 moved backdownstream to the mouth of the TucannonRiver. Of the 22 fish passing Uttle GooseDam, 1 fell back over the dam and waslater found at the mouth of the TucannonRiver, and 21 moved up to Lower GraniteDam, with all 21 crossing over that dam.Assuming that the three fish located at themouth of the Tucannon River weredestined to ascend that stream, there wasno loss of radio tagged fish between UttleGoose and Lower Granite dams. The 12fish that could not be accounted for asentering a stream or crossing Uttle GooseDam may have included fish that died, fishthat regurgitated transmitters, and fish thatmay have moved upstream after the
cessation of surveillance.
By comparing the ten-year countaverages from Ice Harbor and LowerGranite dams we estimated averageannual count discrepancies of 19.9% forspring and summer chinook salmon, and6.8% for steelhead for this stretch of riverduring the period 1980-1989 (Annual FishPassage Report, U.S. Army Corps ofEngineers 1989). Based on these values,which do not include adjustments fortributary escapement or sport fisheryharvests, the losses of adult salmon andsteelhead between Ice Harbor and LowerGranite dams may be less than thosereported for the McNary-Priest Rapids-IceHarbor dam area (Junge 1966a; Bjornnand Ringe 1980).
In an early study of fish countdiscrepancies between dams, Fredd(1966) analyzed data from 1957 to 1965from Bonneville, The Dalles, McNary , andIce Harbor-Priest Rapids dams. Freddadjusted counts at Bonneville Dam forreturns to hatcheries, commercial fisheryharvest, and escapements to the WindRiver, a tributary in the Bonneville pool,before comparing counts at the upstreamdams. Despite the adjustments, thecounts at the upstream qams weresignificantly less than the adjusted countsat Bonneville Dam. For spring chinooksalmon, the discrepancy amounted to 20%of the run between the first two dams, 30%between Bonneville and McNary dams,and 54% between Bonneville and IceHarbor-Priest Rapids dams. For summerchinook salmon, 34% of the run could notbe accounted for between Bonneville andthe upper two dams. The discrepancy in
Spring chinook salmon were outfittedwith radio transmitters and tracked fromHood Park to Ice Harbor and LowerMonumental dams during a 1982evaluation of the fish passage facilities atthe two dams (Turner et al. 1984). Of the31 fish released at Hood Park, 1 died, and30 moved the 14 km up to Ice Harbor Damand then crossed the dam. Of the 30 fishpassing over Ice Harbor Dam plus 4 fishreleased in the Ice Harbor Dam forebay, 31moved up to Lower Monumental Dam, and28 crossed the dam. Three of the fish thatdid not cross Lower Monumental Dammoved back downstream over Ice HarborDam, perhaps after deciding they were inthe wrong stream. If all of the
50
Dam (then under construction) when highspills and supersaturation levels combinedto produce an estimated 20,000 chinooksalmon mortalities, with a resultant 32%loss at McNary Dam (Haas et al. 1969;Haas et al. 1976).
counts of steelhead was small betweenBonneville and The Dalles dams (3%), butincreased to 17% at McNary Dam, and54% at the upper two dams. Freddconcluded that fishery harvest andescapements to tributaries between thedams was insufficient to account for thediscrepancies and that significant numbersof fish were dying enroute to the spawning
grounds.
Uscom and Stuehrenberg (1983)reported that 47% 0! the fall chinooksalmon they tracked from Bonneville Damdid not make- it over McNary Dam; 24%stayed in the Bonneville pool, 22% in TheDalles pool, and 7% in the John Day pool.Most of the fish- entered tributaries or werebelieved to have spawned in the ColumbiaRiver t were caught in commercial andsport fisheries, and fell back over the
dams.
Discrepancies in the counts of salmonand steel head between Columbia andSnake river dams, -at first thought to bepuzzling, now appear to be thecombination of several factors, natural andhuman-made, acting on the upstreammigrants. Upon completion of their studytracking fall chinook salmon fromBonneville to McNary Dam, Uscom andStuehrenberg (1983) concluded that nomajor source of losses existed, but thatdiscrepancies were primarily related todifficulties in estimating tributaryescapements, main channel spawners,and fishery harvests.
Mortalities at Columbia River damsreported from studies conducted from 1955to 1978 have ranged from 4% to 26% forchinook salmon (Weiss (1970); Merrell etal.(1971 ); Gibson et al. 1979; Young et al.1978), and up to 29% for sockeye salmonin 1954-55 (French and Wahle 1966).Mortalities may be caused from delaysbelow dams, gas supersaturation (up to120-140% of normal), and physical injuriesincurred while crossing dams (Merrell et al.1971 ). Injuries to chinook salmonincreased by 5% to 20% betweenBonneville and Uttle Goose dams during astudy conducted from 1973 to 1975, butthe injuries could not be linked to lossesbetween the two dams (Gibson et al.1979). Steelhead with injuries increasedby 18-21% between Bonneville andMcNary dams during a 1974-75 study(Young et al. 1978). An extreme exampleof mortality occurred in 1968 at John Day
Discussion
and numerous observations have beenmade in the last 50 years to aid in the
design of appropriate fish passage facilities
and guide operations at the dams to make
upstream passage as efficient as possible.
The adult passage system in the lower
Snake River has evolved through the
Chinook and sockeye salmon andsteel head migrating to spawning groundsand hatcheries in the Snake Riverdrainage must pass over four dams andthrough their reservoirs in the lower SnakeRiver in addition to the four dams in thelower Columbia River. Several studies
51

years in response to the knowledge andexperience gained during a variety flowand operating conditions. The precariouslylow abundance of sockeye salmon andrecent downward trend in chinook salmonnumbers spurred the initiation of the basin-wide study of adult migrations in the SnakeRiver to insure that adult passage was notsignificantly delayed at the dams or otherpoints along the migration route.
but we could not find an example that wasnot confounded by passage at a dam. Thetime fish take to pass a dam ranges from afew hours to several days (Table 1). Delayat Uttle Goose Dam in a year of high flowswas twice as long as in a year with lowflows (Haynes and Gray 1980). At LowerGranite Dam, the delay in passing the damaveraged about 1 day-when flows wererelatively low (spill 0-25 kcfs), but nearly 7d when fiows- were higher (spill 25-150kcfs) (Turner et al. 1983).The timing of upstream migrations and
losses during migration under naturalconditions varied annually with flows,turbidities, temperatures, and condition ofthe fish. The addition of dams andreservoirs to rivers that are the migrationroutes of salmon and steelhead usuallyincreases the migration time and, in somecases, the mortality of upstream migrants.In the Snake River, before impoundment,and its major tributaries, spring andsummer chinook salmon migrated at meanrates of 18-24 km/d (Oregon FishCommission 1960b). Migration of chinooksalmon through the lower Snake Riverreservoirs has been recorded at meanrates as high as 62 km/d (Turner et al.1983; 1984; Bjornn et al. 1992), but whentime to pass the dams is included, themean rates of passage were in the 8-22km/d range (McMaster et al. 1977; Gibsonet al. 1979; Bjornn et al. 1992), a littleslower than migration rates inunimpounded rivers. When flow conditionsare unfavorable for passage of fish atdams (high flows and spill), the migrationrates in impounded and unimpoundedrivers will decrease.
Discharges irom the powerhouse andspillway influence the routes fish use toenter the fishways. When there is no spill,few fish enter the fishways adjacent to thespillway. Small to moderate amounts ofspill attract fish to the fishway entrancesnear the spillway, but large amounts of spillcan create turbulence that block theentrances. The pattern of water releasedover the spillway can influence the flowpatterns in the tailrace, the attraction flowsleading to the fishway entrances, and theefficiency of fish passage. Althoughdefinitive tests are difficult to conduct,limited tests and observations (Junge1966a; 1967; 1969; Junge and Carnegie1972; 1976a) have been useful in settinggeneral guidelines for spill patterns at theSnake River dams. With limited spill, thewater should be discharged through theend bays to attract fish to nearby fishwayentrances. As the quantity of spillincreases, discharge from the end bays iskept low to prevent -t?locking of theentrances adjacent to the spillway I and thisgradually leads to a crowned or level spillthrough the center bays. At high levels ofspill (>60 kcfs at the Snake River dams)effective fishway attraction flows becomedifficult to maintain.
High flows that occur in the spring, thatare often more turbid than at other times ofthe year, appear to have some effect onmigration rates of adult chinook salmon,
52
Fishway entrance use by adult salmonand steelhead is influenced by dischargesfrom the powerhouse. The location ofentrances and flow patterns differ at eachdam, and generalizations are not of muchhelp except to know that fish usually gowhere there is flow, unless there is toomuch turbulence. If there is evidence ofsignificant delay at a dam, then a detailedstudy of entrance use and flow patternsmay be needed.
fishways, some may go out an entrance,but many pass up through the fishways ina few hours. A large proportion of the timerequired to pass a dam appears to be thetime used to find and enter the fishways(Uscom and Monan 1976). Most fish passthrough the fishways during daylight{Fields et al. 1963; 1964; Calvin 1975), andthose that enter at night usually take longerto pass {Shew et al. 1985). The 1 on 10slope ladders with overflow weirs andsubmerged orifices appear to functionadequately for adult salmon and steel head.Fluctuations in discharges from
powerhouses because of hydroelectricpower peaking can delay adult salmon andsteel head in their migration (Junge 1971 ).may cause an increase in the mortality rate(Young et al. 1974; 1977). and may disruptthe normal daily pattern of migration(Wagner 1971 ). The influence of reducingflows to zero at night in the Snake River onadult passage were conflicting. McMasteret al. (1977) reported that zero nighttimeflows had no measurable effect on themigration rates or behavior of chinooksalmon and steel head in the lower SnakeRiver during a 1975-76 study. Uscom etal. (1985). on the other hand. reported thatsteelhead traveled slower upstreambetween Lower Monumental and UttleGoose dams in 1981 during zero flowsthan during normal flows. Somedownstream movement during zero flowsat night was also seen. Additional testingof the effects of zero flow at night on themigration of steelhead in the lower SnakeRiver was initiated in 1991 and willcontinue through 1994.
Fallback of fish over the spillway orpast the turbines after they have crossed adam varies with species, season of year,flow, and configuration of the componentsof the dam (Table 2). Fallback rates forspring and summer chinook salmon at thelower Snake River dams appear to berelatively low «10%) during low flowconditions with no spill, but can be high(40% observed) when large amounts ofwater is spilled. Fallback rates at theSnake River dams for steel head seem tobe high (up to 20%) considering the lowflows and lack of spill during the summer-fall migration period. The natural tendencyfor many of these fish to overwinter in thelower Snake River is probably anexplanation for the high fallback rates.Most of the fish observed to have fallenback at Snake River dams havereascended and continued their migration,which is evidence that falling back over orthrough a dam is not necessarily fatal. Aswe learn more about fish migrations in theColumbia and Snake Rivers, we willprobably find that some of the fallback isnecessary as wandering fish correct theircourse and resume migration to their natalstreams.
Fishway entrances and ladders at the
Snake River dams benefitted from the
design and testing at previouslyconstructed dams in the Columbia River .
Once adult salmon and steel head enter the
,1
discrepancies at the dams were notlosses, for the most part, but due to ourlack of information on tributaryescapements, main channel spawners,and fishery harvests.
In contrast to Uscom andStuehrenberg's (1983) conclusion that fewfall chinook salmon were lost betweenBonneviJle and McNary dams, losses ofadults can be significant as they migrateupstream. In studies where mortality wasmonitored, losses of adult chinook salmonand steelhead while passing dams haveranged from 4 to 29% (French and Wahle1966; Gibson et al. 1979; Merrell et al.1971; Weiss 1970; Young et al. 1978).Losses of the magnitude listed above maynot occur now because of improvements infacilities and operations in recent years.Nevertheless, losses can be significant asin 1991, when up to 25% of the spring andsummer chinook salmon released at HoodPark near the mouth of the Snake Riverwith radio transmitters could not beaccounted for upstream from the reservoirs(Bjornn et al. 1992). Conditions forupstream migration of adults wererelatively good in 1991 (low flows, no spill,low turbidity) and no obvious passageproblems were encountered. Many of thelost fish may have died from naturalcauses. The effect of less optimummigration conditions on adult survival ratesin the Snake River will be studied in futureyears, and means of reducing the losses ofadults, from whatever cause, should be
pursued.
The loss of adult salmon andsteelhead as they migrate up the Columbiaand Snake rivers to natal streams is amajor concern. Fish no doubt died duringtheir upstream migration before dams werepresent, but there are no estimates of theloss. With the addition of dams, thepotential for increased loss rates ofupstream migrants exist if fish havedifficulty passing over a dam or fall back atone or more dam. In an early analysis ofpotential "losses" between dams, Fredd(1966) reported that the discrepancy incounts between Bonneville and PriestRapids-Ice Harbor dams for the 1957-65period averaged 54% for spring chinooksalmon, 34% for summer chinook salmon,and 54% for steel head. He concluded thatunreported fishery harvest andescapements to tributaries between thedams was insufficient to account for thediscrepancies and that significant numbersof fish were being lost. Junge (1966a) inan analysis of the 1962-66 fish countdiscrepancies between McNary and PriestRapids-Ice Harbor dams concluded thatsubstantial losses were occurring and thatthe losses were primarily fish destined toenter the Snake River. In a recent analysisof the fish count discrepancies for thesame area (Bjornn and Rubin 1992), thediscrepancies have not gone higher andthe "losses" still seem to be mostly ofSnake River fish. Uscom andStuehrenberg (1983) after radio trackingfall chinook from Bonneville to McNarydams concluded that fish count
54

LIterature Cited
Arndt, D., J. Duncan, J. Kuskie, and G. Johnson. 1976. The effects of hydroelectricpeaking an adult salmonid entry rate into The Dalles Dam powerhouse fish collectionsystem. U.S. Army Corps of Engineers, Portland District, Portland, Oregon.
Beiningen, K. T ., and W .J. Ebel. 1970. Effect of John Day Dam on dissolved nitrogenconcentrations and salmon in the Columbia River, 1968. Transactions of theL-
American Fisheries Society 99:664-671.
Bell, M.C. 1984. Fisheries handbook of engineering requirements and biological criteria,fish passage development and evaluation program. U.S. Army Corps of Engineers,
North Pacific Division, Portland, Oregon.
Bjornn, T .C., D.R. Craddock, and D.R. Corley. 1968. Migration and survival of RedfishLake sockeye salmon, °!!c2rhY!1chus n~. Transactions of the American L
Fisheries Society 97:360-373.
Bjornn, T .C., and R.R. Ringe. 1980. Evaluation of steel head trout losses in the McNaryPool area of the Columbia and Snake rivers, 1962-1979. Forest, Wildlife and RangeExperiment Station, University of Idaho, Technical Report 11, Moscow.
Bjornn, T .C., and R.R. Ringe. 1982. Effects of rate of discharge change on catchabilityand movements of steelhead trout in the Clearwater River. Idaho Cooperative FisheryResearch Unit, University of Idaho, Completion Report, Moscow.
Bjornn, T.C., R.R. Ringe, K.R. Tolotti, P.J. Keniry, and J.P. Hunt. 1992. Migration of adultchinook salmon and steel head past dams and through reservoirs in the lower SnakeRiver and into tributaries -1991. Technical Report 92-2, Idaho Cooperative Fish andWildlife Research Unit and U.S. Army Corps of Engineers, Walla Walla, Washington.
Bjornn, T .C., and S. Rubin. 1992. Migration of adult salmon and steelhead in the LowerSnake River as related to flows, turbidity, and temperatures. Technical Report 92-2,Idaho Cooperative Fish and Wildlife Research Unit, University of Idaho, Moscow.
Burck, W .A., and I. W .Jones. 1963. Summer steelhead tagging experiments at McNary
Dam in 1955 and 1956. Oregon Fish Commission Research Briefs 9:42-51.
Calvin, L. 1975. Estimating night fish passing over Bonneville, The Dalles and John Day
dams. U.S. Army Corps of Engineers, Portland, Oregon.
Clay, C.H. 1961. Design of fishways and other fish facilities. Department of Fisheries of
Canada, Ottawa, Ontario.
55
Collins, G.B., and C.H. Erling. 1958. Performance of salmon in experimental "endless"fishways with slopes of 1 on 8 and 1 on 16. U.S. Fish and Wildlife Services andBureau of Commercial Fisheries, Seattle.
Collins, G.B., C.H. Elling, J.R. Gauley, and C.S. Thompson. 1963. Effect of fishway slopeon performance and biochemistry of salmonids. Fishery Bulletin 63:221-253.
Collins, G.B., J.R. Gauley, and C.H. Elling. 1962. Ability of salmonids to ascend highfishways. Transactions of the American Fisheries Society 91 :1-7.
Connor, A.R., C.H. Elling, E.C. Black, G.B. Collins, J.R. Gauley, and E. Trevor-Smith.1964. Changes in. glycogen and lactate levels in migrating salmonid fishes
ascending experimental "endless" fishways. Journal of the Fisheries Research
Board of Canada 21 :255-290.
Cramer, F .K., B.M. MacLean, and R.C. Oligher. 1959. Supplementary report on theinfluence of the south entrance on the Oregon shore fish collection system in passingfish over McNary Dam. U.S. Army Corps of Engineers, Walla Walla District, Walla
Walla, Washington.
Damkaer, D.M. 1983. Effects of water-borne pollutants on fish-passage at John DayDam, Columbia River. National Marine Fisheries Service, Northwest and Alaska
Fisheries Center, Seattle.
Damkaer, D.M., and D.B. Dey. 1984. Adult fish delay at John Day Dam. National MarineFisheries Service, Northwest and Alaska Fisheries Center, Annual Report, Seattle.
Damkaer, D.M., and D.B. Dey. 1985. Effects of water-borne pollutants on salmon-passage at John Day Dam, Columbia River (1982-1984). National Marine FisheriesService, Northwest and Alaska Fisheries Center, Final Report, Seattle.
Davidson, F .A. 1957. The effects of floods on the upstream migration of salmon in the
Columbia River. Public Utility District No.2 of Grant County , Ephrata, Washington.
Delacy, A.C., S.P. Felton, and G.J. Paulik. 1956. A study to investigate the effects offatigue and current velocities on adult salmon and steel head trout. U.S. Army Corpsof Engineers, North Pacific Division, Pages 126-138 in Progress Report on Fisheries
Engineering Research Program, Portland, Oregon.
Duncan, R.N., D.P. Arndt, J.R. Kuskie Jr., and G.A. Johnson. 1978. The Dalles Dampowerhouse fish collection system studies, 1974-75. U.S. Army Corps of Engineers,
Portland, Oregon.
Duncan, R.N., D.P. Arndt, J.R. Kuskie Jr., G.A. Johnson, and D.D. Sunday. 1974. JohnDay Lock and Dam powerhouse fish collection studies. U.S. Army Corps of
Engineers, Portland, Oregon.
56
Duncan, R.N., D.P. Amdt, J.R. Kuskie Jr., G.A. Johnson, and D.D. Sunday. 1975. TheDalles Dam powerhouse fish collection system studies. 1974. U.S. Army Corps of
Engineers, Portland District, Portland, Oregon.
Ebel, W .J. 1970. Supersaturation of nitrogen in the Columbia- River and its effect onsalmon and steel head trout. U.S. Fish and Wildlife Service Fishery Bulletin 68:1- i 1.
Ebel, W .J. 1971. Dissolved nitrogen concentrations in the Columbia and Snake rivers in1970 and their effect on chinook salmon and steelhead trout. National MarineFisheries Service, Technical Report, SSRF-646, Seattle.
Ebel, W.J., H.L. Raymond, G.E. Monan, W.E. Farr, and G.K. Tanonaka. 1975. The effectof atmospheric gas supersaturation caused by dams on salmon and steelhead troutof the Snake and Columbia rivers. National Marine Fisheries Service, Northwest
Fisheries Center, Seattle.
Eldred, D.R. 1970. Steelhead fishing project, Ice Harbor Reservoir, 1969.Corps of Engineers, Walla Walla District, Walla Walla, Washington.
u.s. Army
Falter, C.M., and R.R. Ringe. 1974. Pollution effects on adult steelhead migration in theSnake River. College of Forestry, Wildlife and Range Sciences, University of Idaho,
Project No. 180S0DMB, Moscow.
Fields, P.E., G.L. Finger, and R.J. Adkins. 1955. The effect of electric lights upon theupstream passage of three species of adult salmon through the University ofWashington fish ladder. University of Washington, College of Fisheries, Technical
Report No.12, Seattle.
Fields, P .E., J.P. Sainsbury , and D.D. Kenoyer. 1964. Effect of changing light intensityand spillway flow pattern upon adult salmon passage at The Dalles Dam. Research
Fisheries of Seattle Contribution No. 166:37-38.
Fields, P.E., W.G. Wainwright, D.I. Wielder, and A.R. Martin. 1964. Migration of adultsalmon through lighted fish ladders. Research Fisheries of Seattle Contribution No.
166:36-37.
Fredd. L.C. 1966. Analysis of differences in fish counts at Columbia River Dams, 1957-
65. Fish Commission of Oregon. Portland.
French, R.R., and R.J. Wahle. 1966. Study of loss and delay of salmon passing RockIsland Dam, Columbia River, 1954-1956. U.S. Fish Wildlife Service Fishery Bulletin
65:339-368.
Gard, R. 1973. Travel time and influencing factors for migrating adult sockeye salmon in
Karluk River, Alaska. Transactions of the American Fisheries Society 102:723-727.
57
Gauley, J.R. 1960. Effect of fishway slope on rate of passage of salmonids. U.S. Fishand Wildlife Service, Special Scientific Report: Fisheries No.350, Washington D.C.
Gauley, J.R. 1966. Effect of water velocity on passage of salmonids in a transportation
channel. U.S. Fish and Wildlife Service Fishery Bulletin 66:59-63.
Gauley, J.R., and C.S. Thompson. 1962. Further studies on fishway slope and its effecton rate of passage of salmonids. U.S. Fish and Wildlife Service Fishery Bulletin
63:45-62.
Gibson, G., R. Michimoto, F. Young, and C. Junge. 1979. Passage problems of adultColumbia River chinook salmon and steel head, 1973-78. Oregon Department of
Fish and Wildlife, Portland.
> Gray, R.H., and J.M. Haynes. 1977. Depth distribution of adult chinook salmon(Oncorh~nchus tshaW.¥1scha) in relation to season and gas-supersaturated water.Transactions of the American Fish-eries Society 106:617-620.
-Haas, J.B., B.E. Carnegie, and C. Junge. 1969. Fish passage problems at lower
Columbia River dams in 1968. Fish Commission of Oregon, Part II, Portland.
Haas, J.8., 8.8. Carnegie, and C. Junge. 1976. Fish passage problems at lowerColumbia River dams in 1968. U.S. Army Corps of Engineers, North PacificDivision, Fourth Progress Report on Fisheries Engineering Research Program 1966-
1972, Report No.4, Part II, Portland, Oregon.
) Haynes, J.M., and R.H. Gray. 1980. Influence of Uttle Goose Dam on upstreammovements of adult chinook salmon. Fisheries Bulletin 78:185-190.
Holmes, H.B., and F .G. Morton. 1939. Success of the Bonneville fishway~ during theirfirst year of operation. Progressive Fish Culturist 45:1-11.
Horton, H.F., and R.L. Wallace. 1966. Tagged salmon and the Indian fishery.Department of Fisheries and Wildlife, Oregon State University, Corvallis.
Jensen, A.J., T .G. Heggberget, and B.O. Johnsen. 1986. Upstream migration of adultAtlantic salmon, Salmo .salaL L., in the River Vefsna, Northern Norway. Journal of
Fish Biology 29:459-466.
Jensen, A.J., B.O. Jonsson, and L.P. Hansen. 1989. Effect of river flow and watertemperature on the upstream migration of adult Atlantic salmon Salmo .salaL L. in theRiver Vefsna, Northern Norway. Pages 140-146 in E. Brannon, and B. Jonsson,editors. Proceedings of the Salmonid Migration and Distribution Symposium.
Seattle.
58
Johnson, G.A., J.R. Kuskie Jr., W.T. Nagy, K.L. Uscom, and L Stuehrenberg. 1982. TheJohn Day Dam powerhouse adult fish collection system evaluations, 1979 -1980.U.S. Army Corps of Engineers, Portland District, Portland, Oregon.
Johnson, G.A., L. Stuehrenberg, K.L. Uscom, J.R. Kuskie Jr ., W .T. Nagy, and D.P. Arndt.
1979. The Bonneville lock and dam powerhouse adult fish collection system
evaluation 1976-1978. U.S. Army Corps of Engineers, Portland District, Portland,
Oregon.
Johnson, J.H. 1960. Sonic tracking of adult salmon at Bonneville Dam, 1957. U.S. Fishand Wildlife Service Fishery Bulletin 176 60:471-485.
Johnson, J.H. 1964. Fallback of adult chinook salmon (Oncorh~nchus tsha~scha) atIce Harbor Dam spillway -1964. Review of progress "on the Fish Passage ResearchProgram. U.S. Bureau of Commercial Fisheries Bulletin No.41 , Seattle.
Junge, C.O. 1966a. Indications of loss and delay to adult salmonids below Ice HarborDam (1962-66). Oregon Fish Commission, Portland.
Junge, C.O. 1966b. Observations on the effects of spillway distribution on fish passage atIce Harbor Dam. Fish Commission of Oregon, Portland.
Junge, C.O. 1967. Standardization of spill patterns at Ice Harbor Dam. Fish Commissionof Oregon, Final Report, Portland.
Junge, C.O. 1969. Operational studies at dams on the lower Columbia River with a briefanalysis of new spilling techniques at Ice Harbor Dam. Fish Commission of Oregon,Part 1, Portland.
Junge, C.O. 1971. Effect of peaking operations on passage of adult salmonids overColumbia River dams. Fish Commission of Oregon, Portland.
Junge, C.O., and B.E. Carnegie. 1970. Operational studies at dams on the lowerColumbia and Snake rivers. Fish Commission of Oregon, Clackamas, Oregon.
Junge, C.O., and B.E. Carnegie. 1972. General guidelines for adjusting spill distributionsto improve fish passage with tentative spilling schedules for Bonneville and John Daydams. Fish Commission of Oregon, Clackamas, Oregon.
Junge, C.O., and B.E. Carnegie. 1973. Operational studies (1972-73). Fish Commissionof Oregon, Clackamas, Oregon.
Junge, C.O., and B.E. Carnegie. 1976a. Dam operations and adult fish passage, 1975.Oregon Department of Fish and Wildlife, Clackamas, Oregon.
59

Junge, C.O., and B.E. Carnegie. 1976b. Spillway studies, 1976. Oregon Department ofFish and Wildlife, Clackamas, Oregon.
Uscom, K.L., and G.E. Monan. 1976. Radio-tracking studies to evaluate the effects of thespillway deflectors at Lower Granite Dam on adult fish passage, 1975. NationalMarine Fisheries Service, Northwest Fisheries Center, Seattle.
Uscom, K.L, and L.C. Stuehrenberg. 1983. Radio tracking studies of 'upriver bright' fallchinook salmon between Bonneville and McNary dams, 1982. National MarineFisheries Service, Northwest and Alaska Fisheries Center, Seattle.
Uscom, K.L., G.E. Monan, and L.C. Stuehrenberg. 1977 .Radio tracking studies of springsalmon in relation to evaluating potential solutions to the fallback problem andincreasing the effectiveness of the powerhouse collection system at Bonneville Dam,1976. National Marine Fisheries Service, Northwest and Alaska Fisheries Center,Final Report, Seattle.
Uscom, K.L., G.E. Monan, and L.C. Stuehrenberg. 1979. Radio tracking studies relatingto fallback at hydroelectric dams on the Columbia and Snake rivers. U.S. ArmyCorps of Engineers, North Pacific Division, Pages 39-53 in Fifth Progress Report onFisheries Engineering Research Program 1973-78, Portland, Oregon.
Uscom, K.L., G.E. Monan, L.C. Stuehrenberg, and P.J. Wilder. 1985. Radio-trackingstudies on adult chinook salmon and steelhead trout at lower Columbia River-hydroelectric dams, 1971-77. National Marine Fisheries Service, Northwest andAlaska Fisheries Center, Technical-Memorandum, NMFS F/NWC-81 , Seattle.
Uscom, K.L., L.C. Stuehrenberg, and G.E. Monan. 1978. Radio tracking studies of springchinook salmon and steel head trout to determine specific areas of loss betweenBonneville and John Day dams, 1977 .National Marine Fisheries Service, Northwestand Alaska Fisheries Center, Seattle.
Liscom, K.L., L.C. Stuehrenberg, and F .J. Ossiander. 1985. Radio tracking studies ofadult chinook salmon and steelhead to determine the effects of "zero" river flowduring water storage at Uttle Goose Dam on the Snake River. National MarineFisheries Service, Northwest and Alaska Fisheries Center, Final Report, Seattle.
Major, R.L., and J.L. Mighell. 1966. Influence of the Rocky Reach Dam and thetemperature of the Okanogan River on the upstream migration of sockeye salmon.U.S. Fish and Wildlife Service Fishery Bulletin 66:131-147.
Mann, M.M., N.H.C. Sparks, M.M. Walker, and J.L. Kirschvink. 1988. Ultrastructure,morphology and organization of biogenic magnetite from sockeye salmon,Oncorhynchus nerka: implication for magnetoreception. Journal of ExperimentalBiology 140:35-49.
60

McMaster, K.M., R.G. White, R.R. Ringe, and T.C. Bjornn. 1977. Effects of reducednighttime flows on upstream migration of adult chinook salmon and steel head trout inthe lower Snake River. University of Idaho, Idaho Water Resources ResearchInstitute, FWR Experimental Station, Contribution 93, Final Report, Moscow.
Merrell, T .R., M.D. Collins, and J. W .Greenough. 1971. An estimate of mortality ofchinook salmon in the Columbia River near Bonneville Dam during the summer of1955. U.S. Fish and Wildlife Service Fishery Bulletin 68:461-492.
-Monan, G.E., and J.H. Johnson. 1974. Distribution of 1965 fall chinook salmon between
The Dalles and McNary dams, as determined by sonic tagging. National Marine
Fisheries Service, Northwest Fisheries Center, Final Report, Seattle.
Monan, G.E., and K.L. Uscom. 1971. Radio tracking of adult spring chinook salmonbelow Bonneville Dam, 1971. National Marine Fisheries Service, North PacificFisheries Research Center, Final Report, Seattle.
Radio tracking of adult spring chinook below1972. National Marine Fisheries Service,
Monan, G.E., and K.L. Uscom. 1973.Bonneville and The Dalles dams,Northwest Fisheries Center, Seattle.
Monan, G.E., and K.L. Uscom. 1974a. Radio tracking studies of fall chinook salmon todetermine effect of peaking on the passage at Bonneville Dam, 1973. NationalMarine Fisheries Service, Northwest Fisheries Center, Seattle.
Monan, G.E., and K.L. Uscom. 1974b. Radio tracking of spring chinook salmon todetermine effect of spillway deflectors on passage at Lower Monumental Dam, 1973.National Marine Fisheries Service, Northwest Fisheries Center, Seattle.
Monan, G.E., and K.L. Uscom. 1975. Radio tracking studies to determine the effects ofspillway deflectors and fallback on adult chinook salmon and steel head trout atBonneville Dam, 1974. National Marine Fisheries Service, Northwest FisheriesCenter, Seattle.
Monan, G.E., and K.L. Uscom. 1976. Radio tracking studies of summer chinook salmonand steel head trout at and between Bonneville and The Dalles dams, 1975. NationalMarine Fisheries Service, Northwest Fisheries Center, Seattle.
Monan, G.E., K.L. Uscom, and J.R. Smith. 1970. Sonic tracking of adult-steelhead in IceHarbor Reservoir, 1969. Bureau of Commercial Fisheries, Biological Laboratory,Final Report, Seattle.
Monan, G.E., K.L. Uscom, and L.C. Stuehrenberg. 1979a. Radio tracking studies todetermine the effects of peaking on adult chinook salmon and steel head. U.S. ArmyCorps of Engineers, North Pacific Division, Pages 31-38 in Fifth Progress Report toFisheries Engineering Research Program 1973-1978, Portland, Oregon.
61

Monan, G.E., K.L. Usconi, and L.C. Stuehrenberg. 1979b. Radio tracking studies todetermine the effects of spillway deflectors on adult salmonids. U.S. Army Corps ofEngineers, North Pacific Division, Pages 103-109 in Fifth Progress Report on
Fisheries Engineering Research Program 1973-1978, Portland, Oregon.
Monan, G.E., J.R. Smith, K.L. Uscom, and J.H. Johnson. 1970. Evaluation of upstreampassage of adult salmonids through the navigational lock at Bonneville Dam duringthe summer of 1969. Bureau of Commercial Fisheries, Seattle.
-Monk, B., D. Weaver, C. Thompson, and F.J. Ossiander. 1989. Effects of flow and weir
design on the passage and behavior of American shad and salmonids in anexperimental fish ladder. North American Journal of Fisheries Management 9:60-67.
Oregon Fish Commission. 1960a. An investigation of the effect of The Dalles Dam uponmigration rates of adult salmonids, 1956 and 1957. Oregon Fish Commission,
Fisheries Engineering Research Project, Portland.
Oregon Fish Commission. 1960b. Results of a tagging program to enumerate thenumbers and to determine the seasonal occurrence of anadromous fish in the SnakeRiver and its tributaries. U.S. Army Corps of Engineers, North Pacific Division,Pages 20-22 in. Progress Report on the Fisheries Engineering Research Program,
Portland, Oregon.
Paulik, G.J., and A.C. DeLacy. 1957. Swimming abilities of upstream migrant silversalmon, sockeye salmon, and steelhead at several water velocities. University of
Washington, College of Fisheries, Technical Report 441 I Seattle.
Paulik, G.J., and A.C. DeLacy. 1958. Changes in the swimming ability of Columbia Riversockeye salmon during upstream migration. University of Washington, College of
Fisheries, Technical Report 46, Seattle.
The effect of rest on the swimmingUniversity of Washington, College of
Paulik, G.J., A.C. DeLacy, and E.F. Stacy. 1957.performance of fatigued adult silver salmon.Fisheries, Technical Report 31, Seattle.
Raleigh, R.F ., and W .J. Ebel. 1968. Effect of Brownlee Reservoir on migrations ofanadromous salmonids. Pages 415-452 in Proceedings of the Reservoir Fishery
Resources Symposium. American Fisheries Society, Bethesda, Maryland.
Raymond, H.L. 1964. Effect of dams on the upstream migr.ation rates and timing of
Columbia River salmonids. U.S. Bureau of Commercial Fisheries, Fish-PassageResearch Program, Seattle.
Ross, C. V. 1983. Evaluation of adult fish passage at Bonneville Dam, 1982. U.S. Army
Corps of Engineers, Portland, Oregon.
62
Schoning, R. W ., and D.R: Johnson. 1956. A measured delay in the migration of adultchinook salmon at Bonneville Dam on the Columbia River. Oregon FishCommission, Contribution No.23, Portland.
Shew, D.M., R.D. Peters, R.J. Stansell, and L.M. Beck. 1985. Evaluation of adult fishpassage at McNary Dam and John Day Dam, 1985. U.S. Army Corps of Engineers,Portland District Fisheries Office Bonneville Lock and Dam, Cascade Locks, Oregon.
Shew, D.M., R.D. Peters, R.J. Stansell, D.R. Bryson, A.R. Case, and A.R. Turner Jr.1988. -Evaluation of adult fish passage at Bonneville and John Day dams in 1984.U.S. Army Corps of Engineers, Portland District, Portland. Oregon.
Stabler, D.F ., R.G. White, R.R. Ringe, and T .C. Bjornn. 1981. Effects of altered flowregimes, temperatures and river impoundment on adult steelhead trout and chinooksalmon. Idaho Cooperative Fishery Unit, University of Idaho, Final Report, Moscow.
Strickland, R. 1967a. Sonic tracking study of steel head in the Rocky Reach Reservoir.Washington State Department of Game, Olympia~
Strickland, R. 1967b. Sonic tracking of-steelhead in the Ice Harbor Reservoir, 1967.Washington State Department of Game, Olympia.
Stuehrenberg, L.C., K.L. Uscom, and G.E. Monan. 1978. A study of apparent losses ofchinook salmon and steelhead based on count discrepancies between dams on theColumbia and Snake rivers, 1967-1968. U.S. Army Corps of Engineers, Final
Report, Portland, Oregon.
Stuehrenberg, L.C., G.E. Monan, and K.L. Uscom. 1979. Vertical slots fishway evaluationat Bonneville Dam. U.S. Army Corps of Engineers, North Pacific Division, Pages183-186 in Fifth Progress Report on Fisheries Engineering Research Program 1973-
78, Portland, Oregon.
Thompson, C.S., W.S. Davis, and E. Slatick. 1967. Response of migrating adult salmonsto vertical and horizontal retangular orifices at two depths. U.S. Fish and WildlifeService, Special Scientific RepQrt: Fisheries No.547 I Washington D.C.
Thompson, C.S., and J.R. Gauley. 1965. Laboratory evaluation of the 1-on-10 slope IceHarbor fishway design. U.S. Fish and Wildlife Service, Special Scientific Report:Fisheries No.509, Washington D.C.
Trefethen, P .S., and D.F. Sutherland. 1968. Passage of adult chinook salmon throughBrownlee Reservoir, 1960-62. U.S. Fish and Wildlife Service Fishery Bulletin 67:35-
45.
~1
Turner Jr, A.R., J.R. Kuskie Jr, and K.E. Kostow. 1983. Evaluation of adult fish passageat Uttle Goose and Lower Granite dams, 1981. U.S. Army Corps of Engineers,Portland District, Portland, Oregon.
Turner Jr, A.R., J.R. Kuskie Jr, and K.E. Kostow. 1984. Evaluation of adult fish passageat Ice Harbor and Lower Monumental dams, 1982. U.S. Army Corps of Engineers,Portland District, Portland, Oregon.
Turner Jr, A.R., D.M. Shew, L.M. Beck, R.J. Stansell, and R.D. Peters. 1984. Evaluationof adolt fish passage at Bonneville lock and dam in 1983. U.S. Army Corps ofEngineers, Portland District, Portland, Oregon.
u.s. Army Corps of Engineers. 1953. Interim report on submerged orifice research,powerhouse fish collection system, Bonneville Dam. U.S. Army Corps of Engineers,Oregon DistrictL Portland.
u.s. Army Corps of Engineers. 1956a. Powerhouse system attraction and transportation
flows, Bonneville Dam. U.S. Army Corps of Engineers, North Pacific Division, Pages42-48 in Progress Report Fisheri~s Engineering Research Program, Portland,
Oregon.
U.S. Army Corps of Engineers. 1956b. Submerged orifice research powerhouse fishcollection system, Bonneville Dam. U.S. Army Corps of Engineers, North PacificDivision, Progress Report on Fisheries Engineering Research Program, Portland,
Oregon.
Army Corps of Engineers. 1960. Powerhouse fish collection system andtransportation flows, Bonneville Dam. U.S. Army Corps of Engineers, PortlandDistrict, Pages 127-130 in Fisheries Engineering Research Program, ProgressReport, Portland, Oregon.
U.S. Army Corps of Engineers. 1962-1989. Annual fish passage report. Columbia andSnake River projects. Oregon and Washington. U.S. Army Corps of Engineers,Portland and Walla Walla Districts. Portland. Oregon.
u.s. Army Corps of Engineers. 1979a. Adjusting spill distributions to improve fishpassage at Corps dams (1973-1976). U.S. Army Corps of Engineers, North PacificDivision, Pages 155-164 in Fifth Progress Report on the Fisheries EngineeringResearch Program, Portland, Oregon.
u.s. Army Corps of Engineers. 1979b. Side entrance fishway studies. U.S. Army Corpsof Engineers, North Pacific Division, Pages 209-218 in Fifth Progress Report onFisheries Engineering Research Program 1973-1978, Portland, Oregon.
Army Corps of Engineers. 19790. Studies of the relationships between adult fishpassage and powerhouse operations. U.S. Army Corps of Engineers, Portland
64
District, Pages 15-29 in Fifth Progress Report on Fisheries Engineering Research
Program, Portland, Oregon.
Wagner, C.H. 1971. Fish passage and power peaking at Ice Harbor Dam.Marine Fisheries Service, unpublished reportI Seattle.
National
Weaver, C.R. 1962. Preliminary report on the evaluation of the 1-on-10 slope fish ladderat Ice Harbor Dam on the Snake River. Bureau of Commercial Fisheries, Seattle.
Weaver, C.R. 1963. Influence of water velocity upon orientation and performance of adultmigration salmonids. U.S. Fish and Wildlife Service Fishery Bulletin 63:97-121.
Weaver, C.R. 1968. Research on fishway problems conducted at the Fisheries-Engineering Research Laboratory at Bonneville Dam,. U.S. Fish and Wildlife
Service, Progress Report No.151.
Weaver, C.R., C.S. Thompson, and F.J. Ossiander. 1976. Evaluation of fish passage inthe vertical slot regulating section of the south shore ladder at John Day Dam. U.S.Army Corps of Engineers, Fourth Progress Report on Fisheries Engineering
Research Program 1966-1972, Report No.13, Portland, Oregon.
Weiss, E. 1970. A tagging study to investigate the unexplained loss of spring andsummer chinook salmon migrating past Bonneville and The Dalles Dams. Fish
Commission of Oregon, Final Report, Portland.
Wendler, H.O. 1964. Migration and fishing mortality rates of Columbia River spring
chinook salmon in 1955. Fishery Resource Papers 2(3):71-83.
Westgard. R.L. 1964. Physical and biological aspects of gas-bubble disease inimpounded adult chinook salmon at McNary spawning channel. Transaction of the
American Fisheries Society 93:306-309.
Young, F.R., R.T. Michimoto, and G. Gibson. 1977. Passage problems of adult chinooksalmon and steelhead trout in the Columbia River between Bonneville and McNarydams during 1975. Oregon Department of Fish and Wildlife, Annual Progress
Report, Clackamas, Oregon.
Young, F.R., R.T. Michimoto, and G. Gibson. 1978. Passage problems of adult chinooksalmon during 1976 and 1977 and steelhead trout during 1974 and 1975 in theColumbia River between Bonneville and McNary dams. Oregon Department of Fishand Wildlife, Fish Division, Portland. .
Young, F.R., R.T. Michimoto, G.G. Gibson, A.H. Mirati Jr, H.E. Jensen, and D.W. Nichols.1975. An investigation of the effects of peaking upon adult salmon in the ColumbiaRiver. Fish Commission of Oregon, Annual Progress Report, Portland.
65

Young, F.R., R.T. Michimoto, G.G. Gibson, R.T. Westfall, H.E. Jensen, and D.W. Nichols.1974. An investigation of the effects of peaking upon adult salmon in the ColumbiaRiver. Fish Commission of Oregon, Annual Progress Report. Portland.
66
Additional Related Literature
Aaserude, R.G., and J.F. Orsborn. 1986. New concepts in fish ladder design. Part 2:Results of laboratory and field research on new concepts in weir and pool fishways.Bonneville Power Administration, Project No.82-14, Final Report, Portland, Oregon.
Andrew, F.J., and G.H. Green. 1958. Sockeye and pink salmon investigations at theSeton Creek hydroelectric installation. International Pacific Salmon Fish Commission,Progress Report No.4, New Westminster, British Columbia.
Andrew, F.J., and G.H. Green. 1960. Sockeye and pink salmon production in relation toproposed dams in the Fraser River system. International Pacific Salmon FisheriesCommission, Bulletin No.11 , New Westminster, British Columbia.
Banks, J. W .1969. A review of the literature on the upstream migration of adult salmonids
Journal of Fish Biology 1 :85-136.
Barry, T.J. 1983. Movement of adult American shad (AlQ.sa sapidissima) in ahydroelectric facility tailrace at Holyoke Dam, Connecticut River, during spawningmigration. Master's thesis. University of Massachusetts, Amherst.
Barry, T.J., and B. Kynard. 1986. Attraction of adult American shad to fish lifts at HolyokeDam, Connecticut River. North American Journal of Fisheries Management 6:233-
241.
Bauer, J.A., J.D. Mclntyre, and H.H. Wagner. 1976. Recycling of summer steel head atWinchester Dam, Oregon. Oregon Department of Fish and Wildlife, ResearchSection, Information Report Series, Fisheries No.76-2, Portland.
Baxter, G. 1961. River utilization and the preservation of migratory fish life. Proceedings
of the Institution of Civil Engineers 18:225-244.
Beamish, F.W. H. 1978. Swimming capacity. Pages 101-187 in. W.S. Hoar and D.J.Randal, editors. Fish Physiology, volume 7. Academic Press, New York.
Bell, C.E. 1982. Immediate mortality of adult American shad (Alo.sa sasidissima) resultingfrom passage through a Kaplin turbine at Holyoke Dam, Massachusetts. Master'sthesis. University of Massachusetts, Amherst.
Bell, C.E., and B. Kynard. 1985. Mortality of adult American shad passing through a 17-megawatt Kaplan turbine at a tow-head hydroelectric dam. North American Journal of
Fisheries Management 5:33-38.
Bell. M.C. 1973. Fisheries handbook of engineering requirements and biological criteria.U.S. Army Corps of Engineers. North Pacific Division. Portland, Oregon.
67
Bell, M.C., and H.B. Holmes. 1962. Engineering and biological study of proposed fish-passage at dams on Susquehanna River, Pennsylvania. Pennsylvania Fish
Commission, Harrisburg.
Bennett, D.E. 1982. Fish passage at Willamette Falls in 1981. U.S. Fish and WildlifeService, Dingell -Johnson Project No. F11 OOO/88E25045, Portland, Oregon.
Bennett, D.E. 1983. Fish passage at Willamette Falls in 1982. U.S. Fish and Wildlife
Service, Dingell- Johnson Project No. F-115-R, Portland, Oregon.
Bennett, D.E. 1984. Fish passage at Willamette Falls in 1983. U.S. Fish and Wildlife
Service, Dingell- Johnson Project No. F-115-R, Portland, Oregon.
Bennett, D.E. 1985. Fish passage at Willamette Falls in 1984. U.S. Fish and WildlifeService, Dingell- Johnson Project No. F-115-R-3 and E-115-R-4, Portland, Oregon.
Blackett, R.F. 1987. Development and performance of an Alaskan steeppass fishway for
sockeye salmon. Canadian Journal of Fisheries and Aquatic Sciences 44:66-67.
Brawn, V .M. 1979. Efficiency of an estuarine fishway for the passage of salmon (SaJ.mo
.sa1aL L.), Sheet Harbour, Nova Scotia. Fisheries Marine Service, Manuscript Report
No.1523, Halifax, Nova Scotia.
FisheriesBrett. J.R. 1957. Salmon research and hydroelectric power development.Research Board of Canada Bulletin No.114.
Canada Department of the Environment, F .S. and International Pacific Salmon FisheriesCommission. 1971. Fisheries problems related to Moran Dam on the Fraser River.Technical Staffs of Canada Department of the Environment, Fisheries Service andInternational Pacific Salmon Fisheries Commission, Vancouver, British Columbia.
Chaney, E. 1978. A question of balance. Water/energy -salmon and steel head
production in the Columbia River Basin. Northwest Resource Information Center, Inc,
Summary Report, Portland, Oregon.
Clemens, W .A. 1958. The Fraser River salmon in relation to potential powerdevelopment. Pages 3-10 in P. A. Larkin, editor. The Investigation of Fish-PowerProblems, H.R. MacMillan Lectures in Fisheries. University of British Columbia,
Vancouver.
Cleugh, T .R., and L.R. Russell. 1980. Radio tracking chinook salmon to determinemigration delay at Whitehorse Rapids Dam. Fisheries and Marine Service,Manuscript Report No.1459, Vancouver, British Columbia.
Collins, G.B. 1951. A fishway that shad ascend. U.S. Fish and Wildlife Service, SpecialScientific Report: Fisheries No.65, Washington D.C.
68
Collins, G.B. 1952. Factors influencing the orientation of migrating anadromous fishes.U.S. Fish and Wildlife Service Fishery Bulletin 52:375-396.
Collins, G.B. 1956. Research on fishway problems. U.S. Army Corps of Engineers, NorthPacific Division, Fisheries Engineering Research Program, Portland, Oregon.
Collins. G.B. 1976. Effects of dams on Pacific salmon and steel head trout.
Fisheries Review 38(11 ):39-46.
Marine
Collins. G.B.. W .J. Ebel. G.E. Monan. H.L. Raymond. and G.K. Tanonaka. 1975. TheSnake River salmon and steel head crisis. its relation to dams and the national energycrisis. National Marine Fisheries Service. Northwest Fisheries Center. Seattle.
Collins, G.B., and C.H. Elling. 1960. Fishway research at the Fisheries-EngineeringResearch Laboratory. U.S. Fish and Wildlife Service, Circular 98, Seattle.
Cowx, I.G., and R.A. Gould. 1989. Effects of stream regulation on Atlantic salmon,Salmon sal.aL L., and brown trout, Salmo 1ru.tta L., in the upper Severn catchment, U.K.
Regulated Rivers: Research and Management 3:235-245.
Cramer, S.P ., and J. T. Martin. 1979. Rogue basin evaluation program, adult salmonid
and water quality study. Oregon Department of Fish and Wildlife, Fish Research
Project, Annual Progress Report, Portland.
Cramer, S.P., and B.P. McPherson. 1981. Rogue Basin fisheries evaluation program,adult salmon studies. Oregon Department of Fish and Wildlife, Fish Research Project,
Annual Progress Report, Portland.
Cramer, S.P., and B.P. McPherson. 1983. Rogue basin fisheries evaluation program,adult salmonid studies. Oregon Department of Fish and Wildlife, Fish Research
Project, Annual Progress Report, Portland.
Cramer, S.P ., T .D. Satterthwaite, R.B. Boyce, and B.P. McPherson. 1985. Lost CreekDam fisheries evaluation phase I completion report, volume I: Impacts of Lost CreekDam on the biology of anadromous salmonids in the Rogue River. OregonDepartment of Fish and Wildlife, Fish Research Project, Portland.
Dadswell, M.J., R.A. Rulifson, and G.R. Daborn. 1986. Potential impact of large-scaletidal power developments in the upper Bay of Fundy on fisheries resources of the
Northwest Atlantic. Fisheries 11 (4):26-35.
Davidson, F .A. 1967. The effect of a succession of dams on the Columbia river on theupstream movement of the blueback salmon runs. Public Utility District of Grant
County , Ephrata, Was~ington.
69
Davidson, F.A., and F.K. Cramer. 1960. Concluding report on the influence of the southentrance on the Oregon shore fish collection system in passing fish over McNaryDam. U.S. Army Corps of Engineers, Walla Walla District, Walla Walla, Washington.
Davidson, F .A., E. Vaughan, and S.J. Hutchinson. 1943. Factors influencing theupstream migration pink salmon (Oncorh~nchus gorbusca). Ecology 24:149-168.
Davies, J.K. 1988. A review of information relating to fish passage through turbines:implications to tidal power schemes. Journal of Fish Biology 33:111-126.
Decker,L.F. 1956. Fishways in Maine. Maine Department of Inland Fisheries and Game,Information and Education Division,-Pamphlet Number 5, Augusta.
Dell, M.B., M. W .Erho, and B.D. Leman. 1975.symptoms on fish in mid-Columbia reservoirs.
Douglas, and Chelan Counties.
Occurrence of gas bubble diseasePublic Utility Districts of Grant,
Dunkley, D.A., and W.M. Shearer. 1989. Swimming height of Atlantic salmon, Salmo.sala(L., crossing a crumpweir. Aquaculture and Fisheries Management 20:193-198.
Ebel, W .J. 1985. Review of effects of environmental degradation on the freshwaterstages of anadromous fish. Pages 62-79 in J.S. Alabaster, editor. HabitatModifications and Freshwater Fisheries.
Ebel, W .J., and H.L. Raymond. 1976. Effect of atmospheric gas supersaturation onsalmon and steel head trout of the -Snake and Columbia rivers. Marine FisheriesReview Paper No.1191
Elling, C.H. 1960. Further experiments in fishway capacity, 1957. U.S. Fish and WildlifeService, Special Scientific Report: Fisheries No.340, Washington D.C.
Elling, C.H., and H.L. Raymond. 1959. Fishway capacity experiment, 1956. U.S. Fishand Wildlife Service, Special Scientific Report: Fisheries No.299, Washington D.C.
Ellis, D. V. 1962. Preliminary studies on the visual migration of adult salmon. Journal ofthe Fisheries Research Board of Canada 19:137-148.
Ellis, D. V. 1966. Swimming speeds of sockeye and coho salmon on spawning migration.
Journal of the Fisheries Research Board of Canada 23:181-187.
Fields, p .E. 1954. The effect of electric lights upon the upstream passage of sockeye
salmon through the University of Washington fish ladder. University of Washington,
College of Fisheries, Technical Report 10, Seattle.
Fields, p .E. 1957. Guiding migrating fish. Science Monthly 85:10-22.
70
French, R.R., and R.J. Wahle. 1958. Pacific salmon investigations: magnitude and timeof migration, rate of travel, and spawning areas in tributaries of fish runs passingRocky Reach dam site. Bureau of Commercial Fisheries, Seattle.
Fretwell, M.R. 1989. Homing behavior of adult sockeye salmon in response tohydroelectric diversion at home stream waters at Seton Creek. International PacificSalmon Fisheries Commission, Bulletin No.25
Fustish, C.A., S.E. Jacobs, B.P. McPherson, and P.A. Frazier. 1988. Rogue Basinevaluation program, Applegate Dam evaluation, phase I completion report, effects ofApplegate Dam on the biology of anadromous salmonids in the Applegate River .
Oregon Department of Fish and Wildlife, Portland.
Galbreath, J.L. 1966. Timing of tributary races of chinook salmon through the lowerColumbia River based on analysis of tag recoveries. Fish Commission of Oregon
Research Briefs 12:58-80.
Gauley, J.R., and C.S. Thompson. 1964. Diffusion water velocity -its effect on salmonidpassage through a transportation channel. U.S. Bureau of Commercial Fisheries. FishPassage Research Program, Seattle.
Gibson, G., C. Junge, R. Michimoto, and F. Young. 1979. Passage problems of adultColumbia River chinook salmon and steel head, 1973-78. U.S. Army Corps ofEngineers, North Pacific Division, Pages 55-98 in Fifth Progress Report on Fisheries
Engineering Research Program, Portland, Oregon.
Gordon, R.N. 1965. Fisheries problems associated with hydroelectric development. The
Canadian Fish Culturist 35:17-36.
Graban, J.R. 1964. Evaluation of fish facilities: Brownlee and Oxbow dams, Snake River.
Idaho Department of Fish and Game, Boise.
Gray, R.H., and J.M. Haynes. 1979. Spawning migration of adult chinook salmon(OncQrh~nchus tshaw¥1scha) carrying external internal radio transmitters. Journal ofthe Fisheries Research Board of Canada 36:1060-1064.
Groves, A.B. 1964. Effects of water temperature on swimming performance of adultchinook salmon (summary). U.S. Bureau of Commercial Fisheries, Fish Passage
Program, Seattle.
Gunsolus, R.T., and G.J. Eicher. 1962. Evaluation of the fish' passage facilities at thePelton project on the Deschutes River in Oregon. Fish Commission of Oregon,
Processed Report, Portland.
71

Hanson, H.A., P.D. Zimmer, and I.J. Donaldson. 1950. Injured and dead fish in thevicinity of Bonneville Dam. U.S. Fish and Wildlife Service, Special Scientific Report:Fisheries No.29, Washington D.C.
Hawkins, A.D. 1989. Factors affecting the timing of entry and upstream movement ofAtlantic salmon in the Aberdeenshire Dee. Pages 101-105 in. E. Brannon, and B.Jonsson, editors. Proceedings of the Salmonid Migration and Distribution Symposium.
Seattle.
Hayes, F .R. 1953. Artificial freshets and other factors controlling the ascent andpopulation of Atlantic Salmon in the LaHave River, Nova Scotia. Fisheries Research
Board of Canada Bulletin 99.
Hildebrand, S.G., M.C. Bell, E.P. Richey, J.J. Anderson, and Parkhurst. 1980. Analysis ofenvironmental issues related to small scale hydroelectric development, II: Designconsiderations for passing fish upstream around dams. Union Carbide, Oak RidgeNational Laboratory , Environmental Sciences Division, Publication No.1567 , Oak
Ridge, Tennessee.
Hiss, J.M., P.E. Bigelow, and S.R. Hager. 1990. Pre-spawning adult distribution ofQueets River spring-summer chinook and feasibility of radio telemetry to study adultin-river migration. U.S. Fish and Wildlife Service, Fisheries Assistance Office,
Olympia, Washington.
Holmes, H.B., and M.C. Bell. 1960. A study of the upstream passage of anadromous fishat Willamette Falls, with recommendations for improvements in fish-passage facilities.Oregon Fish Commission, Portland.
Hourston, W .R. 1958. Power development and anadromous fish in British Columbia.Pages 15-24 in P. A. Larkin, editor. The Investigation of Fish-Power Problems, H.R.Macmillan Lectures in Fisheries. University of British Columbia, Vancouver .
Huntsman, A.G.
75:257-266.
1945. Freshets and fish. Transaction of the American Fisheries Society
Ingram, P .' and L. Korn. 1976. Evaluation of fish passage facilities at Cougar Dam on theSouth Fork McKenzie River in Oregon, Final Report. U.S. Army Corps of Engineers,North Pacific Division, Fourth Progress Report on Fisheries Engineering Research
Program 1966-1972, Report No.35, Portland, Oregon.
Johnson, J.H. 1956. Vertical and horizontal fish distribution observed with sonic gear,lower channel -Bonneville Dam. U.S. Fish and Wildlife Service, Pacific SalmonInvestigations, Technical Report No.13, Preliminary Report, Seattle.
72
Johnson, J.H. 1965. Fallback of adult chinook salmon at Ice Harbor spillway I May 1964.U.S. Army Corps of Engineers, Fisheries Engineering Research Program, Third
Progress Report, Portland, Oregon.
Junge, C.O. 1969. Shad through upper section of the Bradford Island Ladder undersimulation of proposed design. Fish Commission of Oregon, Brief Preliminary Report,
Portland.
Junge, C.O. 1974. Operational studies, 1973-74. Fish Commission of Oregon, Portland.
Junge, C.O. 1976a. Standardization of spill patterns at Ice Harbor Dam. U.S. ArmyCorps of Engineers, North Pacific Division, Fourth Progress Report on Fisheries
Engineering Research Project, 1966-1972, Report No.1, Portland, Oregon.
Junge, C.O. 1976b. Operational studies at dams on the lower Columbia River with a briefanalysis of adequacy of new spilling techniques at Ice Harbor Dam. U.S. Army Corpsof Engineers, North Pacific Division, Fourth Progress Report on Fisheries EngineeringResearch Project 1966-1972, Report No.4, Part 1,- Portland. Oregon.
Junge, C.O. 1976c. Effect of peaking operations on passage of adult salmonids overColumbia River dams. U.S. Army Corps of Engineers, North Pacific Division, FourthProgress Report on Fisheries Engineering Research Program 1966-1972, Report No.
5, Portland.
Junge, C.O., and B.E. Carnegie. 1976a. General guidelines for adjusting spill distributionsto improve fish passage with tentative spilling schedules for Bonneville and John Daydams. U.S. Army Corps of Engineers, North Pacific Division, Fourth Progress Reporton Fisheries Engineering Research Program, 1966-1972, Report No.2, Portland,
Oregon.
Junge, C.O., and B.E. Carnegie. 1976b. Operational studies at dams on the lowerColumbia and Snake rivers. U.S. Army Corps of Engineers, North Pacific Division,Fourth Progress Report on Fisheries Engineering Research Program 1966-1972,
Report No.3, Portland, Oregon.
Kynard. B.E. 1982. Restoration of anadromous fishes to eastern rivers: effect of
hydroelectric dams on fish migration. Bulletin of Ecological Society of America
63:193-194.
Lander, R.H. 1959. The problem of fishway capacity. U.S. Fish and Wildlife Service,Special Scientific Report: Fisheries No.301 , Washington D.C.
Lavier, D.C. 1976. Major dams on the Columbia River and tributaries. Pacific Northwest
Regional Commission, Investigative Reports of Columbia River Fisheries Project,
Vancouver, Washington.
73

Leman, B.D., and G.J. Pai.Jlik. 1964. The effect of submerged lighting conditions on thepassage of salmonids in the viewing pool at Rocky Reach Dam. Public Utility DistrictNo.1 of Chelan County , Washington.
Leman, B., and G.J. Paulik. 1966. Spill pattern manipulation to guide migrant salmonupstream. Transactions of the American Fisheries Society 95:397-407.
Uscom, K.L., L.C. Stuehrenberg, and G.E. Monan. 1979. Radio-tracking studies ofchinook salmon and steelhead to determine specific areas of loss between dams.U.S. Army Corps of Engineers, North Pacific Division, Pages 5-14 in Fifth Progressreport on Fisheries Engineering Research Program 1973-1978, Portland, Oregon.
Long, C. W .1959. Passage of salmonids through a darkened fishway. U.S. Fish and
Wildlife Service, Special Scientific Report: Fisheries No.300, Washington D.C.
MacKinnon, D., and J.R. Brett. 1953. Fluctuations in the hourly rate of migration of adultcoho and spring salmon up the Stamp Falls fish ladder, progress report of the PacificCoast Stations. Fisheries Research Board of Canada, No. .95:53-55.
Major, R.L., and G.J. Paulik. 1972. Effect of encroachment of Wanapum Dam reservoiron fish passage over Rock Island Dam, Columbia River. NOAA Fishery Bulletin
70:125-140.
Mauseth & Associates, I. 1980. Mauseth & Associates, Inc., Manuscript Draft, Redmond,
Washington.
McMaster, K.M., R.G. White, R.R. Ringe, and T.C. Bjornn. 1979. Effects of reducednighttime flows on upstream migration of adult chinook salmon and steel head trout inthe lower Snake River. U.S. Army Corps of Engineers, North Pacific Division, Pages125-131 in Fifth Progress Report on Fisheries Engineering Research Program,
Portland, Oregon.
Monan, G.E. 1985. Development of the Columbia-Snake River; Its impact onanadromous salmonids and the role of hatcheries, fish bypasses and the waterbudget, and collection and transport. The Permanent International Association ofNavigation Congress Bulletin 51 :82-97.
Monan, G.E., and K.L. Uscom. 1976. Radio tracking of adult spring chinook salmonbelow Bonneville Dam, 1971. U.S. Army Corps of Engineers, North Pacific Division,Fourth Progress Report on Fisheries Engineering Research Program 1966- 72, Report
No.9, Portland, Oregon.
Monan, G.E., K.L. Uscom, and J.R. Smith. 1976. Sonic tracking of adult steel head in IceHarbor Reservoir. U.S. Army Corps of Engineers, North Pacific Division, FourthProgress Report on Fisheries Engineering Research Program 1966-1972, Report No.
10, Portland, Oregon.
7A.
Monan, G.E., J.R. Smith, K.L. Uscom, and J.H. Johnson. 1976. Evaluation of upstreampassage of adult salmonids through the navigation lock at Bonneville Dam during thesummer of 1969. U.S. Army Corps of Engineers, North Pacific Division, FourthProgress Report on Fisheries Engineering Program 1966-1972, Report No.6,
Portland, Oregon.
Neave, F. 1943. Diurnal fluctuations in the upstream migration of coho and spring
salmon. Journal of the Fisheries Research Board of Canada 6:158-163.
Netboy, A. 1958. Salmon of the Pacific Northwest. Binfords & Mort, Publishers, Portland.
Netboy. A. 1973. The salmon: their fight for survival. Houghton Mifflin Company. Boston.
Nichols, P .R. 1968. Passage conditions and counts of fish at the Snake Island fishway,Uttle Falls Dam, Potomac River, Md., 1960-63. U.S. Fish and Wildlife Service,Special Scientific Report: Fisheries No.565, Washington D.C.
Nichols, P.R., and D.E. Lo-uder. 1970-: Upstream passage of anadromous fish throughnavigation locks and use of the stream for spawning and nursery habitat Cape Fear
River, N.C., 1962-66. U.S. Fish and Wildlife Service, Circular No.352, Washington
D.C.
Northrop, R.B., and J. Q'Leary. 1980. Progress report on the use of underwater electricfields to control the movements of migratory fish at Holyoke, Massachusetts.
Northeast Utilities Service Company, Reports 1 and 2.
Northwest Power Planning Council. 1986a. Council staff compilation of information onsalmon and steel head losses in the Columbia River Basin. Northwest Power Planning
Council, Portland, Oregon.
Northwest Power Planning Council. 198Gb. Council staff compilation of information onsalmon and steelhead losses in the Columbia River Basin: appendices. Northwest
Power Planning Council, Portland, Oregon.
Oligher, R.C., F.K. Cramer, and B.M. MacLean. 1961. Report of experiments with thepressure fish lock at McNary Dam. U.S. Army Corps of Engineers, Walla Walla
District, Walla Walla, Washington.
Ombredane, D., G. Fontenelle, H. Ohresser, and S. Rochepeau. 1987. Dam overpassingby migratory adult salmonids. An analyses of the leaping behavior with the view of abetter management. Bulletin Francais De La Peche Et De La Pisciculture 305:67-80.
Oregon Fish Commission. 1956. Investigations of the rate of passage of salmon andsteel head trout through Bonneville Dam and The Dalles Dam site as compared tounobstructed sections of the Columbia River. U.S. Army Corps of Engineers, North
Pacific Division, Fisheries Engineering Research Program, Portland, Oregon.
75
Orsborn, J.F. 1985. New concepts in fish ladder design. Part 1: Summary .Bonneville
Power Administration, Project No.82-14, Final Report, Portland, Oregon.
Orsborn, J.F ., and P .0. Powers. 1986. Fishways--an assessment of their developmentand design, final project report. Part 3 of 4. Bonneville Power Administration., ProjectNo.82-14, Final Report, Portland, Oregon. -
Osborne. M.F. M. 1961. The hydrodynamic performance of migratory salmon. Journal of
Experimental Biology-38:365-390.
Pacific Northwest Power Company. 1959. High Mountain Sheep Dam and conservation
of salmon and steelhead. Pacific Northwest Power Company, Boise, Idaho.
Patillo, P .' and D. Mclsaac. 1982. Unexplained loss of adult chinook in the ColumbiaRiver between Bonneville and McNary dams, 1977-1981. Washington State
Department of Fisheries, Progress Report No.162,
Paulik, G.J., and R.L. MajQ.r. 1966. 1-g65 Tagging experiment to evaluate fish passagefacilities at Rock Island Dam. U.S. Bureau of Commercial Fisheries, Seattle.
Powers, P .0., and J.F. Orsborn. 1986. Analysis of barriers to upstream fish migration.Part 4: Investigations of the physical and biological conditions affecting fish passagesuccess at culverts and waterfalls. Bonneville Power Administration, Project 82-14,
Final Report, Portland, Oregon.
Pulford, E.F. 1955a. Escapement of spring chinook salmon and steel head overWillamette Falls in 1953. Fish Commission of Oregon Research Briefs 6:19-28.
Pulford, E.F. 1955b. Escapement of spring chinook salmon and steel head overWillamette Falls in 1954. Fish Commission of Oregon Research Briefs 6:21-24.
Raphael, J.M. 1961. The effect of Wanapum and Priest Rapids dams on the temperatureof the Columbia River, September 1961. Public Utility District No.2 of Grant county,
Final Report, Ephrata, Washington.
Rawding, D. 1989. An analysis of the adult fish counting program at Lower Granite Damduring November and December, 1986, 1987, and 1988. Washington Department of
Wildlife, Fish Management Division, Manuscript draft, Olympia.
Raymond. H.L. 1978. Status of Snake River stocks of salmon and steel head. NationalMarine Fisheries Service. Northwest and Alaska Fisheries Center. Seattle.
Ross, C. V. 1982. Evaluation of the Bonneville second powerhouse adult fishways duringthe start-up year of 1981. U.S. Army Corps of Engineers, Portland District, NPPOP-
FMU, Portland, Oregon.
76
Sande, T.V. 1966. Fishways. A. Calhoun, editor.California Department of Fish and Game, Sacramento.
Inland Fisheries Management.
Satterthwaite, T.D. 1987. Rogue Basin fisheries evaluation program, effects of Lost CreekDam on spring chinook salmon in the Rogue River, Oregon: An update. OregonDepartment of Fish and Wildlife, Fish Research Project, Portland.
Slatick, E. 1970. Passage of adult salmon and trout through pipes. U.S. Fish and WildlifeService, Special Scientific Report: Fisheries No.592, Washington, D.C.
Slatick, E. 1975. Laboratory evaluation of a Denil-type steeppass fishway with variousentrance and exit conditions for passage of adult salmonids and American shad.
Marine Fisheries Review Paper 115837(9):17-26.
Smith, A.K., and B.P. McPherson. 1981. The effects of Lost Creek Dam on downstreamtemperatures of the Rogue River, Oregon. Pages 131-140 in T.J. Hassler, editor.Proceedings: Propagation, Enhancement, and Rehabilitation of AnadromousSalmonid Populations and Habitat in the Pacific Northwest Symposium. Arcata,
California.
Smith, E.M., and L. Korn. 1976. Evaluation of fish facilities and passage at Fall CreekDam on Big Fall Creek in Oregon, Final Report. U.S. Army Corps of Engineers, NorthPacific Division, Fourth Progress Report on Fisheries Engineering Research Program
1966-72, Report No.36, Portland, Oregon.
Spranger, M.S. 1984. Columbia River salmon. A resource in danger. NOAA, Washington
Sea Grant Program, Project A/FP- 7, Vancouver, Washington.
Stabler, D.F. 1981. Effects of altered flow regimes, temperatures, and river impoundmenton adult steel head trout and chinook salmon. Master's thesis. University of Idaho,
Moscow.
Stabler, D.F .' R.G. White, R.R. Ringe, and T .C. Bjornn. 1976. The effects of altered flow
regimes, temperatures and river impoundment on adult steelhead trout and chinook
salmon. Idaho Cooperative Fishery Research Unit, University of Idahr:>, Progress
Report, Moscow.
Stabler, D.F., R.G. White, R.R. Ringe, and T.C. Bjornn. 1979. The effects of altered flowregimes, temperatures and river impoundment on adult steelhead trout and chinooksalmon. U.S. Army Corps of Engineers, North Pacific Division, Pages 111-124 in Fifth
Progress Report on Fisheries Engineering Research Program, Portland, Oregon.
Stockley, C. 1975. Injury and disease in Columbia River fishes associated with dams.Washington Department of Fisheries, Management and Research Division,
Supplemental Progress Report, Columbia River Investigations.
77
Strickland, R. 1976a. Sonic tracking of steel head in Ice Harbor Reservoir, 1967. U.S.Army Corps of Engineers, North Pacific Division, Fourth Progress Report on FisheriesEngineering Research Program 1966-1972, Report No.11, Portland, Oregon.
Strickland, R. 1976b. Sonic tracking of steelhead in the Rocky Reach Reservoir, 1967.U.S. Army Corps of Engineers, North Pacific Division, Fourth Progress Report onFisheries Engineering Research Program 1966-1972, Report No.12, Portland,
Oregon.
Talbot. G.B. 1950. A biological study of the effectiveness of the Hell's Gate fishways.International Pacific Salmon Fisheries Commission Bulletin No.3.
Tal bot, G.B. 1953. Passage of shad at the Bonneville fishways. U.S. Fish and WildlifeService, Special Scientific Report: Fisheries No.94, Washington D.C.
Thompson, C.S. 1970. Effect of flow on performance and behavior of chinook salmon infishways. U.S. Fish and Wildlife Service, Special Scientific Report: Fisheries No.601 1Washington D.C.
Thompson, C.S. 1976. Evaluation of the adult salmonid trap installed in the BradfordIsland "A" branch fish ladder, Bonneville Dam, 1975. National Marine FisheriesService, Northwest and Alaska Fisheries Center, Final Report, Seattle.
Thompson, C.S. 1979. Evaluation of the adult salmonid trap installed in the BradfordIsland "A" branch fish ladder, Bonneville Dam. U.S. Army Corps of Engineers, NorthPacific Division, Pages 187-192 in. Fifth Progress Report on Fisheries EngineeringResearch Program 1973-1978, Portland, Oregon.
Thompson, C.S., and C.R. Weaver. 1968. Research on fishway problems at theFisheries-Engineering Research Laboratory at Bonneville Dam. U.S. Fish and WildlifeService, Progress Report No.150, Seattle.
Trefethen, P .S. 1955. Observations on the vertical and horizontal distribution of adult fishin the navigation channel below Bonneville Dam. U.S. Fish and Wildlife Service,Pacific Salmon Investigations, Technical Progress Report No.9, Seattle. -
Trefethen, P .S. 1968. Passage of migrant fish at dams. U.S. Bureau of Commercial
Fisheries, Fish-Passage Research, Review of Progress, 1961-1966, Circular 254:1-
14, Seattle.
u.s. Army Corps of Engineers. 1953. Annual report of passage of fish over BonnevilleDam, Columbia River, Oregon and Washington. U.S. Army Corps of Engineers,Portland and Walla Walla Districts, Portland, Oregon.
78
u.s. Army Corps of Engineers. 1954-1956. Annual report of passage of fish overBonneville and McNary dams, Columbia River, Oregon and Washington. U.S. ArmyCorps of Engineers, Portland and Walla Walla Districts, Portland, Oregon.
u.s. Army Corps of Engineers. 1956. Fishway attraction water supply study. U.S. ArmyCorps of Engineers, North Pacific Division, Progress Report on the FisheriesEngineering Research Program, Portland, Oregon.
u.s. Army Corps of Engineers. 1957-1961. Annual fish passage repQrt, Bonneville, TheDalles and McNary dams, Columbia River, Oregon and Washington. U.S. ArmyCorps of Engineers, Portland and Walla Walla Districts, Portland, Oregon.
u.s. Army Corps of Engineers. 1960a. Fishway attraction water supply study. U.S. ArmyCorps of Engineers, Portland District, Fisheries Engineering Research Program,
Progress Report, Portland, Oregon.
u.s. Army Corps of Engineers. 1960b. Submerged orifice research powerhouse fishcollection system, Bonneville Dam. U.S. Army Corps of Engineers, Portland District,Pages 131-135 in. Fisheries Engineering Research Program, Progress Report,
Portland, Oregon.
u.s. Army Corps of Engineers. 1961. Operational studies of fish passage facilities atMcNary Dam. U.S. Army Corps of Engineers, Walla Walla, Washington.
u.s. Army Corps of Engineers. 1979. Bonneville 1 st powerhouse adult fish collectionsystem studies (1976-1978). U.S. Army Corps of Engineers, North Pacific Division,Pages 199-208 in Fifth Progress Report on the Fisheries Engineering Research
Program, Portland, Oregon.
u.s. Army Corps of Engineers. 1979. Studies on adult fish passage over "A" branch ofBradford Island fishway at Boneville Dam (1974-1975). U.S. Army Corps ofEngineers, North Pacific Division, Pages 193-198 in Fifth Progress Report onFisheries Engineering Research Program 1973-1978, Portland, Oregon.
u.s. Army Corps of Engineers. 1988. Hydrolic evaluation of adult fish passage facilities atUttle Goose. Lower Monumental, and McNary (south shore) dams. U.S. Army Corpsof Engineers. Walla Walla District. Walla Walla. Washington.
u.s. Fish and Wildlife Service. 1960. Research on fishway problems-. U.S. Fish andWildlife Service, Bureau of Commercial Fisheries, Fisheries Engineering ResearchProgram, Seattle.
Von Gunten, G.H., J.B. Cooke, O.L. Hooper, G.P. Palo, M.G. Salzman, and L.G. Puis.1960. Annotated bibliography on fish passing facilities. American Society of Civil
Engineers.
79
Wagner, E., and P. Ingram. 1973. Evaluation of fish passage facilities at Foster andGreen Peter dams on the South Santiam drainage. Fish Commission of Oregon,Portland.
Ward, H.B. 1920. Some features in migration of the sockeye salmon and their practicalsignificance. Transactions of the American Fisheries Society 50:387-426.
Ward. H.B. 1927. .The influence of a power dam in modifying conditions affecting the
migration of the salmon. Proceedings of the National Academy of Sciences 13:827-
833.
Ward, H.B. 1928. Further studies on the influence of a power dam in modifying conditions
affecting the migration of the salmon. National Academy of Sciences 15(1):56-62.
Weaver, C.R., C.S. Thompson, and E. Slatick. 1976. Fish passage research at theFisheries-Engineering Research Laboratory, May 1965 to September 1970. U.S.Army Corps of Engineers, North Pacific Division, Fourth Progress Report on FisheriesEngineering Research Program 1966-1972, Report No.32, Portland, Oregon.
Weber, W.G., and J.D. Fortune. 1974. Siletz River summer steel head study-anadromousfish program. Oregon Wildlife Commission, No. PL89-304, Portland.
Weiss, E. 1976. A tagging study to investigating the unexplained loss of spring andsummer chinook salmon migrating past Bonneville and The Dalles d~ms. U.S. ArmyCorps of Engineers, North Pacific Division, Fourth Progress Report on FisheriesEngineering Research Program 1966-1972, Report No.7, Portland, Oregon.
Williams. J.G. 1989. Snake River spring and chinook salmon: can they be saved?Regulated Rivers; Research and Management 4(1):17-26.
Winston, A.J., A.S. Gee, and p .V. Varallo. 1985. The assessment of flow characteristics
at certain weirs in relation to the upstream movement of migratory salmonids. Journal
of Fisheries Biology 27(suppl. A):75-83.
80