Embed Size (px)
Citation preview
Salinity & Temperature
Data assimilation
N. HOAREAU (ICM, SMOS-BEC)
M. UMBERT (ICM)
S. KALARONI (ICM, SMOS-BEC)
J. BALLABRERA (UTM, SMOS-BEC)
2010/12/15
SUMMARY
• 1. Region of interest
• 2. NEMO-OPA
• 3. ARGO data
• 4. NUDGING, results …
• 5. Perspectives…
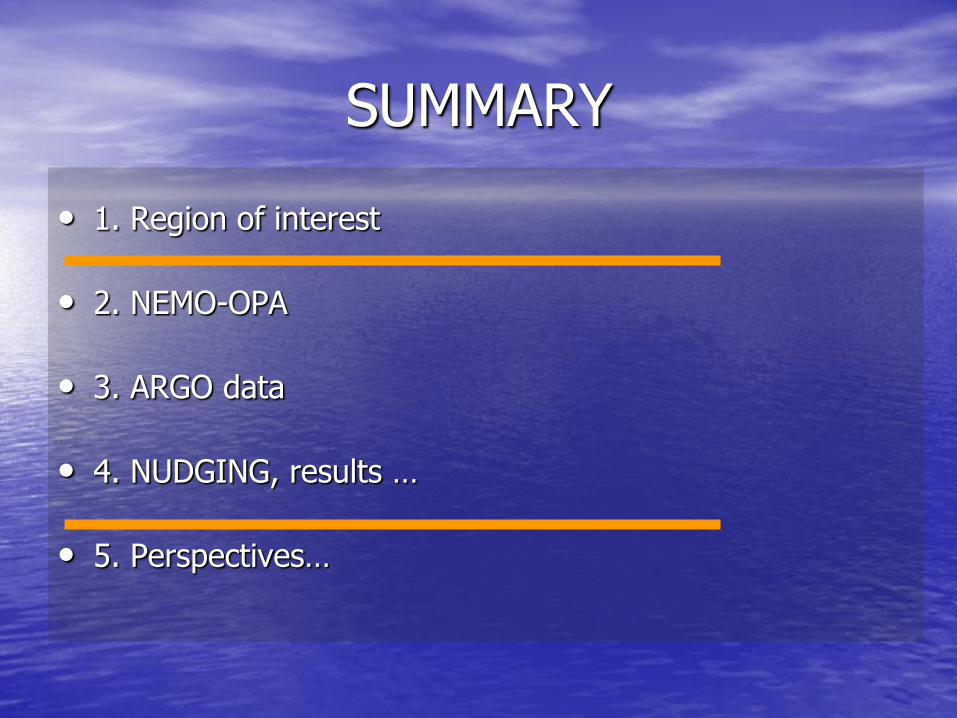
1. Region of interest
A region of validation for SMOS data …
45W 2ºW
44ºN
15ºN
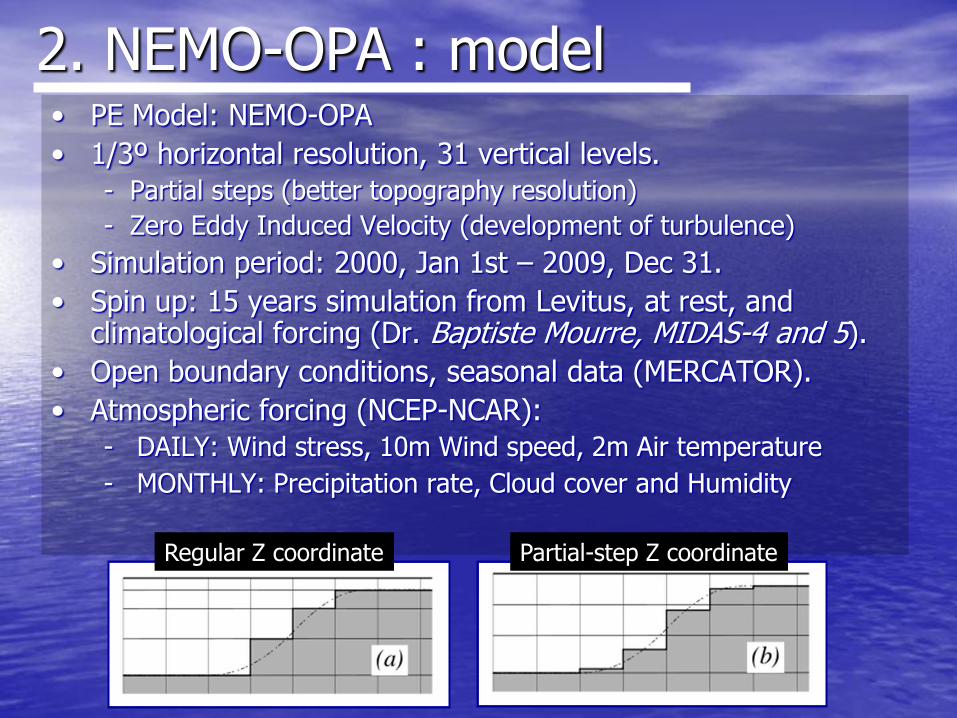
• PE Model: NEMO-OPA
• 1/3º horizontal resolution, 31 vertical levels.
- Partial steps (better topography resolution)
- Zero Eddy Induced Velocity (development of turbulence)
• Simulation period: 2000, Jan 1st – 2009, Dec 31.
• Spin up: 15 years simulation from Levitus, at rest, and climatological forcing (Dr. Baptiste Mourre, MIDAS-4 and 5).
• Open boundary conditions, seasonal data (MERCATOR).
• Atmospheric forcing (NCEP-NCAR):
- DAILY: Wind stress, 10m Wind speed, 2m Air temperature
- MONTHLY: Precipitation rate, Cloud cover and Humidity
2. NEMO-OPA : model
Regular Z coordinate Partial-step Z coordinate
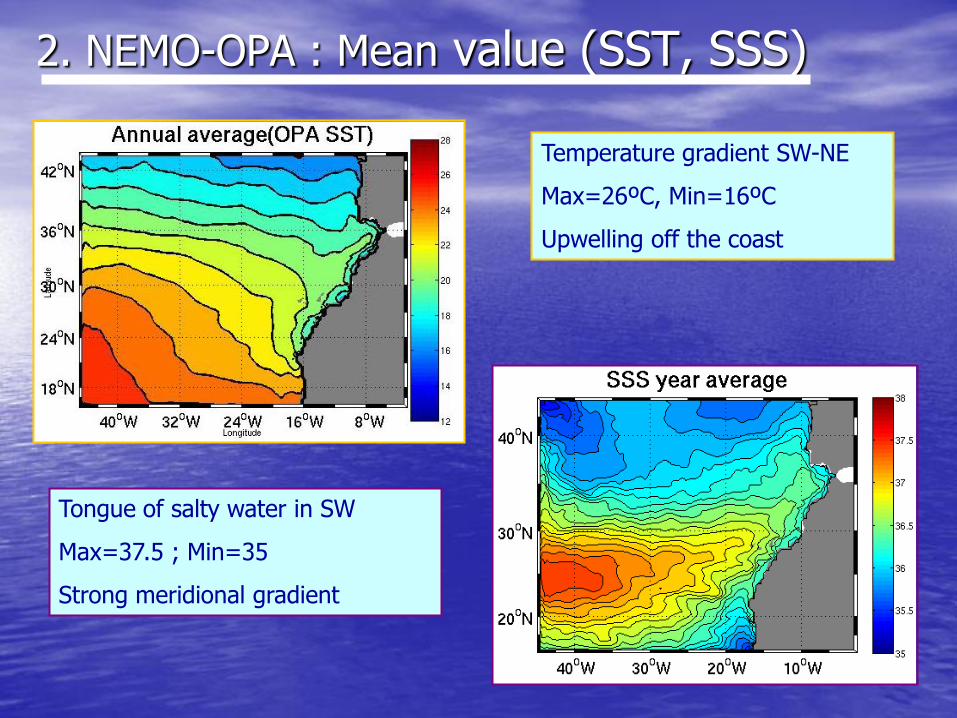
2. NEMO-OPA : Mean value (SST, SSS)
Temperature gradient SW-NE
Max=26ºC, Min=16ºC
Upwelling off the coast
Tongue of salty water in SW
Max=37.5 ; Min=35
Strong meridional gradient
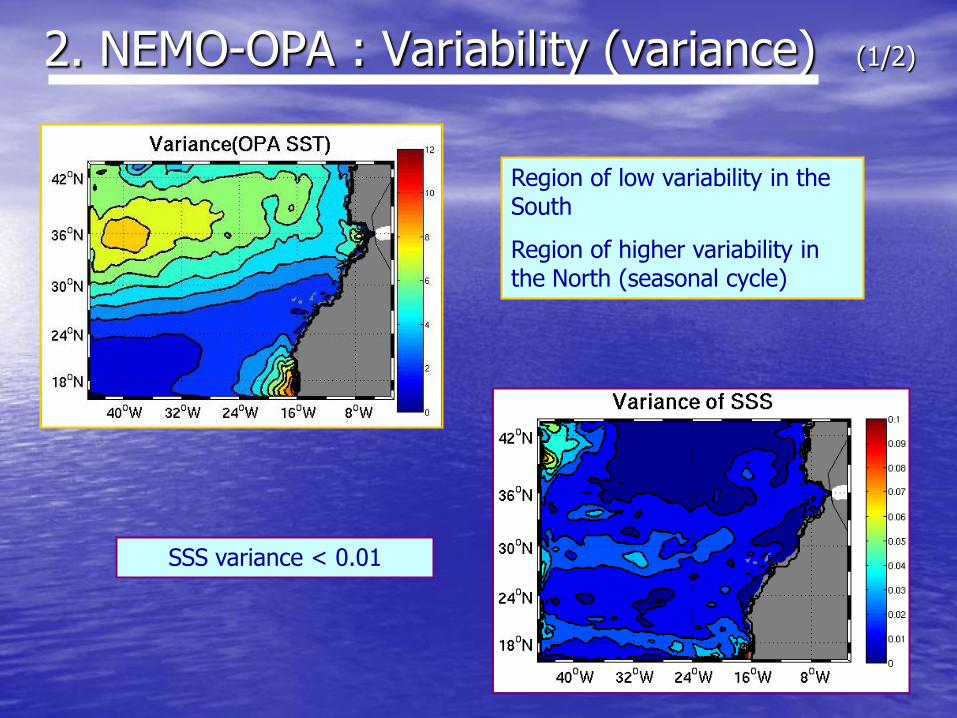
2. NEMO-OPA : Variability (variance) (1/2)
Region of low variability in the South
Region of higher variability in the North (seasonal cycle)
SSS variance < 0.01
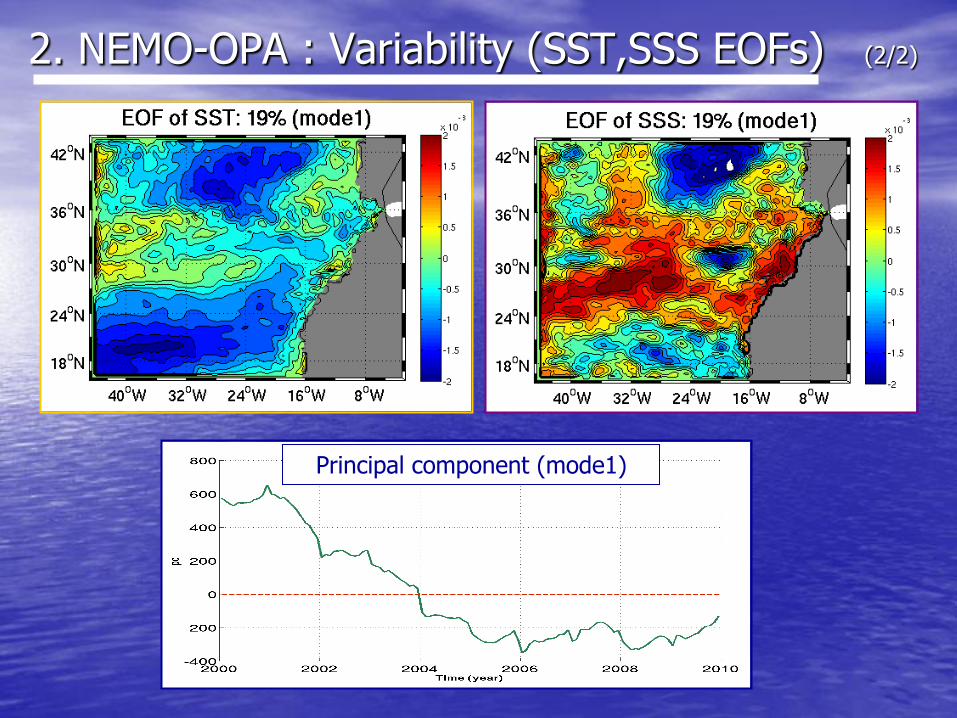
2. NEMO-OPA : Variability (SST,SSS EOFs) (2/2)
Principal component (mode1)
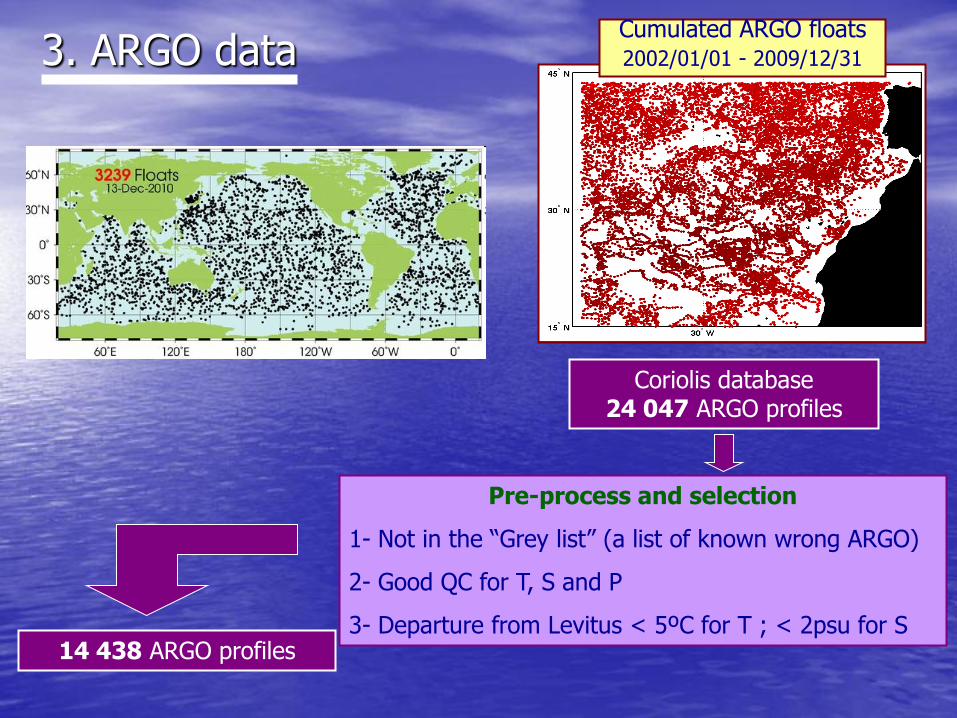
3. ARGO dataCumulated ARGO floats2002/01/01 - 2009/12/31
Coriolis database24 047 ARGO profiles
14 438 ARGO profiles
Pre-process and selection
1- Not in the “Grey list” (a list of known wrong ARGO)
2- Good QC for T, S and P
3- Departure from Levitus < 5ºC for T ; < 2psu for S
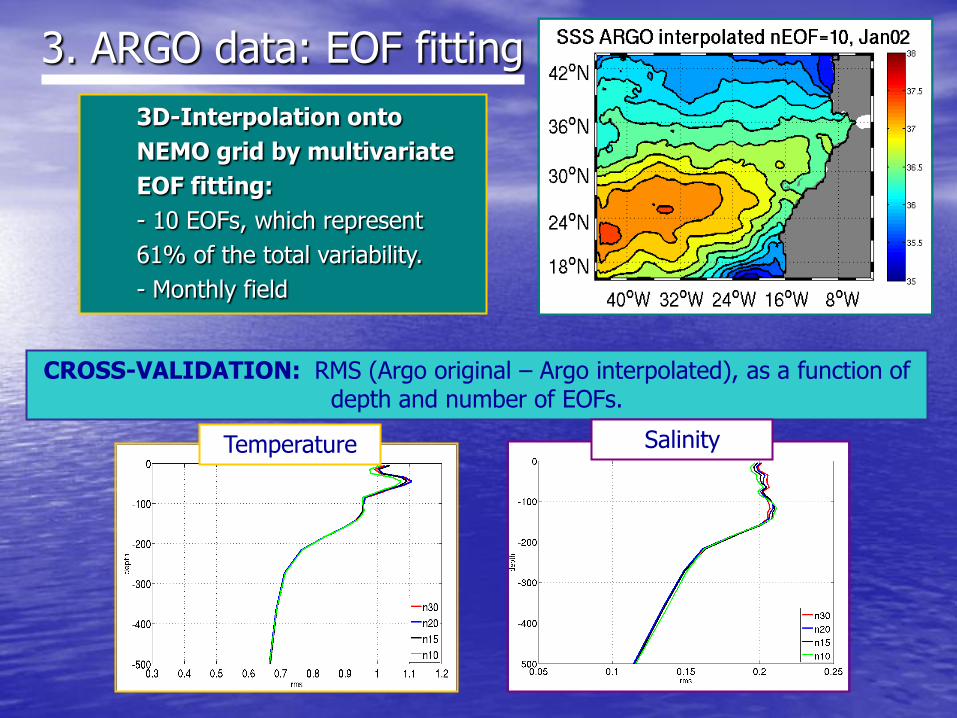
3. ARGO data: EOF fitting
3D-Interpolation onto
NEMO grid by multivariate
EOF fitting:
- 10 EOFs, which represent
61% of the total variability.
- Monthly field
CROSS-VALIDATION: RMS (Argo original – Argo interpolated), as a function of depth and number of EOFs.
Temperature Salinity
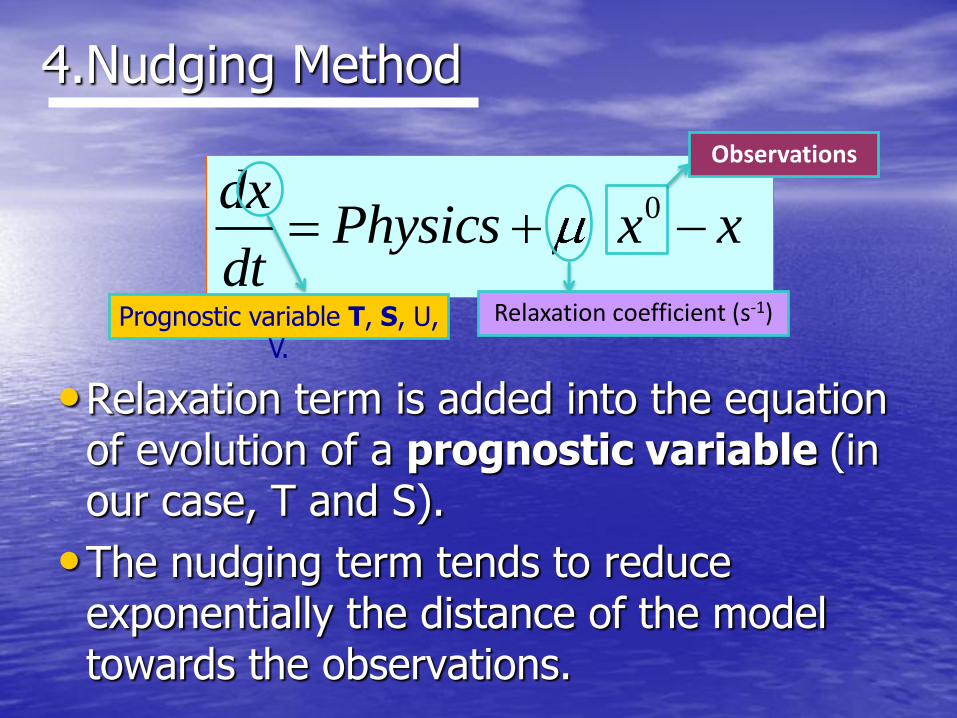
4.Nudging Method
•Relaxation term is added into the equation of evolution of a prognostic variable (in our case, T and S).
•The nudging term tends to reduce exponentially the distance of the model towards the observations.
0dxPhysics x x
dtRelaxation coefficient (s-1)Prognostic variable T, S, U,
V.
Observations
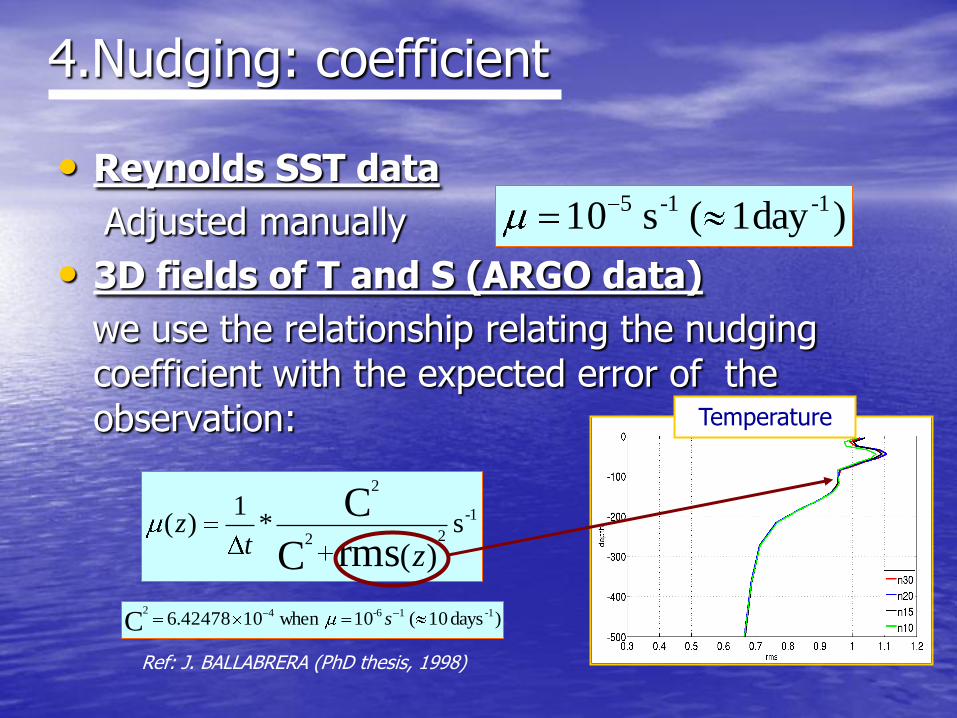
• Reynolds SST data
Adjusted manually
• 3D fields of T and S (ARGO data)
we use the relationship relating the nudging coefficient with the expected error of the observation:
1-
22
2
s *1
)(
)(rmsC
C
ztz
)days 10( 10 when 1042478.6 -11-642
C s
)1day( s 10 -1-15
4.Nudging: coefficient
Ref: J. BALLABRERA (PhD thesis, 1998)
Temperature
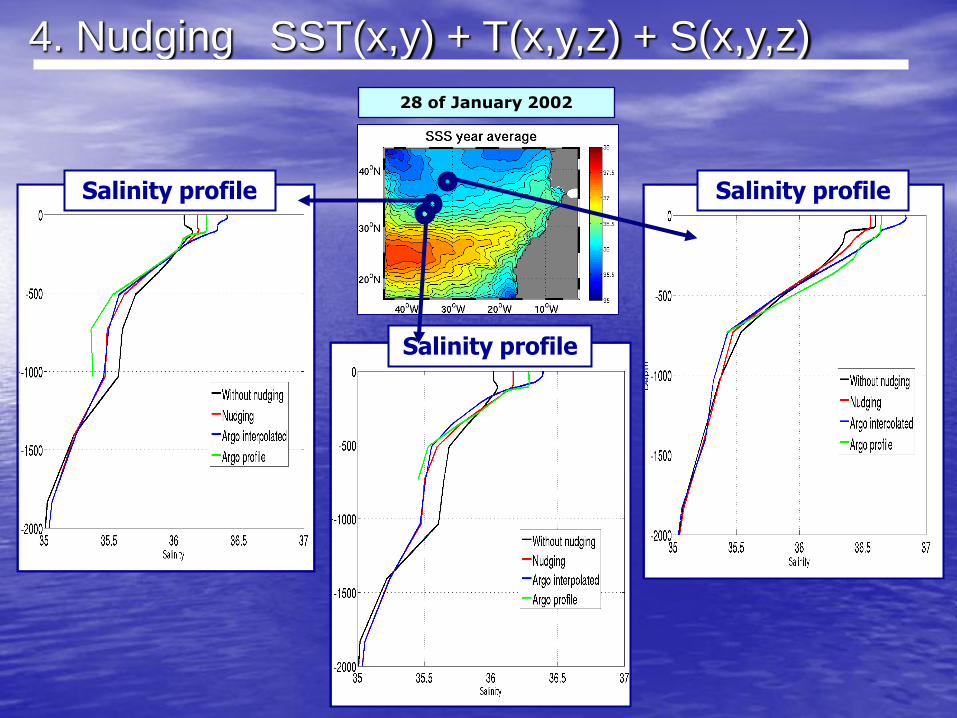
28 of January 2002
4. Nudging SST(x,y) + T(x,y,z) + S(x,y,z)
Salinity profile
Salinity profile
Salinity profile
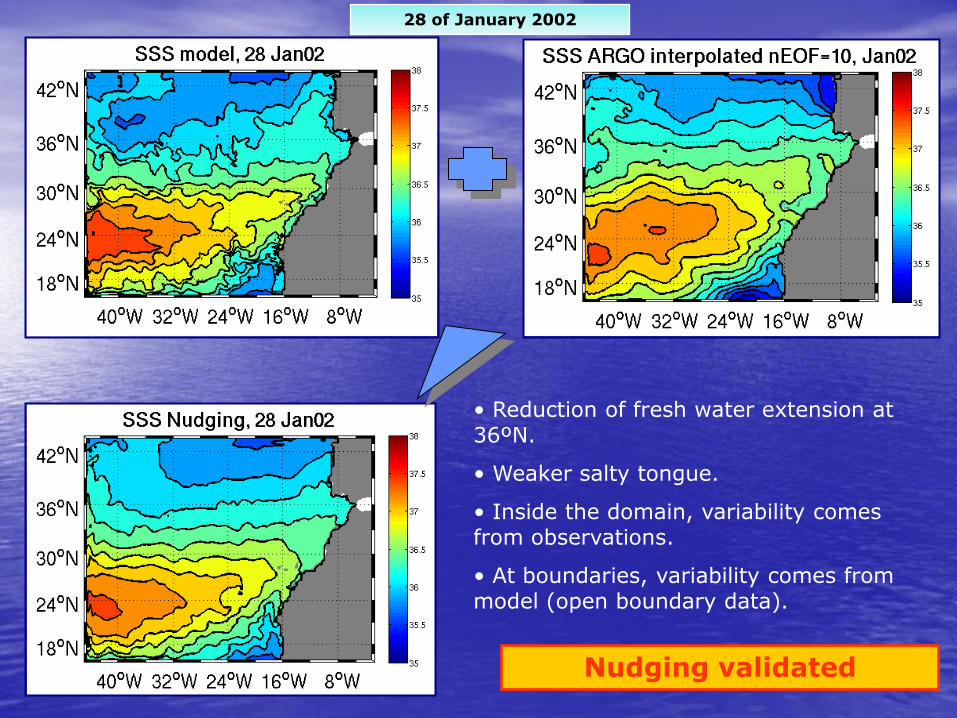
28 of January 2002
• Reduction of fresh water extension at 36ºN.
• Weaker salty tongue.
• Inside the domain, variability comes from observations.
• At boundaries, variability comes from model (open boundary data).
Nudging validated
5. Perspectives …
• Investigate added value of assimilation of SSS from:
- ARGO data (new product from OA)
- SMOS data
• Use other methods of data assimilation,
as the Ensemble Kalman Filter (EnKF)

Thank you !!!