Embed Size (px)
Citation preview
Salinity-Induced Mixed and BarrierLayers in the Southwestern TropicalAtlantic Ocean off the Northeast of BrazilM. Araújo I , c. Limongi', J. Servairr', M. Silva' and C.A.O. LentinP
I Departamento de Oceanografia, Universidade Federal de Pernambuco,Recife-PE, Brazil.21nstitut de Recherche pourle Développement (lRD) , UMR-182, Paris,France. Visiting Scientist at Fundação Cearense de Meteorologia eRecursos Hídricos (FUNCEME), Fortaleza, CE, Brazil..3 Departamento de Física da Terra e do Meio Ambiente, UniversidadeFederal da Bahia, Salvador-BA, Brazil.* GOAT - Grupo de Oceanografia Tropical- http://www.goat.fis.ufba.br# Corresponding to: M. Araújo ([email protected])
ABSTRACTHigh resolution hydrographic observations of temperature
and salinity were used to analyze the formation and distributionof isothermal (ZT)' mixed (ZM) and barrier (BL) layers ina section of the southwestern Atlantic (0030'N-14°00'S;31°24' -41°48 'W), adjacent to the Northeastern Braziliancoast. Analyzed data consisted of 279 CTO casts acquiredduring two cruises under the Brazilian REVIZEE Program, onein late austral winter (Ago-Oct/95) and another in australsummer Qan-Apr/97). Results indicated that the intrusion ofsubtropical Salinity Maximum Waters (SMW) brought by theSouth Equatorial Current (SEC) from the subtropical regioninto the western tropical Atlantic boundary is the major processcontributing to the seasonal BL formation. Ouring late australwinter, BL 5-90 m thick (median=15m) was observed , but BLthickness >30m was restricted to latitudes higher than 80S asa result of a combination of deep isothermal layers (~:2: 90m)and shallow mixed layers, where the latter was created by the
117
Salinity-Induced Mixed and Barrier Layers in the Sauthwestern Tropical Atlantic Ocean af( theNartheast af Brazil
intrusion of salty waters between 8-12.3°S. During australsummer, shallow isotherrnal and mixed layers prevailed and theBL formation was clearly driven by establishing a salt-inducedpycnocline inside an isotherrnal layer, Observed BLT was lessvariable (5-70m) and thicker (median=35 m). BLT2':30m wasobserved not only in the southernmost part of the study area,as verified during late winter, but in the latitude range 2°S-14°S,where near surface salty waters were transported westward bythe SEC flow.
INTRODUCTIONThe southwestern tropical Atlantic Ocean is an area of prime
importance to global climate change where oceanic signals fromintra-seasonal to decadal scales must pass through (Dengler etal., 2004; Schott et al., 2005). Moreover, this region is subjectedto cyclonic and anticyclonic gyres strongly controlled by surfacewinds (Stramma and Schott, 1999; Lumpkin and Garzoli, 2005).These gyres drive the divergence of the southern pathway ofthe South Equatorial Current (sSEC) (Rodrigues et al., 2007)that is partially at the birth site of several current systems thatflows along the Brazilian coastline. The northern branch of thesSEC terrnination flows northward forming the North BrazilianCurrent-North Brazilian Under Current (NBC/NBUC) system.This powerful western boundary current contributes by feedingof the northward Guyana Current (Bourles et al., 1999; Strammaet al., 2005) and the eastward North Equatorial Counter Current(NECC), as well as its associated complex retroflection system(Goes et al., 2005) and the eastward Equatorial Under Current(EUC). It is believed that NBC accounts for approximatelyone-third of the net warrn-water flow transported across theequatorial tropical gyre boundary into the North Atlantic,compensating for the southward export of Nort h Atlantic DeepWater (NADW) (Dengler et al., 2004; Schott et al., 2005). Thesouthern branch of sSEC forms the Brazíl Current (BC) that
118

M. Araujo, C. Limongi,j. Servain, M. Silva and C.AD. Lentini
flows poleward along th e Brazilian coast .Offshore, the upper ocean density stratification is primarily
controlled by temperature variations in the thermocline region.However, there is some evidenc e that salinity variations canregulate the mixed layer depth (e.g., Sprintall and Tomczak,1992). This is the case for the western equatorial Pacific wheresalinity controls the surface stratification, which defines thebase ofthe mixed layer (e.g., Delcroix and McPhaden, 2002).
The occurrence of isohaline layer shallower than theisothermal layer in the tropical ocean has been studied sincethe Meteor research cruises in 1936 (Defant, 1961). Thebarrier layer (BL), which is a layer between the halocline andthe thermocline (Lukas and Lindstr ôrn, 1991), may isolate theupper isohaline layer from the cold thermocline waters, affect ingthe ocean heat budget and its exchanges with the atmosphere(Swenson and Hansen, 1999; Pailler et al. , 1999). When BLoccurs, the energy transferred from the atmosphere to the oceanby the wind and the buoyancy forcing may be trapped into theupper mixed layer Iimited by the salinity stratification, whichis thinner and theoretically more reactive than the one definedby the temperature mixed layer (Vialard and Delecluse, 1998;Montégut et al., 2007).
A number of studies on BL and related physical mechanismshave focu sed in the western equatorial Pacific. According to thetheory, heavy precipitation in the western portion of an oceanbasin was initially taken as the main mechanism accountingfor BL formation (e.g., Sprintall and Tomczak, 1992; Andoand McPhaden, 1997). Recent works show that the thickclimatologically important BL in the western Pacific is due to theeastward fresh jets flowing over subducted salty waters (Vialardand Delecluse, 1998). Cronin and McPhaden (2002) analyzedBL responses to westerly wind gusts over the tropical AtmosphereOcean (TAO) array in th e equatorial Pacific and discu ssed themain mechanisms by which BL may form and spread. General
119
Salinity-Induced Mixedand Barrier Layers in tne Southwestern Tropical AtlanticOceanofftheNortneast ofBrazil
charts of the seasonal variability of BL thickness in tropicaloceans were obtained using Levitus climatological data (Levitus ,1982) to determine the extent of the influence of salinity in thedepth of the mixed layer (Sprintall and Tornczak, 1992).
Montégut et al. (2007) and Mignot et al. (2007) usedinstantaneous T/S profiles, including Argo data, to constructglobal ocean climatology of monthly mean properties of theBL phenomenon. These charts suggest that subduction ofsubtropical salty surface waters toward the equator duringwinter and their advection by the equatorial current systemmight be the mechanism that forms the BL in the westerntropical Atlantic. This hypothesis is partially supported by thepresence of subsurface Salinity Maximum Waters (SMW) alongthe western Atlantic boundary (Pailler et al, 1999; Strammaet al., 2005; Silva et al., 2005). These authors argued that thissalty water, which is formed in the South Atlantic subtropicalgyre, is entrained into the region within the NBve that flowsnorthwestward along the Brazilian continental slope.
The presence and the formation of salinity-induced barrierlayers at the southwestern boundary of the tropical Atlantic isinvestigated here based on the analysis of 279 high resolutioneTD vertical profiles obtained under the Brazilian REVIZEEProgramo Although differences between the isohaline andisothermal depths have been reported in the literature for otherwestern equatorial ocean basins (e.g., Sprintall and Tornczak,1992; Delcroix and McPhaden, 2002), little has been done toidentify the existence of barrier layers in the western tropicalAtlantic where this discrepancy may also existo Therefore,the aim of this paper is to map the large-scale distribution ofthese differences in the southwestern tropical Atlantic off theNortheast of Brazil. In this way, this paper is outlined as follows.Data and methods are delineated in Section 2 where the areaof study is presented and the criteria used for determining theísotherrnal, mixed and barrier layers are described. Results are
120

M. Araujo, C. Limongi,j. Servain. M. Silva and C.AD. Lentini
presented in Section 3 followed by summary and conclusions inSection 4.
DATA AND METHODOLOGY
Study Area and Data Collection
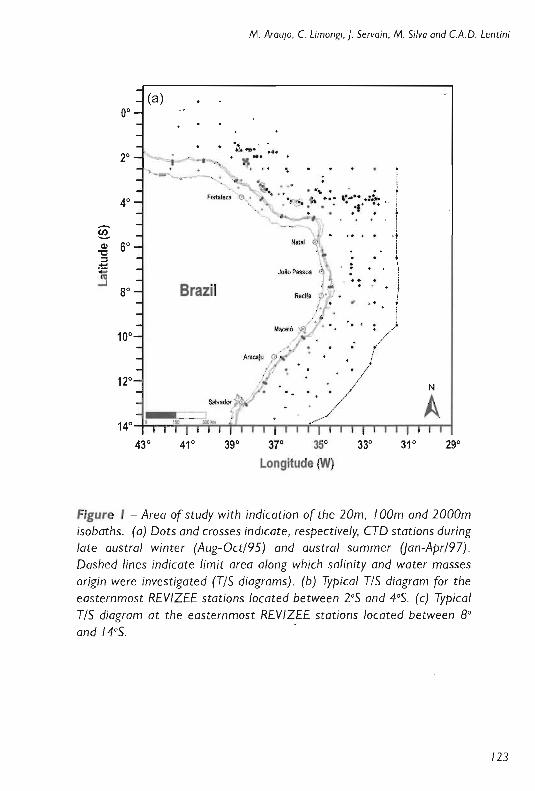
The area of study comprised a section of the western tropicalAtlantic (0°30 ' N-14°00 ' S; 31°24 '-41°48 ' W ), adjacent to theBrazilian NE coast (Figure la) . Hydrographic data were collectedonboard the R/V Antares under the REVIZEE Program (BrazilianProgram for Assessing the Sustainable Potential of the LiveResources of the Exclusive Economic Zone). The dataset for thiswork comprised 279 continuous CTO casts, 146 obtained duringthe late austral winter, (2 Aug. 1995-26 Oct. 1995) and the 133during the austral summer (20 ]an. 1997-17 Apr. 1997).
Criteria for Determining Isothermal, Mixed andBarrier Layers
The cri teria used for determining isothermal and mixedlayers in the ocean requires the deviation of temperature T (ordensity, c.) from its surface value to be smaller then a certainfixed value T value (or density) (Brainerd and Gregg, 1995).Normally considered surface values for evaluating ZTvaries from0.5°e (Monterrey and Levitus, 1997) to 0.8°( (Kara et al., 2000)depending on the used criteria. ZMis estimated as the depthwhere density is equal to its sea surface value plus an incrementÔS t equivalent to a desired net decrease in temperature. Spall(1991), e.g., uses i1CJ
t= O.125CJ
t(O) for determining the mixed
layer depth, while Sprintall and Tomczak (1992) and Ohlmannet al. (1996) adopt Ao, = O.5°C(ocr t /én), where ocr t /oT isthe coefficient of thermal expansion.
The criteria used here is the same defined by Sprintall and
121
Sa/inity-Induced Mixed and Barrier Layers in the Southwestern Tropical Atlant;c Ocean off theNortheast of Brazil
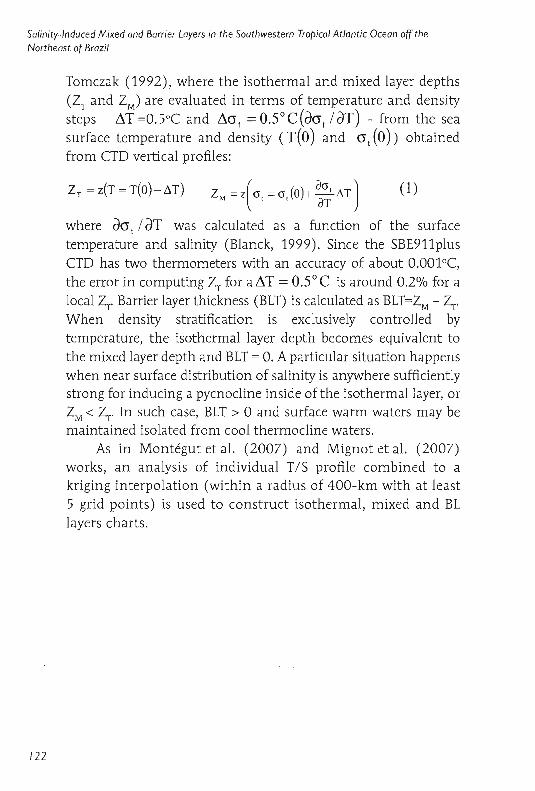
Tomczak (1992), where the isothermal and mixed layer depths(ZTand ZM) are evaluated in terms of temperature and densitysteps - ~T=0.5°C and ~at =O.5°e(dat /dT) - fram the seasurface temperature and density (T(O) and aJO)) obtainedfram CTO vertical prafiles:
Zr=z{T=T{O)-LlT) ZM=Z(01=0I(O)+~~LlT) (1)
where da t / ar was calculated as a function of the surfacetemperature and salinity (Blanck, 1999). Since the 5BE911plusCTO has two thermometers with an accuracy of about O.OOl°C,the errar in computing Z, for a~T =O.5°e is araund 0.2% for alocal Z, Barrier layer thickness (BLT) is calculated as BLT=ZM- ~.
When density stratification is exclusively contralled bytemperature, the isothermal layer depth becomes equivalent tothe mixed layer depth and BLT = O. A particular situation happenswhen near surface distribution of salinity is anywhere sufficientlystrang for inducing a pycnocl ine inside of the isothermallayer, arZM< ~. In such case, BLI > O and surface warm waters ma y bemaintained isolated fram coaI thermocline waters.
As in Montégut et a!. (2007) and Mignot et a!. (2007)works, an analysis of individual T/5 prafile combined to akriging interpolation (within a radius of 400-km with at least5 grid points) is used to construct isothermal , mixed and BLlayers charts.
122
M. Araujo, C. Limongi,J. Servain . M. Silva and C.AD. Lentini
(a)0°
.,...:.~. ...
2° - I ~ . ".":'~...-- ..-.- - ....... ..
~ !." , i.... , ,.i-" ... .. .. • r,\ ·4°
Fortaleza ('l ." ", ...~ 'f!' .. ... 'r··+·:~~ " i· . , ..',' · · • t, , . . • I
0: \ ~ · .. · -,C1l 6°
Natal i-C 'i1-=' \- ~:;::; João Pessoa«I j .·. · I...J
Brazil Recife J.",.. .8° fír , .. ,
" . :)I •,." · .10°
Macel6 ~./ • • •
.--/ 0 , :- : ~ . fAracaju 9> '. )
~ ·12° .-- /
J. · ./· /
14° • ,//
43° 41° 39° 37° 35° 33° 31° 29°Longitude (W)
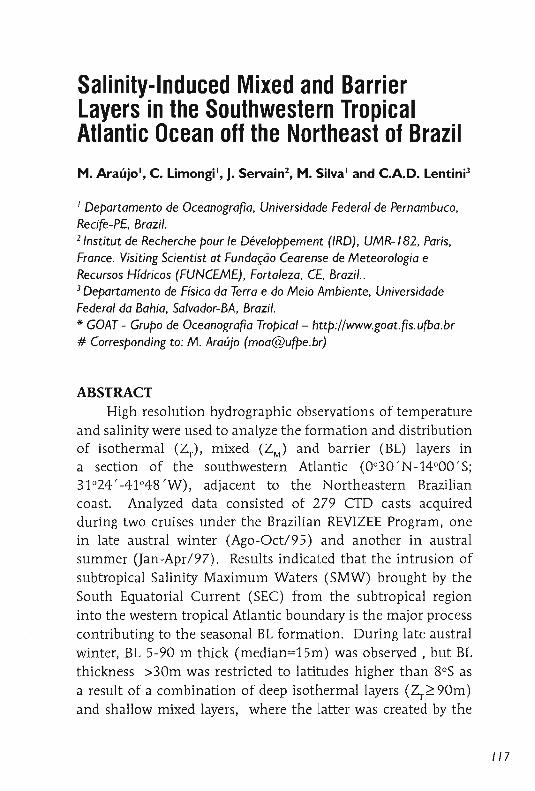
Figure , - Area of study with indication of the 20m, 100m and 2000misobaths. (a) Dots and crosses indicate. respectively. CTO stations duringlate austral winter (Aug-Oct/95) and austral summer Uan-AprI97) .Oashed lines indicate limit area along which salinity and water massesorigin were investigated (TIS diagrams) . (b) Typical TIS diagram for the
eastemmost REVIZEE stations located between 2°5 and 4°5. (c) Typical
TIS diagram at the eas temmost REVIZEE stations located be tween 8°and 14°5. .
123

Sa/inity-InducedMixed and Barrier Layers in the Southwestern Tropical Atlantic Ocean of( theNortheast ofBrazil
25 .5'
.28.5
.-
,/.'
/
......
/',/~ 26.75 ,// ....
5.0
30.0 -----------o~---=~-~___=_---~-_,
23.5»>
es~ 15.0 . r 25.5'Q.
E~ ."
10.0 . 26.25~ .....
(b)
25.0 .22.5-
Õ 20.0a,
27.5/ /
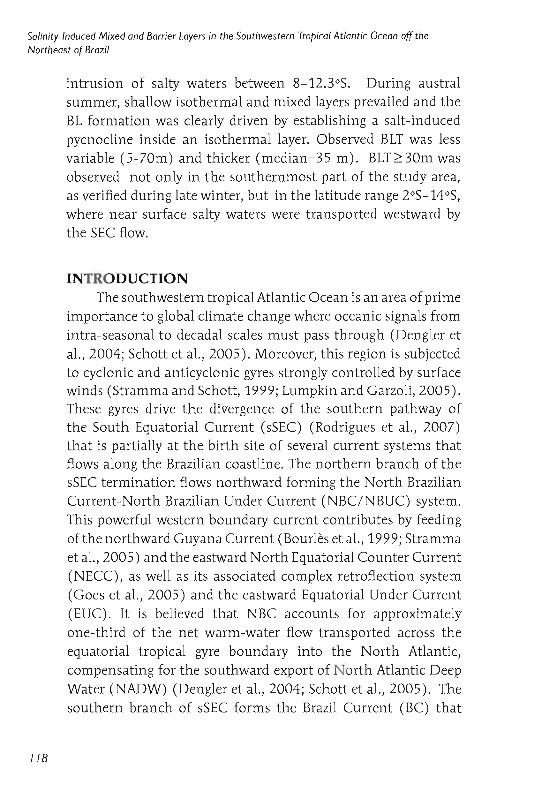
33.5 34.0 34.5 35.0 35.5 36.0 365 37.0 37.5 38.0 38.5Salinity(psu)
Figure I - (cont.)
35.0 35.5 36.0 36.5 37.0 37.5 38.0 38.5Sallnity(pau)
30.0(e)
25.0
~ 20.0
e.af! 15.04>Q.
E~
10.0
5.0
/27.5i
33.5 34.0 34.5
Figure I - (cont.}
//
/
"/
4.5
124
M. Araujo, C. limong), j. Servem, M. Silva and C.A.D. Lentini
2412500 +----==;= = =;== = =;== = :;:== ==;= = =1
14
(8)450
Vertical distribution ofsalinity (Late Winter)
G~ ad
400
350
150
100
50
_ 200.soS 250CoQI
C 300
10 8 6Latitude (5)
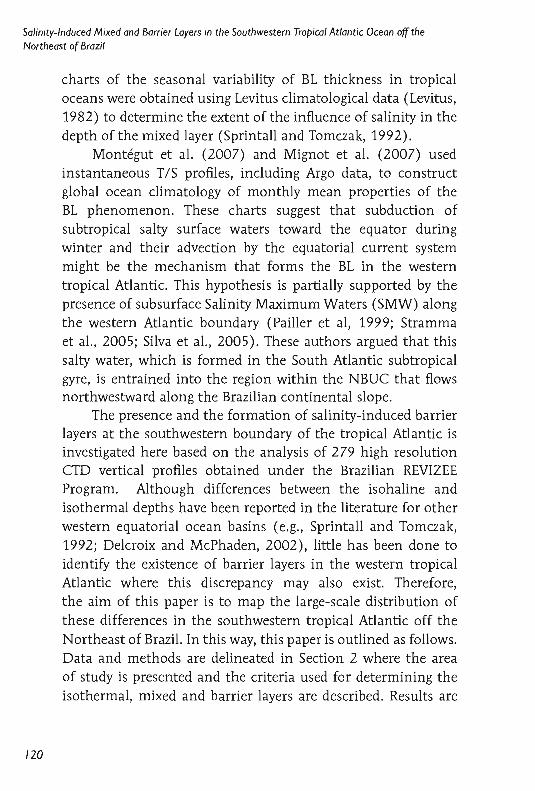
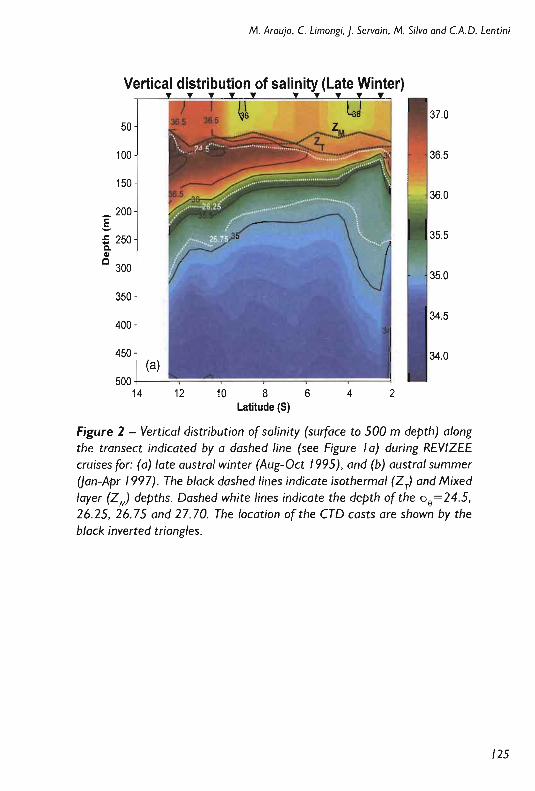
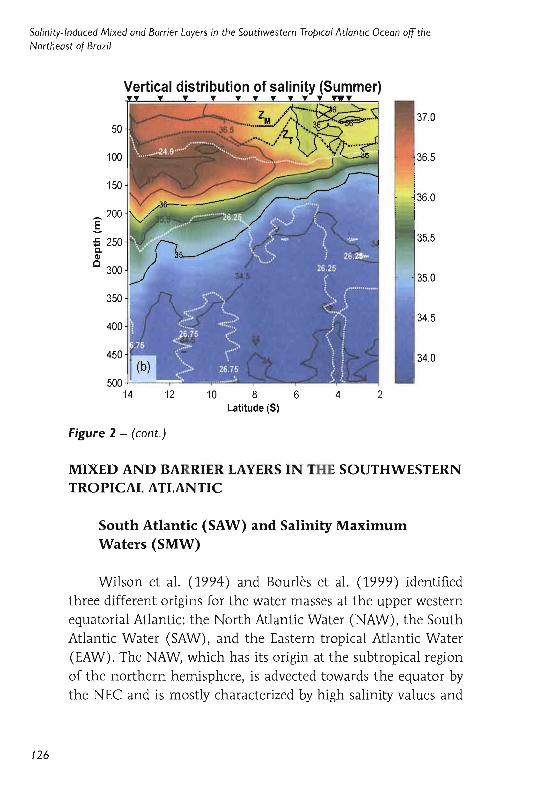
Figure 2 - Vertical distribution of salinity (surface to 500 m depth) alongthe transect indicated by a dashed /ine (see Figure Ia) during REVIZEEcruises for: (a) late austral winter (Aug-Oct 1995) , ond (b) austral summerUan-Apr 1997). The black dashed /ines indicate isothermal (Zr) and Mixedlayer (ZJ depths. Dashed white /ines indicate the depth ofthe Ge= 24.5,26 .25,26.75 and 27 .70. The location ofthe CTD casts are shown by theblack inverted triangles .
125
Salinity-Induced Mixed and Barrier Layers in the Southwestern TropicalAtlantic Ocean off theNortheast of Brazil
Vertical distribution ofsalinity (Summer)
36.5
36.0
37.0
2410 8 6Latitude (5)
12
50
450
500 +--- -'-,-14
100
150
400
Figure 2 - (cont.)
MIXED AND BARRIER LAYERS IN THE SOUTHWESTERNTROPICAL ATLANTIC
South Atlantíc (SAW) and Salinity MaximumWaters (SMW)
Wilson et a!. (1994) and Bourles et a!. (1999) identifi edthree different origins for the water masses at the upper westernequatorial Atlantic : the North Atlantic Water (NAW), the SouthAtlantic Water (SAW), and the Eastern tropical Atlantic Wat er(EAW). The NAW, which has its origin at the subtropical regionof the northern hemisphere, is advected towards the equator bythe NEC and is mostly characterized by high salinity values and
126
M. Araujo. C. Limongi.j. Servain. M. Silva and C.A.D. Lentini
low 02 concentrations below the thermocline. The 5AW, whichexhibits high salinity values above the thermocline and lowsalinity values and high oxygen concentrations below it relativeto the NAW, is advected to the study region through subductionprocesses from subtropical areas by the southern branch of the5EC.The EAWreaches the area of interest via the southern edge ofthe NEC and the central and northern branches of the 5EC. ThisEAWis characterized by the lowest concentrations of oxygen andsalinity around the thermocline when compared to the 5AW.
The origin of the waters masses entering the area of studyis identified using T/5 diagrams of the easternmost boundary ofthe hydrographic stations (Figure la). Particular attention isgiven to those areas where 5MW cores are observed between the24.5 and 26.25 isopycnals. Three distinct signatures are found inlate winter and summer seasons: (i) EAWat 20-405 (Figure 1b);(ii) EAW-5AW transitional zone at 40-805 (not shown here);and (iii) 5AW for latitudes higher than 805 (Figure 1c).
Vertical sections of salinity along this boundary (Figures 2a,b) indicate a salinity maximum around 120m deep, a signatureof subtropical underwaters that may be due to the presence of5AW. Saliníty maximum cores vary seasonally around the 24.5isopycnal. In late austral winter of 1995 a maximum salinitycore C~36.5) is observed at the thermocline levei (Figure 2a)between the latitudes of 6° and12.3°5, and around 10°5 at thesurface. In austral summer of 1997, a shallow core of maximumsalinity (:~36. 5) is found at the 7°-14°5 latitude range, whichis combined with persistent high salinity values (:~36.0) inupper ocean layer (down to 80m depth) at 2°-10°5 (Figure 2b).Excepting for a single surface point around 4°5, low latitude (S;6°5) salty surface waters is not observed in 1995 late winter.
Salinity cores observed to the south of 6°5 (Figures 2a,b)can only be due to the signature of the 5EC penetrating into theregion from the south and transporting westward 5AW formedin the South Atlantic subtropical gyre (Bourles et al., 1999;Rodrigues et al., 2007).
/27
Salinily-Induced Mixed and Barrier Layers in lhe Souzhwestem Tropical AlIaMicOcean off lheNonheast af Brazi!
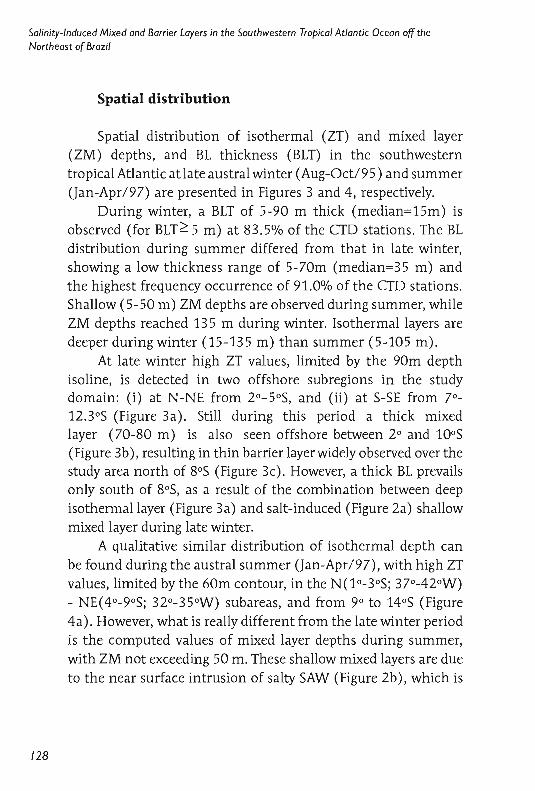
Spatial distribution
Spatial distribution of isothermal (ZT) and mixed layer(ZM) depths, and BL thickness (BLT) in the southwesterntropical Atlantic at late austral winter (Aug-Oct/95) and summer(Jan-Apr/97) are presented in Figures 3 and 4, respectively.
During winter, a BLT of 5-90 m thick (median=15m) isobserved (for BLT~ 5 m) at 83.5% of the CTD stations. The BLdistribution during summer differed from that in late winter,showing a low thickness range of 5-70m (median=35 m) andthe highest frequency occurrence of 91.0% of the CTD stations.Shallow (5- 50 m) ZM depths are observed during summer, whileZM depths reached 13 5 m during winter. Isothermal layers aredeeper during winter (15-135 m) than summer (5-105 m).
At late winter high ZT values, limited by the 90m depthisoline, is detected in two offshore subregions in the studydomain: (i) at N-NE from 2°-5 0S, and (ii) at S-SE from 7°12 .3°S (Figure 3a). Still during this period a thick mixedlayer (70-80 m) is also seen offshore between 2° and 100S
(Figure 3b), resulting in thin barrier layer widely observed over thestudy area north of 80S (Figure 3c) . However, a thick BL prevailsonly south of 80S, as a result of the combination between deepisothermallayer (Figure 3a) and salt-induced (Figure 2a) shallowmixed layer during late winter.
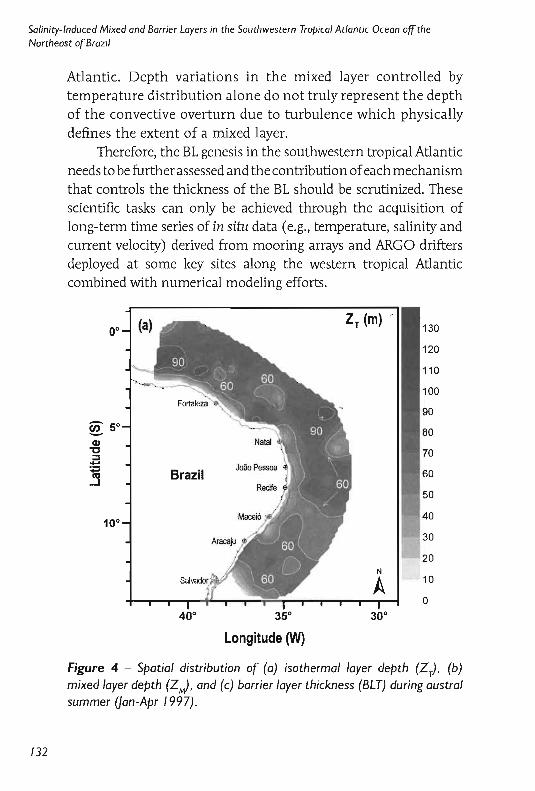
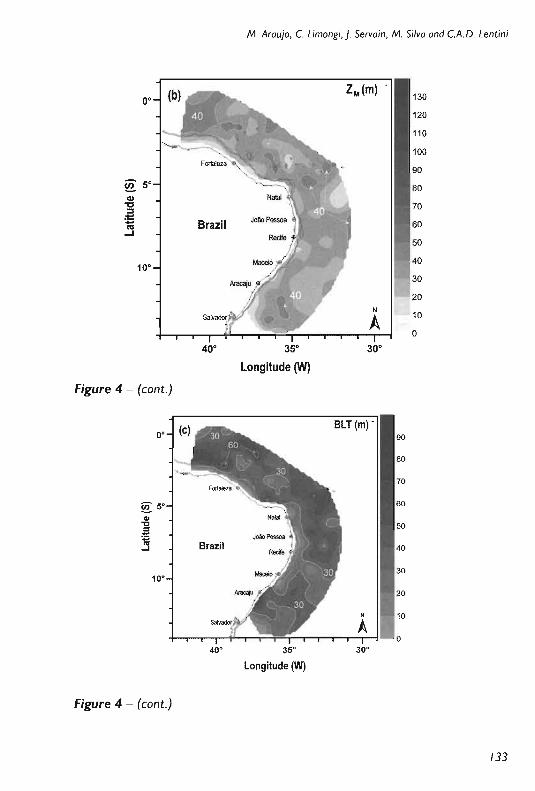
A qualitative similar distribution of isothermal depth canbe found during the austral summer (Jan-Apr/97), with high ZTvalues, limited bythe 60m contour, in the N(1°-3°S; 37°-42 °W)- NE(4°-9°S; 32°-35°W) subareas, and from 9° to 14°S (Figure4a). However, what is really different from the late winter periodis the computed values of mixed layer depths during summer,with ZM not exceeding 50 m. These shallow mixed layers are dueto the near surface intrusion of salty SAW (Figure 2b), which is
128

M. Araujo, C. Limongi,j. Servain. M. Silva and c.A. D. Lentini
transported westward from subtropical region by the intensifiedSEC flow verified during this period (Rodrigues et al., 2007).Consequently, high BL values during austral summer are notonly concentrated in the southernmost part of the study area,as observed during late winter (Figure 3c), but also present from1° tolo-S (Figure 4c).
0° (a) ZT (m) '"130
120
110
100
§: 5°CI)
"O 70~
;t:::
~ Brazil
10°30
N
A 10
o40° 35° 30°
Longitude (W)
Figure 3 - Spatial distribution of (a) isothermallayerdepth (Zr) ' (b) mixedlayerdepth (ZJ . and (c) barrier layer thickness (BLT) during late australwinter (Aug-Oct 1995).
129

Salinity-Induced Mixed and Barrier Layers in the Southwestern Tro picalAtlantic Ocean off theNortheast ofBrazil
§: 5°(l)
"O:::J;t: Brazil-lU..J
10°30
20N
A 10
O
40° 35° 30°
Longitude (W)
Figure 3 - (cont.)
0° (e) BLT(m)"90
- 80
70
§: 5· 60
Ql
" 50::J~
n; Brazil 40..J
3010'
20
N 10
Ao
40 ' 35· 30·
Longitude (W)
Figure 3 - (cont.)
130
0°
M. Araujo, C. Limongi, j. Servain, M. Silva and C.A.D. Lentini
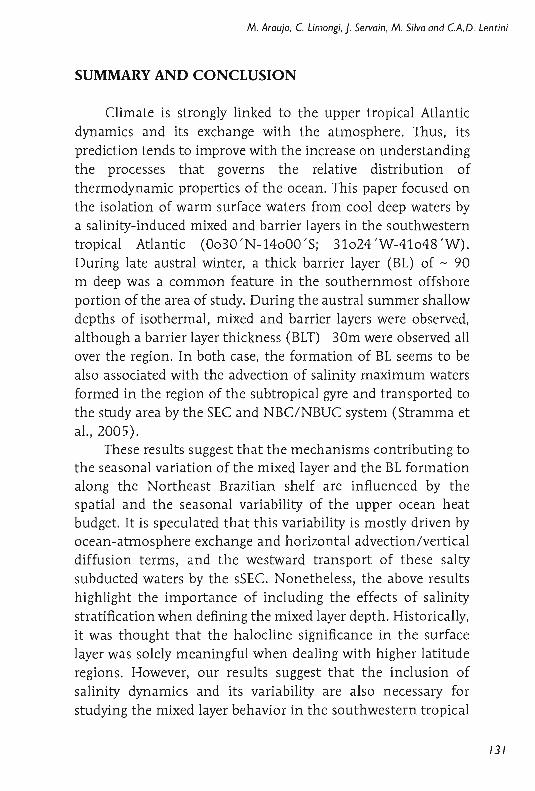
SUMMARY AND CONCLUSION
Climate is strongly linked to the upper tropical Atlanticdynamics and its exchange with the atmosphere. Thus, itsprediction tends to improve with the increase on understandingthe processes that governs the reiative distribution ofthermodynamic properties of the oceano This paper focused onthe isolation of warm surface waters from cool deep waters bya salinity-índuced mixed and barrier layers in the southwesterntropical Atlantic (0030 'N-14000 'S; 31024 ' W-41048 'W).During late austral winter, a thick barrier layer (BL) of - 90m deep was a common feature in the southernmost offshoreportion of the area of study. During the austral summer shallowdepths of isothermal, mixed and barrier layers were observed,although a barrier layer thickness (BLT) 30m were observed allover the region. In both case, the formation of BL seems to bealso associated with the advection of salinity maximum watersformed in the region of the subtropical gyre and transported tothe study area by the SEC and NBC/NBUC system (Stramma etal.,2005).
These results suggest that the mechanisms contributing tothe seasonal variation of the mixed layer and the BL formationalong the Northeast Brazilian shelf are influenced by thespatial and the seasonal variability of the upper ocean heatbudget. It is speculated that this variability is mostly driven byocean-atmosphere exchange and horizontal advection/verticaldiffusion terms, and the westward transport of these saltysubducted waters by the sSEC. Nonetheless, the above resultshighlight the importance of inc1uding the effects of salinitystratification when defining the mixed layer depth. Historically,it was thought that the haloc1ine significance in the surfacelayer was solely meaningful when dealing with higher latituderegions. However, our results suggest that the inc1usion ofsalinity dynamics and its variability are aiso necessary forstudying the mixed layer behavior in the southwestern tropical
131
Salinity-Induced Mixed and Barrier Layers in the Southwestern Tropical Atlantic Ocean offtheNortheast of Brazil
Atlantic. Depth variations in the mixed layer controlled bytemperature distribution alone do not truly represent the depthof the convective overturn due to turbulence which physicallydefines the extent of a mixed layer.
Therefore, the BL genesis in the southwestern tropical Atlanticneeds to befurther assessedand the contribution of each mechanismthat controls the thickness of the BL should be scrutinized. Thesescientific tasks can only be achieved through the acquisition oflong-term time series of in situ data (e.g., temperature, salinity andcurrent velocity) derived from mooring arrays and ARGO driftersdeployed at some key sites along the western tropical Atlanticcombined with numerical modeling efforts.
0°
10°
40° 35°
Longitude (W)
N
A30°
130
120
110
100
90
80
70
60
50
40
30
20
10
o
Figure 4 - Spatial distributian af (a) isathermal layer depth (Zr) , (b)mixed layer depth (ZJ. and (c) barrier layerthickness (BLT) during australsummer Uan-Apr 1997).
132
M. Arauja. C. Limangi,j. Servain, M. Silva and C.A .D. Lentini
0°
§: 5°CIl
"C::r-;; BrazillU-J
10-40
30
20
10
O
40° 35° 30°
Longitude (W)
Figure 4 - (cont .)
0° 90
80
70
§: 5- 50
'""'C 50::::l:=1ü....l 40
3010-
20
to
o40 - 35- 30-
Longitude (W)
Figure 4 - (cont.)
133
Salinity-Induced Mixed and Barrier Layers in the Sauthwestern Tropical Atlantic Oceanaff theNartheast ar Brazil
ACKNOWLEDGEMENTSWe thank the scientific and crew members of the R/V
Antares of the Brazilian Navy for their effort and dedicationduring the REVIZEE Programo This work was carried under theCNPq-IRD Project "Climate of the Tropical Atlantic and lmpactson the Northeast" (CATIN), CNPq Process 492690/2004-9. Thelast author would like to thank the Brazilian National Councilof Scientific and Technological Development under the scope ofProject BACANA (grant 47839812006-9). Our thanks to F. S.Leite for her help on manuscript edition.
REfERENCESAndo, K, and McPhaden, M. J.: Variability of surface layer
hydrography in the tropical Pacific Ocean, ]. Geophys. Res.,102,23063-23078,199Z
Blanck, H. F.: Using TOPEX Satellite El-Nifio altimetry data tointroduce thermal expansion and heat capacity concepts inchemistry courses, J. Chern. Educo, 76, 1635-1646, 1999.
Bourles, B., Gouriou, Y., and Chuchla, R.: On the circulation inthe upper layer of the western equatorial Atlantic, J. Geophys.Res., 104,21151-21170,1999.
Brainerd, K. E., and Gregg , M. c.: Surface mixed and mixinglayer depths, Deep-Sea Res. 1,42,1521-1543,1995.
Cronin, M. F., and McPhaden, M. J.: Barrier layer formation during westerly wind bursts,]. Geophys. Res., 107(C12), 21012112,2002.
Defant, A.: Physical oceanography, vol. I, 729 pp., PergamonPress, New York, 1961.
Dengler, M., Schott, F.A., Eden, c., Brandt, P., Fischer, J., andZantopp R. J.: Break-up of the Atlantic deep western boundarycurrent into eddies at 80S, Nature, 432, 1018-1020, 2004.
Goes, M., Molinari, R., da Silveira, 1., and Wainer 1.: Retroflection of the North Brazil Current during February 2002. Deep-
134
M. Araujo, C. Limongi.J. Servain. M. Silva and C.AD. Lemini
Sea Res,, 52,647-667,2005 .Kara, A. B., Rochford, P. A., and Hurlburt, H. E.:Mixed layer
depth variability and barrier layer formation over the northPacific ocean, J. Geophys. Res., 105, 16783-16801,2000.
Levitus, S.: Climatological atlas of the World Ocean, NOAAProf. Paper 13, V.S. Govt. Printing Office, 173 pp., 1982.
Lukas, R., and Lindstr ôrn, E.: The mixed layer of the westernequatorial Pacific ocean, J. Geophys. Res. (Suppl.), 96, 33433357, 1991.
Lumpkin, R., and Garzoli, S.L.: Near-surface circulation in thetropical Atlantic ocean, Deep Sea Res., 52,495-518,2005.
Mignot, J., Montégut, C. B., Lazar, A., and Cravatte, S.: Control of salinity on the mixed layer depth in the worldocean: 2. Tropical areas, J. Geophys. Res., 112, C06011,doi:l0.l029/2006JC003954,2007.
Montégut, C. B., Mignot, J., Lazar, A, and Cravatte, S.: Control of salinity on the mixed layer depth in the world ocean: 1. General description,]. Geophys. Res. , 112, (C06011) ,doi:l0.l029 /2006JC003953,2007.
Monterrey, G., and Levitus, S.: Seasonal variability of mixed layerdepth for the world ocean, NOAA Atlas NESDIS 14, 96 pp.,V.S . Department of Commerce, Washington, D.C., 1997.
Ohlmann, J. C., Siegel, D. A, and Gautier, c.: Ocean mixedlayer depth heating and solar penetration: A global analysis,]. C/imate, 9,2265-2280, 1996.
Pailler, K., Bourles, B., and Gouriou, Y.: The barrier layer in thewestern Atlantic ocean, Geophys. Res. Lett., 26, 2069-2072,1999.
Rodrigues, R. R., Rothstein, L. M., and Wimbush, M.: Seasonalvariability of the South Equatorial Current bifurcation in theAtlantic ocean: A numerical study, J. Phys. Oceanogr., 37, 1630,2007.
Schott, F. A , Dengler, M., Zantropp, R., Stramma, L., Fischer, J.,and Brandt, P.: The shallow and deep western boundary cir-
135

Salinity-Induced Mixed and Barrier Layers in the Southwestern Tropical Atlantic Ocean off theNortheast ofBrazil
culation of the South Atlantic at 50-110S,]. Phys. Oceanogr.,35,2031-2053,2005.
Silva, A. C, Araujo, M., Medeiros, C, Silva, M., and Bourlês,B.: Seasonal changes in the mixed and barrier layers in thewestern equatorial Atlantic, Braz.]. Oceanogr., 53(3/4) , 8398,2005 .
Spall, M.A.: A diagnostic study of wind- and buoyancy-drivennorth Atlantic circulation,]. Geophys. Res., 96, 18509-18518,1991.
Sprintall, [., and Tomczak, M.: Evidences of the barrier layer inthe surface layer of the tropics. ]. Geophys. Res., 97, 73057316, 1992.
Stramma, L. , and Schott, F.: The mean flow field of the tropicalAtlantic ocean, Deep Sea Res., 46B, 279-303, 1999.
Stramma, L., Rhein , M., Brandt, P., Oengler, Boning , C, andWalter. M.: Upper ocean circulation in the western tropicalAtlantic in boreal fall 2000, Deep-Sea Res. r, 52, 221-240,2005.
Swenson, M. S., and Hansen. O. V. : Tropical Pacifíc ocean mixedlayer heat budget: The Pacific cold tongue,]. Phys. Oceanogr.,29,69-81, 1999.
Vialard, ]., and Oelecluse, P.: An OGeM study for TOGA decade. Part lI: Barrier layer formation and variability, ]. Phys.Oceanogr., 28,1089-1106,1998.
Wilson, W. O., ]ohns, E., and Molinari, R. L.: Upper layer circulation in the western tropical north Atlantic Ocean duringAugust 1989,]. Geophys. Res. , 99,22513-22523, 1994.
136