Embed Size (px)
Citation preview

0
Salinas River Watershed Characterization Report 1999
July 31, 2000
Central Coast Regional Water Quality Control Board
Prepared by: Karen Worcester
Dave Paradies Mary Adams
Daniel Berman

1
Table of Contents
INTRODUCTION ........................................................................................................................................................................3
SALINAS STUDY AREA CHARACTERISTICS .................................................................................................................4
OVERALL WATERSHED CHARACTERIZATION APPROACH.................................................................................6
SAMPLING LOCATIONS.........................................................................................................................................................7
SITE DESCRIPTIONS .....................................................................................................................................................................8 MONITORING ACTIVITY LOCATIONS ........................................................................................................................................12
MONITORING METHODS ....................................................................................................................................................13
CONVENTIONAL WATER QUALITY SAMPLING.........................................................................................................................13 BENTHIC MACROINVERTEBRATE ANALYSIS............................................................................................................................15 SEDIMENT CHEMISTRY ANALYSIS............................................................................................................................................17 TISSUE BIOACCUMULATION......................................................................................................................................................20
RESULTS.....................................................................................................................................................................................23
PESTICIDE USE...........................................................................................................................................................................23 MONITORING RESULTS .............................................................................................................................................................29
Conventional Water Quality ................................................................................................................................................29 pH............................................................................................................................................................................................................. 31 Dissolved Oxygen .................................................................................................................................................................................... 33 Water Temperature................................................................................................................................................................................... 37 Nitrate....................................................................................................................................................................................................... 39 Nitrite ....................................................................................................................................................................................................... 43 Ammonia.................................................................................................................................................................................................. 44 Total Kjeldahl Nitrogen............................................................................................................................................................................ 48 Orthophosphate (as PO4).......................................................................................................................................................................... 49 Chlorophyll a ............................................................................................................................................................................................ 52 Fecal Coliform.......................................................................................................................................................................................... 55 Turbidity................................................................................................................................................................................................... 58 Fixed Suspended Solids............................................................................................................................................................................ 60 Fixed Dissolved Solids ............................................................................................................................................................................. 62 Chloride.................................................................................................................................................................................................... 65 Sodium ..................................................................................................................................................................................................... 67
Organic Chemicals and Metals ............................................................................................................................................68 Arsenic ..................................................................................................................................................................................................... 70 Barium...................................................................................................................................................................................................... 70 Chromium................................................................................................................................................................................................. 71 Cobalt ....................................................................................................................................................................................................... 73 Copper ...................................................................................................................................................................................................... 73 Lead.......................................................................................................................................................................................................... 74 Nickel ....................................................................................................................................................................................................... 75 Zinc .......................................................................................................................................................................................................... 77 p,p DDE.................................................................................................................................................................................................... 78 p,p DDT.................................................................................................................................................................................................... 80 Dieldrin .................................................................................................................................................................................................... 81 Endosulphan I........................................................................................................................................................................................... 83 Endrin....................................................................................................................................................................................................... 83 Anthracene ............................................................................................................................................................................................... 84 Fensulfothion............................................................................................................................................................................................ 85

2
DISCUSSION ..............................................................................................................................................................................86
SALINITY, TOTAL DISSOLVED SOLIDS(TDS), AND CHLORIDE................................................................................................86 NUTRIENTS ................................................................................................................................................................................87 PESTICIDES AND PRIORITY ORGANIC CHEMICALS...................................................................................................................87 PATHOGENS ...............................................................................................................................................................................88 METALS .....................................................................................................................................................................................88 SURFACE WATER FLOW .............................................................................................................................................................88
COMMENTS ON 303(D) LISTINGS .....................................................................................................................................89
RECOMMENDATIONS FOR FUTURE SAMPLING.......................................................................................................90
REFERENCES............................................................................................................................................................................91
APPENDICES.............................................................................................................................................................................92
Appendix 1. Beneficial Uses of the Salinas River and Associated Waterbodies ............................................................93 Appendix 2. Central Coast Regional Water Quality Control Board 303(d) list...............................................................94 Appendix 3. Salinas Watershed Bibliography ...................................................................................................................96

3
Introduction Characterization of the Salinas River and its major tributaries has been conducted following the basic monitoring strategy of the Central Coast Ambient Monitoring Program (CCAMP). The CCAMP program has been developed by the Central Coast Regional Water Quality Control Board (RWQCB) to “collect, assess, and disseminate scientifically based water quality information to aid decision makers and the public in maintaining, restoring, and enhancing water quality and associated beneficial uses”. This characterization is one of five to be conducted throughout the Region over a five year period. It was funded through several sources, including Clean Water Act Section 106, State Mussel Watch Program, State Water Resources Control Board Fresh Water Standards Program and the RWQCB. Portions of the funding were provided in order to support data collection for Total Maximum Daily Load assessments. Data will also be used to update 305(b) watershed assessments, to assess the effectiveness of RWQCB programs, and to help direct Best Management Practice implementation to areas in most need.
Location of Study Area

4
Salinas Study Area Characteristics The watershed of the Salinas River and its tributaries covers approximately 4,600 square miles (nearly 3 million acres) and lies within San Luis Obispo and Monterey Counties. The Salinas River, which originates in San Luis Obispo County, flows northwestward into Monterey County, through the entire length of the Salinas Valley and empties into Monterey Bay. The watershed’s main tributaries are the Arroyo Seco, Nacimiento, San Antonio, and Estrella Rivers. The Salinas River drains a large watershed with a number of distinct tributaries; and although it is considered a single hydrologic unit, geographic, political, land use and ground water divisions facilitate discussion of the Salinas River watershed in terms of an upper and a lower watershed. The upper watershed begins at the headwaters of the Salinas River in the La Panza Range southeast of Santa Margarita Lake in San Luis Obispo County and flows to the narrows area near Bradley, just inside Monterey County. The upper watershed includes drainages of the Estrella, Nacimiento and San Antonio Rivers. The upper watershed overlies the Paso Robles Ground Water Basin and lies mainly in San Luis Obispo County. The lower watershed extends from the Bradley narrows area to Monterey Bay and includes the drainage of the Arroyo Seco River. The lower Salinas River watershed overlies the Salinas Ground Water Basin and is entirely within Monterey County. Agriculture is the primary land use within the Salinas River watershed. Grazing and pasture lands and dryland farming have historically been the dominant land use in the upper watershed, but large areas in southern Monterey County and northern San Luis Obispo County are being converted to vineyards. Irrigated cropland is predominant in the lower watershed, primarily row crops such as lettuce, celery, broccoli and cauliflower on the valley floor, with grazing and vineyards on the upland areas. The lower watershed is one of the most productive agricultural areas in the world, with a gross annual value of nearly $2 billion. The rapidly expanding wine-producing region in the upper watershed around Paso Robles is also becoming a highly productive agricultural area. Urban development occurs primarily in a corridor along the Salinas River. The largest city, Salinas, has more than 100,000 people and is developing rapidly. Urban development in the upper watershed is occurring in the small cities of Santa Margarita, Atascadero, Templeton and Paso Robles, which are also growing rapidly. In addition to agriculture and urban development, other land uses in the Salinas River watershed include two military facilities (Fort Hunter Liggett and Camp Roberts), exploitation of mineral and oil reserves in the San Ardo area and a few other locations throughout the watershed, and some public land and open space. The watershed has three dams, one on the upper Salinas River south of Santa Margarita, one on the Nacimiento River and one on the San Antonio River. The above information is adapted from the Salinas River Watershed Management Action Plan (RWQCB, 1999). Sampling was also conducted at several locations in the Elkhorn Slough, Tembladero, Old Salinas River, and Moro Coho watersheds. These drainages are connected to the Salinas by way of a slide gate between the Salinas River and the Old Salinas River. Flow down these waterbodies generally drains to the ocean through Moss Landing Harbor. Land use in this portion of the study area includes both urban (the City of Salinas and the City of Castroville, and various rural communities) and agriculture. Common agricultural crops include strawberries and artichokes, as well as other row crops. Many of the drainages in this vicinity have been greatly altered through various flood management activities. For example, the Salinas Reclamation Canal is a highly modified channel which carries flow from several different sources through the City of Salinas. Both Moro Cojo Slough and Tembladero Slough have been realigned and channelized in places. At one time, the Salinas River flowed to the ocean in the vicinity of Moss Landing; the Old Salinas River is a remnant of that historic channel. The Salinas River and other waterbodies discussed in this study have been listed by the Regional Board on the Clean Water Act’s 303(d) list of impaired water bodies. Impaired water bodies are those waters which do not fully support all of their designated beneficial uses (Appendix 1). All waterbodies on the 303(d) list are scheduled for development and implementation of Total Maximum Daily Loads (TMDLs) within the next several years (Appendix 2). Developing and implementing a TMDL is a process which includes identification of sources and allocation of load reductions needed to restore beneficial uses.

5
General land use in the Study Area (California Department of
Water Resources, 1989-1991)

6
Overall Watershed Characterization Approach In February 1999, the Central Coast Ambient Monitoring Program (CCAMP) began a year long monitoring effort which continued through March 2000. The goal of this monitoring was to assess the relative contributions of toxins, metals and other pollutants from its major tributary streams and to support the development of total Maximum Daily Load (TMDL) assessments. Basic study design followed the watershed characterization approach described in the Central Coast Regional Water Quality Control Board’s CCAMP guidance (RWQCB, 2000). The Central Coast Regional Water Quality Control Board (RWQCB) used several different methods to evaluate water quality and stream habitat conditions within the Salinas Watershed; these included monthly water quality analysis of conventional pollutants, Rapid Bioassesment of benthic invertebrate communities, three monthly pre-dawn dissolved oxygen measurements and sediment assessment for metals and organic chemicals. Fish were collected at several locations in the lower watershed for analysis of tissue bioaccumulation, and freshwater clams (Corbicula fulminea) were transplanted to several locations for additional tissue analysis. Water column toxicity, along with associated water chemistry, was sampled as part of a SWRCB grant to the Marine Pollutions Studies Laboratory. That data is not yet available and will be summarized in a later report. Monthly sampling for conventional water quality parameters began in February 1999 at 34 sites in the watershed. Sampling was always conducted during the first week of each month. Due to the relatively mild winter of 1998-99, this sampling was continued into the winter months of 2000 to obtain additional supporting data during rainfall events. In addition, sampling was increased from the monthly collection effort to a two week interval, in order to better characterize winter conditions. Water quality parameters were analyzed both in the field and by the RWQCB contract laboratory. Dissolved oxygen (% saturation and mg/L) and water temperature (°C) were measured in the field using a hand held multi-analyte probe. The RWQCB contract laboratory analyzed water samples for nutrients, total and fecal coliform, turbidity, conductivity, suspended solids, dissolved solids, chloride, calcium, magnesium, boron, hardness and chlorophyll a. Qualitative assessments were made at each station for the following parameters: algae coverage (%), periphyton coverage (%), terrestrial plant coverage (%), corridor shading (%) and water level and water velocity (low, medium, high). In conjunction with summer water quality sampling (July-September) pre-dawn dissolved oxygen was measured to assess oxygen concentrations when most depressed. All sites were sampled three times in three consecutive months for early morning DO between the hours of ~0400 and 0600. Nine sites were assessed for benthic macroinvertebrate community structure. Because of the low stream gradient in most of the Salinas system the California Rapid Bioassessment Protocol was modified in cooperation with the California Department of Fish and Game (DFG) from the standard statewide protocol. Samples were collected at sites in consecutive spring seasons (1999 and 2000) and invertebrate identification was conducted by the DFG Water Pollution Laboratory in Rancho Cordova, California. In conjunction with macroinvertebrate bioassessment, habitat assessments were also conducted at each site. Sediment sampling for metals and organic chemicals was conducted once at 29 of the conventional water quality sites. Fine sediments were targeted to improve ability to detect low levels of pollutants. Samples were also analyzed for particle size. The Salinas river bottom is dominated by sandy sediment and does not have the typical “riffle/pool” structure found in many systems. Consequently, fines (silts and clays) were relatively difficult to locate. Sediment sampling was conducted in the fall of 1999. Clams were deployed in the watershed at a number of locations during the winter of 1998-99. Because of vandalism and high rainfall events, a number of the samples were lost in the first sampling run, so were subsequently replaced later in the winter season. Tissue samples were evaluated for concentrations of synthetic organic chemicals and metals. Samples were deployed, collected and analyzed by staff of the State Mussel Watch Program.

7
Sampling Locations Site selection in the Salinas watershed study area was based on several considerations, including geographical location, upstream drainage area, land use, access and known problems. Sites were placed on all tributaries exceeding 66,000 acres in size, as well as upstream and downstream of other potential source areas (such as the City of Salinas and the San Ardo oil extraction facility. Thirty–four sites were placed along the main stem Salinas river and in the major tributaries near their confluence with the Salinas. Sampling site locations and the relative upstream drainage area above each site are shown below. A description of the location of each site and major land uses in the immediate area follows. Sites are listed beginning at the northern most sites and proceeding upstream through the watershed.
Salinas River study area and sample site locations, showing relative upstream drainage area (darker colors depict larger upstream area)

8
Site Descriptions Old Salinas River at Moss Landing Road North (MOS) This site is located on the North side of Moss Landing Road where the Salinas River and Moro Cojo Slough flow into Moss Landing Harbor. At this location the river is influenced by tidal fluctuations. Moss Landing Harbor is listed as an impaired waterbody under section 303(d) of the Clean Water Act (1999) for pathogens, siltation and pesticides (SWRCB, 1998). Water quality and sediment samples were collected from the north-facing bank of the harbor where flow moves under the road. Moro Cojo Slough at Highway 1 (MOR) This site is located on the east side of Highway 1 where the Slough passes under the highway. The Moro Cojo Slough is listed as an impaired waterbody under section 303(d) of the Clean Water Act (1999) for pesticides and sedimentation (SWRCB, 1998). This site is also influenced by tidal fluctuation. Water quality and sediment samples were collected from the east side of the Highway 1 where water flows through an underpass tunnel. Old Salinas River at Potrero Road (POT) This site is located where the Old Salinas River flows under Potrero Road. This site is influenced by tidal fluctuations. Intensive row crop agriculture is the primary land use in the immediate area. Water quality and sediment samples were collected from the bank on the north side of the overpass. Old Salinas River at Monterey Dunes Way (SDW) This site is located near the intersection of Monterey Dunes Way and Molera Rd., just down stream of the confluence with Tembladero Slough. Intensive agricultural land uses surround this site. Water quality and sediment samples were collected from the north river bank at the road overpass. Salinas River at Highway 1 Bridge (SBR) This site is located where the Salinas River flows under Highway 1, south of Moss Landing. This is the downstream most sampling site on the Salinas River and is adjacent to both agriculture fields and a small farming community. The Salinas River is listed as an impaired waterbody under section 303(d) of the Clean Water Act (1999) for nutrients, pesticides, TDS, chlorides, salinity, sedimentation and siltation (SWRCB, 1998). Water quality and sediment samples were collected from the north river bank to the east of the highway. Tembladero Slough at Preston Road (TEM) This waterway flows to the Old Salinas River near Moss Landing and carries a high percentage of urban and agricultural runoff from the cities of Salinas and Castroville. Tembladero Slough is listed as an impaired waterbody under section 303(d) of the Clean Water Act (1999) for nutrients and pesticides (SWRCB, 1998). This site is located in the city of Castroville where Preston Road crosses the Slough. Water quality and sediment samples were collected on the south bank at the road overpass. Elkhorn Slough at Kirby Park (ELK) This site is located within the Elkhorn Slough Preserve which is an important wildlife and recreational area. Within view of the sample site are agriculture fields and areas reserved for recreational use. Elkhorn Slough is listed as an impaired waterbody under section 303(d) of the Clean Water Act (1999) for pathogens, siltation and pesticides (SWRCB, 1998). Water quality samples were collected from the end of the dock found at the south/east corner of the Kirby Park parking lot. Sediment samples were collected from the bank adjacent to the dock. Carneros Creek at Blohm Road (CAR) This tributary to Elkhorn Slough is sampled in the town of Los Lomas, where Blohm Road crosses the creek. Primary land uses in the immediate area adjacent to this site include both urban and agriculture. Water quality and sediment samples were collected from the bank under the road overpass. Salinas Reclamation Canal at Airport Road (ALU) This site is located west of Highway 101 at Airport Road in Salinas. The Reclamation canal is listed as an impaired waterbody under section 303(d) of the Clean Water Act (1999) for pesticides and priority organics (SWRCB, 1998). Water quality samples were collected from the center of the stream approximately 50m down stream from both the Airport Road overpass and a stormdrain discharge pipe. This site is upstream from the primary urban areas of the city of Salinas, and is surrounded by agriculture fields. Sediment samples were collected from the S/W creek bank at the same location.

9
Salinas Reclamation Canal Drain at Airport Road (AXX) This storm drain discharges to the Salinas Reclamation Canal at Airport Road. This site was added to the conventional water quality sampling effort in December 1999 in an effort to identify the source of the unusually high levels of coliform observed in the ALU samples. Flow from this drain is continuous year round into the reclamation canal. Sources to the drain are primarily vegetable and other food processing industries. Alisal Creek at Old Stage Road (UAL) Alisal Creek is diverted for irrigation to several agricultural fields along it course. Alisal Creek is sampled for conventional water quality above its confluence with the Salinas Reclamation Canal and was added to the sampling effort in September, 1999 to assess levels of pollutants observed at the Airport Road site. This site is located where the creek passes under Old Stage Road and is sampled from the bridge. Gablan Creek at East Boranda Road (GAB) This site is located near the intersection of Independence Boulevard and East Boranda Road in the city of Salinas. Gablan Creek is diverted at several locations for agriculture uses. The stream was periodically dry between late May and February with flows appearing dominated by agricultural runoff. Water quality samples were collected from a bridge overpass, which is located on a private farm road north of East Boranda Road. Sediment samples were collected in the streambed directly under the overpass where clays have been deposited. Salinas Reclamation Canal down at Boranda Road (ALD) This site is located west of Highway 101 where the Salinas Reclamation Canal crosses Boranda Road. This site is located at the western edge of the city of Salinas and is surrounded by farmland. Water quality samples were taken from the bridge overpass on Boranda Road and sediment samples were collected on the southern bank, west of the bridge. Salinas River at Davis Road (DAV) This site is located where Davis Road crosses the Salinas River. Water quality samples were collected from the bridge on Davis Road, this location is directly downstream of the rivers' confluence with the Salinas stormdrain and is downstream of the city of Salinas. Primary land use in this area is agriculture. Sediment samples were collected on the southern bank west of the bridge. This site was also regularly sampled for pesticides and PCB’s by the Marine Pollution Studies Laboratory. Salinas River Storm Drain (SDR) This site is located adjacent to an agriculture field, east of Davis Road and approximately 1000m upstream from the Davis Road site. Approximately one third of the City’s runoff flows to the Salinas River via this storm drain pipe, primarily from residential areas. Water quality and sediment samples were collected from the south bank in the channel downstream of the discharge pipe and approximately 100m upstream of its confluence with the river. This site was also regularly sampled for pesticides and PCB’s by the Marine Pollution Studies Laboratory by the Marine Pollution Studies Laboratory. Quail Creek (QUA) The Quail Creek site is located where Potter Road crosses the creek, approximately 1 mile east of Highway 101. Intermittent flows were maintained by agricultural runoff in the dry season. Water quality samples were collected from the overpass on the north side of the road where Quail Creek meets the main agricultural drainage ditch. Sediment samples were collected on the north bank of the creek adjacent to the bridge abutment. Toxicity and water chemistry sampling for pesticides and PCB’s by the Marine Pollution Studies Laboratory by the Marine Pollution Studies Laboratory was conducted at the railroad bridge adjacent to Highway 101, approximately 300 meters upstream of its confluence with the Salinas River and approximately 1 mile downstream from this site. Quail Creek at Old Stage Road (UQA) This site is upstream of the Quail Creek site on Potter Road and was added to the sampling effort in November, 1999 to investigate high levels of nitrate and coliform at the Potter Road site. Primary land use in the immediate vicinity and upstream of this site is agriculture. The water quality samples were collected where the creek passes under Old Stage Road, south of Potter Road.
10
Salinas River at Chualar Bridge (SAC) This site is upstream of the city of Salinas and is located where the Chualar Bridge crosses the Salinas River. Agriculture is the primary land use in this area. Water quality, sediment and toxicity samples were collected from the western bank, adjacent to the bridge. Macroinvertebrate samples were collected 300 meters upstream from the bridge. This site is dry during summer months when Nacimiento and San Antonio releases are restricted. Arroyo Seco River (SEC) Monthly water quality sampling began at this site in July 1999 when the Thorn Road site no longer maintained flows. This site is upstream of Thorn Road and the majority of agriculture influences. Water quality samples were collected at the Elm St Bridge. This site is located adjacent to forest service land and therefore does not reflect the agricultural land uses that influence the Thorn Rd site. Arroyo Seco River at Thorn Road (SET) This site is located where the Arroyo Seco River passes under Thorn Road. Water quality samples were collected from the north side of the road. Agriculture borders both sides of the river at this location. Sediment samples were collected 100 meters upstream from the road. Macroinvertebrate samples were collected approximately 500 meters upstream from the road. Salinas River at Greenfield (GRN) This site is located east of Highway 101 where Elm Road crosses the river. Agriculture is the primary land use in the area. Water quality samples were collected from the Elm Road bridge. Sediment samples were collected under the bridge on the south abutment. Macroinvertebrate samples were collected approximately 200 meters upstream of the bridge. Topo Creek (TOP) Topo Creek is sampled where it meets Elm Road east of Greenfield. The Topo Creek site is downstream of a gravel mine and was sampled for water quality in February only because of lack of flow throughout the rest of the year. No sediment or benthic samples were collected for this site. Salinas River at King City (KNG) This site is located near the entrance to San Lorenzo State Park where the Salinas River flows under Highway 101 in King City. This site is downstream of the river's confluence with the San Lorenzo River and King City. Primary land uses at this site are urban and recreation, however, upstream of this site the primarily landuse is agriculture. Water quality and sediment samples were collected from the east bank of the river at this location. San Lorenzo River (LOR) This site is located where Bitterwater Road parallels the San Lorenzo River, approximately 6 miles up stream of Hwy 101 and King City. Primary land use in this area is agriculture. Water quality and sediment samples were collected from the northwestern bank of the river. This location is above most agricultural influences and serves as a reference for the King City site. San Lorenzo River in King City (LOK) This site is located at the First Street bridge in King City approximately 11/2 miles upstream from its confluence with the Salinas River. Water quality samples were collected from the bridge. Sediment samples were collected under the bridge. Urban and agriculture practices are the known primary influences at this site. This site was dry May 1999 through January 2000. Salinas River downstream of San Ardo (DSA) This site is located at the Cattlemen Road Bridge west of San Ardo where grazing and agriculture are the primary land uses. This site is down stream of an oil refinery. Water quality samples were collected from the bridge. Sediment samples were collected from the west bridge abutment. Macroinvertebrate samples were collected approximately 300 meters upstream from the bridge. Salinas River upstream of San Ardo (USA) This site is located at the Bradley Bridge east of Highway 101. Agriculture and grazing are the primary land uses in the immediate area. Water quality samples were collected from the bridge. Sediment samples were collected under the bridge on the abutment. Macroinvertebrate samples were collected 100 meters upstream from the bridge. Flows increased significantly at this site after releases began at Nacimiento and San Antonio reservoirs in June.

11
Nacimiento River (NAC) The Nacimiento River is the primary source of water to the lower Salinas River in the summer months. Controlled flows are released from Nacimiento Reservoir year round. In September releases were at a minimum (25cfs); at this time the Salinas River was dry from King City to the City of Salinas. Flows were once again increased in mid November to maintain flows to the target area in Spreckles where Highway 68 crosses over the river. Lake Nacimiento is primarily utilized as an agricultural supply reservoir for the lower Salinas Valley, but recreation and flood control are other important uses. The Nacimiento River flows through Camp Roberts up stream of the sampling site. Water quality samples were collected the Old River Bridge, which crosses the river on the Camp Roberts property. Sediment samples were collected from the north bank approximately 50 meters upstream from the bridge. In June releases from the reservoir at this site significantly increased flow, altering riffle habitats. As a result this site was not sampled in June for benthic macroinvertebrates. San Antonio River (SAN) The San Antonio Rive is also a significant source of water to the Salinas. Controlled releases from the reservoir began in June and were regulated on the same schedule as Nacimiento Reservoir releases. This reservoir is also an important agricultural supply reservoir. The river flows through the Camp Robers military base upstream of the sample location. This site is located where Highway 101 passes over the San Antonio River. Water quality samples were collected under the bridge from the south bank. Sediment samples were collected on both banks upstream from the bridge. Macroinvertebrate samples were collected from riffles near the overpass. Flows at this site increased dramatically after water releases began in June. Salinas River up stream of the Nacimiento River (SUN) This site is located on Bradley Road south of Bradley and east of Highway 101. Water quality samples were collected from the bridge. Sediment samples were collected under the bridge on the abutment. This site is upstream of the rivers’ confluence with the Nacimiento and San Antonio rivers. It was dry at this site from June through the end of year. Estrella River (EST) The Estrella River is sampled approximately five miles upstream of its confluence with the Salinas River near San Miguel. This site is located where Airport Road crosses the Estrella River east of Paso Robles and north of Highway 46. Water quality samples were taken from the east roadside bank. Sediment samples were collected from the north bank 50 meters upstream of the road. This site was dry in the spring and was not sampled for macroinvertebrates. The river was dry at this site from May through the end of the sampling year. For future sampling, the Estrella River will be sampled from the bridge just on the south side of Highway 46, and west of Airport Road, where water was more continuously available. Salinas River at 13th Street (PSO) This site is located at the 13th Street bridge in Paso Robles directly downstream of the Niblick Road bridge. This site is located within the urban area of Paso Robles. Water quality samples were collected from the bridge. Sediment samples were collected under the bridge on the west abutment. Macroinvertebrates were sampled 200 meters up stream of the bridge. Cholame Creek at Bitterwater Road (CHO) Cholame Creek is a major tributary stream to the Estrella River. This site is located on Bitterwater Road just south/east of Highway 46. Livestock grazing is the primary land use in the immediate vicinity of the site. Water quality was sampled from the bridge. Sediment samples were collected under the bridge and on the east bank of the creek up stream from the bridge. Macroinvertebrate samples were collected 300 meters upstream of the bridge. Atascadero Creek at Highway 41(ATS) This site is located at the Highway 41 bridge in Atascadero approximately 1 mile upstream of its confluence with the Salinas River. Atascadero Creek flows northward from the City of Atascadero. Water quality samples were collected from the bridge. Sediment samples were collected from the north bank 100 meters upstream from the bridge. Macroinvertebrate samples were collected 200m upstream from the bridge. Salinas River at Highway 41 (SAT) This is the southern-most site in the watershed and is located where the Salinas River passes under the Highway 41 bridge in Atascadero. Water quality samples were collected under the bridge. No sediment samples were collected for this site.

12
Monitoring Activity Locations Not all monitoring activities were conducted at every site. In general, all sites were sampled for conventional water quality once a month; however, many dried up during the summer months, resulting in low sample counts.
Monitoring Activities and Monitoring Frequency by Site Conventional water quality (CWQ), State Muscle Watch (SMW), Rapid Bioassessment (RBA),
Sediment chemistry (SC) and Pre-dawn dissolved oxygen (DO).
Site
Water Body / Receiving Water C
WQ
SMW
SC
RB
A
DO
SEC Arroyo Seco River 10 1 3 SET Arroyo Seco River 7 1 2 ATS Atascadero Creek 22 1 2 3 CAR Carneros Creek 13 1 2 CHO Cholame Creek 10 1 1 2 EST Estrella River 4 1 1 ELK Elkhorn Slough 15 1 3 GAB Gablan Creek 6 1 2 MOR Moro Cojo Slough 13 1 3 NAC Nacimiento River 15 1 2 3 MOS Old Salinas River 13 1 3 POT Old Salinas River 14 1 3 SDW Old Salinas River 14 1 2 UQA Quail Creek 2 QUA Quail Creek 6 1 3 UAL Alisal Creek 6 1 AXX Salinas Reclamation Canal 3 ALD Salinas Reclamation Canal 17 1 3 ALU Salinas Reclamation Canal 15 1 3 DAV Salinas River 21 1 2 3 DSA Salinas River 16 1 2 3 GRN Salinas River 14 1 2 2 KNG Salinas River 14 1 2 3 PSO Salinas River 7 1 1 1 SAC Salinas River 12 1 2 2 SAT Salinas River 11 1 2 SBR Salinas River 14 1 3 SUN Salinas River 4 1 2 USA Salinas River 16 1 2 3 SDR Salinas River 12 1 3 SAN San Antonio River 15 1 2 3 LOK San Lorenzo Creek 3 1 1 LOR San Lorenzo Creek 12 1 2 TEM Tembladero Slough 13 1 3 TOP Topo Creek 1

13
Monitoring Methods (for additional information see www.ccamp.org) The CCAMP strategy of establishing and maintaining permanent long term monitoring sites provides a framework for trend analysis and detection of emergent water quality problems. CCAMP uses a variety of monitoring approaches to characterize status and trends of coastal watersheds and confluences with the ocean. Basic characterization includes collection of water chemistry, sediment chemistry, tissue bioaccumulation, habitat assessment, and bioassessment data, as well as acquisition of existing literature, reports, data and available basic GIS data layers which describe land use, geology, soils, discharge locations, known problem sites, etc. Conventional Water Quality Sampling Monthly water quality sampling for basic water quality parameters was conducted, at all sites with flow in the Salinas watershed, between February 1999 and March 2000. Field measurements were conducted using a 98 YSI DO meter and a Hydrolab Data Sonde-4 multiprobe meter. The DO probe was either placed into flowing water or was gently stirred in still and low flowing waters. Dissolved oxygen (% saturation and mg/L) and temperature (°C) were recorded in the field using the YSI DO meter. When using the Data Sonde 4 in the field, we collected conductivity, pH and salinity in addition to dissolved oxygen and temperature data. Basic water quality parameters analyzed by the contract laboratory are shown. Water samples collected for laboratory analysis were collected in sterilized bottles provided by the contract laboratory and stored in coolers at 4°C until delivered to the laboratory for analysis. Water for coliform analysis was collected in a 100ml sterilized and sealed bottle, water for chlorophyll a analysis WA collected in a 500ml plastic amber colored bottle and water samples for all remaining water quality parameters were collected in two one-liter clear plastic bottles. Chain of custody forms were utilized to document the exchange of all samples between the field crew and the laboratory. Chain of custody forms include the following information for each sample: Date and time collected, sample ID or name, sample collectors name, all analyses to be conducted and the signature of both the person relinquishing and receiving the sample.
Analytes for monthly conventional water quality data collection Analyte Units Analyte Units PH pH units Chlorophyll a ug/l Conductivity US Total Suspended Solids mg/l Turbidity NTU Fixed Suspended Solids mg/l Dissolved Oxygen Ppm Total Dissolved Solids mg/l Oxygen Saturation % Saturation Fixed Dissolved Solids mg/l Water Temperature Celsius Volatile Solids mg/l Air Temperature Celsius Volatile Suspended
Solids mg/l
Total Coliform Bacteria MPN/100 ml Salinity mg/l Fecal Coliform Bacteria MPN/100 ml Chloride mg/l Nitrate-NO3 mg/l Calcium mg/l Nitrite-N mg/l Magnesium mg/l Total Kjeldahl Nitrogen mg/l Boron mg/l Ammonia-N mg/l Corridor Shading % Ortho Phosphate mg/l Algal Cover % Total Phosphate mg/l Plant Cover %

14
Salinas Study Area Conventional Water Quality Sites

15
Benthic Macroinvertebrate Analysis Benthic macroinvertebrates (BMI’s) are found living in association with stream bottom substrates. Different species respond differently to water pollution and habitat degradation. Therefore, BMI’s can be used as important indicators of water quality conditions and biological integrity. CCAMP worked with the Department of Fish and Game Water Pollution Control Laboratory to modify the California Stream Bioassessment Procedures (CSBP’s) for use in low gradient streams where riffle/pools structure is not apparent, such as in the Salinas River. CCAMP assessed nine sites in the Salinas watershed, in consecutive spring seasons (April – May, 1999 and 2000), for BMI communities and physical habitat structure. Benthic macroinvertebrate assessment was conducted in stream reaches associated with conventional water quality and sediment sampling. Procedures for sampling streams with riffle habitat followed the CSBP developed by the California Department of Fish and Game (DFG May 1999). Only three of the sites sampled, Arroyo Seco River, Nacimiento River and San Antonio Piver, had available riffle habitats. A brief synopsis of this protocol follows. The complete CSBP’s and quality assurance guidance can be downloaded at http://www.dfg.ca.gov/cabw/protocols.html. Sampling units are riffles within a representative reach of stream. Five consecutive riffles are identified within the reach, three of these riffles are randomly chosen to be sampled and one sample is collected from the upstream third of each of the three chosen riffles. Sampling begins at the down stream riffle. A measuring tape is used to identify the upper one third of each riffle. One transect is selected from all possible meter marks within the upper third of the riffle using a random number table. Sampling proceeds perpendicular to the flow using a d-shaped kick net with a 0.5 mm mesh. Samples are collected near the side margins and at the stream thalweg along each transect. The three samples for each transect are combined to make one composite sample. The collection net is placed on the substrate so that water flows through the net. In front of the net a 1x2-foot area is disturbed and all rocks are scrubbed for 60 seconds. The sample contents are then gently sifted in flowing water to remove fine sediments using a standard size 35 sieve (0.5mm mesh). Large pebbles which clearly are clean of any clinging insects are also discarded. Samples are stored in tightly capped jars filled with 70% ethanol. All samples are analyzed by a California Bioassessment Laboratories Network laboratory, following the CSBP procedures for benthic macroinvertebrate identification. In short, the laboratory rinses each sample through a No. 35 standard testing sieve (0.5 mm brass mesh) and the sample is transferred into a tray marked with 20 pre-numbered 25 square cm. grids. All detritus is removed from one randomly selected grid at a time and placed in a petri dish for inspection under a stereomicroscope. All invertebrates from the selected grid are separated from the surrounding detritus and transferred to vials containing 70% ethanol and 2% glycerol. This process is continued until 300 organisms are removed from each sample. The material left from the processed grids is transferred into a jar with 70% ethanol and labeled as "remnant" material. Any remaining unprocessed sample from the tray is transferred back to the original sample container and archived in 70% ethanol. Macroinvertebrates are then identified to a standard taxonomic level, typically genus level for insects and order or class for non-insects. The majority of the sites sampled on tributaries to the Salinas River and the Salinas itself had sand or mud substrates and were lacking riffle habitats. CCAMP worked with the Department of Fish and Game Water Pollution Control Laboratory to modify the CSBP’s and the California Aquatic Bioassessment Laboratories (CABL) for wadeable streams for low gradient, sandy systems (Harrington 1999). Three samples were collected from each of three transects along a representative 100m reach. A 100-m tape was stretched along the bank and each meter mark represented a possible transect location. Three transect locations were randomly selected along the tape using a random number table. Sampling began at the most downstream transect and proceeded perpendicular to the stream flow. Net collections were made at each the stream margins and the thalweb. Other sampling procedures, storage and laboratory analysis were identical to those used for riffle habitats. Physical habitat influences both the quality of the water and the condition of the aquatic community. Habitat quality is evaluated using a qualitative approach at each location sampled for benthic macroinvertebrates. Assessment of physical/habitat quality follows that which is described in the CSBP. The sampler uses a ranking system ranging from optimal to poor conditions to assess physical habitat.

16
Salinas Study Area Rapid Bioassessment Sites

17
U.S. EPA Rapid Bioassessment Protocol habitat assessment parameters
Condition Habitat Parameter Excellent Good Fair Poor Primary-Substrate and Instream Cover 1. Instream Cover 16-20 11-15 6-10 0-5 2. Epifaunal Substrate 16-20 11-15 6-10 0-5 3. Embeddedness 16-20 11-15 6-10 0-5 4. Channel Flow 16-20 11-15 6-10 0-5 Secondary - Channel Morphology 5. Channel Alteration 16-20 11-15 6-10 0-5 6. Sediment Deposition 16-20 11-15 6-10 0-5 7. Riffle Frequency 16-20 11-15 6-10 0-5 Tertiary - Riparian and Bank Vegetation 8. Bank Vegetation 16-20 11-15 6-10 0-5 9. Bank Stability 16-20 11-15 6-10 0-5 10. Riparian Zone 16-20 11-15 6-10 0-5 TOTALS 151-200 101-150 51-100 0-50
Sediment Chemistry Analysis Concentrations of many substances are not readily detected in water samples because they are not highly soluble. Screening for the presence of toxic substances including pesticides, petroleum products and metals in sediment was conducted at most of the conventional water quality sampling sites. Sediment chemistry was analyzed at 29 sites in June 1999. Sediment samples were analyzed by the contract laboratory. Laboratory analysis included synthetic organics, metals, particle size distribution and total organic carbon. Sampling targeted fine grain sediments. Surgical gloves were used at each site to collect deposited sediments with high clay content. Samples were collected in three 8oz-glass bottles and delivered to the RWQCB contract laboratory for chemical analysis.
Sediment Sample Analyte List
Analyte Method Units Analyte Method Units % Clay Plumb % Benzo(k)fluoranthene 8270B ug/Kg
% Sand Plumb % beta-BHC 8080A ug/Kg
% Silt Plumb % Chrysene 8270B ug/Kg
% Solids 160.3 % delta-BHC 8080A ug/Kg
Azinphos-methyl 8140 ug/Kg Dibenzo(a,h ) anthracene 8270B ug/Kg
Bolstar 8140 ug/Kg Dieldrin 8080A ug/Kg
Cadmium 6020 mg/kg Endosulfan-I 8080A ug/Kg
Chlorpyrifos 8140 ug/Kg Endosulfan-II 8080A ug/Kg
Chromium 6020 mg/kg Endosulfan-Sulfate 8080A ug/Kg
Copper 6020 mg/kg Endrin 8080A ug/Kg
Coumaphos 8140 ug/Kg Endrin Aldehyde 8080A ug/Kg
Demeton-O 8140 ug/Kg Endrin Ketone 8080A ug/Kg
Demeton-S 8140 ug/Kg Flouranthene 8270B ug/Kg
Diazinon 8140 ug/Kg Flourene 8270B ug/Kg
Dichlorvos 8140 ug/Kg gamma-BHC 8080A ug/Kg
Disulfoton 8140 ug/Kg gamma-Chlordane 8080A ug/Kg

18
Analyte Method Units Analyte Method Units Ethoprop 8140 ug/Kg Heptachlor 8080A ug/Kg
Fensulfothion 8140 ug/Kg Heptachlor-Epoxide 8080A ug/Kg
Fenthion 8140 ug/Kg Indeno(1,2,3-cd)pyrene 8270B ug/Kg
Lead 6020 mg/kg Methoxychlor 8080A ug/Kg
Mercury 7471 mg/kg Naphthalene 8270B ug/Kg
Merphos 8140 ug/Kg PCBs 8080A ug/Kg
Mevinphos 8140 ug/Kg Phenanthrene 8270B ug/Kg
Naled 8140 ug/Kg Pyrene 8270B ug/Kg
Nickel 6020 mg/kg Toxaphene 8080A ug/Kg
Parathion-methyl 8140 ug/Kg 4,4'-DDD 608 ug/L
Particle Size Wt.(<0.002mm) Plumb gm 4,4'-DDE 608 ug/L
Particle Size Wt.(>.0156mm) Plumb gm 4,4'-DDT 608 ug/L
Particle Size Wt.(>0.002mm) Plumb gm Aldrin 608 ug/L
Particle Size Wt.(>0.0039mm) Plumb gm alpha-BHC 608 ug/L
Particle Size Wt.(>0.0078mm) Plumb gm alpha-Chlordane 608 ug/L
Particle Size Wt.(>0.0313mm) Plumb gm Azinphos-methyl 614 ug/L
Particle Size Wt.(>0.0625mm) Plumb gm beta-BHC 608 ug/L
Particle Size Wt.(>0.125mm) Plumb gm Cadmium 200.8 ug/L
Particle Size Wt.(>0.25mm) Plumb gm Chromium 200.8 ug/L
Particle Size Wt.(>0.5mm) Plumb gm Copper 200.8 ug/L
Particle Size Wt.(>16mm) Plumb gm delta-BHC 608 ug/L
Particle Size Wt.(>1mm) Plumb gm Demeton-O 614 ug/L
Particle Size Wt.(>2mm) Plumb gm Diazinon 614 ug/L
Particle Size Wt.(>32mm) Plumb gm Dieldrin 608 ug/L
Particle Size Wt.(>4mm) Plumb gm Disulfoton 614 ug/L
Particle Size Wt.(>8mm) Plumb gm Endosulfan-I 608 ug/L
Phorate 8140 ug/Kg Endosulfan-II 608 ug/L
Ronnel 8140 ug/Kg Endosulfan-Sulfate 608 ug/L
Stirphos 8140 ug/Kg Endrin 608 ug/L
Tokuthion 8140 ug/Kg Endrin Aldehyde 608 ug/L
Trichloronate 8140 ug/Kg Endrin Ketone 608 ug/L
Weight Coarse Plumb gm Ethion 614 ug/L
Weight Fine Plumb gm gamma-BHC 608 ug/L
Weight Total Plumb gm gamma-Chlordane 608 ug/L
Zinc 6020 mg/kg Hardness 130.2 mg/L
4,4'-DDD 8080A ug/Kg Heptachlor 608 ug/L
4,4'-DDE 8080A ug/Kg Heptachlor-Epoxide 608 ug/L
4,4'-DDT 8080A ug/Kg Lead 200.8 ug/L
Acenaphthene 8270B ug/Kg Malathion 614 ug/L
Acenaphthylene 8270B ug/Kg Mercury 200.8 ug/L
Aldrin 8080A ug/Kg Methoxychlor 608 ug/L
alpha-BHC 8080A ug/Kg Nickel 200.8 ug/L
alpha-Chlordane 8080A ug/Kg Parathion-ethyl 614 ug/L
Antracene 8270B ug/Kg Parathion-methyl 614 ug/L
Benzo(a)fluoranthene 8270B ug/Kg PCBs 608 ug/L
Benzo(a)pyrene 8270B ug/Kg Toxaphene 608 ug/L
Benzo(b)fluoranthene 8270B ug/Kg Zinc 200.8 ug/L
Benzo(g,h,i)perylene 8270B ug/Kg

19
Salinas Study Area Sediment Chemistry Sites

20
Tissue Bioaccumulation Bivalves are used by the Mussel Watch Program because they are hardy, and because they accumulate certain pollutants in their tissues to levels higher than concentrations of the same substances in surrounding waters. This makes laboratory detection of these substances easier in mollusk tissues than in the water in which these animals are living. California mussels (Mytilus californianus) are the most commonly used bivalve in marine waters, and the freshwater clam (Coribula fluminea) is typically used in fresh water systems. Bivalves are collected from a relatively "clean" control areas and transplanted into areas to be monitored. Bivalves are suspended in nylon-mesh bags in shallow water for four to six weeks, collected without contamination, and analyzed. Fish are also used to assess presence of chemicals which bioaccumulate in tissues. The Toxic Substances Monitoring Program collects resident fish from sampling sites for analysis. The standard analyte list for the State Mussel Watch Program and Toxic Substances Monitoring Program is shown. Bivalves are removed from their shells, blended into three conglomerates (for element samples) or one conglomerate (for organic samples), and prepared for analysis. For trace element samples, three separate sets of approximately 15 animals each are collected at each sample site or "station". For synthetic organic samples, one set of approximately 45 bivalves is collected at each sample station. Shells and byssal threads are not included in any Mussel Watch analyses. For trace element samples, internal body parts, minus the gonads, are analyzed. For synthetic organic samples, all internal body parts are included for analysis. Freshwater clams (Corbicula fluminea) measuring 20-30 mm in length are collected at clean freshwater control areas, and transplanted to sample sites in estuaries and streams where salinity is low and mussels cannot survive. Collection, processing, and analysis of clams are the same as with mussels, except that for trace elements analyses all internal parts of clams (including gonads) are included for analysis and for organic analyses 100 clams per sample are used. Resident fish are collected from selected sites during the fall by the Toxic Substances Monitoring Program. Depending on the habitat being sampled, fish are collected using electrofishing gear or seines. Field and analytical procedures are conducted by the CDFG according to program quality assurance protocols. Chemical analysis of tissue includes hydrocarbons, priority organics, metals, PCBs and other constituents deemed necessary. Composite samples, using six fish of each species, are collected whenever possible. The number and size uniformity of the fish in each composite depends upon their availability. Replicate composites are collected and analyzed to measure the variability of toxicant concentrations in single species composites collected at the same time and place. Collection of the same species from all stations is desirable to minimize possible variation in the data due to differences in pollutant uptake between species. However, this is not always possible due to the variety of habitat sampled and limited collection time available in the program. All reasonable efforts are made to maintain both station-to-station and year-to-year uniformity in collections. Resident fish and transplanted freshwater clams were collected from several sites in the Salinas watershed. Fish were collected primarily in the lower watershed.

21
State Mussel Watch Program Tissue Analyte List Trace Elements Aluminum Nickel Arsenic Lead Cadmium Selenium Chromium Silver Copper Titanium Mercury Zinc Manganese SyntheticOrganicCompounds aldrin ethion cis-chlordane HCH,alpha trans-chlordane HCH,beta chlordene,alpha HCH,gamma chlordene,gamma HCH,delta chlorpyrifos heptachlor dacthal heptachlorepoxide DDD,o,p' HCB DDD,p,p' methoxychlor DDE,o,p' cis-nonachlor DDE,p,p' trans-nonachlor DDMU,p,p' oxadiazon DDT,o,p' oxychlordan DDT,p,p' parathion,ethyl diazinon parathion,methyl dichlorobenzophenone-p,p' PCB1248 dicofol(Kelthane) PCB1254 dieldrin PCB1260 endosulfanI tetradifon(Tedion) endosulfanII toxaphene endrin PolynuclearAromaticHydrocarbons(PAHs) naphthalene fluoranthene 1-methylnaphthalene pyrene 2-methylnaphthalene benz[a]anthracene biphenyl chrysene 2,6-dimethlynaphthalene benzo[b]fluoranthene acenaphthylene benzo[k]fluoranthene 2,3,5-trimethylnaphthalene benzo[e]pyrene fluorene benzo[a]pyrene phenanthrene perylene anthracene indeno[1,2,3-cd]pyrene 1-methylphenanthrene dibenz[a,h]anthracene benz[ghi]perylene

22
Tissue Bioaccumulation Sites in the Salinas Study Area

23
Results Pesticide Use The Department of Pesticide Regulation (DPR) requires that all applications of pesticides in the State of California be reported through County Agricultural Commissioners offices. DPR makes the resulting annual database available for public use on CD-ROM. This database stores information on the date of pesticide application, township/section/range, pesticide type, and crop type. The total poundage of pesticides applied in the Salinas watershed is by far the largest in the Region, exceeding 3,000,000 million pounds per year (DPR, 1994). Total pounds of all chemicals applied, as well as the diversity of chemical types, are shown. The high number of chemicals applied reflects the diversity of crops grown in this “salad bowl” of California. Sulfur is commonly applied to vineyards for mildew and other pests. The remarkable expansion of vineyards in the Salinas Valley, particularly near King City and in the Estrella River Valley, is readily apparent by examining the distribution of sulfur application. Many of these areas of the watershed supported dryland farming or rangeland only a few years ago. Chlorpyrifos and diazinon are organophosphates which are of particular interest in California because of high associated toxicity found in the Sacramento River system. In the Salinas watershed their use is fairly widespread. During the same year CCAMP was investigating the Salinas watershed, the Marine Pollution Studies Laboratory (MPSL) at Granite Canyon was conducting investigations on water column toxicity. MPSL conducted toxicity work in conjunction with water column chemistry and Toxicity Identification Evaluations. Though this work is still being completed, initial findings point to toxicity caused by both of these chemicals. One site in particular (at Quail Creek) showed consistent toxicity associated with high concentrations of both diazinon and chlorpyrifos. The DPR database shows relatively high application rates in this subwatershed. CCAMP data also shows very high values of nitrate, ammonia, and orthophosphate in this vicinity. RWQCB staff are working with growers in this part of the Salinas watershed to address these serious water quality concerns. The MPSL is continuing with studies to isolate toxicity problems on the Salinas watershed.

24
Total Pounds of All Pesticides Applied in the Study Area in 1998

25
Number of Pesticides Applied in the Study Area in 1998

26
Pounds of Sulfur Applied in the Study Area in 1998

27
Pounds of Chlorpyrifos Applied in the Study Area in 1998

28
Pounds of Diazinon Applied in the Study Area in 1998

29
Monitoring Results The following pages describe basic results of CCAMP sampling activities by analyte group. CCAMP is utilizing a basic data display approach which provides both summary maps and bar charts of mean values and data ranges for the analyte of concern. The maps are shown in two scales; one of the entire study area, and one which shows the lower watershed in more detail. Map keys are based on percentage exceedance of CCAMP Action Levels. CCAMP has established both Attention and Action levels; these do not necessarily imply regulatory violation, but are meant to serve as guidelines. Attention levels are intended to identify conditions which warrant further investigation. Action levels are intended to identify conditions which warrant consideration of corrective measures. CCAMP Action levels are set based on Basin Plan Standards when available. For many conventional water quality analytes no standards are available. In these cases, CCAMP Action Levels are set based on information in the literature, from other States’ water quality objectives, or by best professional judgment. Bar Charts show both the sample mean, minimum, and maximum values. Data is shown for individual sites, and for waterbodies. The waterbodies are those which are formally identified in the SWRCB’s Clean Water Act 305(b) report. Data can be examined in a multitude of ways. The results section of this document is organized on an analyte by analyte basis. The Discussion Section is organized on a geographic basis. If the reader is interested in other aspects of data analysis, the data will be available on the CCAMP web site, at www.ccamp.org., or can be requested by email at [email protected]. Conventional Water Quality Conventional water quality monitoring included a number of analytes and descriptive information on site conditions. Results below represent only a screening level analysis of this information. Data is available in the CCAMP data management system for use in TMDL development and other more detailed analysis purposes.

30
CCAMP Action and Attention Levels for Conventional Water Quality Parameters, and Source Information
Analyte Matrix Units Action Attn Action Source Attention Source Oxygen, Dissolved (minimum) H2O mg/l 7 7 Basin Plan Cold Water Fish Basin Plan General Oxygen Saturation (minimum) H2O % 85 85 Basin Plan General Basin Plan General Fecal Coliform Bacteria H2O MPN/100 ml 200 400 Basin Plan Water Body Contact Basin Plan Water Body Contact Total Coliform Bacteria H2O MPN/100 ml 1000 10000 U.S. EPA CCAMP Tentative Boron H2O mg/l 0.5 0.75 Basin Plan Increasing Problems for Ag Basin Plan Ag Objective Chlorophyll A H2O ug/l 15 40 Univ. of Washington Univ. of Washington Chloride H2O mg/l 106 150 Basin Plan Increasing Problems for Ag CCAMP Tentative Conductivity(ppt) H2O ppt 1.5 3 Basin Plan Increasing Problems for Ag Basin Plan Severe Problems for Ag Conductivity(Us) H2O uS 1500 3000 Basin Plan Increasing Problems for Ag Basin Plan Severe Problems for Ag Fecal Coliform Bacteria H2O MPN/100 ml 200 400 Basin Plan Water Body Contact Basin Plan Water Body Contact Fixed Dissolved Solids H2O mg/l 500 1000 CCAMP Tentative CCAMP Tentative Fixed Suspended Solids H2O mg/l 250 500 CCAMP Tentative CCAMP Tentative Water Temperature H2O Celsius 20 22 CCAMP Tentative Moyle (1976) problems for Steelhead Sodium H2O mg/l 3 5 Basin Plan Increasing Problems for Ag CCAMP Tentative Ammonia As N H2O mg/l 0.02 0.025 CCAMP Tentative Basin Plan General Ammonia As NH3 H2O mg/l 0.02 0.025 CCAMP Tentative Basin Plan General Nitrite As N H2O mg/l 0.1 0.15 CCAMP Tentative CCAMP Tentative Nitrite As No2 H2O mg/l 0.3 0.45 CCAMP Tentative CCAMP Tentative Nitrate As N H2O mg/l 1.13 2.25 Williamson, et al. CCAMP Tentative Nitrate As NO3 H2O mg/l 5 10 Williamson, et al. CCAMP Tentative Ortho Phosphate As P H2O mg/l 0.08 0.16 CCAMP Tentative CCAMP Tentative Ortho Phosphate As PO4 H2O mg/l 0.25 0.5 CCAMP Tentative CCAMP Tentative pH (maximum) H2O pH units 8.3 8.5 Basin Plan Cold Water Basin Plan Cold Water pH (minimum) H2O pH units 7 7 Basin Plan Cold Water Basin Plan Cold Water Phosphate, Total H2O mg/l 0.16 0.7 adapted from Williamson et al. CCAMP Tentative Salinity H2O mg/l 1.5 3 Basin Plan Increasing Problems for Ag Basin Plan Severe Problems for Ag Total Coliform Bacteria H2O MPN/100 ml 1000 10000 U.S. EPA CCAMP Tentative Total Dissolved Solids H2O mg/l 500 1000 CCAMP Tentative CCAMP Tentative Total Suspended Solids H2O mg/l 250 500 CCAMP Tentative CCAMP Tentative Turbidity H2O NTU 5 10 CCAMP Tentative Dry Season CCAMP Tentative Dry Season Volatile Dissolved Solids H2O mg/l 500 1000 CCAMP Tentative Dry Season CCAMP Tentative Dry Season

31
pH

32
pH
pH levels overall are high in the study area, with most sites averaging over 8.0. The large number of CCAMP Action level exceedances generally result from pH levels in excess of 8.5. This was particularly true in areas of high Total Dissolved Solids, including sites under tidal influence and San Lorenzo and Estrella watersheds. Sites which fell occasionally below the lower CCAMP Action level of 7.0 included sites which were typically fresher, and which had high levels of nutrients and signs of eutrophication. These included Quail Creek and Carneros Creek.

33
Dissolved Oxygen

34
Dissolved Oxygen
The Salinas River serves as a migration corridor for threatened steelhead trout and one of its beneficial uses is Cold Water Habitat. Its upper tributaries, including the Arroyo Seco River, the San Antonio River, the Nacimiento River, Atascadero Creek and others, support year round trout habitat. For this beneficial use the Basin Plan standard for dissolved oxygen is 7.0 mg/l, much more restrictive than the 5.0 mg/l standard for most other beneficial uses. The CCAMP Action level is also set at 7.0 mg/l. Oxygen levels at most main stem Salinas sites rarely if ever dropped below the Basin Plan standard, unless water flow was extremely low. Several sites, (mainly between the San Antonio River and the Chualar Bridge) showed excursions below 7.0 mg/l during dawn sampling, but never dropped below 5.0. The Salinas River site at Paso Robles dropped below 5.0 just before drying up in July.

35
Tributaries to the Salinas with high dissolved oxygen levels overall included the San Antonio, San Lorenzo, Quail, and Nacimiento rivers. The Nacimiento had brief excursions below 7.0 and above 12.0 when flows were low. The Arroyo Seco River dropped below 5.0 several times, primarily during dawn sampling. The Estrella River dried up completely at the sampling site by March. Its tributary, Cholame Creek, had oxygen levels depressed below 5.0 mg/l in July, and dried up entirely in August. Atascadero Creek was notable regarding low oxygen concentrations because, though it never dried up, its oxygen levels were depressed below 7.0 mg/l consistently throughout the summer and fall. This site had a fairly large amount of periphyton covering the substrate during summer and fall months. Other waterbodies sampled in this study showed more problems with dissolved oxygen than did the Salinas and its tributaries. Moro Cojo Slough oxygen levels were particularly depressed, dropping as low as 0.8 mg/l. Other sloughs had less severe oxygen depressions, though the Old Salinas River had excursions below 5.0 mg/l during dawn sampling. The Elkhorn Slough site and its upstream tributary, Carneros Creek, both had depressed oxygen levels in summer months below 5.0 mg/l with signs of super-saturation as well. Oxygen levels in the Salinas Reclamation Canal (in the Alisal Creek watershed) were very depressed in summer and fall, both at the upper and lower boundaries of the City of Salinas. Gabilan Creek, a tributary to Alisal Creek, did not show any oxygen depression, though it did dry up in the later summer.
Dissolved Oxygen Levels in Atascadero Creek, 1999 (mg/l)
Salinas: ATS
0
2
4
6
8
1 0
1 2
DO
_PPM
: mg/
l

36
Dissolved oxygen levels are highly depended on other environmental factors, including temperature, flow, and biological activity. For example, Nacimiento River at Highway 101 showed a large fluctuation in dissolved oxygen (55 and 113 % saturation) between pre-dawn and mid day measurements on July 1st . This fluctuation coincided with lower flow levels, slightly warmer water temperature and the highest level of periphyton observed at the site during the study. Subsequent pre-dawn oxygen measurements (on 7/29 and 9/2) showed smaller fluctuations in dissolved oxygen. These measurements coincided with slightly cooler waters (approximately 2 degrees C) and very high flow, resulting from upstream reservoir releases at that time.
Dissolved oxygen, water temperature, and qualitative periphyton observations on
Nacimiento River, 1999
(Oxygen saturation (%) and periphyton cover (%) is shown on left axis, water temperature (Co) is shown on right axis)
0
20
40
60
80
100
120
140
160
2/2/
99
2/16
/99
3/2/
99
3/16
/99
3/30
/99
4/13
/99
4/27
/99
5/11
/99
5/25
/99
6/8/
99
6/22
/99
7/6/
99
7/20
/99
8/3/
99
8/17
/99
8/31
/99
9/14
/99
9/28
/99
10/1
2/99
10/2
6/99
11/9
/99
11/2
3/99
12/7
/99
12/2
1/99
1/4/
00
1/18
/00
2/1/
00
0
5
10
15
20
NAC(DO_SAT) NAC(Periphy) NAC(H2OTEMP)

37
Water Temperature

38
Water Temperature
The CCAMP Action level for water temperature is set at 22.0oC, because temperatures in excess of this become stressful for steelhead trout (Moyle, 1976). On average, temperature at most sites stayed below 18oC. Excursions over 22o generally occurred on the mainstem of the Salinas in its middle reaches, from Paso Robles to the Chualar Bridge, where riparian shading is minimal and flow can be greatly reduced due to agricultural diversion. Particularly high temperatures (in excess of 25o) were recorded in the vicinity of Greenfield, King City, and San Ardo in mid-summer. San Lorenzo Creek reached an astonishing 35.6o in mid-July before drying up in August. It showed temperature swings in excess of 15o between dawn and mid-day measurements during this time. Temperature also exceeded 22oC during summer low flow periods at the Arroyo Seco, Quail Creek, and Estrella River sampling sites (Estrella Creek dried up very early in the season and little data is available). Moro Cojo Slough also exceeded the CCAMP Action level, with several elevated values in the summer.

39
Nitrate

40
Nitrate
This study area includes a number of areas with extremely high concentrations of nitrate. The CCAMP Action level for nitrate (as NO3) is 10 mg/l. This is considerably lower than the Basin Plan drinking water standard (45 mg/l). CCAMP has documented excessive algal blooms associated with nitrate concentrations even lower than the Action level (Pajaro watershed, 1998). Most sites in the Salinas watershed from King City upstream remained below the Action level at all times. Exceptions in the upper watershed included the Estrella River and its tributary, Cholame Creek (which reached 20 mg/l). Downstream of King City, nitrate levels climbed to reach a high at Davis Road, with an average of 46 mg/l and maximum of 172 mg/l. Most of this increase occurred between the Chualar Bridge and the Davis Road bridge. The storm drain entering the Salinas River immediately above Davis Road averaged 135 mg/l. Quail Creek, the only tributary sampled between the Chualar Bridge and the Davis Road Bridge, had the highest nitrate levels documented during the study, averaging 124 and peaking at 417 mg/l.

41
Old Salinas River sites and those on the Tembladero watershed in particular, had greatly elevated nitrate levels. Nitrate levels were high in the Salinas Reclamation Canal at the upper end of the City of Salinas at Airport Road (average 62 mg/l), declined somewhat at the downsteam end of the City, and then increased again at the lower Tembladero site in Castroville (average 89 mg/l). Elkhorn Slough and its tributary, Carneros Creek, did not have elevated nitrate levels, nor did the Moro Cojo Slough site.
Nitrate (mg/l as NO3) on Salinas River at Chualar bridge upstream of Quail Creek (SAC), at Quail Creek (QUA), and downstream Salinas at Davis Road (DAV)
Nitrate (mg/l as NO3) on the Salinas Reclamation Canal at Airport Rd. (ALU), Tembladero Slough at Preston Rd. (TEM), and Old Salinas River at Potrero Rd. (POT)
050
100150200250300350400450
2/1/
99
3/1/
99
4/1/
99
5/1/
99
6/1/
99
7/1/
99
8/1/
99
9/1/
99
10/1
/99
11/1
/99
12/1
/99
1/1/
00
2/1/
00
3/1/
00
4/1/
00
5/1/
00
SAC(NO3_NO3) QUA(NO3_NO3) DAV(NO3_NO3)
020406080
100120140160180200
2/1/
99
2/15
/99
3/1/
99
3/15
/99
3/29
/99
4/12
/99
4/26
/99
5/10
/99
5/24
/99
6/7/
99
6/21
/99
7/5/
99
7/19
/99
8/2/
99
8/16
/99
8/30
/99
9/13
/99
9/27
/99
10/1
1/99
10/2
5/99
11/8
/99
11/2
2/99
12/6
/99
12/2
0/99
1/3/
00
1/17
/00
1/31
/00
2/14
/00
2/28
/00
ALU(NO3_NO3) TEM(NO3_NO3) POT(NO3_NO3)

42
Nitrate Concentrations (mg/l) on the main stem of the Salinas River, upstream to downstream
0
20
40
60
80
100
120
140
160
180
200
SAT PSO SUN USA DSA KNG GRN SAC DAV SBR
Salinas River Sites
Nitr
ate
(mg/
l)

43
Nitrite
Highest nitrite concentrations by far were found in the Salinas Reclamation Canal above and below the City of Salinas. Other sites in the Tembladero and Old Salinas River systems also had elevated concentrations. Nitrite is a relatively unstable form of nitrogen and is rarely found in such high concentrations.
Nitrite (mg/l as NO2) at the Salinas Reclamation Canal, above (ALU) and below (ALD) the City of Salinas
0
2
4
6
8
10
12
14
2/1/
99
2/15
/99
3/1/
99
3/15
/99
3/29
/99
4/12
/99
4/26
/99
5/10
/99
5/24
/99
6/7/
99
6/21
/99
7/5/
99
7/19
/99
8/2/
99
8/16
/99
8/30
/99
9/13
/99
9/27
/99
10/1
1/99
10/2
5/99
11/8
/99
11/2
2/99
12/6
/99
12/2
0/99
1/3/
00
1/17
/00
1/31
/00
ALD(NO2_NO2) ALU(NO2_NO2)

44
Ammonia

45
Ammonia
Like nitrite concentrations, extraordinarily high ammonia concentrations were found in the Salinas Reclamation Canal above and below the City of Salinas. The downstream site (ALD), as well as Tembladero Slough (TEM) farther downstream, appeared to have a seasonal increase in late fall. Other sites in the Tembladero and Old Salinas River systems also had very elevated concentrations, as did Carneros Creek and Quail Creek. Concentrations found at these sites exceeded the Basin Plan standard of 0.025 mg/l by many fold. The upper Salinas watershed and tributaries had relatively low concentrations of ammonia, but were still often above the Basin Plan standard. Ammonia is a relatively unstable form of nitrogen. Such high levels of unionized ammonia may reflect a reducing environment Recent EPA guidance describes the relationship of pH and temperature to ammonia toxicity. At high pH and temperature , ammonia levels become increasingly toxic. The levels seen at many sites in the watershed probably have resulted in an acutely toxic environment for many aquatic species. Ammonium-based fertilizers as well as animal wastes are common sources.
46
Unionized am
monia (N
H3) concentrations at the upper (A
LU) and low
er (ALD
) Salinas R
eclamation C
anal sites, and downstream
Tembladero Slough (TEM
)
A
mm
onia Levels (mg/l as N
H3) on Q
uail Creek (Q
UA
) and Carneros C
reek (CA
R)
0 1 2 3 4 5 6 7 8
2/1/99
2/15/99
3/1/99
3/15/99
3/29/99
4/12/99
4/26/99
5/10/99
5/24/99
6/7/99
6/21/99
7/5/99
7/19/99
8/2/99
8/16/99
8/30/99
9/13/99
9/27/99
10/11/99
10/25/99
11/8/99
11/22/99
12/6/99
12/20/99
1/3/00
1/17/00
1/31/00
2/14/00
2/28/00
ALU(N
H3_N
H3)
ALD
(NH
3_NH
3)TEM
(NH
3_NH
3)
0
0.5 1
1.5 2
2.5 3
3.5 4
2/1/99
2/15/99
3/1/99
3/15/99
3/29/99
4/12/99
4/26/99
5/10/99
5/24/99
6/7/99
6/21/99
7/5/99
7/19/99
8/2/99
8/16/99
8/30/99
9/13/99
9/27/99
10/11/99
10/25/99
11/8/99
11/22/99
12/6/99
12/20/99
1/3/00
1/17/00
1/31/00
2/14/00
2/28/00
QUA
(NH
3_NH
3)C
AR
(NH
3_NH
3)

47
Ammonia concentrations on the mainstem of the Salinas River can be seen to increase from upstream to downstream, peaking at the Davis Road bridge crossing, where variability is also at its highest.
Ammonia concentrations (mg/l) on the main stem of the Salinas River, from upstream to downstream
0.000
0.100
0.200
0.300
0.400
0.500
0.600
0.700
0.800
0.900
1.000
SAT PSO SUN USA DSA KNG GRN SAC DAV SBR
Salinas River Sites
Am
mon
ia (m
g/l)

48
Total Kjeldahl Nitrogen
Total Kjeldahl nitrogen is the sum of organic nitrogen including ammonia. It is generally elevated when a large amount of dead plant material or other organic debris is present in the water. Highest levels of Kjeldahl nitrogen were generally found in fall in San Lorenzo Creek, Quail Creek, and Carneros Creek. The San Lorenzo peak, which occurred in January, was unusual in that the creek had very low values up until that point. Concurrent peaks in chlorophyll a, turbidity and total phosphate were also detected there, suggesting a large amount of organic debris in the sample. The Salinas Reclamation Canal also had elevated Kjeldahl levels. High levels of ammonia certainly contributed to this, however, many of these same sites also had high levels of chlorophyll a, indicating possible algal blooms.

49
Orthophosphate (as PO4)

50
Orthophosphate (as PO4)
Orthophosphate, the dissolved inorganic form of phosphorus, is the most readily available form for utilization by plant species. The CCAMP Action level is tentatively set at 0.5 mg/l. A large proportion of sites averaged more than this level, primarily at the lower end of the Salinas watershed and in more northerly sloughs. Carneros Creek had extremely high orthophosphate levels, particularly in the fall and winter. Many of the same sites which have very high levels of nitrate have correspondingly high levels of orthophosphate. This implies that neither of these nutrients is limiting algal growth in these systems. This was true in the Salinas Reclamation Canal and much of the Tembladero watershed. On the Salinas River, orthophosphate is relatively low in the upper watershed, with the exception of the Salinas upstream of Nacimiento River (SUN), where it increases significantly. Orthophosphate levels are much more variable downstream, particularly at Davis Road, where it ranged as high as 1.8 mg/l.

51
Orthophosphate levels (mg/l as PO4) at Carneros Creek (CAR), 1999
Orthophosphate concentrations (mg/l) on main stem Salinas River sites, from upstream to downstream
Salinas: CAR
0
2
4
6
8
1 0
1 2
1 4
OP_
PO4:
mg/
l
0.00
0.20
0.40
0.60
0.80
1.00
1.20
1.40
1.60
1.80
2.00
SAT PSO SUN USA DSA KNG GRN SAC DAV SBR
Salinas River Sites
Ort
ho-p
hosp
hate
(mg/
l)

52
Chlorophyll a

53
Chlorophyll a
For the most part, sites on the upper Salinas watershed (south of King City) had chlorophyll a values below the CCAMP action level of 40 mg/l at all times. The exception to this was in the vicinity of the City of Atascadero (SAT), where chlorophyll a values reached 79 mg/l. Compared to downstream, nutrient levels here were relatively low. Sites on the lower Salinas watershed and tributary sloughs had generally elevated chlorophyll a values. Tembaldero Slough, for example, repeatedly exceeded the CCAMP Action level of 40 mg/l, averaging 205 mg/l, and only dropping below 40 mg/l during late winter and spring.

54
Highest chlorophyll a values were found in Carneros Creek (CAR) at almost 1000 mg/l, many-fold the CCAMP Action level. Coincident increases in volatile suspended solids and Kjeldahl nitrogen reflect the large amount of organic material present. Nitrate levels were relatively low, particularly during peak chlorophyll a events, implying much of it was tied up in plant material. Chlorophyll a concentrations increased directly with Ortho-phosphate until winter months, when it declined. For example, at the September chlorophyll a peak of 970 mg/l, nitrate was only 0.62 mg/l while phosphate was 7.1 mg/l.
Chlorophyll a, Nitrate, and Orthophosphate Concentrations at Carneros Creek (CAR), 1999
Chlorophyll a values at upper and lower Salinas Reclamation Canal (ALU and ALD) and at Tembladero Slough at Preston Road (TEM), 1999
0
200
400
600
800
1000
1200
3/1/
99
4/1/
99
5/1/
99
6/1/
99
7/1/
99
8/1/
99
9/1/
99
10/1
/99
11/1
/99
12/1
/99
1/1/
00
2/1/
00
3/1/
00
Chl
orop
hyll
a (m
g/l)
0
2
4
6
8
10
12
14 Nitrate and O
rthophosphate (mg/l)
CAR(CHLORA) CAR(NO3_NO3) CAR(OP_PO4)
0
100
200
300
400
500
600
700
2/1/
99
2/15
/99
3/1/
99
3/15
/99
3/29
/99
4/12
/99
4/26
/99
5/10
/99
5/24
/99
6/7/
99
6/21
/99
7/5/
99
7/19
/99
8/2/
99
8/16
/99
8/30
/99
9/13
/99
9/27
/99
10/1
1/99
10/2
5/99
11/8
/99
11/2
2/99
12/6
/99
12/2
0/99
1/3/
00
1/17
/00
1/31
/00
2/14
/00
2/28
/00
TEM(CHLORA) ALD(CHLORA) ALU(CHLORA)

55
Fecal Coliform

56
Fecal Coliform
The CCAMP Action level for fecal coliform is 400 MPN/100ml, a Basin Plan standard for water body contact (no more than 10% of samples should exceed 400 in a 30 day period). Most of the Salinas watershed was unimpaired by fecal coliform bacteria. Though some sites on occasion exceeded 400 MPN/100 ml, the majority of the Salinas River and its tributaries remained below this level. San Antonio River and Atascadero Creek were had higher concentrations than most other sites, though few exceedingly high values were recorded. Three tributaries were notable exceptions: San Lorenzo, Quail, and Cholame. All three were regularly in violation of body contact water quality standards and had continuously elevated coliform levels through most of the study period. For the most part, sloughs and sites with high salt water influence had low overall fecal coliform levels. All of these sites showed peaks in February, when winter storm flows were high. Highest values seen in this study were associated with the Tembladero system. Of particular note was the Salinas Reclamation Canal. In several instances, fecal coliform levels from this water body exceeded the maximum measurable lab limit of 160,000 MPN/100ml. The upstream site at Airport Road (ALU) in the City of Salinas was particularly bad, which led to additional

57
CCAMP sampling upstream and addition of an upstream storm drain input (AXX). Both of these added sites had elevated coliform levels as well. Based on the limited amount of data collected on all three sites, it appears that the storm drain is most closely tracking elevated coliform levels at ALU Gabilan Creek, draining into the Tembladero system, also had coliform levels continuously elevated over 200 MPN/100 ml, as did Tembladero Slough in Castroville.
Fecal Coliform levels (MPN/100 ml) at the Salinas Reclamation Canal at Airport Road (ALU),
at the upstream storm drain (AXX), and at Alisal Creek upstream of its junction with the Reclamation Canal (UAL), 1999
020000400006000080000
100000120000140000160000180000
2/1/
99
2/15
/99
3/1/
99
3/15
/99
3/29
/99
4/12
/99
4/26
/99
5/10
/99
5/24
/99
6/7/
99
6/21
/99
7/5/
99
7/19
/99
8/2/
99
8/16
/99
8/30
/99
9/13
/99
9/27
/99
10/1
1/99
10/2
5/99
11/8
/99
11/2
2/99
12/6
/99
12/2
0/99
1/3/
00
1/17
/00
1/31
/00
ALU(FCOLI) AXX(FCOLI) UAL(FCOLI)

58
Turbidity

59
Turbidity
As with many other pollutants, turbidity and suspended solids tended to be relatively low in the upper Salinas watershed. Generally, higher levels of turbidity and suspended solids were associated with nutrient enriched areas. Highest turbidity values were seen on San Lorenzo Creek, coincident with a large amount of organic material in the water in a January sample when flows were very high. This finding is supported by the high amounts of volatile suspended solids during this event (29,500 mg/l) compared to fixed suspended solids (921 mg/l). The CCAMP Action levels is set at 10 NTUs. This value is very low for turbidity resulting from winter storm events, but represents elevated turbidity during the rest of the year, when suspended sediments are typically not elevated. For example, both Gabilon and Quail creeks had elevated summer turbidity levels, probably because of nutrient overenrichment and algal growth. The large number of exceedances of this value found in the study result from elevated turbidity levels in both winter and summer months.
Examples of elevated dry season turbidity levels, on Quail (QUA) and
Gabilon (GAB) Creeks, 1999
0
200
400
600
800
1000
1200
1400
1600
2/1/
99
2/15
/99
3/1/
99
3/15
/99
3/29
/99
4/12
/99
4/26
/99
5/10
/99
5/24
/99
6/7/
99
6/21
/99
7/5/
99
7/19
/99
8/2/
99
8/16
/99
8/30
/99
9/13
/99
9/27
/99
10/1
1/99
10/2
5/99
11/8
/99
11/2
2/99
12/6
/99
12/2
0/99
1/3/
00
1/17
/00
1/31
/00
NTU
s
GAB(TURB_N) QUA(TURB_N)

60
Fixed Suspended Solids
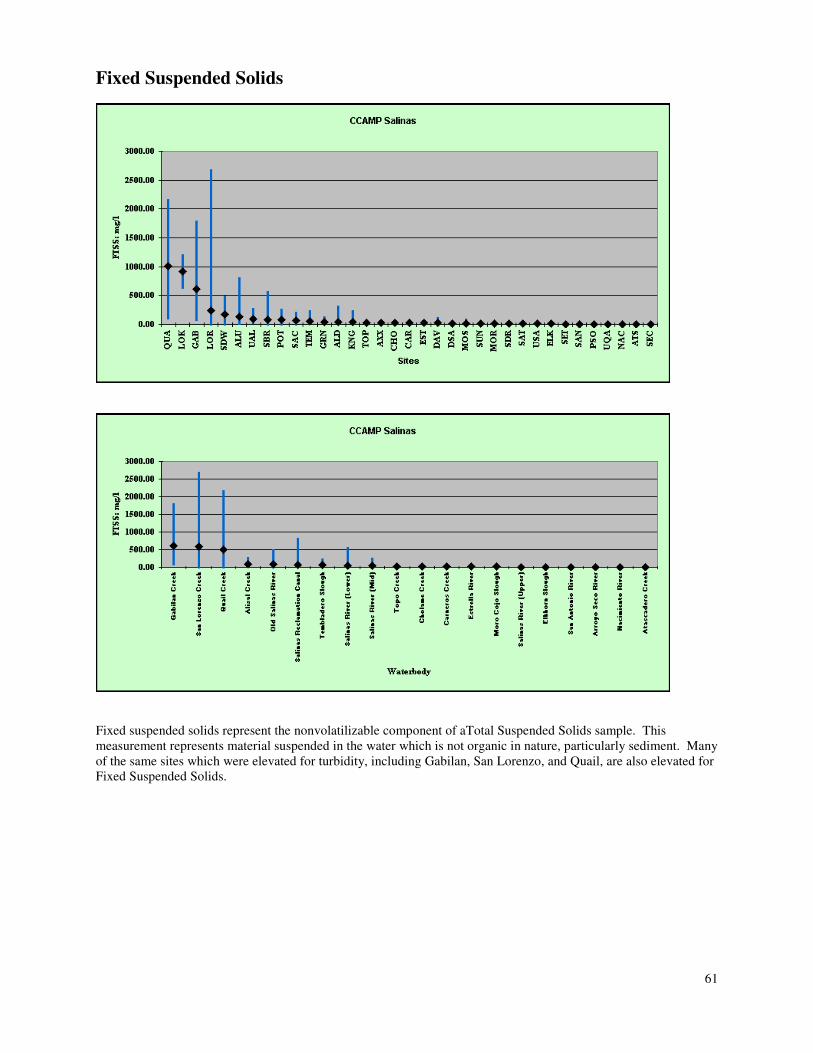
61
Fixed Suspended Solids
Fixed suspended solids represent the nonvolatilizable component of aTotal Suspended Solids sample. This measurement represents material suspended in the water which is not organic in nature, particularly sediment. Many of the same sites which were elevated for turbidity, including Gabilan, San Lorenzo, and Quail, are also elevated for Fixed Suspended Solids.

62
Fixed Dissolved Solids

63
Fixed Dissolved Solids
Salt concentrations at a number of sites were clearly influenced by proximity to the ocean and tidal action. Elkhorn Slough, Moro Cojo Slough, and Moss Landing sites were nearly entirely sea water, and others on the Old Salinas River, lower Salinas River (from Highway 1 to the mouth), Carneros Creek, and the lower Tembladero Slough site were within tidal influence. These sites aside, highest salt concentrations were generally seen on tributaries entering the Salinas River from the east side of the watershed. These include the Estrella River and its tributary Cholame Creek, and San Lorenzo Creek. Both the Cholame and the San Lorenzo Creek sites were collected on “Bitterwater Road”. This name is assuredly an old reference to the high levels of salts in this part of the Salinas Valley. Salts analyzed in this study included sodium, calcium, magnesium, boron, and chloride. Total dissolved solids is a measure of salts and other dissolved chemicals in the water. Site specific objectives (annual mean) are relatively low for the upper Salinas watershed above Bradley (250 mg/l), San Antonio (250 mg/l), and Nacimiento Rivers (200 mg/l). Nacimiento River (NAC) met its site specific objective with an annual average of 182 mg/l. However none of the other upper watershed sites did, with the lowest annual average in the vicinity of San Ardo (DSA) at 292 mg/l. The Salinas River at Paso Robles (PSO) and Atascadero Creek where it enters the

64
Salinas (ATS) were particularly high, averaging 560 mg/l and 715 mg/l respectively. Between Spreckles and Bradley the site specific objective is increased to 600 mg/l. All sites in this reach met this objective.
Fixed Dissolved Solids levels at three eastern watershed tributaries (Estrella (EST), Cholame (CHO), and San Lorenzo (LOR), 1999)
The site specific objective for Boron in the upper watershed is 0.2; most sites easily met this objective. Again, major exceptions outside of saltwater influence were eastern Salinas tributaries, including the Estrella River and its tributary Cholame Creek, and San Lorenzo Creek.
Boron Concentrations (mg/l) at the Estrella River (EST), Cholame Creek (CHO), and San Lorenzo Creek (SAN)
0
1000
2000
3000
4000
5000
6000
2/2/
99
2/16
/99
3/2/
99
3/16
/99
3/30
/99
4/13
/99
4/27
/99
5/11
/99
5/25
/99
6/8/
99
6/22
/99
7/6/
99
7/20
/99
8/3/
99
8/17
/99
8/31
/99
9/14
/99
9/28
/99
10/1
2/99
10/2
6/99
11/9
/99
11/2
3/99
12/7
/99
12/2
1/99
1/4/
00
1/18
/00
2/1/
00
EST(FTDS) CHO(FTDS) LOR(FTDS)
0
1
2
3
4
5
6
2/2/
99
2/16
/99
3/2/
99
3/16
/99
3/30
/99
4/13
/99
4/27
/99
5/11
/99
5/25
/99
6/8/
99
6/22
/99
7/6/
99
7/20
/99
8/3/
99
8/17
/99
8/31
/99
9/14
/99
9/28
/99
10/1
2/99
10/2
6/99
11/9
/99
11/2
3/99
12/7
/99
12/2
1/99
1/4/
00
1/18
/00
2/1/
00EST(BORON) CHO(BORON) LOR(BORON)

65
Chloride
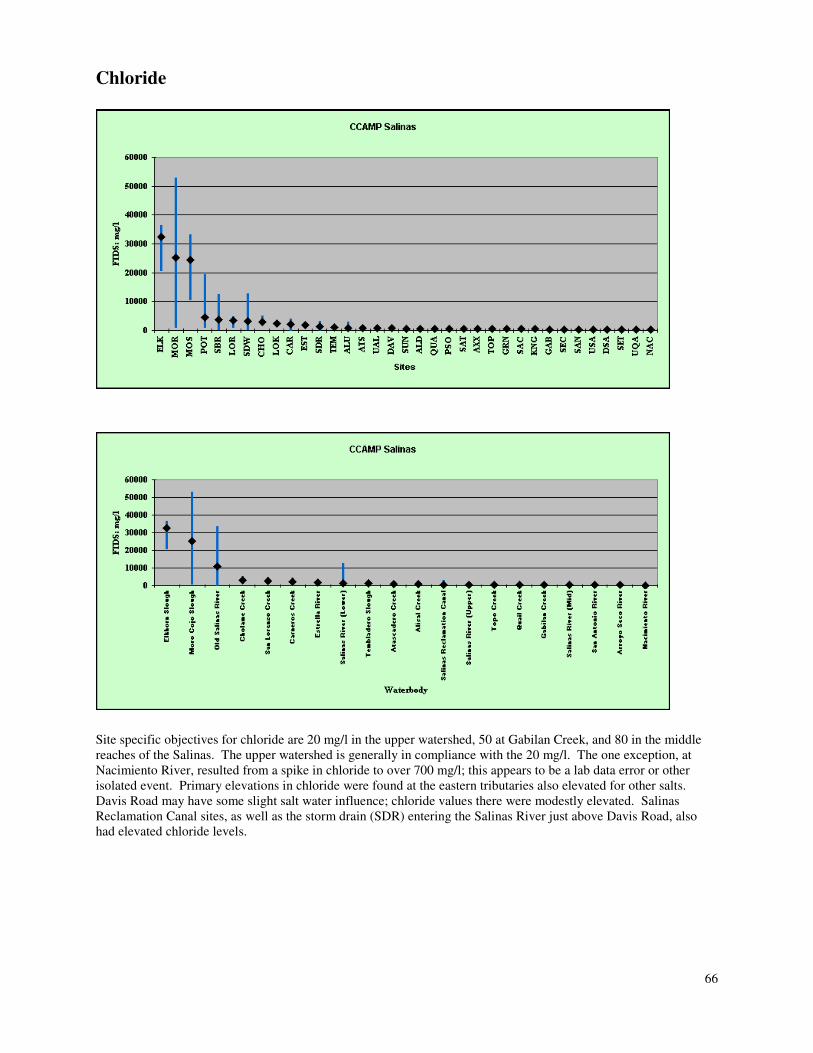
66
Chloride
Site specific objectives for chloride are 20 mg/l in the upper watershed, 50 at Gabilan Creek, and 80 in the middle reaches of the Salinas. The upper watershed is generally in compliance with the 20 mg/l. The one exception, at Nacimiento River, resulted from a spike in chloride to over 700 mg/l; this appears to be a lab data error or other isolated event. Primary elevations in chloride were found at the eastern tributaries also elevated for other salts. Davis Road may have some slight salt water influence; chloride values there were modestly elevated. Salinas Reclamation Canal sites, as well as the storm drain (SDR) entering the Salinas River just above Davis Road, also had elevated chloride levels.

67
Sodium
Though sodium levels in the upper watershed (above Bradley) were generally low, only a few sites, including Nacimiento, and the Salinas River in the vicinity of San Ardo, met the site specific objective of 20 mg/l as an annual average. Lower in the watershed the objective is increased to 70; all mainstem sites above Spreckles met this objective. The storm drain entering the Salinas above Davis Road (SDR) had high levels of sodium, as did upper Salinas Reclamation Canal (ALU).

68
Organic Chemicals and Metals Sediment samples were collected at thirty sites in the study area. Each site was also a water quality sampling site and a subset of these sites were sampled for benthic invertebrates and tissue bioaccumulation. Each sample was analyzed for sediment particle size and total organic content, as well as the synthetic organic chemicals and metals described in the Methods section. Sampling targeted fine-grained sediments, in order to maximize detection of potential problem chemicals. Analysis for a wide variety of organic chemicals and metals in sediment was conducted. Not all chemicals were detected. The following charts depict the concentrations of analytes which were detected at levels of interest. Samples which were reported as non-detects were assigned one half of the minimum detection limit and appear as low values on the right side of each chart. In some cases laboratory detection limits were higher than threshold values of concern. CCAMP Action and Attention Levels for these analytes were set using the NOAA Effects Range Median (ERM) and NOAA Effects Range Low (ERL) (Long and Morgan, 1990), and the Probable Effects Level (PEL) and Threshold Effects Level (TEL) (MacDonald, 1994). All of these values are calculated using existing datasets which include information on both toxic effects and chemical concentrations. The ERM is the median (or 50th percentile) concentration of all toxic samples. The ERL is calculated in the same fashion as the ERM, but represents the 10th percentile of the samples showing toxicity. More recent evaluations (Long, et al., 1998) indicate that a toxicity of approximately 38% is associated with the ERL level. The PEL and TEL limits are based on a similar compilation of data but are calculated differently. These values are used by the State of Florida. The TEL is the geometric mean of the 15th percentile concentration of the toxic effects data set and the 50th percentile of the no-effect data set; below this value toxic effects are expected only occasionally. The PEL is the geometric mean of the 50th percentile of toxic samples and the 85th percentile of the no-effect data set. Adverse effects are expected frequently over this level. Unfortunately, sediment quality guideline values have not been established for all chemicals of concern. Additional information about chemical groups of interest is available from the Agency for Toxic Substances and Disease Registry (ATDSR, 1999), the Cooperative Extension Toxicology Network Pesticide Information Profiles (EXTOXNET), and the U.S. EPA Integrated Risk Information System (IRIS). These organizations provide web sites which include information on acute and chronic toxicity, human and organismal health risk, environmental fate and transport, and other relevant information.
Sediment Particle Size - Sediment samples had particle sizes of relatively low variability, with percentage clay ranging from a high of 75% at Arroyo Seco to a low of 40% at King City. Silt made up the remaining fraction. These samples were presorted prior to analysis for particle sizes of 100 microns and less since samples with high percentages of coarse material do not typically reveal the presence of chemicals bound to fine sediments. Though high concentrations are clearly indicative of problems, low concentrations are not themselves conclusive, and must be interpreted in the context of a sample's sediment particle size.

69
CCAMP Action and Attention Levels, and Source Information, for Chemicals in Sediment Analyte Matrix Units Action Attn Action Source Attention Source Cadmium SED mg/kg 1.2 9.6 NOAA ERL NOAA ERM Chromium SED mg/kg 81 370 NOAA ERL NOAA ERM Copper SED mg/kg 34 270 NOAA ERL NOAA ERM Mercury SED mg/kg 0.15 0.71 NOAA ERL NOAA ERM Nickel SED mg/kg 20.9 51.6 NOAA ERL NOAA ERM Lead SED mg/kg 46.7 218 NOAA ERL NOAA ERM Anthracene SED ug/kg 0.0853 1.1 NOAA ERL NOAA ERM Chlordane, cis SED ug/kg 0.0005 0.006 NOAA ERL NOAA ERM P,P'-DDE SED ug/kg 0.0022 0.027 NOAA ERL NOAA ERM P,P'-DDT SED ug/kg 0.00158 0.0461 NOAA ERL NOAA ERM Dieldrin SED ug/kg 0.00002 0.0008 NOAA ERL NOAA ERM Endrin SED ug/kg 0.00002 0.045 NOAA ERL NOAA ERM Chlordene, Gamma SED ug/kg 0.0005 0.006 NOAA ERL NOAA ERM Fluorene SED ug/kg 0.019 0.54 NOAA ERL NOAA ERM Naphthalene SED ug/kg 0.16 2.1 NOAA ERL NOAA ERM Acenaphthene SED ug/kg 0.016 0.5 NOAA ERL NOAA ERM Acenaphthylene SED ug/kg 0.12789 0.00587 NOAA ERL NOAA ERM PCB, Total SED ug/kg 0.0227 0.18 NOAA ERL NOAA ERM

70
Arsenic
Arsenic is found in iron minerals, and in bedrock at levels up to 38 ppm. It has several industrial uses, and is also used as a chicken feed supplement to increase growth rate. Chicken fertilizer is often used as a fertilizer, and can thus act as a source of arsenic. Majmundar (1980) describes the upper threshold of arsenic in unpolluted stream sediments of the Salinas Basin at 9.25 ppm. Only one site, Elkhorn Slough, exceeds this level. The source of this is uncertain, but given high nutrient levels in the vicinity, chicken fertilizer may be a potential source.
Barium
Barium is always found in combination with other elements, and makes up 0.04% of the earth's crust. It has a number of medical and industrial applications including petroleum mining, and is used in some rat poisons. It was found at highest levels at Gabilan Creek, but no distinctly elevated sites were found.

71
Chromium

72
Chromium
Chromium, along with nickel, is common in soils in portions of the Region, particularly in San Luis Obispo County, where serpentine soils are present. Chromium is used in production of pigments, anti-corrosives, wood preservatives and other applications. Chromium is most toxic in the Chromium VI form, because of its high oxidizing potential. In the Salinas watershed sampling effort, chromium was not found at elevated levels. This is consistent with the findings of the CCAMP Coastal Confluence sampling, which identified several locations in coastal San Luis County with high levels of chromium, but only one in Monterey County, in Moss Landing, where a known chromium slag pile is located.

73
Cobalt
Cobalt is found in a number of ores, including sulfides and arsenides. It is produced as an industrial byproduct of copper, nickel, and lead. No unusually elevated levels of cobalt were detected.
Copper
Copper has many anthropogenic sources, including wastewater discharges, antifouling paints, algicides, metal plating operations, wood preservatives, and others. Although an essential micronutrient, it is also acutely toxic in relatively small concentrations, particularly to aquatic biota. Majmundar (1980) cites worldwide average copper levels in soil at 20 mg/kg. Though two sites exceeded this level, none were elevate above the CCAMP Action level.

74
Lead
Lead used to commonly be used in paints and gasoline additives. Its use has been greatly reduced in recent years. Lead has no necesssary biological function and is toxic to most organisms. It affects virtually all physiological systems. Majmundar (1980) cites worldwide average lead levels in soil at 10 mg/kg. The Salinas Reclamation Canal had lead levels considerably higher than any other sites sampled, but well under the CCAMP Action level of 218 mg/kg.

75
Nickel

76
Nickel
Nickel, along with chromium, is common in the serpentine soils of the Central Coast. Nickel levels found in this study are likely due to natural sources. However, it is also used in industrial applications, particularly plating and circuit board production. Nickel is a lung carcinogen and is also toxic to several physiological systems, including nervous, reproductive, and immunological. Many sites in the Salinas study area exceeded the CCAMP Action level of 51.6 mg/kg (derived from NOAA ERM levels). However, these levels were relatively low compared to ambient levels detected in San Luis Obispo County by the CCAMP 1998 Coastal Confluences sampling (shown below).

77
Zinc
Zinc is an important micronutrient and is ubiquitous in the environment. A major use of zinc is galvanization of other metals to protect from corrosion It is also widely used in batteries, vehicle tires, and corrosion protective devices in boats and ships. Zinc is a common pollutant in urban stormwater runoff. Toxicity requires a relatively high level of exposure, both for humans and in the aquatic environment. The CCAMP Action level for zinc is based on the NOAA ERM of 410 mg/kg. No values in the study area exceeded this level. However, levels in Salinas Reclamation Canal sediments exceeded the CCAMP Attention level of 150 mg/kg.

78
p,p DDE

79
p,p DDE

80
p,p DDT
DDT and its metabolites were detected at several sites at the lower end of the study area, particularly in the Old Salinas River at Potrero Road where ERM values were exceeded for p,p DDE. Lesser amounts were found in the lower Salinas River, Tembladero Slough, and Moss Landing Harbor. Several upland sites had elevated levels as well. Sediments from Gabilan Creek and San Lorenzo Creek exceeded the ERM for p,p DDE. San Lorenzo was only elevated at the site in King City (LOK); the upstream site (LOR) was clean. This implies that the source of the DDT may be somewhere between LOK and upstream LOR. The Salinas Reclamation Canal sites and Quail Creek also had elevated levels, though they were under the ERM for both DDT and DDE. DDT has been well documented as a persistent problem in some sediments of the central coast of California (Cotter and Strnad, 1997). It was used historically in agricultural and urban environments, and was commonly used directly in waterways for mosquito abatement. It is one of the chemicals associated with the Central Coast's largest "toxic hot spot" as defined by the Bay Protection and Toxic Cleanup Program; concentrations at two sites in the Region (Santa Maria Estuary and Upper Tembladero Slough) fell among the highest 5% of samples statewide. The State Mussel Watch Program and the Toxic Substances Monitoring Program have repeatedly detected DDT at elevated levels in mussel and fish tissue at a number of Central Coast sites. Findings of the CCAMP sampling in the lower end of the watersheds are consistent with previous findings of other studies. However, high levels on San Lorenzo Creek, Gabilan Creek and Quail Creek have not been well documented elsewhere.

81
Dieldrin

82
Dieldrin
Dieldrin was used up until 1975 for a variety of purposes, including agricultural soil and seed treatment, mosquito control, sheep dip and wood treatment. The highest level found, almost twice the CCAMP Action level of 8.0 ug/kg, was downstream of the City of Salinas in the Salinas Reclamation Canal. Interestingly, high levels were not found at the upstream site at Airport Road, implying sources within the City itself. Other sites which were elevated for DDT were also elevated for Dieldrin; these included Gabilan Creek, San Lorenzo Creek, and the Old Salinas River.

83
Endosulphan I
Endosulfan and Related Chemicals Endosulfan is a chlorinated hydrocarbon pesticide which has been used in the United States on a number of food crops, and also as a wood preservative. Though it has not been applied in its technical form since 1982, it is still commonly used as a component of other pesticides. Like other organochlorine pesticides, it tends to bind to soil and does not readily break down in water. In plants, endosulfan is rapidly broken down to endosulfan sulphate, which is also a chemical of concern. No sediment guidelines are available for endosulfan or its components and breakdown products; however, both the Old Salinas River at Potrero Road and the Old Salinas River had elevated levels of this chemical.
Endrin
Before its use was terminated, Endrin was used as a insecticide and rodenticide. Like other organochlorines, it is not particularly soluble in water and tends to bind to sediment particles. Endrin breaks down slowly in the environment. Endrin was found in levels above the ERL at the lower Salinas Reclamation Canal site (ALD), Old Salinas River at Potrero Road (POT), Gabilan Creek (GAB), and San Lorenzo Creek in King City (LOK).

84
Anthracene
Anthracene was found at detectable levels on one waterbody only, San Lorenzo Creek, where at one site it exceeded the CCAMP Attention level of 85 mg/kg. Sources include coal tar, creosote production, die production, and scintillation counter manufacturing. Other related forms, benzo anthracene and dibenzo(a,h) anthracene, are also found as byproducts in coal and petroleum refineries. These two substances were found at the Salinas Reclamation Canal sites at low levels.

85
Fensulfothion
Fensulfothion is a liquid organophosphate pesticide used as an insecticide, nematocide, and mosquito larvacide. It decomposes to sulfur and phosphorus oxides when heated. The only place it was detected was Atascadero Creek. No CCAMP guideline has been established for this substance.

86
Discussion Several activities related to this report are not complete as of this printing and will be reported in a revised version. The results of the Rapid Bioassessment Monitoring and the tissue bioaccumulation monitoring are not yet available from the California Department of Fish and Game. The results of the toxicity, water column chemistry, and toxicity identification evaluations being conducted by the Granite Canyon Marine Laboratory will be evaluated in a separate report by the Laboratory. An independent study focused on sedimentation in the watershed is being conducted by the Watershed Institute for the Central Coast Regional Board. A study by the Central Coast Regional Water Quality Control Board entitled “Inactive Metal Mines in Four San Luis Obispo County Watersheds: Surface Water Quality Impacts and Remedial Options” was published in June of 1999; this report addresses several water bodies in the Salinas Watershed listed for TMDL development for metals. In addition to monitoring conducted as a part of this study, CCAMP compiled a variety of historical data and reports to provide context for the findings of this report and to support TMDL development. A Salinas Watershed Bibliography is found in Appendix 3. This report, and the associated data management system, are intended to provide information for a variety of purposes including: 1) Confirmation of the basis for listing of waterbodies for TMDL development. 2) Information in support of source analysis for TMDL development 3) Database for support of load allocation analysis for TMDL development 4) Ambient water quality data in support of development of specific numeric objectives for TMDLs and for update of the
CWA 305(b) report 5) Establishment of permanent monitoring sites for long term trend detection and management measure effectiveness
evaluation. Salinity, Total Dissolved Solids(TDS), and Chloride Problems resultant from excessive salinity, total dissolved solids(TDS), and chloride are present in several locations in the watershed. In the lower watershed, groundwater management efforts to address problems with sea water intrusion were begun many years ago. In the upstream portions of the watershed, particularly in some surface waters of eastern tributaries, natural sources appear to play a major role in water quality conditions. The upper watershed is generally not meeting Basin Plan standards for TDS and sodium. Given the otherwise good water quality of some of these waters, it may be that the upper watershed sodium objective of 20 mg/l is not obtainable for some of these waterbodies. San Lorenzo and Cholame Creeks are tributaries in the upper watershed which exhibit concentrations which do not meet basin plan standards. Both of these tributaries drain watersheds which are very high in natural salts. High salts in the Salinas Valley have long been documented as a problem. H. Esmaili (1978) cites chloride as the major water quality issue limiting the domestic and irrigation uses of water in the Salinas drainage, particularly between Soledad and San Lucas, and sporadically in the foothills along the west side of the valley from Arroyo Seco to Ford Ord.
87
Nutrients Nitrate, nitrite, ammonia, and ortho-phosphate were all found at levels indicative of water quality problems. In addition to being present at levels which conflict with the narrative standard for nutrient enrichment of surface waters, several of these constituents were found at levels which are toxic to aquatic life. In addition to the data confirming high concentrations of these constituents, data collected on other explanatory variables such as chlorophyll a, dissolved oxygen, fixed and volatile dissolved and suspended solids provide additional confirming information regarding the impact of nutrients in surface waters of the watershed. The Salinas River itself shows a dramatic increase in nitrate (from averages of 10 mg/l to 46 mg/l) between the Chualar Bridge and the Davis Road Bridge, a distance of approximately 15 miles. Several inputs, including the City of Salinas Storm Drain at Davis Road and Quail Creek, were extremely high. Other tributaries, particularly Tembladero Slough, the Salinas Reclamation Canal and Old Salinas River, are severely impaired by nitrates. Nitrates at these high levels are toxic to many organisms and have been shown to act as mutagens to amphibian species. At most of these sites ammonia levels were also well above levels which cause toxicity and other adverse responses in steelhead. The basin plan standard of 0.025 mg/l is commonly exceeded throughout the watershed and in some cases the concentrations are over 200 times the standard. The Salinas Reclamation Canal again is exceptionally high. At a number of sites exhibiting high nutrient levels, eutrophication was indicated by high levels of chlorophyll a and wide variations in dissolved oxygen. These conditions were particularly evident at the Old Salinas River and Tembladero watershed sites, as well as at Carneros Creek above Elkhorn Slough. Increases in periphyton coverage coincided with declines in dissolved oxygen levels at some sites, such as the Nacimiento River site. When examining the Salinas River main stem sites only, concentration increases in nutrients, particularly nitrate, are evident from upstream to downstream, with the Davis Road site generally showing highest concentrations, and with large increases occuring between the Chualar Bridge and the Davis Road bridge sites. Pesticides and Priority Organic Chemicals Legacy organochlorine chemicals were detected in sediment samples from areas known to suffer from high concentrations of these substances in the past. In addition to the biological consequences of these toxic chemicals, the Navigation beneficial use is also impaired because of adverse economic impact in the process of dredge spoil disposal at Moss Landing Harbor. New findings show elevated levels of organochlorines at Gabilan Creek, as well as at San Lorenzo Creek in King City. The King City site is downstream of both agricultural cropland and agricultural supply and processing facilities. One organophosphate, Fensulfothion was also detected in sediment. Initial laboratory data available from the Granite Canyon Marine Pollution Studies Laboratory (MPSL) toxicity testing study indicates that chlorpyrifos and diazinon were detected in water samples as well as sediment samples and were determined to be present at levels which produced toxicity to test organisms. More information on these findings will be available when the MPSL report is completed. The Pesticide Use Database will provide important information for development of Total Maximum Daily Load assessments for currently applied pesticides. We are currently planning to collect additional water column data to establish the relationship between the application of pesticides and the conveyance of those substances to the water.

88
Pathogens The only waterbody in this study which was listed for pathogens on the 303(d) list was Elkhorn Slough. This slough has had shellfish closures over the years because of elevated fecal coliform levels. The single sampling point, at Kirby Park, had low fecal coliform levels, all under 10 MPN/100 ml except for one sampling event in February. However, Carneros Creek, a primary tributary to Elkhorn Slough, never dropped below 200 MPN/100 ml. The data collected by this study does not support the 303(d) listing. However, other areas of the Slough may have different conditions. The entire Tembladero drainage, particularly the Salinas Reclamation Canal, had excessively high levels of fecal coliform. The drain entering the Salinas River at Davis Road and the storm drain entering just above the Salinas Reclamation Canal at Airport Road, had similarly high concentrations. Other tributaries, such as San Lorenzo, Cholame, and Quail had elevated levels also, but not to the same extent. Metals Metals concentrations in sediment samples collected from the study sites were for the most part relatively low. Slight elevations of some metals associated with urban runoff were found in the Salinas Reclamation Canal. Chromium and nickel were somewhat elevated, which is not atypical for this region of California. Levels of these metals, though sometimes exceeding CCAMP Action levels, are still well within the range found in other CCAMP sampling in central California. The CCAMP Action levels are based on NOAA ERM values. Some Central Coast geological formations, particularly serpentine, include high natural levels of these substances. Unique ecosystems are associated with these formations, and NOAA ERM values for nickel and chromium are probably less relevant in these cases. Surface water flow For the most part the mainstem of the Salinas River upstream of King City had relatively low levels of most pollutants. The biggest issue for the river in this portion of the watershed is probably reduction and/or complete loss of surface water flow. This has a resulting effect on water column temperature and dissolved oxygen levels, and clearly is not beneficial for aquatic organisms. One of the difficulties in sampling the Salinas River for benthic invertebrates resulted from the extremely variable flow in the river, resulting in a poorly developed “water’s edge” community structure. The Estrella River dried up very early in the dry season along most of its length. Other reaches followed later, including the Salinas River from Atascadero downstream to just above the Nacimiento confluence. In mid-summer, Nacimiento releases from the reservoir were reduced significantly, resulting in drying of the Salinas channel from above Greenfield to Chualar. This event resulted in a large fish kill (approximately 500 individuals) of an unidentified minnow species at the Greenfield site. Topo Creek was continuously dry except during February, 1999. San Lorenzo, Gabilan, and Quail Creek were all intermittently dry. However, the latter two were clearly heavily influenced by tailwater drainage and showed large daily fluctuations. Reliable flow was found at both storm drains sampled by this program.

89
Comments on 303(d) listings The 303(d) list currently includes the following waterbodies: Old Salinas River Estuary Pesticides
Nutrients Salinas River Lagoon Pesticides
Nutrients Siltation
Espinosa Slough Pesticides Priority Organics
Salinas River Pesticides Nutrients Salinity/TDS/Chlorides Siltation
Elkhorn Slough Pesticides Pathogens Siltation
Salinas River Refuge Lagoon Pesticides Nutrients Salinity/TDS/Chloride
Tembladero Slough Pesticides Nutrients
Nacimiento Reservoir Metals
Moro Cojo Slough Pesticides Siltation
Las Tablas Creek Metals
Moss Landing Harbor Pesticides Pathogens
Las Tablas Creek, North Fork Metals
Blanco Drain Pesticides Las Tablas Creek, South Fork Metals
Salinas Reclamation Canal Pesticides Priority Organics
Pesticides and Priority Organics: Compilation of previously collected data and the results of sampling conducted for this study confirms pesticide problems in waterbodies listed for pesticides and priority organics. The “Consolidated Toxic Hot Spots Cleanup Plan” published in June of 1999 by the State Water Resources Control Board contains detailed information on these water bodies and the data which serves as the basis for listing. While many of these problems stem from chemicals which are no longer in use, such as DDT and Dieldrin, preliminary findings from the monitoring conducted in 1999 indicate that several currently applied organophosphates (chlorpyrifos and diazinon) are implicated as causes of toxicity in both surface water and sediment in some areas of the watershed. Results of the sediment chemistry sampling conducted for this study indicate that the geographic scope of the source area involved in the Moss Landing Harbor Toxic Hot Spot can be reduced. If the results of the tissue bioaccumulation testing conducted as a part of this study confirm the sediment results, the area identified as the source of hydrophobic chemicals in Moss Landing, such as DDT and dieldrin, could probably be substantially reduced. The new suspected source area would be confined to hydrologic unit 306 and lower portions of hydrologic subareas 30910 and 30920 bounded on the east by the City of Salinas and on the south by the city of Chualar. Nutrients: Results of the monitoring conducted for this study indicate that the majority of elevated nitrate concentrations in surface water are located downstream of the City of Greenfield. Compilation of data on nitrate concentrations in groundwater conducted as a part of this study indicate that the geographic scope of groundwater problems extends beyond the area of surface water problems. Elevated ammonia concentrations appear to be present throughout the watershed. Orthophosphate levels were very elevated in tributaries to Tembladero Slough and Elkhorn Sough and in Quail Creek. Pathogens: In general, results of the monitoring indicate that waterbodies currently listed for pathogens have either high levels of fecal coliform or have tributary waterbodies which have high levels of fecal coliform. Elevated levels appear throughout the watershed at sites not previously monitored. Metals: The study entitled “Inactive Metals Mines in Four San Luis Obispo County Watersheds: Surface Water Quality Impacts and Remedial Actions” published in June 1999 by the Central Coast Regional Water Quality Control Board contains detailed information on the metals problems of these waterbodies. The study includes descriptions of the problems and remedial measures which might be employed to deal with the problems.

90
Recommendations for future sampling Several sites should be included in future rounds of CCAMP monitoring of the Salinas Study area. These include sites on Blanco Drain, the main stem Salinas up stream of the Blanco input, and Alisal Creek downstream of the City of Salinas. The City of Salinas is now coordinating stormwater permit monitoring with CCAMP activities, and some of these sites will likely be included as part of their monitoring contribution. Both the Estrella River and Topo Creek sites should be relocated to areas where flows are less intermittent (i.e. The highway 46 over-crossing of the Estrella River where flow was fairly consistent through July). The Pesticide Use Database will be utilized to determine where to focus monitoring for currently applied chemicals and toxicity. Solid phase extraction technology will be considered for monitoring use, to provide the ability to sample for chemicals with short half lives and/or high solubility. The high use of sulfur in the watershed on vineyards, warrants additional sampling of conventional water quality and sediment analytes to address the possible impacts of this chemical. New studies currently being conducted on sediment transport and impact will be evaluated to develop monitoring strategies for assessing sediment impacts in the future. The use of satellite imagery will be included as a component of this effort.

91
References California State Water Resources Control Board, Bay Protection and Toxic Cleanup Program. Chemical and Biological Measures of
Sediment Quality in the Central Coast Region. Central Coast Regional Water Quality Control Board. Central Coast Ambient Monitoring Program documentation.
http://www.ccamp.org/ Central Coast Regional Water Quality Control Board. 1999. 303(d) and TMDL priority list. Internal document. Central Coast Regional Water Quality Control Board. 1999. Salinas River Watershed Management Action Plan. Internal
document. Central Coast Regional Water Quality Control Board. 1998. Central Coast Ambient Monitoring Program Strategy. Internal document. Esmaili, H. & Assoc. 1978. Nonpoint Sources of Groundwater Pollution in Santa Cruz and Monterey Counties, California. Harrington, J.M. California Stream Bioassessment Procedure. 1999. California Department of Fish and Game, Aquatic
Bioassessment Laboratory. Rancho Cordova, CA. Majmundar, Hasmukhrai. 1980. Distribution of Heavy Elements Hazardous to Health, Salinas Valley Region, California.
California Division of Mines and Geology, 1416 Ninth Street, Room 1341, Sacramento, CA 95814 Moyle, P. 1976. Inland Fisheries of California. University of California Press. Westcot, D.W., B.J. Genwell, and J.E. Chilcott. 1990. Trace Element Concentrations in Selected Stream in California: A
Synoptic Survey. California Regional Water Quality Control Board, Central Valley Region, Sacramento, CA. State Water Resources Control Board. 1998. Section 303(d) List of Impaired Waterbodies.

92
Appendices Appendix 1. Beneficial Uses of the Salinas River and Associated Waterbodies Appendix 2. Central Coast Regional Water Quality Control Board 303(d) list Appendix 3. Salinas Watershed Bibliography

93
Appendix 1. Beneficial Uses of the Salinas River and Associated Waterbodies Waterbody Names MUN AGR PRO IND GWR REC 1 REC 2 WILD COLD WARM MIGR SPWN BIOL RARE EST FRESH COMM SHELL Moro Cojo Slough X X X X X X X X X X X X Old Salinas River Estuary X X X X X X X X X X X X Tembldero Slough X X X X X X X X X Espinosa Slough X X X X X Salinas Reclamation Canal X X X X X Gabilan Creek X X X X X X X X X Alisal Creek X X X X X X X X X X Blanco Drain X X X X X Salinas River Refuge Lagoon (South) X X X X X X X X X X Salinas River Lagoon (North) X X X X X X X X X X X X Salinas River, dwnstrm of Spreckels Gage X X X X X X X X X Salinas River, Spreckels Gage-Chualar X X X X X X X X X X X X Salinas River, Chualar-Nacimiento River X X X X X X X X X X X X X X Arroyo Seco River X X X X X X X X X X X X X San Antonip River, dwnstr from Res. X X X X X X X X X X X X San Lorenzo Creek X X X X X X X X X Chalone Creek X X X X X X X X X Nacimiento River, dwnstrm Res. X X X X X X X X X X X X X Atascadero Creek X X X X X X X X X X

94
Appendix 2. Central Coast Regional Water Quality Control Board 303(d) list
( including TMDL priorities, for the Salinas and Elkhorn Slough watersheds) Waterbody type codes; B = bays and harbors, E = estuaries, L = lakes/reservoirs and R = rivers/streams
Typ
e
Nam
e
Hyd
rolo
gic U
nit
Cau
ses
Sour
ce
Prio
rity
Size
Uni
t
TM
DL
SDat
e
ED
ate
B Moss Landing Harbor
3060000 Pathogens Agriculture Boat Discharges Vessels Nonpoint sources
L 60.48 Ac Y 04/05 040
Pesticides Agriculture Agriculture Crop production
E Elkhorn Slough 30600014 Pathogens Natural Sources Nonpoint Source
L 67.52 Ac Y 0405 040
Pesticides Agriculture Agriculture-irrigation Agriculture-storm runoff Contaminated Sediments Erosion/Siltation Irrigated Crop Production
Sediment/ Siltation
Agriculture Agriculture-storm runoff Channel Erosion Irrigated Crop Production Nonpoint Source
E Moro Cojo Slough
30913011 Pesticides Agriculture Agriculture-irrigation Agriculture-storm runoff Irrigated Crop Production Nonpoint Source
L 62.72 Ac Y 0198 041
Sediment/ Siltation
Agriculture Agriculture-storm runoff Construction/Land Irrigated Crop Production Nonpoint Source
E Old Salinas River Estuary
30913011 Nutrients Agriculture Agriculture-irrigation Irrigated Crop Production Nonpoint Source
M 92.94 Ac Y 0198 040
Pesticides Agriculture Agriculture-irrigation Agriculture-storm runoff Irrigated Crop Production Nonpoint Source
E Salinas River Lagoon (North)
30911010 Nutrients Nonpoint Source M 196.6 Ac Y 0198 040
Pesticides Agriculture Sediment/
Siltation Nonpoint Source
E Salinas River Refuge Lagoon
30911010 Nutrients Agriculture M 30 Ac Y 0198 040
Pesticides Agriculture Salinity/
TDS/ Chlorides
Agriculture
L Nacimiento Reservoir
30982000
Metals Natural Sources Resource Extraction
H 5735 Ac Y 0997 040
R Blanco Drain 30911010 Pesticides Agriculture Agriculture-irrigation Agriculture-storm runoff Contaminated Sediments Irrigated Crop Production Nonpoint Source
M 15.29 M Y 0198 040

95
R Espinosa Slough 30911010 Nutrients Agriculture
Agriculture-irrigation Agriculture-storm runoff Irrigated Crop Production Nonpoint Source
M 1.45 M Y 0198 040
Pesticides Agriculture Agriculture-irrigation Agriculture-storm runoff Irrigated Crop Production Nonpoint Source
Priority Organics
Nonpoint Source
R Las Tablas Creek 30981293 Metals Surface Mining H 5.72 M Y 0997 040 R Las Tablas
Creek, North Fork
30981290 Metals Surface Mining H 6.47 M Y 0997 040
R Las Tablas Creek, South Fork
30981290 Metals Surface Mining H 4.7 M Y 0997 040
Salinas Reclamation Canal
30911010 Pesticides Agriculture Agriculture-irrigation Agriculture-storm runoff Irrigated Crop Production Minor Industrial Point Source Nonpoint Source
M 9.5 M Y 0198 040
Priority Organics
Agriculture Agriculture-irrigation Agriculture-storm runoff Irrigated Crop Production Nonpoint Source Urban Runoff/Storm Sewers
Salinas River 30911010 Nutrients Agriculture M 187.2 M Y 0198 040 Pesticides Agriculture
Agriculture-irrigation Agriculture-storm runoff Irrigated Crop Production Nonpoint Source
Salinity/ TDS/ Chlorides
Agriculture
Sediment/ Siltation
Agriculture Agriculture-storm runoff Channel Erosion Highway/Road/Bridge Construction Irrigated Crop Production
R Tembladero Slough
30911010 Nutrients Agriculture, Agriculture-irrigation, Agriculture-storm runoff, Irrigated Crop Production, Nonpoint Source
M 5.03 M Y 0198 040
Pesticides Agriculture Agriculture-irrigation, Agriculture-storm runoff, Irrigated Crop Production

96
Appendix 3. Salinas Watershed Bibliography