Embed Size (px)
Citation preview


SALES
&
SERVICE
FOUR DIVISIONS

GLOBAL ENERGY STORAGE EXPERIENCE
>350 Mw
Certified in:
United State
Canada
Australia
New Zealand
UK/Ireland
Netherlands

Sprig Electric
This system is AC integrated with a 350 kW rooftop PV system, and is primarily used to provide Demand Charge Reduction to the customer.
The combined solar + storage system will reduce the customers utility bill by up to 80%.

Duke Energy 36 MW Battery
The Notrees Wind Storage Demonstration Project is a 36-megawatt energy storage and power management system. It shows how energy storage can moderate the intermittent nature of wind by storing excess energy when the wind is blowing and making it available later to the electric grid to meet customer demand. - DOE

Green Mountain Power Stafford Hill
The Stafford Hill Solar Farm combines solar, storage andmicro-grid technology in an innovative new solar project toimprove resiliency and safety in communities. According to the U.S. Department of Energy, The Stafford Hill Solar Farm is the first project to establish a micro-grid powered solely by solar and battery back-up, with no other fuel source.
This installation saves Green Mountain Power customers $200,000 in one hour by reducing GMP’s peak.
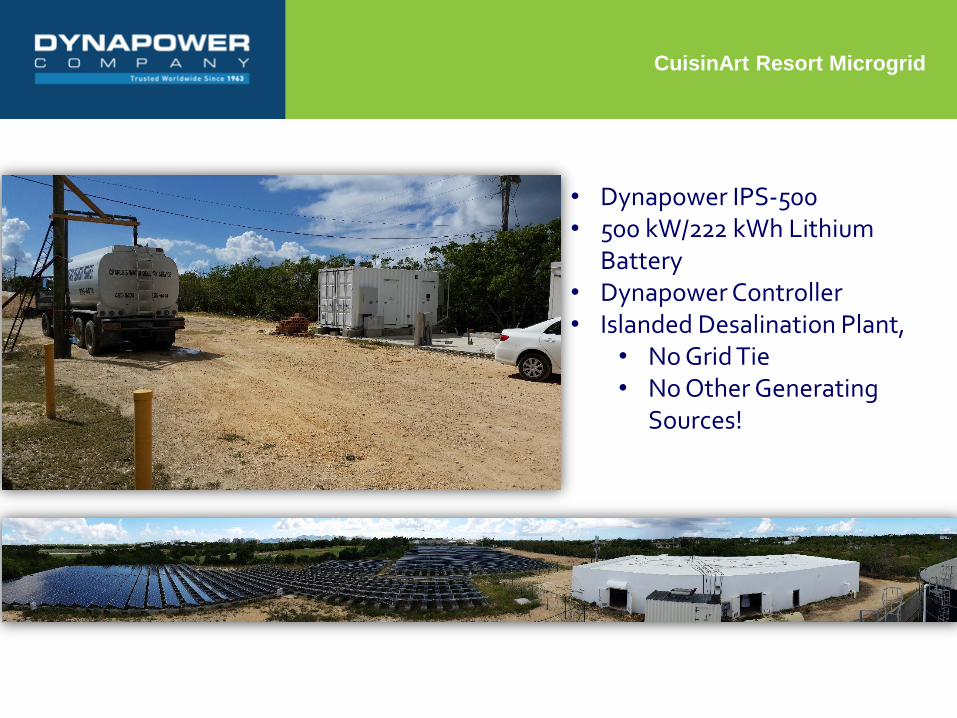
CuisinArt Resort Microgrid
• Dynapower IPS-500• 500 kW/222 kWh Lithium
Battery• Dynapower Controller• Islanded Desalination Plant,
• No Grid Tie• No Other Generating
Sources!

Energy Storage Center
South Burlington, VT
Storage Solar
Wind

March 2017
Energy Storage7.
56March 2017
221
421
2,562
-
500
1,000
1,500
2,000
2,500
2012 2013 2014 2015 2016 2017E 2018E 2019E 2020E 2021E 2022E
Ener
gy S
tora
ge D
eplo
ymen
ts b
y Se
gmen
t (M
W)
Residential Non-Residential Utility
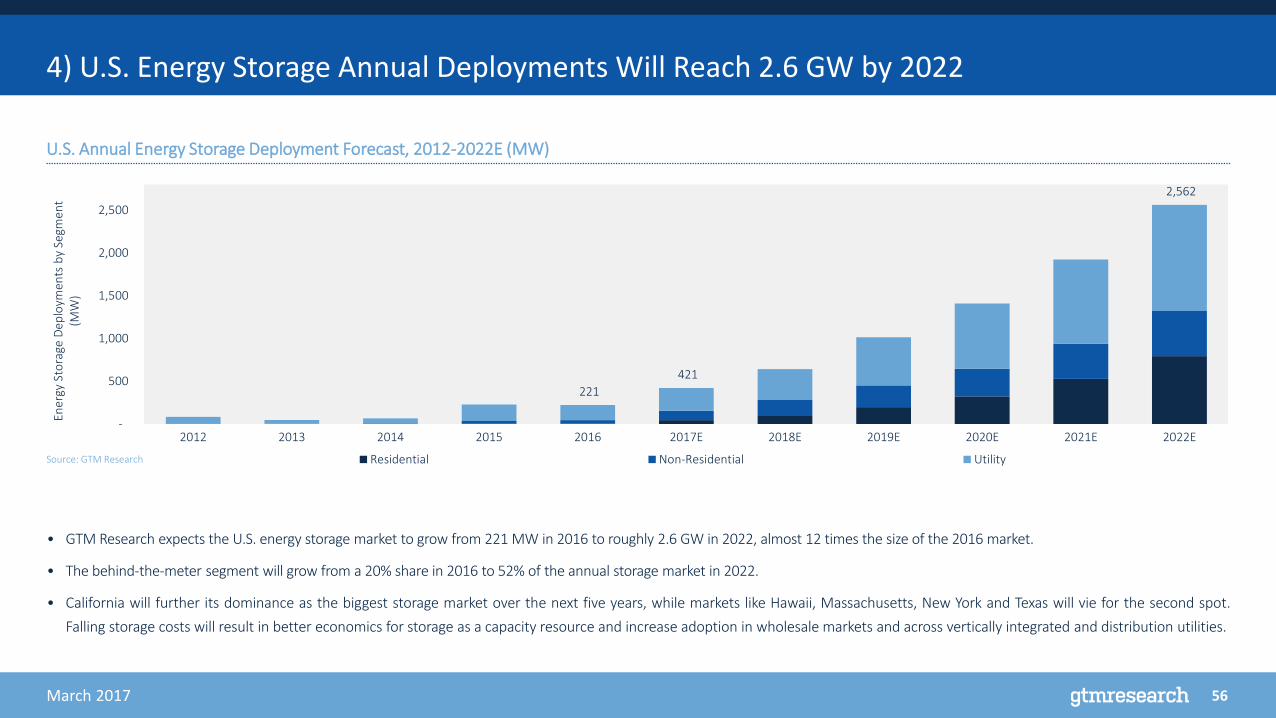
4) U.S. Energy Storage Annual Deployments Will Reach 2.6 GW by 2022
Source: GTM Research
U.S. Annual Energy Storage Deployment Forecast, 2012-2022E (MW)
• GTM Research expects the U.S. energy storage market to grow from 221 MW in 2016 to roughly 2.6 GW in 2022, almost 12 times the size of the 2016 market.
• The behind-the-meter segment will grow from a 20% share in 2016 to 52% of the annual storage market in 2022.
• California will further its dominance as the biggest storage market over the next five years, while markets like Hawaii, Massachusetts, New York and Texas will vie for the second spot.
Falling storage costs will result in better economics for storage as a capacity resource and increase adoption in wholesale markets and across vertically integrated and distribution utilities.
49March 2017
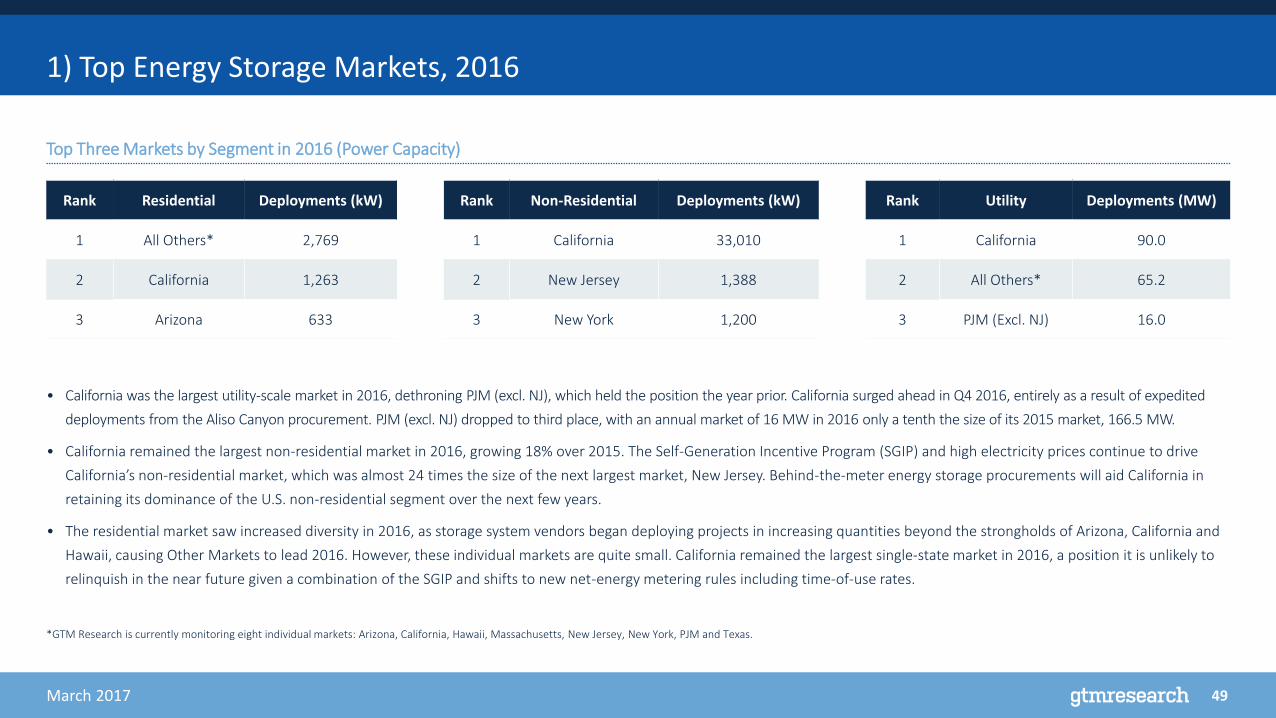
• California was the largest utility-scale market in 2016, dethroning PJM (excl. NJ), which held the position the year prior. California surged ahead in Q4 2016, entirely as a result of expedited
deployments from the Aliso Canyon procurement. PJM (excl. NJ) dropped to third place, with an annual market of 16 MW in 2016 only a tenth the size of its 2015 market, 166.5 MW.
• California remained the largest non-residential market in 2016, growing 18% over 2015. The Self-Generation Incentive Program (SGIP) and high electricity prices continue to drive
California’s non-residential market, which was almost 24 times the size of the next largest market, New Jersey. Behind-the-meter energy storage procurements will aid California in
retaining its dominance of the U.S. non-residential segment over the next few years.
• The residential market saw increased diversity in 2016, as storage system vendors began deploying projects in increasing quantities beyond the strongholds of Arizona, California and
Hawaii, causing Other Markets to lead 2016. However, these individual markets are quite small. California remained the largest single-state market in 2016, a position it is unlikely to
relinquish in the near future given a combination of the SGIP and shifts to new net-energy metering rules including time-of-use rates.
1) Top Energy Storage Markets, 2016
Rank Residential Deployments (kW)
1 All Others* 2,769
2 California 1,263
3 Arizona 633
Rank Non-Residential Deployments (kW)
1 California 33,010
2 New Jersey 1,388
3 New York 1,200
Rank Utility Deployments (MW)
1 California 90.0
2 All Others* 65.2
3 PJM (Excl. NJ) 16.0
*GTM Research is currently monitoring eight individual markets: Arizona, California, Hawaii, Massachusetts, New Jersey, New York, PJM and Texas.
Top Three Markets by Segment in 2016 (Power Capacity)

42March 2017
16 of 19 Newly-Tracked Planned and Operational Microgrid Deployments Include Storage
Seattle City Light
Arlington Microgrid
Rams Hill Golf Club*• CleanSpark (developer), Webcor (builder)
& Sungevity (solar service provider)• 0.829 MW solar operational in 2016• 0.8 MWh battery storage planned for
phase 2• Plan to integrate into larger Borrego
Springs microgrids
Hampden Operations Center • Solar plus storage; Tesla battery
storage system; a Level 2 electric vehicle charging station
• Opus One Solutions GridOS platform as the microgrid controller
• Advanced Microgrid Solutions for analytics and economic optimization platform
Pittsburgh Microgrids (4 locations)1. Uptown2. Oakland3. Northside4. Downtown microgrid will include EV charging
stations in a public parking lot downtown with a solar canopy
Spokane Microgrid• 0.2MW solar; two arrays• 2.5 MWh battery storage
Winehaven Winery
Steger Wilderness Conference Center• tenKsolar panels (0.02 MW)• BAE Batteries USA• Cummins diesel backup genset
Brooklyn Marcus Garvey Apartments• 0.4 MW of rooftop solar• 0.4 MW fuel cell from Bloom Energy• 0.3 MW/1.2 MWh LG Chem batteries• Demand Energy's Distributed Energy
Network Operating System
Dell Children’s Medical Center/Richard Mueller Energy Center**
Mt. Sterling• 10kW of solar design and construction by
Industrial Solar Consulting (“ISC”) and SkyConstruction & Engineering
• 95 kWh of Fluidic Energy zinc-air batteries• Non-wires alternative
Ocracoke Island*• 0.015 MW solar• 1 MW Tesla Powerpack batteries• 3 MW diesel
Anchorage• ABB PowerStore microgrid system to
optimize battery and flywheel application• 500 kWh battery with a maximum
performance of 2 MW
Marine Corps Recruit Depot/Parris Island• Ameresco to build a site-wide
microgrid integrating 10 MW of DERs• 8 MWh battery energy storage
system• 6.7 MW-DC solar• 3.5 MW CHP
*Phase 1 operational **Operational
City/Community
Remote Community
Commercial
Military
Island
Key
Woodbridge
Microgrid
Angel Island

52March 2017
2) Front-of-the-Meter Policy and Market Developments, Q1 2017
New York
Con Ed proposed a new customer-sited front-of-the-meter energy storage business model; NYSERDA released an RFP with $8.1 million offered to pursue strategies to reduce energy storage soft costs.
California
SCE and SDG&E have completed seven out of eight Aliso Canyon-related projects, with only 5 MW of the 104.5 contracted remaining to come on-line. The CPUC issued a report highlighting the Aliso Canyon Demand Side Management Activity and Impact Summary; PG&E released the results of its EPIC 1.01 Energy Storage End Uses study; SCE and PG&Estarted their 2016 RFOs for energy storage under the California energy storage mandate, covering transmission, distribution, and renewables integration. Los Angeles Department of Water and Power released its draft Integrated Resource Plan.
Massachusetts
The Dept. of Energy Resources ruled that it would be prudent for the state to adopt an energy storage target, with the target itself to be finalized in July; Eversource Energy published its Grid Modernization Base Commitment Investment Plan, including $100 million proposed for energy storage research and demonstration projects over 5 years.
Oregon
The Oregon PUC released guidelines related to implementing HB 2193, the state’s energy storage mandate.
Federal
FERC’s ongoing NOPR process proposes broad wholesale market changes to encourage energy storage participation; FERC also clarified the precedent for energy storage to provide multiple value streams; NARUC released an updated ratemaking manual for distributed energy resources.
PJM
PJM continued its ongoing Markets and Reliability Committee task force and distributed energy resource special meetings, as well as testing the new RegD signal without energy neutrality.
Hawaii
The state legislature introduced bills pertaining to energy storage tax credits and infrastructure loans; Hawaiian Electric Companies released its 2016 Power Supply Improvement Plan.
53March 2017
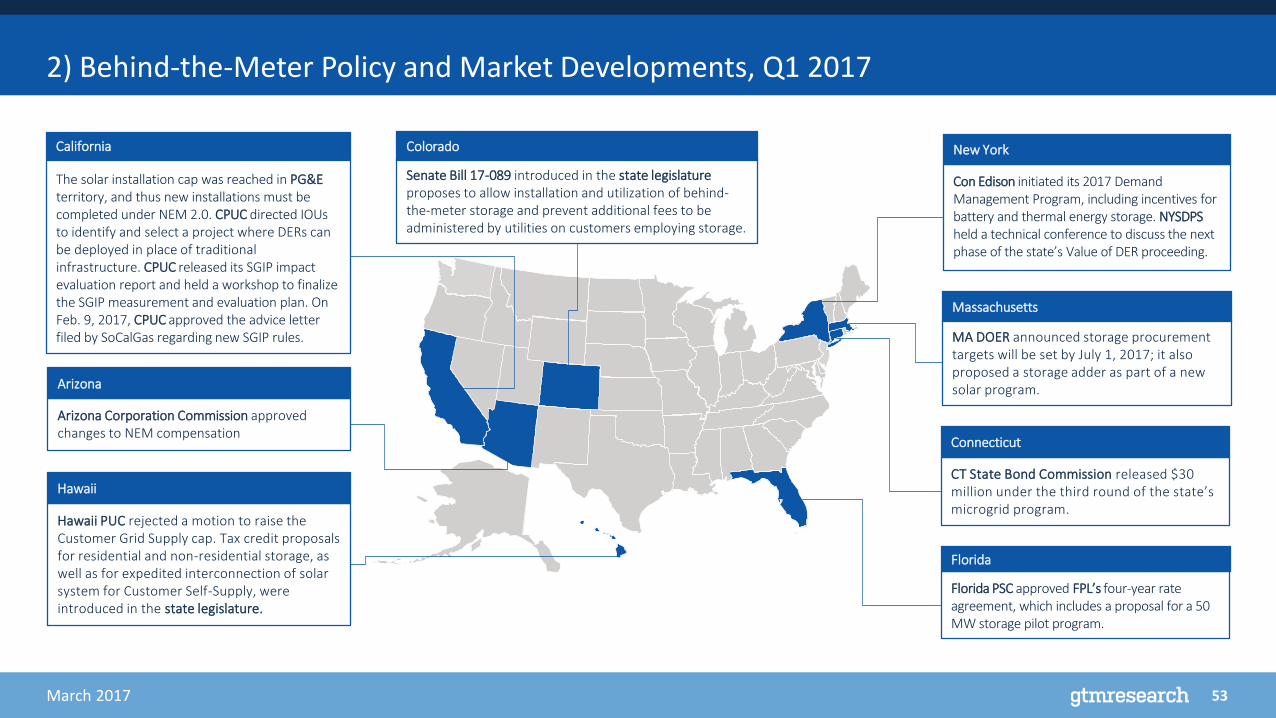
2) Behind-the-Meter Policy and Market Developments, Q1 2017
California
The solar installation cap was reached in PG&E territory, and thus new installations must be completed under NEM 2.0. CPUC directed IOUs to identify and select a project where DERs can be deployed in place of traditional infrastructure. CPUC released its SGIP impact evaluation report and held a workshop to finalize the SGIP measurement and evaluation plan. On Feb. 9, 2017, CPUC approved the advice letter filed by SoCalGas regarding new SGIP rules.
New York
Con Edison initiated its 2017 Demand Management Program, including incentives for battery and thermal energy storage. NYSDPS held a technical conference to discuss the next phase of the state’s Value of DER proceeding.
Arizona
Arizona Corporation Commission approved changes to NEM compensation
Massachusetts
MA DOER announced storage procurement targets will be set by July 1, 2017; it also proposed a storage adder as part of a new solar program.
Colorado
Senate Bill 17-089 introduced in the state legislature proposes to allow installation and utilization of behind-the-meter storage and prevent additional fees to be administered by utilities on customers employing storage.
Connecticut
CT State Bond Commission released $30 million under the third round of the state’s microgrid program.
Florida
Florida PSC approved FPL’s four-year rate agreement, which includes a proposal for a 50 MW storage pilot program.
Hawaii
Hawaii PUC rejected a motion to raise the Customer Grid Supply cap. Tax credit proposals for residential and non-residential storage, as well as for expedited interconnection of solar system for Customer Self-Supply, were introduced in the state legislature.

GTM Research/ESA | U.S. Energy Storage Monitor: Q4 2016
Utility-Scale Market Trends4.

57GTM Research/ESA | U.S. Energy Storage Monitor: Q4 2016
Utility-Scale Market Outlook (MW)
Source: GTM Research
U.S. Annual Utility-Scale Energy Storage Deployment Forecast, 2012-2021E (MW)
8143 58
192 200
294
379
529
780
1,014
0.0
200
400
600
800
1,000
1,200
2012 2013 2014 2015 2016E 2017E 2018E 2019E 2020E 2021E
U.S
. Util
ity-S
cale
Ene
rgy
Stor
age
Depl
oym
ents
(MW
)
Arizona California Hawaii Massachusetts New Jersey New York PJM (Ex. NJ) Texas All Others

48GTM Research/ESA | U.S. Energy Storage Monitor: Q4 2016
0%
10%
20%
30%
40%
50%
60%
70%
80%
90%
100%
Q3 2015 Q4 2015 Q1 2016 Q2 2016 Q3 2016Tota
l Util
ity-S
cale
Pip
elin
e Sh
are
Ove
r Tim
e (%
of M
W)
Arizona California Hawaii Massachusetts New JerseyNew York PJM (Exc. NJ) Texas All Others
U.S. Utility Energy Storage Pipeline Over Time
• California continues to represent the majority of the utility-scale energy storage pipeline, increasing its share from 74% in Q3 2015 to 82% in Q3 2016.
• In Q3 2015, 99% of the U.S. pipeline was made up of projects from only six markets: Arizona, California, Hawaii, New York, PJM and Texas. Markets not on this list increasingly make up a significant share of the U.S. energy storagepipeline, representing 4% of the larger Q3 2016 pipeline. Large projects under consideration in Maine, Michigan, Minnesota and Puerto Rico, among others, show an expanding interest in utility-scale storage.
• As other states have expanded their pipelines, Texas has seen its pipeline share shrink, falling from 11% in Q3 2015 to 6% in Q3 2016.
• PJM saw a similar decline, falling from 9% of the market pipeline to 5%, as its project queue remained relatively stable at 545 MW, only a 67 MW increase from Q3 2015.
U.S. Utility-Scale Energy Storage Pipeline by Market Over Time (MW) U.S. Utility-Scale Energy Storage Pipeline Market Share Over Time (%)
Source: GTM Research
0
2000
4000
6000
8000
10000
12000
Q3 2015 Q4 2015 Q1 2016 Q2 2016 Q3 2016
Tota
l Util
ity-S
cale
Ene
rgy
Stor
age
Pipe
line
(MW
)
Arizona California Hawaii Massachusetts New JerseyNew York PJM (Exc. NJ) Texas All Others
Source: GTM Research
50GTM Research/ESA | U.S. Energy Storage Monitor: Q4 2016
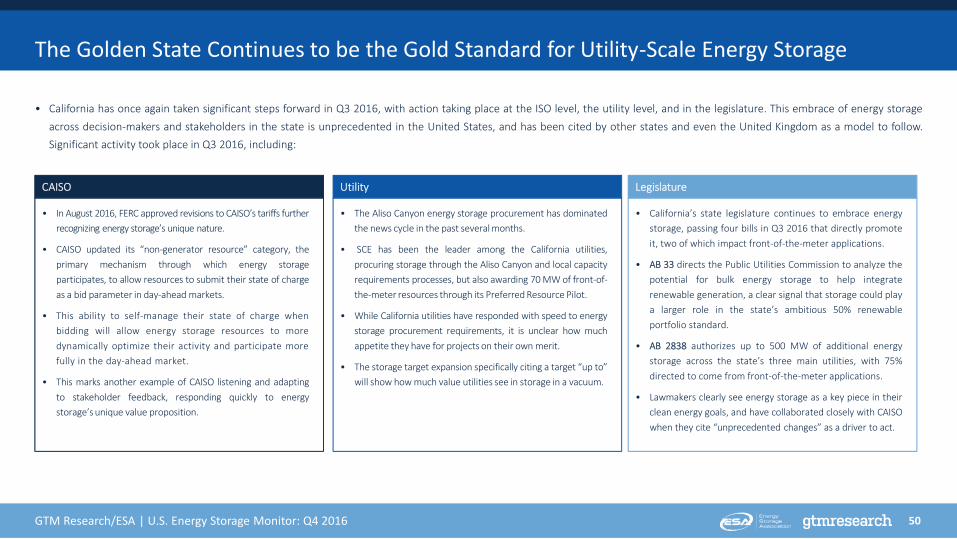
• California has once again taken significant steps forward in Q3 2016, with action taking place at the ISO level, the utility level, and in the legislature. This embrace of energy storageacross decision-makers and stakeholders in the state is unprecedented in the United States, and has been cited by other states and even the United Kingdom as a model to follow.Significant activity took place in Q3 2016, including:
The Golden State Continues to be the Gold Standard for Utility-Scale Energy Storage
CAISO
• In August 2016, FERC approved revisions to CAISO’s tariffs furtherrecognizing energy storage’s unique nature.
• CAISO updated its “non-generator resource” category, theprimary mechanism through which energy storageparticipates, to allow resources to submit their state of chargeas a bid parameter in day-ahead markets.
• This ability to self-manage their state of charge whenbidding will allow energy storage resources to moredynamically optimize their activity and participate morefully in the day-ahead market.
• This marks another example of CAISO listening and adaptingto stakeholder feedback, responding quickly to energystorage’s unique value proposition.
Utility
• The Aliso Canyon energy storage procurement has dominatedthe news cycle in the past several months.
• SCE has been the leader among the California utilities,procuring storage through the Aliso Canyon and local capacityrequirements processes, but also awarding 70 MW of front-of-the-meter resources through its Preferred Resource Pilot.
• While California utilities have responded with speed to energystorage procurement requirements, it is unclear how muchappetite they have for projects on their own merit.
• The storage target expansion specifically citing a target “up to”will show how much value utilities see in storage in a vacuum.
Legislature
• California’s state legislature continues to embrace energystorage, passing four bills in Q3 2016 that directly promoteit, two of which impact front-of-the-meter applications.
• AB 33 directs the Public Utilities Commission to analyze thepotential for bulk energy storage to help integraterenewable generation, a clear signal that storage could playa larger role in the state’s ambitious 50% renewableportfolio standard.
• AB 2838 authorizes up to 500 MW of additional energystorage across the state’s three main utilities, with 75%directed to come from front-of-the-meter applications.
• Lawmakers clearly see energy storage as a key piece in theirclean energy goals, and have collaborated closely with CAISOwhen they cite “unprecedented changes” as a driver to act.

51GTM Research/ESA | U.S. Energy Storage Monitor: Q4 2016
• For the second time we may be seeing a state moving to follow California’s example through legislature-driven and large-scale energy storage targets, with Oregon’s procurementmandate (HB 2193) being the other recent example. Massachusetts' bill H 4568 gives the Department of Energy Resources (DOER) until the end of the year to decide whether to setan energy storage procurement target; if they move forward, it is likely to be on the order of several hundred megawatts by 2020, making it the second largest in the country.
• Concurrently, a study team commissioned as part of the Energy Storage Initiative and in consultation with the DOER and the Massachusetts Clean Energy Center (MassCEC) releasedthe State of Charge report, which recommends a 600 MW target by 2025 to capture what it calculates to be $800 million in benefits to ratepayers.
Massachusetts: Following in California’s Footsteps?
Source: State of Charge Report – Massachusetts Energy Storage Initiative
Energy CostReduction
T&D Cost Reduction
Ancillary Services and WholesaleMarket Cost Reductions
Reduced Peak Capacity
$275 M
$305 M
$397 M
$1,083 M
$219 MRenewable
Integration CostReduction$2,288 M in total
potential systembenefits
Potential System Benefits Highlighted by State of Charge Potential Barriers, Opportunities, and Next Steps for Massachusetts
• Engaging ISO-NE in the stakeholder process is a crucial next step for Massachusetts. Californiaowes a large portion of success to a close working relationship with CAISO, and ifMassachusetts is to emulate that success, it must do the same with ISO-NE. To put thenecessity of this in context, more than half of the benefits cited by the State of Charge reportrequire wholesale market participation.
• Much still depends on the decision the DOER will make later this year on whether to set astorage target and, if so, how high to set it. A figure of around 300 MW would be proportional toCalifornia’s target, and would show that policymakers are looking to that state as an example.
• Massachusetts reached another milestone this quarter, as the Sterling Municipal LightDepartment broke ground on a 2 MW project which would be the largest in the ISO-NEfootprint and the first utility-scale battery storage project in Massachusetts. The system willprovide enhanced resiliency and solar energy integration to the town.
52GTM Research/ESA | U.S. Energy Storage Monitor: Q4 2016
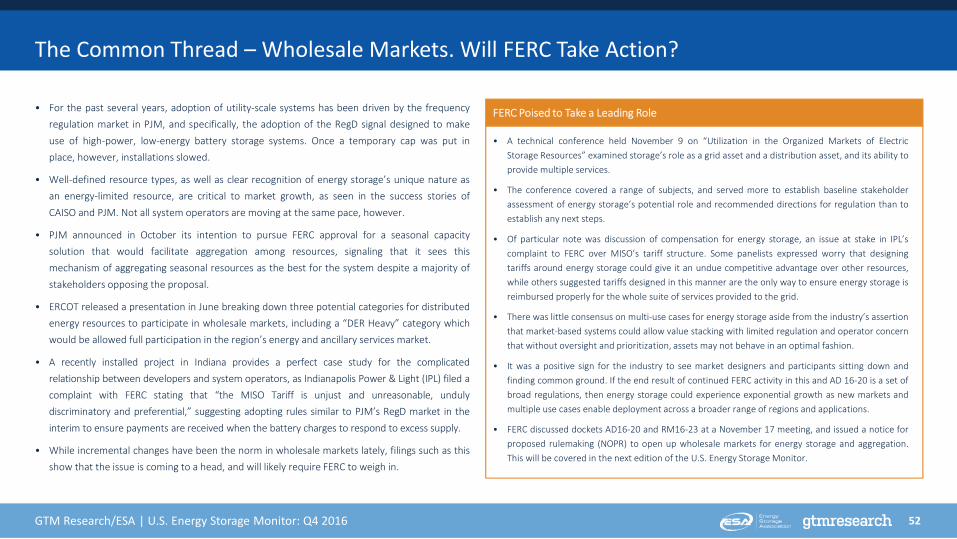
• For the past several years, adoption of utility-scale systems has been driven by the frequencyregulation market in PJM, and specifically, the adoption of the RegD signal designed to makeuse of high-power, low-energy battery storage systems. Once a temporary cap was put inplace, however, installations slowed.
• Well-defined resource types, as well as clear recognition of energy storage’s unique nature asan energy-limited resource, are critical to market growth, as seen in the success stories ofCAISO and PJM. Not all system operators are moving at the same pace, however.
• PJM announced in October its intention to pursue FERC approval for a seasonal capacitysolution that would facilitate aggregation among resources, signaling that it sees thismechanism of aggregating seasonal resources as the best for the system despite a majority ofstakeholders opposing the proposal.
• ERCOT released a presentation in June breaking down three potential categories for distributedenergy resources to participate in wholesale markets, including a “DER Heavy” category whichwould be allowed full participation in the region’s energy and ancillary services market.
• A recently installed project in Indiana provides a perfect case study for the complicatedrelationship between developers and system operators, as Indianapolis Power & Light (IPL) filed acomplaint with FERC stating that “the MISO Tariff is unjust and unreasonable, undulydiscriminatory and preferential,” suggesting adopting rules similar to PJM’s RegD market in theinterim to ensure payments are received when the battery charges to respond to excess supply.
• While incremental changes have been the norm in wholesale markets lately, filings such as thisshow that the issue is coming to a head, and will likely require FERC to weigh in.
The Common Thread – Wholesale Markets. Will FERC Take Action?
FERC Poised to Take a Leading Role
• A technical conference held November 9 on “Utilization in the Organized Markets of ElectricStorage Resources” examined storage’s role as a grid asset and a distribution asset, and its ability toprovide multiple services.
• The conference covered a range of subjects, and served more to establish baseline stakeholderassessment of energy storage’s potential role and recommended directions for regulation than toestablish any next steps.
• Of particular note was discussion of compensation for energy storage, an issue at stake in IPL’scomplaint to FERC over MISO’s tariff structure. Some panelists expressed worry that designingtariffs around energy storage could give it an undue competitive advantage over other resources,while others suggested tariffs designed in this manner are the only way to ensure energy storage isreimbursed properly for the whole suite of services provided to the grid.
• There was little consensus on multi-use cases for energy storage aside from the industry’s assertionthat market-based systems could allow value stacking with limited regulation and operator concernthat without oversight and prioritization, assets may not behave in an optimal fashion.
• It was a positive sign for the industry to see market designers and participants sitting down andfinding common ground. If the end result of continued FERC activity in this and AD 16-20 is a set ofbroad regulations, then energy storage could experience exponential growth as new markets andmultiple use cases enable deployment across a broader range of regions and applications.
• FERC discussed dockets AD16-20 and RM16-23 at a November 17 meeting, and issued a notice forproposed rulemaking (NOPR) to open up wholesale markets for energy storage and aggregation.This will be covered in the next edition of the U.S. Energy Storage Monitor.

54March 2017
For multiple reasons, 2016 was a watershed year for energy storage in terms of megawatt-hours of storage deployments. Now the industry is gearing up for new challenges against the
backdrop of a new presidential administration. To assume that 2017 will be any less critical of a year for energy policy and market changes would be incorrect. As the new Trump
administration fills its energy and environment teams, it will be a source of immense anxiety in the energy community. At the time of writing this report, Scott Pruitt was confirmed to
lead U.S. EPA, while the nomination of Gov. Rick Perry for U.S. DOE had gone through confirmation hearings, but hadn’t been voted on by the Senate. Without staffing of the two most
relevant federal agencies, and a lack of detailed White House energy agenda, it is still premature to speculate about which federal policies will directly (or indirectly) impact energy
storage markets. Moves by the DOE and the EPA, as well as actions taken by the Congress and the executive branch, will be the central theme this year. Beyond the more prominent
activities at these agencies that may dominate the news cycle, there are several other federal, state and regional energy storage trends to keep an eye on (arguably more closely) in
2017. The activities to watch for in 2017 are:
• The future of the Federal Energy Regulatory Commission’s notice of proposed rulemaking on electric storage participation in RTO/ISO Markets
• California’s Aliso Canyon energy storage performance
• State storage mandates: Massachusetts and Oregon setting targets and second-round procurement in California
• Increasing role of energy storage in resource planning and utility procurement
• Dispatchable solar and microgrids
3) Five Trends in Store for 2017

53GTM Research/ESA | U.S. Energy Storage Monitor: Q4 2016
• New York represents a market in flux. The state’s Reforming the Energy Vision (REV)initiative acknowledges that “the electric industry is in transition," but none of theproposals put forward go far enough to establish a functioning and mature front-of-the-meter energy storage market in the state.
• Despite a broad, overarching vision and a recognition of the need for change, themarket remains a maze of stakeholders and proposed changes. This complexity mirrorsthe fact that no one technology can exist in a vacuum anymore, but the scale of theundertaking has resulted in a multitude of divergent approaches with the hope thatthey will dovetail into a comprehensive overhaul.
• Front-of-the-meter energy storage could benefit from NY’s distributed energy roadmap,the New York City 100 MWh of energy storage by 2020 mandate, and non-wiresalternatives RFPs, but none of these provide a cohesive market structure that wouldallow utility-scale storage to flourish.
• The question remains whether these divergent proposals will result in true movementtoward a utility-scale-storage-friendly environment. For now the question remainsunanswered, though with more guidance and structure (particularly from NYISO), New Yorkhas shown it has the appetite and the top-down mandate to make energy storage work.
The Wild Card: New York
DistributedEnergy
Roadmap
Non-WiresAlternative RFPs
NYC 100MWh
StorageMandate
Source: GTM Research
New York’s Reforming Energy Vision: Varied Proposals Circling the Core Issues

GTM Research/ESA | U.S. Energy Storage Monitor: Q4 2016
Behind-the-Meter Market Trends5.
74GTM Research/ESA | U.S. Energy Storage Monitor: Q4 2016
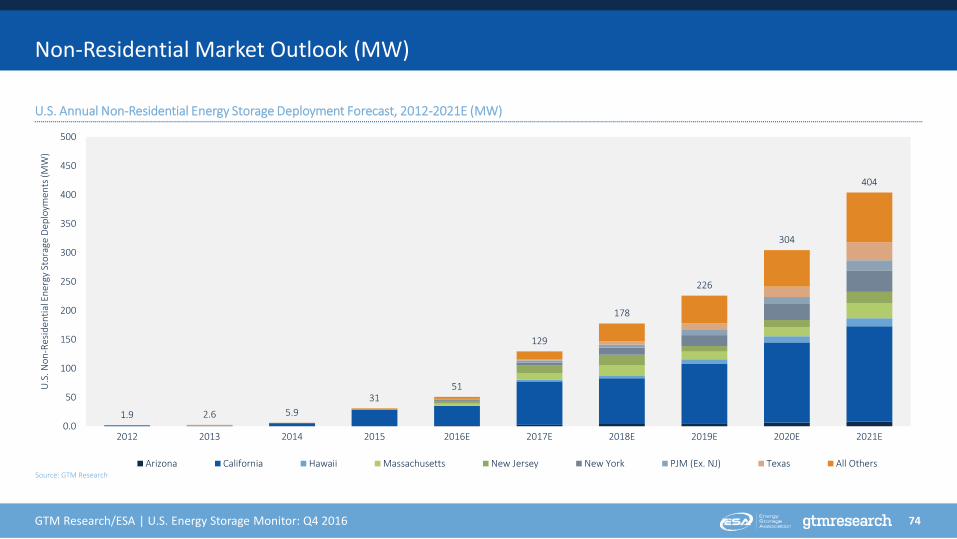
Non-Residential Market Outlook (MW)
U.S. Annual Non-Residential Energy Storage Deployment Forecast, 2012-2021E (MW)
Source: GTM Research
1.9 2.6 5.931
51
129
178
226
304
404
0.0
50
100
150
200
250
300
350
400
450
500
2012 2013 2014 2015 2016E 2017E 2018E 2019E 2020E 2021E
U.S
. Non
-Res
iden
tial E
nerg
y St
orag
e De
ploy
men
ts (M
W)
Arizona California Hawaii Massachusetts New Jersey New York PJM (Ex. NJ) Texas All Others
71GTM Research/ESA | U.S. Energy Storage Monitor: Q4 2016
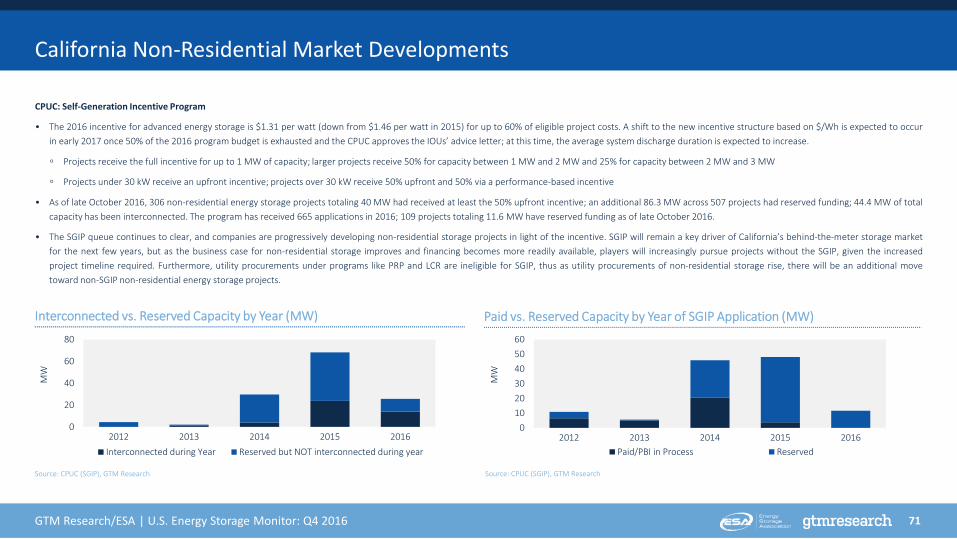
CPUC: Self-Generation Incentive Program
• The 2016 incentive for advanced energy storage is $1.31 per watt (down from $1.46 per watt in 2015) for up to 60% of eligible project costs. A shift to the new incentive structure based on $/Wh is expected to occurin early 2017 once 50% of the 2016 program budget is exhausted and the CPUC approves the IOUs’ advice letter; at this time, the average system discharge duration is expected to increase.
◦ Projects receive the full incentive for up to 1 MW of capacity; larger projects receive 50% for capacity between 1 MW and 2 MW and 25% for capacity between 2 MW and 3 MW
◦ Projects under 30 kW receive an upfront incentive; projects over 30 kW receive 50% upfront and 50% via a performance-based incentive
• As of late October 2016, 306 non-residential energy storage projects totaling 40 MW had received at least the 50% upfront incentive; an additional 86.3 MW across 507 projects had reserved funding; 44.4 MW of totalcapacity has been interconnected. The program has received 665 applications in 2016; 109 projects totaling 11.6 MW have reserved funding as of late October 2016.
• The SGIP queue continues to clear, and companies are progressively developing non-residential storage projects in light of the incentive. SGIP will remain a key driver of California’s behind-the-meter storage marketfor the next few years, but as the business case for non-residential storage improves and financing becomes more readily available, players will increasingly pursue projects without the SGIP, given the increasedproject timeline required. Furthermore, utility procurements under programs like PRP and LCR are ineligible for SGIP, thus as utility procurements of non-residential storage rise, there will be an additional movetoward non-SGIP non-residential energy storage projects.
California Non-Residential Market Developments
Source: CPUC (SGIP), GTM Research Source: CPUC (SGIP), GTM Research
Interconnected vs. Reserved Capacity by Year (MW) Paid vs. Reserved Capacity by Year of SGIP Application (MW)
0
20
40
60
80
2012 2013 2014 2015 2016
MW
Interconnected during Year Reserved but NOT interconnected during year
0102030405060
2012 2013 2014 2015 2016
MW
Paid/PBI in Process Reserved
73GTM Research/ESA | U.S. Energy Storage Monitor: Q4 2016
GTM Research analysis suggests that there will be three broad application areas for non-residential energy storage: demand-charge management, resiliency and backup, and grid andwholesale market services
Demand-charge management: A majority of commercial and industrial customers pay as much as 50% of their electricity bills in demand charges. Energy storage offers peak demand-reduction opportunities, leading to 20% to 30% electricity bill savings in many cases. Markets with high demand-charge tariffs (upward of $15/kW to $30/kW) represent a particularlyattractive opportunity already, and by 2021, we anticipate even markets with tariffs of $11/kW and above will start to look attractive.
Resiliency and backup: Commercial and industrial customers can be sensitive to outages due to expensive equipment and critical facilities. States in the Northeast have establishedprograms to increase grid resiliency, and states in the Northwest are pursuing resiliency policies, relying on energy storage along with other upgrades. However, customers with existingbackup power needs may already possess this type of infrastructure in the form of diesel generators, in which case the value proposition for storage requires an additional benefit suchas electricity bill reduction or reducing carbon emissions.
Grid and wholesale market services: California utilities have been at the forefront of exploring the use of energy storage for grid services, including demand response, ancillary servicesand local capacity. In September 2016, SCE awarded 50 MW of contracts for demand response from non-residential energy storage and energy conservation under utility’s PreferredResources Pilot program. The New York REV initiative has entered into its demonstration phase, in which several pilot projects involve energy storage. Hawaii recently introduced ademand response plan that proposes four grid services for which it could procure energy storage and other distributed resources.
Non-Residential Market Outlook: Applications

61GTM Research/ESA | U.S. Energy Storage Monitor: Q4 2016
California remains the leader in the U.S. behind-the-meter energy storage market, both in terms of total megawatts deployed and policies that directly support the state’s energy storagemarket. Behind-the-meter storage increasingly has a role to play in programs to provide grid services, and the outcome of policy decisions made today are priming behind-the-meterstorage to play a more significant role in future grid modernization planning.
• Second Round of SCE’s Preferred Resources Pilot: In September 2016, SCE announced 125 MW worth of contracts under its second round of the PRP program, which seeks to explorehow distributed energy resources can support the electric grid. Behind-the-meter (BTM) awards included 40 MW from Advanced Microgrid Solutions (non-residential), 10 MW fromNextEra (non-residential) and 5 MW from Swell Energy (residential). Procurements of this type indicate that electric utilities such as SCE are exploring the potential of aggregated BTMstorage to supply value to the grid, such as via load reduction. As distributed energy resources such as behind-the-meter storage deployments increase, utilities are increasinglyexpected to seek to aggregate and dispatch these resources; in order for this type of plan to be feasible, utilities must start exploring the potential of these resources at smaller scale,before they become ubiquitous or risk missing an opportunity or, worse, have to deal with potential challenges that arise as DER deployment reaches critical mass. Results of SCE’sPRP will provide useful results for other utilities examining use cases for aggregated BTM energy storage.
• AB 1637: In August 2016, the California State Legislature proposed amendments to AB 1637, which were approved by the governor in September 2016. The bill doubles the maximumannual collection the CPUC may authorize for the Self-Generation Incentive Program (SGIP) compared to the amount authorized for the 2008 SGIP, authorizing an additional $249million for the program. Though SGIP funds technology other than storage, policies approved in June 2016 created a 75% carve-out for energy storage, meaning that the majority ofthis funding will go toward energy storage. California’s BTM storage market is the largest in the U.S. today, which is largely attributable to the SGIP. Increasing SGIP funding will directlyinfluence greater BTM energy storage deployment, particularly as system prices continue to fall. However, SGIP funds historically have been exhausted quickly, and the increase infunding is likely to simply increase the near-term deployment of storage rather than extend the length of the program, as even this higher budget is expected to be rapidly subscribed.As of late October 2016, 126 MW of non-residential storage and 2.3 MW of residential storage had either received or reserved funds from SGIP; doubling the funding, coupled withstorage price reductions, will lead to an additional 50+ MW for BTM storage compared to the previous scenario, with an especially strong upside for the residential segment, whichhas a 15% carve-out under rules expected to be implemented in early 2017.
California Remains the Behind-the-Meter Leader With More Utility Contracts

62GTM Research/ESA | U.S. Energy Storage Monitor: Q4 2016
• AB 2861: In September 2016, AB 2861 was approved by the governor. AB 2861 authorized the CPUC to set an expedited distribution grid interconnection dispute resolution processand resolve disputes within 60 days. The 60-day interconnection dispute resolution requirement will make the SGIP approval cycles much faster. While interconnection delays are notthe only cause of long SGIP project backlogs, the average number of days for SGIP applications to get interconnected has been at least 300 days for projects under program year 2015,a large drop from the 900+ days for program year 2011. AB 2861 will reduce interconnection uncertainties that tend to add to soft costs and create barriers for wider adoption ofbehind-the-meter energy storage.
• AB 2868: AB 2868, approved by the governor in September 2016, effectively creates an additional maximum 500-megawatt mandate for the three California IOUs (PG&E, SCE andSDG&E). These storage systems will have to be located on the distribution grid, and not more than 25% (i.e., 125 MW) will be behind-the-meter, with prioritization to investments forpublic-sector and low-income customers. This program may rely on SGIP funds, but that is yet to be determined. Regardless, this new mandate will lead to a significant upside inbehind-the-meter energy storage in Calif. in the early 2020s, as storage procured under the California storage mandate AB 2514 must be installed by 2024.
• Resolution E-4803: In September 2016, the CPUC issued a resolution, with modifications, to approve 2017 Demand Response Auction Mechanism (DRAM) contracts for PG&E. CPUCapproved 14 contracts, but required PG&E to procure either up to its DRAM budget cap of $6 million or to a point where there are clear outlier bids. Energy storage companies have woncontracts under DRAM, and thus it is possible that PG&E could procure additional energy storage under DRAM, though storage is unlikely to account for more than a few megawatts.
A Quartet of Assembly Bills Further Storage Gains in the Golden State

63GTM Research/ESA | U.S. Energy Storage Monitor: Q4 2016
SGIP Advice Letter: In October 2016, SoCalGas filed an advice letter on behalf of PG&E, SCE and the Center for Sustainable Energy regarding new rules for the Self-Generation IncentiveProgram. The advice letter included proposed revisions to the SGIP.
Recommendations affecting energy storage include the total amount of funds set aside for the residential energy storage carve-out that will be accounted for across the four programadministrator territories; the incentive step decline increasing from $0.05/Wh to $0.10/Wh if an incentive step is fully subscribed across all program administrator territories within 10calendar days of opening; program administrators being unable to issue conditional reservations to a developer that has already received reservations in the active step of 20%;commercial storage systems being required to discharge the equivalent of 130 full discharges/year and residential systems being required to discharge the equivalent of 52 fulldischarges/year; priority selection in the SGIP lottery for storage systems paired with onsite renewables that charge 75% from the renewables, systems located in LADWP territory andsystems located in West Los Angeles Local Reliability Area of Southern California Edison’s service territory; and declining incentive structures for long-duration storage projects. Theadvice letter is awaiting approval by the CPUC, and implementation of the new SGIP rules is expected in Q1 2017.
New program rules are expected to benefit the energy storage market in Calif. by increasing competition, and they are expected to lead to an increase in the average discharge durationof behind-the-meter systems, though this will be somewhat tempered by rules regarding incentive step-downs for longer-duration systems. If changes to the allocation of funds for theresidential storage carve-out are approved, then it’s possible residential storage capacity could be more concentrated in one or a few regions, given the lack of requirement for eachprogram administrator territory to adhere to the 15% carve-out.
California’s Modified SGIP Set to Take Off Early Next Year

64GTM Research/ESA | U.S. Energy Storage Monitor: Q4 2016
Massachusetts has historically seen little energy storage market activity, particularly in the behind-the-meter segment. However, recent market developments position Massachusetts tobecome a significant market for energy storage in the next few years, though this outcome depends on final policy decisions to be made within the next six-12 months.
• State of Charge Massachusetts Energy Storage Initiative Study: In September 2016, the Massachusetts Department of Energy Resources (MA DOER) issued the study performed incollaboration with independent consultants. It analyzed the potential for energy storage in Mass. to fulfill multiple niches and found that 1,766 MW of advanced energy storage wouldmaximize ratepayers’ benefits, though it only recommended 600 MW be pursued by 2025, which is expected to result in $800 million in ratepayer benefits; this disconnect resultsfrom the fact that 1,766 MW represents the ideal degree of ratepayer benefits without market barriers, while 600 MW follows from the policy recommendations outlined in thestudy. The report creates a framework for energy storage policy in Mass., and recommends a suite of policies to support energy storage, including incentive and rebate programs, andstorage-specific rules for retail and wholesale market participation. The study will inform the upcoming state storage mandate (to be decided on by December 31, 2016), the $10million energy storage demonstration project RFP (to be issued in November 2016) and potentially update the MA Solar Initiative to include storage (timeline unclear). The studynotes that behind-the-meter storage can provide multiple benefits to the host customer (e.g., electricity bill reduction) and the electric system (e.g., increased renewable integration).The study also notes the value of utility aggregated behind-the-meter systems to provide grid services, and it seems likely Mass. utilities will pursue DER aggregation pilots within thenext one to two years. The launch of the study will likely influence greater provision of storage-centric policies in Massachusetts and encourage storage developers to deploy projectsin the state, leading to an upside for the market as a whole.
• Advancing Commonwealth Energy Storage (ACES): The ACES program is an energy storage RFP developed jointly by MA DOER and the Massachusetts Clean Energy Center (MassCEC).Program budget was approved in September 2016, with $10 million for storage projects and $1 million for monitoring performance. The RFP is expected to be released in November2016 and will seek energy storage projects to demonstrate multiple value streams. MassCEC expects ACES to fund 10 to 15 small-scale energy storage projects in order to understanddifferent business models, with $100,000 to $1 million offered per project. Given the size of the program, and an expected 50% cost share from program awardees, as well asexpected cost reductions, the RFP could result in up to 22 MWh of behind-the-meter energy storage in Massachusetts, a significant amount considering that to date less than 1 MWhof behind-the-meter storage is operating in the state.
Massachusetts Takes Charge with ‘State of Charge’ Study

65GTM Research/ESA | U.S. Energy Storage Monitor: Q4 2016
• Potential Storage Mandate by End of 2016: In August 2016, H. 4568 was signed into law. Under H. 4568, MA DOER will determine whether to set a storage procurement target byDecember 31, 2016, with procurement required by January 1, 2020. If pursued, procurement targets will be determined by July 1, 2017 and will be evaluated at least once everythree years. The bill also permits utility ownership of storage. Given the results of the State of Charge study and opportunities for storage in Massachusetts, the procurement targetmay be up to 600 MW, though much of the target is expected to be for front-of-the-meter projects.
• MA Solar Initiative May Include Storage: In September 2016, MA DOER presented a suite of proposals for the next phase of the MA Solar Initiative, including a provision for solar-plus-storage projects, with a goal of encouraging co-located renewables and energy storage. This would take the form of an incentive adder for solar PV projects that add energy storage;however, to date the size of the incentive has not been determined, though example incentives in the presentation range from $0.03/kWh to $0.05/kWh. Implementing a storageadder would contribute to an upside in storage deployed on both sides of the meter, albeit with the specific size of the increase dependent upon the level at which the incentives areset and the rate of energy storage system price reductions.
Massachusetts DOER Has the Task of Setting Storage Targets

66GTM Research/ESA | U.S. Energy Storage Monitor: Q4 2016
New York is in the process of transitioning the state’s electrical infrastructure via its Reforming the Energy Vision (REV) program. Already, a number of initiatives have included a behind-the-meter energy storage component either explicitly or implicitly, including the Brooklyn-Queens Demand Management Program and the Clean Virtual Power Plant pilot. Electricalcongestion and high demand charges are pressing issues in New York City, though to date, fire and building codes have hampered the growth of the storage market. Nevertheless, NewYork continues to explore policies and programs that will push storage forward.
• New York City Storage Target: in September 2016, Mayor Bill de Blasio announced an energy storage target for New York City of 100 MWh by 2020. Energy storage has a clear roleto play in New York City, an area with high electricity demand, grid congestion and aging infrastructure. To date, there has not been a specific distinction for how much of thisstorage will be behind-the-meter versus front-of-the-meter, though perhaps projects like the 12 MWh Distributed Energy Storage System under the Brooklyn-Queens DemandManagement Program will be counted toward the target; it is likely that a significant share will be behind-the-meter given electricity demand and the desire for greater resiliency,particularly of critical infrastructure. NYC experienced electrical outages following Hurricane Sandy in late 2012, and thus prioritizing greater resiliency is a key focus of the citygoing forward. This policy also marks NYC as the first city in the U.S. to set an energy storage target, and it seems likely that other cities hoping to address similar challenge willfollow in NYC’s footsteps in the next several years.
• Value of DER Straw Proposal and Staff Report/Recommendations (Case 15-E-0751): In August 2016, the New York State Department of Public Service (NYSDPS) issued a straw proposalregarding the valuation of distributed energy resources (DERs), focusing on the adoption of an interim valuation methodology to be implemented in advanced of a refined DERvaluation methodology to be adopted by December 31, 2018. In October 2016, the NYSDPS issued a Staff Report and Recommendations regarding DER valuation. Though the reportdoes not focus solely on storage, the ongoing discussion in NY around “the value of D,” that is, the value that DERs provide to the grid, is ongoing, and the report suggests developinga proposal in early 2017 to inform commission action on storage not paired with NEM-eligible generation. Determining an adequate valuation of DERs has massive implications forstorage, as several key value streams include reducing strain on the grid at specific nodes. Therefore, determination of a value for DERs can spur additional storage deployment in the2019 and beyond timeframe depending upon the level set. Furthermore, future proceedings addressing specifically how storage will be accounted for are key for influencing the roleenergy storage can play as New York pursues grid modernization programs.
New York City the First in Nation With Storage Target

67GTM Research/ESA | U.S. Energy Storage Monitor: Q4 2016
Several other state markets experienced market developments affecting the state’s energy storage market. New Jersey, like much of the Northeast, is focusing on increasing resiliency, withstorage offering one avenue to achieve this goal. Following recent net-energy metering reforms, Nevada has become a state of greater interest for behind-the-meter energy storage, a pointfurther cemented as the NV PUC considers an investigation of energy storage technology. Washington’s Clean Energy Fund previously supported energy storage projects, and while the nextphase of the program has not increased its support of storage significantly, there is still notable forward motion in developing storage as part of the state’s cleantech cluster.
• New Jersey Community Microgrid Program: In August 2016, the New Jersey Board of Public Utilities issued a draft for the Town Center Distributed Energy Resource MicrogridFeasibility Study Incentive Program, with up to $200,000 available for microgrid feasibility studies. While the program doesn’t explicitly include energy storage, microgrids areincreasingly including energy storage resources. Resiliency is a key focus for New Jersey following storms such as Hurricane Sandy, and energy storage offers the opportunity toprovide additional reliability and resiliency. There have been no updates to this program as of late October 2016, and it is unclear what the timeline for feasibility studies will be; it isalso unclear how subsequent phases, involving actual microgrid deployments, will be structured. Therefore, at present, it remains difficult to determine how much non-residentialenergy storage will be implemented as a result of the program.
• Nevada PUC Investigation into Energy Storage (Docket 16-01013): In September 2016, the Public Utilities Commission of Nevada issued procedural orders under the state’sinvestigation into energy storage, which formally opened in January 2016. The orders request comments on inverter standards and requirements, communication protocols andstandards, as well as whether the initiative should move forward following passage of the state’s Energy Choice Initiative. Nevada has recently experienced debate around net-metering reform and the role storage can play in modernizing the grid; as such, if the investigation continues to move forward, a significant upside can be expected as the potentialfor storage to integrate renewables and augment the state’s grid is explored, though the timeline of the investigation and the size of the potential upside remain unclear at present.
• Updates from Washington’s Clean Energy Fund 2: In September 2016, the Washington Department of Commerce announced $7 million in grants for clean energy projects under theClean Energy Fund 2. The grant funding will be matched by $12.3 million in non-state funding. Funding awardees include Demand Energy, an energy storage system and softwarevendor, and Battery Informatics, a startup focused on battery control systems. Specific project details have not been publicly announced, but the awards are expected to result in upto 2 MWh of additional non-residential energy storage in Washington.
Other Notable Behind-the-Meter Market Developments