Embed Size (px)
Citation preview

Sales and Marketing Sentiment Study

2 © 2015 Callidus Software Inc. All Rights Reserved.
INTRODUCTIONSales and marketing alignment is an ongoing obsession for many vendors, thought leaders and sales and marketing managers. The need for the two organizations to work in synchrony is increasingly well understood, as is the impact of misalignment.
According to IDC, B2B companies’ failure to align sales and marketing teams around the right processes and technologies costs them more than 10 percent of revenue per year. For a billion-dollar company, that’s $100 million left on the table.
The flip side of that: getting it right is lucrative. A 2013 study by Aberdeen Group showed that less well-aligned companies saw a 7 percent annual decrease in revenues, while highly-aligned organizations saw growth of 32 percent.
Sirius Decisions echoed this. They found that B2B companies with highly-aligned marketing and sales operations achieved 24 percent faster three-year revenue growth and 27 percent faster three-year profit growth.
But in order to achieve these results, sales and marketing have to be willing to work together toward common goals, and their organizations must be oriented toward alignment. In CallidusCloud’s view, that requires a few conditions to be met:
▶ Mutual respect between sales and marketing ▶ Mutual use of a common set of data ▶ Use of technology that encourages alignment (vs. reinforcing data silos) ▶ Full adoption of technology by sales and marketing personnel
These conditions provide a framework for alignment; within that framework, specific issues within sales and marketing organizations can be worked out and sales and marketing can establish a more collaborative relationship.
To assess how widespread this framework may be, we asked sales pros and marketers the same questions, examining opinions on technology, processes and professional perceptions. Each question and its results are presented below with a brief analysis of the study results.
The study sample included 211 respondents contacted through email (via CallidusCloud’s marketing list), the SellingPower newsletter and through social media. The results of this study, while valuable, are the first step in an ongoing examination of sales and marketing trends; the survey will be repeated at regular intervals, with this initial study as a benchmark.

3 © 2015 Callidus Software Inc. All Rights Reserved.
Remarkably, the sample split between sales and marketing was nearly perfect. This allowed the survey questions to then be split for analyses of differences in opinion between sales and marketing.
Question 1: In which role do you work, primarily?
Aggregate Marketing Sales
Mean: 2.18Response: 211
Question 2: What is your company’s primary sales target?
1 - SMB companies (fewer 250 employees) ---- 28.44% (60)
2 - Mid-sized companies (251 to 1500 employees) ---- 33.65% (71)
3 - Enterprise companies(more than 1500 employees) ---- 29.38% (62)
4 - Consumer buyers ---- 8.53% (18)
Mean: 2.09Response: 106
1 - SMB companies (fewer 250 employees) ------- 31.13% (33)
2 - Mid-sized companies (251 to 1500 employees) ------ 34.91% (37)
3 - Enterprise companies (more than 1500 employees) ------ 27.36% (29)
4 - Consumer buyers ------ 6.6% (7)
Mean: 2.09Response: 106
1 - SMB companies (fewer 250 employees) ------- 25% (26)
2 - Mid-sized companies (251 to 1500 employees) ------ 32.69% (34)
3 - Enterprise companies (more than 1500 employees) ------ 31.73% (33)
4 - Consumer buyers ------ 10.58% (11)
Aggregate Marketing Sales
Mean: 1.5 Mean: 2 Mean: 1Response: 211 Response: 106 Response: 105
1 - Sales ---------- 49.76% (105) 1 - Sales ---------- 0% (0) 1 - Sales ---------- 100% (105)
2 - Marketing ---------- 50.24% (106) 2 - Marketing ---------- 100% (106) 2 - Marketing ---------- 0% (0)
The vast majority of respondents sell and market to B2B businesses. An nearly even split between SMB, mid-sized and enterprise companies further allows analysis of sales and marketing issues by market size.

4 © 2015 Callidus Software Inc. All Rights Reserved.
Mean: 1.83 Mean: 1.62 Mean: 2.03
Response: 210 Response: 105 Response: 104
Question 4: Why did you get into sales or marketing?
1 - North America --------- 66.67% (140) 1 - North America --- 72.38% (76) 1 - North America --- 61.54% (64)
2 - South America --------- 1.43% (3) 2 - South America ----- 1.9% (2) 2 - South America ----- 0.96% (1)
3 - Europe --------- 18.1% (38) 3 - Europe ----- 18.1% (19) 3 - Europe ----- 17.31% (18)
4 - Asia --------- 10% (21) 4 - Asia --------- 6.67% (7) 4 - Asia --------- 13.46% (14)
5 - Africa/Middle East --------- 3.81% (8) 5 - Africa/Middle East ----0.95% (1) 5 - Africa/Middle East ---- 6.73% (7)
Aggregate Marketing Sales
The vast majority of respondents are based in North America, with significant numbers in Europe and Asia. However, the sample sizes for regions besides North America are not statistically significant, so we will not break out answers by region until the next iteration of the study.
Question 3: Where in the world are you based?
Mean: 3.75
Mean: 3.9 Mean: 3.58
Response: 210 Response: 106 Response: 103
1 - I believe it offers the best earning potential/promotion prospects -- 13.33% (28)
1 - I believe it offers the best earning potential/promotion prospects ------- 5.66% (6)
1 - I believe it offers the best earning potential/promotion prospects ------- 21.36% (22)
2 - I enjoy being creative -- 20.48% (43)
2 - I enjoy being creative ---------- 25.47% (27)
2 - I enjoy being creative ---------- 15.53% (16)
3 - Gives me the skills to run my own business one day -- 6.19% (13)
3 - Gives me the skills to run my own business one day ----- 4.72% (5)
3 - Gives me the skills to run my own business one day ----- 7.77% (8)
4 - I am attracted to the way the profession is -- 8.1% (17)
4 - I am attracted to the way the profession is ------------ 13.21% (14)
4 - I am attracted to the way the profession is ------------ 2.91% (3)
5 - I think sales/marketing has the ability to impact an organization's future -- 41.9% (88)
5 - I think sales/marketing has the ability to impact an organization's future ---- 39.62% (42)
5 - I think sales/marketing has the ability to impact an organization's future ---- 43.69% (45)
6 - Other -- 10% (21)
6 - Other ----------- 11.32% (12) 6 - Other ----------- 8.74% (9)
Aggregate Marketing Sales
5 © 2015 Callidus Software Inc. All Rights Reserved.
This question offered a view into the main motivations of the two professions. Some areas of difference were predictable: 25.47 percent of marketers chose their profession mostly because they enjoy being creative (vs. 15.53 percent of sales pros); 21.36 percent of sales pros chose sales because it offered them the best earning potential and promotional prospects (vs. 5.66 for marketers). The most notable difference was in the area of change: 13.21 percent of marketers said they were most attracted to marketing because of how fast the profession was changing, but only 2.91 percent of sales pros felt the same enthusiasm for change.
As notable as these responses were, the top answer for both sales and marketing was the same. “I think sales and marketing has the ability to impact an organization’s future” was cited as the major motivator for career choice by 41.90 percent of the respondents – 43.69 of sales pros and 39.60 percent of marketers. Sales and marketing pros want to make an impact.
Mean: 1.93Mean: 1.93 Mean: 1.92Response: 209Response: 105 Response: 103
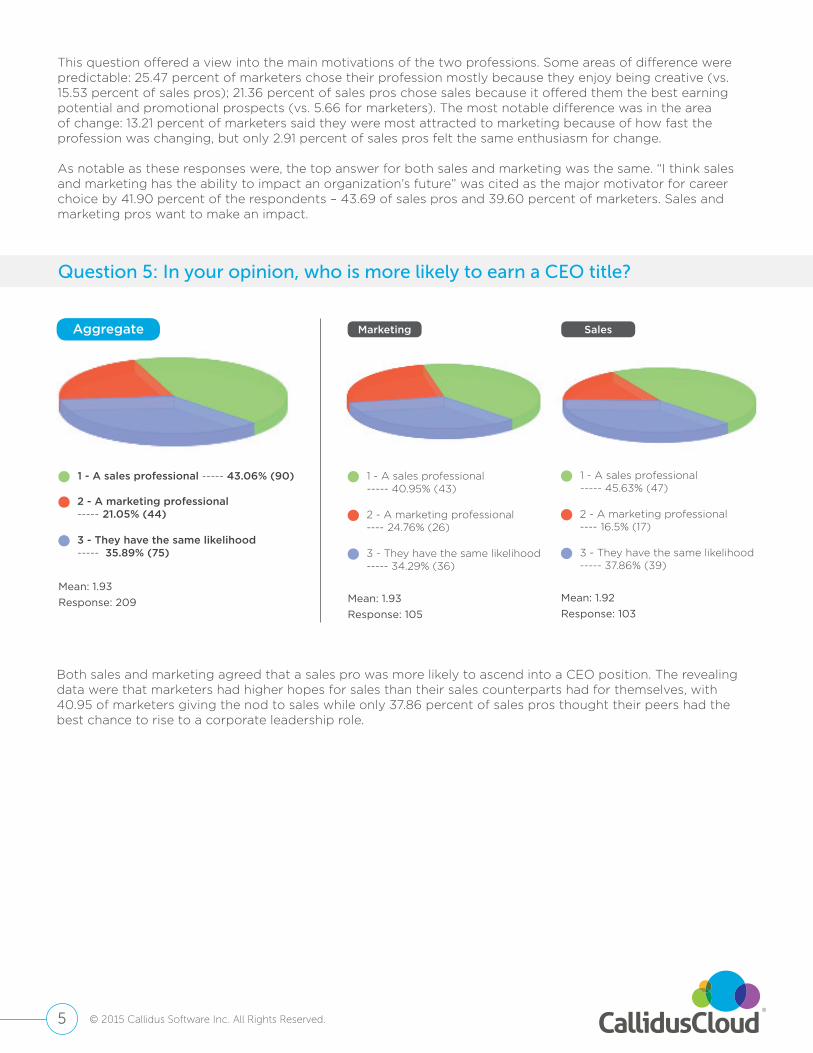
1 - A sales professional ----- 43.06% (90) 1 - A sales professional ----- 40.95% (43)
1 - A sales professional ----- 45.63% (47)
2 - A marketing professional ----- 21.05% (44) 2 - A marketing professional
---- 24.76% (26)2 - A marketing professional ---- 16.5% (17)
3 - They have the same likelihood ----- 35.89% (75) 3 - They have the same likelihood
----- 34.29% (36)3 - They have the same likelihood ----- 37.86% (39)
Aggregate Marketing Sales
Both sales and marketing agreed that a sales pro was more likely to ascend into a CEO position. The revealing data were that marketers had higher hopes for sales than their sales counterparts had for themselves, with 40.95 of marketers giving the nod to sales while only 37.86 percent of sales pros thought their peers had the best chance to rise to a corporate leadership role.
Question 5: In your opinion, who is more likely to earn a CEO title?

6 © 2015 Callidus Software Inc. All Rights Reserved.
Aggregate Marketing Sales
Automation has long been recognized as the key to scaling up sales and marketing operations. Eliminating manual hand-offs of data and data re-entry is a key to eliminating errors, ensuring that data is shared, and avoiding the need for inflated headcount. After so many years of automation, the expectation is that most companies have much of the sales and marketing process managed through automation – but the numbers say otherwise. Only 2.39 percent of respondents said their processes were 100 percent automated, and another 10.53 said that their processes were between 75 and 99 percent automated. In other words, only 12.99 percent of the respondents said their company had automation in place for three quarters or more of the sales and marketing process.
That was the good news. The bad news was that a full third of respondents – 33.01 percent, to be exact – said that less than a quarter or their sales and marketing processes were automated. Another 31.1 percent said they had automated 50 to 74 percent of their processes and 22.7 percent said that 25-49 percent of their processes were automated. In this example, sales and marketing respondents were nearly identical in their responses.
Clearly, there are gaps in the software solutions most companies are employing to manage sales and marketing. This is reflected later in the survey in questions 17, 18 and 19, which show that most businesses are using a set of applications that may not integrate well and which may not encourage adoption among users.
Question 6: In your estimation, what percentage of your sales and marketing processes has been automated successfully?
Mean: 3.74Mean: 3.74 Mean: 3.74Response: 209Response: 104 Response: 104
1 - 100 percent ------ 2.39% (5) 1 - 100 percent ------- 2.88% (3) 1 - 100 percent ------- 1.92% (2)
2 - 75-99 percent ------ 10.53% (22) 2 - 75-99 percent ------- 10.58% (11) 2 - 75-99 percent ------- 10.58% (11)
3 - 50-74 percent ------ 31.1% (65) 3 - 50-74 percent --- 28.85% (30) 3 - 50-74 percent --- 32.69% (34)
4 - 25-49 percent ------ 22.97% (48) 4 - 25-49 percent ------ 25% (26) 4 - 25-49 percent ------ 21.15% (22)
5 - Less than 25 percent ------ 33.01% (69) 5 - Less than 25 percent ------- 32.69% (34)
5 - Less than 25 percent ------- 33.65% (35)

7 © 2015 Callidus Software Inc. All Rights Reserved.
Aggregate Marketing Sales
The responses to this question suggest that both marketing and sales have a similar, realistic view on alignment. Response percentages were close, with marketing having slightly more extreme opinions, both positively and negatively.
Only 15.71 percent of all respondents said their organizations were fully aligned (marketing 17.14, sales 14.42); 56.19 percent said that their organizations were somewhat aligned (marketing 54.29, sales 57.69). In aggregate, the percentage of respondents who felt their organizations were fully or somewhat aligned was 71.9 percent (71.43 for marketing, 72.11 for sales).
On the negative side, 9.05 percent said their organizations were misaligned, but this number was split between the two sides - 11.43 percent of marketers, vs. 6.73 percent of sales pros. Respondents who said their organizations were somewhat misaligned totaled 19.05 percent, with 17.14 percent of marketing and 21.15 of sales pros offering that answer. In total, 28.01 percent of all respondents (28.57 for marketing vs. 27.68 for sales) reported their organizations being totally or somewhat misaligned.
The consistency in answers is a good thing. It indicates that the perception of alignment is something that is not viewed differently by sales and marketing – both see it as an issue for their organizations (whether good or bad) at similar rates. Sales and marketing may not be fully aligned, but in their perception of the degree of alignment in their organizations their alignment is remarkable.
Mean: 2.21Response: 210
1 - Fully aligned ------ 15.71% (33)
2 - Somewhat aligned ------ 56.19% (118)
3 - Somewhat misaligned ------ 19.05% (40)
4 - Misaligned ------ 9.05% (19)
Question 7: In your opinion, how well are your sales and marketing teams aligned?
Mean: 2.23 Mean: 2.2
Response: 105 Response: 104
1 - Fully aligned ------- 17.14% (18) 1 - Fully aligned ------- 14.42% (15)
2 - Somewhat aligned ------ 54.29% (57)
2 - Somewhat aligned ------ 57.69% (60)
3 - Somewhat misaligned ------ 17.14% (18)
3 - Somewhat misaligned ------ 21.15% (22)
4 - Misaligned ------- 11.43% (12) 4 - Misaligned ------- 6.73% (7)

8 © 2015 Callidus Software Inc. All Rights Reserved.
Aggregate Marketing Sales
Mean: 1.77
Mean: 1.77 Mean: 1.77Response: 211
Response: 106 Response: 104
1 - Data is fully shared between sales and marketing ----------- 37.44% (79)
1 - Data is fully shared between sales and marketing ----------- 34.91% (37)
1 - Data is fully shared between sales and marketing ----------- 39.42% (41)
2 - Some reports are shared between sales and ----------- 48.34% (102) 2 - Some reports are shared
between sales and -------- 52.83% (56)
2 - Some reports are shared between sales and -------- 44.23% (46)3 - Data is siloed between sales and
marketing ----------- 14.22% (30)3 - Data is siloed between sales and marketing ------ 12.26% (13)
3 - Data is siloed between sales and marketing ------ 16.35% (17)
Question 8: How well does your organization share lead data between sales and marketing?
According to the data, marketing is far more optimistic that lead data is being shared than sales. About the same percentage of marketers and sales pros (34.91 percent vs. 39.42 percent, respectively) said all data was shared. However, 16.35 percent of sales pros said lead data was siloed in their organizations (vs. 12.26 percent of marketers).
Less than 40 percent of the respondents (37.43 percent) reported full sharing, meaning that almost two-thirds (62.57) still had all or part of their lead data in systems that were visible only to marketing. These numbers are alarming – they point to a lack of visibility into lead data, which has been shown to be a key contributor to sales and marketing misalignment.
9 © 2015 Callidus Software Inc. All Rights Reserved.
Aggregate Marketing Sales
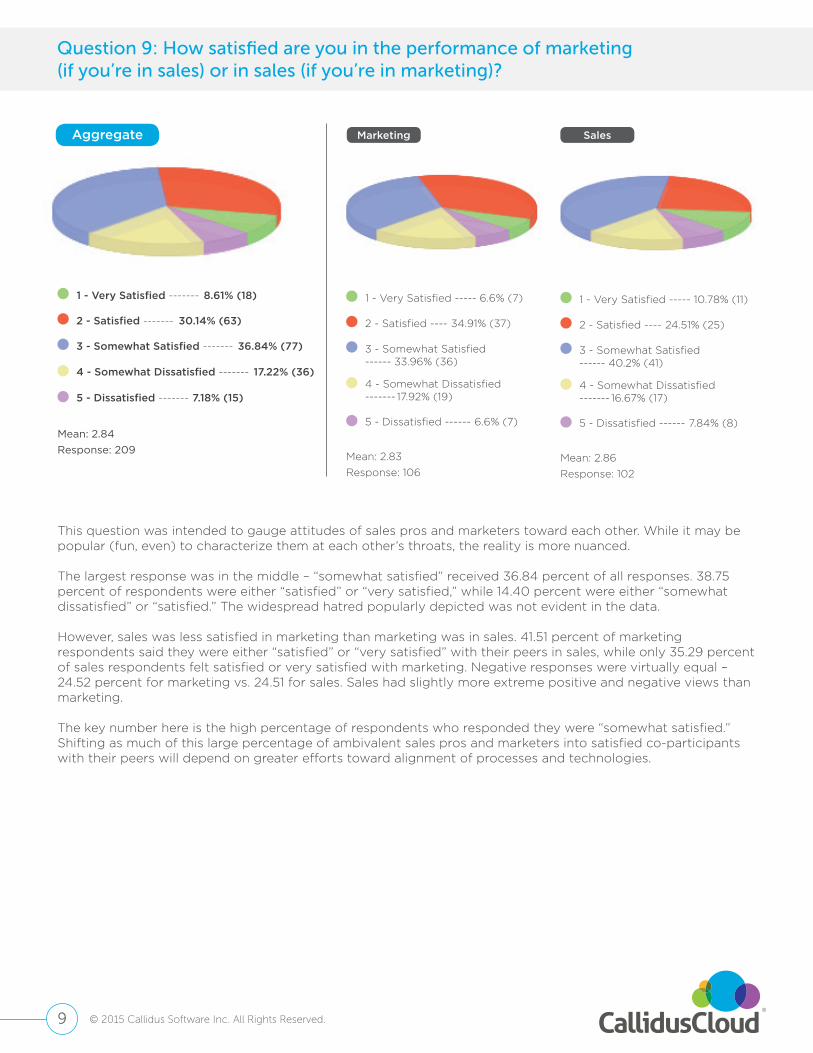
Question 9: How satisfied are you in the performance of marketing (if you’re in sales) or in sales (if you’re in marketing)?
Mean: 2.84
Mean: 2.83 Mean: 2.86Response: 209
Response: 106 Response: 102
1 - Very Satisfied ------- 8.61% (18) 1 - Very Satisfied ----- 6.6% (7) 1 - Very Satisfied ----- 10.78% (11)
2 - Satisfied ------- 30.14% (63) 2 - Satisfied ---- 34.91% (37) 2 - Satisfied ---- 24.51% (25)
3 - Somewhat Satisfied ------- 36.84% (77) 3 - Somewhat Satisfied ------ 33.96% (36)
3 - Somewhat Satisfied ------ 40.2% (41)
4 - Somewhat Dissatisfied ------- 17.22% (36)4 - Somewhat Dissatisfied ------- 17.92% (19)
4 - Somewhat Dissatisfied ------- 16.67% (17)5 - Dissatisfied ------- 7.18% (15)
5 - Dissatisfied ------ 6.6% (7) 5 - Dissatisfied ------ 7.84% (8)
This question was intended to gauge attitudes of sales pros and marketers toward each other. While it may be popular (fun, even) to characterize them at each other’s throats, the reality is more nuanced.
The largest response was in the middle – “somewhat satisfied” received 36.84 percent of all responses. 38.75 percent of respondents were either “satisfied” or “very satisfied,” while 14.40 percent were either “somewhat dissatisfied” or “satisfied.” The widespread hatred popularly depicted was not evident in the data.
However, sales was less satisfied in marketing than marketing was in sales. 41.51 percent of marketing respondents said they were either “satisfied” or “very satisfied” with their peers in sales, while only 35.29 percent of sales respondents felt satisfied or very satisfied with marketing. Negative responses were virtually equal – 24.52 percent for marketing vs. 24.51 for sales. Sales had slightly more extreme positive and negative views than marketing.
The key number here is the high percentage of respondents who responded they were “somewhat satisfied.” Shifting as much of this large percentage of ambivalent sales pros and marketers into satisfied co-participants with their peers will depend on greater efforts toward alignment of processes and technologies.
© 2015 Callidus Software Inc. All Rights Reserved.10
Aggregate Marketing Sales
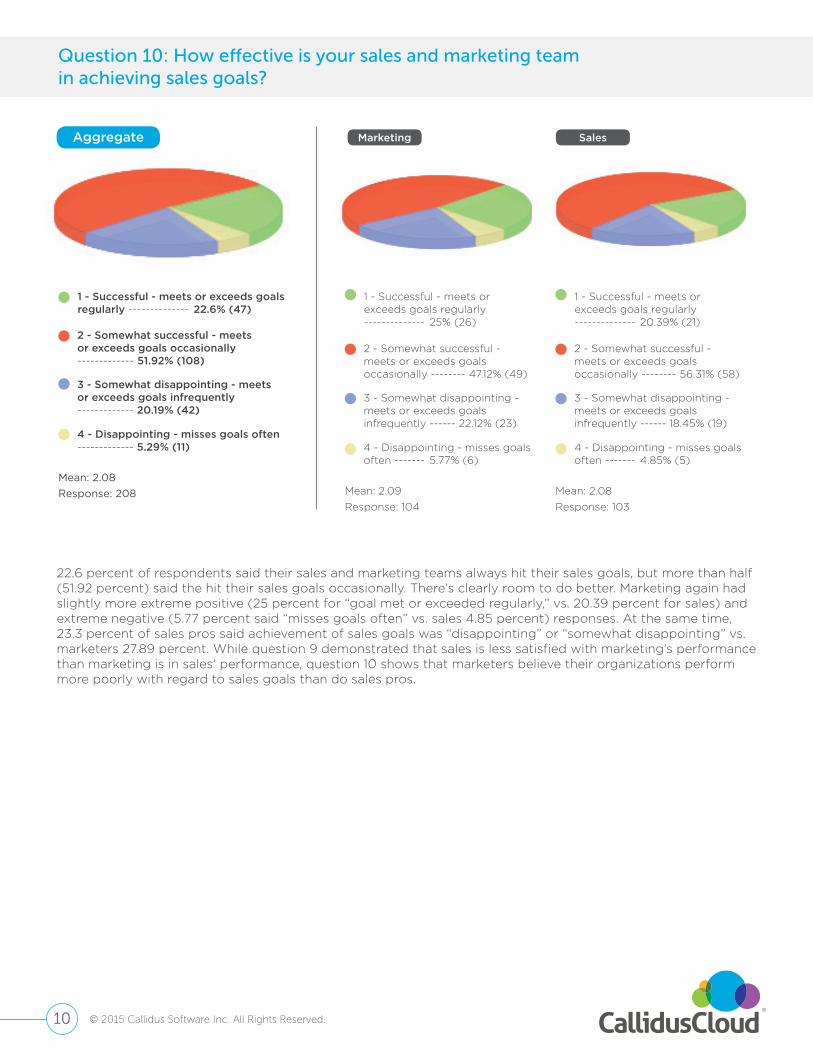
22.6 percent of respondents said their sales and marketing teams always hit their sales goals, but more than half (51.92 percent) said the hit their sales goals occasionally. There’s clearly room to do better. Marketing again had slightly more extreme positive (25 percent for “goal met or exceeded regularly,” vs. 20.39 percent for sales) and extreme negative (5.77 percent said “misses goals often” vs. sales 4.85 percent) responses. At the same time, 23.3 percent of sales pros said achievement of sales goals was “disappointing” or “somewhat disappointing” vs. marketers 27.89 percent. While question 9 demonstrated that sales is less satisfied with marketing’s performance than marketing is in sales’ performance, question 10 shows that marketers believe their organizations perform more poorly with regard to sales goals than do sales pros.
Mean: 2.08Mean: 2.09 Mean: 2.08Response: 208Response: 104 Response: 103
1 - Successful - meets or exceeds goals regularly -------------- 22.6% (47)
1 - Successful - meets or exceeds goals regularly -------------- 25% (26)
1 - Successful - meets or exceeds goals regularly -------------- 20.39% (21)
2 - Somewhat successful - meets or exceeds goals occasionally ------------- 51.92% (108)
2 - Somewhat successful - meets or exceeds goals occasionally -------- 47.12% (49)
2 - Somewhat successful - meets or exceeds goals occasionally -------- 56.31% (58)
3 - Somewhat disappointing - meets or exceeds goals infrequently ------------- 20.19% (42)
3 - Somewhat disappointing - meets or exceeds goals infrequently ------ 22.12% (23)
3 - Somewhat disappointing - meets or exceeds goals infrequently ------ 18.45% (19)
4 - Disappointing - misses goals often ------------- 5.29% (11) 4 - Disappointing - misses goals
often ------- 5.77% (6)4 - Disappointing - misses goals often ------- 4.85% (5)
Question 10: How effective is your sales and marketing team in achieving sales goals?

© 2015 Callidus Software Inc. All Rights Reserved.11
Aggregate Marketing Sales
Only 11.54 percent of respondents were able to say their sales forecasting was “very accurate,” with the majority (56.25 percent) reporting it was “somewhat accurate.” The dichotomy between sales and marketing was pronounced, however: 14.56 percent of sales respondents said their forecasting was accurate, but only 8.65 percent of marketing said the same. When “accurate” and “somewhat accurate” were taken together, they represented 71.84 percent of sales respondents; the same could be said for only 63.46 percent of marketers.
On the other end of the spectrum, 9.71 of sales respondents said that their forecasting was “inaccurate,” but 13.46 percent of marketing respondents held that opinion. Adding “inaccurate” and “somewhat inaccurate,” the percentages were 28.16 for sales but 36.54 for marketers.
According to the opinions of respondents, sales pros think they do a better job of forecasting than marketers do. Sales has a vested interest in defending its forecasts, but, at the same time, marketing has little visibility into forecasts, leading into a clash of perspectives.
Mean: 2.32
Mean: 2.41 Mean: 2.23
Response: 208
Response: 104 Response: 103
1 - Very accurate ------ 11.54% (24) 1 - Very accurate -------- 8.65% (9)
1 - Very accurate -------- 14.56% (15)
2 - Somewhat accurate ------ 56.25% (117)2 - Somewhat accurate -------- 54.81% (57)
2 - Somewhat accurate -------- 57.28% (59)3 - Somewhat inaccurate ------ 20.67% (43)
3 - Somewhat inaccurate ------ 23.08% (24)
3 - Somewhat inaccurate ------ 18.45% (19)
4 - Inaccurate ------ 11.54% (24)
4 - Inaccurate ------- 13.46% (14) 4 - Inaccurate ------- 9.71% (10)
Question 11: How accurate is your sales forecasting?

© 2015 Callidus Software Inc. All Rights Reserved.12
Aggregate Marketing Sales
Only 4.85 percent of all respondents said that 100 percent accuracy was required to be acceptable. The majority had a more realistic view: 54.37 percent said that accuracy between 80-99 percent was acceptable. Only 10.68 saw forecasts that were less than 60 percent accurate as acceptable.
57.84 percent of sales respondents said that accuracy above 80 percent was acceptable, an answer given by 61.13 percent of marketing respondents. This slightly higher expectation from marketing reflects a similar phenomena to the data in question 11; marketing has limited visibility into sales’ activities and so its expectations are higher.
Mean: 2.48
Mean: 2.1
Mean: 2.07 Mean: 2.15
Mean: 2.48Response: 206
Response: 207Response: 104 Response: 102
Response: 103
1 - 100 percent ------ 4.85% (10) 1 - 100 percent ------- 3.88% (4)
2 - 80-99 percent ------ 54.37% (112) 2 - 80-99 percent ----- 57.28% (59)
3 - 60-79 percent ------ 30.1% (62) 3 - 60-79 percent --- 27.18% (28)
4 - 30-59 percent ------ 9.71% (20)
4 - Is used by individual sales people/marketers and thus impact is hard to track ----------- 14.49% (30)
4 - Is used by individual sales people/marketers and thus impact is hard to track -------- 15.38% (16)
4 - Is used by individual sales people/marketers and thus impact is hard to track -------- 13.73% (14)
4 - 30-59 percent ------ 10.68% (11)
5 - Less than 30 percent ------ 0.97% (2) 5 - Less than 30 percent ------- 0.97% (1)
Question 12: What is an acceptable percentage of accuracy for sales forecasts?
Mean: 2.47Response: 102
1 - 100 percent ------- 5.88% (6)
2 - 80-99 percent ----- 51.96% (53)
3 - 60-79 percent --- 32.35% (33)
4 - 30-59 percent ------ 8.82% (9)
5 - Less than 30 percent ------- 0.98% (1)
Aggregate Marketing Sales
1 - Significantly ----------- 35.75% (74)
1 - Significantly ----- 38.46% (40) 1 - Significantly ----- 32.35% (33)
2 - Slightly ----------- 32.85% (68)
2 - Slightly ----- 31.73% (33) 2 - Slightly ----- 34.31% (35)
3 - Little ----------- 16.91% (35)
3 - Little ---- 14.42% (15) 3 - Little ---- 19.61% (20)
Question 13: In your opinion, has data analytics changed your team’s sales or marketing practices?

© 2015 Callidus Software Inc. All Rights Reserved.13
Marketing leads sales in this area. 38.46 percent of marketers reported that data analytics had “significantly” changed sales or marketing practices (vs. 32.35 percent of sales pros). The percentages flipped among those who answered “slightly,” with sales giving this response 34.31 percent of the time vs. marketing’s 31.73 percent. Still, marketing reported changes due to the use of analytics more often – 70.19 percent of the time vs. 66.66 percent for sales.
An alarming 14.49 percent of respondents (13.73 percent for sales, 15.38 percent for marketers) said that data analytics were used by individuals on their teams, making the impact difficult to track. This speaks to the fact that, in many organizations, the use of data analytics has not yet become part of key processes and, thus, the value of data analysis has not been realized across the organization.
Question 14: What are your concerns about the use of data analytics in sales and marketing?
1 - That I won't be able to make the data actionable --------- 22.77% (46)
1 - That I won't be able to make the data actionable ------ 20.95% (22)
1 - That I won't be able to make the data actionable ------ 25% (24)
2 - Non-compliance with privacy for customer data --------- 7.43% (15)
2 - Non-compliance with privacy for customer data -- 5.71% (6)
2 - Non-compliance with privacy for customer data -- 8.33% (8)
3 - Others in the company don't understand the value of the data --------- 27.72% (56)
3 - Others in the company don't understand the value of the data --------- 31.43% (33)
3 - Others in the company don't understand the value of the data --------- 23.96% (23)
4 - We don't have the right skills to analyze the data we have --------- 20.3% (41)
4 - We don't have the right skills to analyze the data we have ------------- 19.05% (20)
4 - We don't have the right skills to analyze the data we have ------------- 21.88% (21)
5 - We can't guarantee the quality of our data --------- 21.78% (44)
5 - We can't guarantee the quality of our data ---- 22.86% (24)
5 - We can't guarantee the quality of our data ---- 20.83% (20)
Aggregate Marketing Sales
Mean: 3.11 Mean: 3.17 Mean: 3.05
Response: 202 Response: 105 Response: 96
Conveying the importance of data was a prime concern for most of the respondents to this question, although this concern was viewed slightly differently depending on whether the respondents were in sales or marketing. The most common response was that others in the organization don’t understand the value of the data (27.72 percent of all respondents), with marketing (31.43 percent) citing this concern far more often than sales (23.96). That made it marketing’s top response, but sales’ top response was the fear they would not be able to make the data actionable (25 percent for sales, vs. 20.95 for marketing).
One in five respondents (20.5 percent) said their organizations lacked the talent to analyze the data they collected. There was little difference in the response between sales (21.88 percent) and marketing (19.05 percent), indicating a need for greater analytical assets – or, at least, enhanced training in data analytical tools and techniques – within sales and marketing teams.

© 2015 Callidus Software Inc. All Rights Reserved.14
Aggregate Marketing Sales
Mean: 2.25 Mean: 2.39 Mean: 2.11Response: 208 Response: 105 Response: 102
1 - Significantly ------ 24.04% (50) 1 - Significantly ----- 20% (21) 1 - Significantly ----- 28.43% (29)
2 - Slightly ------ 36.06% (75) 2 - Slightly -------- 32.38% (34) 2 - Slightly -------- 39.22% (40)
3 - Little ------ 30.77% (64) 3 - Little ------ 36.19% (38) 3 - Little ------ 25.49% (26)
4 - Is used by individual sales people/marketers and thus impact is hard to track ------ 9.13% (19)
4 - Is used by individual sales people/marketers and thus impact is hard to track ------- 11.43% (12)
4 - Is used by individual sales people/marketers and thus impact is hard to track ------- 6.86% (7)
Question 15: Has social media changed your sales/marketing process?
While social media is often seen as something used most often by marketing, the results showed that among respondents, the impact has been greater in sales. 28.43 percent of sales respondents said social media had changed their processes significantly, while only 20 percent of marketers said the same thing. On the other end of the spectrum, sales said that social media had had “little” impact less often (25.49 percent) than marketing (36.19 percent).
Also contrary to perceptions, sales was less likely to report that social media was used by individuals and thus the impact was hard to track (11.43 percent of marketers vs. 6.86 percent of sales pros).

© 2015 Callidus Software Inc. All Rights Reserved.15
1 - Time wasted building quotes and getting approvals -- 21.18% (43)
2 - Poor quality of leads -- 16.75% (34)
3 - Low quantity of leads -- 23.15% (47)
4 - Hard-to-understand value proposition and buyer messaging -- 33% (67)
5 - Misaligned territories and quotas -- 5.91% (12)
Aggregate Marketing Sales
Mean: 2.86Response: 203
1 - Time wasted building quotes and getting approvals ------ 22.12% (23)
1 - Time wasted building quotes and getting approvals ------ 20.41% (20)
2 - Poor quality of leads ------------ 13.46% (14)
2 - Poor quality of leads ------------ 20.41% (20)
3 - Low quantity of leads --------- 24.04% (25)
3 - Low quantity of leads --------- 21.43% (21)
4 - Hard-to-understand value proposition and buyer messaging -------- 34.62% (36)
4 - Hard-to-understand value proposition and buyer messaging -------- 31.63% (31)
5 - Misaligned territories and quotas ------------ 5.77% (6)
5 - Misaligned territories and quotas ------------ 6.12% (6)
Mean: 2.88 Mean: 2.83Response: 104 Response: 98
Question 16: Which of these areas is the biggest hindrance to your organization’s ability to sell?
Exactly a third of all respondents said that hard-to-understand value propositions and buyer messaging were the top obstacles they needed to overcome (31.63 percent for sales, 34.62 percent for marketing). This basic problem by itself nearly equaled combined concerns over lead quality and quantity (cited by 39.87 percent of all respondents).
However, when it came to the question of lead quality vs. lead quantity, it was clear that quantity is still winning the argument. Both sides cited low quantity as a bigger hindrance than quality, and was a significant discrepancy in responses between sales and marketing. Sales cited quality over quantity by a narrow margin – 21.43 percent vs. 20.41 percent. Marketing, on the other hand, was tilted dramatically toward quantity – 24.04 percent to 13.46 percent.
This mirrors a frequent disconnect between sales and marketing: sales may say it wants more leads, but what it really wants is a larger number of QUALITY leads. This failure to agree on what is needed from a lead is a clear symptom of the misalignment seen frequently between sales and marketing organizations.

© 2015 Callidus Software Inc. All Rights Reserved.16
Aggregate Marketing Sales
Question 17: What technology solutions are you using today to manage sales and marketing?
Although many take the presence of technology in sales and marketing for granted, the reality is that many organizations have automated either sales or marketing, or their sales and marketing operations are not automated in any way. Among all respondents, 11.9 percent said that they still worked from spreadsheets or other manual means. Another 15.71 percent said that one part of the organization used automation while the other part continued to use manual approaches.
Among those respondents who employ sales force automation and marketing automation, most use separate applications – 40.95 percent in total, 41.35 percent in sales and 40 percent in marketing. This points at another area of possible misalignment, since separate systems frequently are put in place without any thought of integration.
Less than a third of respondents (31.43 percent) said they used a single integrated sales and marketing suite (34.62 percent in sales, 28.57 percent in marketing).
1 - A single integrated sales and marketing suite ----- 31.43% (66)
1 - A single integrated sales and marketing suite ------ 28.57% (30)
1 - A single integrated sales and marketing suite ------ 34.62% (36)
2 - Separate applications in sales and marketing ----- 40.95% (86)
2 - Separate applications in sales and marketing ----- 40% (42)
2 - Separate applications in sales and marketing ----- 41.35% (43)
3 - One department has automation, while the other operates manually or through spreadsheets ----- 15.71% (33)
3 - One department has automation, while the other operates manually or through spreadsheets ------ 16.19% (17)
3 - One department has automation, while the other operates manually or through spreadsheets ------ 15.38% (16)
4 - Both departments operate manually or through spreadsheets ----- 11.9% (25)
4 - Both departments operate manually or through spreadsheets ----- 15.24% (16)
4 - Both departments operate manually or through spreadsheets ----- 8.65% (9)
Mean: 2.08Mean: 2.18 Mean: 1.98
Response: 210Response: 105 Response: 104

© 2015 Callidus Software Inc. All Rights Reserved.17
Aggregate Marketing Sales
The numbers of respondents satisfied or very satisfied with their current solution mirrored the percentage of respondents using a single integrated suite. 36.4 percent of all respondents (40.77 percent in sales, 32.38 in marketing) said they were satisfied or very satisfied. Only 28.8 percent of all respondents (23.3 percent of sales, 34.28 percent in marketing) said they were dissatisfied or somewhat dissatisfied.
One notable difference: sales was found to be more likely to be satisfied and less likely to be dissatisfied with an existing solution than marketing. The reason for this is unclear; perhaps the pace of change in marketing automation technology has been faster and marketers feel like they are behind the technological curve because of slow investment in new solutions.
Mean: 2.9
Mean: 3.05 Mean: 2.77
Response: 209
Response: 105 Response: 103
1 - Very satisfied ------- 12.44% (26) 1 - Very satisfied ------- 10.48% (11)
1 - Very satisfied ------- 14.56% (15)
2 - Satisfied ------- 24.4% (51)2 - Satisfied ------- 21.9% (23) 2 - Satisfied ------- 26.21% (27)
3 - Somewhat satisfied ------- 34.45% (72)3 - Somewhat satisfied ------- 33.33% (35)
3 - Somewhat satisfied ------- 35.92% (37)4 - Somewhat dissatisfied ------- 17.7% (37)
4 - Somewhat dissatisfied ------- 20.95% (22)
4 - Somewhat dissatisfied ------- 14.56% (15)
5 - Dissatisfied ------- 11% (23)
5 - Dissatisfied ------- 13.33% (14) 5 - Dissatisfied ------- 8.74% (9)
Question 18: How satisfied are you with your current solution?

© 2015 Callidus Software Inc. All Rights Reserved.
Aggregate Marketing Sales
In aggregate, the responses to this question suggested that, when technology is deployed, most sales pros and marketers use it. 37.98 of all respondents said that their technology solution had been adopted by all the members of their teams. Another 38.54 percent said that more than half of their teams had adopted the technology.
Roughly a quarter of respondents (25.48 percent) said that “less than half” or “almost no one” on their teams had adopted their technology solution.
Mean: 1.93
Mean: 2.04 Mean: 1.84Response: 208
About CallidusCloud:
Response: 103 Response: 104
1 - Adopted by all members of my team ------- 37.98% (79)
1 - Adopted by all members of my team ------- 33.01% (34)
1 - Adopted by all members of my team ------- 42.31% (44)
2 - Adopted by more than half of the members of my team ------- 36.54% (76)
2 - Adopted by more than half of the members of my team ------- 37.86% (39)
2 - Adopted by more than half of the members of my team ------- 35.58% (37)
3 - Adopted by less than half of the members of my team ------- 19.71% (41)
3 - Adopted by less than half of the members of my team ------- 21.36% (22)
3 - Adopted by less than half of the members of my team ------- 18.27% (19)
4 - Adopted by almost no one on my team ------- 5.77% (12) 4 - Adopted by almost
no one on my team ------- 7.77% (8)
4 - Adopted by almost no one on my team ------- 3.85% (4)
Question 19: How much of your team has adopted and regularly uses your current solution?
CallidusCloud is the global leader in cloud-based sales, marketing and learning solutions. CallidusCloud enables organizations to accelerate and maximize their lead to money process with a complete suite of solutions that identify the right leads, ensure proper territory and quota distribution, enable sales forces, automate configure price quote, and streamline sales compensation — driving bigger deals, faster. Over 3,500 leading organizations, across all industries, rely on CallidusCloud to optimize the lead to money process to close more deals for more money in record time.
Give your marketing and sales teams a solution that helps them stay in sync, on track, and committed to the joint cause of bringing in revenue. Contact our experts todayor call 1-866-812-5244
18