Embed Size (px)
Citation preview

gareth.jones Section name
Sales and Advertising Rivalry in interwar US Department Stores
by
Professor Peter Scott and
Dr James T. Walker
School of Management
2009 078 Henley Business School University of Reading Whiteknights Reading RG6 6AA United Kingdom www.henley.reading.ac.uk
Sales and Advertising Rivalry in interwar US
Department Stores Peter Scott and James Walker*
Centre for International Business History Henley Business School at the University of Reading
PO Box 218, Whiteknights, Reading, Berks, RG6 6AA, UK
Department stores represented one of the most advertising-intensive sectors of American
inter-war retailing. Yet it has been argued that a competitive spiral of high advertising
spending, to match the challenge of other local department stores, contributed to a damaging
inflation of costs that eroded long-term competitiveness. We test these claims, using both
qualitative archival data and establishment-level national data sets. Returns to stores’
advertising are shown to have fallen over the period, while own advertising led to retaliatory
advertising by rival department stores, which substantially lowered returns on advertising
dollars in the 1930s (but not the 1920s).
Key words: Department stores, Interwar U.S. economic history, Advertising, Marketing
JEL Classification: L81, M37, N82
Acknowledgements: We thank Natalie Anderson and Nat Ishino for fastidious RA work, and Lucy
Newton, Tom Nicholas, Francisco Requena, Mark Tadajewski, and Stefan Schwarzkopf for
comments on the paper. Thanks are also due to the Baker Library Archives; Boston Public Library;
West Yorkshire Archive Service, Leeds; and Worcester Historical Museum, Worcester, Mass. We are
also grateful for comments by participants at the Business History Conference, Sacramento (2008),
and the Business History Association Conference in Birmingham (2008).
@ NOT TO BE CITED OR REFERENCED WITHOUT THE WRITTEN PERMISSION OF
THE AUTHORS
*Corresponding author James Walker ([email protected]).
2
The 1920s were a golden age for American advertising, national advertising
expenditure rising from $1.409 billion in 1919 to $2.987 billion in 1929.1 Department stores,
which constituted the most important class of large-scale American retailer until the late
1920s, were particularly advertising-intensive.2 In 1935, the 4,201 U.S. department stores
accounted for some 10 per cent of national retail sales.3 Yet their contribution to retail
advertising was much larger, owing to a substantially higher ratio of promotional expenditure
to turnover than was the case for most chain stores. Department stores devoted an average of
4.0 per cent of turnover to advertising during 1932, compared with median figures for the
same year of 0.42 per cent for variety stores; 1.37 per cent for drug store chains; 1.02 per cent
for grocery chains, and a mean of 2.98 per cent for shoe chains.4 Department stores had been
at the forefront of new innovations in advertisings since the late nineteenth century and
during the interwar period they adopted increasingly sophisticated methods of both designing
advertisements and monitoring their effectiveness.
Yet by the 1930s, both industry insiders and well-informed business academics were
pointing to excessive advertising expenditure as one of the key factors undermining
department store performance – through raising gross margins, which eroded department
stores’ competitive position vis-à-vis expanding chain stores operating on a lower-cost
model. The onset of decline for the US department store sector occurred substantially earlier
than was the case internationally. For example, British department stores experienced
continued growth in retail market share and healthy profits, partly due to lower gross margins
and operating costs compared to their American counterparts, which enabled them to more
effectively address rising competition from the expanding multiple chains. Conversely, it is
argued, US stores’ higher-cost business model progressively undermined their profitability
and, ultimately, survival - in their traditional form.5
This paper examines both the objectives and nature of U.S. department store
advertising and its cost-effectiveness. Qualitative archival evidence, mainly concerning
Macys of New York, the Higbee Co. of Cleveland, Ohio, and Filenes of Boston, is used to
chart the development of department store advertising policy, media, and techniques. Then,
after briefly reviewing contemporary arguments that advertising levels were excessive and
produced illusory gains (owing to retaliatory advertising by rival department stores) we 1 Pope, The Making of Modern Advertisting, pp.22-29. 2 McNair, “Trends of expense”; Darby, Story of the Chain Store, p. 16. 3 Hyppes, ”Department store”, p.76. 4 McNair and May American Department, Table III-1, 22-23; other retailers, McNair, “Chain store”, Tables 1 and 2. 5 See Scott and Walker, “`British failure’ that never was?”.
3
assess the extent to which these claims are justified, using establishment-level data from the
Harvard Bureau of Business Research archives. The archives provided two data sets - a panel
of returns covering the years 1920-1940 and capturing the sales and advertising history of 29
department stores over this full twenty-year span – and a second study with data covering the
early 1920s, providing an unbalanced panel of some 655 stores. Using these exceptionally
rich and under-exploited data sources, we show that returns to US stores’ advertising fell over
the period. As importantly, increases in store advertising budgets led to retaliatory
expansions in advertising by rival department stores, that substantially lowered the returns on
advertising dollars in the 1930s (but not in the 1920s). We also find that smaller stores
obtained lower advertising returns than their larger counterparts.
ADVERTISING POLICY
The rise of the first great American department stores such as Marshall Field’s in the
second half of the nineteenth century was closely associated with their successful
development of strong, consistent, and meaningful brand images to distinguish them from
their competitors, command customer loyalty, and identify the store’s principal consumer
market segment. Advertising both facilitated the projection and adaption of brand images and
allowed retailers to capitalize on distinctive branding by communicating their brand to its
target market.6 During the late nineteenth century department store advertising innovations
transformed U.S. newspaper advertising, including the pioneering of the full-page advert by
John Wanamaker in 1879; the introduction of drawings and illustrations in adverts;
innovations in typography and layout; and the development of ‘institutional advertising’
aimed at advertising the store as a brand – rather than the individual products sold.7
Stores initially faced their main competition from other local or regional department
stores – though this was limited by the fact that each occupied its own market niche,
reinforced by aggressive branding and advertising. For example, the Higbee Co. of Cleveland
Ohio, a long-established department store opened in 1860, had five main stores that could be
regarded as competitors during the 1930s.8 Yet most of its competition came from three
stores: the May Co. – which aimed at a wider market than Higbee and competed on price, and
Linder and Halle – two up-market stores which competed in terms of quality of merchandise
6 Koehn, “Marshall Field”. 7 Benson, Counter Cultures, pp.17-18. 8 Baker Library Archives, M.ss 776, papers of the Higbee Co., Higbee comparison questionnaire, 1932.; idem, ‘General report and recommendations,’ October 10th-15th, 1932. These included four department stores and one apparel speciality store.

4
(particularly with regard to fashion items). Even this level of competition was partly due to
Higbee’s attempt to serve a relatively broad market segment; as a 1932 comparison shoppers’
report noted, by doing so it both failed to offer the variety of merchandise and appropriate
goods for the ‘popular’ market served by the May Co. and overlooked the fashion-based
competitive threat from Linder and Halle.9
Distinct branding was particularly important, given that department stores sold a high
proportion of fashion-related, durable, and ‘luxury’ goods, characterised by segmented
markets. As another Higbee policy document noted, customers generally fell into three broad
groups - frequenting ‘high grade’; ‘medium grade’ or ‘low grade’ stores. While high grade
and medium grade stores shared many customers, as did medium grade and low grade stores,
few customers’ purchasing habits spanned the high and low grades.10 Strong market
segmentation also increased the importance of repeat business and customer loyalty. Thus
department stores were early pioneers of ‘relationship marketing’. John Wanamaker had
pioneered the relationship marketing approach to department store retailing in the late
nineteenth century, based on the philosophy of ‘reciprocity’ and ‘mutuality of interest’
between the store and its customers. This encompassed a leisure-based retail format,
underpinned by generous provision of service facilities; allowing customers to return
products they were not satisfied with; and an advertising philosophy based around marketing
the store as an institution.11 By the 1920s ‘institutional advertising’, aimed at imprinting
stores’ overall brand images in the minds of the consuming-public, rather than relying on
claims regarding particular merchandise, had become the standard approach to department
store advertising.12 For example, Filene’s of Boston developed a strong institutional focus for
its advertising, the primary object of which was: ‘to sell to the public our store as a whole
rather than individual departments and individual merchandise…’13 Strength in fashion goods
was described as their ‘greatest single “institutionalising” factor’ – the store’s institutional
appeal being summed up as ‘leadership in the showing of new styles, in choice of styles, in
completeness of assortment, in service and in values’ – while their range of services provided
an important subsidiary attraction.14
9 Baker Library Archives, M.ss 776, papers of the Higbee Co., report of Higbee’s comparion shoppers, October 10th-14th 1932. 10 Baker Library Archives, M.ss 776, papers of the Higbee Co., ‘General report and recommendations,’ October 10th-15th, 1932. 11 Tadajewski, `Relationship marketing at Wanamaker’s’. 12 Benson, Counter Cultures, p.103. 13 Worcester Historical Museum, William Filene’s Sons Co., ‘Publicity responsibilities’, memorandum (1928). 14 Ibid.
5
Filene’s advertising policy was designed to constantly reflect this fashion orientation
which, it emphasised, should never be subordinated to price or other appeals.15 For example,
when selecting merchandise to feature in newspaper advertising and window displays the
highest priority was accorded to style and the lowest to profit margins on the specific items
displayed - in order to project the right image for the store. Efforts to project an expertise in
fashion included production of a fashion magazine, Clothes, from around 1922. This was
formatted more like a women’s magazine than a conventional catalogue, with much space
given over to advice regarding new fashions and how to wear them, together with items on
specialist clothing – for example for sports, maternity, or weddings. Illustrations tended to
show women in different social settings, dressed in the latest fashions, rather than explicitly
advertising specific items of clothing.16 Other department stores also developed magazine-
format promotional material; for example, the Rochester department store Sibley, Lindsay
and Curr produced a Juvenile Magazine for the children of its patrons. Again, its
consumption messages were subtly interweaved within more conventional magazine items
such as puzzles and stories.17
America’s largest department store, Macy’s of New York, was similarly keen to
project a strong institutional image in its advertising. As one of its executives informed its
management trainees in 1929, ‘Macy’s is anxious to be known as an institution, and must
therefore offer services and policies which are distinctive.’18 These included the firm’s cash-
only policy, its underselling strategy, and the extremely wide assortment it offered.
Advertising reflected these perceived strengths, using tag lines such as ‘It’s smart to be
thrifty,’ and ‘No one is in debt to Macy’s,’ or emphasising the wide assortment of products
offered by its different departments. 19 This institutional appeal also influenced the visual
style of Macy’s adverts. Both ‘arty’ advertising and superlative statements were consciously
avoided, on the grounds that Macy’s served a middle class market and should therefore
employ a conservative style.20 Similar policies were evident at Higbee Co. As F. M. Cochran
of Higbee’s advertising department explained at an executive training lecture of September
1938, that they used advertising to:
15 Ibid. 16 Boston Public Library, Filene’s marketing archive, C12, D1. Examples of Filene’s ‘Clothes’ magazine, 1924-28. 17 Elvins, Sales & Celebrations, p.29. 18 Baker Library Archives, Mss 776, R.H. Macy & Co. Papers, Box 6, Macy’s documentary history, ‘Advertising policy: Series I, Lecture III’, Executive Training Course, Jan-April, 1929, lecture by Mr Collins. 19 Baker Library Archives, Mss 776, R.H. Macy & Co. Papers, Box 6, Macy’s documentary history, ‘Advertising policy: Series I, Lecture III’, Executive Training Course, Jan-April, 1929, lecture by Mr Collins. 20 Ibid.
6
… Sell the store as Well as the Merchandise… at one and the same time… It’s done with short, subtle, confident statements such as: “This blanket comes up to the Higbee standard of quality” “Another Higbee fashion scoop” “We’re first again – with the newest bag of the season” “This is another Higbee service for your convenience – there is no charge” … to convince the customer with a few brief words that your store is outstanding for fashion … that it will help her with her problems… that it strives to make her shopping convenient and comfortable… that it assures her satisfaction by safe-guarding quality… that it saves her money and offers her many prices from which she may select the one which fits her budget. 21
Newspaper advertising dominated stores’ publicity budgets, accounting for about 86
per cent of all department store advertising expenditure over 1932-39.22 In addition to its
direct advantages, heavy newspaper spend might also purchase the services of the local paper
as a “booster” for the store – for example by promoting its merchandise in fashion feature
columns.23 However, other advertising media, such as direct mailings, posters, etc. often
played a significant supporting or ancillary role. One significant new area of department store
advertising was radio. Higbee broadcast a 15 minute radio programme six days a week during
the 1930s. This was again used primarily as an instrument of institutional advertising: ‘the
job of a department store radio program is to sell to the public... the best thing to sell year in,
year out, is the store itself, its friendliness, its interest in civic affairs, its position as a center
of community activities.’ 24 Thus Higbee sought to embed itself in the minds of listeners as a
major social institution, for example through offering free air-time to local clubs and
voluntary institutions.25 Elvins found that department stores in Buffalo and Rochester also
supported civic promotions and arranged cooperative events with local clubs and charities in
21 Baker Library Archives, M.ss 776, papers of the Higbee Co., Mrs F. M. Cochran, ‘Advertising – its policies and procedures’ transcript of lecture for Higbee Co.’s executive training course, 23rd September 1938. 22 Source: Table 1 (based on a simple average of all size groups shown in the Table). See also Benson, Counter Cultures, p.103. 23 Elvins, Sales & Celebrations, p. 63. 24 Baker Library Archives, M.ss 776, papers of the Higbee Co., ‘The functions of a public relations department, Elsa Conners (Ellen Conners on the air)’, transcript of lecture for Higbee Co.’s executive training course, 11 Oct. 1938. 25 Baker Library Archives, M.ss 776, papers of the Higbee Co., ‘The functions of a public relations department, Elsa Conners (Ellen Conners on the air)’, transcript of lecture for Higbee Co.’s executive training course, 11 Oct. 1938. The document also mentions promoting a diverse range of other local groups such as the Cleveland symphony orchestra committee, Red Cross supporters, museums, and schools.
7
order to create ‘goodwill’ advertising and identify themselves more closely with their local
communities.26
Macy’s used both radio advertising and a variety of other promotional methods to
reinforce its press adverts.27 These included the launching of its famous Thanksgiving Day
Parade in 1924, including (from 1927) giant helium-inflated rubber figures, designed by Tony
Sarg. In some years the balloons were released into the sky to float away - cash prizes going
to those who found the accompanying tags and returned them to the store.28 Detroit’s J. L.
Hudson store also launched its first Thanksgiving Parade in 1924 – which, like Macy’s’
parade, became a major local institution in its own right. Charles F. Wendel, Hudson’s
display manager - drawing on Italian carnivals he had witnessed on holiday - incorporated
giant papier mache heads carried on the shoulders of the marchers into his first parade; which
became as characteristic a feature of Hudson’s parades as Macy’s inflated rubber figures.29
Both events were designed to support the Christmas sales campaign: Macy’s’ first parade was
entitled a ‘Christmas Parade’ (though it was held on Thanksgiving Day) and ended with
Santa Claus being welcomed into Herald Square. Similarly, Hudson’s parade included
Santa’s arrival by sleigh - to take up residence at the store’s ‘Toyland’. The success of these
events is reflected by the fact that they were rapidly and widely copied by leading stores in
other retail centres.30
Relationship marketing required the maintenance of customers’ trust and by the 1920s
department stores had become aware that consumers, particularly in more affluent income
brackets, were becoming distrustful of sensational adverts. Thus major efforts were made to
avoid risks of reputational damage from misrepresentation.31 Filene’s executives were
warned to avoid exaggeration, misleading statements, and half truths. Small prizes were
offered to members of the public, or employees, who spotted any misrepresentation.32
Similarly, F. M. Cochran of Higbee’s advertising department stated that their most important
advertising principle was:
26 Elvins, Sales & Celebrations, pp. 35-38. 27 Baker Library Archives, Mss 776, R.H. Macy & Co. Papers, Box 5, pp. 277-9, minutes of meeting, 3 April 1924. 28 Baker Library Archives, Mss 776, R.H. Macy & Co. Papers, Box 15, unpublished chapters of Ralph M. Hower, History of Macy’s of New York, 1858-1919 (Cambridge: Mass, Harvard U.P., 1943). Chapter XIV, pp. 40-41. Wanamakers had earlier released giant balloons with prizes as a promotional stunt – Hendrickson, Grand Emporiums, p. 286. 29 Detnews.com, http://info.detnews.com/redesign/history/story/historytemplate.cfm?id=173, copy of article originally published in Detroit News on 26th November 1999. 30 Elvins, Sales & Celebrations, pp. 155-6.. 31 Benson, Counter Cultures, p.105. 32 Worcester Historical Museum, William Filene’s Sons Co., ‘Publicity responsibilities’, memorandum (1928).
8
TELL THE TRUTH … THE TRUTH, THE WHOLE TRUTH… but NOT… NOTHING BUT THE TRUTH. Naturally, we attempt to glorify the truth with glowing copy and inviting illustrations... [But] half-truths are dangerous, and costly; and destructive to our greatest asset – the confidence and good will of our customers. 33
Department stores took on board the new scientific and psychological approaches to
advertising that had become popular by the 1920s.34 Cochran argued that successful
advertising executives ‘must be psychologists, interested in people of all types and social
levels. They must be curious about what makes people “tick”.’ Reflecting the consensus that
department stores’ principle customers were women, he added that they must be able to put
themselves in the customer’s place; ‘feel her wants, her doubts… encourage her to have
courage to dress better or create a lovelier home for herself.’35 Meanwhile Macy’s extolled
the scientific basis of their advertising planning. As their head of publicity told the Dry
Goods Economist:
Formerly, a buyer would carry around in his head many various notions about advertisements that ‘pulled’ and advertisements that didn’t... Today we interview customers in the department and in their homes; we clock traffic inside and outside the store, and we key the responses to different types of advertisement in different media – newspaper, magazine, direct mail, car cards, billboards and even window display. Right now we are testing the pulling power of our windows. By clocking the number of people who pass by and the percentage of them that stop to look (it averages about one in twenty) – we attempt to measure sale response from windows as compared to an advertisement in the newspaper of the same merchandise on another day.36
Such monitoring of customer flow was widespread; one Buffalo department store even
installed microphones by its front windows, to record spectators’ conversations
regarding their displays.37
33 Baker Library Archives, M.ss 776, papers of the Higbee Co., Mrs F. M. Cochran, ‘Advertising – its policies and procedures’ transcript of lecture for Higbee Co.’s executive training course, 23rd September 1938. 34 Olney, Buy Now, Pay Later, pp. 142-3 & 174-6. 35 Baker Library Archives, M.ss 776, papers of the Higbee Co., Mrs F. M. Cochran, ‘Advertising – its policies and procedures’ transcript of lecture for Higbee Co.’s executive training course, 23rd September 1938. 36 Baker Library Archives, Mss 776, R.H. Macy & Co. Papers, Box 12, Kenneth Collin, R.C. Macy (June 1st, 1929), ‘Taking the Blindfold Test Out of Retail Business’, Dry Goods Economist , p38. 37 Elvins, Sales and Celebrations, p. 22.
9
Planning Macy’s £2,000,000 annual advertising budget was now said to be based on,
‘the scientific basis of fact rather than the fond guesswork which characterises so much retail
advertising.’ 38 Advertising expenditure was carefully budgeted over each 26-week season.
Account numbers were set up to monitor each item of expenditure and a weekly report traced
progress through the season. This system was also applied to the advertising appropriations of
its individual selling departments. Filene’s policy was to divide their publicity budget by
department in direct proportion to expected sales - with the exception of departments on the
ground floor, which received a smaller budget on account of their opportunity to benefit from
circulation brought in via other departments’ advertising. A general fund (not exceeding 10
per cent of the total) was also set aside for departments which required extra funding on
account of temporary conditions which made their sales inadequately reflect their needs.39
Frederick Loeser & Co. of Brooklyn, New York took a more sophisticated approach, dividing
advertising spend between departments based on their contribution to store sales and profits
and their advertising to sales ratio – together with available data on these indicators for the
same departments in other stores.40 Similarly, by 1930 J.L. Hudson were looking at the
advertising-elasticity of their different departments, using data on previous movements in
advertising spend and sales volumes to plan current allocations.41
THE RISING TREND OF COMPETITION
While the content and planning of department store advertising became more
sophisticated over the interwar period, advertising budgets outpaced the growth of sales and
profits and widespread doubts emerged both within the industry and among well-informed
commentators regarding the productivity of this rising advertising spend. Analysis by Cover
et al. of total department store advertising space carried by the Chicago Daily News and
Chicago Tribune over 1910-31 showed an abrupt increase in department store advertising
over 1918-20 and a rate of growth during the first half of the twenties which continued to
outpace the pre-1918 trend.42 Rising expenditures continued until the early 1930s; as Figure 1
shows, advertising expenses as a proportion of net sales for U.S. department stores rose from
2.0 per cent in 1920 to a peak of 4.0 per cent over 1932-33. It then declined slightly, yet
38 Library Archives, Mss 776, R.H. Macy & Co. Papers, Box 12, Kenneth Collin, R.C. Macy (June 1st, 1929), ‘Taking the Blindfold Test Out of Retail Business’, Dry Goods Economist , p38. 39 Worcester Historical Museum, William Filene’s Sons Co., ‘Publicity responsibilities’, memorandum (1928). 40 Meischeid, “Publicity budget” 41 West Yorkshire Archive service, Leeds. WYL/1262/16, Schofields Department Store, Leeds, S. Schofield’s journal of a tour of North America, visiting department stores, entry for 8th September 1930. 42 Cover, Browne, Norris, and Cohenour, “Department store sales”, pp.232-3.
10
remained significantly above the level of the 1920s. Conversely net operating profits began to
fall after 1923, declined continuously from 1927-32 and (despite a recovery over the mid-late
1930s) were positive only for three years during the 1930s.43
[Figure 1 near here]
Benson described the period from 1924-29 as a battle to increase sales volumes in the
face of rising gross margins. The results of this competitive spiral of promotion were inflated
advertising expenditures, reduced margins, costly mark-downs, and falling profits.44 In 1937
Hyppes characterised the interwar years as a period in which merchandising and advertising
skill dominated competition between department stores. Their high fixed costs made profits
very sensitive to sales volumes and, in turn, made initiatives to increase sales via aggressive
advertising campaigns highly tempting.45 ‘High pressure’ promotional techniques temporarily
boosted sales, but high costs and competition (including the growing threat from speciality
and chain stores) wiped out much of the expected growth in long-term profits. Competition
via more elaborate stores and customer services (such as credit, delivery, return privileges,
etc.) further raised costs.46
Meanwhile, Hypps argued, the gains from this increased expense were largely
negated by rising competition from expanding chain and speciality stores operating on a
lower cost model, who took advantage of department stores’ rising gross margins by
undercutting them on price.47 Pasdermadjian similarly argued that department store efforts to
expand business via costly advertising and services, or sales promotion events involving
temporarily slashing margins, generally failed to produce a sufficient increase in revenue to
justify the costs involved.48 Stores, it was argued, had become locked into a ‘high promotion
regime’ where the heavy advertising and promotion of their competitors compelled them to
undertake similarly heavy expenditure, despite the fact that most of the gains would be
negated by retaliatory action. In the depression and its aftermath, stores found it difficult to
retreat from the high cost competitive equilibrium which they had become locked into.
Meanwhile increased advertising expenditure, high-pressure advertising techniques, and
costly sales promotions, were said to be much more characteristic of department stores than
other retailers and were, ‘mainly weapons of department stores in the competition within their
own ranks… The final result of such contests is that all stores adopt these costly customer 43 McNair and May, American Department Store, pp.22-23. 44 Benson Counter Cultures, p. 55. 45 Pasdermadjian, Department Store, p. 55. 46 Hypps, ”Department store”, pp. 74-9. 47 Ibid, p.74. 48 Pasermadjian, Department Store, pp.55-58.
11
attraction methods and in the end the average expense level of all department stores is simply
raised.’49
Such views are echoed in the internal records of the department stores examined for
this study. For example, a letter of February 1934 from E.H. Stewart of the department store
group Associated Dry Goods Corporation, to C. L. Bradley of the Higbee Co., noted:
In most stores there has been a tendency in the last few years to run their advertising percent higher than gross profit and other expenses justify. We believe that it is a sound policy to place greater emphasis on good salesmanship, good assortments, and good interior displays in an effort to stimulate repeat business, gradually reducing the expenditure through newspapers to a proper percentage to sales. 50 Similarly, a Filene’s manager confided to a British visitor in 1930 that 50 per cent of
their turnover was traced directly to advertising and they felt it should not be so. The visitor
(S. Schofield of the Leeds store Schofield’s) noted that many other stores he had visited on
his North American tour were also developing their turnover on these lines.51 Department
stores were aware of their competitors’ advertising spends - it was relatively easy to compare
the column inches purchased by rival stores in local newspapers to their own, while broader
data were available via the national bench-marking exercises of store expenditure and
performance undertaken from 1920, which enjoyed widespread participation among
department stores.52
Perceptions that rising advertising budgets were not being translated into
improvements in sales and profits were corroborated by the growing volume of quantitative
data. According to the U.S. Census of Business, between 1929 and 1935 American
department store numbers, and sales, had declined from 4,221-4,201 and $4,350 million -
$3,311 million respectively.53 Meanwhile the interwar years witnessed a long-term trend
towards higher ratios of advertising (and of total store expenses) to sales, low (and often
49 Pasermadjian, Department Store, p.58; Hendrickson, Grand Emporiums, pp. 71-3; Benson, Counter Cultures., p.32 50 Baker Library Archives, M.ss 776, papers of the Higbee Co., letter, E. H. Stewart to C. L. Bradley, 21 Feb. 1934. 51 West Yorkshire Archive service, Leeds. WYL/1262/16, Schofields Department Store, Leeds, S. Schofield’s journal of a tour of North America, visiting department stores, entry for September 1930 (exact date not given). 52 Elvins, Sales and Celebrations, pp. 54-6. 53U.S. Department of Commerce, Census of Business, 1935, Retail Distribution, Vol. IV, p.23 & Vol. VI, p.177, cited in Hyppes (1937), p.76.
12
negative) department store profits, and a decline in market share relative to the expanding
chain stores.54
[Figure 2 near here]
Figure 2 examines the growth of advertising expenditure by store size, using the
published Harvard Bureau of Business Research (hereafter HBBR) data. The upward trend in
advertising expenditure over the period to 1932, identified in Figure 1, is evident for all
department store size bands. Furthermore the advertising intensity of department stores
actually rose with store size, for stores with net sales of up to $4 million. Beyond this range
the relationship is less clear, possibly owing to economies of scale when advertising in
newspapers covering larger populations.
[Table 1 near here]
The interrelationships between store size, advertising expenditures, and other key
performance indicators, are explored in more detail in Table 1. This shows average values for
the full HBBR sample over the period 1932-39 (detailed data were not available for all size
groups shown prior to this date). The positive relationship between store size and
proportionate advertising spend is shown to be entirely due to press advertising. This rose
sharply with store size, while proportionate spending on other forms of advertising remained
roughly constant. The positive relationship between advertising expenditure and store size
was matched by a rise in total operating expenses and gross margins. Larger stores charged a
higher mark-up over costs, which compensated for their higher expenses ratios – allowing
them to earn a better (though still negative) net operating profit and a higher net gain than
their smaller counterparts.55
Larger stores’ superior financial performance appears to be strongly linked to their
higher stock-turn rates. The largest stores turned their stock over 5.4 times per year, roughly
double the rate for stores with sales of under $300,000. This also enabled them to achieve
double their smallest counterparts’ sales per square foot, thus compensating for their much
higher real estate costs (owing to more expensive sites in the centres of major cities and
higher spend on buildings and fittings for America’s ‘grand emporiums’).
Maximising stock-turn (and aggregate sales, which was very closely linked) was seen
by contemporary department store managers as being key to success. For example a 1930
54 McNair and May, American Department Store, Table III-1, 22-23. 55 Net gain includes operating profits, plus other income: from leased departments and from any non-retailing operations; credit on imputed interest previously charged as expense (after adjustment for interest actually received and paid); accounts receivable handling charges paid; and other miscellaneous income and outgo. See McNair and May, American Department Store, p. 20.
13
Macy’s document noted that it’s undercutting policy (prices being set at least 6 per cent
below those of competing stores, for comparable merchandise) was not sustained by its cash
only policy (the administrative savings from which were not great), or bulk purchasing (much
of which was in fact hand-to-mouth). Instead the key factors were their high sales volume and
rapid stock-turn.56 The post-1918 trend towards the extension of fashion-appeal from
premium to middle and even lower-priced ranges of clothing and related goods increased the
emphasis on stock-turn. For example, S. Schofield was informed by managers at Detroit’s J.
L. Hudson Store that sale days were held at the end of each month, where they, “really
slaughter the prices, the whole policy being to get stock moving quicker…”57
Similarly, when visiting Filene’s, he was told that the store achieved a stock-turn on
its fashion items ranging from 7 to 15, while the rate for the whole store was 6 times. This
owed much to Filene’s policy of rapid markdowns, where after 10 days all fashion goods
were inspected and marked down to next zone price. 58 Filene’s ‘Automatic Bargain
Basement’ was even more focused on maximising stock-turn, its business model being, ‘to
force a large volume of sales by rapid turnover of stock, at prices lower than those of any
regular or unusual competition’. 59 To achieve this they operated a ruthless discounting
policy, where all stock was automatically marked down by 25% after 12 selling days; then if
not sold in another 18 days by a further 25%, if still in stock at the end of 24 days by another
25% and - if not sold after 30 selling days- donated to charity.60
Conversely, the growing emphasis on fashion aggravated the Higbee company’s
problems of slow stock-turn. For example, a 1932 analysis noted its large stocks of
merchandise more than six months old. In part, this represented stock which had become
obsolete: ‘in the case of dresses and millinery there should be very little merchandise at any
time over 2 months old. When apparel passes this age, the presentation of it to customers in
56 Baker Library, Harvard, Mss 776, R.H. Macy & Co. Papers., Series III, Box 5, documentary history, item 112. Note by Mr Faller, Controllers Office, 1930. 57 West Yorkshire Archive service, Leeds, WYL/1262/16. S. Schofield’s journal of a tour of North America, visiting department stores, entry for 8th Sept. 1930. 58 West Yorkshire Archive service, Leeds, WYL/1262/16. S. Schofield’s journal of a tour of North America, visiting department stores, entry for Sept. 1930 (no exact date given). This `automatic’ pricing scheme appears to have remained unchanged as late as 1979 – Hendrickson, Grand Emporiums, p. 130. 59 Worcester Historical Museum, William Filene’s Sons Co., ` Fundamental merchandise policies - basement’, memorandum (1928). 60 Ibid; West Yorkshire Archive service, Leeds, WYL/1262/16. S. Schofield’s journal of a tour of North America, visiting department stores, entry for Sept. 1930 (no exact date given). This `automatic’ pricing scheme appears to have remained unchanged as late as 1979 –Hendrickson, The Grand Emporiums, p. 130.

14
large quantities, unless offered at ridiculously low prices, is likely to be very injurious to a
store’s reputation.’61
Advertising was used as a targeted weapon to bring stock-turn, and sales, up to
capacity; as the Publicity Manager of the J. L. Hudson Store explained to Schofield, they cut
back advertising expenditure each year after around December 10th, ‘of course because the
store can be filled without advertising.’ 62 Yet the seasonal nature of demand meant that
stores could rarely operate at capacity for more than a short period of each year, while
seasonal troughs in sales were also periods of low returns to advertising. Evidence for
Chicago indicates that department store advertising closely followed seasonal changes in
sales volumes, falling sharply during July-August to a trough of around 70 per cent of its
mean annual figure, then recovering strongly in the following months to a December peak;
thereafter falling sharply in January-February and reaching a more moderate peak in the
spring months.63
ANALYSING THE RETURNS TO DEPARTMENT STORE ADVERTISING
The following analysis focuses on two main elements – the returns to stores’ own
advertising spend, and whether advertising rivalry reduced own store sales, (i.e. whether rival
advertising is a strategic substitute). There is a substantial empirical literature on estimating
the impact of advertising on sales or market share and on advertising rivalry.64 Some authors
have used the estimated response function to determine optimal spending levels, though
results concerning advertising rivalry have been mixed.65 For example, John E. Kwoka found
that rivalry increased own firm sales using a sample of US automobile firms. In effect,
Kwoka’s results indicate that advertising has the effect of stimulating aggregate sales and is
therefore a strategic complement.66 Not surprisingly this is exactly what advertisers
61 Baker Library, Harvard, M.ss 776, Higbee Company papers, analysis and comments on merchandise and supply inventories, 10th-15th October, 1932. 62 West Yorkshire Archive service, Leeds, WYL/1262/16. S. Schofield’s journal of a tour of North America, visiting department stores, entry for 8th Sept. 1930. 63 Cover, J.H., M. A. Browne, G. Norris, and V. J. Cohenour (1931), ‘Department store sales and advertising’, Journal of Business of the University of Chicago, 4(3), 227-44, pp.234-5. 64See, for example, Tremblay, “Strategic Groups”; Nelson, Siegfried and Howell, “Simultaneous Equations Model”; Kwoka, “Sales and Competitive Effects”; Slade, “Product Rivalry”; Thomas, “Incumbent Firms’ Response”; Alston, Freebairn and James “’Beggery-thy-neighbour’ Advertising”. 65 Carpenter et. al., “Modelling Aysmmetric Competition”. 66 Kwoka (1993) is not alone in finding rivalry to raise model sales. Tremblay (1985) also found a positive effect on rival sales in a similarly mature market – the US beer market.

15
themselves were arguing.67 Indeed, it was often presumed that, by expanding demand,
advertising would increase stores’ turnover - thereby enabling them to lower prices without
reducing profits. It was not only advertising executives who espoused what was effectively
the common view.68 Yet later empirical work is less positive. Evidence from a number of
industries has found that advertising by one firm takes market share from rivals and that
advertising is therefore a strategic substitute.69
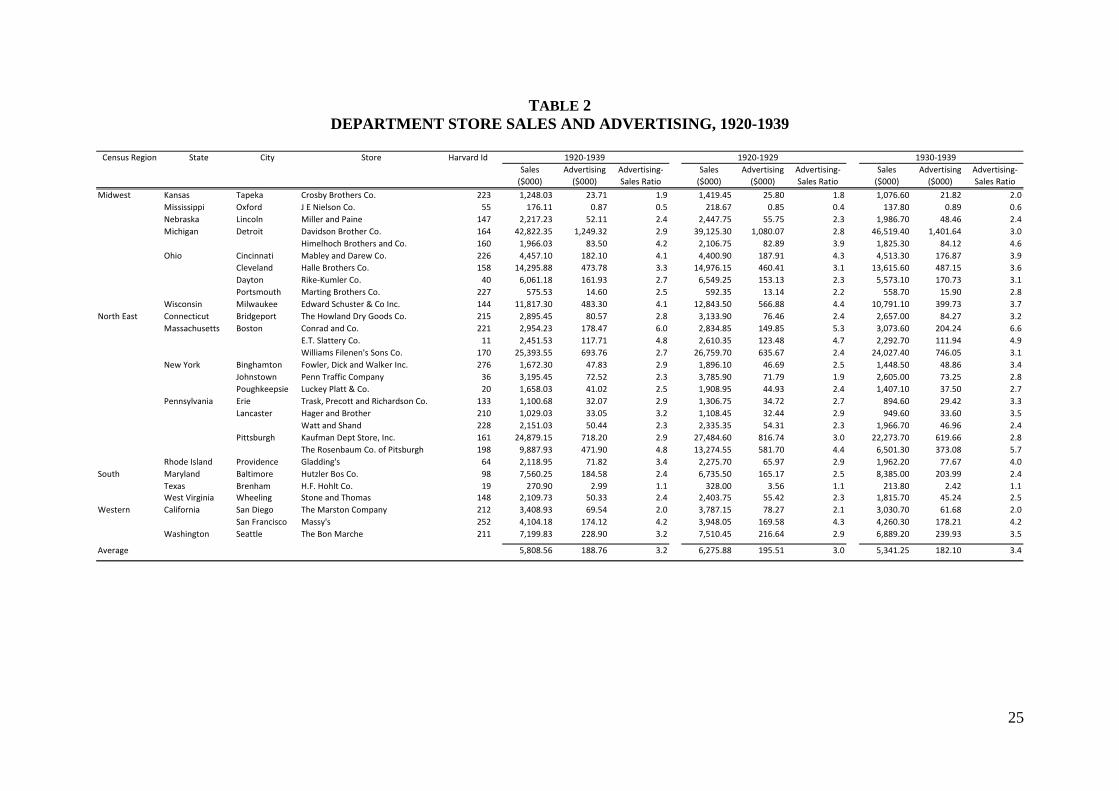
Table 2 shows data for the stores incorporated into the HBBR “25 Year Study”;
broken down by state, city, the name of the store, the identifier allocated by the HBBR, and
data on sales and advertising. For every store we have complete information over the full
twenty years that constitutes our period of analysis. Annual average sales and advertising data
are illustrated for stores over the whole 1920-39 period, but are also broken into two sub-
periods. The choice of break reflects the sharp fall in sales associated to the Great
Depression, but also provides a means to analyse the relationship between advertising and
sales over the interwar period and = determine the extent to which there was a shift in returns
to advertising spends.70 Comparing the two sub-periods, there were clearly level falls in both
sales revenue and advertising spend, suggesting that the periods differed. Equally clear is that
advertising relative to sales, summarised by the advertising-sales ratio, increased, near
uniformly, across the sample, with only two of the twenty nine stores recording moderate
falls.
[Table 2 near here]
To get an idea of the extent to which the “25 Year Study” is representative of the
general time series trends in department store sales over the period, we compare the Federal
Reserve’s department store sales index with an index calculated using the “25 Year Study”
data in Figure 3.71 Monthly Federal data (based on the Census definition of a department
store) are shown in the continuous series, while the white squares plot the annual HBBR sales
index (both based at 1920=100).72 Certainly the “25 Year Study” index tracks the Fed series
well, mirroring its turning points consistently.
67 An excellent source being found in Ralph M. Hower’s case study of N.W. Ayer and Son, History of an Advertising Agency: N.W. Ayer and Son at Work: 1869-1949. Cambridge MA: Harvard University Press, 1966. 68 For example, Hotchkiss in a paper published in the American Economic Review, argued that with all advertising were suddenly eliminated, prices would actually rise because demand would be smaller (“Economic Defence of Advertising”, American Economic Review, 1925). 69 For example, Slade, “Product Rivalry”; Thomas, “Incumbent Firms”. 70 Romer, “The Great Crash”. 71 U.S. Federal Reserve, Federal Reserve Bulletin. 72 As the 1929 Census states “Department stores are classified as such if they sell $100,000 or more of merchandise annually (exclusive of food departments); otherwise they are defined as general merchandise
16
[Figure 3 near here]
While the Federal Reserve data are informative in allowing us to examine the
representativeness of the data from a time series perspective, they tell us less about the
geographical distribution of sales. Certainly the most informative, and by definition complete,
data are the U.S. Censuses of Distribution.73 Given that the number of stores contained in the
“25 Year Study” is not extensive for purposes of comparison, we aggregated the Census data
into the four Census groups, Northeast, South, Midwest and Western. We also identify a
fourth grouping of urban centres, comprising eleven cities for which the US Census provides
disaggregated data, as we would expect that stores located in these centres would have higher
sales and advertising rates.74
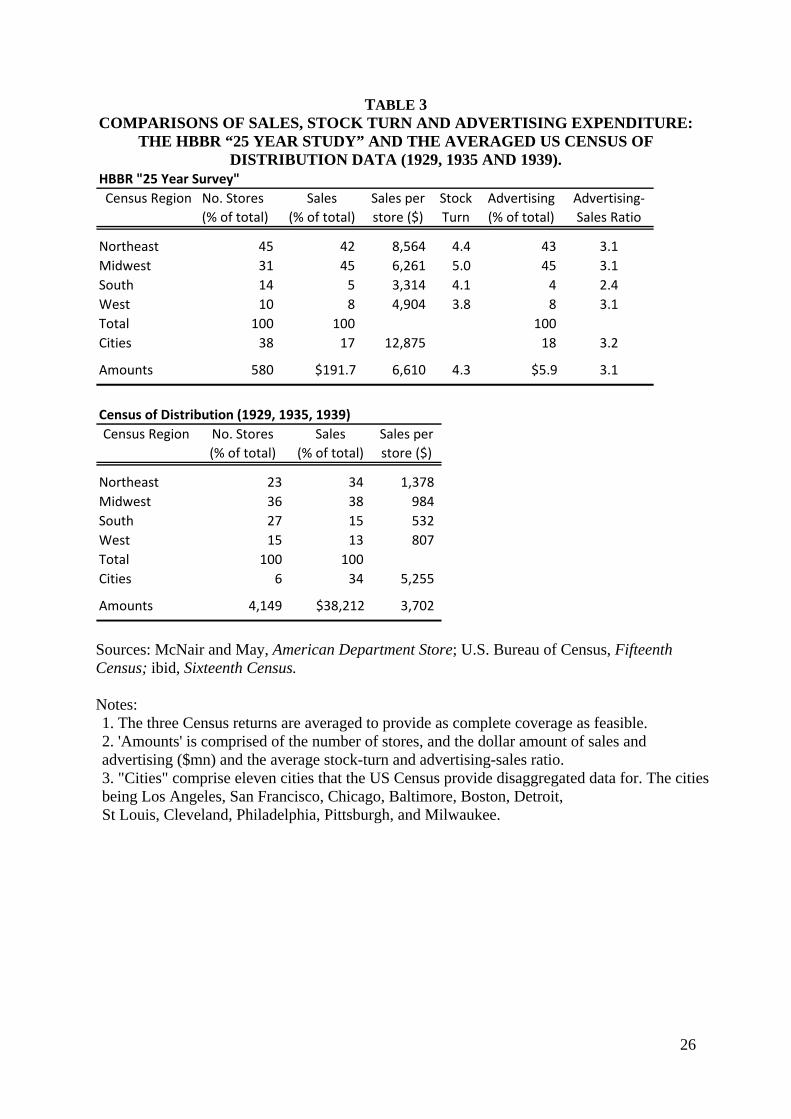
Table 3 provides a breakdown of the number of stores, sales, advertising and stock-turn,
derived from the “25 Year Study” in the top panel, with comparative information from the
Census of Distribution. The Census data are averaged over the three cross-sections available
but while the amount of sales falls substantially from the 1929 to 1935 samples (rising again
by 1939) the distribution of sales across regions and cities in the Census remains quite stable,
as we will illustrate later. The Table brings out a number of salient features that we will need
to keep in mind both in the analysis and interpretation of the findings. In particular, the “25
Year Study” comprises stores that are on average larger, are based in the eleven key urban
centres, and are located disproportionally in the Northeast. These trends reflect the fact that,
as Census data show, stores in the North-East were larger, as were “city” stores, with the “25
Year Study” containing a larger proportion of both North-eastern and urban stores (and
encompassing three Boston stores, including Filenes).
[Table 3 near here]
To understand the relationship between own and rival advertising we examined both
static and dynamic panel models, using instrumental variables to account for endogeneity
issues. Since advertising affects sales, and in turn sales revenues fund advertising,
endogeneity is an important issue for the analysis.75 Furthermore, stock turn - the frequency
stores” (U.S. Bureau of Census (1932), Census of Distribution, Chapter II – Definitions and General Explanation of Terms, p4). The Federal Reserve data also excludes special mail-order houses as does the Harvard studies analyzed in this paper (Federal Reserve (1944), p544). 73 US Bureau of The Census, Fifteenth Census; idem, Sixteenth Census (this also contains data for 1935). 74 The cities being Los Angeles, San Francisco, Chicago, Baltimore, Boston, Detroit, St Louis, Cleveland, Philadelphia, Pittsburgh, and Milwaukee. 75 Not accounting for endogeneity is thus known to lead to biased and in consistent estimates (Schmalensee, Economics of Advertising, pp. 98-100).
17
with which goods are sold (i.e. the number of times the stock is turned over each year) - is
endogenously related to sales. Both the static and dynamic estimates employ instrumental
variable methods to ensure consistent estimates. In particular we examine fixed and random
effect models in static specification frameworks, and a dynamic model.76 A feature of both
sets of models is that that they subsume, or difference out, elements that are constant over
time. This is a potentially important feature, as it captures the impact of fixed factors such as
urban and regional location, which we are aware are not representatively captured in the “25
Year Study” dataset. Specifically, in order to provide baseline estimates to compare the
dynamic results against we estimate a static model of the form
itititiitit stockarivaq ενβββ ++++= ,4,31 _ Ni ,....,1= iTt ,....,1= (1)
where individual store sales, i, in period t, itq , are determined by current advertising, tia , the
advertising of rivals in a given state, tiariv ,_ , and stock turn, tistock , , and where iν is the
panel-level effect, and itε are i.i.d. over the who sample with a variance 2εσ .77 All
estimations include year effects to capture economy-wide shocks in any given year. The
dynamic individual effects autoregressive model is of the form
ititititiit
p
jjtiit stockarivaaqq ενβββββ ++++++= −−∑ ,4,31,21,0 _ Ni ,....,1= iTt ,....,1= (2)
with a lagged dependent variable in the dynamic model, ∑ −
p
jjtiq , below, that are absent from
the static framework.78
[Table 4 near here]
The full set of results is contained in Table 4. For the static estimation we adopted an
IV fixed effects strategy, with stores acting as the fixed effect, and all variables being
instrumented by one period lags.79 If the full impact of advertising on sales is felt within the
first year, estimating equation (2) can appropriately characterise the relationships between
these variables. The first column in Table 4 refers to the (log) sales equation, with all
variables being instrumented by one period lags of the endogenous variables. Column 1, the
static version of the model in equation 1, shows that variation in stores’ sales, over the full
76 Arellano and Bond, “Some Tests of Specification”. 77 For a more detailed account of these models see Woodbridge Econometric Analysis, pp. 247-291. 78 See Arellano and Bond, “Some Tests of Specification” and Arellano, Panel Data Econometrics. 79 The fixed effects specification is preferred as Hauman testing rejected the random effects model in support of fixed effects.

18
1920-1930 period, is explained by the variation in the current values of the quality-adjusted
prices and advertising expenditures and stock-turn. The parameters of most importance are
the own and rival advertising and stock-turn variables. Not surprisingly, given the extensive
high quality data at our disposal, we are able to obtain well-defined estimates. Since both the
dependent and independent variables are expressed in logs, the coefficients can be interpreted
as elasticities. The results imply that the sales returns to advertising are quite high, as are the
gains to expanding stock-turn; however, there is no indication that rival advertising is either
predatory or expansionary.
The static results take no account of the persistence of sales across time, which are
captured via the use of lagged dependent variables. To overcome these potential consistency
issues, we take first differences in Equation (2) to control for unobservable model-specific
effects and then estimate using a general method of moments (GMM). Arellano and Bond
show that, in the absence of serial correlation, the most efficient set of instruments are found
using the lagged values of itq , itA and itstock from t-2 and hence these are the instruments
we adopt.80 Moreover, we also treat the variable stock-turn as endogenous and use lagged
stock-turn interactions as instruments. Column 2 displays the results, which are markedly
different from the fixed effect estimates - with the coefficients of the variables of interest in
the dynamic model being considerably lower. These findings reflect the importance of
accounting for persistence of sales and advertising across time and hence that the fixed
effects estimations are inconsistent. Reassuringly, the Sargan test accepts the validity of the
instruments and the null of no serial autocorrelation of the residuals is also accepted.81
Additionally, we find that that the coefficient on rivals’ advertising is negative, indicating
that rival advertising is predatory and has a well determined impact on sales. Thus advertising
rivalry is shown to be an important determinant of sales.
We turn to testing the key hypothesis that by the 1930s department stores had become
locked into a competitive spiral of high advertising and promotional expenditure, plus
extensive services provision, in order to meet the challenge of rival department stores. To do
so, we break the sample into two subsamples, allowing us to test whether the returns to own
advertising of stores fell, and, secondly, whether advertising rivalry reduced own stores’ sales
(i.e. that rival advertising is a strategic substitute) in the 1930s more than in the 1920s.82
80 Arellano and Bond, “Some Tests of Specification”. 81 Sargan, “Estimation of Economic Relationships”. 82 We have tested whether there are substantial shifts in coefficients if we adjust the parameters of our analysis to ensure that we are picking up a genuine decade long shift by estimating shorter panels (e.g. 1933-1939). The key coefficients remain quite stable over differing sub-periods.
19
Comparing between coefficients, there is a notable difference between the two sub-periods.
In each case the lagged terms are significant, allowing us to focus on the dynamic
estimations. Three key findings are illuminating. First, returns to stores’ own advertising fell
in the 1930s and fell substantially – by over 80%. Second, advertising rivalry impacted
exclusively on the 1930s - when it was a significant force, potentially compelling stores to
retaliate against rivals by expanding their advertising spends. Third, stock-turn, which did not
have a well defined impact on store sales in the 1920s, took on a significant role during the
1930s.
ROBUSTNESS - STORE SIZE
The findings indicate that there was a substantial decline in returns to own advertising
and, for the 1930s at least, that advertising rivalry also played a role in reducing stores sales.
An advantage of the “25 Year Study” is that is allows us to compare the same set of stores
across time. A potential disadvantage is that, as was shown in Table 3, the sample does not
map consistently to the Census. The three key differences are: (1) a smaller proportion of
urban, ‘city’, stores; (2) that stores located in the Southern and Western Census regions were
under-represented; (3) that the stores we examined were larger, in terms of sales. We use
panel data methods, which incorporate or difference out fixed effects, such as regional
location and whether stores are located in urban or non-urban areas. Furthermore, to check
whether there are regional trends, we have interacted regional and year effects to capture
these shifts, but have not found there to be any impacts on the coefficients of interest. While
we can address concerns relating to the urban and North-Eastern bias in the data within our
statistical methodology, the issue of store size is more problematic.
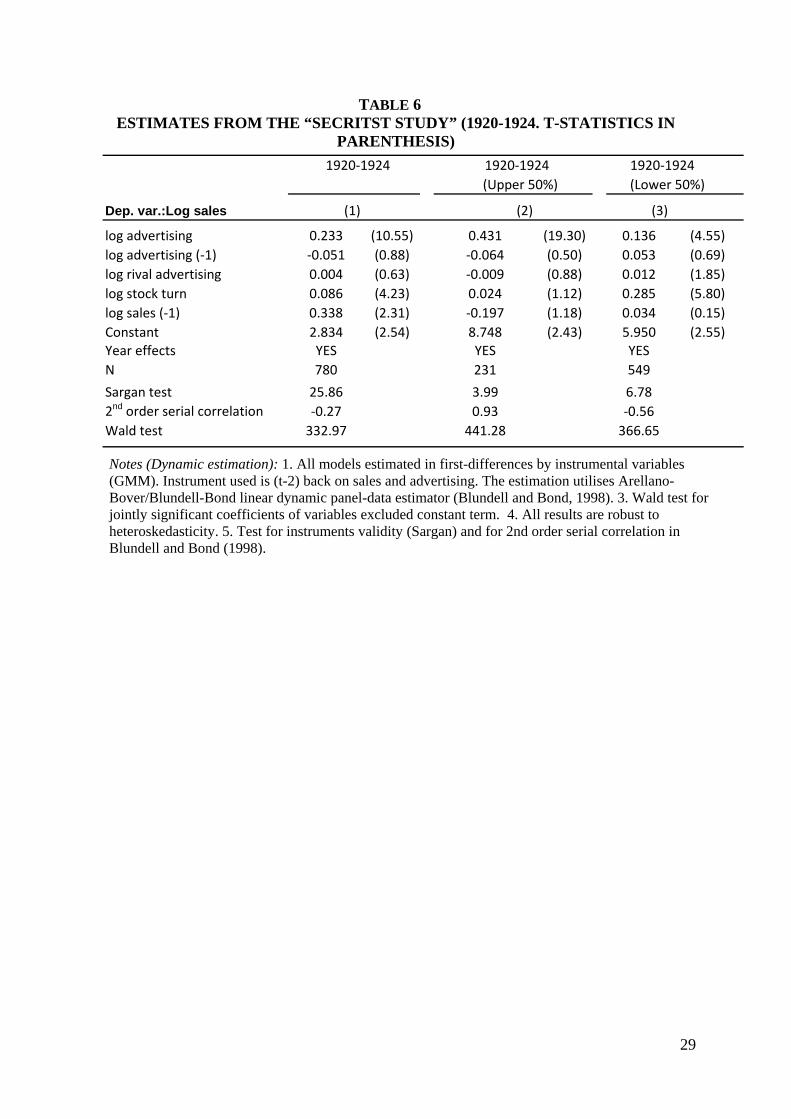
Fortunately a substantial 1920-1924 HBBR data set, the “Secritst Study”, provides us
with a means to examine a wider sample of establishments so that we can directly address the
extent to which store size is biasing our findings. Unlike the sample of stores available in the
“25 Year Study”, this sample includes a large number of smaller establishments and thereby
allows us to examine the extent to which firm size affects the returns to small stores. When
we eliminate stores with sales below $100,000 - to ensure comparability with the Census - the
“Secrist Study” includes 1,933 observations, for 655 stores. Unlike the “25 Year Study”,
which includes the same firm every year, the average number of years that a firm is in the
sample is 2.4. By analysing this alternative data-set we are able to address whether or not our
findings are representative, and provide evidence for a different population of stores. Table 5
provides comparisons of Sales, Stock turn and Advertising Expenditure between the “Secritst
20
Study” and the first, 1929, US Census of Distribution. Comparing the study with the census
reveals that the bias towards firms in the North-East remains. However, those in the North-
East have similar average sales per store to the Census data. Stores in other regions have
higher sales then the mean store in the Census. Despite stores’ sales being less than a third of
the “25 Year” sample in regions other than the North-East, mean sales levels in the Secritst
are still over 62% higher than the Census. 83
[Table 5 near here]
Table 5 implies that there may well be differences in our overall findings due to the
unrepresentative nature of the sample, since small stores have lower advertising to sales ratios
and stock-turn rates. This does not in itself suggest that the marginal returns to advertising or
the ability to turn over stock are going to have differing marginal returns to small or large
stores, but does show that advertising behaviour differs between these two groups of stores.
In order to test these differences we take a comparable approach to that we utilised for
the “25 year Study”.84 However, Arellano and Bond’s dynamic panel model, used when
analysing the “25 year Study” data, has been shown to produce poor results where there are
many cross-sections but few periods. This is because there are fewer instruments available, as
the Arellano and Bond framework uses lags and combinations of time periods and lags,
therefore the number of periods analysed falls. Building on the work of Arellano and Bover
which used lagged differences as potential instruments, Blundell and Bond exploit additional
moment restrictions, which substantially improve on the performance of the Arellano and
Bond GMM estimator in circumstances where the number of time-series observations is
relatively small - as is the case for the five period “Secritst Study”.85
Results from the estimations are contained in Table 5.86 In all cases the Sargan test is
well-determined, supporting the specifications. The results highlight that large firms were
able to extract greater returns from advertising but that, while advertising played a
disproportionally important role for larger stores, stock-turn was key to the sales success of
small firms. 83 We adjust sales by applying growth rates from the Federal Reserve Indices to obtain this figure. The mean sales rate is 62% higher before the adjustment for sales growth over the period is made. 84 As was the case when analysing the“25 Year Study” data set, we again use the fixed effects estimator, based on it being supported by the data, relative to the random effects model 85 Arellano and Bover, “Another Look”; Blundell and Bond, “Initial Conditions”. Arellano and Bond’s estimator is an efficient estimator where there are many cross-sections and many period, but has been show to perform poorly where for short panels but is less efficient, hence our use of the Blundell and Bond/Arellano and Bover estimator with the shorter (in terms of cross-sections) “Secritst Study” panel. 86 We have excluded the results from the static estimations since, as was the case with the estimates from the “25 Year Study” sample, we found that the preferred fixed effects static model provided inconsistent (inflated) coefficients.
21
CONCLUSION
Department stores are shown to have made heavy and innovative use of advertising.
This was originally employed primarily to imprint a strong retail brand image on their target
market segment and build consumer loyalty via `goodwill’ or `relationship’ marketing. Yet
by the 1930s department stores had become caught up in a competitive spiral of rising
advertising expenditure (together with expanded services provision and cut-price sales) in an
effort to boost sales volumes and meet the competitive threat from rival stores. The
quantitative analysis confirms that – while advertising expenditure originally reaped
substantial economic returns to department stores - by the 1930s they had become caught up
in an increasingly competitive struggle to maintain market share and combat the industry-
wide trend of low profits and growth. Raising advertising expenditure assisted their goals,
though gains were eroded by retaliatory increases in advertising spend by rivals who were
also struggling to maintain their market position.
As the econometric analysis demonstrates, returns to stores’ own advertising were
much lower in the 1930s than in the 1920s, while the negative impacts of increased
advertising spend by rival department stores significantly eroded any gains from their own
expanded advertising budgets. This contrasts with the 1920s, when rivals’ advertising does
not appear to have had any significant impact. Meanwhile, by focusing on competition within
the department store sector, stores left themselves vulnerable to competition from the
expanding chain stores and speciality retailers, who operated on a lower-cost model (which
included much lower ratios of advertising to sales). Thus the department store advertising
battle of the 1930s, while perfectly rational from each individual store’s perspective, did not
provide a long-term solution to the problems of the interwar department store. Department
stores had become locked in to a high-cost regime and increasing advertising budgets
ultimately only served to further raise costs and erode their competitiveness.
References
Archival Sources Baker Library Archives, M.ss 776, papers of the Higbee Co.
Baker Library Archives, Mss 776, R.H. Macy & Co. Papers, Boxes 5, 6, 12 and 15.
Boston Public Library; Filene’s Marketing Archive.
22
West Yorkshire Archive service, Leeds. WYL/1262/16, Schofields Department Store, Leeds, S. Schofield’s journal of a tour of North America, visiting department stores, September 1930.
Worcester Historical Museum, William Filene’s Sons Co., policy memoranda (1928).
Data Sources Harvard Bureau of Business Research (1922-1940), ‘Operating Results of Department and
Specialty Stores’, Harvard Bureau of Business Research Bulletin, No.: 33, 37, 45, 53, 57, 83, 85, 88, 91, 92, 96, 100, 104, 106, 109, 111. (Schmalz, Carl -1929-1937: McNair, Malcolm – 1939-1940).
McNair, Malcolm (1934), ‘Chain store expenses and profits: An Interim Report for 1932,’ Harvard Bureau of Business Research Bulletin No. 94
McNair, Malcolm P. and Eleanor G. May, The American Department Store 1920-1960. A Performance Analysis Based on the Harvard Reports, Harvard Bureau of Business Research Bulletin No. 166 (1963). U.S. Bureau of Census (1932), Fifteenth Census of the United States-Retail Distribution,
Washington D.C. Government Printing Press.
U.S. Bureau of Census (1939), Sixteenth Census of the United States-Retail Distribution, Washington D.C. Government Printing Press.
U.S. Federal Reserve (1944), Federal Reserve Bulletin: Revised Index of Department Store Sales, 542-549.
Secondary Sources
Alston, Julian M., John W. Freebairn, and Jennifer S. James. “Beggar-thy-Neighbor Advertising: Theory and Application to Generic Commodity Promotion Programs.” American Journal of Agricultural Economics 83, no. 4 (2001): 888-902.
Arellano, Manual. Panel Data Econometrics, Oxford University Press, 2003. Arellano, Manual and Stephen R. Bond. “Some Tests of Specification for Panel Data: Monte
Carlo Evidence and an Application to Employment Equations.” Review of Economic Studies 58, no. 2 (1991): 277-297.
Arellano, Manual and Olympia Bover, “Another Look at the Instrumental Variable Estimation of Error-Components Models.” Journal of Econometrics 68, vol. 1 (1995): 29-51.
Benson, Susan P.. Counter Cultures. Saleswomen, Managers, and Customers in American Department Stores, 1890-1940. Urbana: University of Illinois Press, 1988.
Blundell, Richard and Stephen R. Bond, “Initial Conditions and Moment Restrictions in Dynamic Panel Data Models.” Journal of Econometrics 87, no. 1 (1998): 115-143.
Carpenter, Gregory S., Cooper, Lee G., Hanssens, Dominique M. and David F. Midgley, “Modelling Asymmetric Competition.” Management Science 7, no. 4 (1988): 393-412.
Cover, J.H., M. A. Browne, G. Norris, and V. J. Cohenour. “Department Store Sales and Advertising”, Journal of Business of the University of Chicago 4, no. 3 (1931): 227-44.
Darby, W.D., The Story of the Chain Store. New York: Dry Goods Economist, 1928. De Grazia, Victoria. Irresistible Empire. America’s Advance Through Twentieth-century
Europe. Harvard: Belknap, 2005. Elvins, Sarah, Sales & Celebrations. Retailing and Regional Identity in Western New York
State, 1920-1940. Athens, Ohio: Ohio University Press, 2004.

23
Hausman, Jerry. “Specification Tests in Econometrics.” Econometrica 46 (1978): 1251-1272. Hendrickson, Robert (1979), The Grand Emporiums. The Illustrated History of America’s
Great Department Stores, New York, Stein and Day. Hotchkiss, George Burton, “Economic Defense of Advertising”, American Economic Review,
15 (1925): 14-22. Hower, Ralph M. History of an Advertising Agency: N.W. Ayer and Son at Work: 1869-1949.
Cambridge MA: Harvard University Press, 1966. Hypps, Frank Thomson. “The Department Store – A Problem of Elephantiasis”, Annals of the
American Academy of Political and Social Science, 193 (1937): 70-87. Koehn, Nancy F. (2002), “Marshall Field and the rise of the department store,” Harvard
Business School Case No. 9-801-349. Kwoka, John E., Jr, (1993). “The Sales and Competitive Effects of Styling and Advertising
Practices in the U.S. Auto Industry,” Review of Economics and Statistics 75: 649- 56. McNair, Malcolm P. “Trends of Expense and Profit Ratios in Department Stores,” 102-109 in
D. Bloomfield (ed), Selected Articles on Trends in Retail Distribution. New York: H.W. Wilson, 1930.
Meischeid, Frank H, “The Publicity Budget and its Control”, National Retail Dry Goods Association, Report and Digest of Proceedings (1929): 114-19. Nelson, Phillip, Siegfried, John H. and Howell, John. “A Simultaneous Equations Model of
Coffee Brand Pricing and Advertising.” Review of Economics and Statistics,” 74, no 1 (1991): 54-63.
Olney, Martha L., Buy Now, Pay Later. Advertising, Credit, and Consumer Durables in the 1920s (Chapel Hill, N.C.: University of North Carolina Press, 1991).
Pasdermadjian, H.. The Department Store. Its Origins, Evolution, and Economics. London: Newman Books, 1954.
Pope, Daniel. The Making of Modern American Advertising, New York: Basic Books, 1983. Romer, C.D. (1990), “The Great Crash and the onset of the Great Depression,” Quarterly
Journal of Economics, 105(3), 597-624. Sargan, J.D.. “The Estimation of Economic Relationships using Instrumental Variables.”
Econometrica 26, no. 3 (1958): 393-415. Schmalensee, R. (1972). The Economics of Advertising. Amsterdam: North-Holland. Scott, Peter and James T. Walker (2009), “The British ‘Failure’ that Never Was? Anglo-
American Productivity Differences in Large-scale Retailing between the Wars – Evidence from the Department Store Sector.” Unpublished paper, Centre for International Business History, University of Reading.
Slade, Margaret. “Product Rivalry with Multiple Strategic Weapons: An Analysis of Price and Advertising Competition.” Journal of Economics and Management Strategy 4 (1995): 445-476.
Tadajewski, Mark, “Relationship Marketing at Wanamaker’s in the Nineteenth and Early Twentieth Centuries.” Journal of Macromarketing 28 (2008): 169-82.
Thomas, L.A.. “Incumbent Firms’ Response to Entry: Price, Advertising and New Product Introduction.” International Journal of Industrial Organisation 17, (1999): 527-555.
Tremblay, Victor J.. “Strategic Groups and the Demand for Beer,” Journal of Industrial Economics 34, no. 2 (1985): 183-198.
Woodbridge, Jeffery M., Econometric Analysis of Cross Section and Panel Data. Cambridge, MA: MIT Press, 2002.

24
TABLE 1 DEPARTMENT STORE ADVERTISING AND OPERATING STATISTICS, AVERAGE VALUES FOR 1932-39
Sales volume ($) Under $150,000$150,000-300,000$300,000-500,000 $500,000-750,000 $750,000-1,000,000 $1-2 million $2-4 million $4-10 million $10-20 million $20 million or moreNo. of reports 64.9 55.1 50.0 37.8 28.5 65.5 53.8 54.4 18.5 9.8Aggregate sales ($ thousands) 5,906.8 11,218.3 21,290.1 25,287.5 22,141.0 83,383.4 160,143.4 298,860.0 234,244.6 308,835.1Population of city (thousands) 11.3 20.1 34.0 56.5 70.0 113.8 258.1 484.4 1,300.0 2,487.5Gross margin 29.9 31.4 33.0 34.0 34.1 34.4 35.3 35.8 36.8 36.8Newspaper advertising 1.5 2.1 2.4 2.7 2.9 3.2 3.5 3.7 3.4 3.1Direct advertising 0.3 0.2 0.2 0.1 0.1 0.2 0.2 0.2 0.2 0.2Other advertising 0.2 0.3 0.3 0.3 0.3 0.3 0.3 0.2 0.2 0.2Total advertising 2.1 2.6 2.9 3.2 3.4 3.7 3.9 4.2 3.9 3.4Total Expenses 32.3 33.3 33.9 35.0 35.2 35.7 36.5 37.3 37.4 37.2Net profit -2.4 -1.9 -0.9 -1.1 -1.2 -1.3 -1.2 -1.5 -0.6 -0.4Net gain (% of net sales) 0.5 1.1 2.0 2.0 2.1 2.1 2.2 2.4 3.1 3.1Stock-turn (beginning & end inventories) 2.2 2.8 3.4 3.9 4.1 4.0 4.4 4.7 4.7 5.4Sales per sq ft. ($) 9.5 11.2 11.7 13.4 12.9 14.0 14.5 16.1 17.5 19.7Real estate costs per sq. ft. ($) 0.4 0.4 0.4 0.5 0.5 0.6 0.7 0.8 0.9 1.1Sales per employee 6,221.3 5,912.5 5,621.3 5,583.8 5,456.3 5,556.3 5,909.4 6,085.0 6,262.5 7,027.5 Source: HBBR reports, 1932-39. Notes: All columns are % of net sales, except where indicated otherwise. * Available only for 1933-34 for < $150,000 group and for 1932-35 for $150-300,000 group; no 1932 data available for $750-$1m group or >$20 m group. ** Based on a larger proportion of firms reporting than the disaggregated advertising data. *** No 1933 data for >$20 million group. *** No data for < $150,000 group in 1932-34; for $150-300,000 group over 1934-36; for $300-500,000 group in 1934-35; and for >$20 m group in 1932-33.
25
TABLE 2 DEPARTMENT STORE SALES AND ADVERTISING, 1920-1939
Census Region State City Store Harvard Id 1920‐1939 1920‐1929 1930‐1939
Sales Advertising Advertising‐ Sales Advertising Advertising‐ Sales Advertising Advertising‐($000) ($000) Sales Ratio ($000) ($000) Sales Ratio ($000) ($000) Sales Ratio
Midwest Kansas Tapeka Crosby Brothers Co. 223 1,248.03 23.71 1.9 1,419.45 25.80 1.8 1,076.60 21.82 2.0Mississippi Oxford J E Nielson Co. 55 176.11 0.87 0.5 218.67 0.85 0.4 137.80 0.89 0.6Nebraska Lincoln Miller and Paine 147 2,217.23 52.11 2.4 2,447.75 55.75 2.3 1,986.70 48.46 2.4Michigan Detroit Davidson Brother Co. 164 42,822.35 1,249.32 2.9 39,125.30 1,080.07 2.8 46,519.40 1,401.64 3.0
Himelhoch Brothers and Co. 160 1,966.03 83.50 4.2 2,106.75 82.89 3.9 1,825.30 84.12 4.6Ohio Cincinnati Mabley and Darew Co. 226 4,457.10 182.10 4.1 4,400.90 187.91 4.3 4,513.30 176.87 3.9
Cleveland Halle Brothers Co. 158 14,295.88 473.78 3.3 14,976.15 460.41 3.1 13,615.60 487.15 3.6Dayton Rike‐Kumler Co. 40 6,061.18 161.93 2.7 6,549.25 153.13 2.3 5,573.10 170.73 3.1Portsmouth Marting Brothers Co. 227 575.53 14.60 2.5 592.35 13.14 2.2 558.70 15.90 2.8
Wisconsin Milwaukee Edward Schuster & Co Inc. 144 11,817.30 483.30 4.1 12,843.50 566.88 4.4 10,791.10 399.73 3.7North East Connecticut Bridgeport The Howland Dry Goods Co. 215 2,895.45 80.57 2.8 3,133.90 76.46 2.4 2,657.00 84.27 3.2
Massachusetts Boston Conrad and Co. 221 2,954.23 178.47 6.0 2,834.85 149.85 5.3 3,073.60 204.24 6.6E.T. Slattery Co. 11 2,451.53 117.71 4.8 2,610.35 123.48 4.7 2,292.70 111.94 4.9Williams Filenen's Sons Co. 170 25,393.55 693.76 2.7 26,759.70 635.67 2.4 24,027.40 746.05 3.1
New York Binghamton Fowler, Dick and Walker Inc. 276 1,672.30 47.83 2.9 1,896.10 46.69 2.5 1,448.50 48.86 3.4Johnstown Penn Traffic Company 36 3,195.45 72.52 2.3 3,785.90 71.79 1.9 2,605.00 73.25 2.8Poughkeepsie Luckey Platt & Co. 20 1,658.03 41.02 2.5 1,908.95 44.93 2.4 1,407.10 37.50 2.7
Pennsylvania Erie Trask, Precott and Richardson Co. 133 1,100.68 32.07 2.9 1,306.75 34.72 2.7 894.60 29.42 3.3Lancaster Hager and Brother 210 1,029.03 33.05 3.2 1,108.45 32.44 2.9 949.60 33.60 3.5
Watt and Shand 228 2,151.03 50.44 2.3 2,335.35 54.31 2.3 1,966.70 46.96 2.4Pittsburgh Kaufman Dept Store, Inc. 161 24,879.15 718.20 2.9 27,484.60 816.74 3.0 22,273.70 619.66 2.8
The Rosenbaum Co. of Pitsburgh 198 9,887.93 471.90 4.8 13,274.55 581.70 4.4 6,501.30 373.08 5.7Rhode Island Providence Gladding's 64 2,118.95 71.82 3.4 2,275.70 65.97 2.9 1,962.20 77.67 4.0
South Maryland Baltimore Hutzler Bos Co. 98 7,560.25 184.58 2.4 6,735.50 165.17 2.5 8,385.00 203.99 2.4Texas Brenham H.F. Hohlt Co. 19 270.90 2.99 1.1 328.00 3.56 1.1 213.80 2.42 1.1West Virginia Wheeling Stone and Thomas 148 2,109.73 50.33 2.4 2,403.75 55.42 2.3 1,815.70 45.24 2.5
Western California San Diego The Marston Company 212 3,408.93 69.54 2.0 3,787.15 78.27 2.1 3,030.70 61.68 2.0San Francisco Massy's 252 4,104.18 174.12 4.2 3,948.05 169.58 4.3 4,260.30 178.21 4.2
Washington Seattle The Bon Marche 211 7,199.83 228.90 3.2 7,510.45 216.64 2.9 6,889.20 239.93 3.5
Average 5,808.56 188.76 3.2 6,275.88 195.51 3.0 5,341.25 182.10 3.4
26
TABLE 3 COMPARISONS OF SALES, STOCK TURN AND ADVERTISING EXPENDITURE:
THE HBBR “25 YEAR STUDY” AND THE AVERAGED US CENSUS OF DISTRIBUTION DATA (1929, 1935 AND 1939).
HBBR "25 Year Survey"Census Region No. Stores Sales Sales per Stock Advertising Advertising‐
(% of total) (% of total) store ($) Turn (% of total) Sales Ratio
Northeast 45 42 8,564 4.4 43 3.1Midwest 31 45 6,261 5.0 45 3.1South 14 5 3,314 4.1 4 2.4West 10 8 4,904 3.8 8 3.1Total 100 100 100 Cities 38 17 12,875 18 3.2
Amounts 580 $191.7 6,610 4.3 $5.9 3.1
Census of Distribution (1929, 1935, 1939)Census Region No. Stores Sales Sales per
(% of total) (% of total) store ($)
Northeast 23 34 1,378 Midwest 36 38 984 South 27 15 532 West 15 13 807 Total 100 100 Cities 6 34 5,255
Amounts 4,149 $38,212 3,702
Sources: McNair and May, American Department Store; U.S. Bureau of Census, Fifteenth Census; ibid, Sixteenth Census. Notes: 1. The three Census returns are averaged to provide as complete coverage as feasible. 2. 'Amounts' is comprised of the number of stores, and the dollar amount of sales and advertising ($mn) and the average stock-turn and advertising-sales ratio. 3. "Cities" comprise eleven cities that the US Census provide disaggregated data for. The cities being Los Angeles, San Francisco, Chicago, Baltimore, Boston, Detroit, St Louis, Cleveland, Philadelphia, Pittsburgh, and Milwaukee.

27
TABLE 4 ESTIMATES FROM THE “25 YEAR STUDY” (1920-1930. t-STATISTICS IN PARENTHESIS)
1920‐1939 1920‐1929 1930‐1939
Fixed Effects Dynamic Estimates Fixed Effects Dynamic Estimates Fixed Effects Dynamic EstimatesDep. var.:Log sales (1) (2) (3) (4) (5) (6)
log advertising 0.385 (15.35) 0.215 (10.90) 0.439 (9.95) 0.274 (9.35) 0.233 (8.91) 0.146 (7.24)log advertising (‐1) 0.131 (5.98) ‐0.031 (0.87) 0.072 (3.08)log rival advertising ‐0.004 (0.95) ‐0.008 (2.84) ‐0.002 (0.28) ‐0.003 (0.64) ‐0.007 (1.32) ‐0.006 (2.74)log stock turn 0.126 (5.66) 0.042 (2.60) 0.086 (3.43) 0.018 (1.04) 0.214 (5.99) 0.226 (7.56)log sales (‐1) 0.661 (16.20) 0.261 (3.15) 0.586 (11.65)Constant 6.126 (49.68) 0.004 (3.44) 6.577 (39.17) 0.017 (6.99) 6.861 (51.12) ‐0.010 (5.95)Year effects YES YES YES YES YES YESN 580 522 290 261 290 261
R2‐adj 0.912 0.913 0.8658e´e 149.5 22.89 113.85Hausman test 238.4 235.39 ‐477.41
Sargan test 243.78 83.58 197.212nd order serial correlation ‐0.79 0.05 ‐0.68Wald test 3903.39 185.29 4366.65
Notes (Static estimation): 1. All equations include store-specific fixed effects. 2. One period lags are used as instrumental variables for each variable. In order to ease visual comparison the static results are not included in the lagged column. 3. Results are robust to heteroskedasticity.Notes (Dynamic estimation): 1. All models estimated in first‐differences by instrumental variables (GMM). Instrument used is (t‐2) back on sales andadvertising. 2. All results are robust to heteroskedasticity. 3. Test for instruments validity (Sargan) and for 2on order serial correlation are described in Arellano and Bond (1991). 3. Wald test for jointly significant coefficients of variables excluded constant term.

28
TABLE 5 COMPARISONS OF SALES, STOCK TURN AND ADVERTISING EXPENDITURE: “SECRITST STUDY” AND THE US CENSUS
OF DISTRIBUTION (1929) HBBR 1920‐1924 (average) Census of Distribution (1929)Census Region No. Stores Sales Sales per Stock Advertising Advertising‐ Census Region No. Stores Sales Sales per
(% of total) (% of total) store ($) Turn (% of total) Sales Ratio (% of total) (% of total) store ($)
Northeast 39 43 1,899 3.6 41 2.8 Northeast 21 36 1,806 Midwest 34 30 1,520 3.0 33 3.2 Midwest 39 39 1,041 South 15 12 1,379 3.2 11 2.7 South 25 13 523 West 13 15 2,060 2.9 15 2.8 West 15 12 841 Total % 100 100 100 Total % 100 100 Cities 11 44 7,066 3.2 11.2 0.7 Cities 6 36 6,034
Amounts 461 $790 1,715 3.2 231 2.9 Amounts 4,062 $42,144
HBBR 1920‐1924 (Upper 50% of Sales Distribution) HBBR 1920‐1924 (Lower 50% of Sales Distribution)Census Region No. Stores Sales Sales per Stock Advertising Advertising‐ Census Region No. Stores Sales Sales per Stock Advertising Advertising‐
(% of total) (% of total) store ($) Turn (% of total) Sales Ratio (% of total) (% of total) store ($) Turn (% of total) Sales Ratio
Northeast 33 41 7,029 4.1 40 3.0 Northeast 41 48 620 3.4 9 2.4Midwest 30 30 5,768 4.1 33 3.3 Midwest 35 29 435 2.8 6 2.8South 17 12 3,882 4.1 11 2.8 South 13 14 529 2.9 3 2.4West 19 17 5,016 3.7 16 2.8 West 10 9 445 2.4 2 2.5Total 100 100 100 3.0 Total 100 100 20 2.6
Amounts 121 $692 5,712 4.1 20,952 3.0 Amounts 340 $178 2.7 4,563 2.6 Notes: see Table 2.
29
TABLE 6 ESTIMATES FROM THE “SECRITST STUDY” (1920-1924. T-STATISTICS IN
PARENTHESIS) 1920‐1924 1920‐1924 1920‐1924
(Upper 50%) (Lower 50%)
Dep. var.:Log sales (1) (2) (3)
log advertising 0.233 (10.55) 0.431 (19.30) 0.136 (4.55)log advertising (‐1) ‐0.051 (0.88) ‐0.064 (0.50) 0.053 (0.69)log rival advertising 0.004 (0.63) ‐0.009 (0.88) 0.012 (1.85)log stock turn 0.086 (4.23) 0.024 (1.12) 0.285 (5.80)log sales (‐1) 0.338 (2.31) ‐0.197 (1.18) 0.034 (0.15)Constant 2.834 (2.54) 8.748 (2.43) 5.950 (2.55)Year effects YES YES YESN 780 231 549
Sargan test 25.86 3.99 6.782nd order serial correlation ‐0.27 0.93 ‐0.56Wald test 332.97 441.28 366.65
Notes (Dynamic estimation): 1. All models estimated in first-differences by instrumental variables (GMM). Instrument used is (t-2) back on sales and advertising. The estimation utilises Arellano-Bover/Blundell-Bond linear dynamic panel-data estimator (Blundell and Bond, 1998). 3. Wald test for jointly significant coefficients of variables excluded constant term. 4. All results are robust to heteroskedasticity. 5. Test for instruments validity (Sargan) and for 2nd order serial correlation in Blundell and Bond (1998).
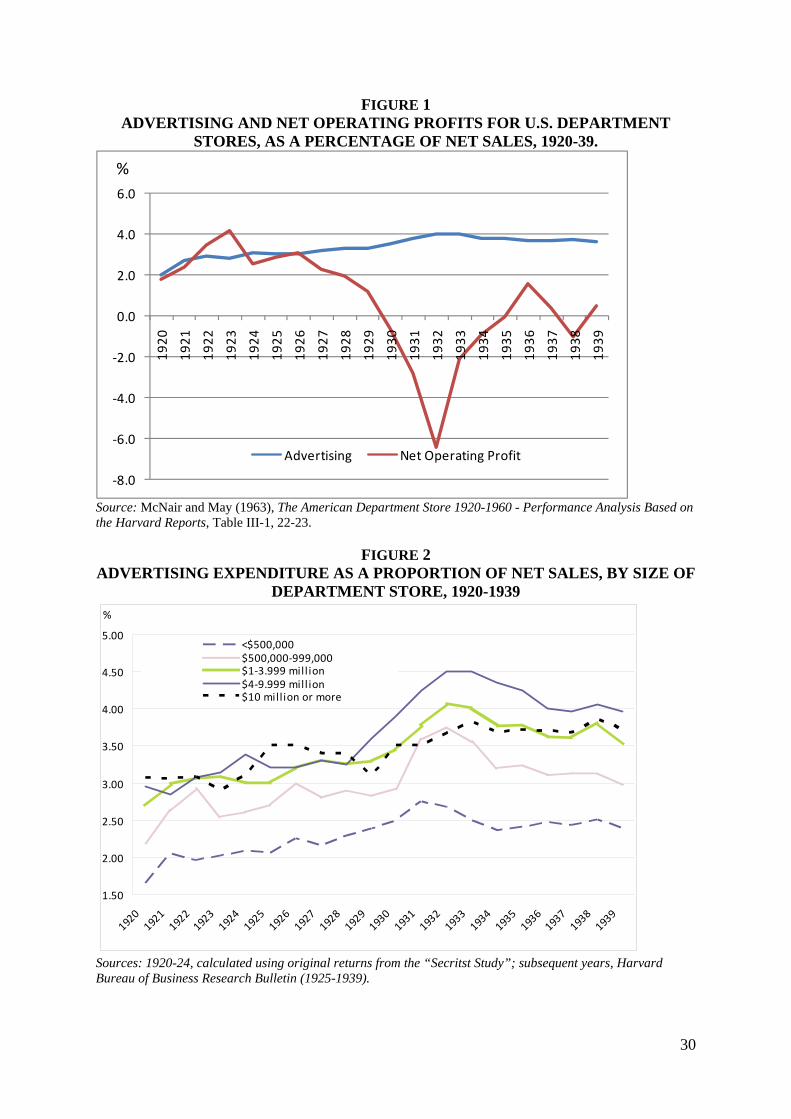
30
FIGURE 1 ADVERTISING AND NET OPERATING PROFITS FOR U.S. DEPARTMENT
STORES, AS A PERCENTAGE OF NET SALES, 1920-39.
‐8.0
‐6.0
‐4.0
‐2.0
0.0
2.0
4.0
6.0
1920
1921
1922
1923
1924
1925
1926
1927
1928
1929
1930
1931
1932
1933
1934
1935
1936
1937
1938
1939
Advertising Net Operating Profit
%
Source: McNair and May (1963), The American Department Store 1920-1960 - Performance Analysis Based on the Harvard Reports, Table III-1, 22-23.
FIGURE 2 ADVERTISING EXPENDITURE AS A PROPORTION OF NET SALES, BY SIZE OF
DEPARTMENT STORE, 1920-1939
1.50
2.00
2.50
3.00
3.50
4.00
4.50
5.00
1920
1921
1922
1923
1924
1925
1926
1927
1928
1929
1930
1931
1932
1933
1934
1935
1936
1937
1938
1939
<$500,000$500,000‐999,000$1‐3.999 mill ion$4‐9.999 mill ion$10 million or more
%
Sources: 1920-24, calculated using original returns from the “Secritst Study”; subsequent years, Harvard Bureau of Business Research Bulletin (1925-1939).

31
FIGURE 3
DEPARTMENT STORE SALES INDICES (1920-1939): COMPARISON OF FEDERAL RESERVE AND HARVARD BUREAU OF BUSINESS RESEARCH
DATA
40
50
60
70
80
90
100
110
120
130
140
1920 1925 1930 1935
Federal Reserve Index
HBBR Index
Sources: 1. The Federal Reserve Board, "Revised Index of Department Store Sales" -Seasonally Adjusted Series, p549; 2. Harvard Bureau Business Research "25 Year Study", Harvard Business School.

APPENDIX 1 COMPLETE SAMPLE OF THE HBBR DEPARTMENT STORE STUDIES (1920-
1939) State/ City Store Harvard Years No.
Province Identifier in sample Years
Alabama Birmingham Louis Pizitz Dry Goods Company 141 1920‐1924 4Loveman, Joseph and Loeb 350 1921‐1924 4
Troy Rosenberg Bro. 359 1921‐1924 4Arizona Douglas Levy Bros. Dry Goods Co. Inc. 430 1921‐1924 4
Phoenix Korriek's Dry Goods Co. 349 1921‐1922 2Arkansas Fort Smith Wolf‐Pollock Dry Goods Co. 168 1921‐1924 3
Seamon Store Co. 609 1922‐1924 3Hot Springs WoodCo.ck and Lawson Dry Goods Co. 186 1920‐1924 5Jonesboro Z T Matthew and Son 152 1920‐1924 4Little Rock Joe D Back and Brother 451 1921‐1922 2
Pfeifer Bros. Inc. 874 1929‐1939 22Pine Bluff Schober‐Martin Dry Goods Co. 328 1921‐1924 4Texarkana Ben F Smith Dry Goods Co. 475 1922‐1922 1
California Anaheim Unidentified 678 1922‐1922 1Berkeley J F Hink & Son, Inc. 143 1920‐1920 1
G O Donogh and Son 213 1920‐1924 4El Centro Verney Bros. Inc. 464 1920‐1924 4Eureka Daly Bros. 577 1922‐1924 3Fresno Radin and Kamp, Inc. 13 1920‐1922 3
Einotein's Inc 197 1920‐1924 5Long Beach Buffunis? 72 1920‐1924 3
The Wall Co. 352 1921‐1921 1Los Angeles Millisone? 154 1920‐1922 3
Bullock's Inc. 412 1921‐1924 4J W Robinson 114 1920‐1924 5
Modesto G P Schafer Co. 232 1921‐1923 3Napa Unidentified 42 1920‐1921 2
Winship Beard Co. 17 1920‐1924 5Basburg 516 1922‐1924 3
Oakland Whitthome and Swan 272 1920‐1924 5H C Capwell Co. 150 1920‐1939 16
Ontario P E Ostran & Co. 662 1922‐1922 1Pacific Grove Holman's Dept Store Inc. 91 1920‐1922 3Placerville A K Gwisler Co. 353 1921‐1924 4Redlands Harris Company 416 1921‐1924 4Riverside G Rouse and Co. 216 1920‐1922 3Sacramento Weinstock,Lubin and Co. Inc. 205 1920‐1923 4San Diego The Marston Company 212 1920‐1939 20
Holzwasser Inc. 515 1922‐1924 3San Francisco Raphael Weil and Co. 49 1920‐1939 15
Massy's 252 1920‐1939 20Unidentified 301 1921‐1921 1L Magnin & Co., Inc. 385 1921‐1924 4The Emporium 387 1921‐1939 15City of Paris Dry Good Co. 597 1922‐1924 3Roos Bros. Inc. 785 1929‐1939 22
San Jose O A Hale and Co. 593 1922‐1924 3San Luis Obispo Riley‐Crocker Co. 444 1921‐1924 4San Mateo Levy Brothers 202 1920‐1924 4San Rafael Allient's Inc. 85 1920‐1924 3Santa Ana Rankin Dry Goods Co. 92 1920‐1920 1Stockton Smith and Lang 199 1920‐1930 11Turlock Berg's 658 1922‐1922 1Upland J J Atwood Co. 96 1920‐1930 11Visalia S Sweet‐Company Inc. 109 1920‐1921 2Watsonville Charles Ford Co. 381 1921‐1924 4
Colorado Colorado Springs Kaufman's 619 1922‐1924 3Denver A S Lewis and Son Dry Goods Co. 242 1920‐1924 4
May Daniels and Fisher Stores Co. 438 1921‐1924 4Denver Dry Goods Co. 436 1921‐1939 15
Fort Collins The Edmonds Dry Goods Co. 504 1922‐1924 3Pueblo White and Davis 547 1922‐1924 3
Connecticut Bridgeport The Howland Dry Goods Co. 215 1920‐1939 20D M Read Co. 414 1921‐1924 4The Smith‐Murray Co. 351 1921‐1924 4
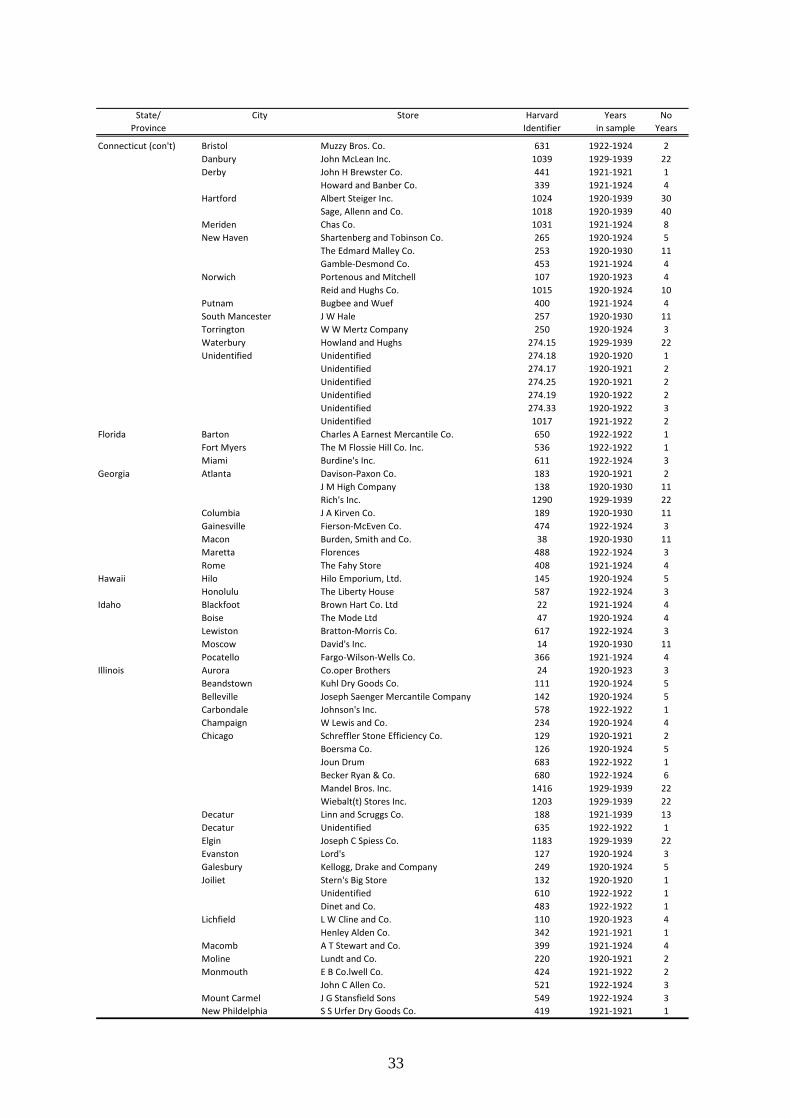
33
State/ City Store Harvard Years NoProvince Identifier in sample Years
Connecticut (con't) Bristol Muzzy Bros. Co. 631 1922‐1924 2Danbury John McLean Inc. 1039 1929‐1939 22Derby John H Brewster Co. 441 1921‐1921 1
Howard and Banber Co. 339 1921‐1924 4Hartford Albert Steiger Inc. 1024 1920‐1939 30
Sage, Allenn and Co. 1018 1920‐1939 40Meriden Chas Co. 1031 1921‐1924 8New Haven Shartenberg and Tobinson Co. 265 1920‐1924 5
The Edmard Malley Co. 253 1920‐1930 11Gamble‐Desmond Co. 453 1921‐1924 4
Norwich Portenous and Mitchell 107 1920‐1923 4Reid and Hughs Co. 1015 1920‐1924 10
Putnam Bugbee and Wuef 400 1921‐1924 4South Mancester J W Hale 257 1920‐1930 11Torrington W W Mertz Company 250 1920‐1924 3Waterbury Howland and Hughs 274.15 1929‐1939 22Unidentified Unidentified 274.18 1920‐1920 1
Unidentified 274.17 1920‐1921 2Unidentified 274.25 1920‐1921 2Unidentified 274.19 1920‐1922 2Unidentified 274.33 1920‐1922 3Unidentified 1017 1921‐1922 2
Florida Barton Charles A Earnest Mercantile Co. 650 1922‐1922 1Fort Myers The M Flossie Hill Co. Inc. 536 1922‐1922 1Miami Burdine's Inc. 611 1922‐1924 3
Georgia Atlanta Davison‐Paxon Co. 183 1920‐1921 2J M High Company 138 1920‐1930 11Rich's Inc. 1290 1929‐1939 22
Columbia J A Kirven Co. 189 1920‐1930 11Gainesville Fierson‐McEven Co. 474 1922‐1924 3Macon Burden, Smith and Co. 38 1920‐1930 11Maretta Florences 488 1922‐1924 3Rome The Fahy Store 408 1921‐1924 4
Hawaii Hilo Hilo Emporium, Ltd. 145 1920‐1924 5Honolulu The Liberty House 587 1922‐1924 3
Idaho Blackfoot Brown Hart Co. Ltd 22 1921‐1924 4Boise The Mode Ltd 47 1920‐1924 4Lewiston Bratton‐Morris Co. 617 1922‐1924 3Moscow David's Inc. 14 1920‐1930 11Pocatello Fargo‐Wilson‐Wells Co. 366 1921‐1924 4
Illinois Aurora Co.oper Brothers 24 1920‐1923 3Beandstown Kuhl Dry Goods Co. 111 1920‐1924 5Belleville Joseph Saenger Mercantile Company 142 1920‐1924 5Carbondale Johnson's Inc. 578 1922‐1922 1Champaign W Lewis and Co. 234 1920‐1924 4Chicago Schreffler Stone Efficiency Co. 129 1920‐1921 2
Boersma Co. 126 1920‐1924 5Joun Drum 683 1922‐1922 1Becker Ryan & Co. 680 1922‐1924 6Mandel Bros. Inc. 1416 1929‐1939 22Wiebalt(t) Stores Inc. 1203 1929‐1939 22
Decatur Linn and Scruggs Co. 188 1921‐1939 13Decatur Unidentified 635 1922‐1922 1Elgin Joseph C Spiess Co. 1183 1929‐1939 22Evanston Lord's 127 1920‐1924 3Galesbury Kellogg, Drake and Company 249 1920‐1924 5Joiliet Stern's Big Store 132 1920‐1920 1
Unidentified 610 1922‐1922 1Dinet and Co. 483 1922‐1922 1
Lichfield L W Cline and Co. 110 1920‐1923 4Henley Alden Co. 342 1921‐1921 1
Macomb A T Stewart and Co. 399 1921‐1924 4Moline Lundt and Co. 220 1920‐1921 2Monmouth E B Co.lwell Co. 424 1921‐1922 2
John C Allen Co. 521 1922‐1924 3Mount Carmel J G Stansfield Sons 549 1922‐1924 3New Phildelphia S S Urfer Dry Goods Co. 419 1921‐1921 1

34
State/ City Store Harvard Years NoProvince Identifier in sample Years
Illinois (con't) Peterburg Ross A Nanee Co. 537 1922‐1924 3Ploria Clarke and Co. 519 1922‐1924 3Quincy Halbach‐Schroeder and Co. 512 1922‐1922 1Rushville The George Little Co. 322 1921‐1924 4Springfield R F Herndon and Co. 217 1920‐1924 5Sterling The J K Chester Co. 368 1921‐1924 3
Indiana Elkhardt Zielsel Bro Co. 130 1920‐1930 11Frankfort The M B Thrasher Co. 332 1921‐1924 4Gashen The Hudson Co. 334 1921‐1921 1Indiana Indianopolis 70 1920‐1920 1Indianapolis William H Block Company 565 1922‐1924 3
H P Wasson and Co. Inc. 71 1920‐1924 4Kockomo William H Turner Co. 422 1921‐1923 3La Fayette Unidentified 447 1921‐1921 1Logansport Wiler and Wise Inc. 277 1920‐1924 5Marion Boston Store 157 1920‐1924 5Michigan City Staigen and Donnelly 73 1920‐1924 4Mishanwaka M Gilbert and Sons Co. Inc. 674 1922‐1924 6Muncie The W.A. Mc Naughton Co. 542 1922‐1924 3New Albany S W Newburger and Company 300 1922‐1924 3Rensselaer G E Murray and Co. 153 1920‐1930 11South Bend George Wyman and Co. 458 1921‐1924 4
Unidentified 480 1922‐1922 1Sullivan Springer‐Gouekenour Co. (see 1903) 116 1920‐1924 4Sullivan Will A Thompson and Son 406 1921‐1924 4Winchester The W E Miller Co. 598 1922‐1924 3
Iowa Alden Fred L Spencer & Co. 471 1922‐1924 3Cedar Rapids The Denecke Co. 397 1921‐1921 1
The Killian Co. 75 1920‐1924 5Clinton John D Van Alland and Son Inc. 54 1920‐1924 5Davenport M.L Parker Co. 2 1920‐1920 1Des Moines Harris‐Emery Co. 278 1920‐1924 5
Younger Brothers 264 1920‐1939 14Unidentified 379 1921‐1921 1
Dubugue J F Stampler Co. Inc. 117 1920‐1920 1Eldora C M Haas Co. 104 1922‐1924 3Fort Dodge Gates Dry Goods Company 121 1920‐1924 5
Tuerke Mercantile Co. 4 1920‐1930 11The Boston Store 315 1921‐1921 1
Fort Madison Dodge? 165 1920‐1924 4Mason City Manley Bor. Co. 418 1921‐1924 4
Merkel Co. 561 1922‐1924 3Monticello George Stuhler's Sons Co. 218 1920‐1920 1Sheldon Starrett Bros Inc 682 1922‐1924 5Sioux City J L Hudson 163 1920‐1930 11
Unidentified 452 1921‐1921 1Pelletier Co. 600 1922‐1922 1
Spencer Moulton, Fee & Co. 31 1920‐1922 3Storm Lake Staple Stores 468 1922‐1922 1
W L McNeal 606 1922‐1922 1Woodbine Siebels' Dept Store 484 1922‐1924 3
Kansas Arkansas Newman Dry Goods Co. 454 1921‐1924 4Peoples Store 543 1922‐1924 3
Concordia Austin Dry Goods 326 1921‐1924 4Emporia Rorabaugh Paxton Dry Goods Co. 497 1922‐1924 3Fort Scott W.J. Calhoun Dry Goods Co. 18 1920‐1930 11Hiawatha Adams Mercantile Co. 25 1920‐1924 5Hutchinson Pegues‐Wright Dry Goods Co. 100 1920‐1921 2Leavenworth Ettensen‐Winning Dry Goods Co. 648 1922‐1922 1Liberal Frank G Boles 491 1922‐1922 1Sterling A L Mincer 404 1921‐1922 2Tapeka Crosby Brothers Co. 223 1920‐1939 20
The Pelletier Stores Co. 308 1921‐1939 15Wellington The Fashion (Sehabinger and Baker) 622 1922‐1922 1Wichita The George Innes Co. 175 1920‐1920 1
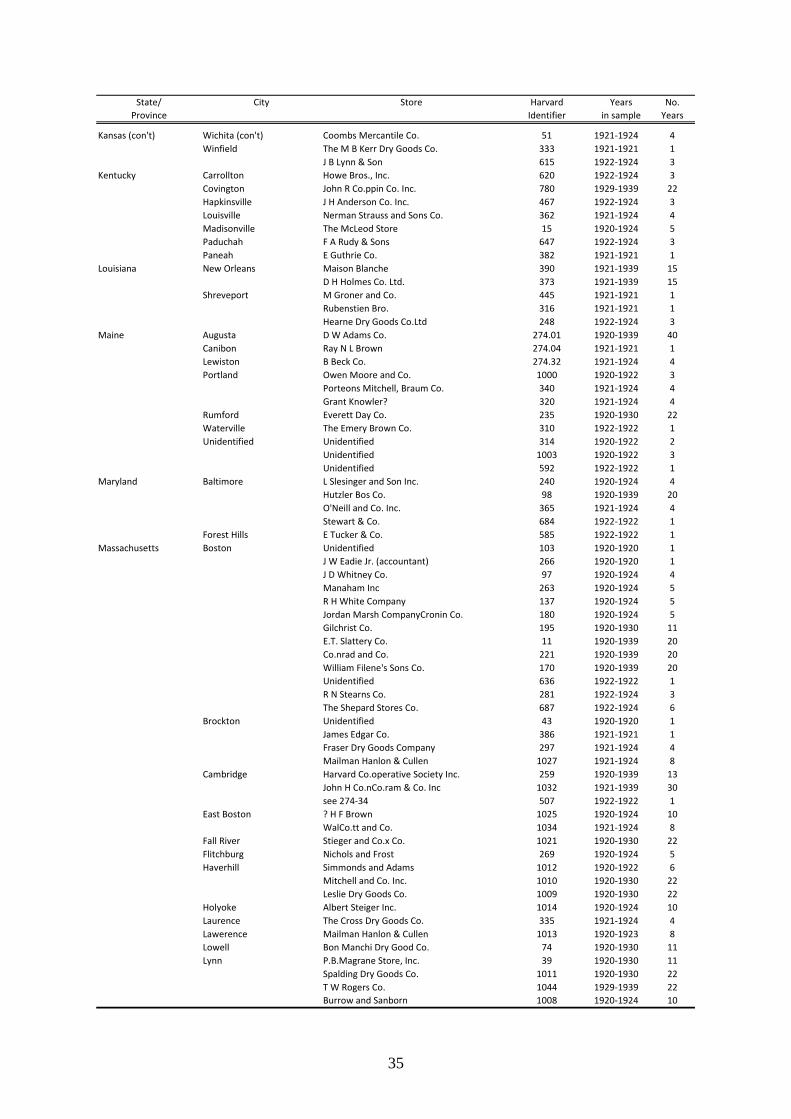
35
State/ City Store Harvard Years No.Province Identifier in sample Years
Kansas (con't) Wichita (con't) Coombs Mercantile Co. 51 1921‐1924 4Winfield The M B Kerr Dry Goods Co. 333 1921‐1921 1
J B Lynn & Son 615 1922‐1924 3Kentucky Carrollton Howe Bros., Inc. 620 1922‐1924 3
Covington John R Co.ppin Co. Inc. 780 1929‐1939 22Hapkinsville J H Anderson Co. Inc. 467 1922‐1924 3Louisville Nerman Strauss and Sons Co. 362 1921‐1924 4Madisonville The McLeod Store 15 1920‐1924 5Paduchah F A Rudy & Sons 647 1922‐1924 3Paneah E Guthrie Co. 382 1921‐1921 1
Louisiana New Orleans Maison Blanche 390 1921‐1939 15D H Holmes Co. Ltd. 373 1921‐1939 15
Shreveport M Groner and Co. 445 1921‐1921 1Rubenstien Bro. 316 1921‐1921 1Hearne Dry Goods Co.Ltd 248 1922‐1924 3
Maine Augusta D W Adams Co. 274.01 1920‐1939 40Canibon Ray N L Brown 274.04 1921‐1921 1Lewiston B Beck Co. 274.32 1921‐1924 4Portland Owen Moore and Co. 1000 1920‐1922 3
Porteons Mitchell, Braum Co. 340 1921‐1924 4Grant Knowler? 320 1921‐1924 4
Rumford Everett Day Co. 235 1920‐1930 22Waterville The Emery Brown Co. 310 1922‐1922 1Unidentified Unidentified 314 1920‐1922 2
Unidentified 1003 1920‐1922 3Unidentified 592 1922‐1922 1
Maryland Baltimore L Slesinger and Son Inc. 240 1920‐1924 4Hutzler Bos Co. 98 1920‐1939 20O'Neill and Co. Inc. 365 1921‐1924 4Stewart & Co. 684 1922‐1922 1
Forest Hills E Tucker & Co. 585 1922‐1922 1Massachusetts Boston Unidentified 103 1920‐1920 1
J W Eadie Jr. (accountant) 266 1920‐1920 1J D Whitney Co. 97 1920‐1924 4Manaham Inc 263 1920‐1924 5R H White Company 137 1920‐1924 5Jordan Marsh CompanyCronin Co. 180 1920‐1924 5Gilchrist Co. 195 1920‐1930 11E.T. Slattery Co. 11 1920‐1939 20Co.nrad and Co. 221 1920‐1939 20William Filene's Sons Co. 170 1920‐1939 20Unidentified 636 1922‐1922 1R N Stearns Co. 281 1922‐1924 3The Shepard Stores Co. 687 1922‐1924 6
Brockton Unidentified 43 1920‐1920 1James Edgar Co. 386 1921‐1921 1Fraser Dry Goods Company 297 1921‐1924 4Mailman Hanlon & Cullen 1027 1921‐1924 8
Cambridge Harvard Co.operative Society Inc. 259 1920‐1939 13John H Co.nCo.ram & Co. Inc 1032 1921‐1939 30see 274‐34 507 1922‐1922 1
East Boston ? H F Brown 1025 1920‐1924 10WalCo.tt and Co. 1034 1921‐1924 8
Fall River Stieger and Co.x Co. 1021 1920‐1930 22Flitchburg Nichols and Frost 269 1920‐1924 5Haverhill Simmonds and Adams 1012 1920‐1922 6
Mitchell and Co. Inc. 1010 1920‐1930 22Leslie Dry Goods Co. 1009 1920‐1930 22
Holyoke Albert Steiger Inc. 1014 1920‐1924 10Laurence The Cross Dry Goods Co. 335 1921‐1924 4Lawerence Mailman Hanlon & Cullen 1013 1920‐1923 8Lowell Bon Manchi Dry Good Co. 74 1920‐1930 11Lynn P.B.Magrane Store, Inc. 39 1920‐1930 11
Spalding Dry Goods Co. 1011 1920‐1930 22T W Rogers Co. 1044 1929‐1939 22Burrow and Sanborn 1008 1920‐1924 10

36
State/ City Store Harvard Years No.Province Identifier in sample Years
Massachusetts (con't) Marlboro W M A Allen Co. 1001 1920‐1930 22New Bedford Charles H Co.x Company 1023 1920‐1930 22Pittsfield England Bros.. Inc. 465 1921‐1923 3
Holden and Stone Co. 446 1921‐1924 4Rockland J A Rice Company Ltd 607 1922‐1924 3Roxbury Timothy Smith Co. 1002 1920‐1924 10Salem Almy, Bigelow and Washburn Inc. 1019 1920‐1924 10
W G Webber Co. 1016 1920‐1930 22Springfield Albert Steiger Inc. 1020 1920‐1939 32
Poole Dry Goods Co. 1026 1921‐1924 8The Brigham Co. 312 1921‐1939 15
Waltham Gover Cronin Inc 287 1921‐1924 4Westfield Beals and Co. Inc. 1029 1921‐1924 8Worcester Chauncy Textile Co. 1028 1921‐1924 8
John C MacInnes Co. Inc. 564 1922‐1924 3Bannard,Summer and Putman Co. 569 1922‐1924 3John C MacInnes Co. 1054 1929‐1939 22
Unidentified Unidentified 274.28 1920‐1920 1Unidentified 274.27 1920‐1920 1Unidentified 274.03 1920‐1921 2Unidentified 274.11 1920‐1922 2Unidentified 274.09 1920‐1922 2Unidentified 274.24 1920‐1922 2Unidentified 274.22 1920‐1922 2Unidentified 274.02 1920‐1922 2Unidentified 274.21 1920‐1922 2Unidentified 274.12 1920‐1922 3Unidentified 274.26 1920‐1922 3Unidentified 274.14 1920‐1922 3Unidentified 274.1 1920‐1922 3Unidentified 274.16 1920‐1922 3Unidentified 274.2 1920‐1922 3Unidentified 274.13 1920‐1922 3Unidentified 1 1921‐1921 1Unidentified 402 1921‐1921 1Unidentified 274.29 1921‐1922 2Unidentified 274.34 1921‐1922 2Unidentified 274.36 1921‐1922 2Unidentified 274.3 1922‐1922 1Unidentified 274.31 1922‐1922 1
Michigan Alligan Stein & Griswold Co. 641 1922‐1922 1Alma Dwight W Robinson 225 1920‐1922 3Alpena Cronin Co. 181 1920‐1924 4Ann Arbor Mack and Co. 247 1920‐1930 11Battle Creek Schroeder Bro. Co. 108 1920‐1924 5
Toeller's Dept Store 455 1921‐1921 1The L W Robinson Co. 517 1922‐1922 1
Detroit ?‐Davidson Brother Co. 164 1920‐1939 20Himelhoch Brothers and Co. 160 1920‐1939 20Crowby Milner and Co. 1440 1929‐1939 22
Escanabra Boston Store Co. 583 1922‐1924 3Flint Smith, Bridgeman and Co. 94 1920‐1923 4Grand Haven Addison Baltz Co. Inc. 552 1922‐1922 1
Addison Baltz Co. Inc. 550 1922‐1922 1Grand Rapids Wurzburg Co. 134 1920‐1921 2
Jurgens and Holtuluwer 538 1922‐1924 3Ionia Allen Bros. 481 1922‐1922 1Kalamazoo Streng and Ginn Co. 336 1921‐1924 4Lansing J W Krapp Co. 63 1920‐1939 14Lansing Mills Dry Goods Co. 420 1921‐1924 4
F N Anbaugh Co. 522 1922‐1924 3Ludington Adam Drach Co. 173 1920‐1922 3Mt. Pleasant Charles E Hagan and Campany 495 1922‐1922 1Muskegon The William W Hardy Co. 576 1922‐1924 3Otsego Kohlenstein Brothers 26 1920‐1920 1Owasso D M Christian Co. 204 1920‐1924 3Port Huron The Ballentine Dry Goods Co. 229 1920‐1920 1

37
State/ City Store Harvard Years No.Province Identifier in sample Years
Michigan Port Huron (con't) J B Sperry Co. 237 1921‐1921 1L Niger and Co. 59 1920‐1930 11
Saginaw William Bari Dry Goods Co. 124 1920‐1924 5Unidentified 135 1920‐1920 1Unidentified 305 1921‐1921 1
Spanta John‐Swift Co. 76 1920‐1924 4St Joseph Rimes and Hildebrand 459 1921‐1924 4
Minnesota Detroit the Blanding Co. 643 1922‐1922 1Duluth The Fair 35 1920‐1922 3
Ed F Wahl Co. 241 1920‐1923 4Slack and Co. 574 1922‐1924 3
Minneapolis The Baker Co. 348 1921‐1924 4L S Donaldson Co. 357 1922‐1922 1The Dayton Co. 623 1922‐1924 3
St Paul Mannheimer Brother 179 1920‐1924 5Schuneman and Evans 207 1920‐1924 5The Emporium of St Pauls 1135 1929‐1939 22
Stillwater Murphy and Co. 570 1922‐1924 3Willmar P C Petersen and Sons 367 1921‐1924 4
Mississippi Jackson R.E. Kennington Co. 270 1920‐1920 1Duluth Duluth Glass Block Stone Inc. 69 1920‐1924 5Hibbing Lippman's Dept Store 530 1922‐1924 3Jackson Downing, Locke Co. 575 1922‐1924 3Kosciusko Potts Oliver Co. 557 1922‐1924 3Natchez James J Co.le and Company 48 1920‐1930 11Oxford J E Nielson Co. 55 1920‐1939 20St Louis The Progress Store Co. 50 1920‐1924 5
Missouri Brookfield Calhoun‐Halliburton Dry Goods Co. 434 1921‐1921 1Independence A J Bundsechu, Inc 118 1920‐1924 5Japlin Newman Merchantile Co. 523 1922‐1924 3
Christman Dry Goods Co. 599 1922‐1924 3Marshall Missouri Valley Stores Co. 338 1921‐1924 4Mexico Dallmeyer Dry Goods Co. 671 1922‐1924 6Springfield Turner's Inc. 676 1922‐1924 5St Joseph Hirsch Bro. Dry Goods Co. 354 1921‐1924 4St Louis Nugent's 136 1920‐1924 5
Stix, Baer and Fuller 209 1920‐1930 11Scruggs, Vandervoort and Barney 1271 1929‐1939 22
Montana Bozeman The Willson Co. 222 1920‐1922 3Great Falls The Paris Fligmand Co. 203 1920‐1920 1Harve The Golden Ruld Store (Woodward &Co.) 627 1922‐1922 1
F Buttrey Co. 174 1920‐1920 1Helena Sander‐Ferguson Co. 62 1920‐1922 3
New York Dry Goods 361 1921‐1921 1Kalispell Kalispell Mercantile Co. 307 1921‐1922 2Leviston Power Merchantile Co. 672 1922‐1924 6Miles City Hansen's 624 1922‐1922 1Sidney Yellowstone Mercantile Co. 384 1921‐1924 4
North Carolina Ashevillle Bon Marche, Inc. 27 1920‐1924 4Greensboro Brown‐Beck Co. 155 1920‐1924 5
North Dakota Fargo E G Ricker Co. 89 1920‐1920 1New York Bath BabCo.ck‐Bath Co. 274.08 1922‐1922 1
Binghamton Hills, McLean and Haskins 274.23 1920‐1930 11Binghamton Fowler, Dick and Walker Inc 470 1920‐1939 20Brooklyn Heilbronn Inc. 178 1921‐1924 4
A L Naumm and Son Co. 276 1921‐1924 4Mc Co.mmick Store 289 1922‐1922 1Abraham, Straus Inc. 462 1929‐1939 22
Buffalo I S Given 553 1920‐1920 1Wiesseman and Eiss Co. 1277 1920‐1924 5Williams Hengerer Co. 172 1921‐1924 4Jahraus‐Braum Co. 187 1922‐1924 3
East Rochester B J Fryatt Dept Store, Inc. 383 1921‐1921 1Elmira S F Iszard Co. 524 1920‐1923 4
Sheehan's Inc. 321 1922‐1924 5Glens Falls The Boston Sore Co. 90 1920‐1924 5
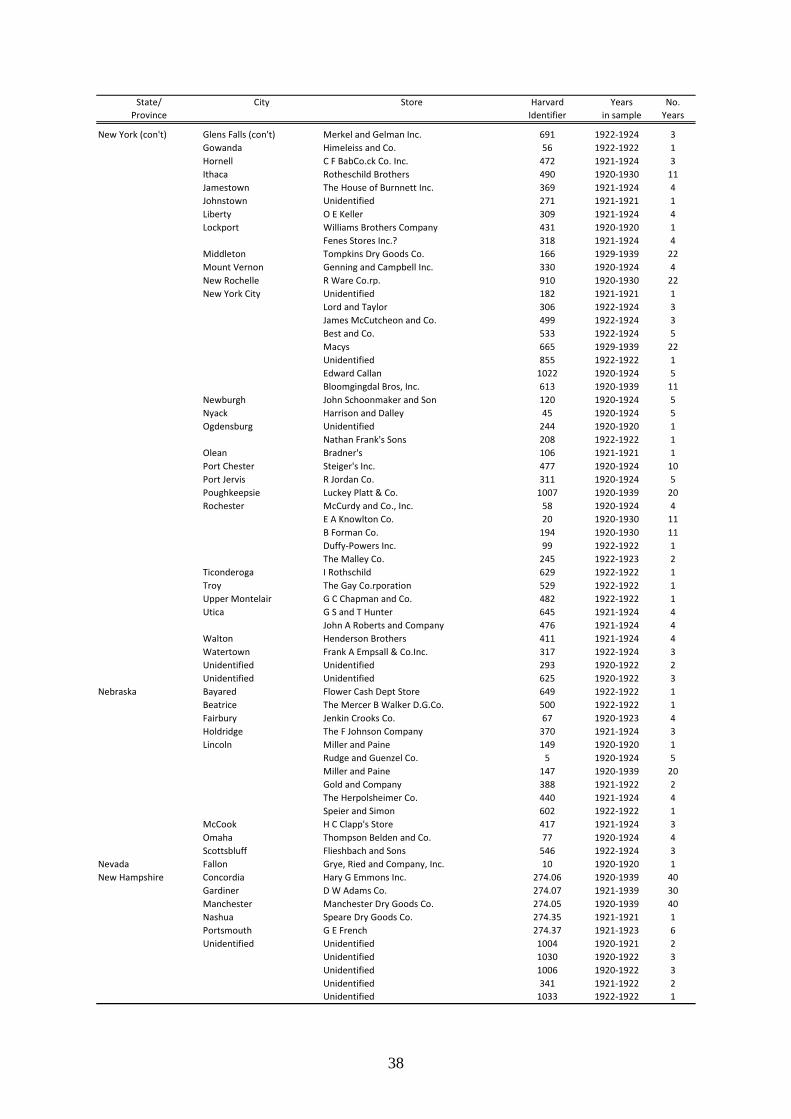
38
State/ City Store Harvard Years No.Province Identifier in sample Years
New York (con't) Glens Falls (con't) Merkel and Gelman Inc. 691 1922‐1924 3Gowanda Himeleiss and Co. 56 1922‐1922 1Hornell C F BabCo.ck Co. Inc. 472 1921‐1924 3Ithaca Rotheschild Brothers 490 1920‐1930 11Jamestown The House of Burnnett Inc. 369 1921‐1924 4Johnstown Unidentified 271 1921‐1921 1Liberty O E Keller 309 1921‐1924 4Lockport Williams Brothers Company 431 1920‐1920 1
Fenes Stores Inc.? 318 1921‐1924 4Middleton Tompkins Dry Goods Co. 166 1929‐1939 22Mount Vernon Genning and Campbell Inc. 330 1920‐1924 4New Rochelle R Ware Co.rp. 910 1920‐1930 22New York City Unidentified 182 1921‐1921 1
Lord and Taylor 306 1922‐1924 3James McCutcheon and Co. 499 1922‐1924 3Best and Co. 533 1922‐1924 5Macys 665 1929‐1939 22Unidentified 855 1922‐1922 1Edward Callan 1022 1920‐1924 5Bloomgingdal Bros, Inc. 613 1920‐1939 11
Newburgh John Schoonmaker and Son 120 1920‐1924 5Nyack Harrison and Dalley 45 1920‐1924 5Ogdensburg Unidentified 244 1920‐1920 1
Nathan Frank's Sons 208 1922‐1922 1Olean Bradner's 106 1921‐1921 1Port Chester Steiger's Inc. 477 1920‐1924 10Port Jervis R Jordan Co. 311 1920‐1924 5Poughkeepsie Luckey Platt & Co. 1007 1920‐1939 20Rochester McCurdy and Co., Inc. 58 1920‐1924 4
E A Knowlton Co. 20 1920‐1930 11B Forman Co. 194 1920‐1930 11Duffy‐Powers Inc. 99 1922‐1922 1The Malley Co. 245 1922‐1923 2
Ticonderoga I Rothschild 629 1922‐1922 1Troy The Gay Co.rporation 529 1922‐1922 1Upper Montelair G C Chapman and Co. 482 1922‐1922 1Utica G S and T Hunter 645 1921‐1924 4
John A Roberts and Company 476 1921‐1924 4Walton Henderson Brothers 411 1921‐1924 4Watertown Frank A Empsall & Co.Inc. 317 1922‐1924 3Unidentified Unidentified 293 1920‐1922 2Unidentified Unidentified 625 1920‐1922 3
Nebraska Bayared Flower Cash Dept Store 649 1922‐1922 1Beatrice The Mercer B Walker D.G.Co. 500 1922‐1922 1Fairbury Jenkin Crooks Co. 67 1920‐1923 4Holdridge The F Johnson Company 370 1921‐1924 3Lincoln Miller and Paine 149 1920‐1920 1
Rudge and Guenzel Co. 5 1920‐1924 5Miller and Paine 147 1920‐1939 20Gold and Company 388 1921‐1922 2The Herpolsheimer Co. 440 1921‐1924 4Speier and Simon 602 1922‐1922 1
McCook H C Clapp's Store 417 1921‐1924 3Omaha Thompson Belden and Co. 77 1920‐1924 4Scottsbluff Flieshbach and Sons 546 1922‐1924 3
Nevada Fallon Grye, Ried and Company, Inc. 10 1920‐1920 1New Hampshire Concordia Hary G Emmons Inc. 274.06 1920‐1939 40
Gardiner D W Adams Co. 274.07 1921‐1939 30Manchester Manchester Dry Goods Co. 274.05 1920‐1939 40Nashua Speare Dry Goods Co. 274.35 1921‐1921 1Portsmouth G E French 274.37 1921‐1923 6Unidentified Unidentified 1004 1920‐1921 2
Unidentified 1030 1920‐1922 3Unidentified 1006 1920‐1922 3Unidentified 341 1921‐1922 2Unidentified 1033 1922‐1922 1

39
State/ City Store Harvard Years No.Province Identifier in sample Years
New Jersey Asbury Steinbach Co. 378 1921‐1922 2Bridgeton Stiles and Son 401 1921‐1921 1Jersey City Wonder Stores Inc. 604 1922‐1922 1Newwalk L Bamberger and Co. 1446 1929‐1939 22
Hahne and Co. 1438 1929‐1939 22New Mexico Alamogordo G J Wolfinger 184 1920‐1922 3
Albuguergue Kistler Co.llister and Co. 518 1922‐1922 1Belen The John Becker Co. 663 1922‐1924 6
North Carolina Ashville M V Moore and Co. 460 1921‐1924 4Charlotte Ivey's of Charlotte 956 1929‐1939 22Durham R L Baldwin Co. 664 1922‐1922 1Greensboro Meyer's Co. 539 1922‐1922 1Pinehurst Pinehurst Inc. 506 1922‐1922 1
North Dakota Bottineau Ertresvaag's 505 1922‐1922 1Dickinson Ried Bros. Inc. 634 1922‐1924 3Fargo Herbst Department Stores 254 1920‐1920 1Grand Forks Odell Co. 591 1922‐1924 3
Ohio Akron A Polsky Co. 78 1920‐1924 5The Hower Co. 410 1921‐1924 4The Yeager Co. 393 1921‐1924 4
Alliance The Spring‐Holzworth Co. 344 1921‐1924 4Arcanum The M L Winsenberger 478 1922‐1924 3Cambridge Potter, Davis Company 487 1922‐1924 3Canton The Stern and Mann Co. 167 1920‐1923 4
Klein ‐Heffelman‐Gallans Co. 442 1921‐1924 4Cincinnati Rollman and Sons Co. 246 1920‐1924 5
Mabley and Darew Co. 226 1920‐1939 20Unidentified 303 1921‐1921 1Hanke Brothers Co. 219 1921‐1921 1Unidentified 642 1922‐1922 1The H S Pogue Co. 1269 1929‐1939 22
Cleveland Fries and Schuele Co. 193 1920‐1924 5Lindner Company 125 1920‐1930 11The Stearn Co. 28 1920‐1930 11The Bailey Co. 159 1920‐1939 12Halle Brothers Co., 158 1920‐1939 20
Columbus The F&R Lazarus Co. 535 1922‐1924 3Morehouse‐Martens Co. 667 1922‐1924 6The Union Co. 936 1929‐1938 10
Covington George Worley 568 1922‐1922 1Dayton Rike‐Kumler Co. 40 1920‐1939 20
Elder and Johnston Co. 391 1921‐1924 3The Louis Traxler Co. 377 1921‐1924 4
Delaware Morrison Dry Goods Company 191 1920‐1920 1Delphos J N Lange and Co. 224 1920‐1920 1Findlay Patterson's 421 1922‐1922 2Franklin E.B. Thirkield and Sons Co. 9 1920‐1920 1Greenville Palace Dept Store 177 1920‐1924 4Hicksville Boon Bevinton Co. 560 1922‐1924 3Kenton D B Nourse and Son Co. 291 1921‐1921 1
D B Nourse and Son Co. 292 1921‐1921 1Lima The Leader Store 639 1922‐1922 1Marion Uhler‐Phillips Co. 105 1920‐1930 11Mount Gilead White House Dry Goods Store (White & Bra 30 1920‐1922 3Mt Vernon J S Ringwalt Co. 206 1920‐1924 5Newark The W H Mazey Co. 558 1922‐1924 3Norwalk Lewis M Pries 675 1922‐1924 6Portsmouth Marting Brothers Co. 227 1920‐1939 20
Co.oper Bros 638 1922‐1924 3Sandusky The R M and C B WilCo.x Co. 239 1920‐1924 5Springfield Fahiem‐Leham Co. 331 1921‐1924 4Toledo The Nauhausel Bros. Co. 432 1921‐1924 4
Lamson Bros. Co. 433 1921‐1939 15La Salle and Koch Co. 415 1921‐1939 15
Van Wert The Bonnewitz Co. 295 1921‐1924 4Warren Warner Co. 88 1920‐1922 3
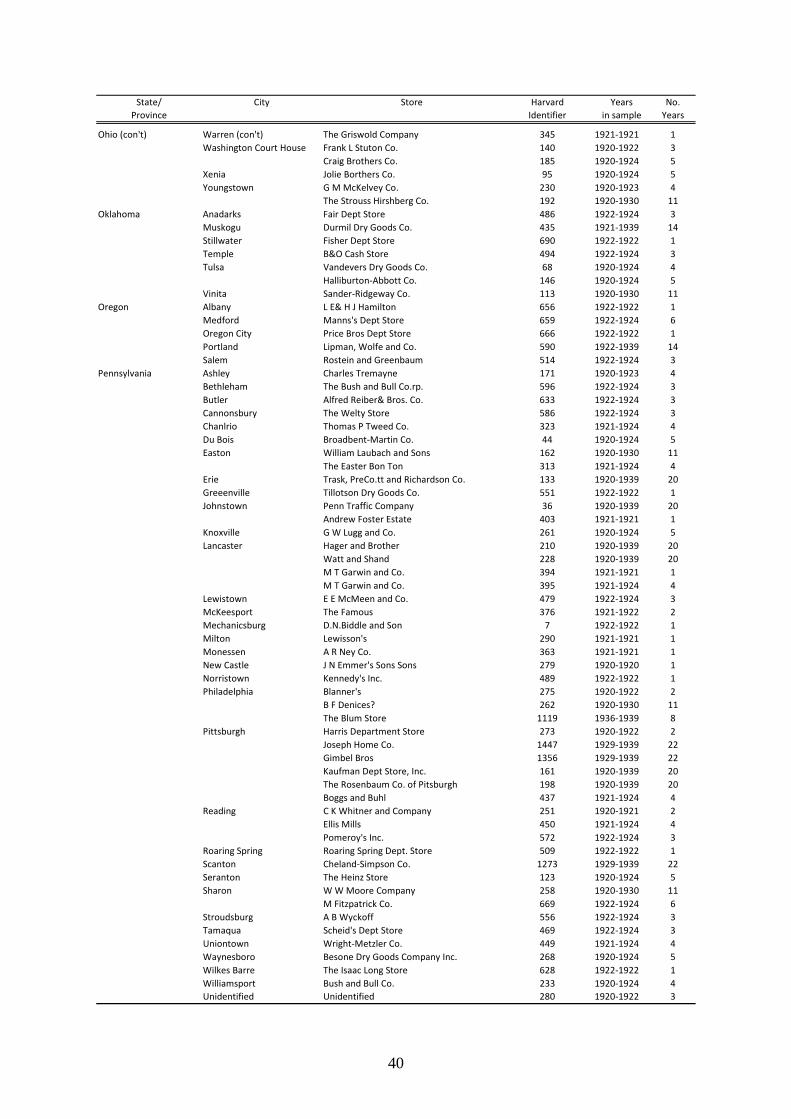
40
State/ City Store Harvard Years No.Province Identifier in sample Years
Ohio (con't) Warren (con't) The Griswold Company 345 1921‐1921 1Washington Court House Frank L Stuton Co. 140 1920‐1922 3
Craig Brothers Co. 185 1920‐1924 5Xenia Jolie Borthers Co. 95 1920‐1924 5Youngstown G M McKelvey Co. 230 1920‐1923 4
The Strouss Hirshberg Co. 192 1920‐1930 11Oklahoma Anadarks Fair Dept Store 486 1922‐1924 3
Muskogu Durmil Dry Goods Co. 435 1921‐1939 14Stillwater Fisher Dept Store 690 1922‐1922 1Temple B&O Cash Store 494 1922‐1924 3Tulsa Vandevers Dry Goods Co. 68 1920‐1924 4
Halliburton‐Abbott Co. 146 1920‐1924 5Vinita Sander‐Ridgeway Co. 113 1920‐1930 11
Oregon Albany L E& H J Hamilton 656 1922‐1922 1Medford Manns's Dept Store 659 1922‐1924 6Oregon City Price Bros Dept Store 666 1922‐1922 1Portland Lipman, Wolfe and Co. 590 1922‐1939 14Salem Rostein and Greenbaum 514 1922‐1924 3
Pennsylvania Ashley Charles Tremayne 171 1920‐1923 4Bethleham The Bush and Bull Co.rp. 596 1922‐1924 3Butler Alfred Reiber& Bros. Co. 633 1922‐1924 3Cannonsbury The Welty Store 586 1922‐1924 3Chanlrio Thomas P Tweed Co. 323 1921‐1924 4Du Bois Broadbent‐Martin Co. 44 1920‐1924 5Easton William Laubach and Sons 162 1920‐1930 11
The Easter Bon Ton 313 1921‐1924 4Erie Trask, PreCo.tt and Richardson Co. 133 1920‐1939 20Greeenville Tillotson Dry Goods Co. 551 1922‐1922 1Johnstown Penn Traffic Company 36 1920‐1939 20
Andrew Foster Estate 403 1921‐1921 1Knoxville G W Lugg and Co. 261 1920‐1924 5Lancaster Hager and Brother 210 1920‐1939 20
Watt and Shand 228 1920‐1939 20M T Garwin and Co. 394 1921‐1921 1M T Garwin and Co. 395 1921‐1924 4
Lewistown E E McMeen and Co. 479 1922‐1924 3McKeesport The Famous 376 1921‐1922 2Mechanicsburg D.N.Biddle and Son 7 1922‐1922 1Milton Lewisson's 290 1921‐1921 1Monessen A R Ney Co. 363 1921‐1921 1New Castle J N Emmer's Sons Sons 279 1920‐1920 1Norristown Kennedy's Inc. 489 1922‐1922 1Philadelphia Blanner's 275 1920‐1922 2
B F Denices? 262 1920‐1930 11The Blum Store 1119 1936‐1939 8
Pittsburgh Harris Department Store 273 1920‐1922 2Joseph Home Co. 1447 1929‐1939 22Gimbel Bros 1356 1929‐1939 22Kaufman Dept Store, Inc. 161 1920‐1939 20The Rosenbaum Co. of Pitsburgh 198 1920‐1939 20Boggs and Buhl 437 1921‐1924 4
Reading C K Whitner and Company 251 1920‐1921 2Ellis Mills 450 1921‐1924 4Pomeroy's Inc. 572 1922‐1924 3
Roaring Spring Roaring Spring Dept. Store 509 1922‐1922 1Scanton Cheland‐Simpson Co. 1273 1929‐1939 22Seranton The Heinz Store 123 1920‐1924 5Sharon W W Moore Company 258 1920‐1930 11
M Fitzpatrick Co. 669 1922‐1924 6Stroudsburg A B Wyckoff 556 1922‐1924 3Tamaqua Scheid's Dept Store 469 1922‐1924 3Uniontown Wright‐Metzler Co. 449 1921‐1924 4Waynesboro Besone Dry Goods Company Inc. 268 1920‐1924 5Wilkes Barre The Isaac Long Store 628 1922‐1922 1Williamsport Bush and Bull Co. 233 1920‐1924 4Unidentified Unidentified 280 1920‐1922 3

41
State/ City Store Harvard Years No.Province Identifier in sample Years
Rhode Island Paurtucket McDevitt's Inc. 274.38 1921‐1921 1Providence Jones and Co. 337 1920‐1924 5
Gladding's 12 1920‐1939 20The Outlet Co. 64 1922‐1939 23The Shipard Co. 677 1929‐1939 22
Woonsocket The Harris Mowry Company 1127 1920‐1924 5Unidentified Unidentified 260 1922‐1922 1
S Carolina Greenville C D Stradley and Co. Inc. 60 1920‐1920 1Spartanburg Aug W Smith Co. 156 1920‐1939 15
South Dakota Aberdeen The Olwin‐Angell Store 371 1921‐1924 3Lake Andes G F Buche Co. 621 1922‐1924 3Lead Hearst Mercantile Co. 493 1922‐1922 1Michell A F McGovern and Sons 492 1922‐1922 1Rapid City ? Hill Co. 1248 1929‐1939 22Sioux Falls Freese‐Rohde Co. 644 1922‐1922 1
Tennessee Bristol H P King Co. 508 1922‐1924 3Chattanooga Unidentified 41 1920‐1920 1
D B Loueman Co. 231 1920‐1921 2Columbia Anderson Bros & Foster 688 1922‐1922 1Jackson Rosenbloom Brothers Company 238 1920‐1924 5Johnson City ? 325 1921‐1924 4Knoxville Rich's 618 1922‐1924 3Memphis Bry‐Block Merchantile Co. 429 1921‐1924 4
B Lowenstein & Bros. Inc. 603 1922‐1922 1Texas Austin E M Scanbrough and Sons 79 1920‐1924 4
Bahn Bros. 768 1929‐1939 22Belton Co.chran, Blair and Potts 485 1922‐1922 1Brenham H.F. Hohlt Co. 19 1920‐1939 20
Winkelmann and Bohne 540 1922‐1924 3Consicana K Wolens Dept Store 545 1922‐1924 3Dallas A Harris and Co. 324 1921‐1939 15
W A Green Co. 922 1929‐1939 22Neiman‐Niarcus Co. 978 1929‐1939 22
Denton The Williams Store 501 1922‐1924 3EL Paso The Boston Store 503 1922‐1922 1Fort Wayne Wolf & Dessaner Co. 1318 1929‐1939 22Fort Worth The Fair of Texas Co. 122 1920‐1920 1
W C Stripling Co. 176 1920‐1920 1H C Meacham and Co. 356 1921‐1924 4L G Gilbert and Co. 544 1922‐1924 3The Fair of Texas Co. 679 1922‐1939 23
Gainesville J O Patterson 661 1922‐1922 1Greenville Graham‐Fagg Co. 347 1921‐1924 4Houston W C Mumm Co. 87 1920‐1920 1
Harris‐Hahlo Co. 541 1922‐1924 3Lancaster F M Hammond Co. 52 1920‐1924 4Longview J.F.Stuckey Co. 32 1920‐1920 1Newcastle Thomas, Slaton and Burris 425 1921‐1921 1Paris Burton Peel Dry Goods Co. 510 1922‐1922 1San Antonio Wolff and Munx Co. 101 1920‐1921 2
Joske Bro. Co. 372 1921‐1921 1Taylor F W Marse and Co. 80 1920‐1920 1Tyler Mayer and Schmidt 358 1921‐1921 1
Sipstate Dry Goods Co. 654 1922‐1922 1Yoakum E Hertz 448 1921‐1924 4
Utah Salt Lake City Keith O'Brian Inc 115 1920‐1922 3Auerbach Co. 236 1920‐1924 5Walker Bros Dry Goods Company 151 1920‐1930 11
Vermont Barre Tehe Homer Fritts Co. Inc. 398 1921‐1924 4Billows Falls Goodnow, Jennett and Pillsbury Inc 548 1922‐1924 3Brattleboro Houghton and Simonds 637 1922‐1924 3Bristol N F Wunshee and Son 294 1921‐1924 4Burlington F W Abernethy 463 1921‐1924 4
E E Clerkson and Co. 589 1922‐1922 1Virginia Lawrenceville W S Peebles 413 1921‐1924 4
Lynchburg Snyder and Benman Inc. 563 1922‐1924 3
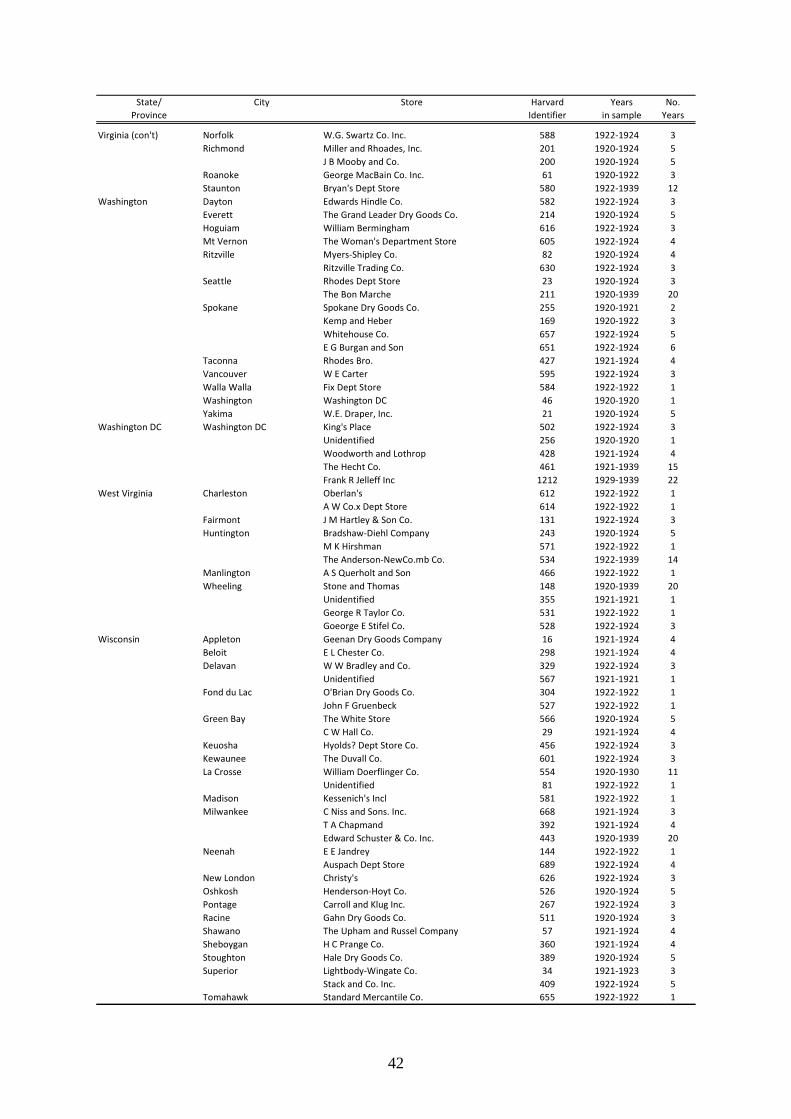
42
State/ City Store Harvard Years No.Province Identifier in sample Years
Virginia (con't) Norfolk W.G. Swartz Co. Inc. 588 1922‐1924 3Richmond Miller and Rhoades, Inc. 201 1920‐1924 5
J B Mooby and Co. 200 1920‐1924 5Roanoke George MacBain Co. Inc. 61 1920‐1922 3Staunton Bryan's Dept Store 580 1922‐1939 12
Washington Dayton Edwards Hindle Co. 582 1922‐1924 3Everett The Grand Leader Dry Goods Co. 214 1920‐1924 5Hoguiam William Bermingham 616 1922‐1924 3Mt Vernon The Woman's Department Store 605 1922‐1924 4Ritzville Myers‐Shipley Co. 82 1920‐1924 4
Ritzville Trading Co. 630 1922‐1924 3Seattle Rhodes Dept Store 23 1920‐1924 3
The Bon Marche 211 1920‐1939 20Spokane Spokane Dry Goods Co. 255 1920‐1921 2
Kemp and Heber 169 1920‐1922 3Whitehouse Co. 657 1922‐1924 5E G Burgan and Son 651 1922‐1924 6
Taconna Rhodes Bro. 427 1921‐1924 4Vancouver W E Carter 595 1922‐1924 3Walla Walla Fix Dept Store 584 1922‐1922 1Washington Washington DC 46 1920‐1920 1Yakima W.E. Draper, Inc. 21 1920‐1924 5
Washington DC Washington DC King's Place 502 1922‐1924 3Unidentified 256 1920‐1920 1Woodworth and Lothrop 428 1921‐1924 4The Hecht Co. 461 1921‐1939 15Frank R Jelleff Inc 1212 1929‐1939 22
West Virginia Charleston Oberlan's 612 1922‐1922 1A W Co.x Dept Store 614 1922‐1922 1
Fairmont J M Hartley & Son Co. 131 1922‐1924 3Huntington Bradshaw‐Diehl Company 243 1920‐1924 5
M K Hirshman 571 1922‐1922 1The Anderson‐NewCo.mb Co. 534 1922‐1939 14
Manlington A S Querholt and Son 466 1922‐1922 1Wheeling Stone and Thomas 148 1920‐1939 20
Unidentified 355 1921‐1921 1George R Taylor Co. 531 1922‐1922 1Goeorge E Stifel Co. 528 1922‐1924 3
Wisconsin Appleton Geenan Dry Goods Company 16 1921‐1924 4Beloit E L Chester Co. 298 1921‐1924 4Delavan W W Bradley and Co. 329 1922‐1924 3
Unidentified 567 1921‐1921 1Fond du Lac O'Brian Dry Goods Co. 304 1922‐1922 1
John F Gruenbeck 527 1922‐1922 1Green Bay The White Store 566 1920‐1924 5
C W Hall Co. 29 1921‐1924 4Keuosha Hyolds? Dept Store Co. 456 1922‐1924 3Kewaunee The Duvall Co. 601 1922‐1924 3La Crosse William Doerflinger Co. 554 1920‐1930 11
Unidentified 81 1922‐1922 1Madison Kessenich's Incl 581 1922‐1922 1Milwankee C Niss and Sons. Inc. 668 1921‐1924 3
T A Chapmand 392 1921‐1924 4Edward Schuster & Co. Inc. 443 1920‐1939 20
Neenah E E Jandrey 144 1922‐1922 1Auspach Dept Store 689 1922‐1924 4
New London Christy's 626 1922‐1924 3Oshkosh Henderson‐Hoyt Co. 526 1920‐1924 5Pontage Carroll and Klug Inc. 267 1922‐1924 3Racine Gahn Dry Goods Co. 511 1920‐1924 3Shawano The Upham and Russel Company 57 1921‐1924 4Sheboygan H C Prange Co. 360 1921‐1924 4Stoughton Hale Dry Goods Co. 389 1920‐1924 5Superior Lightbody‐Wingate Co. 34 1921‐1923 3
Stack and Co. Inc. 409 1922‐1924 5Tomahawk Standard Mercantile Co. 655 1922‐1922 1

43
State/ City Store Harvard Years No.Province Identifier in sample Years
Two Rivers Rivers Merchantile Co. 559 1921‐1921 1Wanpaca Cristy's 405 1921‐1924 4Waukesha Enterprise Mercantile Company 407 1920‐1924 5Wisconsin Rapids Johnson and Hill Co. 37 1921‐1921 1Unidentified Unidentified 346 1920‐1920 1
Wyoming Sheridon Stevens, Fryberger & Co. 608 1922‐1924 3Unidentified Unidentified Unidentified 139 1920‐1920 1
Unidentified 374 1921‐1921 1Unidentified 302 1921‐1921 1Unidentified 274 1929‐1939 11
Alberta Edmonton South J P Malone 84 1922‐1924 3Ontariao, Canada Chatham Charles Austin Co. Ltd. 364 1921‐1924 4
Galt W W Wislkinson Ltd 83 1920‐1923 4Hamilton Fuinch Bros. Ltd 1466 1929‐1939 22Toronto Murray‐Kay Co. Ltd. 284 1920‐1924 5
Quebec Montreal Henry Morgan and Co. Ltd 128 1920‐1924 5Sakatchewan Regina R H Williams and Son Ltd. 86 1920‐1930 11
Weyburn F W Smith Ltd. 375 1921‐1922 2