Embed Size (px)
Citation preview
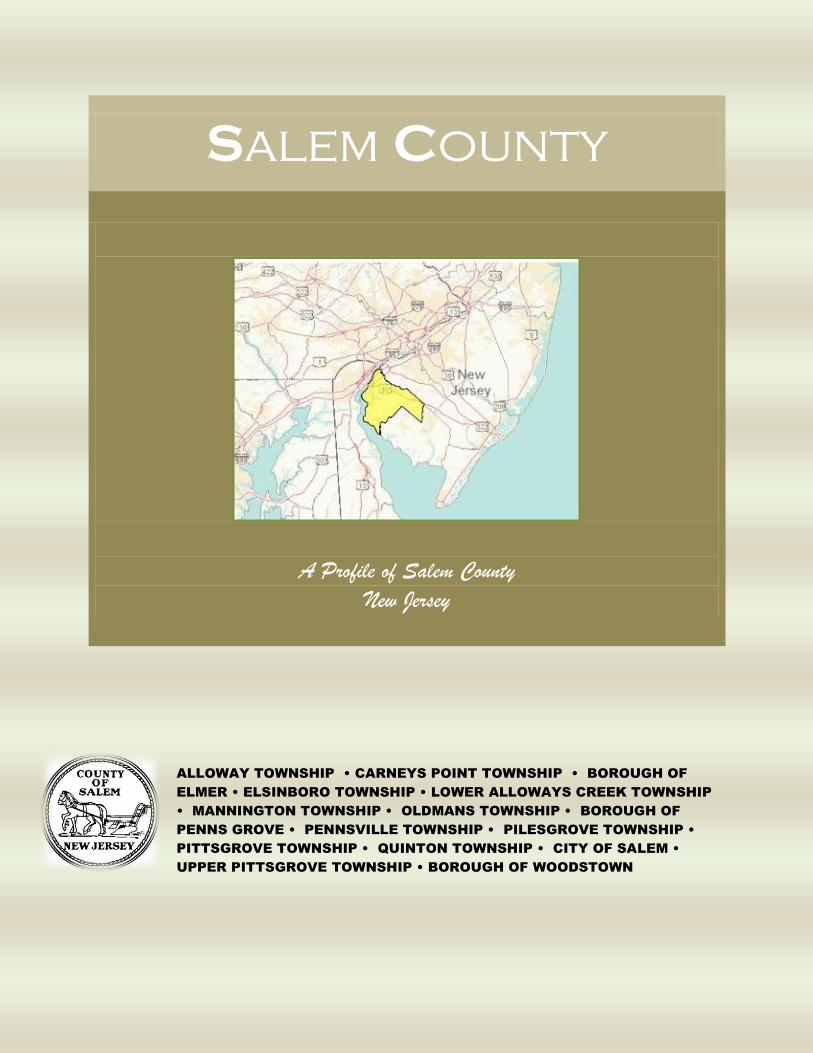
Salem County
A Profile of Salem County
New Jersey
ALLOWAY TOWNSHIP • CARNEYS POINT TOWNSHIP • BOROUGH OF
ELMER • ELSINBORO TOWNSHIP • LOWER ALLOWAYS CREEK TOWNSHIP
• MANNINGTON TOWNSHIP • OLDMANS TOWNSHIP • BOROUGH OF
PENNS GROVE • PENNSVILLE TOWNSHIP • PILESGROVE TOWNSHIP •
PITTSGROVE TOWNSHIP • QUINTON TOWNSHIP • CITY OF SALEM •
UPPER PITTSGROVE TOWNSHIP • BOROUGH OF WOODSTOWN
2 Salem County, NJ
Table of Contents
Overview and Geographical Background ..................................................................................................... 3
Housing Density........................................................................................................................................ 4
Transportation ........................................................................................................................................... 5
Public Transportation ............................................................................................................................ 5
County Road Mileage ........................................................................................................................... 6
Commute: Travel Time to Work ........................................................................................................... 7
Demographics ............................................................................................................................................... 8
Population ................................................................................................................................................ 8
Race (2010) ............................................................................................................................................... 9
Municipalities (Population) .................................................................................................................... 10
Population Density .................................................................................................................................. 11
Population Under the Age of 18 ............................................................................................................. 12
Political and Government Background ....................................................................................................... 13
Voter Registration .................................................................................................................................. 14
Voter Turnout ......................................................................................................................................... 15
Family Structure.......................................................................................................................................... 16
Households .............................................................................................................................................. 16
Education .................................................................................................................................................... 17
Adults ...................................................................................................................................................... 17
School Districts ....................................................................................................................................... 17
Youth Education Achievement ............................................................................................................... 18
HSPA Language Arts/Mathematics 2011-2012 ...................................................................................... 19
Dropout Rates ......................................................................................................................................... 19
Kids Count .................................................................................................................................................. 20
Housing and Income ................................................................................................................................... 21
Local Economy/ Job Sector ........................................................................................................................ 21
Unemployment ........................................................................................................................................ 21
Main Industrials ...................................................................................................................................... 22
Largest Employers .................................................................................................................................. 22
Crime and Substance Abuse ....................................................................................................................... 23
3 Salem County, NJ
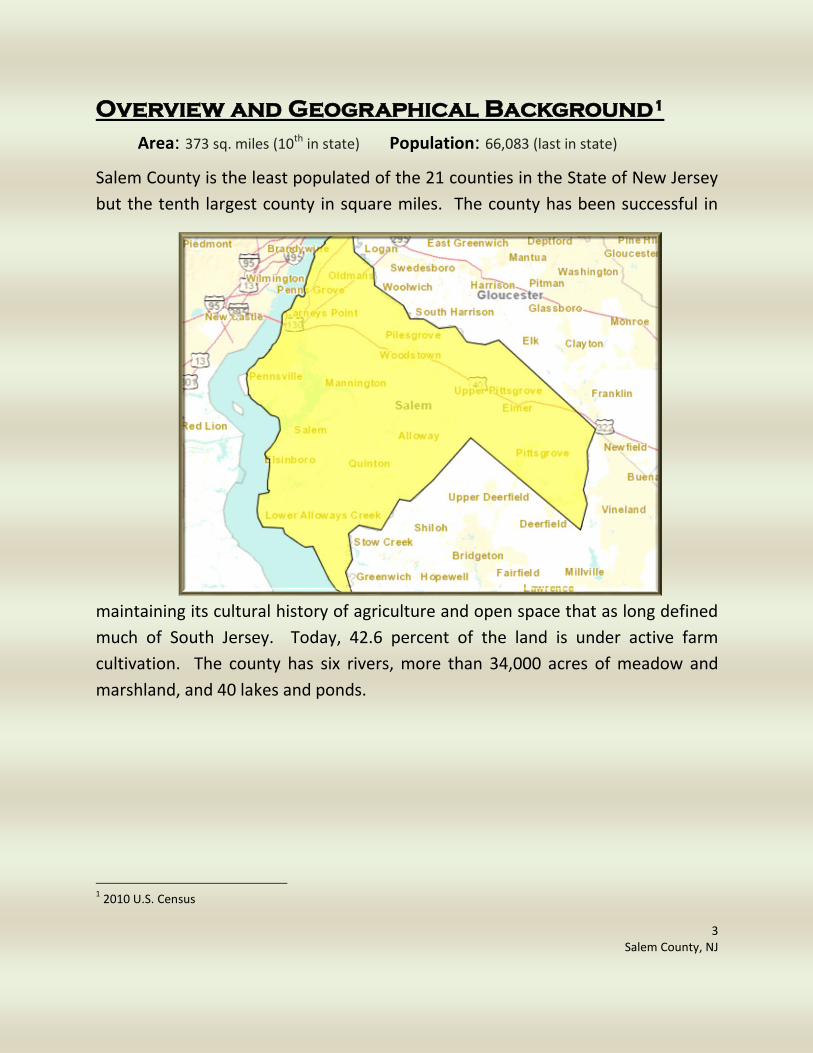
Overview and Geographical Background1
Area: 373 sq. miles (10th in state) Population: 66,083 (last in state)
Salem County is the least populated of the 21 counties in the State of New Jersey
but the tenth largest county in square miles. The county has been successful in
maintaining its cultural history of agriculture and open space that as long defined
much of South Jersey. Today, 42.6 percent of the land is under active farm
cultivation. The county has six rivers, more than 34,000 acres of meadow and
marshland, and 40 lakes and ponds.
1 2010 U.S. Census
4 Salem County, NJ
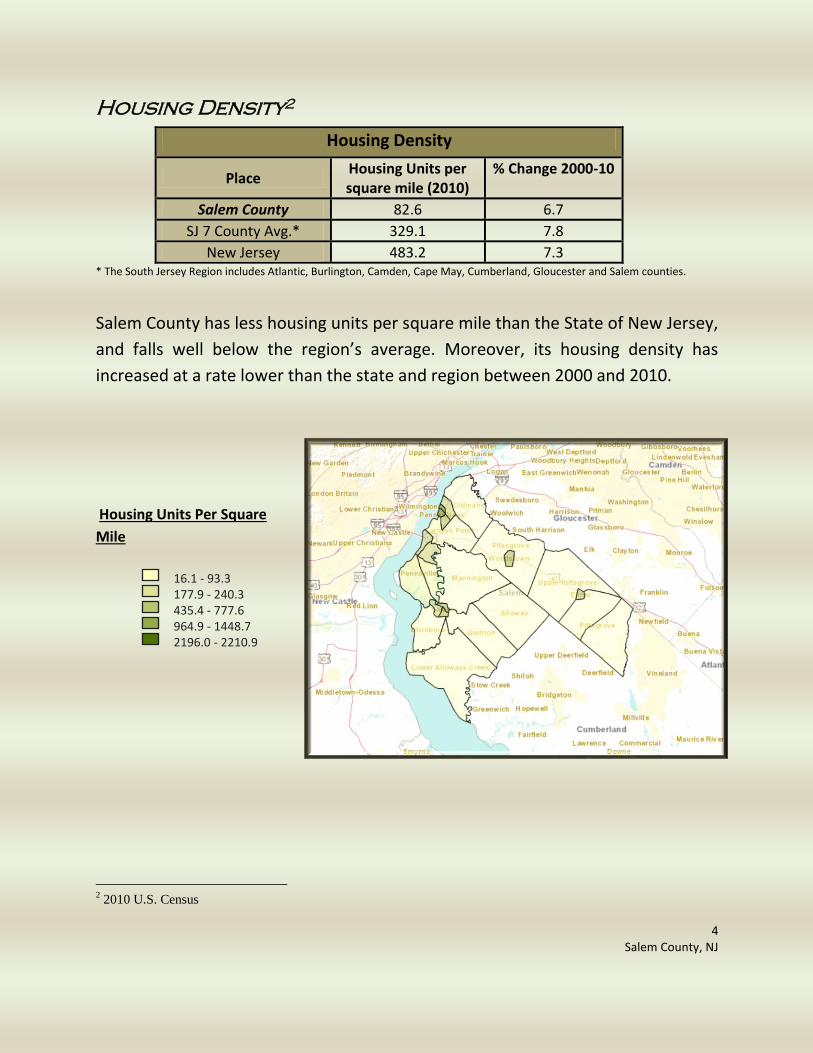
Housing Density2
Housing Density
Place Housing Units per square mile (2010)
% Change 2000-10
Salem County 82.6 6.7
SJ 7 County Avg.* 329.1 7.8
New Jersey 483.2 7.3 * The South Jersey Region includes Atlantic, Burlington, Camden, Cape May, Cumberland, Gloucester and Salem counties.
Salem County has less housing units per square mile than the State of New Jersey,
and falls well below the region’s average. Moreover, its housing density has
increased at a rate lower than the state and region between 2000 and 2010.
Housing Units Per Square
Mile
2 2010 U.S. Census
16.1 - 93.3 177.9 - 240.3 435.4 - 777.6 964.9 - 1448.7 2196.0 - 2210.9
5 Salem County, NJ
Transportation
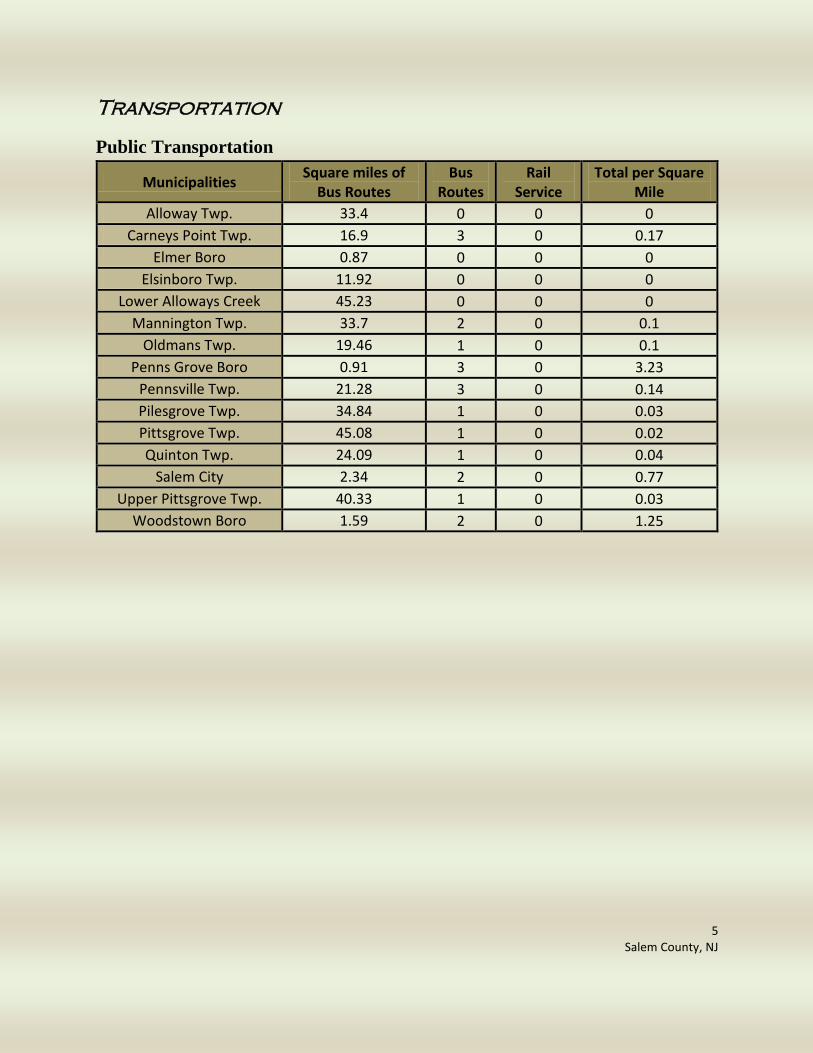
Public Transportation
Municipalities Square miles of
Bus Routes Bus
Routes Rail
Service Total per Square
Mile
Alloway Twp. 33.4 0 0 0
Carneys Point Twp. 16.9 3 0 0.17
Elmer Boro 0.87 0 0 0
Elsinboro Twp. 11.92 0 0 0
Lower Alloways Creek 45.23 0 0 0
Mannington Twp. 33.7 2 0 0.1
Oldmans Twp. 19.46 1 0 0.1
Penns Grove Boro 0.91 3 0 3.23
Pennsville Twp. 21.28 3 0 0.14
Pilesgrove Twp. 34.84 1 0 0.03
Pittsgrove Twp. 45.08 1 0 0.02
Quinton Twp. 24.09 1 0 0.04
Salem City 2.34 2 0 0.77
Upper Pittsgrove Twp. 40.33 1 0 0.03
Woodstown Boro 1.59 2 0 1.25
6 Salem County, NJ
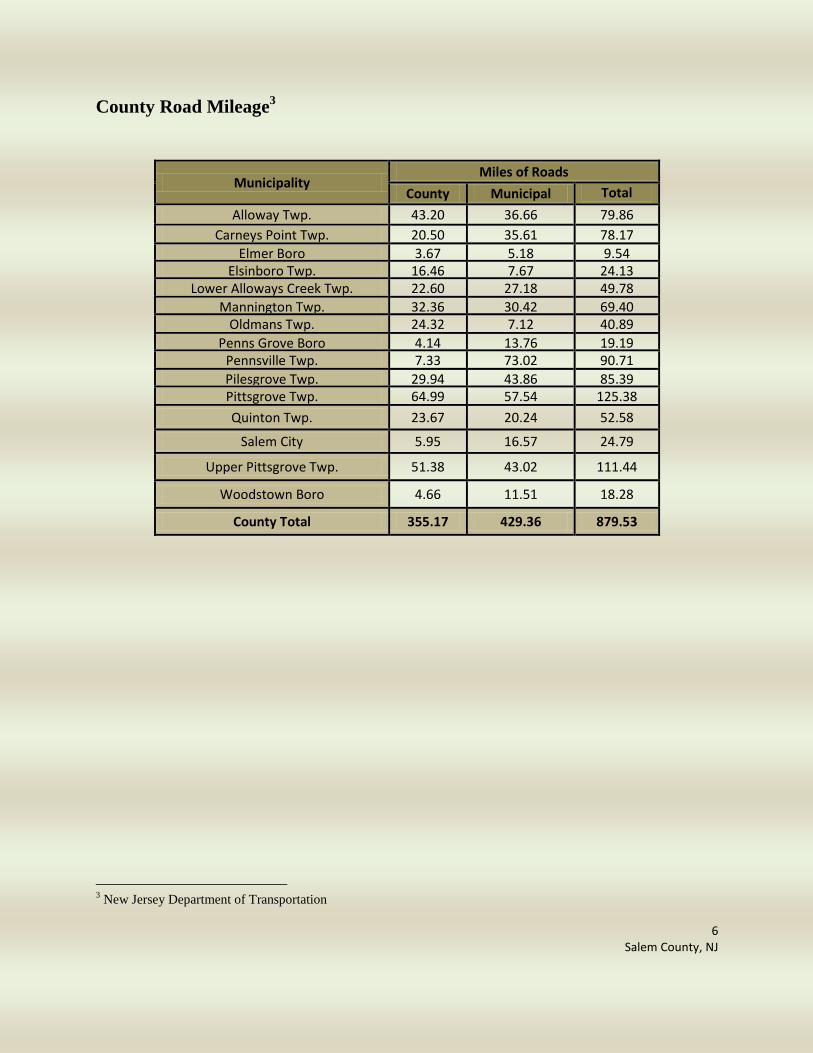
County Road Mileage3
Municipality Miles of Roads
County Municipal Total Mileage Alloway Twp. 43.20 36.66 79.86
Carneys Point Twp. 20.50 35.61 78.17
Elmer Boro 3.67 5.18 9.54 Elsinboro Twp. 16.46 7.67 24.13
Lower Alloways Creek Twp. 22.60 27.18 49.78
Mannington Twp. 32.36 30.42 69.40 Oldmans Twp. 24.32 7.12 40.89
Penns Grove Boro 4.14 13.76 19.19 Pennsville Twp. 7.33 73.02 90.71
Pilesgrove Twp. 29.94 43.86 85.39 Pittsgrove Twp. 64.99 57.54 125.38
Quinton Twp. 23.67 20.24 52.58
Salem City 5.95 16.57 24.79
Upper Pittsgrove Twp. 51.38 43.02 111.44
Woodstown Boro 4.66 11.51 18.28
County Total 355.17 429.36 879.53
3 New Jersey Department of Transportation
7 Salem County, NJ
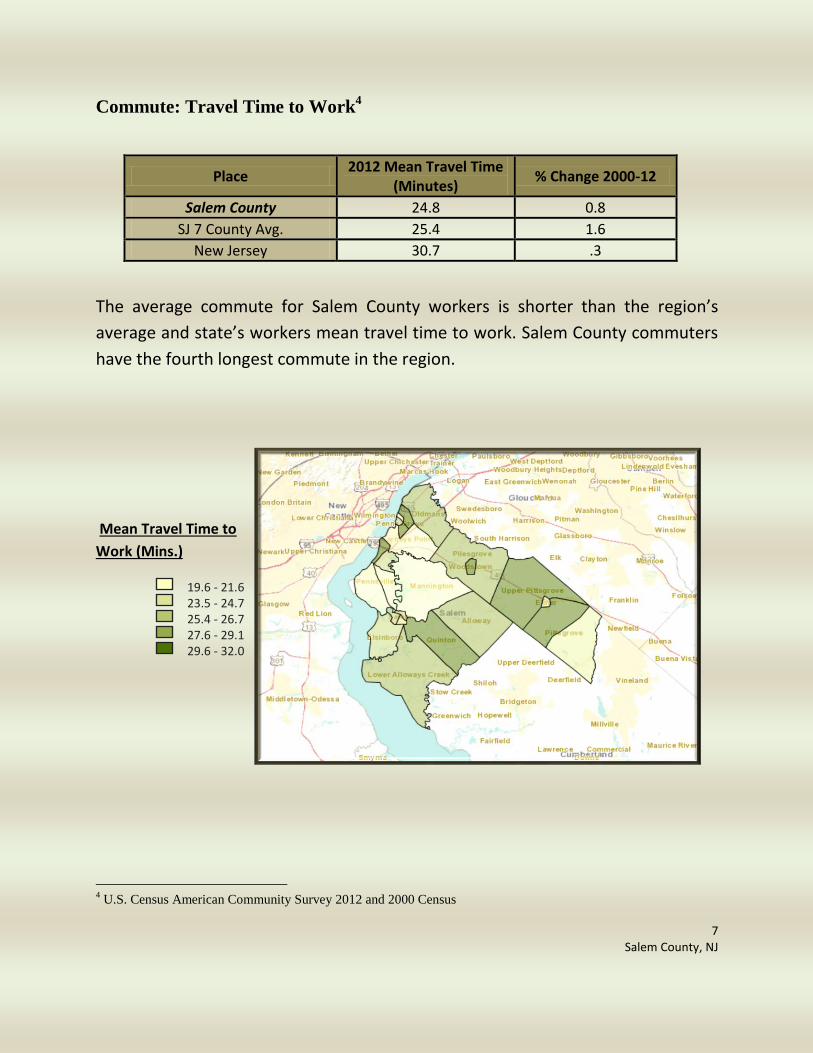
Commute: Travel Time to Work4
Place 2012 Mean Travel Time
(Minutes) % Change 2000-12
Salem County 24.8 0.8
SJ 7 County Avg. 25.4 1.6
New Jersey 30.7 .3
The average commute for Salem County workers is shorter than the region’s
average and state’s workers mean travel time to work. Salem County commuters
have the fourth longest commute in the region.
Mean Travel Time to
Work (Mins.)
4 U.S. Census American Community Survey 2012 and 2000 Census
19.6 - 21.6 23.5 - 24.7 25.4 - 26.7 27.6 - 29.1 29.6 - 32.0
8 Salem County, NJ
Demographics
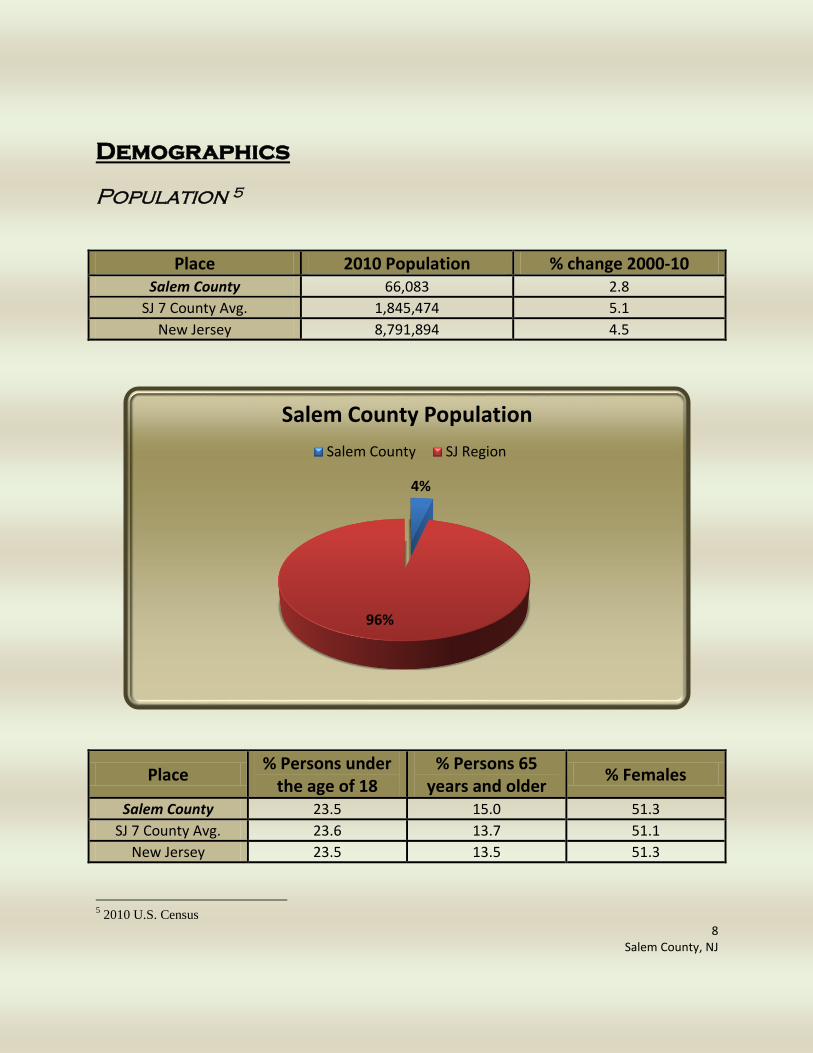
Population 5
Place 2010 Population % change 2000-10 Salem County 66,083 2.8
SJ 7 County Avg. 1,845,474 5.1
New Jersey 8,791,894 4.5
Place % Persons under
the age of 18 % Persons 65
years and older % Females
Salem County 23.5 15.0 51.3
SJ 7 County Avg. 23.6 13.7 51.1
New Jersey 23.5 13.5 51.3
5 2010 U.S. Census
4%
96%
Salem County Population
Salem County SJ Region
9 Salem County, NJ
0
10
20
30
40
50
60
70
80
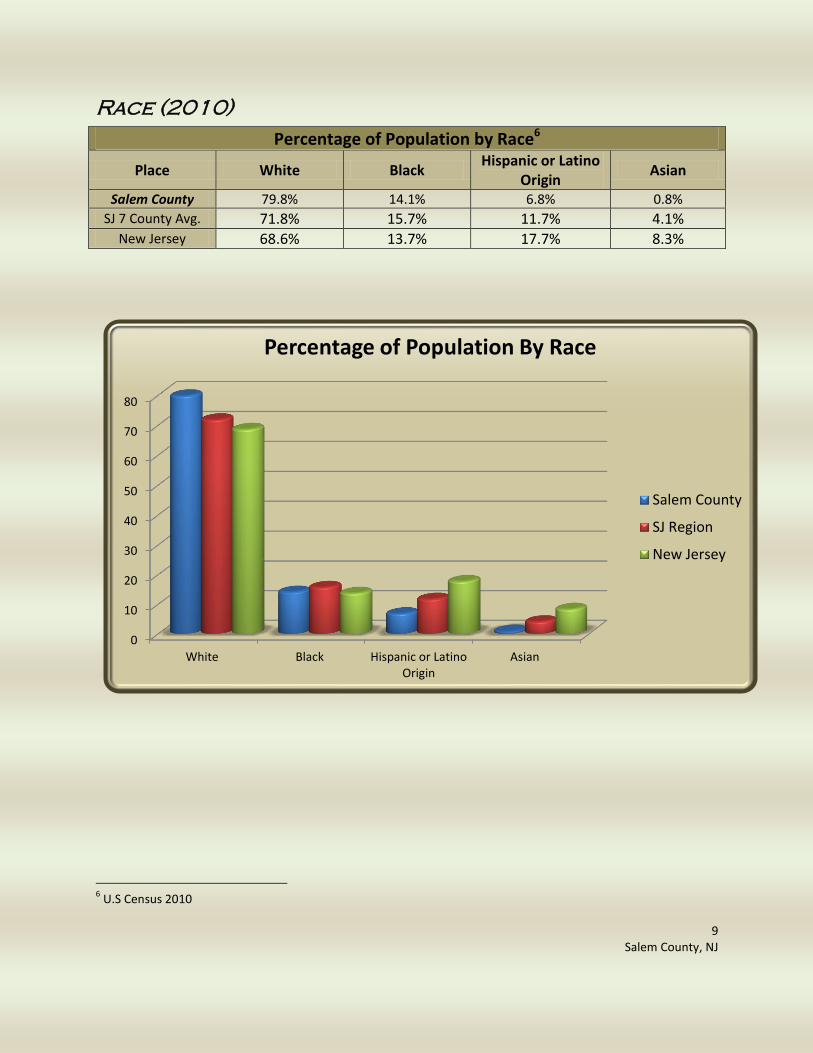
White Black Hispanic or LatinoOrigin
Asian
Percentage of Population By Race
Salem County
SJ Region
New Jersey
Race (2010)
Percentage of Population by Race6
Place White Black Hispanic or Latino
Origin Asian
Salem County 79.8% 14.1% 6.8% 0.8%
SJ 7 County Avg. 71.8% 15.7% 11.7% 4.1% New Jersey 68.6% 13.7% 17.7% 8.3%
6 U.S Census 2010
10 Salem County, NJ
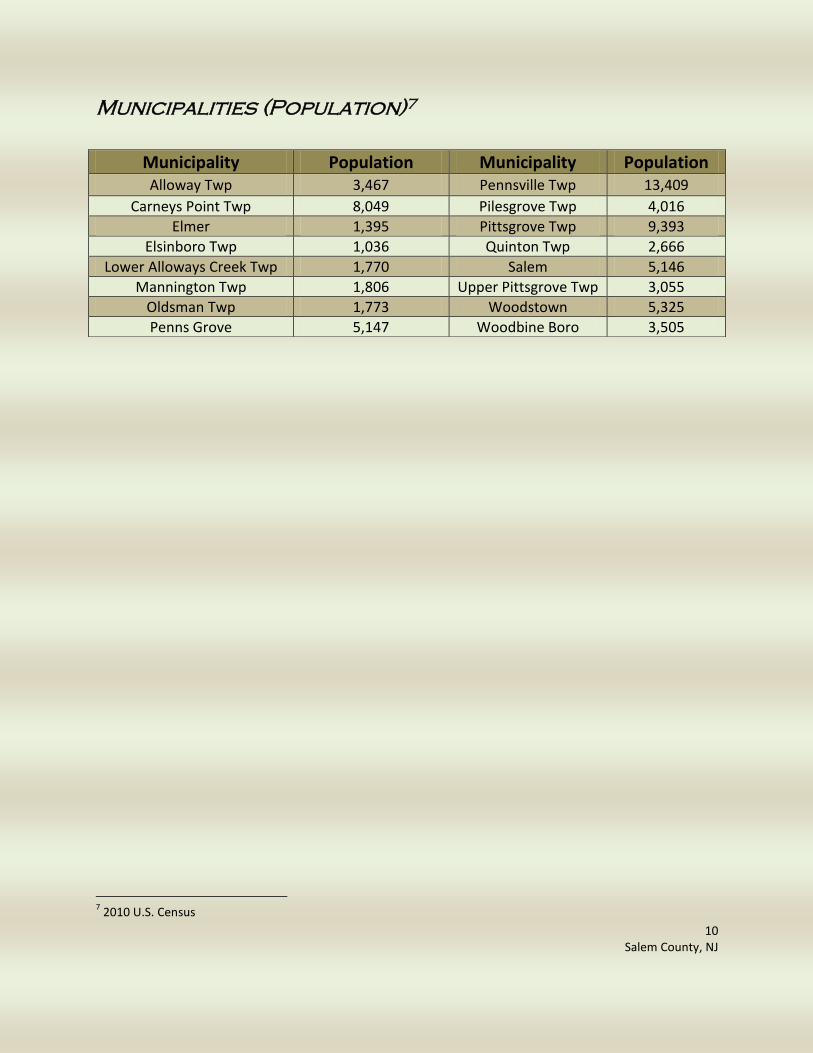
Municipalities (Population)7
7 2010 U.S. Census
Municipality Population Municipality Population Alloway Twp 3,467 Pennsville Twp 13,409
Carneys Point Twp 8,049 Pilesgrove Twp 4,016
Elmer 1,395 Pittsgrove Twp 9,393
Elsinboro Twp 1,036 Quinton Twp 2,666
Lower Alloways Creek Twp 1,770 Salem 5,146
Mannington Twp 1,806 Upper Pittsgrove Twp 3,055
Oldsman Twp 1,773 Woodstown 5,325
Penns Grove 5,147 Woodbine Boro 3,505
11 Salem County, NJ
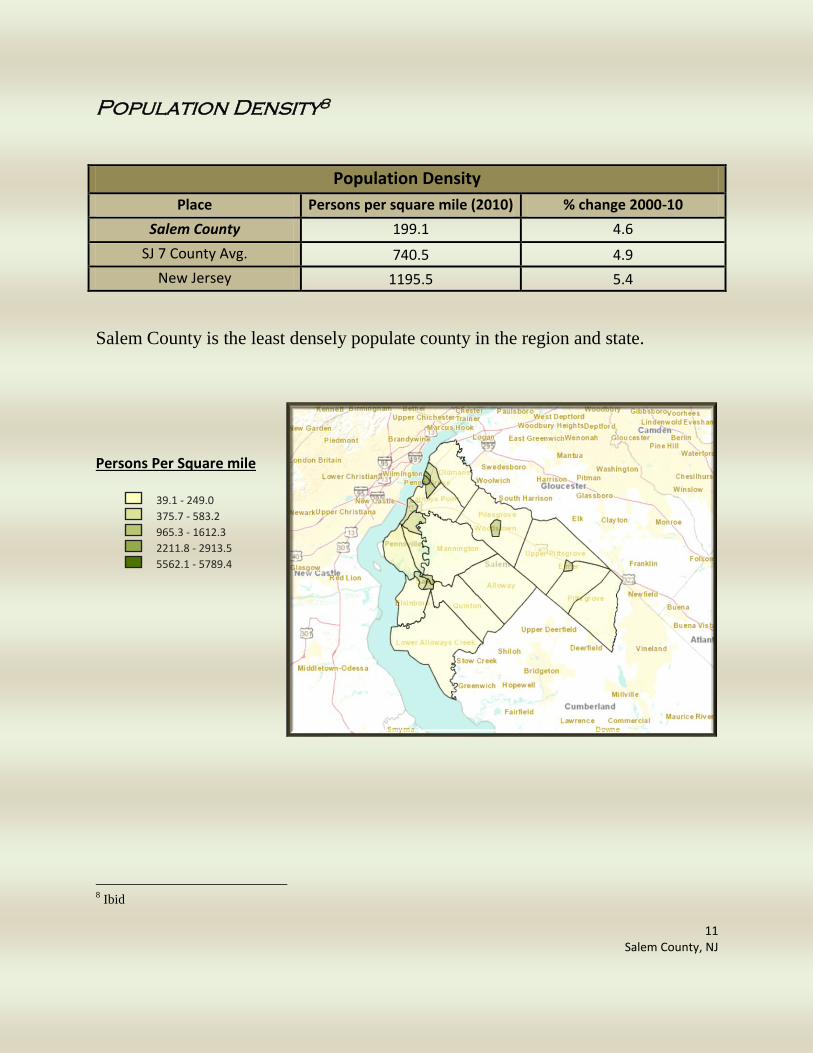
Population Density8
Population Density
Place Persons per square mile (2010) % change 2000-10
Salem County 199.1 4.6
SJ 7 County Avg. 740.5 4.9
New Jersey 1195.5 5.4
Salem County is the least densely populate county in the region and state.
Persons Per Square mile
8 Ibid
39.1 - 249.0
375.7 - 583.2
965.3 - 1612.3
2211.8 - 2913.5
5562.1 - 5789.4
12 Salem County, NJ
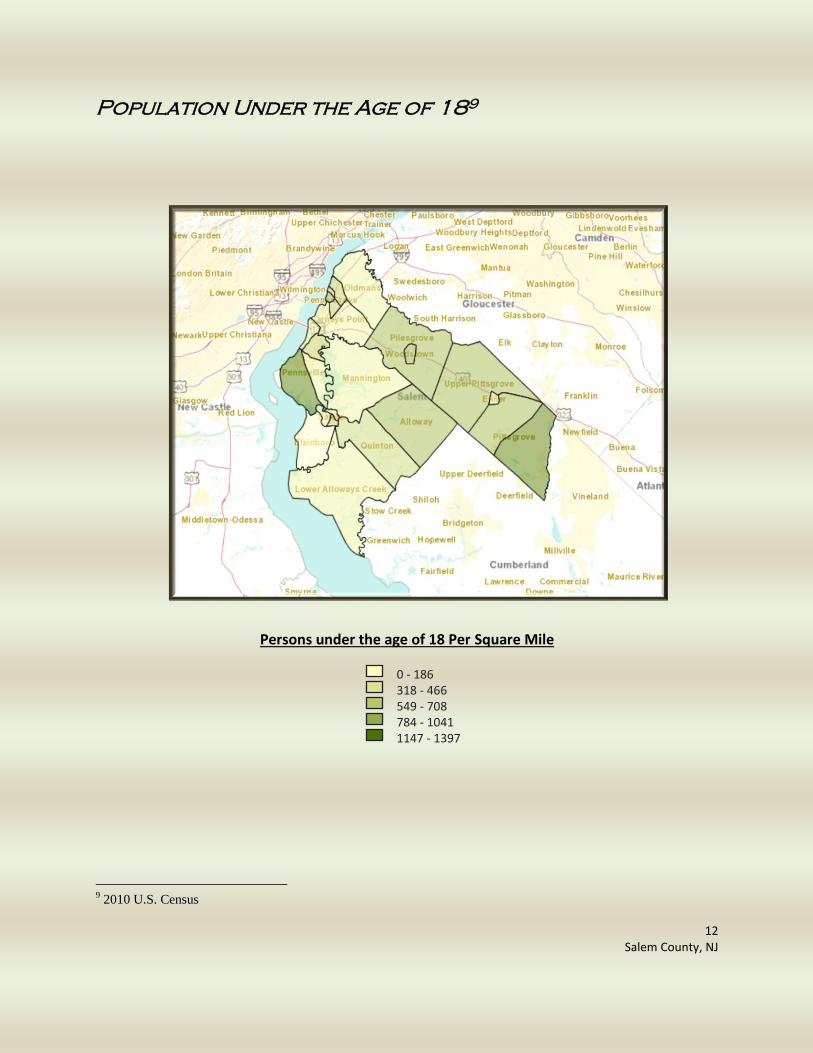
Population Under the Age of 189
Persons under the age of 18 Per Square Mile
9 2010 U.S. Census
0 - 186 318 - 466 549 - 708 784 - 1041 1147 - 1397
13 Salem County, NJ
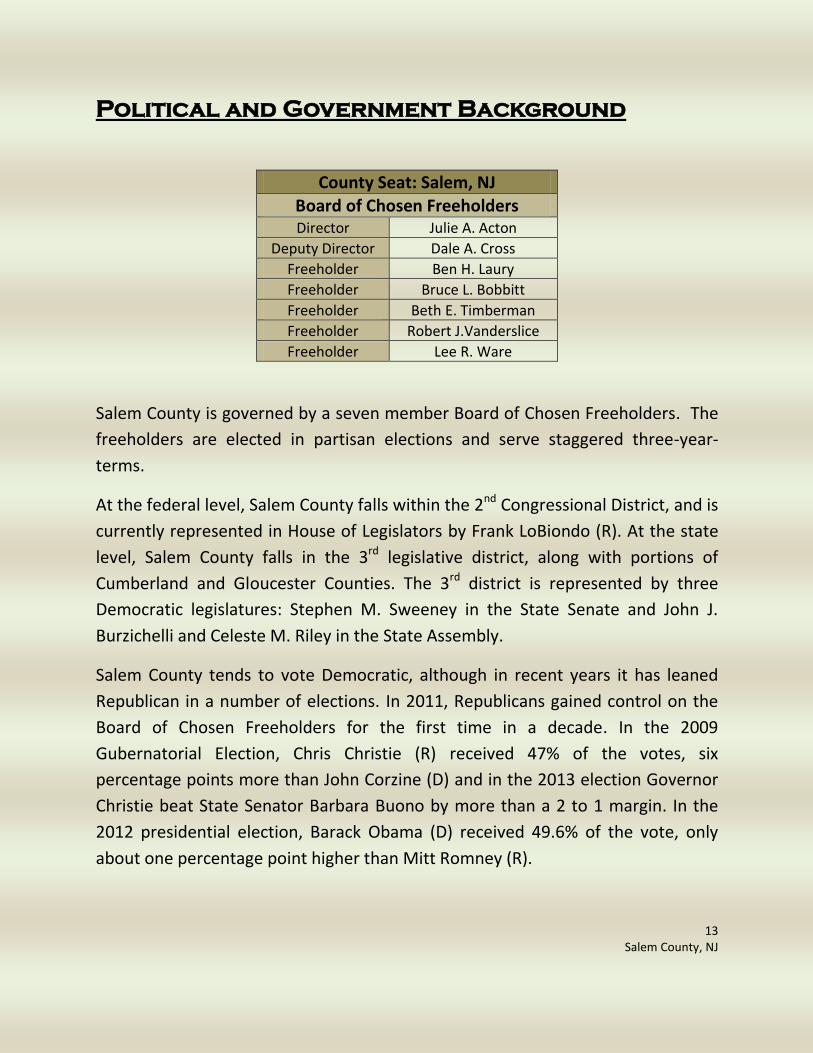
Political and Government Background
County Seat: Salem, NJ Board of Chosen Freeholders Director Julie A. Acton
Deputy Director Dale A. Cross
Freeholder Ben H. Laury
Freeholder Bruce L. Bobbitt
Freeholder Beth E. Timberman
Freeholder Robert J.Vanderslice
Freeholder Lee R. Ware
Salem County is governed by a seven member Board of Chosen Freeholders. The
freeholders are elected in partisan elections and serve staggered three-year-
terms.
At the federal level, Salem County falls within the 2nd Congressional District, and is
currently represented in House of Legislators by Frank LoBiondo (R). At the state
level, Salem County falls in the 3rd legislative district, along with portions of
Cumberland and Gloucester Counties. The 3rd district is represented by three
Democratic legislatures: Stephen M. Sweeney in the State Senate and John J.
Burzichelli and Celeste M. Riley in the State Assembly.
Salem County tends to vote Democratic, although in recent years it has leaned
Republican in a number of elections. In 2011, Republicans gained control on the
Board of Chosen Freeholders for the first time in a decade. In the 2009
Gubernatorial Election, Chris Christie (R) received 47% of the votes, six
percentage points more than John Corzine (D) and in the 2013 election Governor
Christie beat State Senator Barbara Buono by more than a 2 to 1 margin. In the
2012 presidential election, Barack Obama (D) received 49.6% of the vote, only
about one percentage point higher than Mitt Romney (R).
14 Salem County, NJ
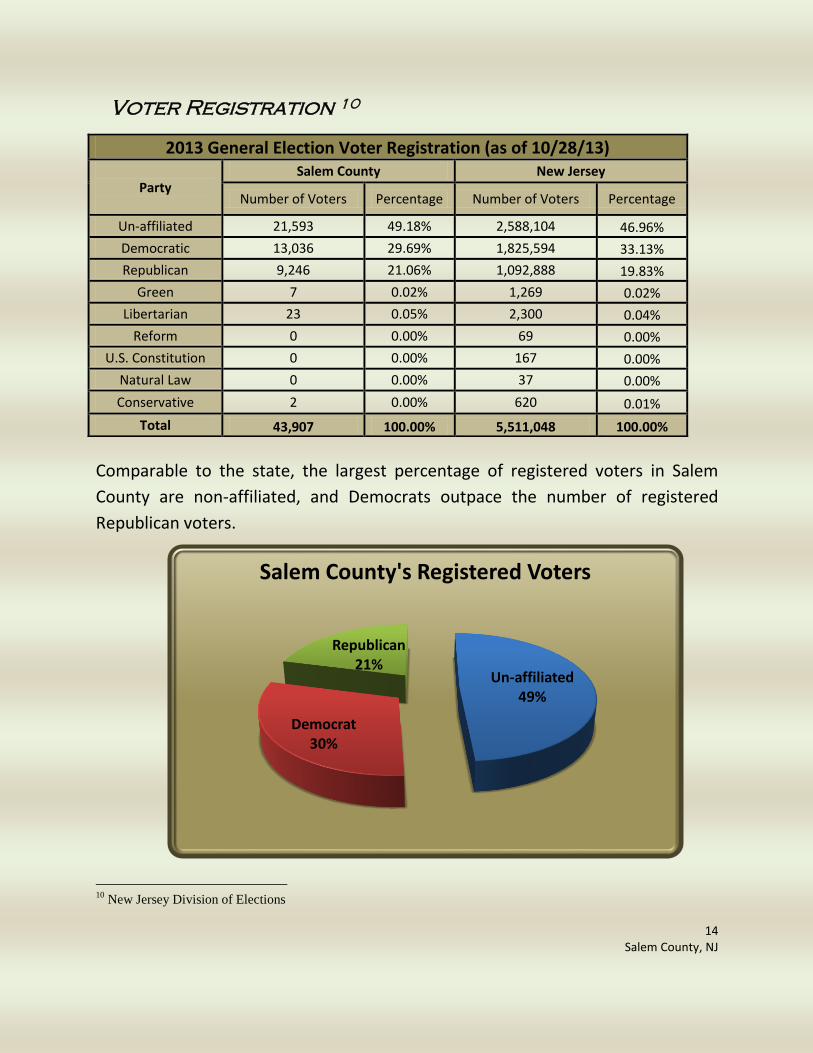
Un-affiliated 49%
Democrat 30%
Republican 21%
Salem County's Registered Voters
Voter Registration 10
Comparable to the state, the largest percentage of registered voters in Salem
County are non-affiliated, and Democrats outpace the number of registered
Republican voters.
10
New Jersey Division of Elections
2013 General Election Voter Registration (as of 10/28/13)
Party
Salem County New Jersey
Number of Voters Percentage Number of Voters Percentage
Un-affiliated 21,593 49.18% 2,588,104 46.96%
Democratic 13,036 29.69% 1,825,594 33.13%
Republican 9,246 21.06% 1,092,888 19.83%
Green 7 0.02% 1,269 0.02%
Libertarian 23 0.05% 2,300 0.04%
Reform 0 0.00% 69 0.00%
U.S. Constitution 0 0.00% 167 0.00%
Natural Law 0 0.00% 37 0.00%
Conservative 2 0.00% 620 0.01%
Total 43,907 100.00% 5,511,048 100.00%
15 Salem County, NJ
Voter Turnout 11
General Election Voter Turnout (as of 11/6/12)
Election Year County
Registered Voters
County Ballots Cast
Salem County New Jersey
2008 44,324 31,812 72% 73%
2010 41,006 20,329 50% 42%
2012 44,509 29,934 67% 67%
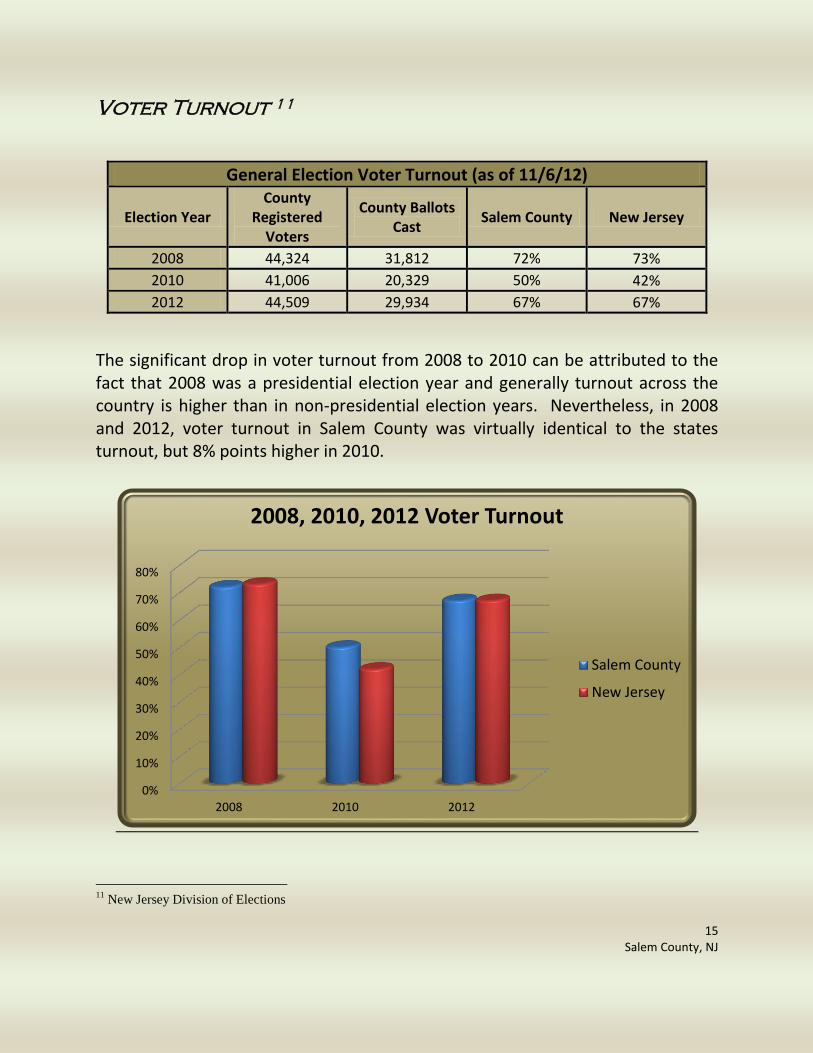
The significant drop in voter turnout from 2008 to 2010 can be attributed to the fact that 2008 was a presidential election year and generally turnout across the country is higher than in non-presidential election years. Nevertheless, in 2008 and 2012, voter turnout in Salem County was virtually identical to the states turnout, but 8% points higher in 2010.
11
New Jersey Division of Elections
0%
10%
20%
30%
40%
50%
60%
70%
80%
2008 2010 2012
2008, 2010, 2012 Voter Turnout
Salem County
New Jersey
16 Salem County, NJ
Family Structure12
Households
12
2010 U.S. Census
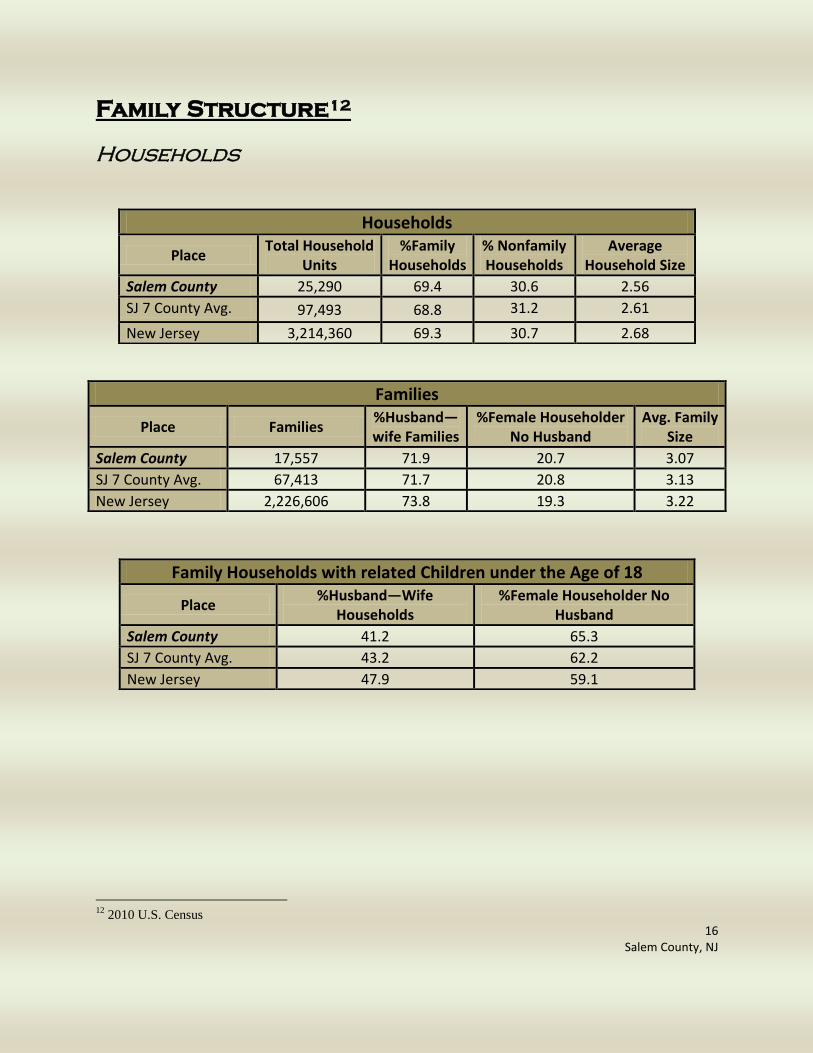
Households
Place Total Household
Units %Family
Households % Nonfamily Households
Average Household Size
Salem County 25,290 69.4 30.6 2.56
SJ 7 County Avg. 97,493 68.8 31.2 2.61
New Jersey 3,214,360 69.3 30.7 2.68
Families
Place Families %Husband—wife Families
%Female Householder No Husband
Avg. Family Size
Salem County 17,557 71.9 20.7 3.07
SJ 7 County Avg. 67,413 71.7 20.8 3.13
New Jersey 2,226,606 73.8 19.3 3.22
Family Households with related Children under the Age of 18
Place %Husband—Wife
Households %Female Householder No
Husband
Salem County 41.2 65.3
SJ 7 County Avg. 43.2 62.2
New Jersey 47.9 59.1
17 Salem County, NJ
Education
Adults13
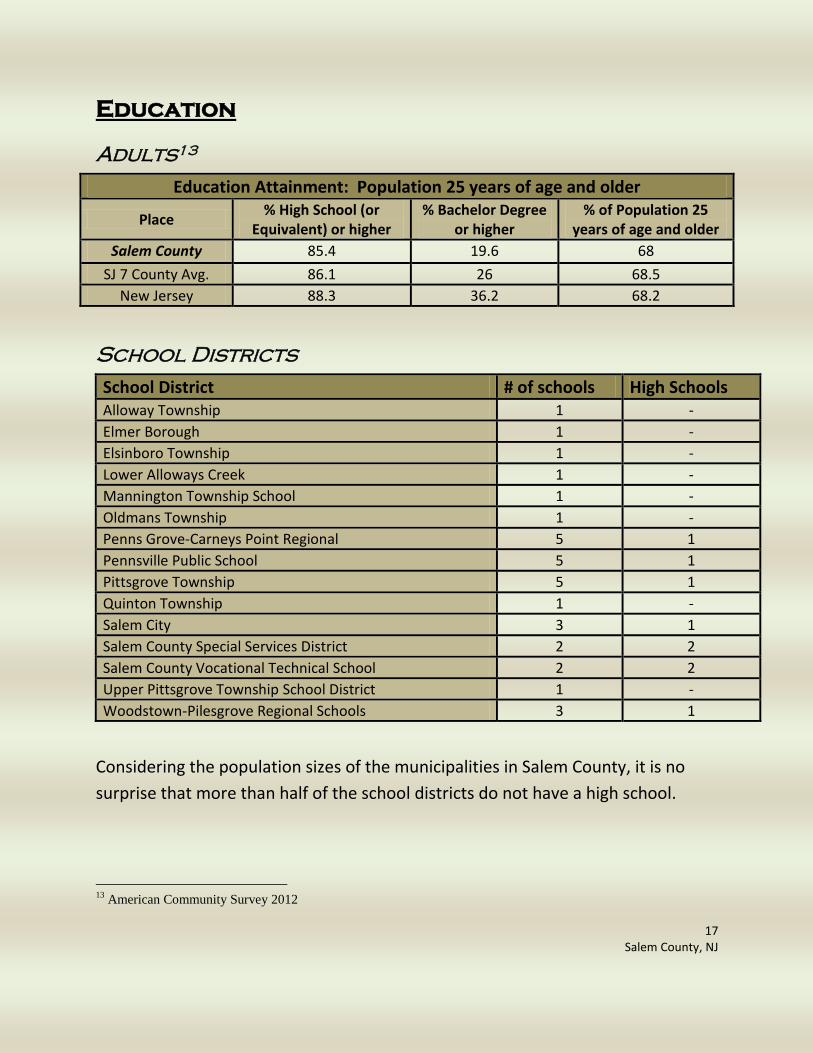
Education Attainment: Population 25 years of age and older
Place % High School (or
Equivalent) or higher % Bachelor Degree
or higher % of Population 25
years of age and older
Salem County 85.4 19.6 68
SJ 7 County Avg. 86.1 26 68.5
New Jersey 88.3 36.2 68.2
School Districts
School District # of schools High Schools Alloway Township 1 -
Elmer Borough 1 -
Elsinboro Township 1 -
Lower Alloways Creek 1 -
Mannington Township School 1 -
Oldmans Township 1 -
Penns Grove-Carneys Point Regional 5 1
Pennsville Public School 5 1
Pittsgrove Township 5 1
Quinton Township 1 -
Salem City 3 1
Salem County Special Services District 2 2
Salem County Vocational Technical School 2 2
Upper Pittsgrove Township School District 1 -
Woodstown-Pilesgrove Regional Schools 3 1
Considering the population sizes of the municipalities in Salem County, it is no
surprise that more than half of the school districts do not have a high school.
13
American Community Survey 2012
18 Salem County, NJ
Youth Education Achievement14
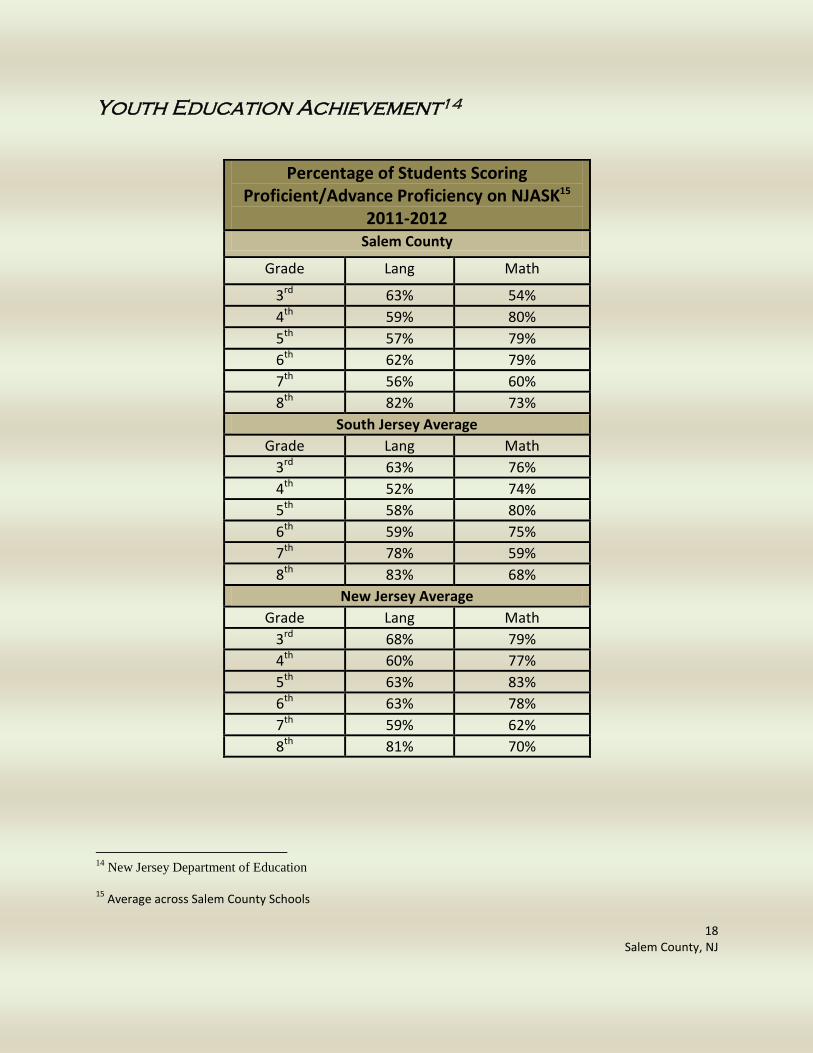
Percentage of Students Scoring Proficient/Advance Proficiency on NJASK15
2011-2012
Salem County
Grade Lang Math
3rd 63% 54%
4th 59% 80%
5th 57% 79%
6th 62% 79%
7th 56% 60%
8th 82% 73%
South Jersey Average
Grade Lang Math
3rd 63% 76%
4th 52% 74%
5th 58% 80%
6th 59% 75%
7th 78% 59%
8th 83% 68%
New Jersey Average
Grade Lang Math
3rd 68% 79%
4th 60% 77%
5th 63% 83%
6th 63% 78%
7th 59% 62%
8th 81% 70%
14
New Jersey Department of Education
15 Average across Salem County Schools
19 Salem County, NJ
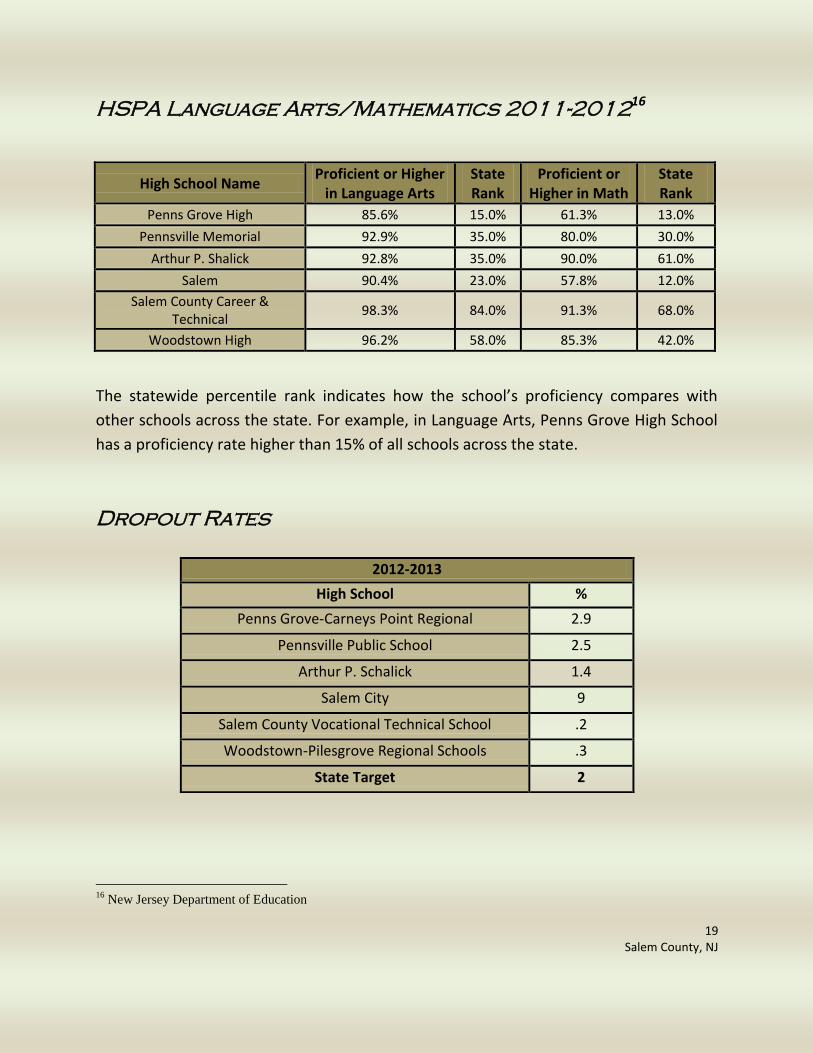
HSPA Language Arts/Mathematics 2011-201216
High School Name Proficient or Higher
in Language Arts State Rank
Proficient or Higher in Math
State Rank
Penns Grove High 85.6% 15.0% 61.3% 13.0%
Pennsville Memorial 92.9% 35.0% 80.0% 30.0%
Arthur P. Shalick 92.8% 35.0% 90.0% 61.0%
Salem 90.4% 23.0% 57.8% 12.0%
Salem County Career & Technical
98.3% 84.0% 91.3% 68.0%
Woodstown High 96.2% 58.0% 85.3% 42.0%
The statewide percentile rank indicates how the school’s proficiency compares with
other schools across the state. For example, in Language Arts, Penns Grove High School
has a proficiency rate higher than 15% of all schools across the state.
Dropout Rates
16
New Jersey Department of Education
2012-2013
High School %
Penns Grove-Carneys Point Regional 2.9
Pennsville Public School 2.5
Arthur P. Schalick 1.4
Salem City 9
Salem County Vocational Technical School .2
Woodstown-Pilesgrove Regional Schools .3
State Target 2
20 Salem County, NJ
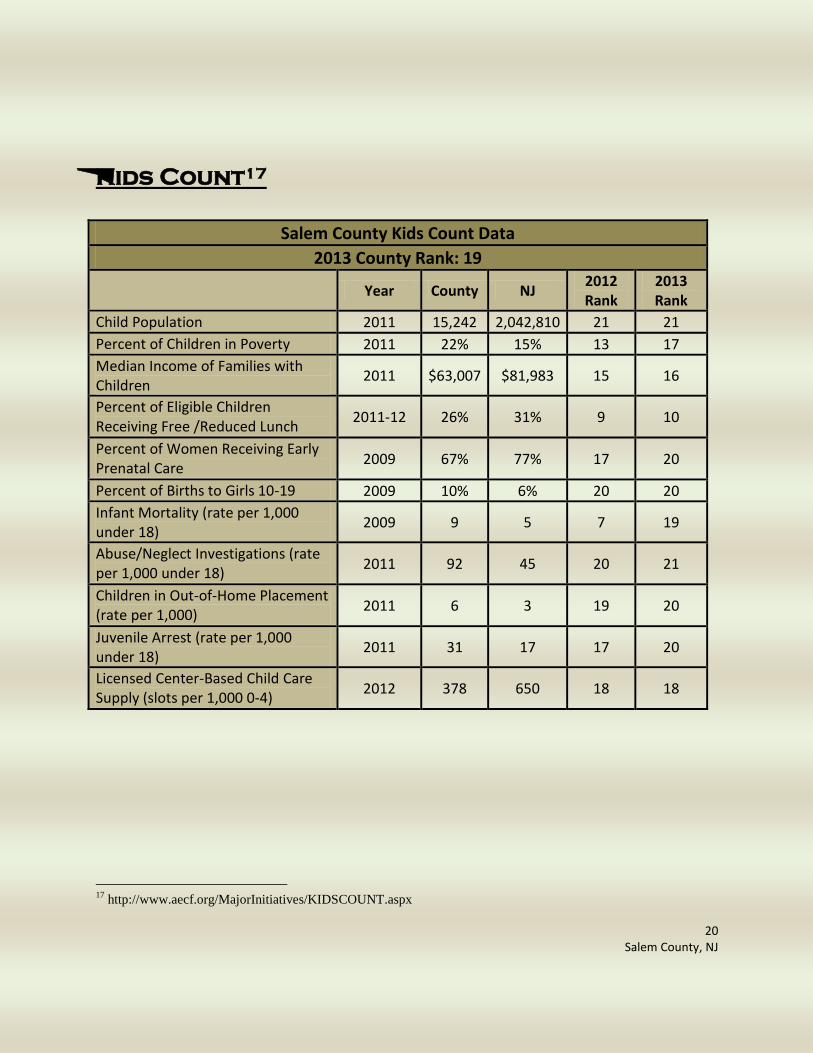
Kids Count17
Salem County Kids Count Data
2013 County Rank: 19
Year County NJ 2012 Rank
2013 Rank
Child Population 2011 15,242 2,042,810 21 21
Percent of Children in Poverty 2011 22% 15% 13 17
Median Income of Families with Children
2011 $63,007 $81,983 15 16
Percent of Eligible Children Receiving Free /Reduced Lunch
2011-12 26% 31% 9 10
Percent of Women Receiving Early Prenatal Care
2009 67% 77% 17 20
Percent of Births to Girls 10-19 2009 10% 6% 20 20
Infant Mortality (rate per 1,000 under 18)
2009 9 5 7 19
Abuse/Neglect Investigations (rate per 1,000 under 18)
2011 92 45 20 21
Children in Out-of-Home Placement (rate per 1,000)
2011 6 3 19 20
Juvenile Arrest (rate per 1,000 under 18)
2011 31 17 17 20
Licensed Center-Based Child Care Supply (slots per 1,000 0-4)
2012 378 650 18 18
17
http://www.aecf.org/MajorInitiatives/KIDSCOUNT.aspx
21 Salem County, NJ
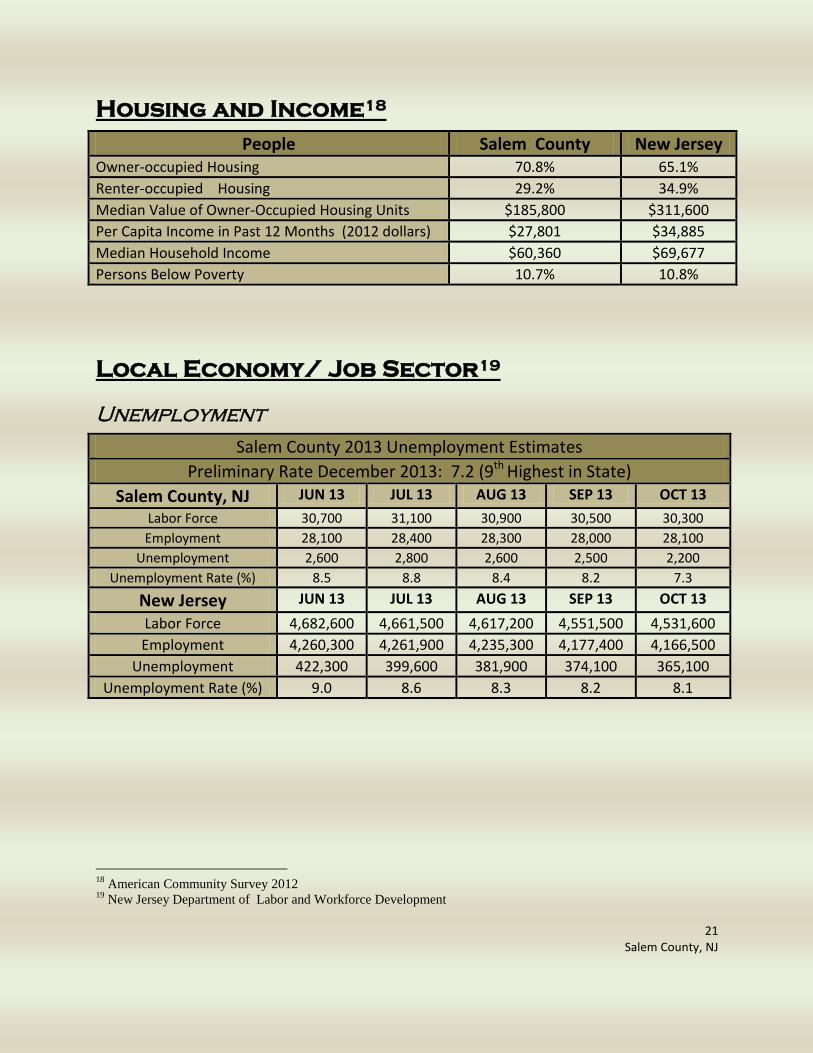
Housing and Income18
People Salem County New Jersey Owner-occupied Housing 70.8% 65.1%
Renter-occupied Housing 29.2% 34.9%
Median Value of Owner-Occupied Housing Units $185,800 $311,600
Per Capita Income in Past 12 Months (2012 dollars) $27,801 $34,885
Median Household Income $60,360 $69,677
Persons Below Poverty 10.7% 10.8%
Local Economy/ Job Sector19
Unemployment
Salem County 2013 Unemployment Estimates
Preliminary Rate December 2013: 7.2 (9th Highest in State)
Salem County, NJ JUN 13 JUL 13 AUG 13 SEP 13 OCT 13
Labor Force 30,700 31,100 30,900 30,500 30,300
Employment 28,100 28,400 28,300 28,000 28,100
Unemployment 2,600 2,800 2,600 2,500 2,200
Unemployment Rate (%) 8.5 8.8 8.4 8.2 7.3
New Jersey JUN 13 JUL 13 AUG 13 SEP 13 OCT 13
Labor Force 4,682,600 4,661,500 4,617,200 4,551,500 4,531,600
Employment 4,260,300 4,261,900 4,235,300 4,177,400 4,166,500
Unemployment 422,300 399,600 381,900 374,100 365,100
Unemployment Rate (%) 9.0 8.6 8.3 8.2 8.1
18
American Community Survey 2012 19
New Jersey Department of Labor and Workforce Development
22 Salem County, NJ
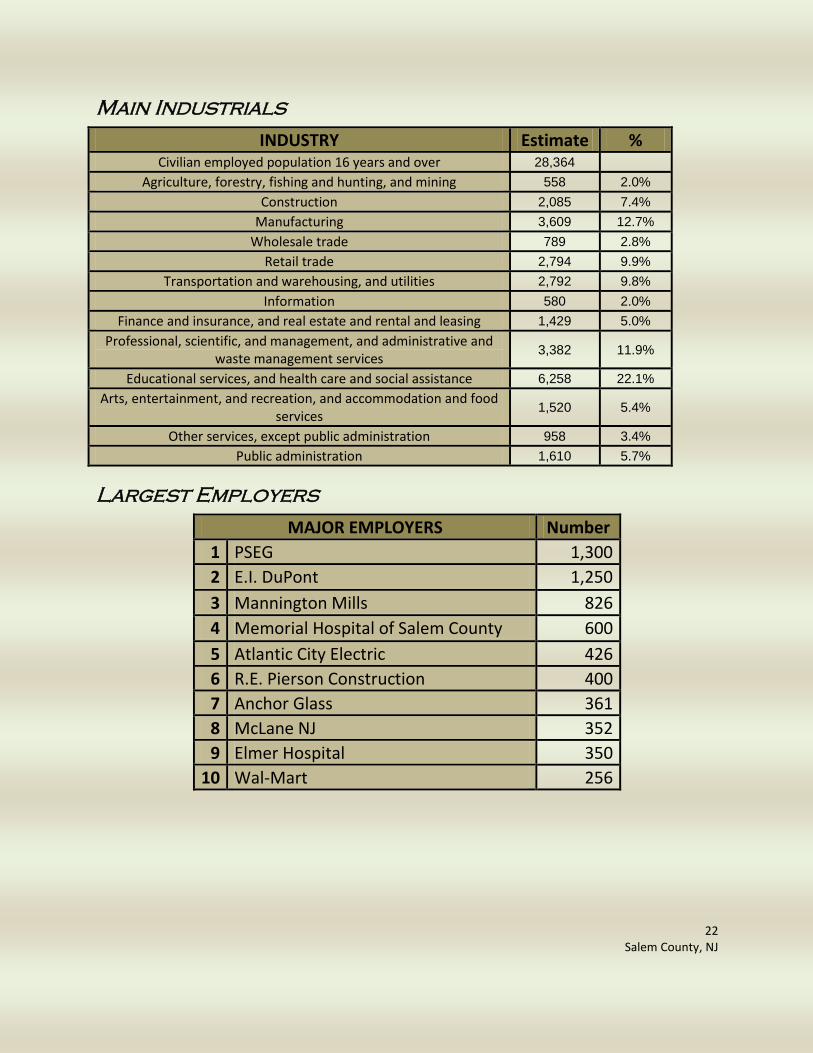
Main Industrials
INDUSTRY Estimate % Civilian employed population 16 years and over 28,364
Agriculture, forestry, fishing and hunting, and mining 558 2.0%
Construction 2,085 7.4%
Manufacturing 3,609 12.7%
Wholesale trade 789 2.8%
Retail trade 2,794 9.9%
Transportation and warehousing, and utilities 2,792 9.8%
Information 580 2.0%
Finance and insurance, and real estate and rental and leasing 1,429 5.0%
Professional, scientific, and management, and administrative and waste management services
3,382 11.9%
Educational services, and health care and social assistance 6,258 22.1%
Arts, entertainment, and recreation, and accommodation and food services
1,520 5.4%
Other services, except public administration 958 3.4%
Public administration 1,610 5.7%
Largest Employers
MAJOR EMPLOYERS Number
1 PSEG 1,300
2 E.I. DuPont 1,250
3 Mannington Mills 826
4 Memorial Hospital of Salem County 600
5 Atlantic City Electric 426
6 R.E. Pierson Construction 400
7 Anchor Glass 361
8 McLane NJ 352
9 Elmer Hospital 350
10 Wal-Mart 256
23 Salem County, NJ
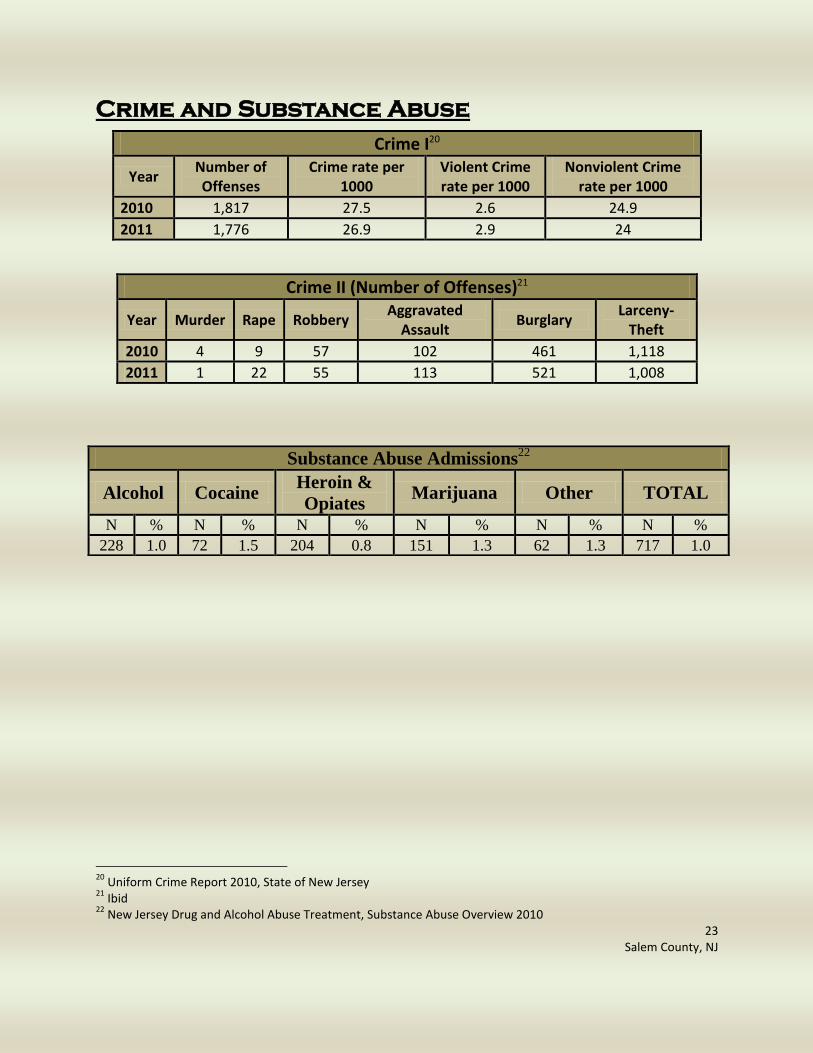
Crime and Substance Abuse
Crime I20
Year Number of Offenses
Crime rate per 1000
Violent Crime rate per 1000
Nonviolent Crime rate per 1000
2010 1,817 27.5 2.6 24.9
2011 1,776 26.9 2.9 24
Crime II (Number of Offenses)21
Year Murder Rape Robbery Aggravated
Assault Burglary
Larceny-Theft
2010 4 9 57 102 461 1,118
2011 1 22 55 113 521 1,008
20
Uniform Crime Report 2010, State of New Jersey 21
Ibid 22
New Jersey Drug and Alcohol Abuse Treatment, Substance Abuse Overview 2010
Substance Abuse Admissions22
Alcohol Cocaine Heroin &
Opiates Marijuana Other TOTAL
N % N % N % N % N % N %
228 1.0 72 1.5 204 0.8 151 1.3 62 1.3 717 1.0