Embed Size (px)
Citation preview
SALARY AND JOB SATISFACTION SURVEY
‘S
2
EXECUTIVE SUMMARYWant to make good money in PR—and have a good time doing it?
Work for a public company or a government agency. According to our first-ever PR Daily Salary and Job
Satisfaction Survey, these organizations offer you the best chance for good money and good raises,
ample benefits, and high job satisfaction.
Here’s more good news from the survey: In spite of a still-wobbly economy, the majority of PR
professionals across the board received salary increases in 2012, ranging from cost-of-living increases of
2–3 percent to a healthier 10 percent. And many PR pros expect to get pay raises in 2013. Professionals
at public companies were most likely to get a pay hike (81 percent) compared with those at nonprofits
(75 percent), and those at PR agencies (69 percent).
However, the 2,764 respondents we surveyed online—communicators, marketers, and corporate and
agency PR professionals at all levels of their careers—made it clear that they’re out for more than the
paycheck. They want to do more challenging and strategic work for their companies and clients, instead
of getting saddled with endless administrative tasks. They want the freedom to telecommute or do
flextime. And they want their organizations to get serious about career development, and improving
internal processes and practices.
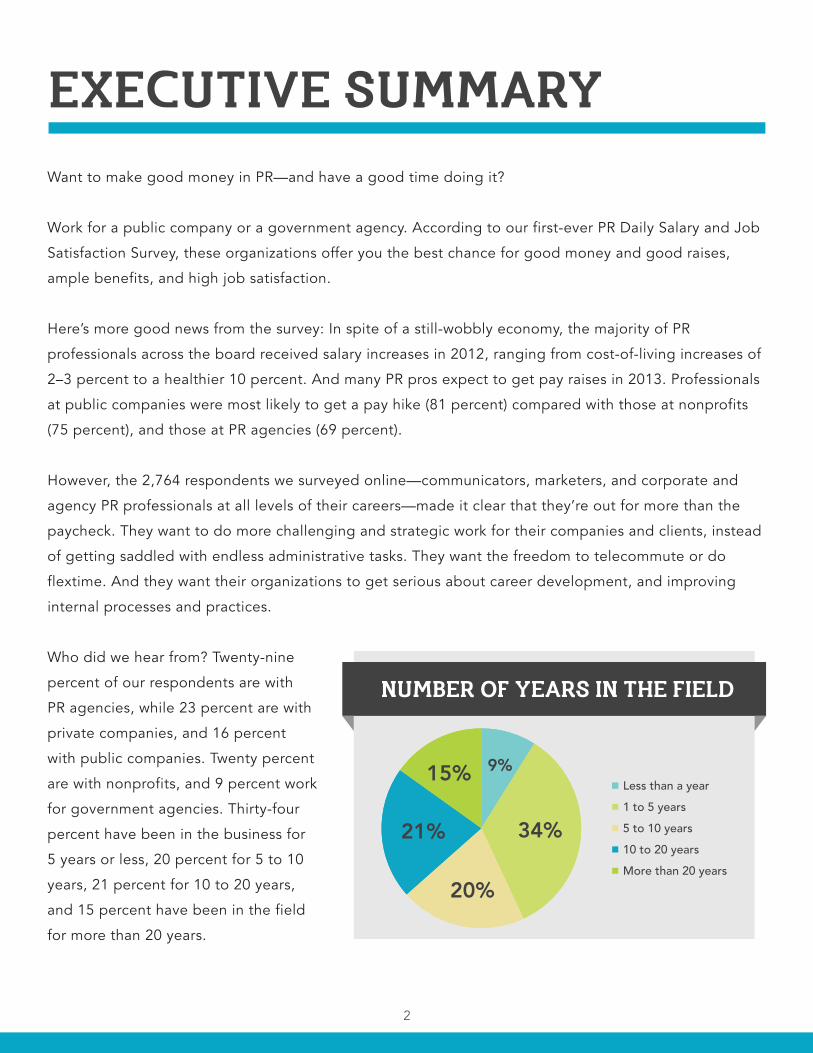
Who did we hear from? Twenty-nine
percent of our respondents are with
PR agencies, while 23 percent are with
private companies, and 16 percent
with public companies. Twenty percent
are with nonprofits, and 9 percent work
for government agencies. Thirty-four
percent have been in the business for
5 years or less, 20 percent for 5 to 10
years, 21 percent for 10 to 20 years,
and 15 percent have been in the field
for more than 20 years.
Less than a year 1 to 5 years 5 to 10 years 10 to 20 years More than 20 years
NUMBER OF YEARS IN THE FIELD
34%
20%
21%
15% 9%
3
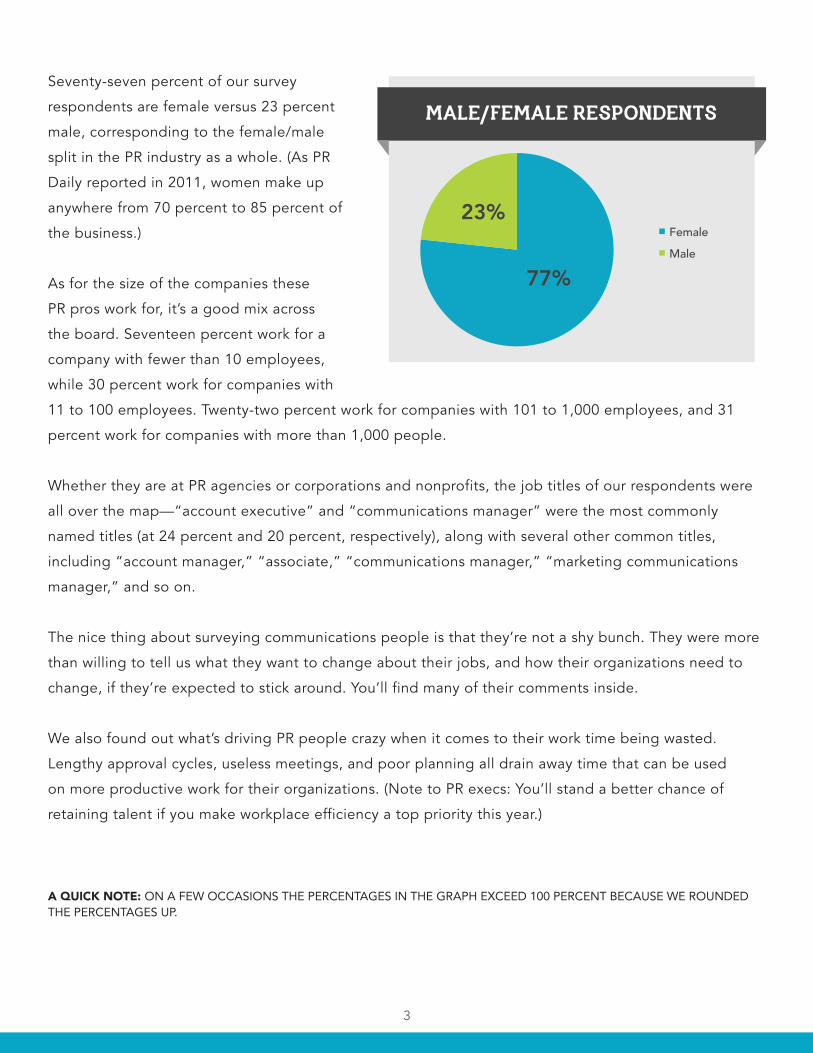
Seventy-seven percent of our survey
respondents are female versus 23 percent
male, corresponding to the female/male
split in the PR industry as a whole. (As PR
Daily reported in 2011, women make up
anywhere from 70 percent to 85 percent of
the business.)
As for the size of the companies these
PR pros work for, it’s a good mix across
the board. Seventeen percent work for a
company with fewer than 10 employees,
while 30 percent work for companies with
11 to 100 employees. Twenty-two percent work for companies with 101 to 1,000 employees, and 31
percent work for companies with more than 1,000 people.
Whether they are at PR agencies or corporations and nonprofits, the job titles of our respondents were
all over the map—“account executive” and “communications manager” were the most commonly
named titles (at 24 percent and 20 percent, respectively), along with several other common titles,
including “account manager,” “associate,” “communications manager,” “marketing communications
manager,” and so on.
The nice thing about surveying communications people is that they’re not a shy bunch. They were more
than willing to tell us what they want to change about their jobs, and how their organizations need to
change, if they’re expected to stick around. You’ll find many of their comments inside.
We also found out what’s driving PR people crazy when it comes to their work time being wasted.
Lengthy approval cycles, useless meetings, and poor planning all drain away time that can be used
on more productive work for their organizations. (Note to PR execs: You’ll stand a better chance of
retaining talent if you make workplace efficiency a top priority this year.)
MALE/FEMALE RESPONDENTS
77%
23% Female Male
A QUICK NOTE: ON A FEW OCCASIONS THE PERCENTAGES IN THE GRAPH EXCEED 100 PERCENT BECAUSE WE ROUNDED THE PERCENTAGES UP.
4
SALARIES
As the economy creeps toward a rebound, PR pros are getting raises. Seventy-one percent received
increases in 2012, and 59 percent say they expect to get raises in 2013. In 2012, 24 percent got raises
of 2–3 percent, while 22 percent got raises of more than 10 percent. Men and women were equally likely
to get raises: Seventy-one percent of women got raises, versus 70 percent of men.
Interestingly enough, it’s not the long-timers in the business who get the most pay raises. Seventy-five
percent of our respondents working in the field 5 to 10 years got raises, while 67 percent of those in the
business for more than 20 years got raises.
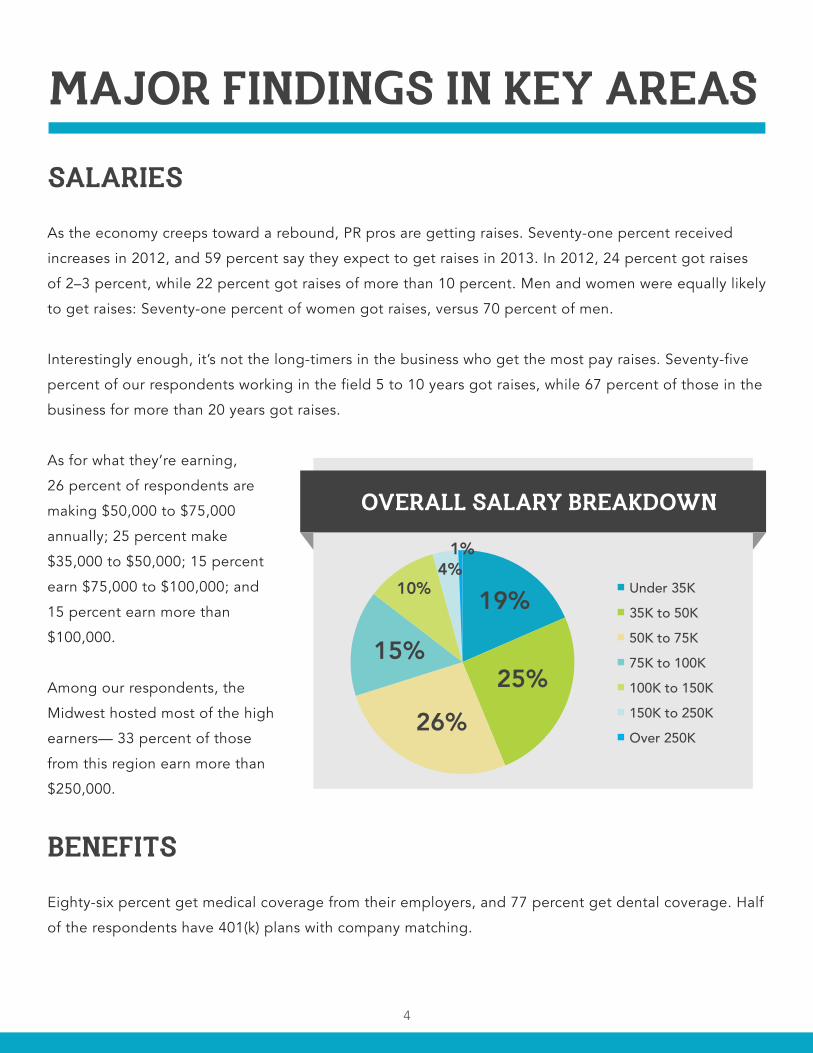
As for what they’re earning,
26 percent of respondents are
making $50,000 to $75,000
annually; 25 percent make
$35,000 to $50,000; 15 percent
earn $75,000 to $100,000; and
15 percent earn more than
$100,000.
Among our respondents, the
Midwest hosted most of the high
earners— 33 percent of those
from this region earn more than
$250,000.
MAJOR FINDINGS IN KEY AREAS
OVERALL SALARY BREAKDOWN
19%
25% 26%
15%
10% 4%
1%
Under 35K 35K to 50K 50K to 75K 75K to 100K 100K to 150K 150K to 250K Over 250K
BENEFITS
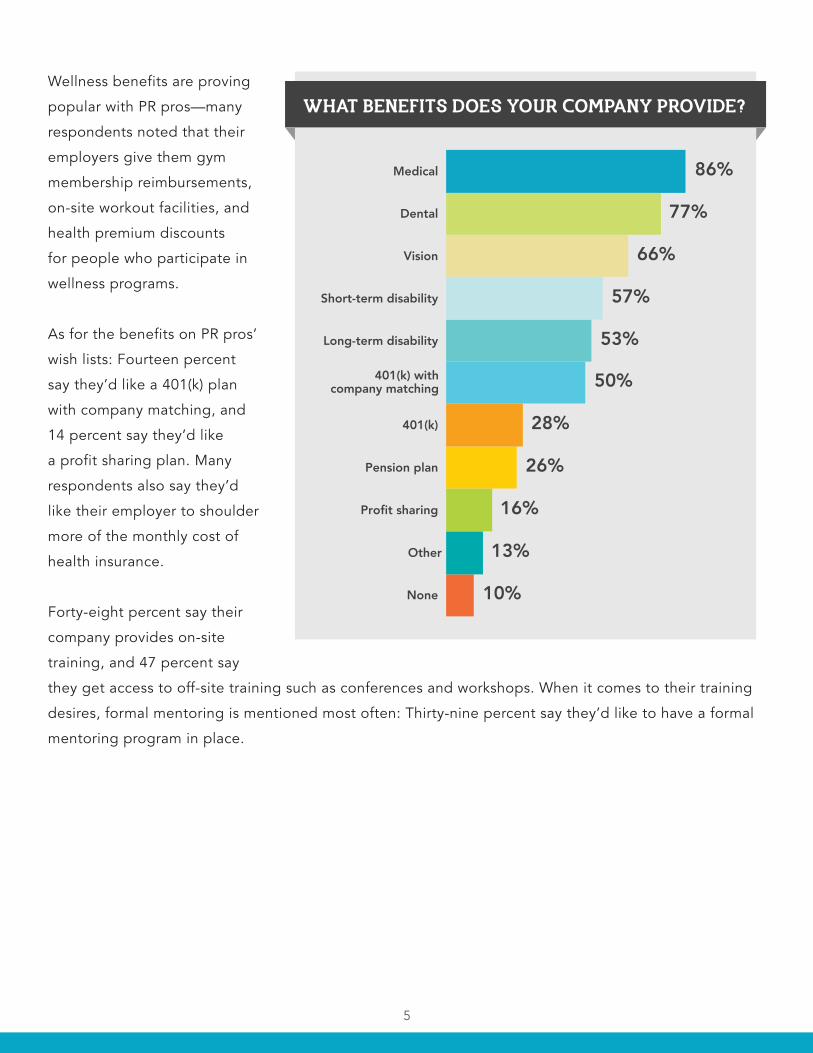
Eighty-six percent get medical coverage from their employers, and 77 percent get dental coverage. Half
of the respondents have 401(k) plans with company matching.
5
Wellness benefits are proving
popular with PR pros—many
respondents noted that their
employers give them gym
membership reimbursements,
on-site workout facilities, and
health premium discounts
for people who participate in
wellness programs.
As for the benefits on PR pros’
wish lists: Fourteen percent
say they’d like a 401(k) plan
with company matching, and
14 percent say they’d like
a profit sharing plan. Many
respondents also say they’d
like their employer to shoulder
more of the monthly cost of
health insurance.
Forty-eight percent say their
company provides on-site
training, and 47 percent say
they get access to off-site training such as conferences and workshops. When it comes to their training
desires, formal mentoring is mentioned most often: Thirty-nine percent say they’d like to have a formal
mentoring program in place.
WHAT BENEFITS DOES YOUR COMPANY PROVIDE?
50% 401(k) withcompany matching
86%
77%
66%
57%
53%
13%
10%
Medical
Dental
Vision
Short-term disability
Long-term disability
16% Profit sharing
26% Pension plan
28% 401(k)
Other
None
6
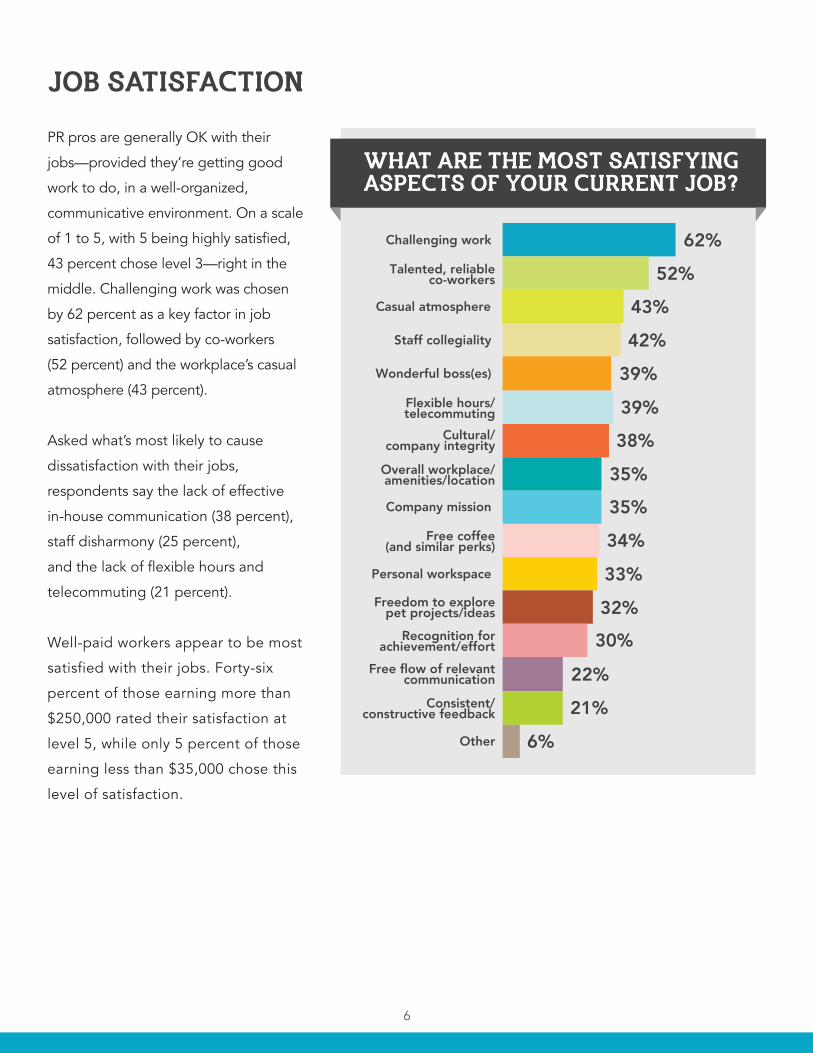
JOB SATISFACTION
PR pros are generally OK with their
jobs—provided they’re getting good
work to do, in a well-organized,
communicative environment. On a scale
of 1 to 5, with 5 being highly satisfied,
43 percent chose level 3—right in the
middle. Challenging work was chosen
by 62 percent as a key factor in job
satisfaction, followed by co-workers
(52 percent) and the workplace’s casual
atmosphere (43 percent).
Asked what’s most likely to cause
dissatisfaction with their jobs,
respondents say the lack of effective
in-house communication (38 percent),
staff disharmony (25 percent),
and the lack of flexible hours and
telecommuting (21 percent).
Well-paid workers appear to be most
satisfied with their jobs. Forty-six
percent of those earning more than
$250,000 rated their satisfaction at
level 5, while only 5 percent of those
earning less than $35,000 chose this
level of satisfaction.
WHAT ARE THE MOST SATISFYINGASPECTS OF YOUR CURRENT JOB?
62% Challenging work
52% Talented, reliableco-workers
42% Staff collegiality
39% Wonderful boss(es)
35% Company mission
38% Cultural/company integrity
39% Flexible hours/telecommuting
35% Overall workplace/amenities/location
33% Personal workspace
32% Freedom to explorepet projects/ideas
22% Free flow of relevantcommunication
21% Consistent/constructive feedback
30% Recognition forachievement/effort
34% Free coffee(and similar perks)
6% Other
43% Casual atmosphere

7
WORK/LIFE BALANCE
Forty-seven percent of respondents
telecommute at least one day a week;
27 percent of this group telecommutes
five days a week. High earners are more
likely to telecommute: Forty-two percent
of those making more than $250,000
say they telecommute, while only 22
percent of people earning less than
$35,000 say they do.
Forty-one percent say they work at least
one weekend a month, although 30
percent say they never work on weekends.
Desk-bound lunches are commonplace:
Sixty-nine percent do lunch at their desks, while 13 percent eat in their company’s lunchroom.
When it comes to drains on their productivity, respondents are most likely to blame delayed approvals
(56 percent), followed by inefficient meetings (46 percent), and flawed information (44 percent).
Read on to dig deeper.
HOW MANY DAYS A WEEKDO YOU TELECOMMUTE?
47%
16% 8%
2%
27% 1 2 3 4 5

8
SALARIES
SALARY INCREASES
While many respondents may not be delighted with their compensation, most of them got more money
in 2012: Seventy-one percent say they received a salary increase in 2012, while 29 percent did not. For
those respondents who did receive a salary increase, 24 percent received a 2–3 percent increase, while
22 percent received a salary increase of more than 10 percent.
Those most likely to get
increases were at the
higher end of the pay scale:
Eighty-eight percent of
respondents earning more
than $250,000 received a pay
increase, as did 77 percent
of those earning $150,000 to
$250,000, 76 percent making
$100,000 to $150,000, 71
percent earning $75,000 to
DID YOUR 2012 SALARYINCREASE FROM 2011?
71%
29% Yes No
DID YOU GET A RAISE? [ACCORDING TO EXPERIENCE]
Yes No
Less than a year 1-5 years 5-10 years 10-20 years More than20 years
52%
76% 75%68% 67%
48%
24% 25%32% 33%
BY HOW MUCH DID YOUR SALARY INCREASE?
18%
24%
20%
18%
22%
1% to 2%
2% to 3%
3% to 5%
5% to 10%
More than 10%
9
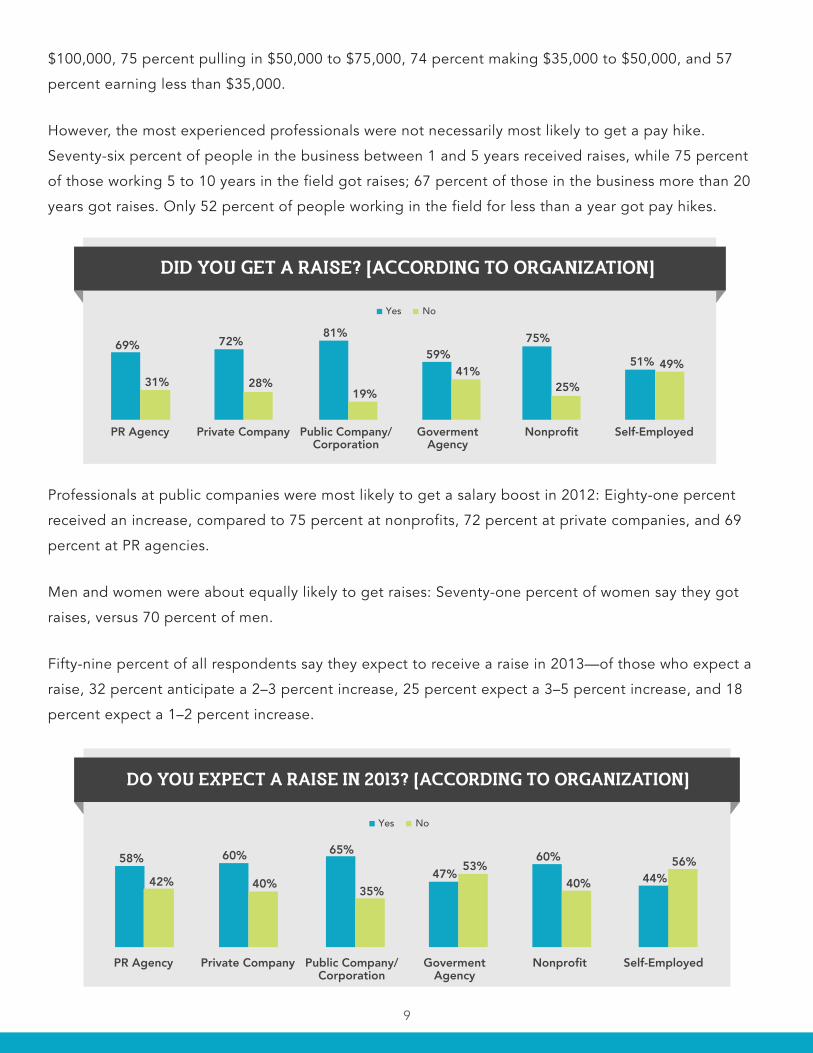
$100,000, 75 percent pulling in $50,000 to $75,000, 74 percent making $35,000 to $50,000, and 57
percent earning less than $35,000.
However, the most experienced professionals were not necessarily most likely to get a pay hike.
Seventy-six percent of people in the business between 1 and 5 years received raises, while 75 percent
of those working 5 to 10 years in the field got raises; 67 percent of those in the business more than 20
years got raises. Only 52 percent of people working in the field for less than a year got pay hikes.
Professionals at public companies were most likely to get a salary boost in 2012: Eighty-one percent
received an increase, compared to 75 percent at nonprofits, 72 percent at private companies, and 69
percent at PR agencies.
Men and women were about equally likely to get raises: Seventy-one percent of women say they got
raises, versus 70 percent of men.
Fifty-nine percent of all respondents say they expect to receive a raise in 2013—of those who expect a
raise, 32 percent anticipate a 2–3 percent increase, 25 percent expect a 3–5 percent increase, and 18
percent expect a 1–2 percent increase.
69%
31%
PR Agency
72%
28%
Private Company
81%
19%
Public Company/Corporation
GovermentAgency
59% 41%
Nonprofit
75%
25%
Self-Employed
51% 49%
Yes No
DID YOU GET A RAISE? [ACCORDING TO ORGANIZATION]
DO YOU EXPECT A RAISE IN 2013? (ACCORDING TO ORGANIZATION)
58% 60% 65%
47%60%
44%42% 40% 35%
53%40%
56%
Yes No
PR Agency Private Company Public Company/Corporation
GovermentAgency
Nonprofit Self-Employed
10
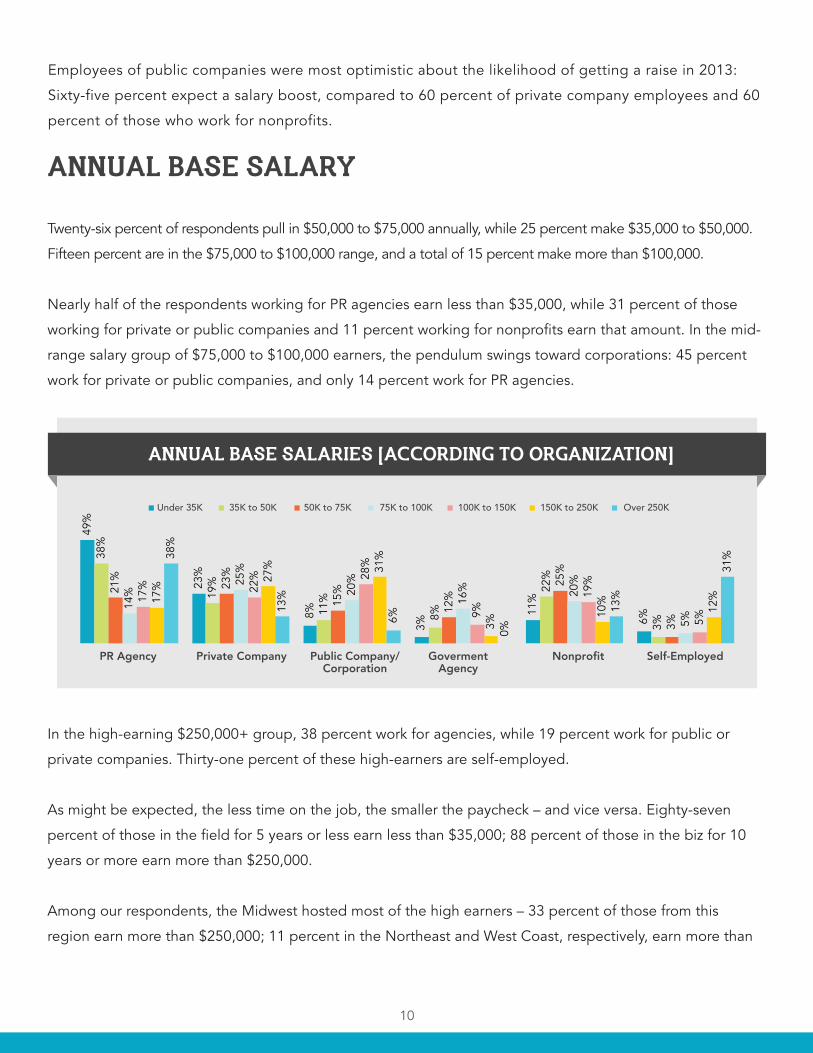
ANNUAL BASE SALARY
Twenty-six percent of respondents pull in $50,000 to $75,000 annually, while 25 percent make $35,000 to $50,000.
Fifteen percent are in the $75,000 to $100,000 range, and a total of 15 percent make more than $100,000.
Nearly half of the respondents working for PR agencies earn less than $35,000, while 31 percent of those
working for private or public companies and 11 percent working for nonprofits earn that amount. In the mid-
range salary group of $75,000 to $100,000 earners, the pendulum swings toward corporations: 45 percent
work for private or public companies, and only 14 percent work for PR agencies.
In the high-earning $250,000+ group, 38 percent work for agencies, while 19 percent work for public or
private companies. Thirty-one percent of these high-earners are self-employed.
As might be expected, the less time on the job, the smaller the paycheck – and vice versa. Eighty-seven
percent of those in the field for 5 years or less earn less than $35,000; 88 percent of those in the biz for 10
years or more earn more than $250,000.
Among our respondents, the Midwest hosted most of the high earners – 33 percent of those from this
region earn more than $250,000; 11 percent in the Northeast and West Coast, respectively, earn more than
49%
23%
8%
3%
11%
6%
38%
19%
11%
8%
22%
3%
21%
23%
15%
12%
25%
3%
14%
25%
20%
16% 20
%
5%
17% 22
% 28%
9%
19%
5%
17%
27% 31
%
3%
10%
12%
38%
13%
6%
0%
13%
31%
Under 35K 35K to 50K 50K to 75K 75K to 100K 100K to 150K 150K to 250K Over 250K
ANNUAL BASE SALARIES [ACCORDING TO ORGANIZATION]
PR Agency Private Company Public Company/Corporation
GovermentAgency
Nonprofit Self-Employed
Employees of public companies were most optimistic about the likelihood of getting a raise in 2013:
Sixty-five percent expect a salary boost, compared to 60 percent of private company employees and 60
percent of those who work for nonprofits.

11
$250,000. The coasts claimed most of the mid- to high-range earners: 24 percent of Northeasters and 15
percent of West Coasters earn $100,000 to $150,000, and 26 percent of Northeasters and 29 percent of
West Coasters earn $150,000 to $250,000.
WHERE ARE YOU LOCATED? (ACCORDING TO ANNUAL SALARY)
Under 35K 35K to 50K 50K to 75K 75K to 100K 100K to 150K 150K to 250K Over 250K
17% 23%
21% 18%
24% 26%
11% Northeast
18% 17% 16%
15% 10% 10% 11%
Southeast
16% 12%
Midwest
21% 27%
25% 25%
33%
6% 8% 10% 10% 10%
7% 0%
Southwest
12% 11% 11% 10%
15% 29%
11% West Coast
2% 1% 1% 0% 1% 0% 0%
Upper Rockies
Women are somewhat more likely to be in the lower pay ranges: Eighty-five percent of respondents earning
less than $35,000 are women—in the $250,000+ pay range, 67 percent are women. This is an interesting
finding, as women seem to predominate at the bottom of the pay scale, as well as the top of the pay scale.

12
CAREER PEAK SALARY
Sixty-eight percent say their current salary
represents their career peak in earnings,
while 32 percent say their current salary is
not their career peak.
For respondents who are not currently
earning their career peak salary, 24 percent
say their top earnings were in the $75,000 to
$100,000 range, while 22 percent say they
had earned $50,000 to $75,000. Nineteen
percent say their peak earnings were in the
range of $100,000 to $150,000.
WHAT IS YOUR PEAK SALARY?
8%
17%
22%
24%
19%
8%
4%
Under 35K
35K to 50K
50K to 75K
75K to 100K
100K to 150K
150K to 250K
Over 250K
HOW HAPPY ARE YOU WITHYOUR COMPENSATION?
14% Verydissatisfied
38% Somewhatdissatisfied
33% Satisfied
15% Quite pleased
2% Exceedinglypleased
COMPENSATION SATISFACTION
Respondents aren’t jumping
up and down for joy about
their take-home pay. Thirty-
eight percent say they are
“somewhat dissatisfied” with
their current salary, while 33
percent proclaimed themselves
satisfied with their earnings.
Fourteen percent are in the “very
dissatisfied” group. Men and
women appear to be equally
satisfied or dissatisfied with
their compensation in similar
percentages to the above.
13
Not surprisingly, lower-paid professionals are less happy with their take-home pay: Seventy-four percent of
respondents earning less than $35,000 are somewhat dissatisfied or very dissatisfied with their compensation,
while 62 percent of those earning more than $250,000 are quite pleased or exceedingly pleased with their pay.
PR agency workers are most likely to be very dissatisfied with their pay (21 percent), with self-employed
professionals (17 percent) close behind. Those working for public companies are happiest with their
compensation: Twenty-one percent are either quite pleased or exceedingly pleased with their paychecks,
followed by 18 percent of private company employees, and 17 percent of nonprofit workers.
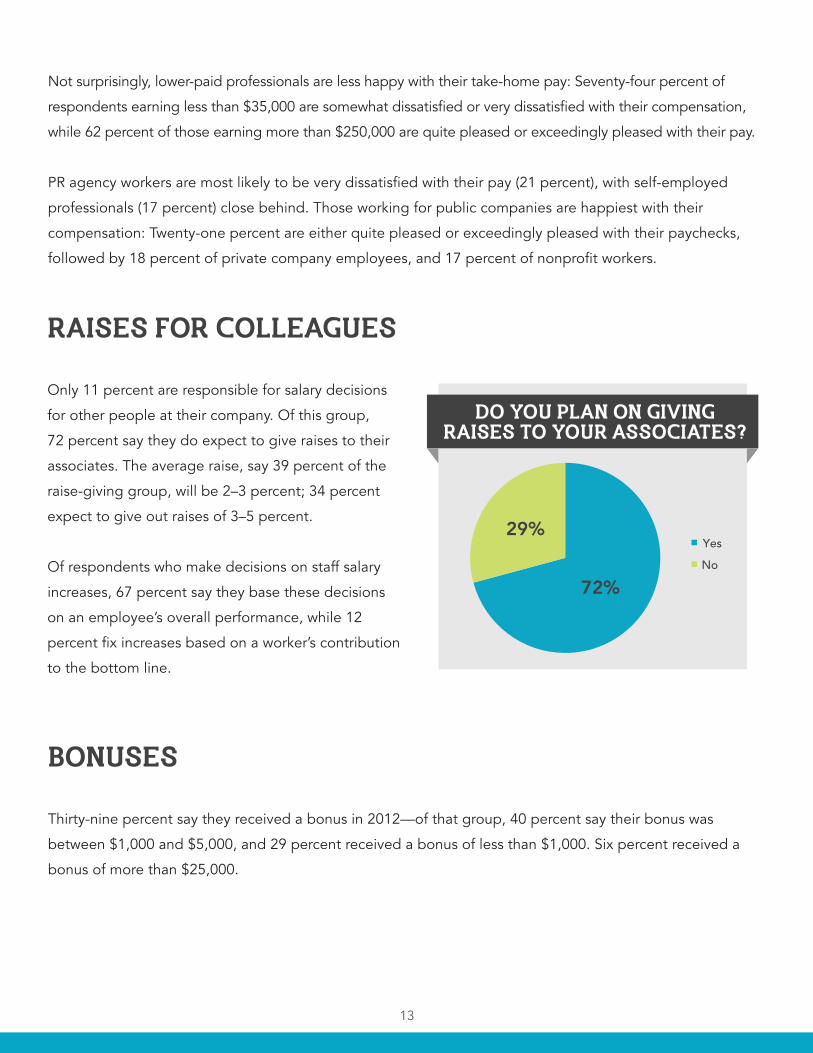
RAISES FOR COLLEAGUES
Only 11 percent are responsible for salary decisions
for other people at their company. Of this group,
72 percent say they do expect to give raises to their
associates. The average raise, say 39 percent of the
raise-giving group, will be 2–3 percent; 34 percent
expect to give out raises of 3–5 percent.
Of respondents who make decisions on staff salary
increases, 67 percent say they base these decisions
on an employee’s overall performance, while 12
percent fix increases based on a worker’s contribution
to the bottom line.
DO YOU PLAN ON GIVINGRAISES TO YOUR ASSOCIATES?
72%
29% Yes No
BONUSES
Thirty-nine percent say they received a bonus in 2012—of that group, 40 percent say their bonus was
between $1,000 and $5,000, and 29 percent received a bonus of less than $1,000. Six percent received a
bonus of more than $25,000.
14
WHO GOT A BONUS? [ACCORDING TO EXPERIENCE]
83%
64% 57% 52%
36%
17%
36% 43% 48%
64%
Less than a year 1 to 5 years 5 to 10 years 10 to 20 years More than20 years
No Yes
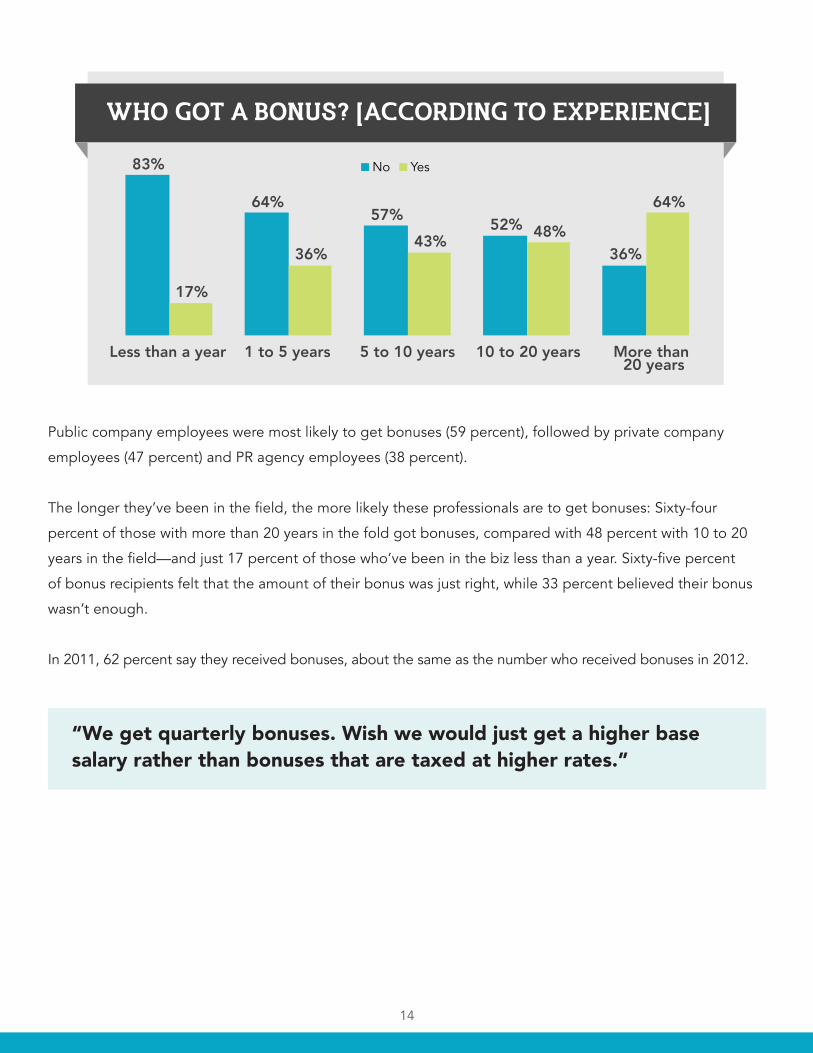
Public company employees were most likely to get bonuses (59 percent), followed by private company
employees (47 percent) and PR agency employees (38 percent).
The longer they’ve been in the field, the more likely these professionals are to get bonuses: Sixty-four
percent of those with more than 20 years in the fold got bonuses, compared with 48 percent with 10 to 20
years in the field—and just 17 percent of those who’ve been in the biz less than a year. Sixty-five percent
of bonus recipients felt that the amount of their bonus was just right, while 33 percent believed their bonus
wasn’t enough.
In 2011, 62 percent say they received bonuses, about the same as the number who received bonuses in 2012.
“We get quarterly bonuses. Wish we would just get a higher base salary rather than bonuses that are taxed at higher rates.”

15
PROFESSIONAL DEVELOPMENT AND PROMOTIONS
Experience is the most important factor
affecting decisions about promotions
at their organizations, say 64 percent;
45 percent say internal connections
or “chumminess” plays a key role in
getting promoted, while 38 percent say
interpersonal skills weigh heavily on
promotion decisions.
WHICH SKILLS/ELEMENTS DO YOU FEEL AREMOST HEAVILY WEIGHTED IN DECISIONS ABOUT
PROMOTIONS AT YOUR ORGANIZATION?
64% Experience
15% Education
23% Writing ability
23% Creativity
38% Interpersonal skills
18% Persuasion
8% Tech savvy
10% Social media skills
22% Professional network
34% Personality
9% Personal appearance
3% Wardrobe
45% Internal connections(Chumminess with
the powers that be)
31% General intelligence
16
BENEFITS
BENEFITS PROVIDED BY COMPANY
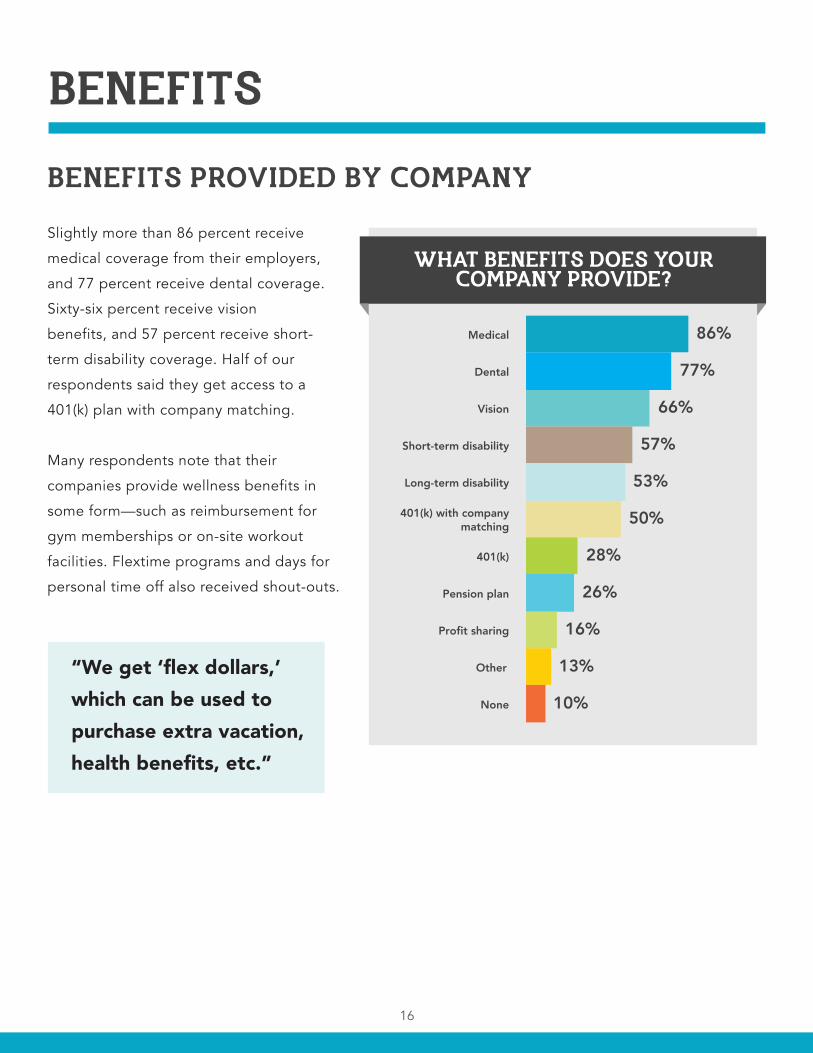
Slightly more than 86 percent receive
medical coverage from their employers,
and 77 percent receive dental coverage.
Sixty-six percent receive vision
benefits, and 57 percent receive short-
term disability coverage. Half of our
respondents said they get access to a
401(k) plan with company matching.
Many respondents note that their
companies provide wellness benefits in
some form—such as reimbursement for
gym memberships or on-site workout
facilities. Flextime programs and days for
personal time off also received shout-outs.
“We get ‘flex dollars,’ which can be used to purchase extra vacation, health benefits, etc.”
WHAT BENEFITS DOES YOURCOMPANY PROVIDE?
10%
13%
16%
26%
28%
50%
53%
57%
66%
77%
86%
None
Other
Profit sharing
Pension plan
401(k)
401(k) with company matching
Long-term disability
Short-term disability
Vision
Dental
Medical

17
MOST WANTED BENEFITS
When asked which benefit
they’d most like their
company to provide that is
currently not part of their
benefits package, 44
percent said “none.”
Fourteen percent say they’d
like a 401(k) plan with
company matching, while
14 percent say they’d
welcome a profit sharing plan.
Even if they already have
medical coverage, some
respondents noted that better medical coverage would be a big plus—or paying cheaper monthly premiums for
this benefit.
WHICH BENEFIT THAT YOUR COMPANY DOES NOTPROVIDE WOULD YOU MOST LIKE TO BE OFFERED?
6% 4%
4% 2%
2%
14%
10%
1%
14%
44%
Medical
Dental
Vision
Short-term disability
Long-term disability
Profit sharing
Pension plan
401(k)
401(k) with company matching
None
TRAINING
Forty-eight percent of respondents say their
company provides on-site training. Forty-seven
percent say their company offers off-site training
opportunities, such as conferences and workshops.
Fifty-three percent say they are offered access
to webinars and podcasts that provide training.
Many respondents also say their company provides
mentoring on an informal basis.
“Training money is provided, but each employee is expected to find needed training from external sources.”
WHAT TYPE OF TRAININGDOES YOUR COMPANY OFFER?
6%
13%
18%
24%
27%
30%
35%
47%
48%
Other
Formal mentoring program
Webinars and podcasts (internally produced)
None
Online training (internally produced)
Online training (externally produced)
Webinars and podcasts(externally produced)
Offsite conferencesand workshops
Onsite training
18
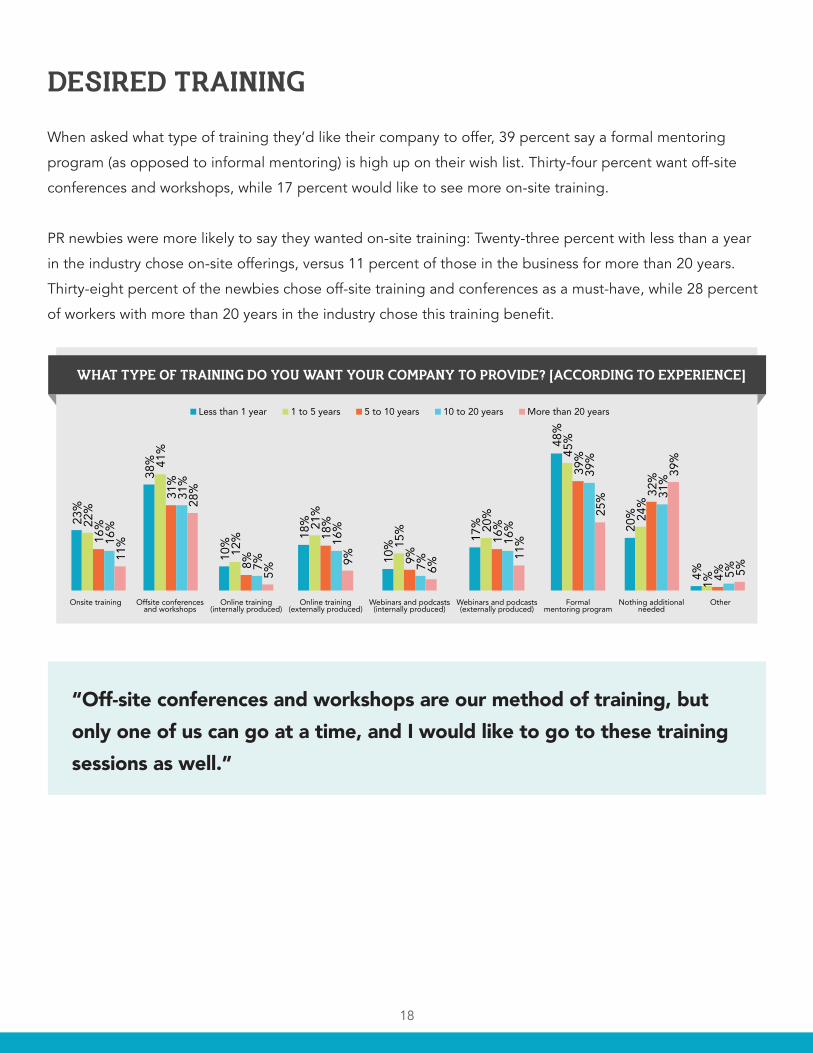
DESIRED TRAINING
When asked what type of training they’d like their company to offer, 39 percent say a formal mentoring
program (as opposed to informal mentoring) is high up on their wish list. Thirty-four percent want off-site
conferences and workshops, while 17 percent would like to see more on-site training.
PR newbies were more likely to say they wanted on-site training: Twenty-three percent with less than a year
in the industry chose on-site offerings, versus 11 percent of those in the business for more than 20 years.
Thirty-eight percent of the newbies chose off-site training and conferences as a must-have, while 28 percent
of workers with more than 20 years in the industry chose this training benefit.
“Off-site conferences and workshops are our method of training, but only one of us can go at a time, and I would like to go to these training sessions as well.”
WHAT TYPE OF TRAINING DO YOU WANT YOUR COMPANY TO PROVIDE? [ACCORDING TO EXPERIENCE]
23%
22%
16%
16%
11%
Onsite training
38% 41
%31
%31
%28
%
Offsite conferencesand workshops
10% 12%
8% 7%5%
Online training(internally produced)
18% 21
%18
%16
%9%
Online training(externally produced)
10% 15
%9% 7% 6%
Webinars and podcasts(internally produced)
17% 20
%16
%16
%11
%
Webinars and podcasts(externally produced)
48%
45%
39%
39%
25%
Formalmentoring program
20% 24
%32
%31
% 39%
Nothing additionalneeded
4% 1% 4% 5% 5%
Other
Less than 1 year 1 to 5 years 5 to 10 years 10 to 20 years More than 20 years
19
JOB SATISFACTION
OVERALL SATISFACTION
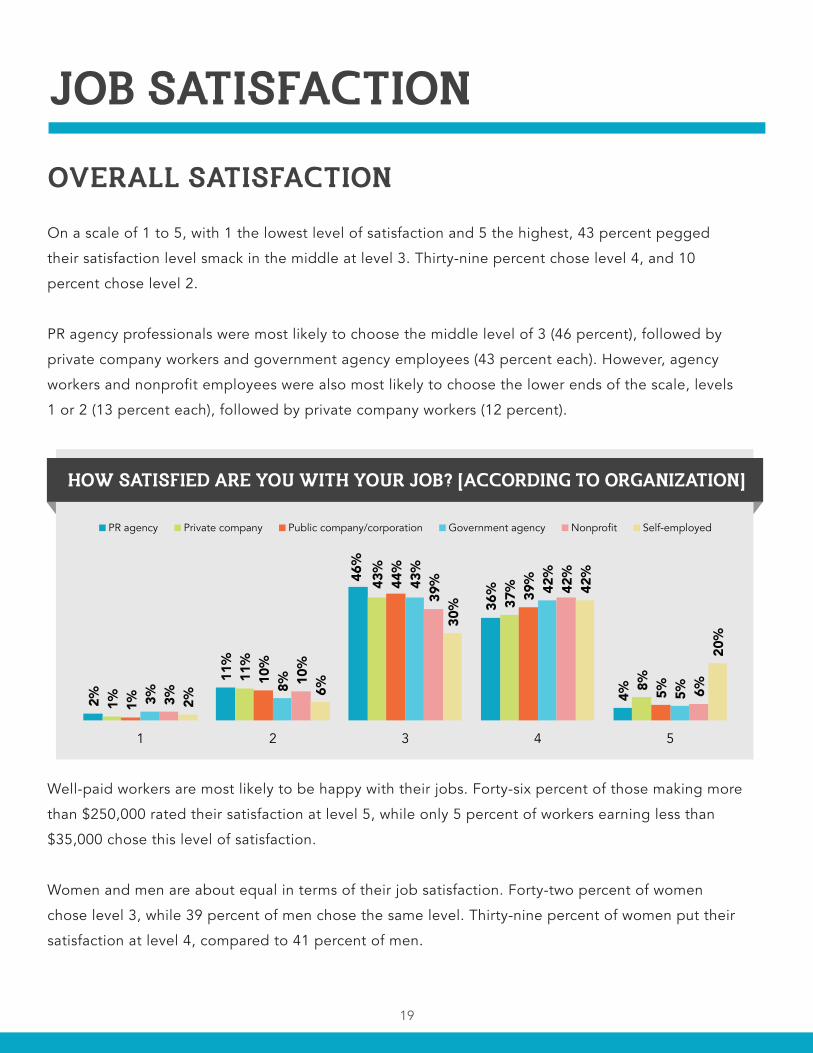
On a scale of 1 to 5, with 1 the lowest level of satisfaction and 5 the highest, 43 percent pegged
their satisfaction level smack in the middle at level 3. Thirty-nine percent chose level 4, and 10
percent chose level 2.
PR agency professionals were most likely to choose the middle level of 3 (46 percent), followed by
private company workers and government agency employees (43 percent each). However, agency
workers and nonprofit employees were also most likely to choose the lower ends of the scale, levels
1 or 2 (13 percent each), followed by private company workers (12 percent).
Well-paid workers are most likely to be happy with their jobs. Forty-six percent of those making more
than $250,000 rated their satisfaction at level 5, while only 5 percent of workers earning less than
$35,000 chose this level of satisfaction.
Women and men are about equal in terms of their job satisfaction. Forty-two percent of women
chose level 3, while 39 percent of men chose the same level. Thirty-nine percent of women put their
satisfaction at level 4, compared to 41 percent of men.
HOW SATISFIED ARE YOU WITH YOUR JOB? [ACCORDING TO ORGANIZATION]
2% 11
%
46%
36%
4%
1% 11
%
43%
37%
8%
1% 10
%
44%
39%
5%
3% 8%
43%
42%
5%
3% 10
%
39%
42%
6%
2% 6%
30%
42%
20%
1 2 3 4 5
PR agency Private company Public company/corporation Government agency Nonprofit Self-employed
20
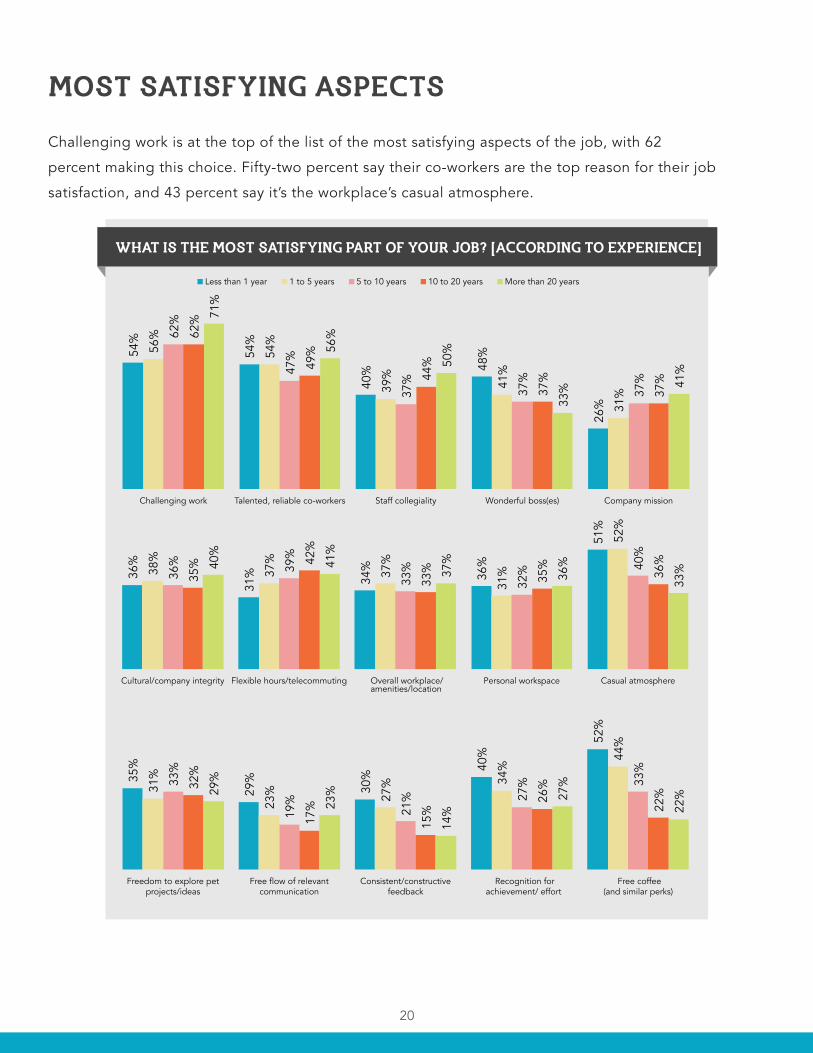
MOST SATISFYING ASPECTS
Challenging work is at the top of the list of the most satisfying aspects of the job, with 62
percent making this choice. Fifty-two percent say their co-workers are the top reason for their job
satisfaction, and 43 percent say it’s the workplace’s casual atmosphere.
WHAT IS THE MOST SATISFYING PART OF YOUR JOB? [ACCORDING TO EXPERIENCE]
Less than 1 year 1 to 5 years 5 to 10 years 10 to 20 years More than 20 years
amenities/location
36%
31%
34%
36%
51%
38%
37%
37%
31%
52%
36%
39%
33%
32%
40%
35%
42%
33%
35%
36%
40%
41%
37%
36%
33%
Cultural/company integrity Flexible hours/telecommuting Overall workplace/ Personal workspace Casual atmosphere
54%
54%
40%
48%
26%
56%
54%
39%
41%
31%
62%
47%
37%
37%
37%
62%
49%
44%
37%
37%
71%
56%
50%
33%
41%
Challenging work Talented, reliable co-workers Staff collegiality Wonderful boss(es) Company mission
35%
29%
30%
40%
52%
31%
23%
27%
34%
44%
33%
19%
21%
27%
33%
32%
17%
15%
26%
22%
29%
23%
14%
27%
22%
Freedom to explore pet projects/ideas
Free flow of relevant communication
Consistent/constructive feedback
Recognition forachievement/ effort
Free coffee(and similar perks)
21
Professionals on the job less than a year are somewhat less likely to value challenging work as a key
aspect of their satisfaction—54 percent say challenging work matters the most, and 52 percent of
these newbies named free coffee as a key job satisfaction perk. Seventy-one percent of people in
the business more than 20 years chose challenging work as the most important factor in their job
satisfaction—while only 22 percent chose free coffee.
“I work for a charity with a four-star rating from Charity Navigator, believe in our mission, and know the impact our services have on the vulnerable in our community. It gives me a good feeling to know that I’m making a difference in my community. Sure, I’m underpaid ... but I do important work.”
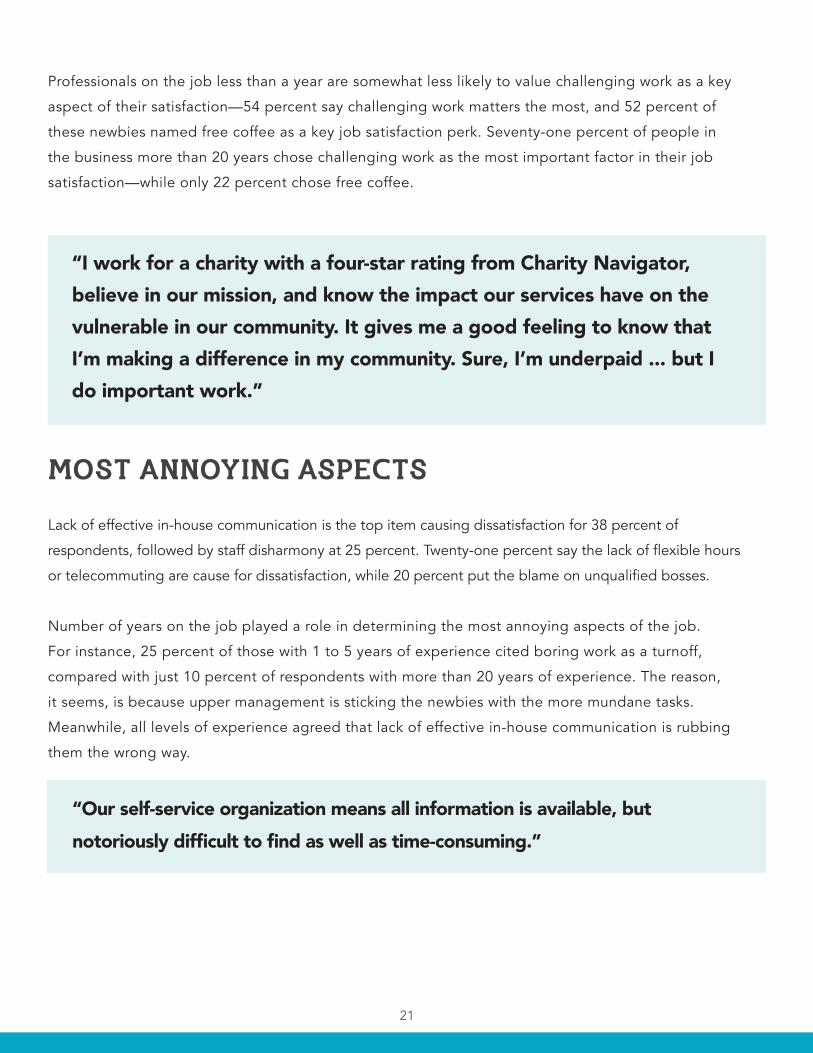
MOST ANNOYING ASPECTS
Lack of effective in-house communication is the top item causing dissatisfaction for 38 percent of
respondents, followed by staff disharmony at 25 percent. Twenty-one percent say the lack of flexible hours
or telecommuting are cause for dissatisfaction, while 20 percent put the blame on unqualified bosses.
Number of years on the job played a role in determining the most annoying aspects of the job.
For instance, 25 percent of those with 1 to 5 years of experience cited boring work as a turnoff,
compared with just 10 percent of respondents with more than 20 years of experience. The reason,
it seems, is because upper management is sticking the newbies with the more mundane tasks.
Meanwhile, all levels of experience agreed that lack of effective in-house communication is rubbing
them the wrong way.
“Our self-service organization means all information is available, but notoriously difficult to find as well as time-consuming.”
22
Less than 1 year 1 to 5 years 5 to 10 years 10 to 20 years More than 20 years
25%
4% 7%
15%
10%
25%
6%
12%
23%
10%
19%
3%
15%
31%
7%
19%
3%
10%
28%
10%
10%
2% 7%
23%
Boring work Distasteful work My co-workers Staff disharmony Ethical issues
14%
8%
16%
19%
4%
15%
19%
22%
14%
13%
21%
18%
23%
11%
14%
22%
19%
19%
12%
12%
19%
16%
15%
6%
Mean/unfair boss(es) Unqualified boss(es) Vague or off-track company mission
Lack of flexible hours/telecommuting
Overall workplace/lack of amenities/crummy location
18%
8%
3%
13%
33%
19%
10%
4%
15%
42%
20%
12%
2%
14%
43%
15%
12%
2%
13%
41%
10%
9%
2%
10%
26%
Personal workspace (or lack thereof)
Excessively rigid atmosphere
Excessively casual atmosphere
No freedom to explore pet projects/
ideas
Lack of effective in-house communication
5%
21%
10%
17%
12%
21%
11%
28%
8%
43%
Perks have been taken away Other
WHAT IS THE LEAST SATISFYING PART OF YOUR JOB? [ACCORDING TO EXPERIENCE]
23
WHAT TO CHANGE IN THE ORGANIZATION
Respondents were asked to choose one thing they would change in their organization. While
responses varied widely, some common themes emerged: More communication and clear direction
from management are clearly needed, along with cohesiveness on company goals and standardized
policies and practices.
“There are too many unnecessary meetings, too little communication, and too many chiefs and not enough Indians.”
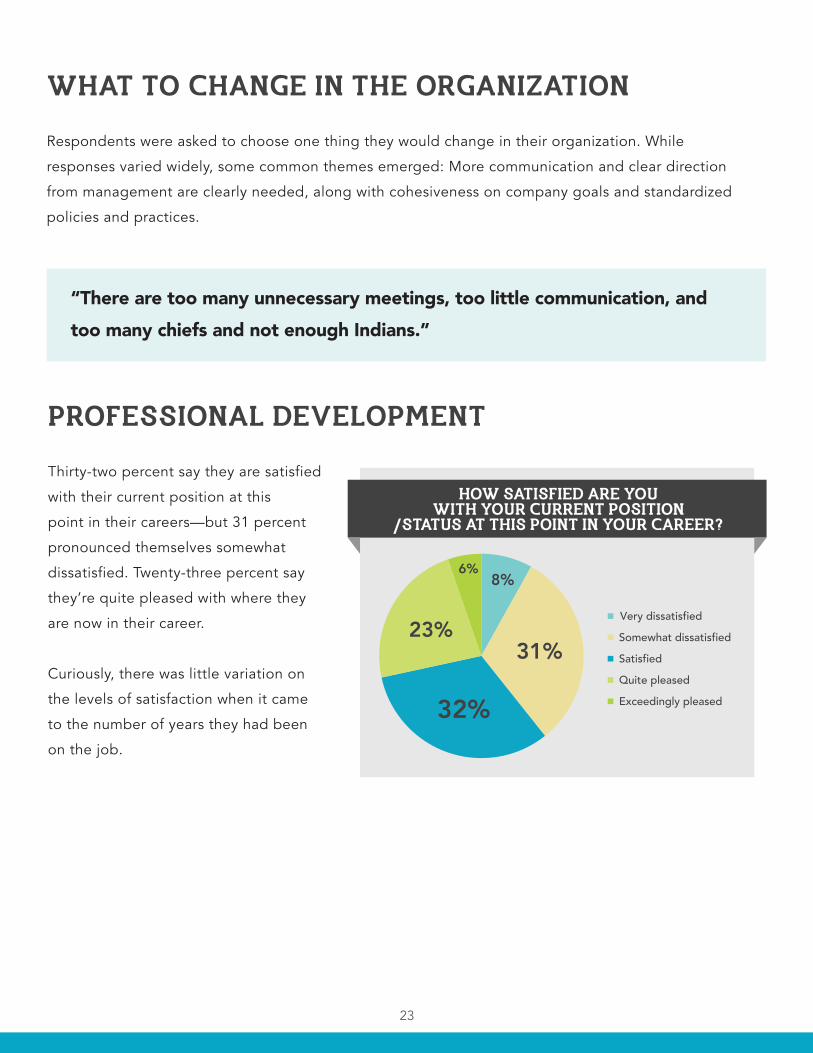
PROFESSIONAL DEVELOPMENT
Thirty-two percent say they are satisfied
with their current position at this
point in their careers—but 31 percent
pronounced themselves somewhat
dissatisfied. Twenty-three percent say
they’re quite pleased with where they
are now in their career.
Curiously, there was little variation on
the levels of satisfaction when it came
to the number of years they had been
on the job.
HOW SATISFIED ARE YOUWITH YOUR CURRENT POSITION
/STATUS AT THIS POINT IN YOUR CAREER?
8%
31%
32%
23%
6%
Very dissatisfied Somewhat dissatisfied Satisfied Quite pleased Exceedingly pleased
24
WORK/LIFE BALANCE
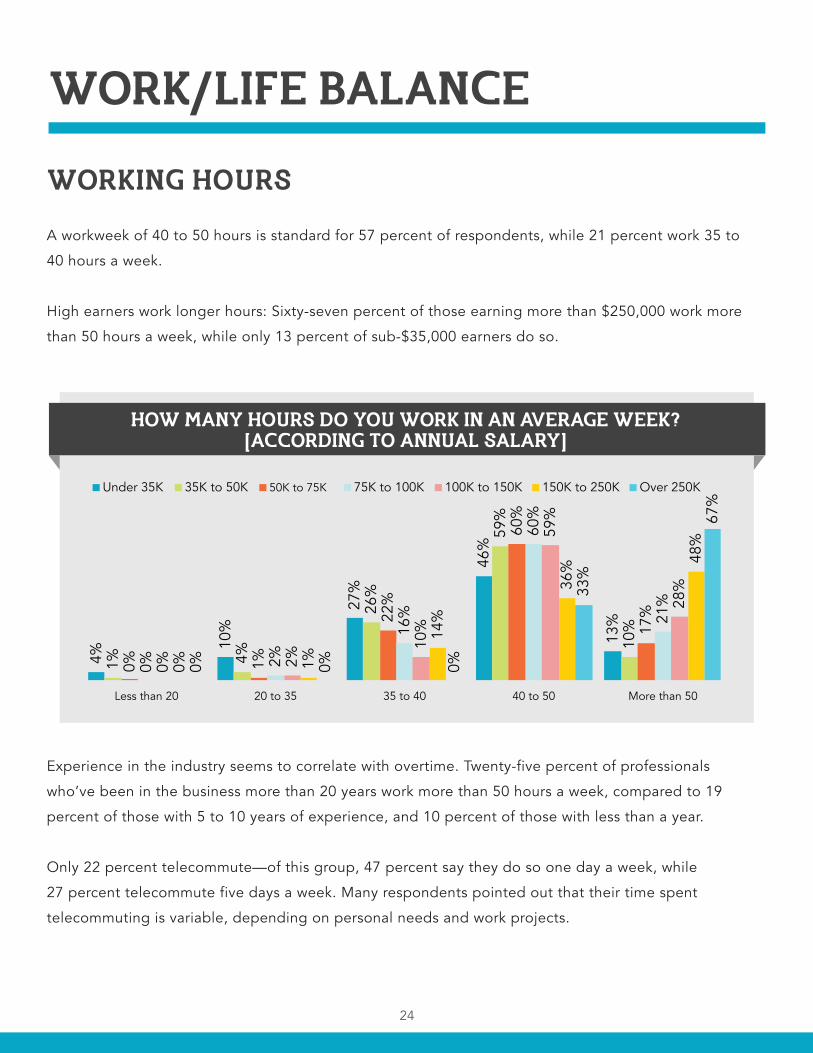
WORKING HOURS
A workweek of 40 to 50 hours is standard for 57 percent of respondents, while 21 percent work 35 to
40 hours a week.
High earners work longer hours: Sixty-seven percent of those earning more than $250,000 work more
than 50 hours a week, while only 13 percent of sub-$35,000 earners do so.
Experience in the industry seems to correlate with overtime. Twenty-five percent of professionals
who’ve been in the business more than 20 years work more than 50 hours a week, compared to 19
percent of those with 5 to 10 years of experience, and 10 percent of those with less than a year.
Only 22 percent telecommute—of this group, 47 percent say they do so one day a week, while
27 percent telecommute five days a week. Many respondents pointed out that their time spent
telecommuting is variable, depending on personal needs and work projects.
HOW MANY HOURS DO YOU WORK IN AN AVERAGE WEEK?[ACCORDING TO ANNUAL SALARY]
4% 10
% 27
%
46%
13%
1%
4%
26%
59%
10%
0%
1%
22%
60%
17%
0%
2%
16%
60%
21%
0%
2% 10
%
59%
28%
0%
1% 14
%
36%
48%
0%
0%
0%
33%
67%
Less than 20 20 to 35 35 to 40 40 to 50 More than 50
Under 35K 35K to 50K 50K to 75K 75K to 100K 100K to 150K 150K to 250K Over 250K
25
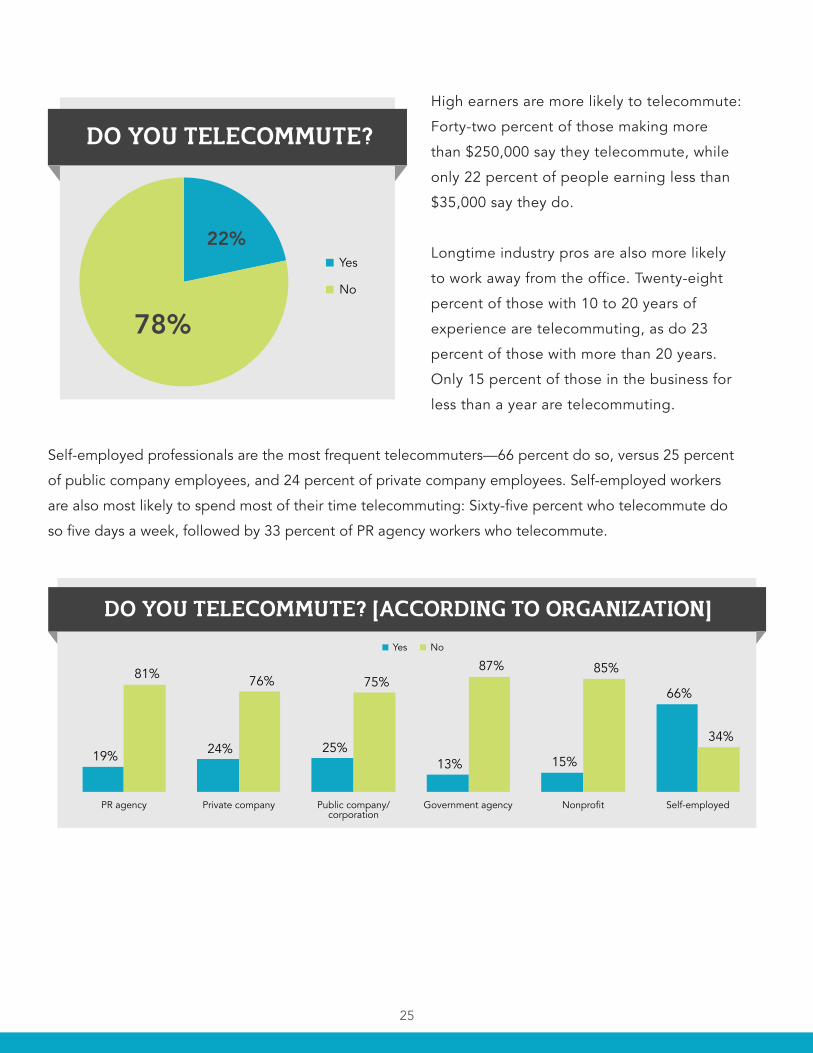
High earners are more likely to telecommute:
Forty-two percent of those making more
than $250,000 say they telecommute, while
only 22 percent of people earning less than
$35,000 say they do.
Longtime industry pros are also more likely
to work away from the office. Twenty-eight
percent of those with 10 to 20 years of
experience are telecommuting, as do 23
percent of those with more than 20 years.
Only 15 percent of those in the business for
less than a year are telecommuting.
Self-employed professionals are the most frequent telecommuters—66 percent do so, versus 25 percent
of public company employees, and 24 percent of private company employees. Self-employed workers
are also most likely to spend most of their time telecommuting: Sixty-five percent who telecommute do
so five days a week, followed by 33 percent of PR agency workers who telecommute.
DO YOU TELECOMMUTE?
22%
78%
Yes
No
DO YOU TELECOMMUTE? [ACCORDING TO ORGANIZATION]
19% 24% 25% 13% 15%
66% 81% 76% 75%
87% 85%
34%
PR agency Private company Public company/corporation
Government agency Nonprofit Self-employed
Yes No
26
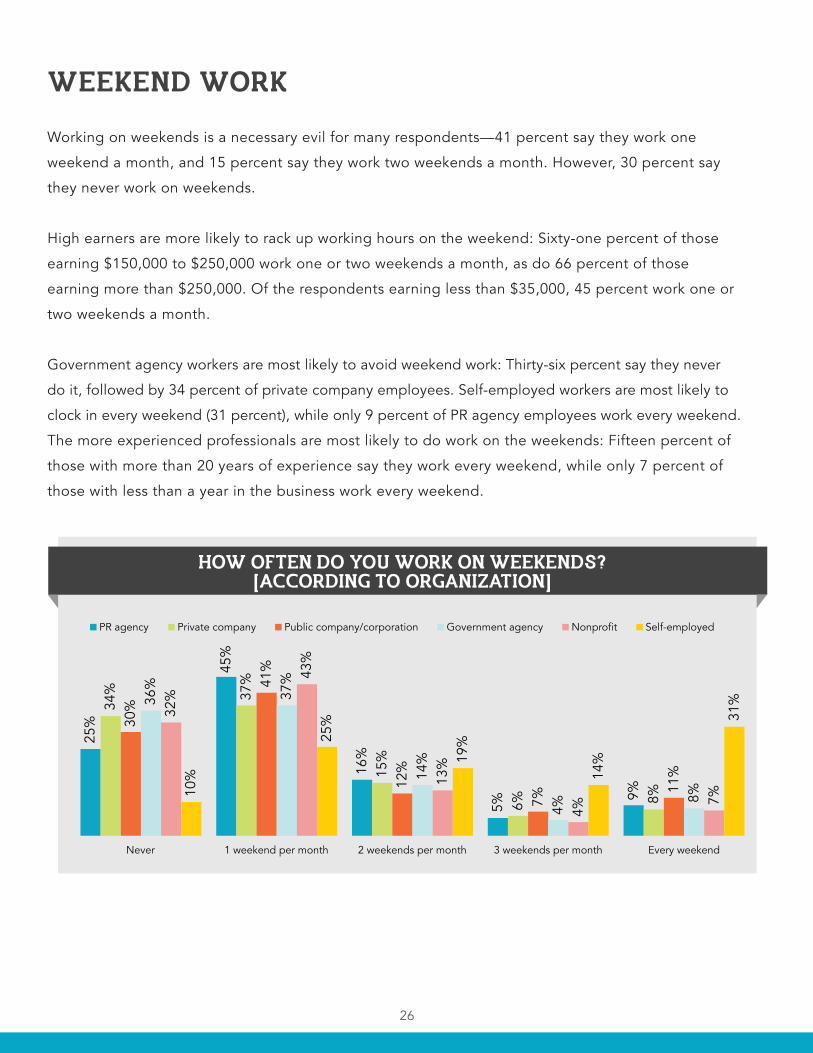
WEEKEND WORK
Working on weekends is a necessary evil for many respondents—41 percent say they work one
weekend a month, and 15 percent say they work two weekends a month. However, 30 percent say
they never work on weekends.
High earners are more likely to rack up working hours on the weekend: Sixty-one percent of those
earning $150,000 to $250,000 work one or two weekends a month, as do 66 percent of those
earning more than $250,000. Of the respondents earning less than $35,000, 45 percent work one or
two weekends a month.
Government agency workers are most likely to avoid weekend work: Thirty-six percent say they never
do it, followed by 34 percent of private company employees. Self-employed workers are most likely to
clock in every weekend (31 percent), while only 9 percent of PR agency employees work every weekend.
The more experienced professionals are most likely to do work on the weekends: Fifteen percent of
those with more than 20 years of experience say they work every weekend, while only 7 percent of
those with less than a year in the business work every weekend.
HOW OFTEN DO YOU WORK ON WEEKENDS?[ACCORDING TO ORGANIZATION]
25%
45%
16%
5% 9%
34%
37%
15%
6%
8%
30%
41%
12%
7% 11
%
36%
37%
14%
4% 8%
32%
43%
13%
4% 7%
10%
25%
19%
14%
31%
Never 1 weekend per month 2 weekends per month 3 weekends per month Every weekend
PR agency Private company Public company/corporation Government agency Nonprofit Self-employed
27
Of those who do weekend work, 67 percent say they don’t get extra compensation for doing so,
since it’s considered part of the job. But 17 percent say they make an effort to get the time back in
other ways, such as taking longer lunches or working shorter days.
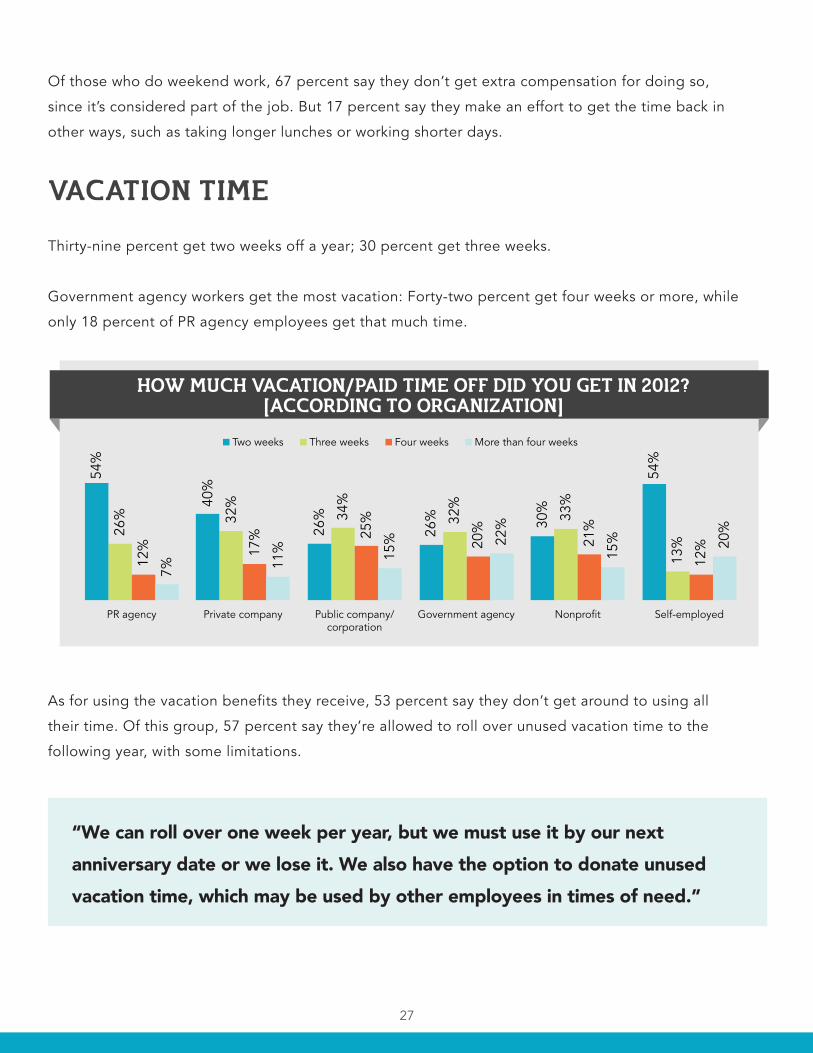
VACATION TIME
Thirty-nine percent get two weeks off a year; 30 percent get three weeks.
Government agency workers get the most vacation: Forty-two percent get four weeks or more, while
only 18 percent of PR agency employees get that much time.
As for using the vacation benefits they receive, 53 percent say they don’t get around to using all
their time. Of this group, 57 percent say they’re allowed to roll over unused vacation time to the
following year, with some limitations.
“We can roll over one week per year, but we must use it by our next anniversary date or we lose it. We also have the option to donate unused vacation time, which may be used by other employees in times of need.”
HOW MUCH VACATION/PAID TIME OFF DID YOU GET IN 2012?[ACCORDING TO ORGANIZATION]
54%
40%
26%
26%
30%
54%
26%
32%
34%
32%
33%
13%
12%
17%
25%
20%
21%
12%
7%
11%
15%
22%
15%
20%
PR agency Private company Public company/corporation
Government agency Nonprofit Self-employed
Two weeks Three weeks Four weeks More than four weeks

28
MONEY VS. TIME OFF
If able to choose between getting more money or getting more time off, 65 percent say they’ll take
the cash, while 35 percent would take the extra time. Men were somewhat more likely to prefer the
cash: Seventy-one percent say they’d take the money compared to 62 percent of women.
Slightly more of the lower-paid respondents say they’d prefer money to time: Sixty-seven percent in
both the under-$35,000 and the $35,000 to $50,000 categories say they want the cash, compared to
58 percent of people making more than $250,000.
“Would love to say time, but with my responsibilities, I probably couldn’t take the extra time off anyway.”
WOULD YOU RATHER HAVE AN EXTRA WEEK OF PAIDTIME OFF, OR A 3 PERCENT RAISE IN SALARY?
67% 67% 66% 61% 62% 55% 58%
33% 33% 34% 39% 38% 45% 42%
Under 35K 35K to 50K 50K to 75K 75K to 100K 100K to 150K 150K to 250K Over 250K
The money The time
29
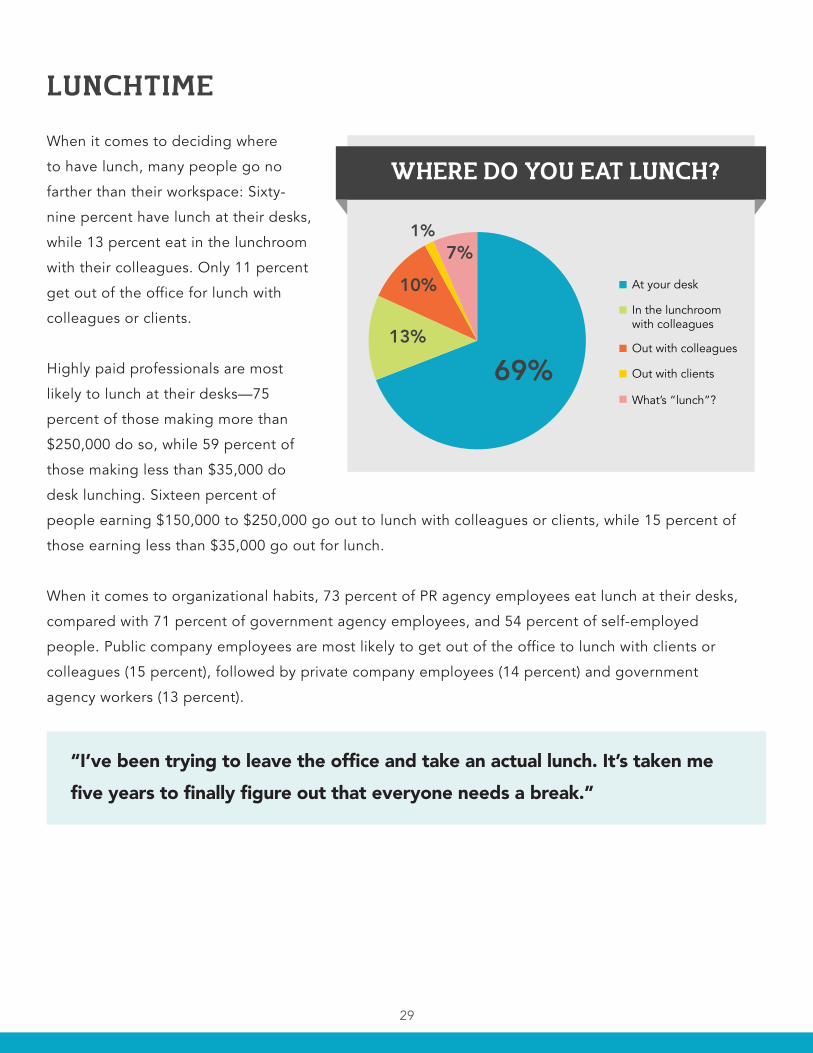
LUNCHTIME
When it comes to deciding where
to have lunch, many people go no
farther than their workspace: Sixty-
nine percent have lunch at their desks,
while 13 percent eat in the lunchroom
with their colleagues. Only 11 percent
get out of the office for lunch with
colleagues or clients.
Highly paid professionals are most
likely to lunch at their desks—75
percent of those making more than
$250,000 do so, while 59 percent of
those making less than $35,000 do
desk lunching. Sixteen percent of
people earning $150,000 to $250,000 go out to lunch with colleagues or clients, while 15 percent of
those earning less than $35,000 go out for lunch.
When it comes to organizational habits, 73 percent of PR agency employees eat lunch at their desks,
compared with 71 percent of government agency employees, and 54 percent of self-employed
people. Public company employees are most likely to get out of the office to lunch with clients or
colleagues (15 percent), followed by private company employees (14 percent) and government
agency workers (13 percent).
“I’ve been trying to leave the office and take an actual lunch. It’s taken me five years to finally figure out that everyone needs a break.”
WHERE DO YOU EAT LUNCH?
69% 13%
10%
1% 7%
At your desk
In the lunchroomwith colleagues
Out with colleagues
Out with clients
What’s “lunch”?
30
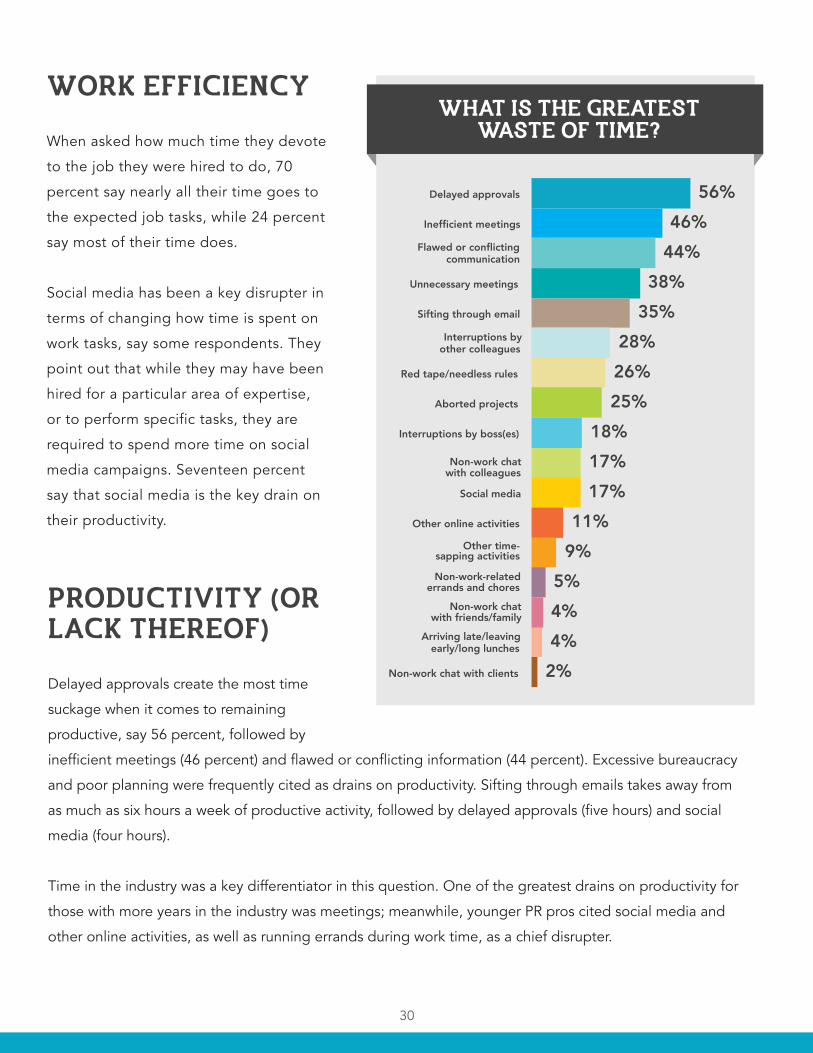
WORK EFFICIENCY
When asked how much time they devote
to the job they were hired to do, 70
percent say nearly all their time goes to
the expected job tasks, while 24 percent
say most of their time does.
Social media has been a key disrupter in
terms of changing how time is spent on
work tasks, say some respondents. They
point out that while they may have been
hired for a particular area of expertise,
or to perform specific tasks, they are
required to spend more time on social
media campaigns. Seventeen percent
say that social media is the key drain on
their productivity.
WHAT IS THE GREATESTWASTE OF TIME?
2% 4% 4% 5%
9% 11%
17% 17% 18%
25% 26% 28%
35% 38%
44% 46%
56%
Non-work chat with clients
Arriving late/leaving early/long lunches
Non-work chat with friends/family
Non-work-related errands and chores
Other time- sapping activities
Other online activities
Social media
Non-work chat
Interruptions by boss(es)
Aborted projects
Red tape/needless rules
Interruptions byother colleagues
Sifting through email
Unnecessary meetings
Flawed or conflictingcommunication
Inefficient meetings
Delayed approvals
with colleagues
PRODUCTIVITY (OR LACK THEREOF)
Delayed approvals create the most time
suckage when it comes to remaining
productive, say 56 percent, followed by
inefficient meetings (46 percent) and flawed or conflicting information (44 percent). Excessive bureaucracy
and poor planning were frequently cited as drains on productivity. Sifting through emails takes away from
as much as six hours a week of productive activity, followed by delayed approvals (five hours) and social
media (four hours).
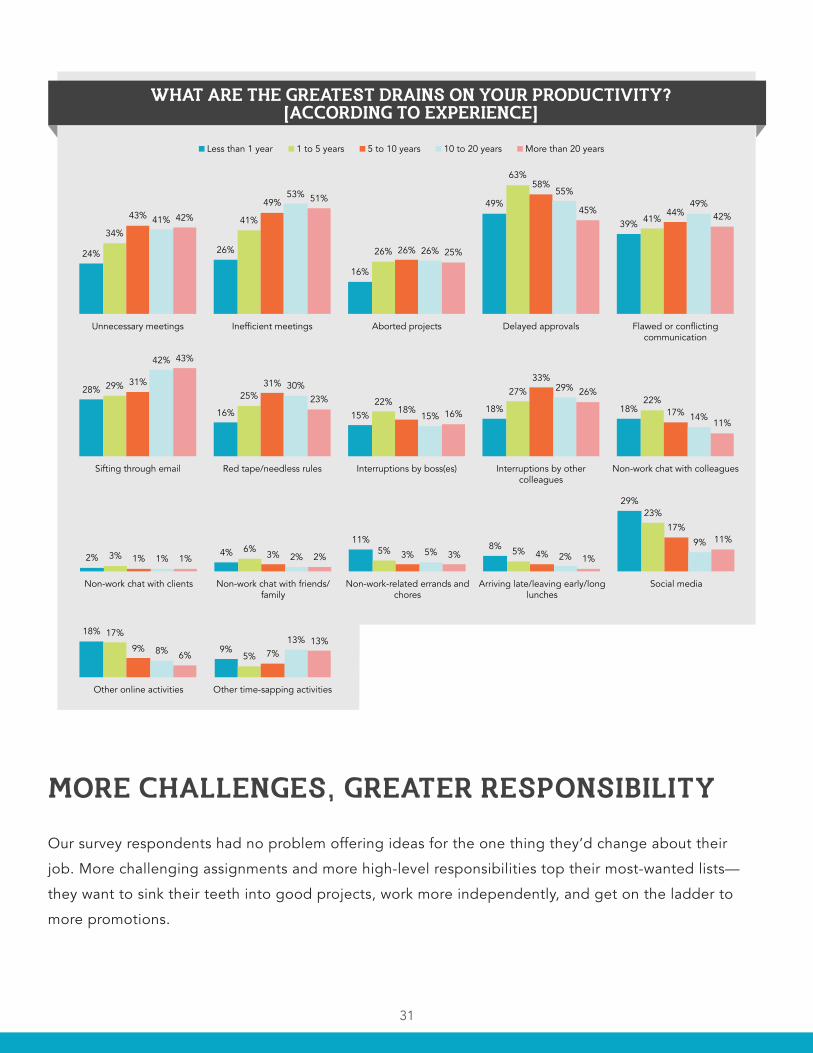
Time in the industry was a key differentiator in this question. One of the greatest drains on productivity for
those with more years in the industry was meetings; meanwhile, younger PR pros cited social media and
other online activities, as well as running errands during work time, as a chief disrupter.
31
WHAT ARE THE GREATEST DRAINS ON YOUR PRODUCTIVITY?[ACCORDING TO EXPERIENCE]
24% 26%
16%
49%
39% 34%
41%
26%
63%
41% 43% 49%
26%
58%
44% 41%
53%
26%
55% 49%
42%
51%
25%
45% 42%
Unnecessary meetings Inefficient meetings Aborted projects Delayed approvals Flawed or conflicting communication
28%
16% 15% 18% 18%
29% 25%
22% 27%
22%
31% 31%
18%
33%
17%
42%
30%
15%
29%
14%
43%
23%
16%
26%
11%
Sifting through email Red tape/needless rules Interruptions by boss(es) Interruptions by other colleagues
Non-work chat with colleagues
2% 4% 11%
8%
29%
3% 6% 5% 5%
23%
1% 3% 3% 4%
17%
1% 2% 5% 2%
9%
1% 2% 3% 1%
11%
Non-work chat with clients Non-work chat with friends/family
Non-work-related errands and chores
Arriving late/leaving early/long lunches
Social media
18%
9%
17%
5% 9% 7% 8%
13%
6%
13%
Other online activities Other time-sapping activities
Less than 1 year 1 to 5 years 5 to 10 years 10 to 20 years More than 20 years
MORE CHALLENGES, GREATER RESPONSIBILITY
Our survey respondents had no problem offering ideas for the one thing they’d change about their
job. More challenging assignments and more high-level responsibilities top their most-wanted lists—
they want to sink their teeth into good projects, work more independently, and get on the ladder to
more promotions.