Embed Size (px)
Citation preview

Baseline Peak Reduction0
5
10
15
20
25
30
35
Perc
ent B
ody
Fat (
%)
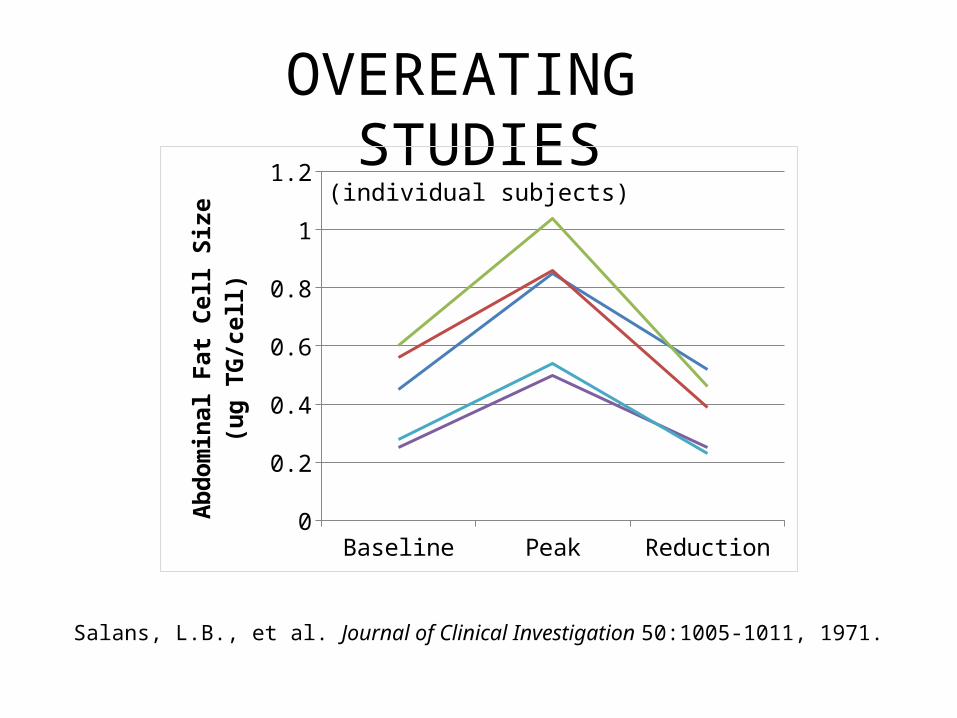
Salans, L.B., et al. Journal of Clinical Investigation 50:1005-1011, 1971.
OVEREATING STUDIES(individual subjects)

Baseline Peak Reduction05
101520253035
Perc
ent B
ody
Fat
(%)
Salans, L.B., et al. Journal of Clinical Investigation 50:1005-1011, 1971.
OVEREATING STUDIES(individual subjects)
Baseline Peak Reduction0
0.20.40.60.8
11.2
Glu
teal
Fat
Cel
l Siz
e (u
g TG
/cel
l)
Baseline Peak Reduction0
0.20.40.60.8
11.2
Glu
teal
Fat
Cel
l Siz
e (u
g TG
/cel
l)
Baseline Peak Reduction0
0.20.40.60.8
11.2
Abd
omin
al F
at C
ell S
ize
(ug
TG/c
ell)

OVEREATING STUDIES(individual subjects)
Salans, L.B., et al. Journal of Clinical Investigation 50:1005-1011, 1971.
Baseline Peak Reduction0
0.2
0.4
0.6
0.8
1
1.2G
lute
al F
at C
ell S
ize
(ug
TG/c
ell)
OVEREATING STUDIES(individual subjects)
Salans, L.B., et al. Journal of Clinical Investigation 50:1005-1011, 1971.
Baseline Peak Reduction0
0.2
0.4
0.6
0.8
1
1.2A
bdom
inal
Fat
Cel
l Siz
e (u
g TG
/cel
l)

OVEREATING STUDIES(individual subjects)
Salans, L.B., et al. Journal of Clinical Investigation 50:1005-1011, 1971.
Baseline Peak Reduction0
5
10
15
20
25
30
35
40
45Fa
t Cel
l Num
ber (
x109
)

OVEREATING STUDIES(individual subjects)
Salans, L.B., et al. Journal of Clinical Investigation 50:1005-1011, 1971.
Baseline Peak Reduction0
0.2
0.4
0.6
0.8
1
1.2Tr
icep
s F
at C
ell S
ize
(ug
TG/c
ell)
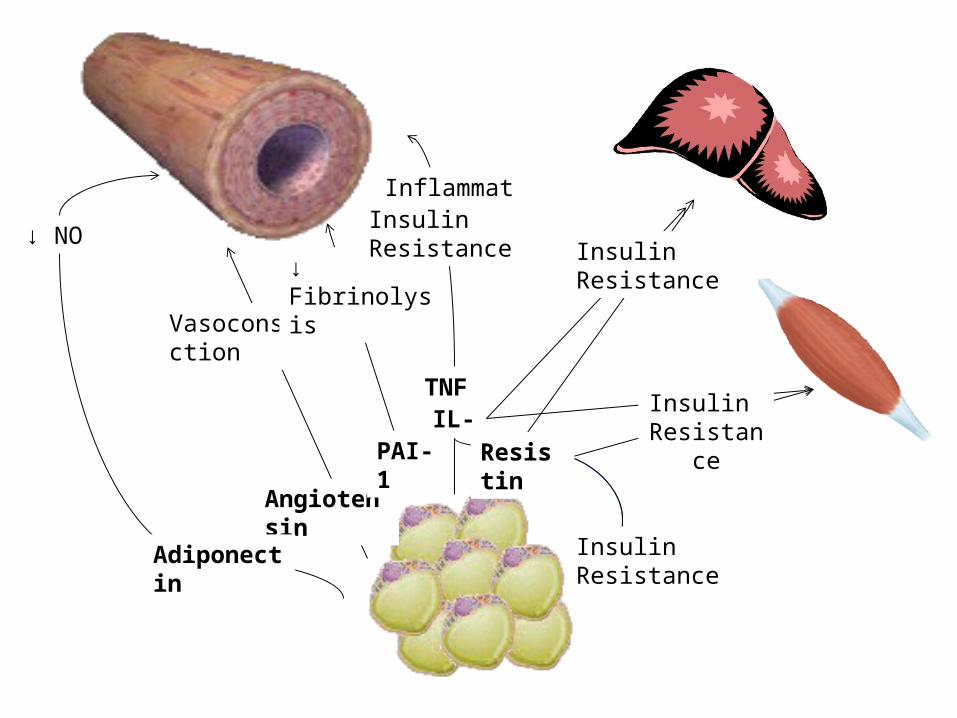
TNF αIL-6
Angiotensin
Vasoconstriction
↓ NO
Adiponectin
↓ Fibrinolysis
PAI-1
Insulin Resistance
Insulin Resistance
Resistin
InflammationInsulin Resistance
Insulin Resistance


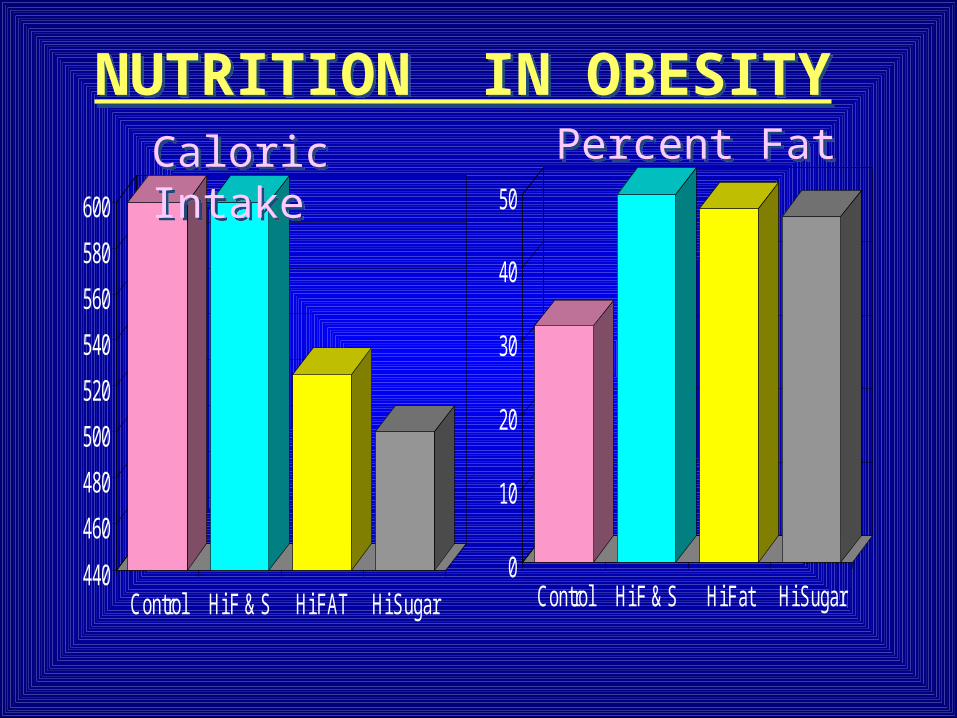
NUTRITION IN OBESITYNUTRITION IN OBESITY
440
460
480
500
520
540
560
580
600
Control Hi F & S Hi FAT Hi Sugar0
10
20
30
40
50
Control Hi F & S Hi Fat Hi Sugar
Caloric IntakeCaloric Intake Percent FatPercent Fat

OBESITYOBESITY
Oscai et al J Lipid Research 13:588-592, 1972.
Sedentary Free EatersSedentary Free Eaters
Sedentary Pair
Weighted
Sedentary Pair
WeightedExerciseExercise
0
10
20
30
40
50
60
Calo
ries
per
Day
Calo
ries
per
Day

OBESITYOBESITY
0
5
10
15
20
25
Sed-Free Sed-Pair Exercise0
50
100
150
200
250
300
350
400
Sed-Free Sed-Pair Exercise
Percent Fat (%)Percent Fat (%)
Body Weight (g)Body Weight (g)

OBESITYOBESITY
Sed-Free Sed-Pair Exercise0
0.05
0.1
0.15
0.2
0.25
0.3
0.35
0.4
0.45
Sed-Free Sed-Pair Exercise0
1
2
3
4
5
6
7
Fat Cell SizeFat Cell Size Fat Cell NumberFat Cell Number
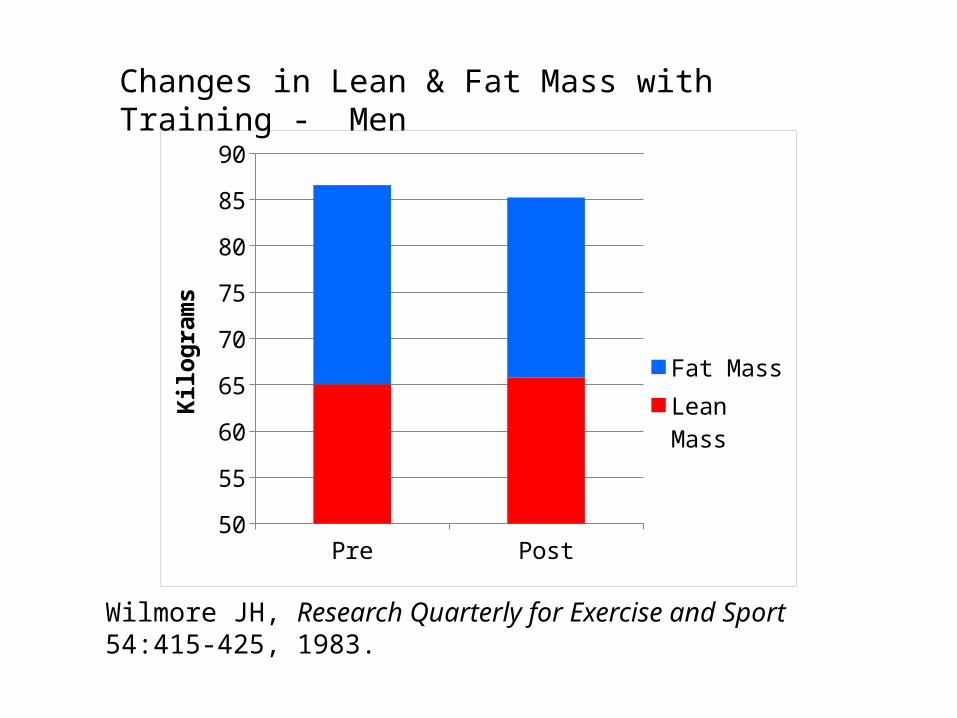
Wilmore JH, Research Quarterly for Exercise and Sport 54:415-425, 1983.
Pre Post50
55
60
65
70
75
80
85
90
Fat Mass
Lean Mass
Kilo
gram
s
Changes in Lean & Fat Mass with Training - Men

Wilmore JH, Research Quarterly for Exercise and Sport 54:415-425, 1983.
Pre Post30
35
40
45
50
55
60
65
70
Fat MassLean MassKi
logr
ams
Changes in Lean & Fat Mass with Training - Women

Diet Exercise Diet + Exercise-12
-10
-8
-6
-4
-2
0
2
Total Wt
Fat Wt
Lean Wt
Kilo
gram
s
Total weight, fat mass & lean mass changes with diet and exercise
Miller, WC et al International Journal of Obesity 21:941-947, 1997

Diet Exercise Diet + Ex-14-12-10-8-6-4-2024
Lean
Fat
Zuti & Golding, Physician & SportsMedicine 4:49-55, 1978
Wei
ght C
hang
e (lb
s)Lean vs. Fat Mass Loss with Diet & Exercise

Normal Wt Overweight-6
-5
-4
-3
-2
-1
0
1
2
LeanFat
Franklin, B., et al. Research Quarterly 1976.
Wei
ght C
hang
e (lb
s)Lean vs. Fat Mass Loss In Overweight Adults

Jakicic, et al. JAMA 282:1554-1560, 1999
SHORT vs. LONG BOUTS OF EXERICSESHORT vs. LONG BOUTS OF EXERICSE

Jakicic, et al. JAMA 282:1554-1560, 1999
1-4 wks 5-8 wks 9-24 wks
7-12 Mo 13-18 Mo
0
50
100
150
200
250
ShortLongShort Eq
ADHERENCEADHERENCEM
inut
es p
er w
eek
Min
utes
per
wee
k
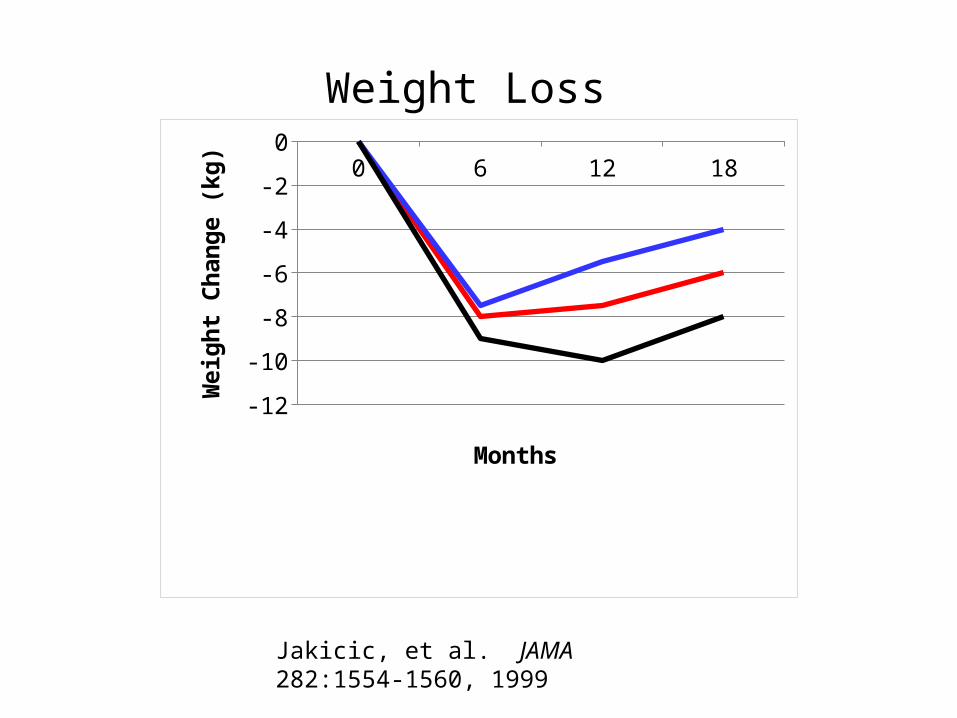
Jakicic, et al. JAMA 282:1554-1560, 1999
0 6 12 18
Long 0 -8 -7.5 -6
Short 0 -7.5 -5.5 -4
Short Eq 0 -9 -10 -8
-11
-9
-7
-5
-3
-1
Months
Wei
ght C
hang
e (k
g)
Weight Loss

Weight % Fat-3
-2.5
-2
-1.5
-1
-0.5
0
0.5
1
Exercise
Physical Activ-ity
Wei
ght (
kg)o
r Per
cent
Fat
(%)
Lifestyle Activity vs. Exercise is Weight Loss
Dunn, A.L. et al JAMA 281:327-334, 1999

MORBID OBESITYMORBID OBESITY
Reduce body fat in obese: Hill JO et al Physical Activity, Fitness, and Health: International Proceedings and Consensus statement, p 684-694, 1994.
No Wt LossNo Wt Loss
TrendTrend
Wt LossWt Loss

Body Weight Fat Mass Waist Circumference-3
-2
-1
0
1
2
3
Control
Walk 1
Walk 2Chan
ge (k
g or
cm
)
Fogelholm, et al. Arch Int Medicine 160:2177-2184, 2000
PHYSICAL ACTIVITY & WEIGHT MAINTENANCE

Wald
en
et
al, A
m J C
lin N
utr
47
:22
9-2
34
, 1
98
8.
N= 20 upperN= 20 lowerN= 20 upperN= 20 lower
LOWER:
• Lost Abd & Glut
LOWER:
• Lost Abd & Glut
UPPER:
• Lost more on WHR• Lost only from Abd• Lost more weight
UPPER:
• Lost more on WHR• Lost only from Abd• Lost more weight

Baseline Peak Reduction05
101520253035
Perc
ent B
ody
Fat
(%)
Salans, L.B., et al. Journal of Clinical Investigation 50:1005-1011, 1971.
OVEREATING STUDIES(individual subjects)
Baseline Peak Reduction0
0.20.40.60.8
11.2
Glu
teal
Fat
Cel
l Siz
e (u
g TG
/cel
l)
Baseline Peak Reduction0
0.20.40.60.8
11.2
Abd
omin
al F
at C
ell S
ize
(ug
TG/c
ell)
Baseline Peak Reduction0
1020304050
Fat C
ell N
umbe
r (x1
09)

0
10
20
30
40
50
60
70
80
90
% Fat Fat Cell Size
Ex Obese
Elite
Sed Control
Tremblay, A., Int J Obesity 8:641-648, 1984.Tremblay, A., Int J Obesity 8:641-648, 1984.
EXERCISE & THE FAT CELLEXERCISE & THE FAT CELL

Lean Normal Obese0
0.5
1
1.5
2
2.5
UnfitFitRe
lativ
e Ri
sk
Lee, C.D., et al. American Journal of Clinical Nutrition 69:373-380, 1999
Fitness & Fatness

EXERCISE & NUTRITIONEXERCISE & NUTRITION
0
5
10
15
20
25
30
35
40
Sed-Low Sed-High Ex-High
Perc
ent
Body F
at
(%)
Pitts, et al Am J Physiol 246:R495, 1984

EXERCISE & METABOLIC RATEEXERCISE & METABOLIC RATE
0
10
20
30
40
50
60
70
80
90
0.8 0.9 1 1.1 1.2
RMR/kg hr
VO
2 m
ax (m
l/min
kg)
Poehlman, E.T., Med Sci Sports Exerc 21:515-525, 1989Poehlman, E.T., Med Sci Sports Exerc 21:515-525, 1989

EXERCISE & FOOD INTAKEEXERCISE & FOOD INTAKE
Neiman, D.C., J A, Dietetic Assoc 90: 1557-1562, 1990Neiman, D.C., J A, Dietetic Assoc 90: 1557-1562, 1990
1400
1600
1800
2000
2200
0 3 5 9 12 15
Kca
l int
ake
Control
Exercise

0 1 2 3 4 5 60
0.5
1
1.5
2
2.5
3
Control
Time (hrs)
Trig
lyce
ride
s (m
Mol
/L
Postprandial Lipemia and Exercise
Aldred, H.E, et al Metabolism 43:836-841, 1994

Control Diet Exercise Diet & Exercise
808284868890929496
Body
Wei
ght (
kg)
Control Diet Exercise Diet & Exercise
20
21
22
23
24
25
26
Perc
ent F
at (%
)
Baseline
1 year
Control Diet Exercise Diet & Exercise
0
2
4
6
8
10
12
Lepti
n (n
g/m
L)
Control Diet Exercise Diet & Exercise
02468
10121416
Adi
pone
ctin
(ug/
mL)
* ** *
**
*

Control Diet Exercise Diet & Exercise
808284868890929496
Body
Wei
ght (
kg)
Control Diet Exercise Diet & Exercise
20
21
22
23
24
25
26
Perc
ent F
at (%
)
Baseline
1 year
Control Diet Exercise Diet & Ex0
0.51
1.52
2.53
3.54
IL-6
(pg/
mL)
Control Diet Exercise Diet & Exercise
0
1
2
3
4
5
6
TNF-
α (p
g/m
L)
*interaction

Control Diet Exercise Diet & Exercise
0123456789
Resi
stin
(ng/
mL)
Control Diet Exercise Diet & Exercise
0
5
10
15
20
25
30
PAI-1
(U/m
L)
Control Diet Exercise Diet & Exercise
808284868890929496
Body
Wei
ght (
kg)
Control Diet Exercise Diet & Exercise
20
21
22
23
24
25
26
Perc
ent F
at (%
)
Baseline
1 year

Control Diet Exercise Diet & Ex0
0.51
1.52
2.53
3.54
IL-6
(pg/
mL)
Control Diet Exercise Diet & Exercise
0
2
4
6
8
10
12Le
ptin
(ng/
mL)
Control Diet Exercise Diet & Exercise
02468
10121416
Adi
pone
ctin
(ug/
mL)
Control Diet Exercise Diet & Exercise
0
1
2
3
4
5
6
TNF-
α (p
g/m
L)