Embed Size (px)
Citation preview

/N-Q5 -c&
SAILPLANE GLIDE PERFORMANCE AND CONTROL USING @ g S 7
FIXED AND ARTICULATING WINGLETS
A Thesis
by
JAMES DAVID COLLING
Submitted to the Office of Graduate Studies of Texas A&M University
in partial fulfillment of the requirement for the degree of
MASTER OF SCIENCE
May 1995
Major Subject: Aerospace College of Engineering
(NASA-CR-198579) SAILPLANE G L I D E PERFORNANCE AND CONTROL USING FIXED AND ARTICULATING WINGLETS M.S. Thesis (Texas At+ ! Univ . ) 100 p
SAEPLANE GLIDE PERFORMANCE AND CONTROL USING
FIXED AND ARTICULATING WTNGLETS
A Thesis
by
J M S DAVID COLLING
Submitted to Texas A&M University in partial fulfillment of the requirements
for the degree of
MASTER OF SCIENCE
Approved as to style and content by:
Leland A. Carlson XL/\?W,.\ c @LL
Thomas C. Pollock (Chairman of Committee) (Member)
&&-/H& ~ a v i & ~ . Rhode
k~9_/7~'6/ Donald T Ward
(Member) (Head of Department)
May 1995
Major Subject: Aerospace College of Engineering

a, S X
'd
3
C"
m
0
C-'
a
24 3
9 C-' a, 3
bn
C
'5 a, S C
0
G a
a
2 d ch
a,
8, 4
'n.
N
N
0
C-'
0
E
0
&
3, C 2 m
a, 4
M
9

iv
moment of the model are presented. Oil flows were used on the wing model with the fixed
geometry winglet and the standard wing tip to visualize flow directions and areas of
boundary layer transition.
A cant angle of 25 degrees and a toe-out angle of 2.5 degrees provided an optimal
increase in wing performance for the cant and toe angles tested. Maximum performance
was obtained when the winglet rudder remained in the neutral position of zero degrees. By
varying the cant, toe, and rudder angles from their optimized positions, wing performance
decreases. Although the winglet rudder proved to be more effective in increasing the
yawing moment compared to varying the cant and toe angles, the amount of increased
yawing moment was insignificant when compared to that produced by the vertical tail. A
rudder on the winglet was detennined to be ineffective for providing additional yaw
control.

v
ACKNOWLEDGMENT
The author would like to thank the committee members, Dr. Thomas C. Pollock,
Dr. David L. Rhode, and especially Dr. Leland A. Carlson for their guidance and assistance
and to Dr. Kenneth D. Korkan, who was the original advisor on this project. Special
appreciation is given to Mr. Oran W. Nicks for his guidance and assistance during the
investigation. Thanks are also given to Mr. Greg G. Steen, and all the Texas A&M wind
tunnel staff for their assistance. The author would like to thank Mr. Peter C. Masak for
allowing the use of his winglet design for my research and for sponsoring the construction
of the wind tunnel model. I would like to thank Dr. Michael Card for sponsoring this
research from NASA Langely Research Center through grant number NAG 1-1 522.


r' C'l
si 3
bn
3 b
-5
-d
2 C,
a, - b8 C
2 06
00
C'l
ui w
3
2 2 r: i
B C, C !i
2 P
, rn
0
3
9 w
8 v a
8 a,
4-c 0
C
0
.3
C
.3
C
%
a
o;
Y---
Ti-
%
* 2
'n
*. 0
3
I1 c' 0
'? C
\1
I I 8
PI
Ti-

5'
ii: 5
67 g. 3
0
'-'?
4 5- 5
!2 2 2
2. a
0
3
cn E g. s
? B 0
'-'? 5 3
as,.
CD d 2' CD 2 2 C
A
F
m
+ 5
F
3.
0
3 On,
4
% 5
E
3
S 2
z.
'd s ? m
m 4 ? B 0
2 5'
as,. a i?
2 2 m
z P 5
2,
E
ti' g. 3
0 2 5'
as,. a T 8
m 4 F !i
9' Li 5'
rt: r z 0"
\O
00
Cd 8 CD
3
!+
2! P 5
m E E' g. 3
0 2 5.
as,. a '-0 - 8 CA
6 CD E
a
0 r 3 5.
% cn
CD a
rt: g . 3
z P 5
m E 6.
8 tt
0 2 5.
as,. a C
A
F: 3.
0
3 F
ci
?
Q I I 4
Cn 0
10 I1
C-L
0
00
wl $ wl
r-L
z 0 < 5 B g P, g.
tt
0 2 5'
as,. a cn
C
0 g. 3 g 0
Q I I 0
0
10
II C
-L
0
00
wl $ P
4


Figure
38. Effects of Cant Angle on the Drag Polar, Lift Curve, Side Force Curve,
and Pitching Moment Coefficients at a Toe-Out Angle of 2.5 Degrees.
Reynolds Number 5.2 x lo5 ft-'. . . . . . . . . . . . . . . . . . . . . . . . . . . . . . . . . . 67
Effects of Toe-Out Angle on the Drag Polar, Lift Curve, Side Force Curve,
and Pitching Moment Coefficients at a Cant Angle of 85 Degrees.
~ e ~ n o l d s umber 5.2 x lo5 ft-'. . . . . . . . . . . . . . . . . . . . . . . . . . . . . . . 68
Effects of Winglet Rudder Angle on the Drag Polar, Lift Curve, Side Force
Curve, and Pitching Moment Coefficients at a Cant Angle of 65 Degrees,
Toe-Out Angle of 2.5 Degrees. Reynolds Number 5.2 x lo5 R'. . . . . . . . 69
Effects of Winglet Rudder Angle on the Drag Polar, Lift Curve, Side Force
Curve, and Pitching Moment Coefficients at a Cant Angle of 85 Degrees,
Toe-Out Angle of 2.5 Degrees. Reynolds Number 5.2 x lo5 ft-'. . . . . . 70
Effects of Cant Angle on the Lift to Drag Ratio at a Toe-Out Angle of
Page
2.5 Degrees. Reynolds Number 5.2 x 1 O5 fi". . . . . . . . . . . . . . . . . . . . . . . 7 1
Effects of Toe-Out Angle on the Lift to Drag Ratio at a Cant Angle of
85 Degrees. Reynolds Number 5.2 x lo5 ft-'. . . . . . . . . . . . . . . . . . . . .
Effects of Winglet Rudder Angle on the Lift to Drag Ratio at a Cant
Angle of 65 Degrees and Toe-Out angle 2.5 Degrees.
. . . . . . . . . . . . . . . . . . . . . . . . 73 . . Reynolds Nuinber 5.2 x lo5 fi-'.

Figure
45. Effects of Winglet Rudder Angle on the Lift to Drag Ratio at a Cant
Angle of 85 Degrees and Toe-Out angle 2.5 Degrees.
Reynolds Number 5.2 x lo5 ft-'. . . .
46. Effects of Cant Angle on the Climb Parameter at a Toe-Out Angle of
Page
2.5 Degrees. Reynolds Number 5.2 x lo5 ft".. . . . . . . . . . . . . . . . . . . . . . 75
47. Effects of Toe-Out Angle on the Climb Parameter at a Cant Angle of
85 Degrees. Reynolds Number 5.2 x lo5 ft-'. . . . . . . . . . . . . . . . . . . . . . . 76
48. Effects of Winglet Rudder Angle on the Climb Parameter.
Cant Angle 65 Degrees. Toe-Out angle 2.5 Degrees.
Reynolds Number 5.2 x lo5 fie'. . . .
49. Effects of Winglet Rudder Angle on the Climb Parameter.
Cant Angle 85 Degrees. Toe-Out angle 2.5 Degrees.
. . . . . . . . . . . . . . . . . . . . . . . ~ e ~ n o l d s umber 5.2 x 1 o5 fl-' .
50. Effects of Cant Angle on the Rolling Moment.
. . Toe-Out Angle 2.5 Degrees. Reynolds Number 5.2 x lo5 ft-'.
5 1 . Effects of Toe-Out Angle on the Rolling Moment.
. . . Cant Angle 85 Degrees. Reynolds Number 5.2 x lo5 fY1.
52. Effects of Winglet Rudder Angle on the Rolling Moment. Cant Angle
65 Degrees. Toe-Out angle 2.5 Degrees.
Reynolds Number 5.2 x lo5 ft-'. . . . . . . . . . . . . . . . . . .

xii
Figure
53. Effects of Winglet Rudder Angle on the Rolling Moment. Cant Angle
85 Degrees. Toe-Out angle 2.5 Degrees.
Reynolds Number 5.2 x 10' ft-'. . . . . . . . . . . . . . . . . . . . . . . . . . . . . . . . . . 82
54. Effects of Cant Angle on the Yawing Moment at a Toe-Out Angle of
2.5 Degrees. Reynolds Number 5.2 x 10' f t ' . . . . . . . . . . . . . . . . . . . . . . . 83
55. Effects of Toe-Out Angle on the Yawing Moment.
Cant Angle 85 Degrees. Reynolds Number 5.2 x 10' ft-'. . . . . . . . . . . . . . 84
56. Effects of Winglet Rudder Angle on the Yawing Moment.
Cant Angle 65 Degrees. Toe-Out angle 2.5 Degrees.
Reynolds Number 5.2 x 10' ft-'. . . . . . . . . . . . . . . . . . . . . . . . . . . . . . . . . . 85
57. Effects of Winglet Rudder Angle on the Yawing Moment.
Cant Angle 85 Degrees. Toe-Out angle 2.5 Degrees.
Reynolds Nuinber 5.2 x 10' ft-'. . . . . . . . . . . . . . . . . . . . . . . . . . . .
Page

NOMENCLATURE
Drag Coefficient
Lift Coefficient
Cliinb Parameter
Pitching Moment Coefficient
Yawing Moment Coefficient
Side Force Coefficient
Foot
Pounds Force
Lift to Drag Ratio
Miles per Hour, Statute
Power
Dynamic Pressure
Rate of Climb
Wing Surface Area
Weight
Angle of attack
Propeller Efficiency

1
INTRODUCTION
Winglets are vertically mounted, cambered wing extensions that are attached at the
wing tips of aircraft to provide aerodynamic performance enhancements such as llnpaoved
lift to drag ratio. Figure I shows a high performance sailplane, called a Schreder W-18,
with winglets installed. An experimental investigation was conducted to determine
whether the glide performance of high performance sailplanes can be further i~nproved
over that of fixed geometry winglets by controlling the toe, cant, and winglet rudder angles
in flight. Another purpose of this investigation was to study the effect of asymmetric
control of the winglets on the yawing moment of the aircraft.
Modern high performance sailplane designs achieve lift to drag ratios (LD) which
range from 4011 to 6011. These glide ratios are accomplished through the extensive use s f
composite materials and natural laminar flow airfoils. For the fifteen-ineter racing class of
sailplanes, the L/D will typically range from 4211 at the best L/D speed of 70 lnph to 3011
at a cruise speed of 105 mph. At a gross weight of 1188 lbs, the drag of the sailplane at the
best L/D speed would amount to 28 lbs. Since the total drag of a sailplane is small
compared to the lift, a small decrease in the amount of drag can produce a large increase in
the lift to drag ratio. Methods of obtaining drag reduction include sealing all gaps along
the control surfaces, sealing pushrod exits, and removing the roughness and waviness from
the wing surface. Winglets have been shown both in flight testing and wind tunnel testing
to improve the glide ratio and the cliinb rate.
Journal Model is the AIAA Journal ofAircrufi.

9 Ei fir
, V) 5 a
0 2.
;. 09 % P CD I?
2
0 5 a
w 0
VI a a
3 E 3 0
3 P El P, F
4
0 a P, i.
g. a
0 e 3 5 6.
3
re
5'
m E.
C
'Et,
P, s V) e.
m
P,
0
0 8 '6,
t;' tr a
5
Y
0, 5.
Ef. 1
W 5'
3.
;. W 2.
1 8 CD 8 0 5
z'
a
B k 3
5'
fir, -8 a E
g . s 0 E CD
'b, z' P, 1 C.. . z.
2.
ftl. 8
E 8
P, 3 5' 5
fir, 5.
!= 4
%
w 0 0
0
3' a 5
'4
D,

3
raised to the three halves power.
The geometry of winglets is defined by cant angle, toe angle, sweep angle, tw~st
distribution, and airfoil selection. Cant angle is defined as the angle of the winglet surface
from the vertical axis. Figure 3 shows the geometry which defines the winglet and the
dimensions of the fixed geometry winglet used for the investigation. Proper design of
winglets can provide an increase in the aerodynamic efficiency of aircraft by reduclng the
lift induced drag of the wing 2-3. An inflow of air is created at the wing tip by a wlng tip
vortex, as shown in Figure 4, which changes the relative angle of attack of the winglet
airfoil with respect to the freestream airflow. As a result, a force directed toward the
fuselage and in the forward direction is produced by the winglet as shown in Flgure 5.
This "thrust" component of the winglet force accounts for part of the total drag reduction
of the aircraft 4. With the installation of winglets, the wing tip boundary condition no
longer requires that the lift be reduced to zero at the wing tip. Thus, as portrayed in
Figure 6, the lift distribution of the wing can be changed such that the same amount of lift
will be produced at a lower angle of attack, which reduces the wing induced drag thus
reducing the total drag of the aircraft as described by Nicks '.
For this investigation, two separate wind tunnel tests were conducted. The first test
studied the general behavior of fixed geometry winglets for sailplanes, and performance
coinparisons were made to a standard sailplane wing tip. The fixed geometry winglet and
the standard wing tip tested are shown in Figure 7. Some tests were also conducted
without a contoured wing tip to provide a baseline comparison for future testing.

P).
0
5
Eil, 5-
% 62
CD "
5"
2
-. g
V,
$
u
c
X.
" 2 a
q
9.
3
3
4
P,
3
iff a a "
5. 8
5
@ .
a
""3
4.
r+
3
u!.
4
i?
B-r 5
0
0
0
r 5
6.
CD
3
rr
0 2
k?
E 5'
09
w.
V, 5 m E a
rr
5 9 w
.
V,
P,
0
0 2 6
0
3
fi:
3
Oc,
iff e.
$ g.
3 5' 4 Fi 0 5
3 9
5'
9 CD
P,
V,
CD a g . P CD a 4.
3
U!
4
V, X 0 8 CD 5 V, CD 3 0 8.
s -.
5 3- O
c, iff a
$ g.
3 8
0
P, 5i CD

6
wing, as shown in Figure 9. True cant angle would therefore be 90 degrees minus the
referenced cant angle. Cant angles used for this investigation consisted of 50, 65, and 85
degrees froin horizontal measured from top surface of the wing model. For the remainder
of this investigation the cant angle will be defined as that measured from the horizontal
axis.
Due to unforeseen structural problems with the articulating winglet mechanism, all
the test cases involving toe-out angles other than the neutral position of 2.5 degrees were
conducted at a cant angle of 85 degrees. At the 85 degree position, the winglet mechanism
was against its physical stop which prevented undue deflection of the winglet. For toe
angles near the neutral position, the winglet could be forced to remain in its current
position at any cant angle by using tape. Thus, to prevent excessive deflections, the wind
tunnel dynamic pressure was limited to 8 Ib/f$ for the duration of the test.


5 2 E 2 0
=t e 5 9 6.
z 5
Y
rC
tt
CD 9. - 5 El- 3
3 P, E
3
09
5 & E; 9
CD $
5 z.
g.
3 B.
"2
5
5
5' B 8


10
backflow was present on the aileron top surface during testing. Again, the streamlines at
the wing tip were measured to be at an inward flow angle of 15 degrees.
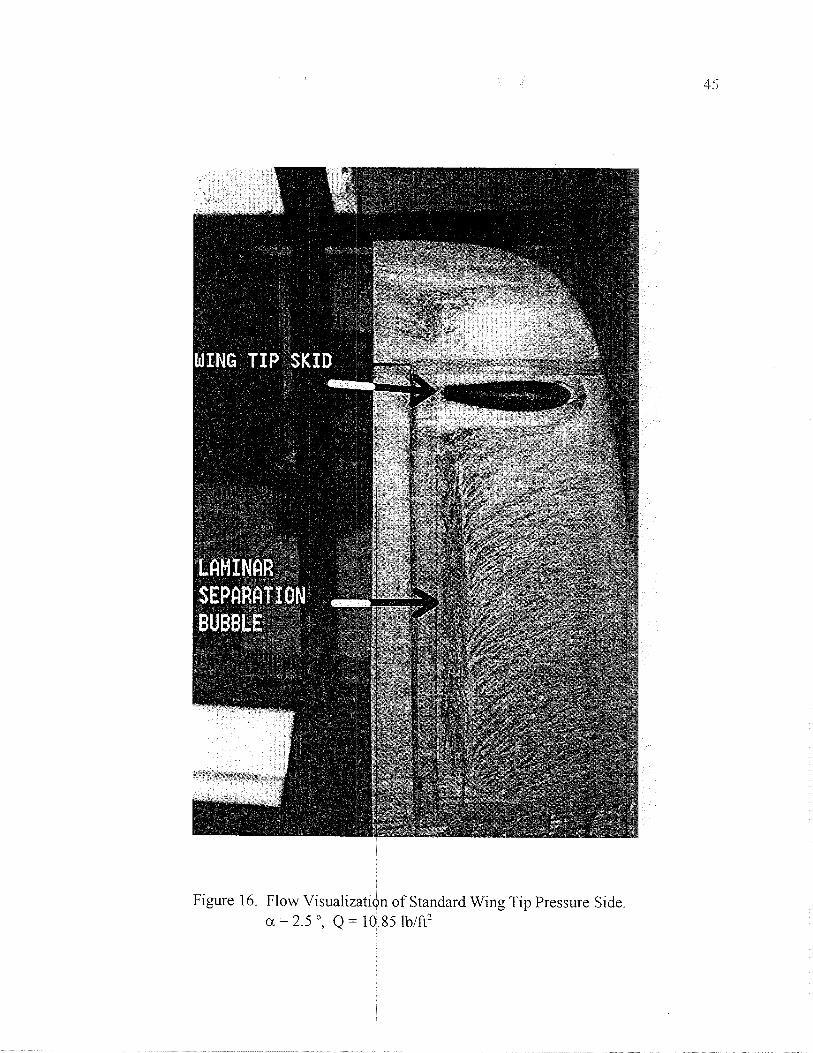
On the bottom surface or pressure side of the wing, transition was measured to be
at 63 percent of chord when at an angle of attack of 2.5 degrees and a dynamic pressure of
10.85 lb/ft2, Figure 16. A strong laminar separation bubble, characterized by brush marks
from the application of the oil remaining undisturbed during the duration of the test, was
present on the bottom surface for all cases at a dynamic pressure of 10.85 lbIft2. When the
angle of attack was increased, the point of transition moved further back by just a few
percentage points. A wing tip skid was installed on the lower surface of the wind tunnel
model to resemble the typical wing tip configuration found on most sailplanes. This tip
skid appeared to create a region of flow which resembles a junction vortex. At a higher
Reynolds number with a Q of 40.6 lbIft2, the laminar separation bubble on the bottom
surface was no longer present, Figure 17. The point of transition appeared to move further
back on the pressure side although the presence of numerous turbulent wedges, which are
highlighted in Figure 17, made accurate measurement difficult.
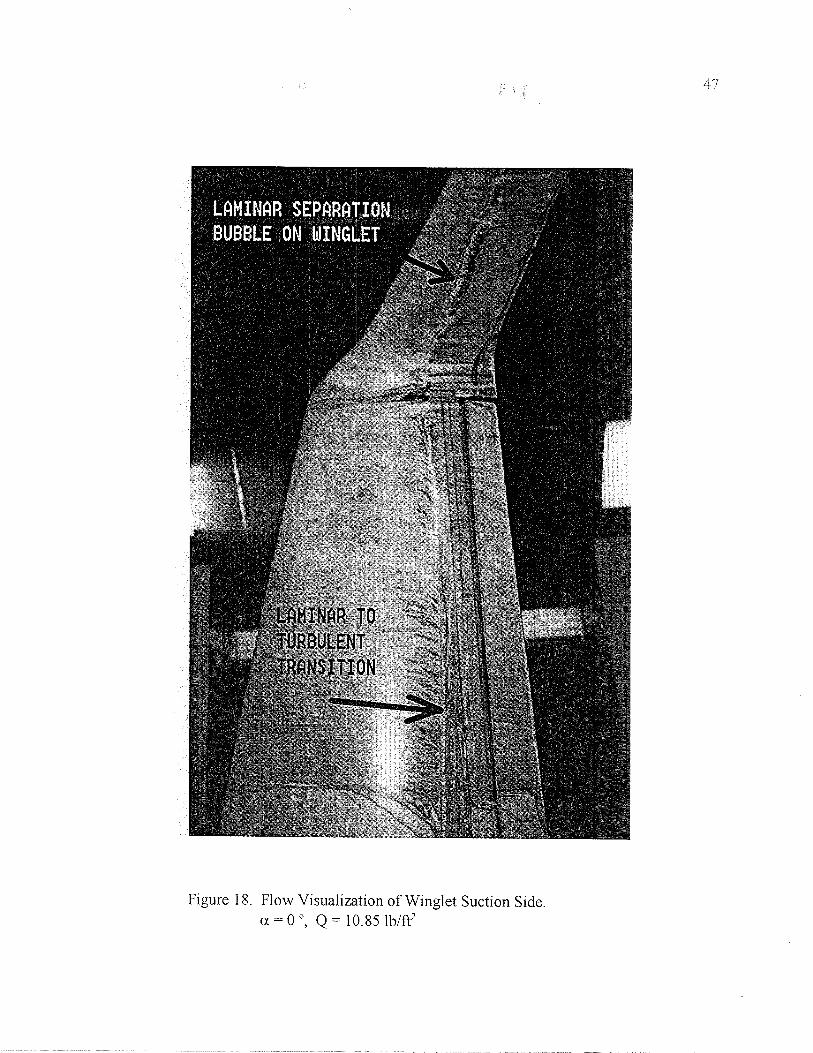
A similar series of flow visualization tests was conducted for the fixed geometry
winglet with similar results. At an angle of attack of 0 degrees and a dynamic pressure of
10.85 lb/ft2, boundary-layer transition was measured at 70 percent of chord on the suction
side of the wing as shown in Figure 18. A laminar separation bubble was present on the
winglet surface in which transition began at 53 percent of chord at the root of the winglet
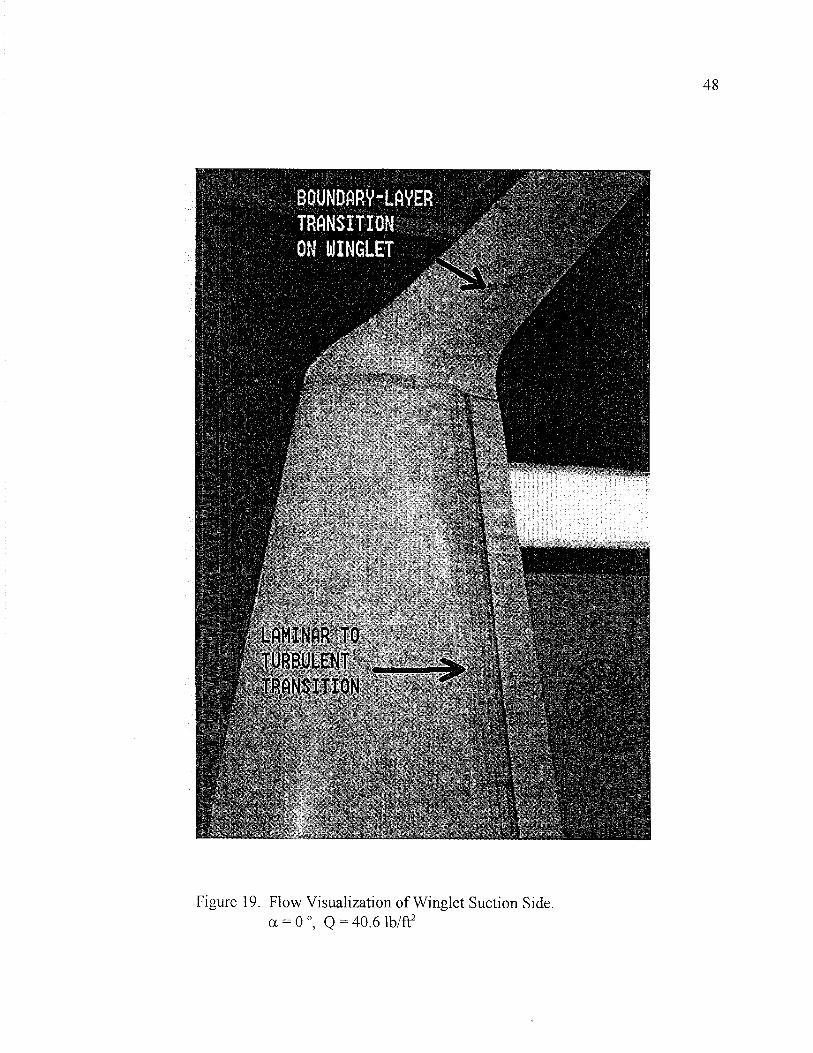
and 40 percent of chord at the winglet tip. For the same configuration at a higher dynamic
pressure of 40.6 lbIft2, there was no longer a laminar separation bubble present on the

11
winglet, Figure 19. Boundary-layer transition on the wing was measured at 75 percent of
chord on the wing at the higher Reynolds number.
At an angle of attack of 2.5 degrees and a dynamic pressure of 10.85 lb/ft2, the
boundary-layer transition location on the wing top surface moved forward to 66 percent of
chord as shown in Figure 20. This transition location was further forward than that of the
standard wing tip at the same conditions which indicates an increased lift for the same
angle of attack. Numerous turbulent wedges were present on the upper surface of the wing
and are highlighted. The laminar separation bubbles present on the suction side of the
wing and winglet are indicated by the black arrows. Transition on the suction side of the
winglet moved forward to 50 percent at the root and 35 percent at the winglet tip.
At a 5 degree angle of attack, boundary layer transition on the wing was around 50
percent of chord as shown in Figure 2 1. The boundary-layer transition on the winglet
moved forward to 46 percent at the root and 25 percent at the winglet tip.
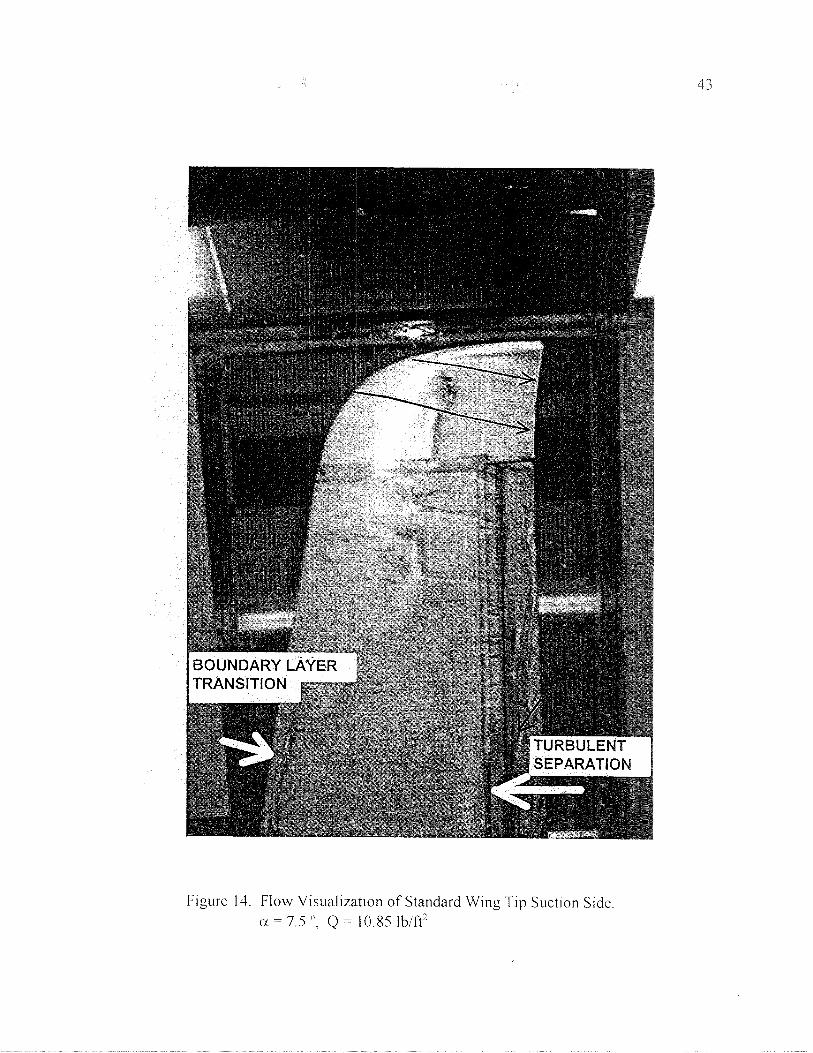
When the angle of attack was increased to 7.5 degrees, the point of boundary-layer
transition moved to the leading-edge of the wing as shown in Figure 22. Near the junction
of the wing and winglet, the point of transition moved back to 50 percent of chord.
Premature turbulent separation occurred before the aileron along the trailing-edge ofahe
wing.
At a 10 degree angle of attack, turbulent separation was more pronounced and
backflow was visible on the aileron top surface during testing as shown in Figure 23.
Transition on the winglet surface appeared to stabilize at 20 percent of chord.
On the bottom surface of the wing at an angle of attack of 0 degrees, the point of
12
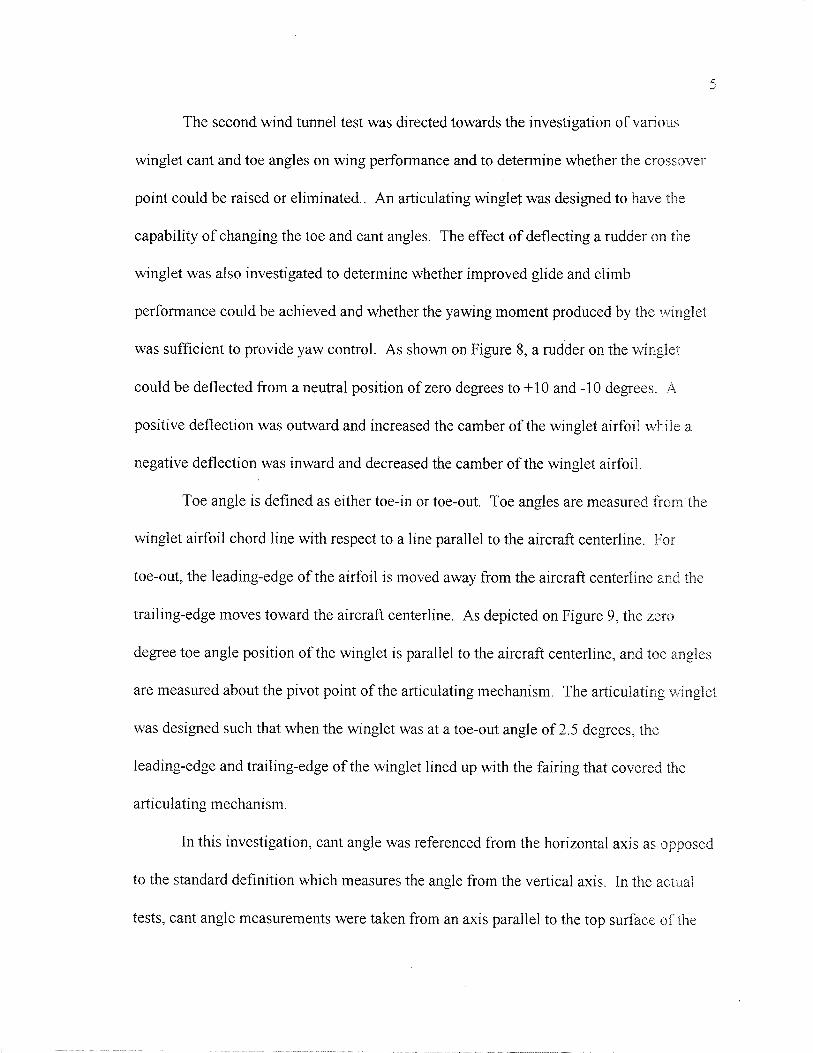
transition was a fairly constant 67 percent of chord, Figure 24. With increased angle of
attack, the point of transition moved back only by a few percentage points.
Laminar separation on the pressure side of the winglet was measured at 90 percent
of chord at an angle of attack of 2.5 degrees and a dynamic pressure of 10.85 lbIft2 as
shown in Figure 25. When the angle of attack was increased to 10 degrees, the laminar
separation point on the winglet moved back to very near the trailing-edge as shown in
Figure 26. The surface streamlines at the junction of the wing and winglet can be seen to
wrap around on the bottom surface as they apparently flow from the junction vortex
created by the wing tip skid as mentioned previously. With the installation of a turbulator
strip on pressure side of the winglet, the laminar boundary-layer was tripped to turbulent in
a controlled manner before separation occurred as shown in Figure 27. The installation of
a turbulator strip ahead of the laminar separation bubble on the suction side of the winglet
tripped the laminar boundary-layer to turbulent before a laminar separation bubble could
be formed as shown in Figure 28. The effects on the performance of the winglet with
turbulators installed were measured during the force and moment balance data acquisition
phase of the wind tunnel testing.

a, a 3 8 id
-2 t: &
2 m
.3
B
3
- cd +-' 2 . 3
z .3 I-. w
LO
8 C,
cd 3
I
-e I
+-' C,
9 C,
6)
3
M
.$ 2 C-c
2 +-' C
s i% 5 3 4
TeS Q
) C
-, (d
.--. 1
-e 3
C,
0
S
z 0
C,
a 2
I-.
& 2 V
) .3
LO
8 w cd 3
I
5 C-' 6)
S
S '5 +-'
6)
3
2 3 6
)
G 3 2
2 3 C
J
6)
3
2 .5 F: 8 3
0
cd m
. ... +
0
d
a
m
3
F-+ 4
a, d
M
C
3 6)
S I-.
42 C
a
%, 41
0
6)
B P 2 2
3
cd LO .3
LO
B G 0
S C
.3
B a 5 3
0
C
+4 c; 6
)
3
2
4
6)
w
i;D
C
'5 6
)
S I-.
42 C,
E .3
0
E 6
)
3 c
. 3
3
6)
2 C,
cd C,
0
C
m
'3
6)
,2
42 4
.3
LO 41
0
+-' C
6)
. 3
4 6)
3 6)
S 2
42 2 6
) .-c t-.
i-4
c
'2 $4 3
E= a,
$ CJ
0
P
2 2 . 3
2 2 0
0
I-.
G
- 3 % 3
m
.3
a
% bD
C
3 6
)
S
h
0
3 5 41 0
6)
3
M
C
cd 6
)
S C
13
LO
8l $ -5
6
b==
.A 0
2 4-1 0
6) 3
2' cd 6)
E
2 0
S
I-.
a 2' .3
3 6)
S
41
0
5
d
6)
S 2 2 0 C . - 0
C,
a
5 w LO C,
6)
3
M
C
z

14
visualization section, at an angle of attack of 7.5 degrees, the boundary-layer transition
location moves from 50 percent chord to the leading-edge as a result of a leading-edge
suction peak. Above this angle of attack, the lift curve is that of an airfoil having turbulent
Row on the top surface of the wing. At higher angles of attack, premature separation of
the turbulent boundary-layer was apparent near the trailing edge. This separation resulted
in a loss of lift and the onset of stall and corresponds to angle of attack where the natural
laminar flow airfoil was operating well outside of its design condition 9.
The shift of the boundary-layer transition point to the leading-edge resulted in the
pitching moment coefficient suddenly becoming less negative. Pitching moment was
higher in magnitude, i.e. more negative, with winglets than with the standard wing tip.
The installation of turbulators on the winglet changed the pitching moment to values
between that of the standard wing tip and the clean winglet.
The side force produced by the winglet increased as the angle of attack of the wing
was increased, and the winglet began to stall when the angle of attack of the wing was 7.5
degrees. A greater amount of side force was produced with the clean winglet as opposed
to the turbulated winglet.
From the drag polar it can be seen that the shift in the boundary-layer transition
location to the leading-edge corresponds to an increase in the drag coefficient. The drag
polar also indicates that turbulators installed on the winglets further reduces the drag
coefficient at C, values above 0.25.
By increasing the wind tunnel dynamic pressure to a Q of 20.8 lbIft2, which
corresponds to a Reynolds number of 8.2 x 10' ft-', no significant change was noticeable in


16
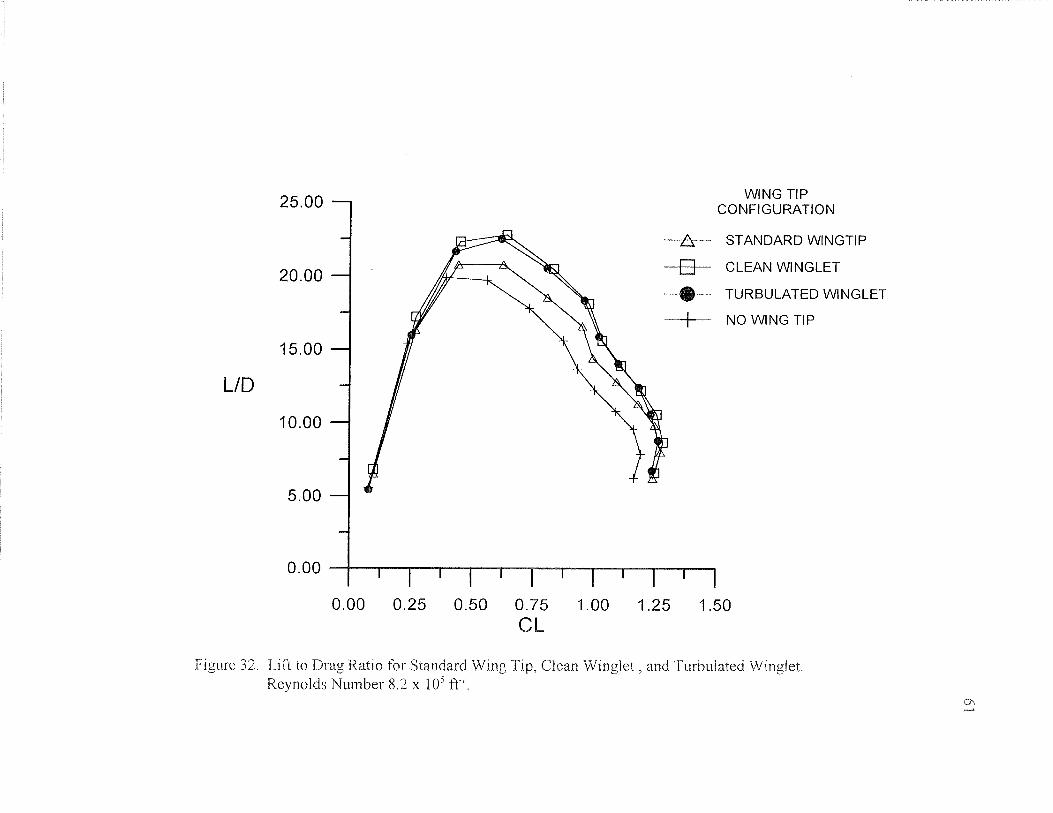
clean winglet at this dynamic pressure. At a dynamic pressure of 20.8 lblf?, as shown on
Figure 32, the L/D increased for the standard wing tip and the winglet from that of the
lower Q value. The clean winglet provided the maximum improvement over the standard
wing tip although the turbulated winglet provided almost the same benefit. Even though
the addition of turbulators on the winglet produces a small amount of extra drag at the
higher Reynolds number. Note that at a higher dynamic pressure, the laminar separation
bubble on the suction side of the winglet and the laminar separation on the pressure side
no longer occurred. The data shows that the clean winglet provides a 9.7 percent
i~nprovement while the turbulated winglet provides an improvement of 8.3 percent. When
no wing tip was installed, the maximum L/D was 4.2 percent less with the standard wing
tip. In all cases, the maximum L/D of the model was achieved at a C, around 0.625.
The climb parameter, ~,3/2/C,, was used to measure the relative change in the
climb rate between the different wing tip configurations. As mentioned above, a direct
comparison in percentage differences in the climb parameter cannot be used to determine
the effects on full-scale aircraft. General trends can however be made. In Figure 33, the
climb parameter is plotted against the lift coefficient for a dynamic pressure of 10.85 lblf?.
The nlaximuin value of climb rate parameter was achieved at a C, of 0.83. Above a C, of
1.0, the climb rate parameter suddenly decreased in value. This region corresponded to the
boundary-layer transition location moving to the leading-edge of the wing. Overall, for
this case, the turbulated winglet provided the maximum gain in the climb parameter with
an 1 I percent increase over the standard wing tip value. The clean winglet, however,
provided a six percent improvement.

Q)
e
Ti-
m
K . i
Fr, C
0
0
-6, 3
3- 8
09 0
rn &
l 0
S 3
St E 2 m
k 0
.3
g a
& %
I 2 6
)
S
2

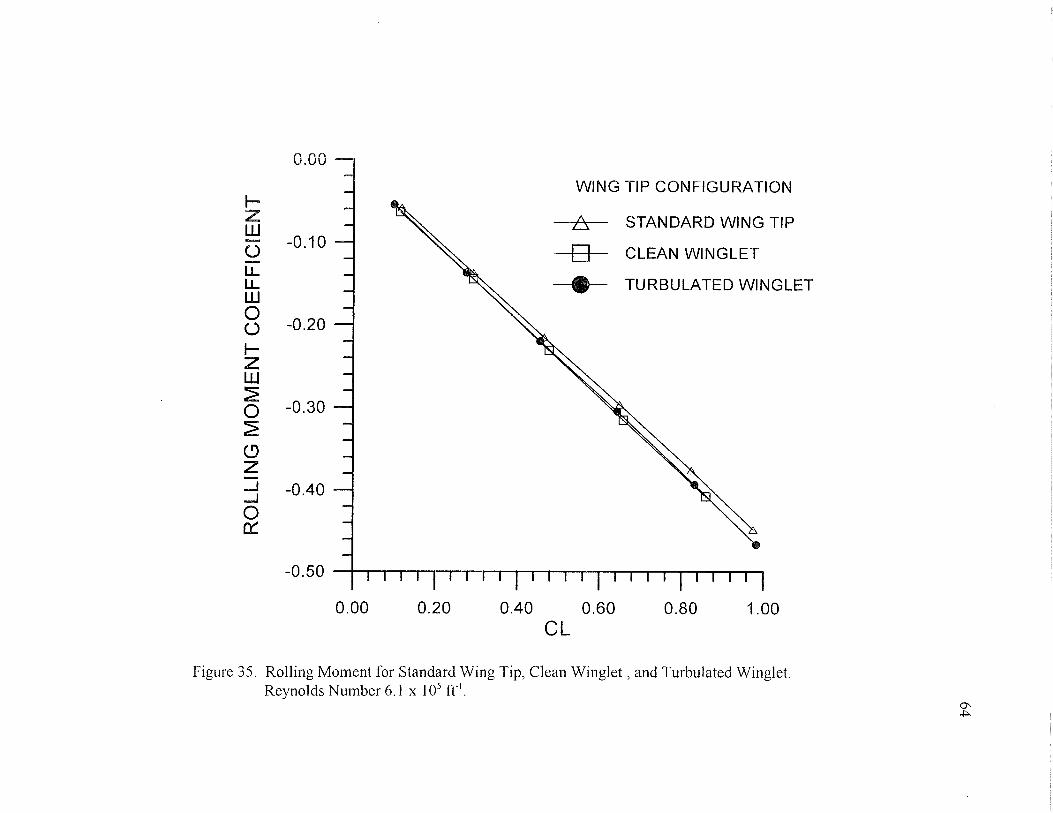
18
variation with lift coefficient was identical to that of the 10.8 lb/@ case. For the wing
model without a wing tip installed, the rolling moment was at the minimum.

20
same. However, the 50 degree cant angle produced more drag than the other two cases
below a C, of 1 .O. Above a C, of 1 .O, the 50 degree cant angle case produced the same
drag as the 65 degree case.
There were no significant differences in the lift curves between the different cant
angles until the higher C, values were reached, but near stall, the 50 degree cant angle
produced more lift than the 85 degree case. Maximum side force was produced at a cant
angle of 85 degrees, and the minimum amount of side force was produced by the 50 degree
cant angle.
Cant angle also had an effect on pitching moment at C, values above 1 .O. As with
the fixed geometry winglet test, the boundary-layer transition point moved to the
leading-edge at an angle of attack of 7.5 degrees and a lift coefficient of around 1 .O.
Consequently, above an angle of attack of 7.5 degrees, the pitching moment was lower in
magnitude with the 85 degree cant angle and higher in magnitude with the 50 degree cant
angle. Below this angle of attack, the pitching moment was nearly identical for all three
cant angles tested.
In Figure 39, the effects of toe-out angle on the drag polar, lift curve, side force,
and pitching inoinent are presented for a cant angle of 85 degrees. Minimum drag was
produced with a toe-out angle of 2.5 degrees. This value corresponds to the neutral toe
angle position of the articulating winglet. The next lowest value of drag was produced
with a toe-out angle of 5 degrees followed by 0 degree case. The 22.5 degree toe-out angle
produced the highest amount of drag at the lower C , values. However, at C , values above
0.5, the 22.5 degree toe-out angle case yielded drags in the same range as the other toe-out

0
- +-J
00
0
C
cd g
ii
0
3
6)
-
S
9 C
,
m
cd a,
a, -%
-8 0
3
'f? .s :
m
0
C,
4
5 E
.+
C
'2 0"
d
5 bn .3 C
r, C
. +
E: $ '3
bn m
.3
-5 2 3 $ 0
6)
3
an 9 +-'
9 0
a,
& a, Tf 'n
'Q 6)
S 5
Cr,
v; a,
C 6) a
'n.
c-4 b
0


23
The effects of winglet toe-out angle on the lift to drag ratio for a cant angle of 85
degrees is shown in Figure 43. Here, the maximum lift to drag ratio was achieved when
the toe-out angle was in the neutral position of 2.5 degrees, and the next highest L/D was
obtained using a toe-out angle of 5 degrees followed by 0 degrees. A toe-out angle of 12 5
degrees provided the minimum L/D for the cant angles presented.
As shown on Figure 43, at a cant angle of 65 degrees and a toe-out angle of 2 5
degrees, the deflection of the winglet rudder either positive or negative reduced the
maximum L/D. The lowest L/D for the winglet was obtained when the winglet rudder was
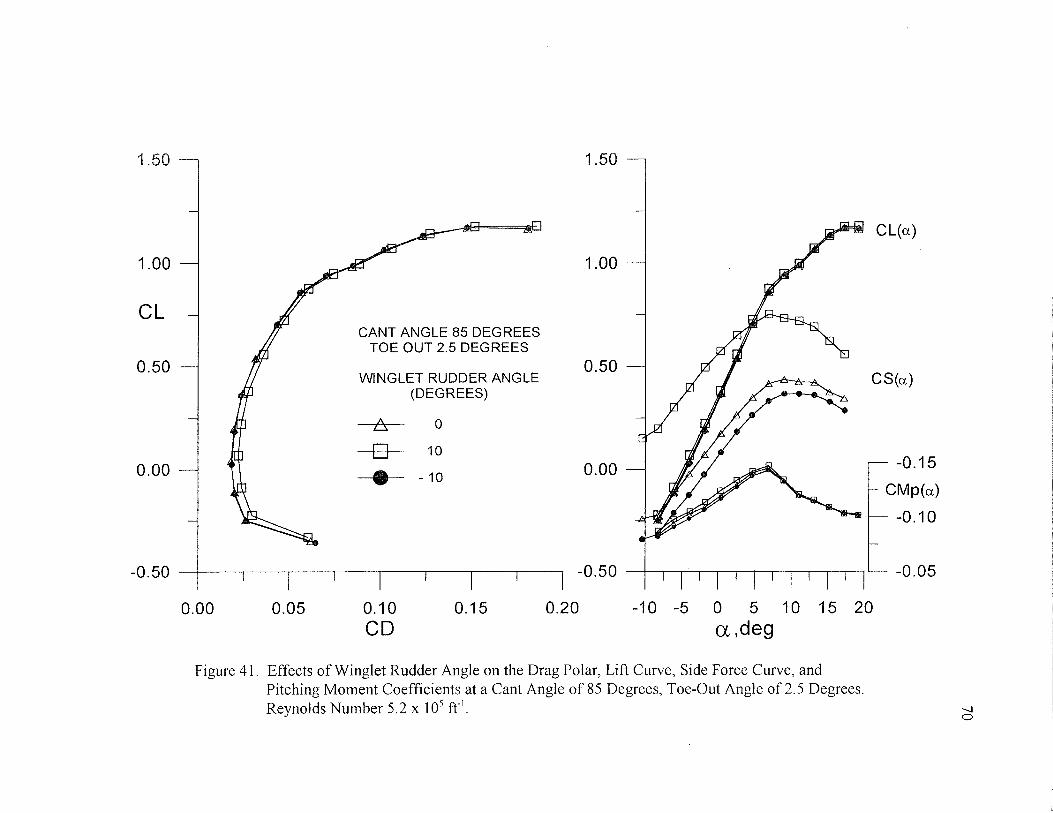
reflexed to an angle of -10 degrees. However, as displayed on Figure 45, when the cant
angle was moved to 85 degrees, the maximum LID was equal for both the -10 and 0 degree
winglet rudder deflections. Originally this behavior was thought to be a data error because
the L/D curves were close to being the same for the two cases. However, in Figure 4 1 it
can be seen that the side force produced by the winglet with the rudder reflexed to - I0
degrees was lower than that produced when the rudder was in the neutral position of 0
degrees. For the 85 degree cant angle case, the rudder deflections had no significant effect
on the L/D above a C, of 0.825.
A comparison of the climb parameter at the different winglet cant angles, as plotted
in Figure 46, reveals that a cant angle of 65 degrees produced the maximum cliinb
parameter. Below a C, of 0.55, the climb parameter for the 85 degree cant angle was
equal to that of the 65 degree case, and above a C, of 0.825, the 50 degree cant angle
climb parameter was equal to the 65 degree case. At a C, of 0.9, which corresponds to the
large shift in boundary-layer transition point, the climb parameters for the three different

24
cant angles were nearly equal.
The effect of the winglet toe-out angle on the climb parameter for a cant angle of
85 degrees is shown in Figure 47. The results show that a maximum value of climb
parameter was obtained when the toe-out angle was in its neutral position of 2.5 degrees,
and the next highest values of climb parameter were obtained by a toe-out angle of 5
degrees followed by the 0 degree case. A toe-out angle of 12.5 degrees had the ininiinum
value of climb parameter for the winglet toe-out angles presented.
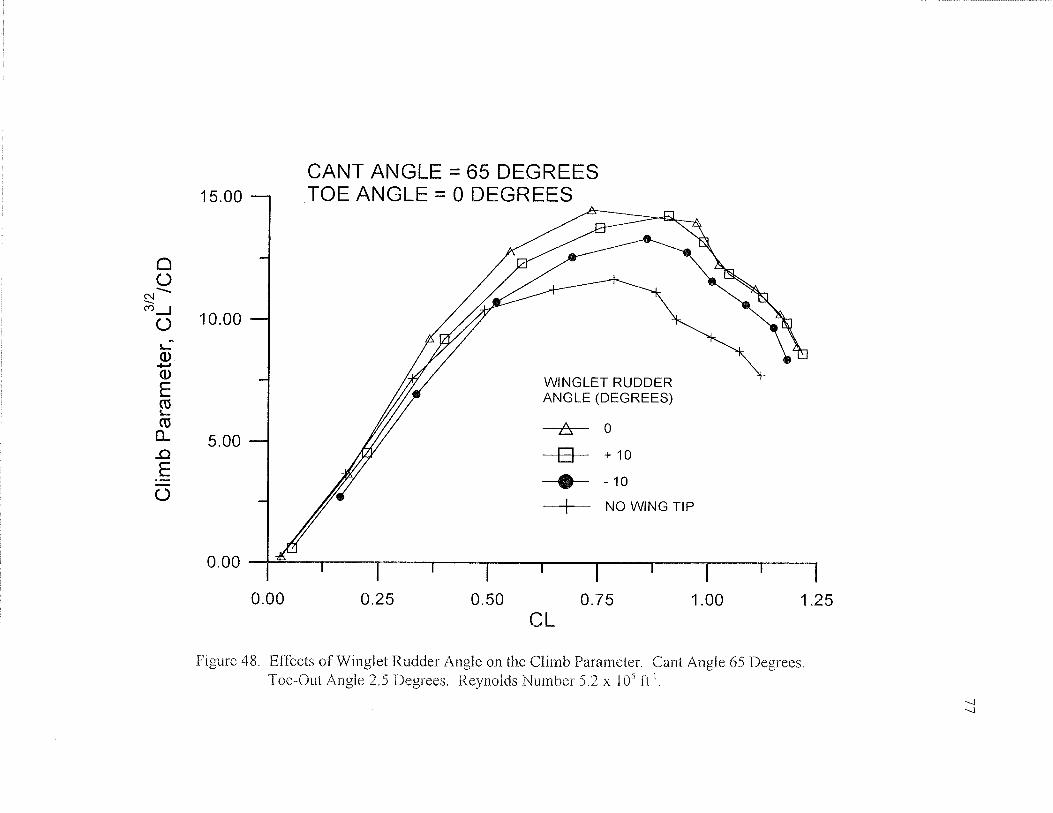
The effects of winglet rudder deflection on the climb parameter for a cant angle of
65 degrees and a toe-out angle of 2.5 degrees are presented in Figure 48. The maximum
value of the climb parameter was produced with a winglet rudder in the neutral position of
0 degrees. When the winglet rudder was reflexed to an angle of -10 degrees, the climb
parameter was at the minimum value. Similar to the LID case, when the cant angle was 85
degrees, the maximum values of climb parameter were equal for the winglet rudder
positions of 0 and -10 degrees as shown in Figure 49. The lowest value of climb parameter
was obtained when the winglet rudder was at an angle of -610 degrees.
The effects of winglet cant angle on the wing rolling moment for the model are
presented in Figure 50. Very small differences in the rolling moment between the different
cant angles were observed. Higher rolling moments were produced with a cant angle of
50 degrees produced at higher values of C,, and at low values of C,, the rolling moment
was the greatest when the cant angle was 85 degrees. As portrayed on Figure 5 1, winglet
toe-out angle appeared to have little effect on the rolling moment of the model, but at the
extreme toe-out angle of 22.5 degrees the rolling moment was increased slightly. For both

2 5
a 65 degree and 85 degree cant angle, the winglet rudder provided an increased rolIlng
moment when deflected in a positive direction, this phenomena can be observed on
Figures 52-53. The rolling moment for the 0 degree and -10 degree rudder angle cases
were identical for a cant angle of 85 degrees.
The yawing moment of the model indicates which winglet configuration produced
the minimum amount of drag since this moment, measured at the base of the model, can
be resolved into a vector component of the total drag and the moment ann for which the
force vector of the drag acts. In Figure 54, the yawing moment versus C, plots for the
cant angles of 50, 65, and 85 degrees at a toe-out angle of 2.5 degrees are presented. Froin
this graph it can be seen that the 65 degree cant angle produced the lninimu~n amount of
yawing moment while the greatest amount of yawing moment was produced when the cant
angle was 50 degrees. A toe-out angle of 2.5 degrees produced the minimum amount of
yawing moment at a cant angle of 85 degrees among the various toe-out angles presented
as shown in Figure 55.
The effect of the winglet rudder on the yawing moment was studied to de te r~~~rne
whether yaw control could be achieved or supplemented. In Figures 56 and 57, the effect
on yawing moment by deflecting a winglet rudder is shown for a cant angle of 65 and 85
degrees, respectively. By defecting the rudder + 10 degrees, the yawing moment was
increased in both cases which indicated an increase in the drag produced by the wlnglet.
The winglet rudder was more effective for increasing the yawing moment as cornpared to
changing cant angle or toe-out angle. Using the data given in Figure 57, the increase In
yawing moment at the base of the model would amount for 4.7 ft*lbs when the wlnglet


2 7
SUMMARY AND CONCLUSIONS
The general behavior and effects of winglets on high perfonnance sailplane wings
has been presented. Low Reynolds number effects such as laminar separation bubbles and
laminar separation can reduce wing performance at low airspeeds. It was shown
experimentally that by tripping the laminar boundary-layer on the winglet ahead of lalninar
separation, the L/D and climb perfonnance parameters were improved at low a~rspeeds.
With increased Reynolds number, the addition of a boundary-layer trip device reduced the
performance from that of the clean winglet but still provided an improved perfonnance
over the standard wing tip. A wing without a contoured wing tip of any type provlded the
lowest performance.
By having the capability of adjusting the cant, toe, and winglet rudder angles, it
was hoped that perfonnance could have been increased over a wide range of wing lift
coefficients. Even though this goal was not realized, valuable information was gathered as
to the behavior of winglets with different winglet cant and toe-out angles. Surprisrngly,
only one optimum combination of toe-out and cant angles was obtained.
As expected the installation of winglets increased the lift coefficient of the wlng for
the same angle of attack. As the cant angle measured from the vertical axis was increased,
the lift coefficient of the wing increased as a result of the vertical lift component of the
winglet. This increased lift of the wing was accompanied by an increase in the rollarag
moment at the base of the model, as expected. However, even though the winglets
increased the wing root bending moment, it was only by a small amount compared to the
increased wing perfonnance resulted from the installation of winglets. If a wing tip

28
extension which provides the same improvement obtained with the winglet were installed,
a greater wing root bending moment would be produced due to the increased wing span.
By increasing the camber of the winglet with the deflection of a rudder, it was
originally expected that the lift of the wing would increase, thus improving the climb
parameter. Although the lift of the wing as well as the side force did increase, a
subsequent increase in the amount of drag did not yield an increase in the climb parameter.
Because of this increased drag, deflecting a rudder on the winglet had more of an effect on
increasing the yawing moment than changing either the cant or toe-out angles. Although
the winglet rudder was more effective, the additional drag and the amount of yawing
~ncnment produced, when compared with that of the vertical tail, does not justify its use.
The deflection of the winglet rudder, either positive or negative, only served to decreased
the wing perfonnance in most cases.
The fixed geometry winglet tested in the first series of wind tunnel tests provided
the maximum gain in the lift to drag ratio and the climb parameter compared to the
standard wing tip and the articulating winglet. By adjusting the cant, toe, and rudder
angles of the articulating winglet, a perfonnance gain over a wider range of lift
coefficients was not realized. Optimum performance of the articulating winglet was
provided with a cant angle of 25 degrees from the vertical axis and a toe-out angle of 2.5
degrees. It was therefore concluded that maximum wing performance can be gained by the
proper design of a fixed geometry winglet. The winglet rudder also proved not to be useful
in providing increased wing performance or yawing moment.

REFERENCES
Nicks, 0. W. , Landrum, D. B., "Wing Extensions for Improving Climb
Performance," AIAA Paper 83-2556, Oct. 1983.
Van Dam, C. P., "Natural Laminar Flow Airfoil Design Considerations for
Winglets on Low-Speed Airplanes," NASA Contractor Report 3853, Dec. 1984.
Masak, P. C., "Design of Winglets for Sailplanes," Soarmng Mugazmne, Soarlng
Society of America, Inc., Hobbs, New Mexico, June 1993, pp. 21-27.
Nicks, 0. W., "Experimental Comparison of Two Wing Tips," Teclznzcal Soaring,
Soaring Society of America, Inc., Hobbs, New Mexico, Vol. 14, Number 3, 1989,
pp. 81-88.
Nicks, 0. W., "A Physical View of Wing Aerodynamics," Teclznzcul Soar~ng.,
Soaring Society of America, Inc., Hobbs, New Mexico, Vol. 17, Nuinber 4, 1993,
pp. 122-128.
Rae, X. H., Pope, A., Low-Speed Wind Tunnel Testmng, John Wiley & Sons, 1984
Schlichting, H., "Origin of Turbulence," Boundary-Layer Tlzeory, 7th ed.,
McGraw-Hill Book Company, New York, 1979, pp. 453-456.
Schubauer, G. B., Klebanoff, P. S., "Contributions on the Mechanics of Bolundary-
Layer Transition," NACA TN 3489, 1955.
Vijgen, P. M. H. W., van Dam, C. P., Holmes, B. J., "Sheared Wing-Tip
Aerodynamics: Wind Tunnel and Computational Investigations of Induced-Drag
Reduction," AIAA Paper 87-2481 CP, Aug. 1987.

Figure 1. Winglets Mounted on a High Performance Sailplane


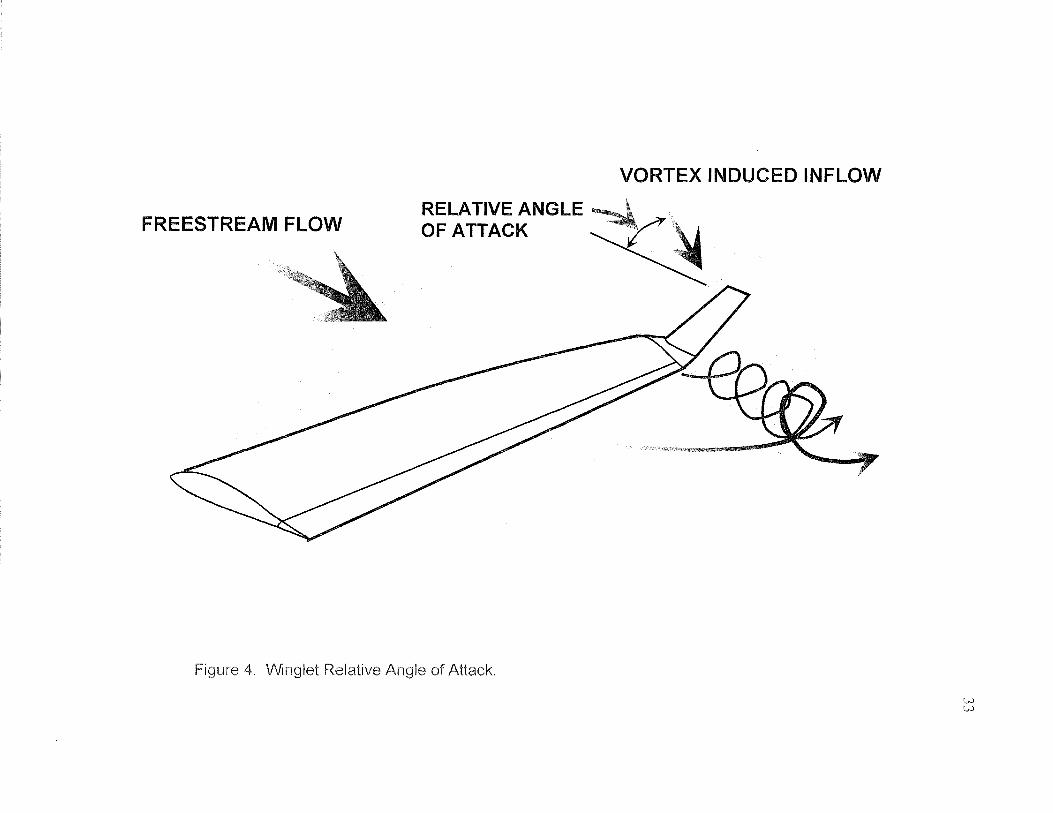

Figure 5. Thrust and Side Component of Winglet Force Vector.


Figure 7. Fixed Geometry Winglet and Standard Wing Tip Used During First Wind-Tunnel Test.


I-'
B


-* STANDARD WING TIP -* CLEAN WINGLET
TURBULATED WINGLET
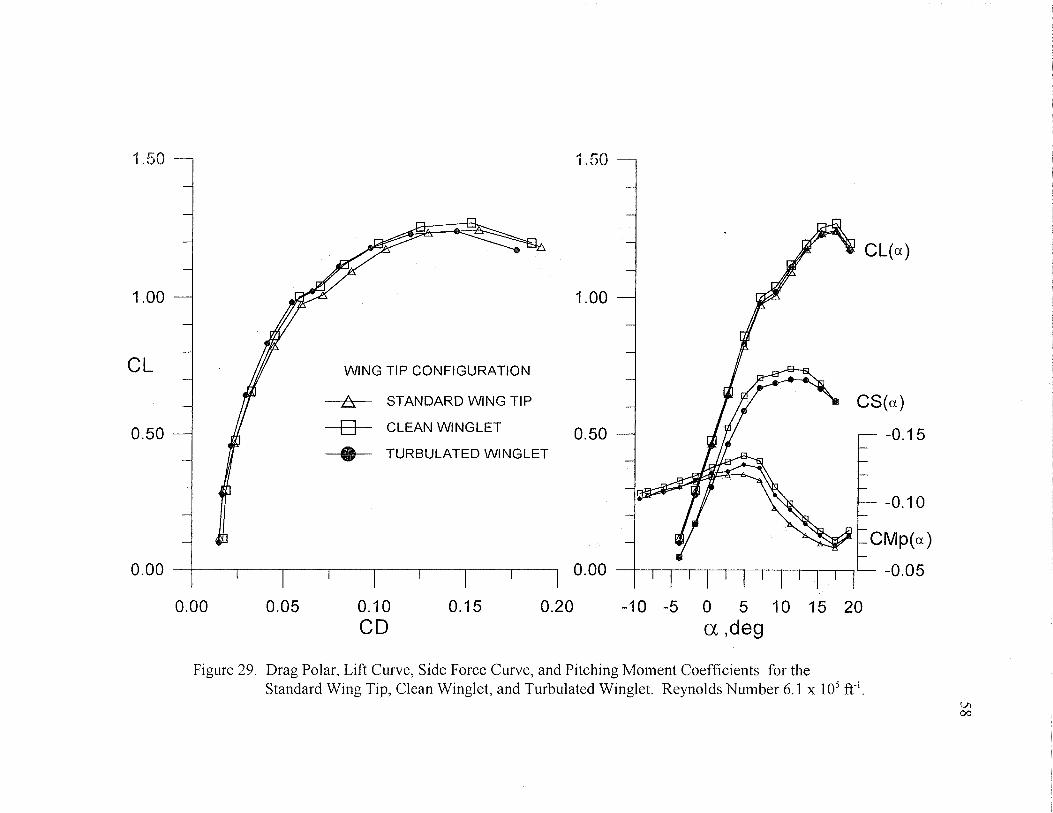
Figure 29. Drag Polar, Lift Curve, Side Force Curve, and Pitching Moment Coefficients for the Standard Wing Tip, Clean Winglet, and Turbulated Winglet. Reynolds Nuinber 6.1 x lo5 ft-l.

WlNG TIP CONFIGURATION
--y&-- STANDARD WlNG TIP
- - CLEAN WINGLET
TURBULATED WINGLET
NO WING TIP
Figure 30. Drag Polar, Lift Curve, Side Force Curve, and Pitching Mo~nent Coefficients for the Standard Wing Tip, Clean Winglet, and Turbulated Winglet. Reynolds Nurnber 8.2 x lo5 ft-',

WING TIP CONFIGURATION
STANDARD WINGTIP
CLEAN WINGLET
TURBULATED WINGLET
Figure 3 1. Lift to Drag Ratio for Standard Wing Tip, Clean Winglet , and Turbulated Winglet. Reynolds Number 6.1 x 1 O5 ft-' .

WING TIP CONFIGURATION
*. STANDARD WING TIP
Figure 33. Cliinb Parameter for Standard Wing Tip, Clean Winglet , and Turbulated Winglet. Reynolds Number 6.1 x 1 O 5 ft" .

LL. LL.
WING TIP CONFIGURATION + STANDARD WING TIP
CLEAN WINGLET
TURBULATED WINGLET
Figure 35. Rolling Moment for Standard Wing Tip, Clean Winglet, and Turbulated Winglet. Reynolds Number 6.1 x 1 O5 ft-'.

WING TIP CONFIGURATION
STANDARDWINGTIP + CLEAN WINGLET
TURBULATED WINGLET
+ NO WING TIP
Figure 36. Rolling Moment for Standard Wing Tip, Clean Winglet , and Turbulated Winglet. Reynolds Number 8.2 x 10' ft-'.

-
-
1.00 - 1.00 -
- CL -
-
0.50 - 0.50 - BASELINE NO WING TIP
- FIRST TEST Q = 20.85 IblftA2
- SECOND TEST Q = 8.0 IblftA2
- €a
0.00 b I I I I 0.00
Figure 37. Drag Polar and Lift Curve of Baseline Comparison for the First and Second Wind-Tunnel Test.

,-JJ c~ 1 x z s -laqulnN sp(ouila8 saa~2aa s ~jo al8u~y' $no-ao~ G JV s~ua13gao3 luauropy Zury~~rd pue axed apts 'aa/una $JI~ '.IGIO~ 9s~~ ayl uo a18uv lue3jo s~333j3 8~ am8rd
0 1'0- (13NlAJ3
s1-0-
OZ'O- 1 a3
OZ'O S1'0 0 1'0 SO'O
OS'O-
OS'O

I .oo
CANT ANGLE 85 DEGREES
TOE ANGLE (DEGREES)
- 7 ! k - O 0.50 -* 2.5
12.5
-$X$--- 22.5 0.00
Figure 39. Effects of Toe-Out Angle on the Drag Polar, Lift Curve, Side Force Curve, and Pitching Moment Coefficients at a Cant Angle of 85 Degrees. Reynolds Number 5.2 x 10' ft".

6ap'm a3 OZ S1 01 S 0 S- 01- OZ'O S1'0 0 1'0 SO'O 00'0
OS'O- I I I I I OS'O-
-
00'0 - 00'0 OL --€I- 0 u -
(szgtroza) 313NV tf3aacltl1313NIM
OS'O - OS'O s33t333a 9.z lno 301
S33t133a S9 313NV lNV3 -
13
00' 1 - 00'1
-
CANT ANGLE 85 DEGREES TOE OUT 2.5 DEGREES
WINGLET RUDDER ANGLE 0.50
Figure 41. Effects of Winglet Rudder Angle on the Drag Polar, Lift Curve, Side Force Curve, and Pitching Moment Coefficients at a Cant Angle of 85 Degrees, Toe-Out Angle of 2.5 Degrees. Reynolds Number 5.2 x 10' ft-'.

73 SZ. 1 00' 1 SL'O OS'O SZ'O 00'0

CANT ANGLE 85 DEGREES
LID
WINGLET TOE OUT ANGLE (DEGREES)
0
2.5
5
12.5
NO WING TIP
Figure 43. Effects of Toe-Out Angle on the Lift to Drag Ratio at a Cant Angle of 85 Degrees. Reynolds Number 5.2 x lo5 ft".

CANT ANGLE 65 DEGREES TOE OUT ANGLE 2.5 DEGREES
WINGLET RUDDER ANGLE (DEGREES)
0
+ 10
- 10
NO WING TIP
Figure 44. Effects of Winglet Rudder Angle on the Lift to Drag Ratio at a Cant Angle of 65 Degrees, Toe-Out Angle 2.5 Degrees. Reynolds Number 5.2 x 10' ft-'.

CANT ANGLE 85 DEGREES TOE OUT ANGLE 2.5 DEGREES
WINGLET RUDDER ANGLE (DEGREES)
0
+ 10
- 10
NO WING TIP
Figure 45. Effects of Winglet Rudder Angle on the Lift to Drag Ratio at a Cant Angle of 85 Degrees, Toe-Out Angle 2.5 Degrees. Reynolds Nuinber 5.2 x 10' ft-'.

93 GZ. 1 00'1 GL'O OS'O GZ'O 00'0

CANT ANGLE = 85 DEGREES WINGLET RUDDER ANGLE = 0 DEGREES
15.00 1
WINGLET TOE-OUT ANGLE (DEGREES)
12.5
--f--- NO WING TIP
Figure 47. Effects of Toe-Out Angle on the Cliinb Parameter at a Cant Angle of 85 Degrees. Reynolds Number 5.2 x lo5 ft-I.
CANT ANGLE = 65 DEGREES 15.00 --, TOE ANGLE = 0 DEGREES
WINGLET RUDDER t
ANGLE (DEGREES)
Figure 48. Effects of Winglet Rudder Angle on the Cliinb Parameter. Cant Angle 65 Degrees Toe-Out Angle 2.5 Degrees. Reynolds Number 5.2 x 1 O5 ft-I.

CANT ANGLE -. 85 DEGREES 15.00 -7 TOE ANGLE =, 0 DEGREES
WINGLET RUDDER ANGLE (DEGREES)
Figure 49. Effects of Winglet Rudder Angle on the Climb Parameter. Cant Angle 85 Degrees. Toe-Out Angle 2.5 Degrees. Reynolds Number 5.2 x 1 O5 ft-'.

Figure 50. Effects of Cant Angle on the Rolling Moment. T o e - 0 u " r d e 2.5 Degrees Reynolds Number 5.2 x 1 O 5 ft-'.

CANT ANGLE -- 85 DEGREES
WINGLET TOE ANGLE (DEGREES)
Figure 5 1 . Effects of Toe-Out Angle on the Rolling Moment. Cant Angle 85 Degrees. Reynolds Nuinber 5.2 x 10' ff ' .

OZ'O-
0 1'0-
00'0
01'0
02'0
s33t133a 9.2 313~~ lno-301
- - z OE'O -4 - - -
~33t133a 99 313~~ 1~~7'3 - Otf'O

0.40 -zq CANT ANGLE 85 DEGREES
- 0 - LL. LL u
TOE-BUT ANGLE 2.5 DEGREES
WINGLET RUDDER ANGLE (DEGREES)
-+ 0
+ + I 0
Figure 53. Effects of Winglet Rudder Angle on the Rolling Moment. Cant Angle 85 Degrees. Toe-Out Angle 2.5 Degrees. Reynolds Nuinber 5 .2 x 10' ft-' .

CANT ANGLE (DEGREES)
F~gure 54 Effects of Cant Angle on the Yawrng Morrtent at a Toe-Out Angle of 2 5 Degrees Reynolds Number 5 2 x lo5 ft"

WINGLET TOE ANGLE (DEGREES)
Figure 55. Effects of Toe-Out Angle on the Yawing Moment. Cant Angle 85 Degrees. Reynolds Number 5.2 x 10' ft-'.

CANT ANGLE 65 DEGREES
WINGLET RUDDER DEFLECTION (DEGREES)
0 DEGREES 1 + I 0 DEGREES 1 -10 DEGREES C L -- -. CL CYM CYM I
-0.381 30 0.03380 / -0.371 10 0.04480
Flgure 56 Effects of Winglet Rudder Angle on the Yawing Moment Cant Angle 65 Degrees Toe-Out angle 2.5 Degrees. Reynolds Number 5.2 x lo5 ft-'.

- - -- - - --
0 DEGREES 1 + l o DEGREES I -10 DEGREES 1 I CL CYM 1 CL cYM C L ! -b.%66d003150 -0.33230 0.03980 -0.35930 O:;%
WINGLET RUDDER DEFLECTION (DEGREES)
Figure 57 . Effects of Winglet Rudder Angle on the Yawing Moment. Cant Angle 85 Degrees. Toe-Out angle 2.5 Degrees. Reynolds Number 5 .2 x 1 O5 f t - I .

VITA
graduated from W. B. Ray High School in Corpus Christi, Texas in May 1983 He
received his Bachelor of Science degree in Aerospace Engineering from Texas A&M
University in May 1988. In January 1989, he started his graduate work towards a Master
of Science in Aerospace Engineering at Texas A&M University. In July 1989, he started
full-time employment at Loral Space Information Systems, in Houston, Texas, as a
programmer for the Space Shuttle Guidance, Navigation, and Control Flight Software.
Later that year, he moved into an engineering position to provide support for the NASA
Shuttle Program Office at the Johnson Space Center, Houston, Texas. In August 1993, he
returned to Texas A&M University as a full-time student to finish his Masters degree in
Aerospace Engineering. During this time, he worked as a contract engineer for High
Performance Engineering, in Houston, Texas, to design and build a prototype 15-meter
sailplane. This sailplane was flown at the World Soaring Championships which were held
January 1995, in Omarama, New Zealand. His research work focused on winglets for high
performance sailplanes. However, other research projects during the course of completing
his Master of Science degree included: performance of counter rotating propellers on
single engine airplanes, performance degradation of helicopter rotor blades due to
leading-edge icing, the design and finite element analysis of a crescent shaped composrte
sailplane wing, and finite element stress and dynamic analysis of two and three blade
propellers for single engine airplanes.
His permanent address is: 609 Barracuda, Corpus Christi, TX 7841 1.


![7 3 Sailplane GP-1 [Mode de compatibilité]...Sailplane Grand Prix 2014 World Sailplane Grand Prix Final 2014-2015 Qualifying Sailplane Grand Prix series 2015 World Sailplane Grand](https://img.pdfslide.us/doc/110x75/6023534700029d297b3d533e/7-3-sailplane-gp-1-mode-de-compatibilit-sailplane-grand-prix-2014-world.jpg)