Embed Size (px)
Citation preview

Saidj, Faiza and Kibboua, Rachid and Azzi, Abdelwahid and Ababou, Noureddine and Azzopardi, Barry J. (2014) Experimental investigation of air–water two-phase flow through vertical 90° bend. Experimental Thermal and Fluid Science, 57 . pp. 226-234. ISSN 0894-1777
Access from the University of Nottingham repository: http://eprints.nottingham.ac.uk/35548/1/Experimental%20investigation%20of%20air-water%20two-phase%20flow%20through%20vertical%2090%20bend.pdf
Copyright and reuse:
The Nottingham ePrints service makes this work by researchers of the University of Nottingham available open access under the following conditions.
This article is made available under the Creative Commons Attribution Non-commercial No Derivatives licence and may be reused according to the conditions of the licence. For more details see: http://creativecommons.org/licenses/by-nc-nd/2.5/
A note on versions:
The version presented here may differ from the published version or from the version of record. If you wish to cite this item you are advised to consult the publisher’s version. Please see the repository url above for details on accessing the published version and note that access may require a subscription.
For more information, please contact [email protected]
1
Experimental investigation of air-water two-phase flow through vertical 90°
bend
Faiza Saidj1, Rachid Kibboua1, Abdelwahid Azzi1, Noureddine Ababou2, Barry James
Azzopardi3
1 Université des Sciences et de la Technologie Houari Boumedien, LTPMP/FGMGP, BP 32
El Alia, Algiers 16111, Algeria
2 Université des Sciences et de la Technologie Houari Boumedien, LINS/FEI, BP 32 El Alia,
Algiers 16111, Algeria
3 Process and Environmental Research Division, Faculty of Engineering, University of Nottingham, University Park, Nottingham NG7 2RD, UK
Corresponding author E-mail address: [email protected]
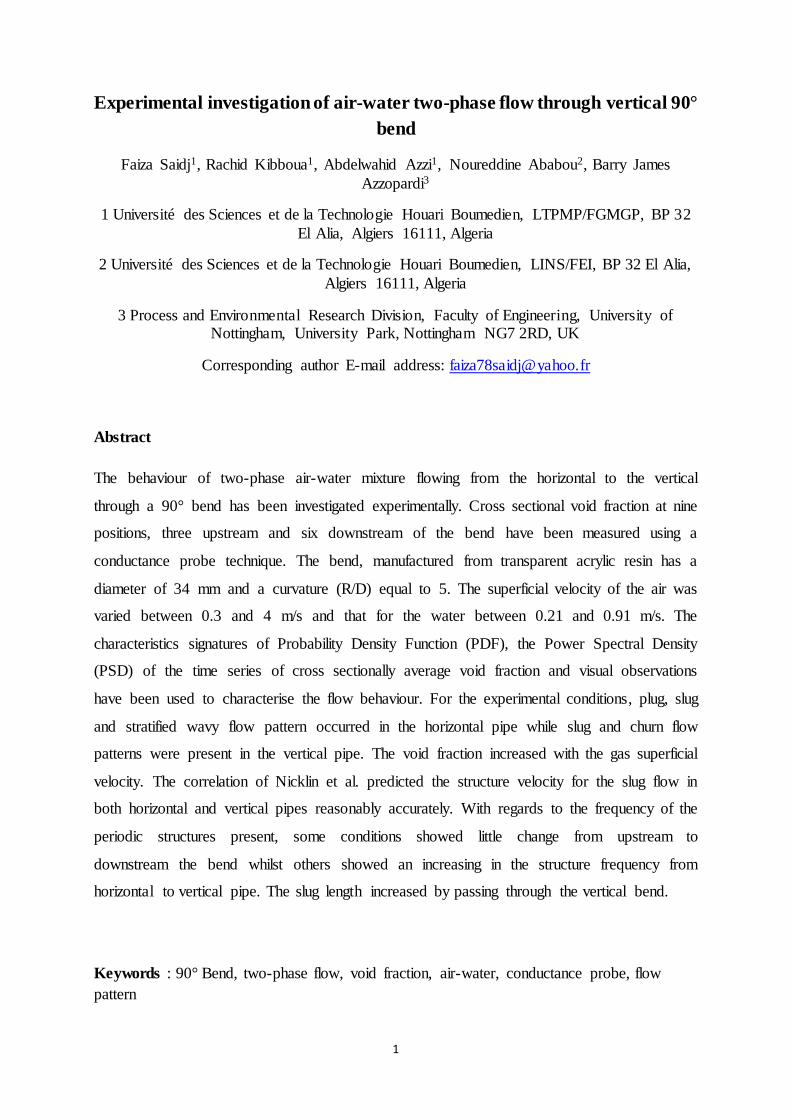
Abstract
The behaviour of two-phase air-water mixture flowing from the horizontal to the vertical
through a 90° bend has been investigated experimentally. Cross sectional void fraction at nine
positions, three upstream and six downstream of the bend have been measured using a
conductance probe technique. The bend, manufactured from transparent acrylic resin has a
diameter of 34 mm and a curvature (R/D) equal to 5. The superficial velocity of the air was
varied between 0.3 and 4 m/s and that for the water between 0.21 and 0.91 m/s. The
characteristics signatures of Probability Density Function (PDF), the Power Spectral Density
(PSD) of the time series of cross sectionally average void fraction and visual observations
have been used to characterise the flow behaviour. For the experimental conditions, plug, slug
and stratified wavy flow pattern occurred in the horizontal pipe while slug and churn flow
patterns were present in the vertical pipe. The void fraction increased with the gas superficial
velocity. The correlation of Nicklin et al. predicted the structure velocity for the slug flow in
both horizontal and vertical pipes reasonably accurately. With regards to the frequency of the
periodic structures present, some conditions showed little change from upstream to
downstream the bend whilst others showed an increasing in the structure frequency from
horizontal to vertical pipe. The slug length increased by passing through the vertical bend.
Keywords : 90° Bend, two-phase flow, void fraction, air-water, conductance probe, flow
pattern
2
1. Introduction
Bends are present in much industrial equipment, e.g., heat exchangers, chemical plants,
transport piping, thermal-hydraulic reactor system etc. One peculiar and complex
characteristics of the bend flow is the establishing secondary flow, which is already well
known from single-phase liquid flow. When the fluid flows through the bend, the curvature
causes a centrifugal force, directed from the centre of curvature to the outer wall. This force
and the presence of a boundary layer at the wall, respectively fluid adhesion to the wall,
combine to produce the secondary flow ideally organised in two identical eddies. Basically,
the fluid in the core moves outwards and in the region near the wall inwards. The secondary
flow is superimposed to the main stream along to the tube axis, imposing a helical shape to
the stream lines Azzi et al. [1].
When positioned vertically, bends involve the simultaneous action of centrifugal,
gravitational and buoyancy forces, which leads to complicated flow behaviour such as
inhomogeneous phase distribution, flow reversal, flooding, secondary flow and coalescence.
These latter can produce corrosion and consequently pipe damage. As consequence, the
understanding of the flow behaviour upstream, through and downstream the bend is of prime
importance in the design of the devices where they are present.
In single-phase flow several studies are reported in the literature regarding these aspects while
in two-phase gas-liquid comparatively less work has be devoted to and more particularly for
the vertical 90° bends where very few studies are cited.
Azzopardi [2] in his review on two-phase flow through fittings discussed the flow structure of
a two-phase mixture flowing through 90° and 180° bends. He found that there were more
publications about 180 bends than 90 ones. Of the papers on the latter type of bends,
several were about the pressure losses occurring at the bend such as Azzi et al. [1].
For analysing the two-phase mixture flowing in a circuit including a 90° bend three flow
orientations have been investigated. Vertical to horizontal Gardner and Neller [3], Maddock et
al. [4] and Abdulkadir et al. [5]; horizontal to horizontal Ribeiro et al. [6], Sekoguchi et al.
[7], Sánchez Silva al. [8]; horizontal to vertical .Legius [9], Omebere-Iyari and Azzopardi
[10].
3
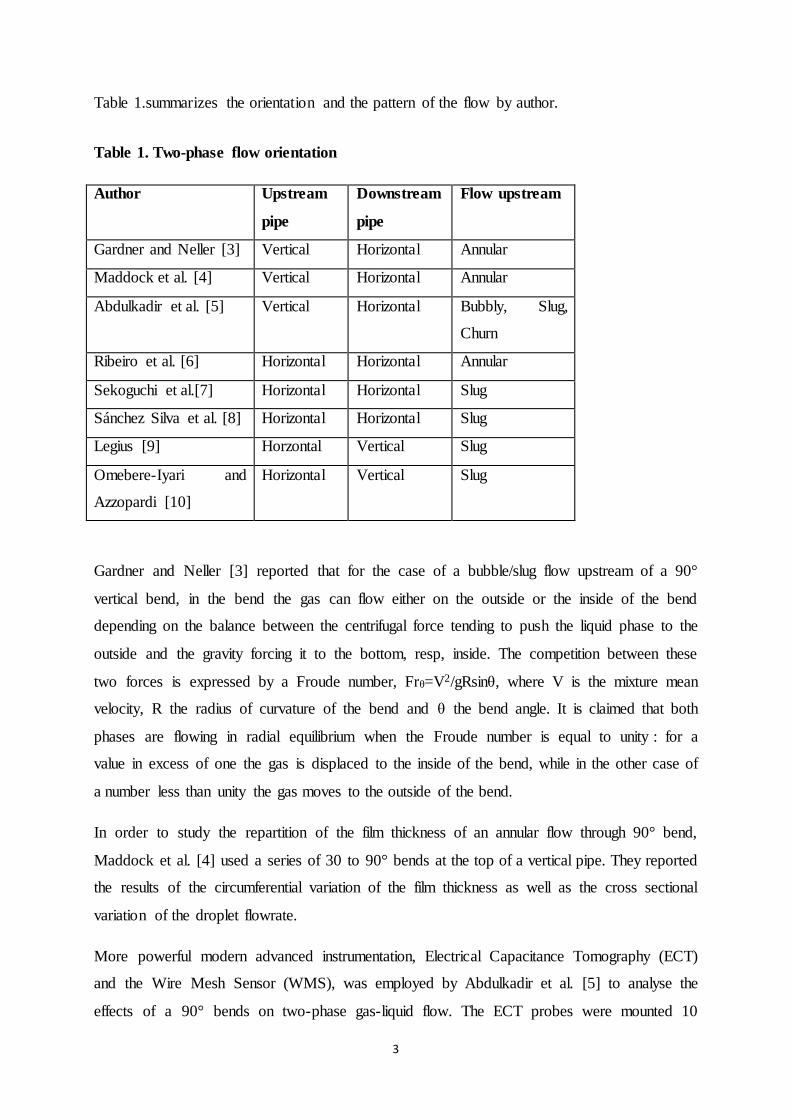
Table 1.summarizes the orientation and the pattern of the flow by author.
Table 1. Two-phase flow orientation
Author Upstream
pipe
Downstream
pipe
Flow upstream
Gardner and Neller [3] Vertical Horizontal Annular
Maddock et al. [4] Vertical Horizontal Annular
Abdulkadir et al. [5] Vertical Horizontal Bubbly, Slug,
Churn
Ribeiro et al. [6] Horizontal Horizontal Annular
Sekoguchi et al.[7] Horizontal Horizontal Slug
Sánchez Silva et al. [8] Horizontal Horizontal Slug
Legius [9] Horzontal Vertical Slug
Omebere-Iyari and
Azzopardi [10]
Horizontal Vertical Slug
Gardner and Neller [3] reported that for the case of a bubble/slug flow upstream of a 90°
vertical bend, in the bend the gas can flow either on the outside or the inside of the bend
depending on the balance between the centrifugal force tending to push the liquid phase to the
outside and the gravity forcing it to the bottom, resp, inside. The competition between these
two forces is expressed by a Froude number, Frθ=V2/gRsinθ, where V is the mixture mean
velocity, R the radius of curvature of the bend and θ the bend angle. It is claimed that both
phases are flowing in radial equilibrium when the Froude number is equal to unity : for a
value in excess of one the gas is displaced to the inside of the bend, while in the other case of
a number less than unity the gas moves to the outside of the bend.
In order to study the repartition of the film thickness of an annular flow through 90° bend,
Maddock et al. [4] used a series of 30 to 90° bends at the top of a vertical pipe. They reported
the results of the circumferential variation of the film thickness as well as the cross sectional
variation of the droplet flowrate.
More powerful modern advanced instrumentation, Electrical Capacitance Tomography (ECT)
and the Wire Mesh Sensor (WMS), was employed by Abdulkadir et al. [5] to analyse the
effects of a 90° bends on two-phase gas-liquid flow. The ECT probes were mounted 10
4
diameters upstream of the bend whilst the WMS was positioned either immediately upstream
or immediately downstream of the bend. The downstream pipe was kept horizontally while
the upstream one was positioned either vertically or horizontally. The characteristics
signatures of Probability Density Function (PDF) obtained from the time series of cross-
sectionally averaged void fraction data were utilized to identify the flow pattern upstream and
downstream the bend. They remarked that bubble, stratified, slug and semi-annular flows
were present downstream the bend for the vertical 90° bend while for the horizontal 90° bend,
the flow pattern exhibited the same configurations as upstream the bend.
By using the Laser diffraction technique, Ribeiro et al. [6] measured the Sauter mean diameter
of the drops upstream and downstream a horizontal 90° bend. They found that the bend
increases the diameter of the drops. They suggested that this increasing is the result of several
processes occurring at the bend, such as drop coalescence and deposition and re-entrainment.
The static pressure along pipes upstream and downstream 90° bends,with both pipes on a
horizontal plane, was measured by Sekoguchi et al. [7] using water manometers. They found
that the maximum value of the recovery length downstream the bends was about 150 pipe
diameters for the flow conditions and bend geometries investigated, while the upstream
developing length was found considerably smaller.
Using conductive probes consisting of pairs of flush mounted metal rings, Sánchez Silva et al.
[8] measured the slug hold-up, length and frequency of slug upstream and downstream of a
horizontal 90° bend. Upstream of the bend measurement devices were positioned at a distance
from mixer where fully developed slugs where found, while downstream the bend, the
measuring station was placed near the bend where the flow is not fully developed. They
noticed that the slug flow characteristics (velocity, frequency, hold-up, length) downstream
the bend are greatly different to those upstream the bend in the fully developed slug flow
region.
Legius [9] analyzed the effects of a vertical 90º bend on the two-phase flow behaviour in a
flow line/riser system experimentally and numerically. He found that slug formation is
promoted by the presence of the bend. Under most of the experimental conditions studied, a
fully developed slug was observed just downstream the bend. At higher flow rates is can
develop into churn flow. The slug in the riser part is the origin of a continuous process of
liquid fall-back to the upstream horizontal duct through a liquid film. This liquid film is
moved upstream as waves, destabilizing the horizontal stratified flow in the process.
5
Moreover, by using a visualization technique and responses of the pressure transducers, the
author proposed flow regime maps for the horizontal pipe and the riser respectively. However
no details concerning the slug characteristics (structure velocity, length and frequency of the
slug) are given.
Omebere-Iyari and Azzopardi [10], presented the time varying void fraction data and flow
pattern information for the two-phase nitrogen-naphtha mixture flowing in a 189 mm
diameter and 52 m high and compared their results for the same riser when it was connected
to an upstream horizontal pipeline of the same diameter. They found that the slug flow formed
in the upstream horizontal pipeline at high liquid flowrates is propagated into the vertical pipe
and is absent in the same riser when the gas and liquid phase are introduced at the riser base.
It appears from this review that there is a lack in the analysis of the behaviour of gas-liquid
mixture passing through a circuit constituted by a flow line, a 90° bend and a riser; and more
particularly downstream the bend. The present work is an attempt to fill this gap.
2. Experiments
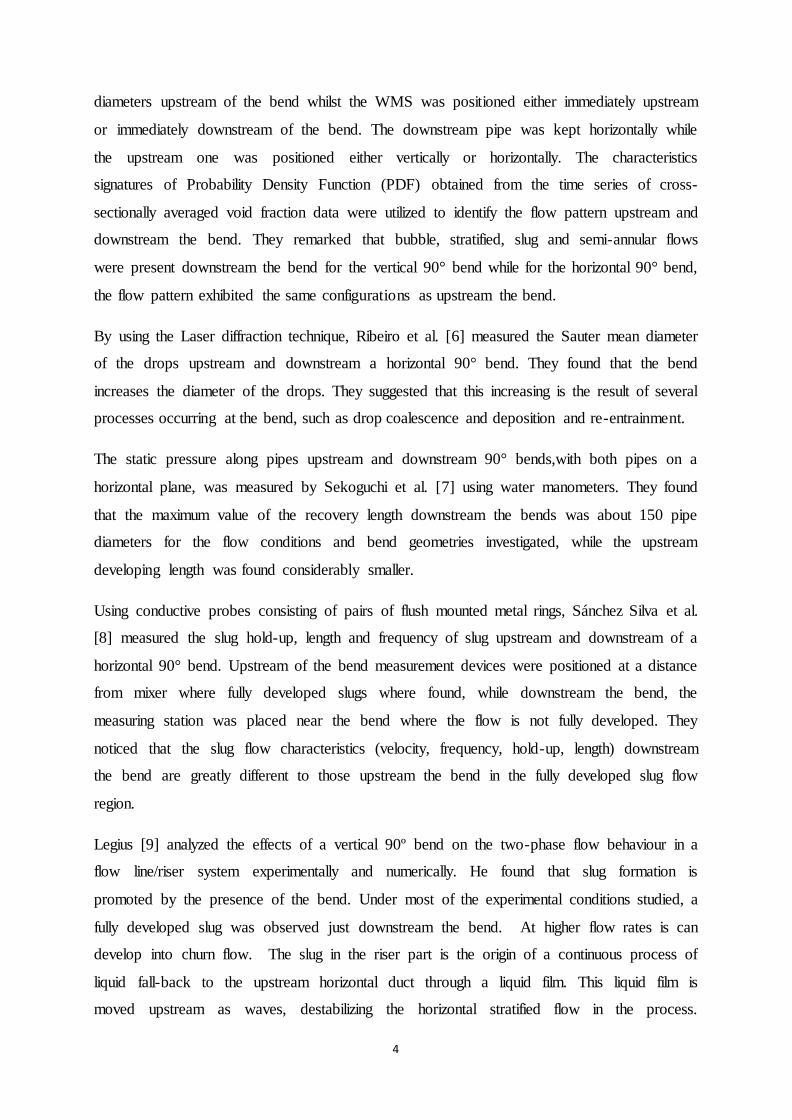
A schematic diagram of the experimental apparatus installed at the Laboratory of Multiphase
Flows and Porous Media of the University of Sciences and Technology Houari Boumedien,
Algiers, is shown in Figure 1.
6
Fig. 1 Schematic diagram of the experimental facility
The test section consists of a horizontal pipe preceding a 90° the bend and followed by a
vertical outlet pipe. Each pipe was 5m long (about 150 pipe diameters to ensure the full
development of the flow). These pipes are made from transparent acrylic resin (PMMA),
which permitted observation of the flow pattern. The inner diameter and the thickness of the
straight pipes are 34 mm and 4 mm respectively. The 90° bend made in Perspex has been
machined using a CNC machine. Thus, after achieving geometrical pieces in the shape of half
torrus with 17 mm from plates of 20 mm thickness, these pieces are glued, bolted and pasted
to the flanges to give the final form of the bend. The relative bend curvature is equal to 5.
The mixing unit (Mixer) made of Polyvinyl chloride (PVC), is consisted of a section of pipe
wall with 64 holes with 1 mm diameter spaced equally in 8 columns over a length of 80 mm.
The liquid was introduced into an annular chamber surrounding this section of pipe, creating
thus, a more even circumferential mixing effect.
7
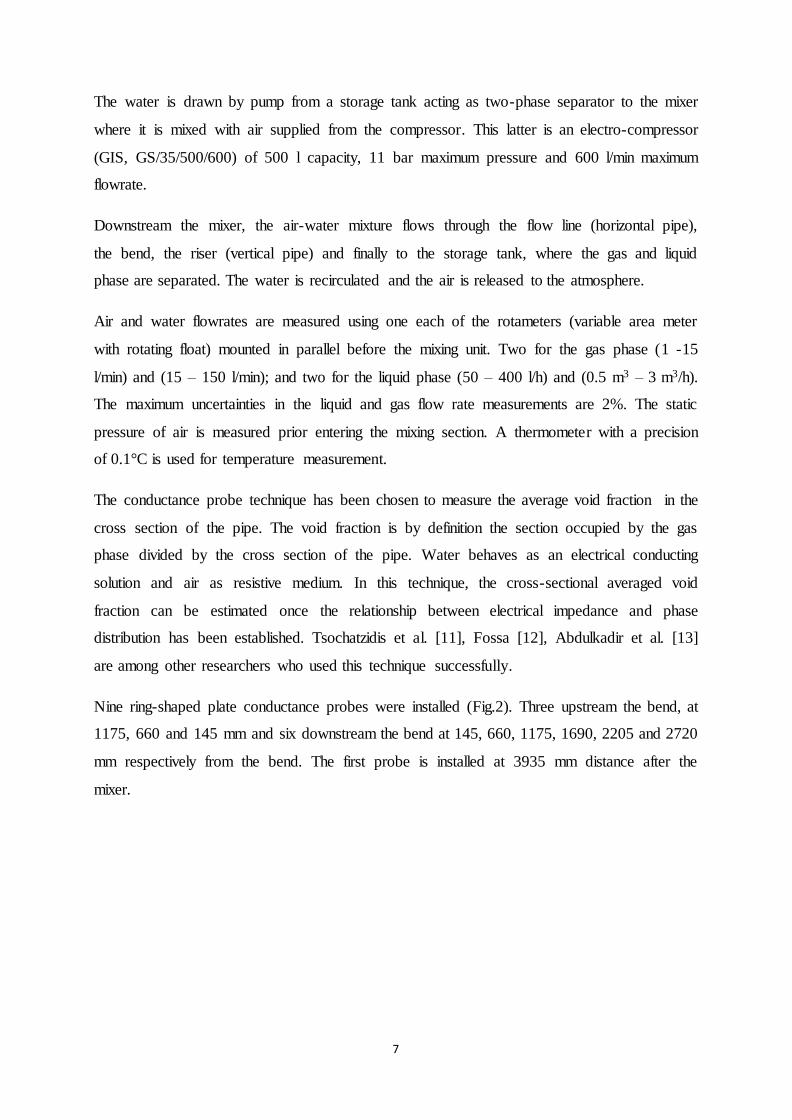
The water is drawn by pump from a storage tank acting as two-phase separator to the mixer
where it is mixed with air supplied from the compressor. This latter is an electro-compressor
(GIS, GS/35/500/600) of 500 l capacity, 11 bar maximum pressure and 600 l/min maximum
flowrate.
Downstream the mixer, the air-water mixture flows through the flow line (horizontal pipe),
the bend, the riser (vertical pipe) and finally to the storage tank, where the gas and liquid
phase are separated. The water is recirculated and the air is released to the atmosphere.
Air and water flowrates are measured using one each of the rotameters (variable area meter
with rotating float) mounted in parallel before the mixing unit. Two for the gas phase (1 -15
l/min) and (15 – 150 l/min); and two for the liquid phase (50 – 400 l/h) and (0.5 m3 – 3 m3/h).
The maximum uncertainties in the liquid and gas flow rate measurements are 2%. The static
pressure of air is measured prior entering the mixing section. A thermometer with a precision
of 0.1°C is used for temperature measurement.
The conductance probe technique has been chosen to measure the average void fraction in the
cross section of the pipe. The void fraction is by definition the section occupied by the gas
phase divided by the cross section of the pipe. Water behaves as an electrical conducting
solution and air as resistive medium. In this technique, the cross-sectional averaged void
fraction can be estimated once the relationship between electrical impedance and phase
distribution has been established. Tsochatzidis et al. [11], Fossa [12], Abdulkadir et al. [13]
are among other researchers who used this technique successfully.
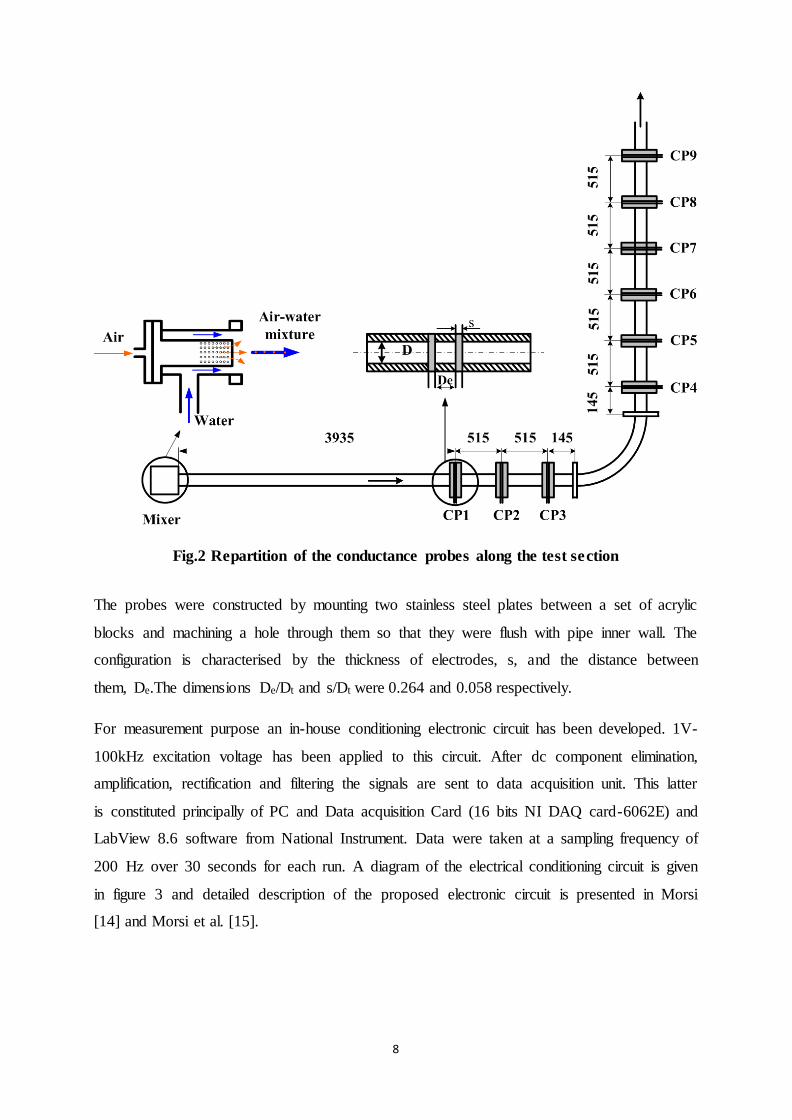
Nine ring-shaped plate conductance probes were installed (Fig.2). Three upstream the bend, at
1175, 660 and 145 mm and six downstream the bend at 145, 660, 1175, 1690, 2205 and 2720
mm respectively from the bend. The first probe is installed at 3935 mm distance after the
mixer.
8
Fig.2 Repartition of the conductance probes along the test section
The probes were constructed by mounting two stainless steel plates between a set of acrylic
blocks and machining a hole through them so that they were flush with pipe inner wall. The
configuration is characterised by the thickness of electrodes, s, and the distance between
them, De.The dimensions De/Dt and s/Dt were 0.264 and 0.058 respectively.
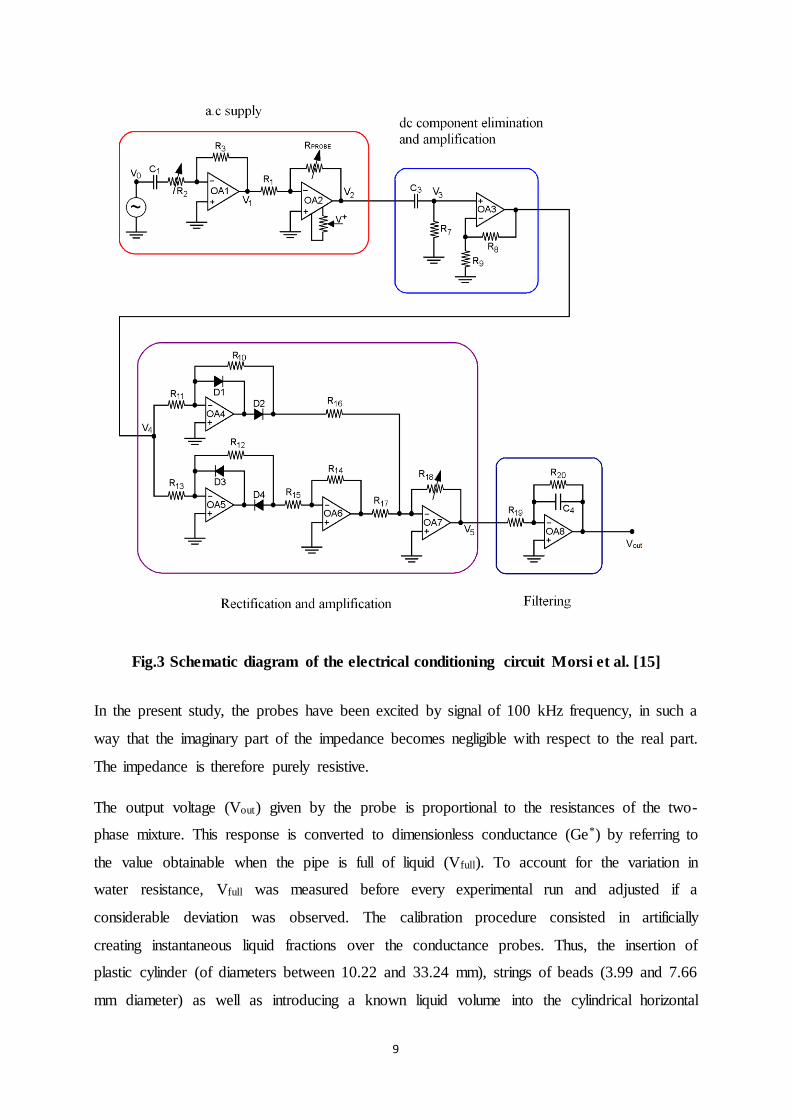
For measurement purpose an in-house conditioning electronic circuit has been developed. 1V-
100kHz excitation voltage has been applied to this circuit. After dc component elimination,
amplification, rectification and filtering the signals are sent to data acquisition unit. This latter
is constituted principally of PC and Data acquisition Card (16 bits NI DAQ card-6062E) and
LabView 8.6 software from National Instrument. Data were taken at a sampling frequency of
200 Hz over 30 seconds for each run. A diagram of the electrical conditioning circuit is given
in figure 3 and detailed description of the proposed electronic circuit is presented in Morsi
[14] and Morsi et al. [15].
9
Fig.3 Schematic diagram of the electrical conditioning circuit Morsi et al. [15]
In the present study, the probes have been excited by signal of 100 kHz frequency, in such a
way that the imaginary part of the impedance becomes negligible with respect to the real part.
The impedance is therefore purely resistive.
The output voltage (Vout) given by the probe is proportional to the resistances of the two-
phase mixture. This response is converted to dimensionless conductance (Ge*) by referring to
the value obtainable when the pipe is full of liquid (Vfull). To account for the variation in
water resistance, Vfull was measured before every experimental run and adjusted if a
considerable deviation was observed. The calibration procedure consisted in artificially
creating instantaneous liquid fractions over the conductance probes. Thus, the insertion of
plastic cylinder (of diameters between 10.22 and 33.24 mm), strings of beads (3.99 and 7.66
mm diameter) as well as introducing a known liquid volume into the cylindrical horizontal
10
pipe were used for simulating the annular, bubbly and stratified flows respectively. Further
details on the calibration procedure are also presented in Morsi [14].
3. Results and discussion
3.1 Flow patterns
A series of visual observations made through the transparent walls of the flow line, bend and
riser, were carried out for the range of the gas and liquid superficial velocities studied here.
Stratified plug, wavy and slug flows were observed in the flow line while slug and churn
flows were observed in the riser. To confirm these observations, flow patterns were identified
using the characteristic signatures of the Probability Density Function (PDF) of the time series
of cross sectionally average void fraction as suggested by Costigan and Whalley [16] and
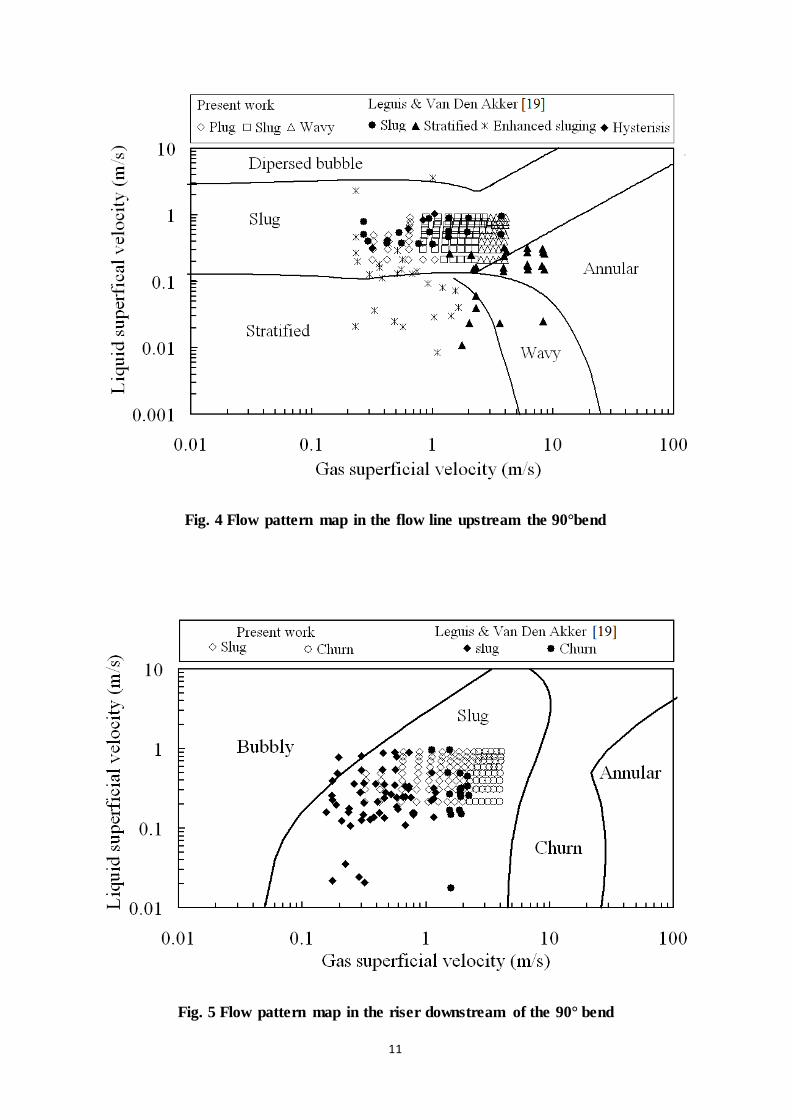
Jones and Zuber [17]. In Figs.4 and 5, the experimental data have been plotted on flow pattern
maps of Shoham [18] for the flow line and the riser respectively. Additionally to the present
data, those obtained by Legius and van den Akker [19] obtained from similar experiments
except the geometrical parameters of the pipes and bend, are plotted on these maps. For the
flow line, from Figure 4 one can see that all the experiments of the present study are plug,
slug and stratified wavy flows. It can be noticed that the Shoham map predicts the
experimental data for the plug and slug flow quite well but is less accurate for the
stratified/wavy flow transition. The stratified wavy flow observed in the intermittent region of
the map could be attributed to the liquid fall-back from the riser which tends to increase wave
generation. On the other hand Shoham map predicts accurately the slug data of Legius and
van den Akker but is less good for the stratified flow and the flow they called enhanced slug.
In the riser, the present data and those of Legius and Van Den Akker are plotted together in
the flow pattern map of Shoham (Fig 5). From this figure it appears that for the present test
conditions, the flow patterns observed in the riser are slug and churn flow. The transition
between these latter is not so accurately predicted by Shoham. flow pattern map. The same
applies to the data of Legius and van den Akker.
11
Fig. 4 Flow pattern map in the flow line upstream the 90°bend
Fig. 5 Flow pattern map in the riser downstream of the 90° bend
12
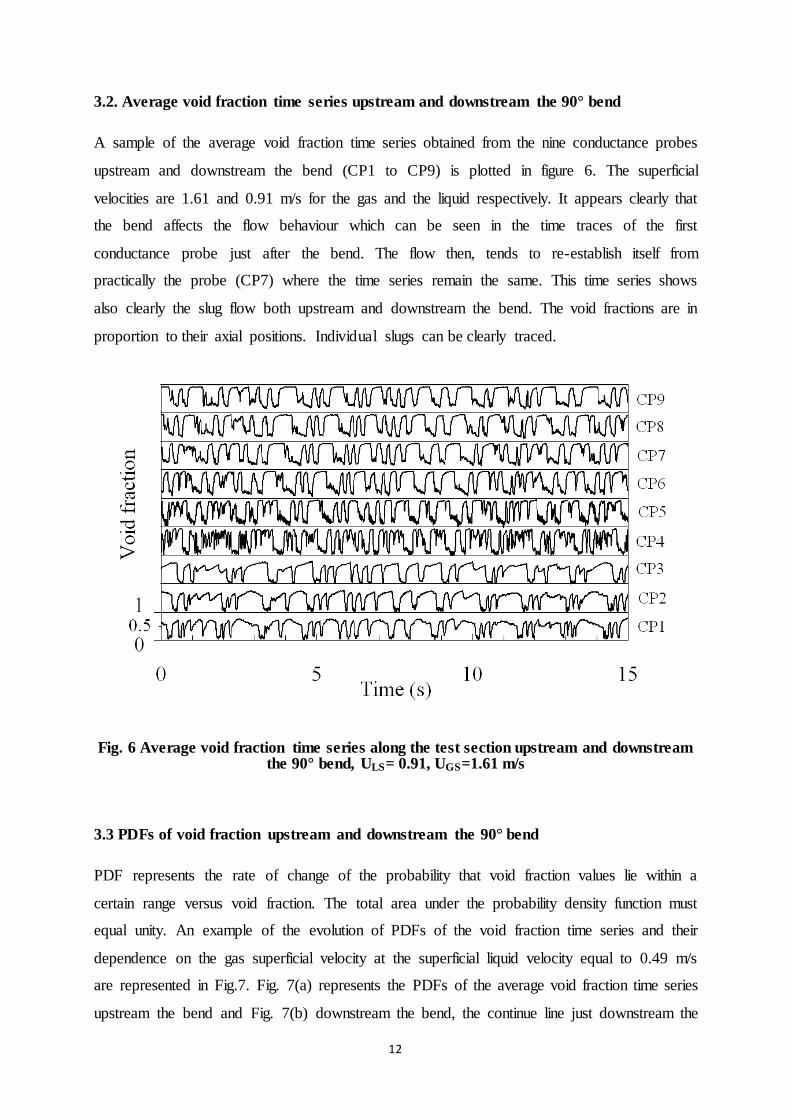
3.2. Average void fraction time series upstream and downstream the 90° bend
A sample of the average void fraction time series obtained from the nine conductance probes
upstream and downstream the bend (CP1 to CP9) is plotted in figure 6. The superficial
velocities are 1.61 and 0.91 m/s for the gas and the liquid respectively. It appears clearly that
the bend affects the flow behaviour which can be seen in the time traces of the first
conductance probe just after the bend. The flow then, tends to re-establish itself from
practically the probe (CP7) where the time series remain the same. This time series shows
also clearly the slug flow both upstream and downstream the bend. The void fractions are in
proportion to their axial positions. Individual slugs can be clearly traced.
Fig. 6 Average void fraction time series along the test section upstream and downstream the 90° bend, ULS= 0.91, UGS=1.61 m/s
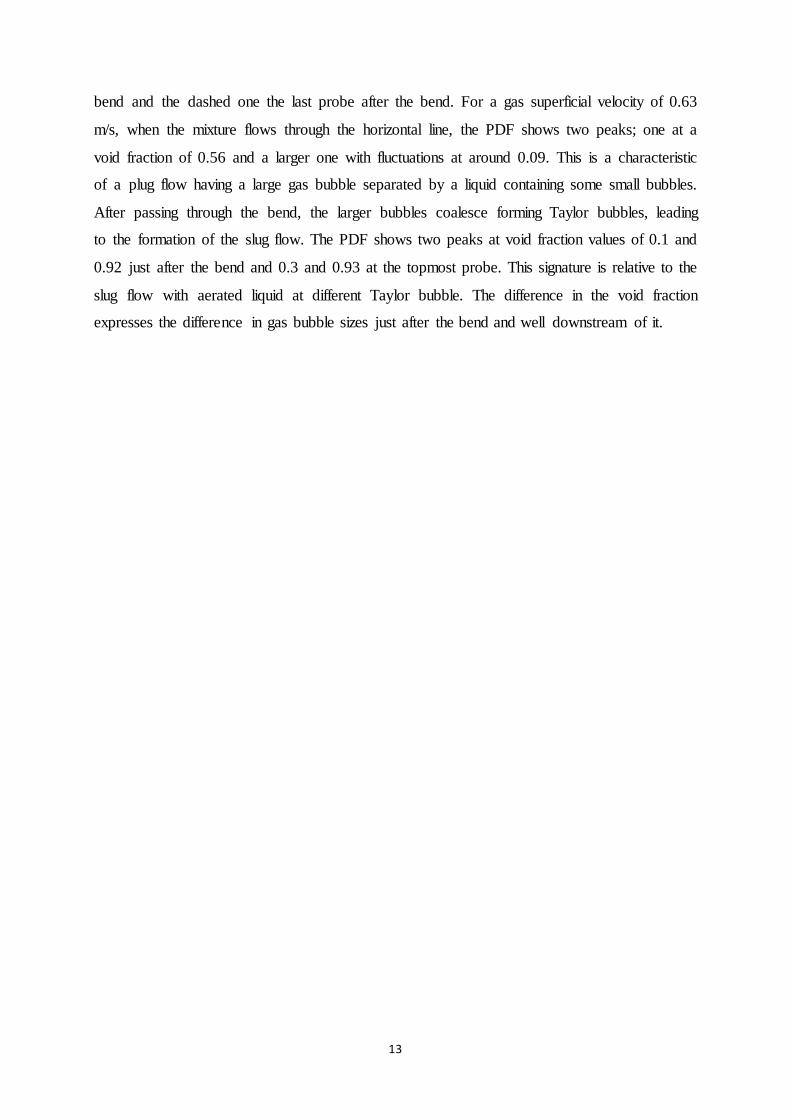
3.3 PDFs of void fraction upstream and downstream the 90° bend
PDF represents the rate of change of the probability that void fraction values lie within a
certain range versus void fraction. The total area under the probability density function must
equal unity. An example of the evolution of PDFs of the void fraction time series and their
dependence on the gas superficial velocity at the superficial liquid velocity equal to 0.49 m/s
are represented in Fig.7. Fig. 7(a) represents the PDFs of the average void fraction time series
upstream the bend and Fig. 7(b) downstream the bend, the continue line just downstream the
13
bend and the dashed one the last probe after the bend. For a gas superficial velocity of 0.63
m/s, when the mixture flows through the horizontal line, the PDF shows two peaks; one at a
void fraction of 0.56 and a larger one with fluctuations at around 0.09. This is a characteristic
of a plug flow having a large gas bubble separated by a liquid containing some small bubbles.
After passing through the bend, the larger bubbles coalesce forming Taylor bubbles, leading
to the formation of the slug flow. The PDF shows two peaks at void fraction values of 0.1 and
0.92 just after the bend and 0.3 and 0.93 at the topmost probe. This signature is relative to the
slug flow with aerated liquid at different Taylor bubble. The difference in the void fraction
expresses the difference in gas bubble sizes just after the bend and well downstream of it.
14
(a)
(b)
Fig. 7 PDFs of the void fraction function of the gas superficial velocity (a) upstream the bend (b) downstream the bend; continue curve at the first probe downstream the bend, dashed curve last probe downstream the bend; (liquid superficial velocity of 0.49 m/s).
At the highest gas superficial velocity of 3.95 m/s, stratified wavy flow is present in the
horizontal pipe. It is characterized by small fluctuations and a high peak with a large base.
This increase in the superficial gas velocity intensifies the instability of the liquid slug and
15
creates the breakup of the Taylor bubbles in the vertical pipe; the churn flow is than observed
with a peak at high void fraction with tails extending down to 0.2.
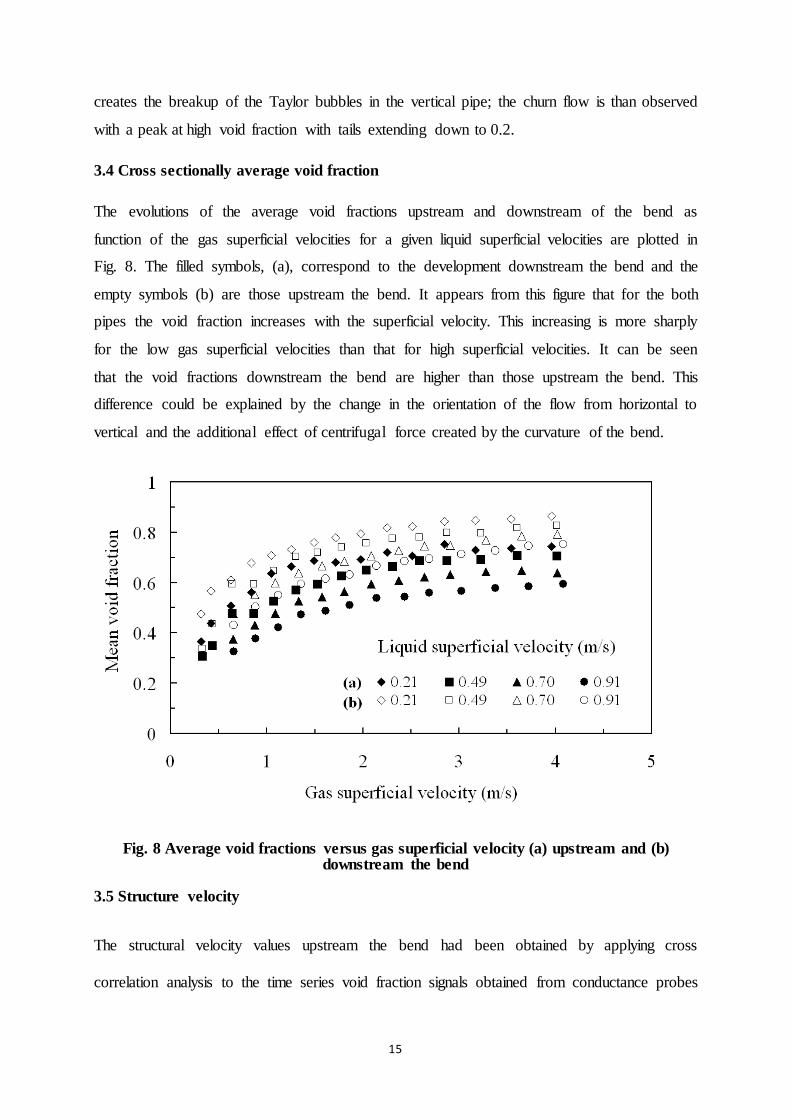
3.4 Cross sectionally average void fraction
The evolutions of the average void fractions upstream and downstream of the bend as
function of the gas superficial velocities for a given liquid superficial velocities are plotted in
Fig. 8. The filled symbols, (a), correspond to the development downstream the bend and the
empty symbols (b) are those upstream the bend. It appears from this figure that for the both
pipes the void fraction increases with the superficial velocity. This increasing is more sharply
for the low gas superficial velocities than that for high superficial velocities. It can be seen
that the void fractions downstream the bend are higher than those upstream the bend. This
difference could be explained by the change in the orientation of the flow from horizontal to
vertical and the additional effect of centrifugal force created by the curvature of the bend.
Fig. 8 Average void fractions versus gas superficial velocity (a) upstream and (b) downstream the bend
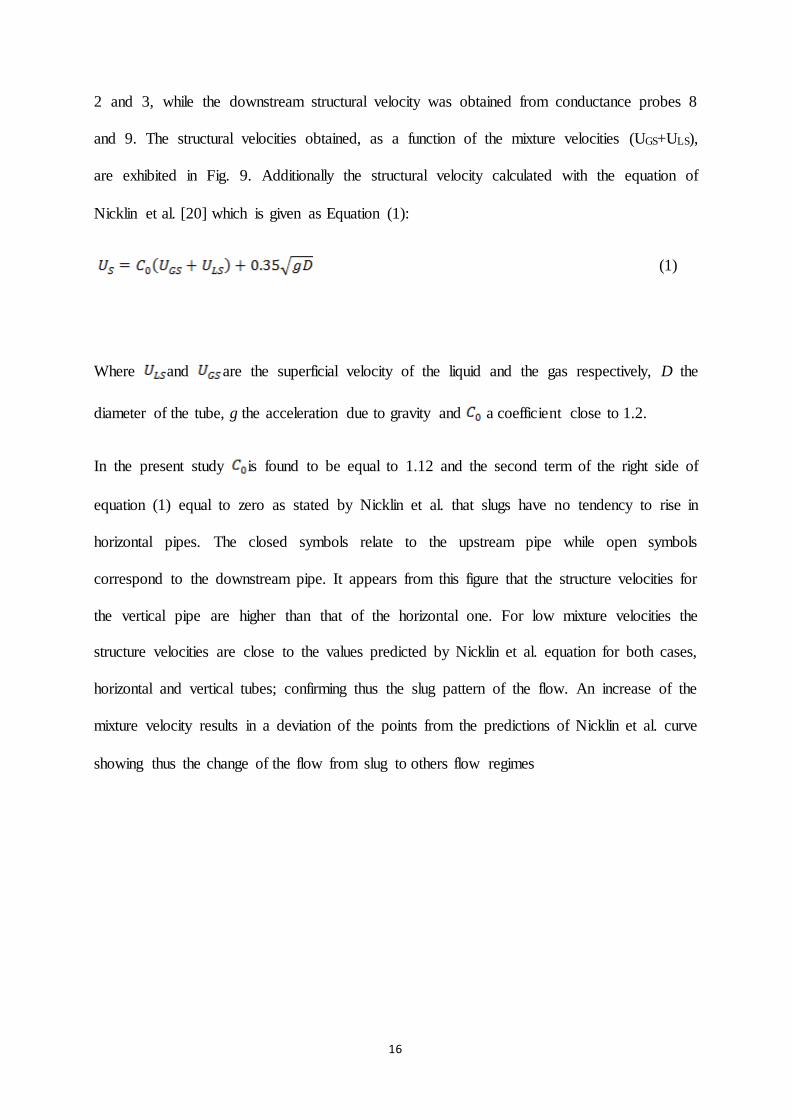
3.5 Structure velocity
The structural velocity values upstream the bend had been obtained by applying cross
correlation analysis to the time series void fraction signals obtained from conductance probes
16
2 and 3, while the downstream structural velocity was obtained from conductance probes 8
and 9. The structural velocities obtained, as a function of the mixture velocities (UGS+ULS),
are exhibited in Fig. 9. Additionally the structural velocity calculated with the equation of
Nicklin et al. [20] which is given as Equation (1):
(1)
Where and are the superficial velocity of the liquid and the gas respectively, D the
diameter of the tube, g the acceleration due to gravity and a coefficient close to 1.2.
In the present study is found to be equal to 1.12 and the second term of the right side of
equation (1) equal to zero as stated by Nicklin et al. that slugs have no tendency to rise in
horizontal pipes. The closed symbols relate to the upstream pipe while open symbols
correspond to the downstream pipe. It appears from this figure that the structure velocities for
the vertical pipe are higher than that of the horizontal one. For low mixture velocities the
structure velocities are close to the values predicted by Nicklin et al. equation for both cases,
horizontal and vertical tubes; confirming thus the slug pattern of the flow. An increase of the
mixture velocity results in a deviation of the points from the predictions of Nicklin et al. curve
showing thus the change of the flow from slug to others flow regimes
17
Fig. 9 Structural velocities against mixture velocity upstream and downstream the bend
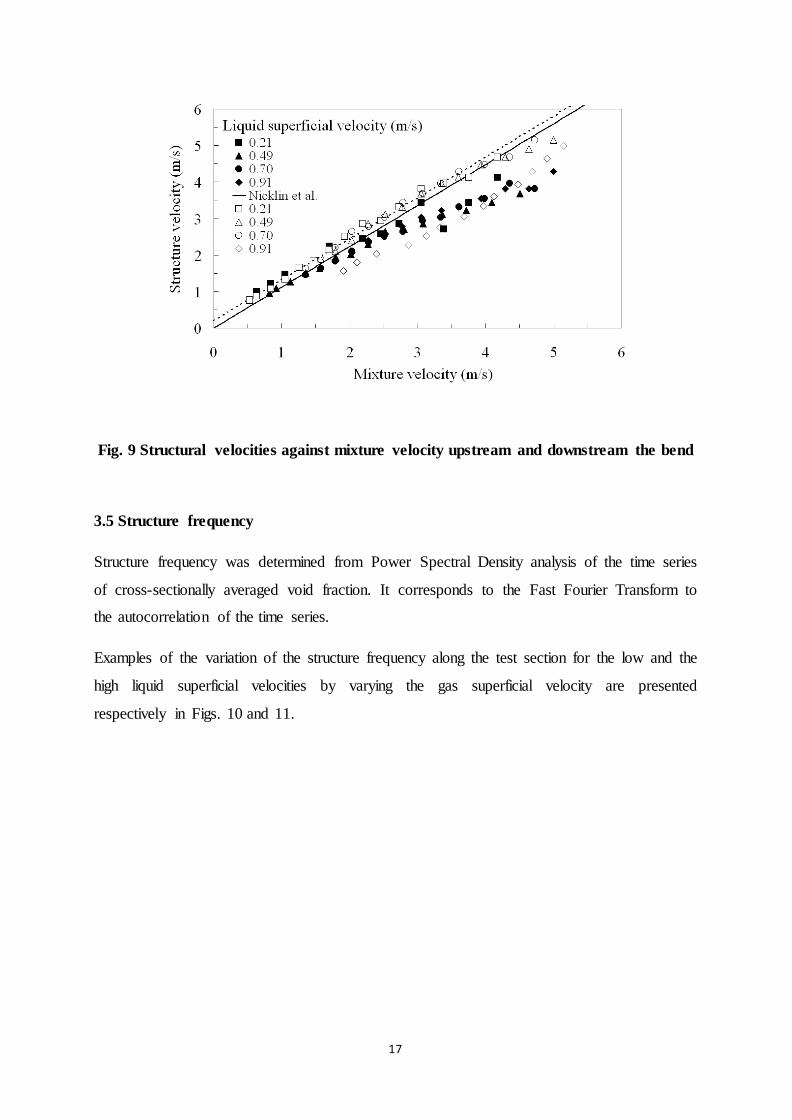
3.5 Structure frequency
Structure frequency was determined from Power Spectral Density analysis of the time series
of cross-sectionally averaged void fraction. It corresponds to the Fast Fourier Transform to
the autocorrelation of the time series.
Examples of the variation of the structure frequency along the test section for the low and the
high liquid superficial velocities by varying the gas superficial velocity are presented
respectively in Figs. 10 and 11.
18
Fig. 10 Evolution of the frequency along the test section for low liquid superficial velocity (= 0.21 m/s)
One can remark that for the case of low liquid superficial velocity the frequency is persistent
from horizontal to vertical pipe only for the two lowest gas superficial velocities and increases
for the other gas superficial velocities. On the other hand for high liquid superficial velocity,
Fig. 11, it is evident that for the all superficial gas velocities the frequency remains persistent.
19
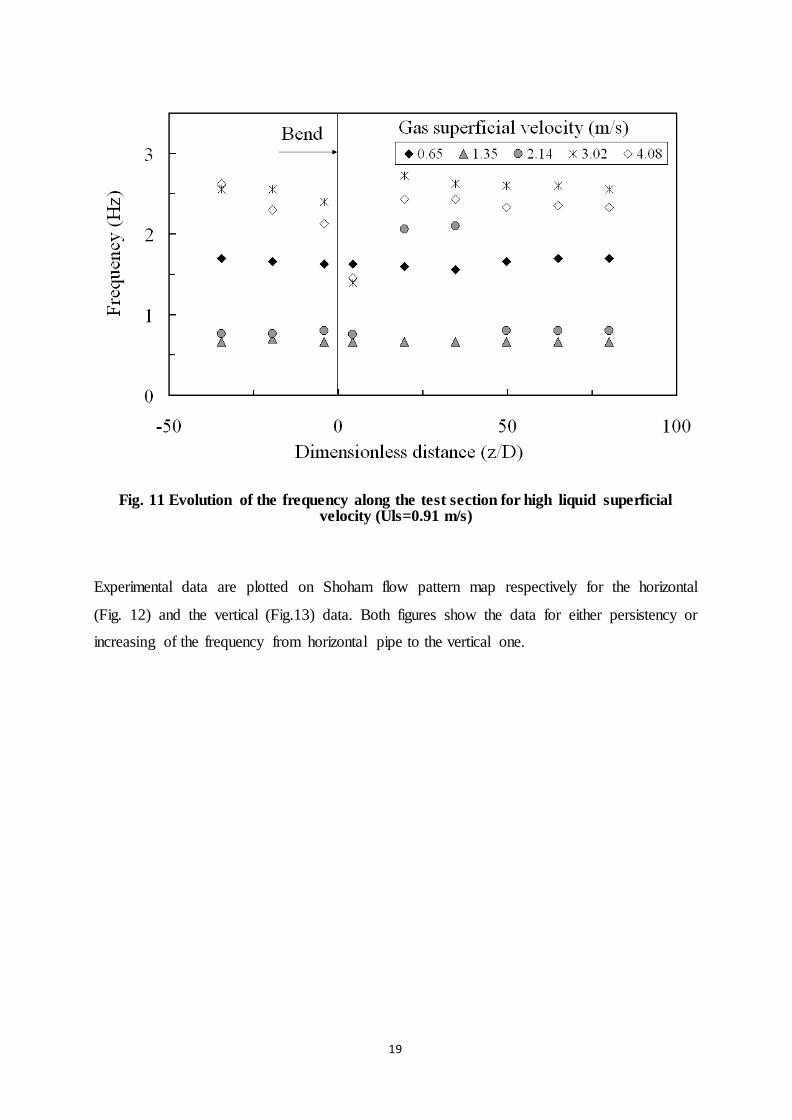
Fig. 11 Evolution of the frequency along the test section for high liquid superficial velocity (Uls=0.91 m/s)
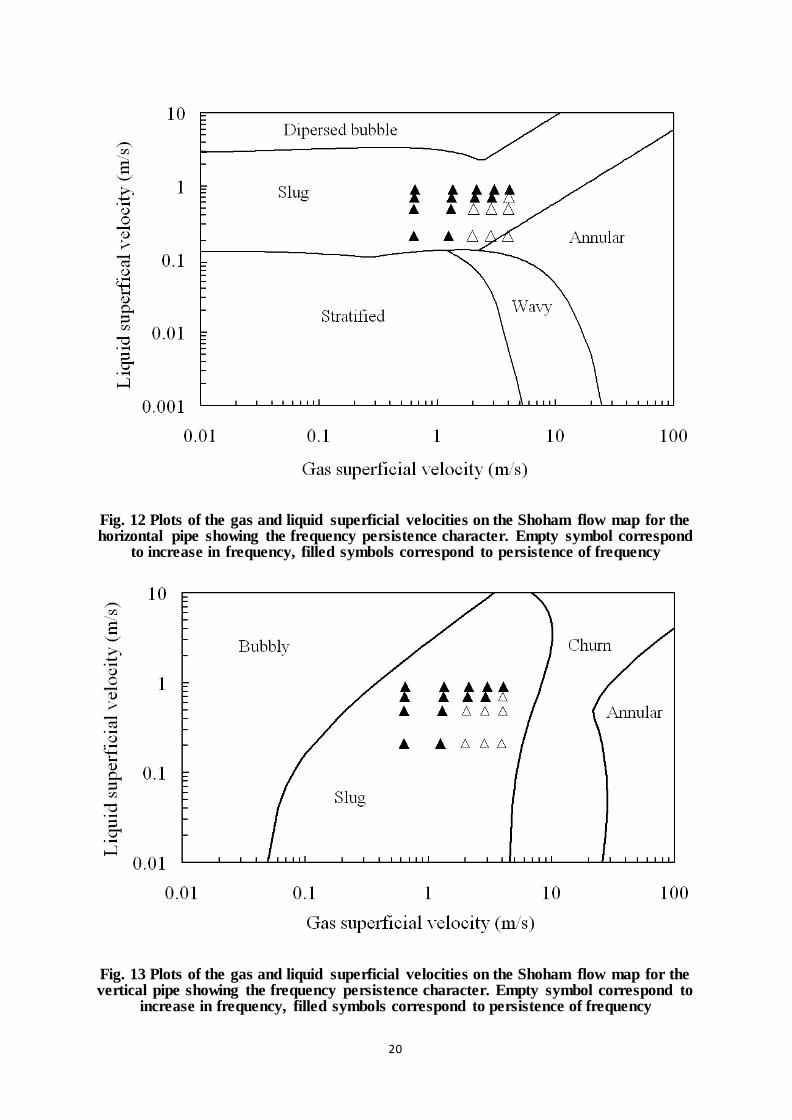
Experimental data are plotted on Shoham flow pattern map respectively for the horizontal
(Fig. 12) and the vertical (Fig.13) data. Both figures show the data for either persistency or
increasing of the frequency from horizontal pipe to the vertical one.
20
Fig. 12 Plots of the gas and liquid superficial velocities on the Shoham flow map for the horizontal pipe showing the frequency persistence character. Empty symbol correspond
to increase in frequency, filled symbols correspond to persistence of frequency
Fig. 13 Plots of the gas and liquid superficial velocities on the Shoham flow map for the vertical pipe showing the frequency persistence character. Empty symbol correspond to
increase in frequency, filled symbols correspond to persistence of frequency
21
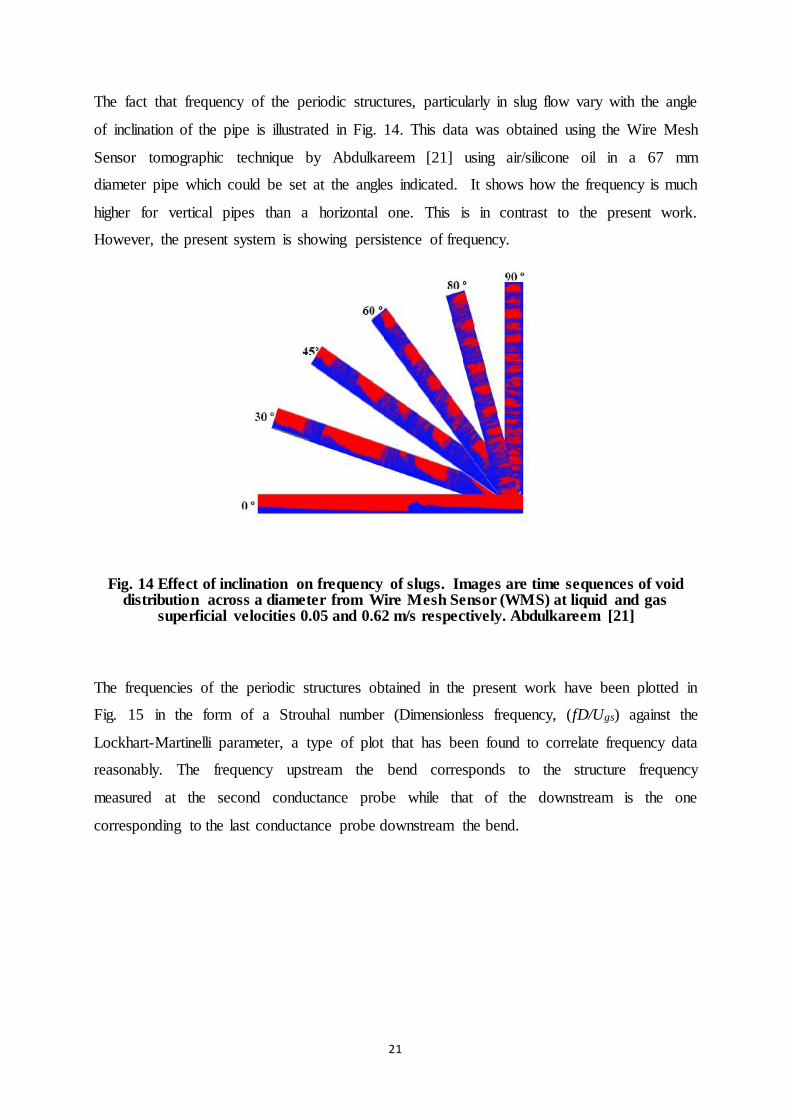
The fact that frequency of the periodic structures, particularly in slug flow vary with the angle
of inclination of the pipe is illustrated in Fig. 14. This data was obtained using the Wire Mesh
Sensor tomographic technique by Abdulkareem [21] using air/silicone oil in a 67 mm
diameter pipe which could be set at the angles indicated. It shows how the frequency is much
higher for vertical pipes than a horizontal one. This is in contrast to the present work.
However, the present system is showing persistence of frequency.
Fig. 14 Effect of inclination on frequency of slugs. Images are time sequences of void distribution across a diameter from Wire Mesh Sensor (WMS) at liquid and gas
superficial velocities 0.05 and 0.62 m/s respectively. Abdulkareem [21]
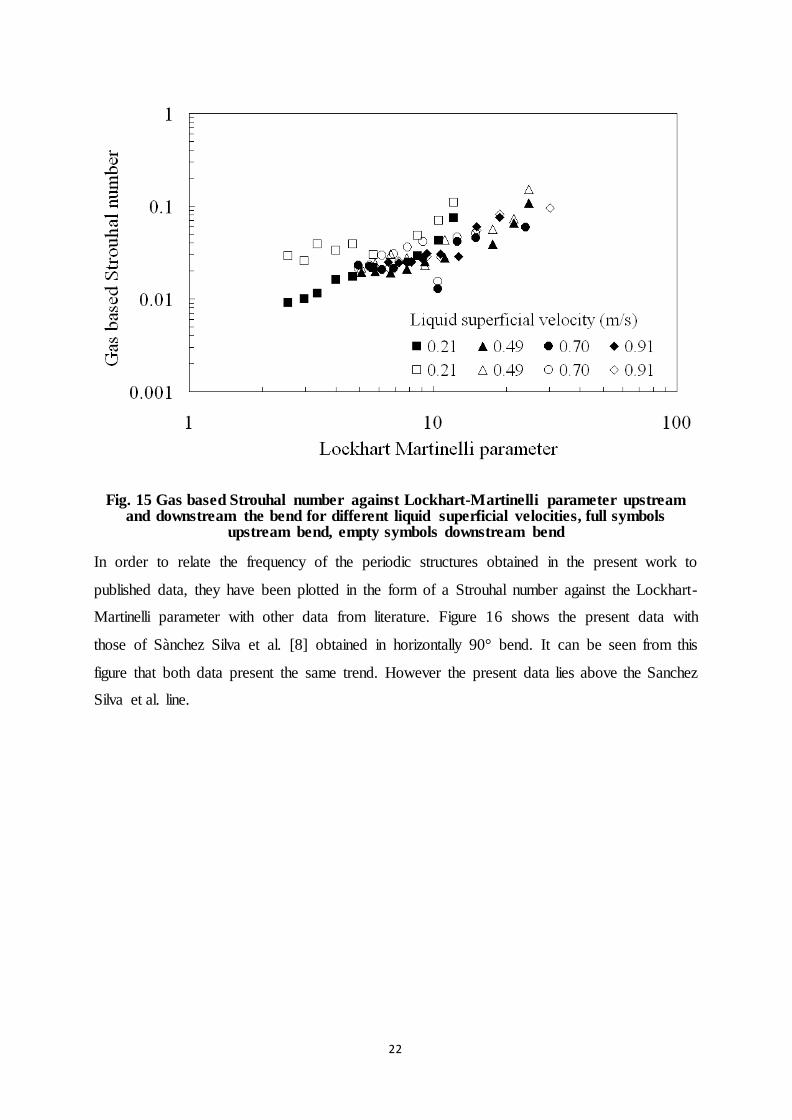
The frequencies of the periodic structures obtained in the present work have been plotted in
Fig. 15 in the form of a Strouhal number (Dimensionless frequency, (fD/Ugs) against the
Lockhart-Martinelli parameter, a type of plot that has been found to correlate frequency data
reasonably. The frequency upstream the bend corresponds to the structure frequency
measured at the second conductance probe while that of the downstream is the one
corresponding to the last conductance probe downstream the bend.
22
Fig. 15 Gas based Strouhal number against Lockhart-Martinelli parameter upstream and downstream the bend for different liquid superficial velocities, full symbols
upstream bend, empty symbols downstream bend
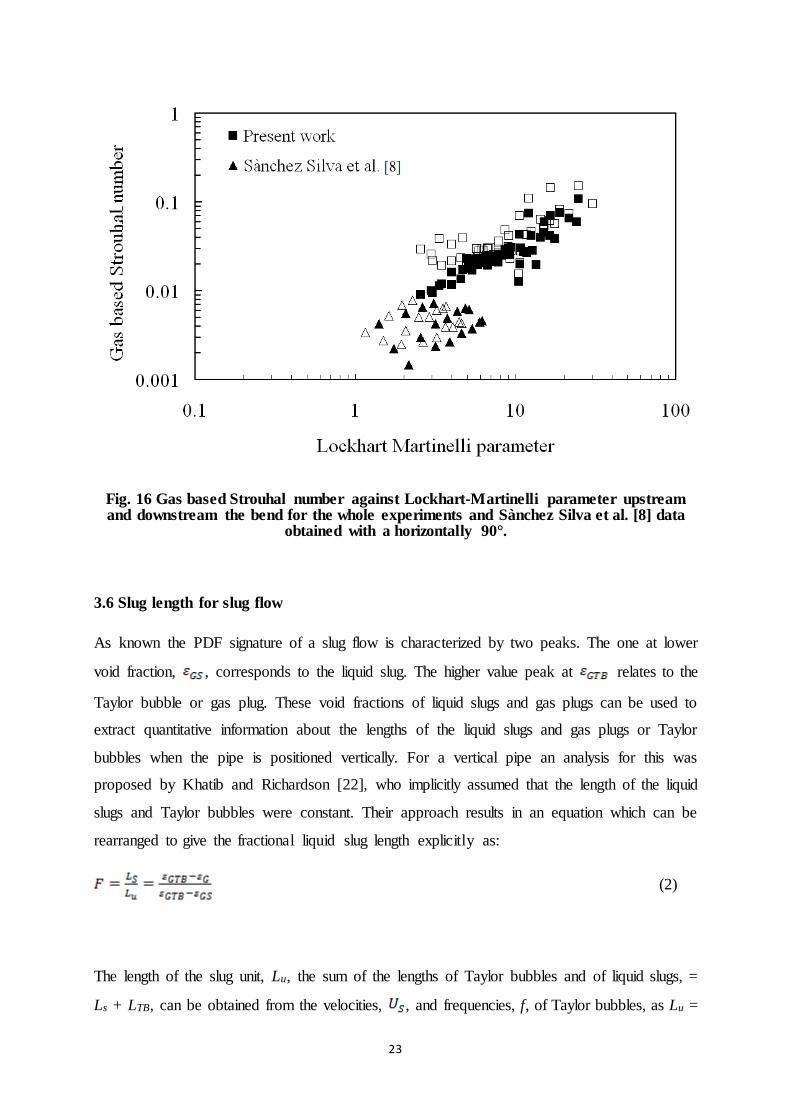
In order to relate the frequency of the periodic structures obtained in the present work to
published data, they have been plotted in the form of a Strouhal number against the Lockhart-
Martinelli parameter with other data from literature. Figure 16 shows the present data with
those of Sànchez Silva et al. [8] obtained in horizontally 90° bend. It can be seen from this
figure that both data present the same trend. However the present data lies above the Sanchez
Silva et al. line.
23
Fig. 16 Gas based Strouhal number against Lockhart-Martinelli parameter upstream and downstream the bend for the whole experiments and Sànchez Silva et al. [8] data
obtained with a horizontally 90°.
3.6 Slug length for slug flow
As known the PDF signature of a slug flow is characterized by two peaks. The one at lower
void fraction, , corresponds to the liquid slug. The higher value peak at relates to the
Taylor bubble or gas plug. These void fractions of liquid slugs and gas plugs can be used to
extract quantitative information about the lengths of the liquid slugs and gas plugs or Taylor
bubbles when the pipe is positioned vertically. For a vertical pipe an analysis for this was
proposed by Khatib and Richardson [22], who implicitly assumed that the length of the liquid
slugs and Taylor bubbles were constant. Their approach results in an equation which can be
rearranged to give the fractional liquid slug length explicitly as:
(2)
The length of the slug unit, Lu, the sum of the lengths of Taylor bubbles and of liquid slugs, =
Ls + LTB, can be obtained from the velocities, , and frequencies, f, of Taylor bubbles, as Lu =
24
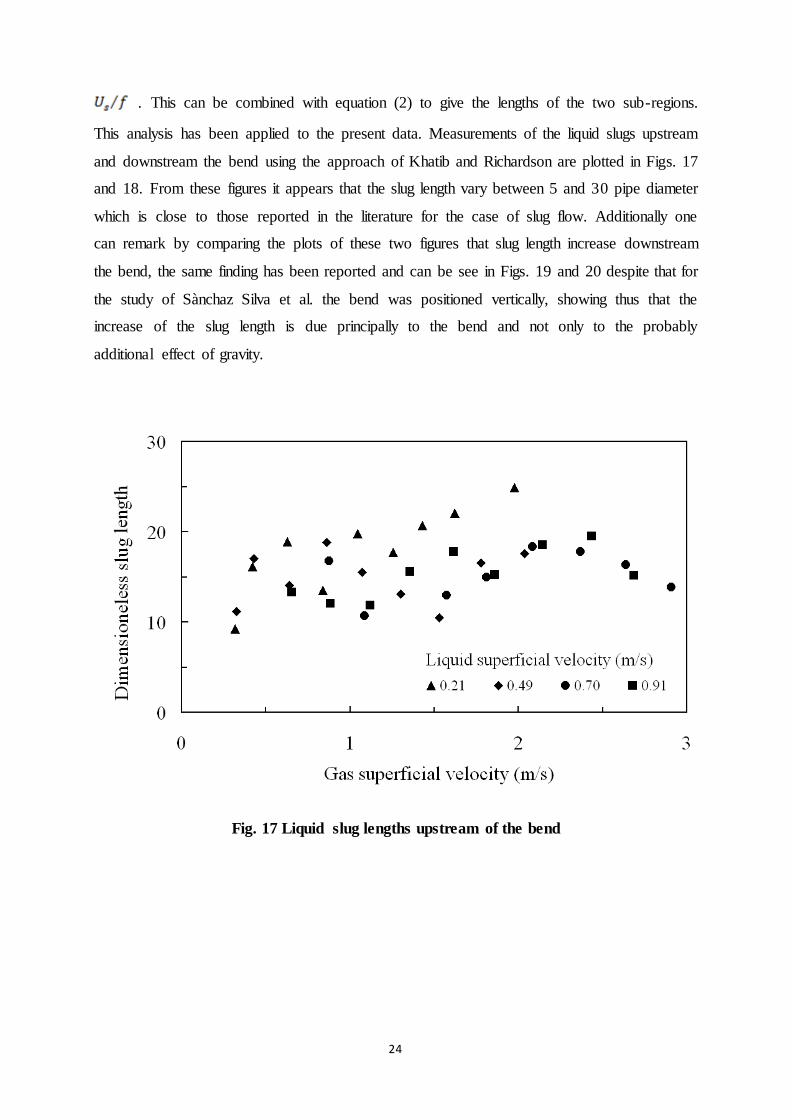
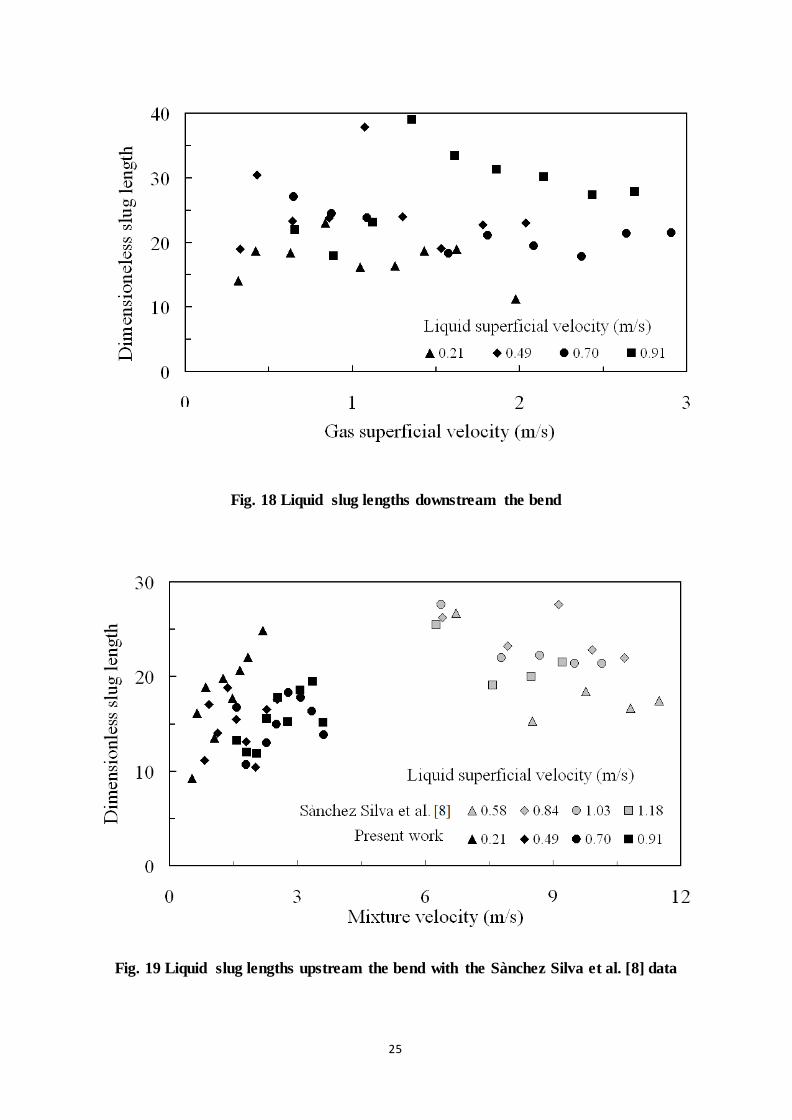
. This can be combined with equation (2) to give the lengths of the two sub-regions.
This analysis has been applied to the present data. Measurements of the liquid slugs upstream
and downstream the bend using the approach of Khatib and Richardson are plotted in Figs. 17
and 18. From these figures it appears that the slug length vary between 5 and 30 pipe diameter
which is close to those reported in the literature for the case of slug flow. Additionally one
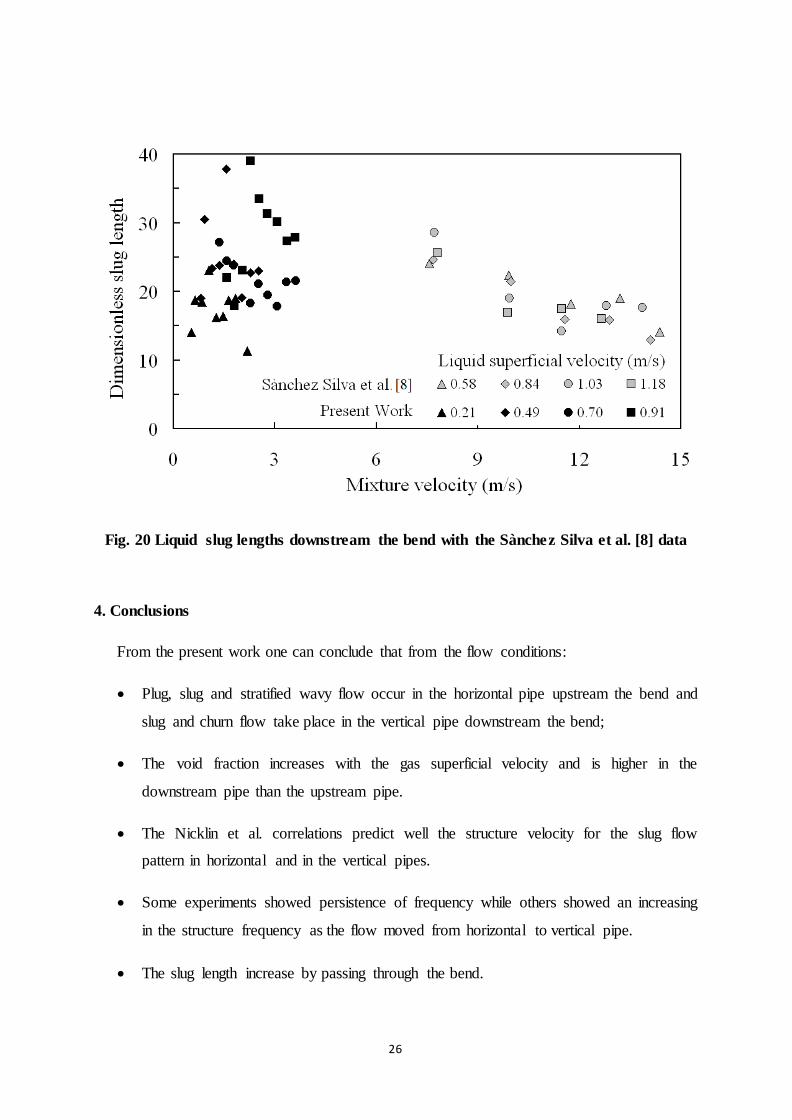
can remark by comparing the plots of these two figures that slug length increase downstream
the bend, the same finding has been reported and can be see in Figs. 19 and 20 despite that for
the study of Sànchaz Silva et al. the bend was positioned vertically, showing thus that the
increase of the slug length is due principally to the bend and not only to the probably
additional effect of gravity.
Fig. 17 Liquid slug lengths upstream of the bend
25
Fig. 18 Liquid slug lengths downstream the bend
Fig. 19 Liquid slug lengths upstream the bend with the Sànchez Silva et al. [8] data
26
Fig. 20 Liquid slug lengths downstream the bend with the Sànchez Silva et al. [8] data
4. Conclusions
From the present work one can conclude that from the flow conditions:
Plug, slug and stratified wavy flow occur in the horizontal pipe upstream the bend and
slug and churn flow take place in the vertical pipe downstream the bend;
The void fraction increases with the gas superficial velocity and is higher in the
downstream pipe than the upstream pipe.
The Nicklin et al. correlations predict well the structure velocity for the slug flow
pattern in horizontal and in the vertical pipes.
Some experiments showed persistence of frequency while others showed an increasing
in the structure frequency as the flow moved from horizontal to vertical pipe.
The slug length increase by passing through the bend.
27
References
[1] A. Azzi, L. Friedel and S. Belaadi, Two-phase gas/liquid flow pressure loss in bends,
ForschungimIngenieurwesen. 65 (2000) 309-318.
[2] B.J. Azzopardi, Gas-liquid flows, Begell House, Connecticut (2006).
[3] G.C. Gardner, P.H. Neller, Phase distribution in flow of an air-water mixture round
bends and past obstructions at the wall of 76 mm bore tube, Proceedings of the
Institution of Mechanical Engineers 184, (1969) p36.
[4] C. Maddock, P.M.C. Lacey, M.A. Patrick, The structure of two-phase flow in a curved
pipe, Symposium on Multiphase flow systems, University of Strathclyde, Glasgow,
paper J2, published as Institution of Chemical Engineers Symposium, Series No 38
(1974).
[5] M. Abdulkadir, D. Zhao, S. Sharaf, L. Abdulkareem, I.S. Lowndes and B.J.
Azzopardi, Interrogating the effect of 90° bends on air-silicone oil flows using
advanced instrumentation, Chem. Eng. Sci., 66 (2011) 2453-2467.
[6] A.M. Ribeiro, T.R. Bott, D.M. Jepson, The influence of a bend on drop sizes in
horizontal annular two-phase flow. Int. J. Multiphase Flow 27 (2001) 721-728.
[7] K. Sekoguchi, Y. Sato and A. Karayasaki, The influence of mixers, bends and exit
section on horizontal two-phase flow, Co Current gas-liquid flow, Plenum Press,
(1969).
[8] F. Sánchez Silva, A. Henández Gómez and M. Toledo Velázquez, Experimental
characterization of air-water slug flow through a 90° horizontal elbow, Proc. Two-
Phase Flow Modeling and Experimentation, G.P. Celata, P.Di Marco and R.K. Shah
(Editors) Edizioni ETS, Pisa, (1999).
[9] H.J.W.M. Legius, Propagation of pulsations and waves in two-phase pipe systems,
Ph.D. thesis, TechnischeUniversiteit Delft, Delft, Netherlands, (1997).
[10] N.K. Omebere-Iyari and B.J. Azzopardi, Gas/liquid flow in a large riser: effect
of upstream configurations, Proc 13th International Conference on Multiphase
Production Technology ’07 Edinburgh, UK: 13-15 june (2007).
[11] N.A. Tsochatzidis, T.D. Karapantsios, M.V. Vostoglou, A.J. Karabelas, A
conductance probe for measuring liquid fraction in pipes and packed beds, Int. J.of
Multiphase Flow 18(1992), 653–667.
[12] M. Fossa, 1998. Design and performance of a conductance probe for measuring
28
liquid fraction in two-phase gas-liquid flow, Flow Meas. Inst., 9 (1998) 103–109.
[13] M. Abdulkadir, D. Zhao, A. Azzi, I.S. Lowndes, B.J. Azzopardi, Two-phase
air-water flow through a large diameter vertical 180° bend, Chem. Eng. Sci., 79(2012),
138-152.
[14] T. Morsi T, Contribution au développement d'une chaîne de mesure de
conductance dédiée à l'identification des configurations d'écoulements diphasiques.
M.Sc. thesis, USTHB University, Algiers, (2012).
[15] T. Morsi T., N. Ababou, A. Ababou, F. Saïdj, S. Arezki S., A. Azzi, Improved
electronic conditioning circuit for conductance probe technique. Conférence
Internationale sur l’Automatique et la Mécatronique, CIAM’2011, Oran, Algeria. 22-
24 November (2011).
[16] G. Costigan and P.B. Whalley, Slug flow regime identification from dynamic
void fraction measurements in vertical air-water flows, Int. J. Multiphase Flow,
23(1997) 263–282.
[17] O. C. Jones and N. Zuber, The interrelation between void fraction fluctuations
and flow patterns in two-phase flow, Int. J. Multiphase Flow, 2(1975) 273-306.
[18] O. Shoham, Mechanistic modeling of gas-liquid two-phase flow in pipes,
Society of Petroleum Engineering, USA, (2005).
[19] H.J.W.M. Legius and H.E.A. van den Akker, Numerical and experimental
analysis of transitional gas-liquid pipe flow through a vertical bend. BHRA Group
(1997).
[20] D.J. Nicklin, J.O. Wilkes and J.F. Davidson, Two-phase flow in vertical tubes,
Trans. Inst. Chem. Eng. 40(1962) 61-68.
[21] L.A. Abdulkareem, Tomographic investigation of gas-oil flow in inclined
risers, PhD. Thesis University of Nottingham, (2011).
[22] Z. Khatib and J.F. Richardson, Vertical co-current flow of air and shear
thinning suspensions of Kaolin. Chem. Eng. Res. Des. 62(1984) 139-154.
29
Figure captions
Fig. 1 Schematic diagram of the experimental facility
Fig. 2 Repartition of the conductance probes along the test section
Fig.3 Schematic diagram of the electrical conditioning circuit Morsi et al. [15]
Fig. 4 Flow pattern map in the flow line upstream the 90°bend
Fig. 5 Flow pattern map in the riser downstream of the 90° bend
Fig. 6 Average void fraction time series along the test section upstream and downstream the
90° bend, ULS= 0.91, UGS=1.61 m/s
Fig. 7 PDFs of the void fraction function of the gas superficial velocity (a) upstream the bend
(b) downstream the bend; continue curve at the first probe downstream the bend, dashed curve
last probe downstream the bend; (liquid superficial velocity of 0.49 m/s).
Fig. 8 Average void fractions versus gas superficial velocity (a) upstream and (b) downstream
the bend
Fig. 9 Structural velocities against mixture velocity upstream and downstream the bend
Fig. 10 Evolution of the frequency along the test section for low liquid superficial velocity (=
0.21 m/s)
Fig. 11 Evolution of the frequency along the test section for high liquid superficial velocity
(Uls=0.91 m/s)
Fig. 12 Plots of the gas and liquid superficial velocities on the Shoham flow map for the
horizontal pipe showing the frequency persistence character. Empty symbol correspond to
increase in frequency, filled symbols correspond to persistence of frequency
30
Fig. 13 Plots of the gas and liquid superficial velocities on the Shoham flow map for the
vertical pipe showing the frequency persistence character. Empty symbol correspond to
increase in frequency, filled symbols correspond to persistence of frequency
Fig. 14 Effect of inclination on frequency of slugs. Images are time sequences of void
distribution across a diameter from Wire Mesh Sensor (WMS) at liquid and gas superficial
velocities 0.05 and 0.62 m/s respectively. Abdulkareem [21]
Fig. 15 Gas based Strouhal number against Lockhart-Martinelli parameter upstream and
downstream the bend for different liquid superficial velocities, full symbols upstream bend,
empty symbols downstream bend
Fig. 16 Gas based Strouhal number against Lockhart-Martinelli parameter upstream and
downstream the bend for the whole experiments and Sànchez Silva et al. [7] data obtained
with a horizontally 90°.
Fig. 17 Liquid slug lengths upstream of the bend
Fig. 18 Liquid slug lengths downstream the bend
Fig. 19 Liquid slug lengths upstream the bend with the Sànchez Silva et al. [7] data
Fig. 20 Liquid slug lengths downstream the bend with the Sànchez Silva et al. [7] data


![NON LINEAR STATIC ANALYSIS OF A REINFORCED … mehani+kibboua rae 58.pdfClassical steps of the Eurocode 8 approach are then [6]: -Cantilever model of the structure with concentrated](https://img.pdfslide.us/doc/110x75/60d69f725496bc10940f3b51/non-linear-static-analysis-of-a-reinforced-mehanikibboua-rae-58pdf-classical-steps.jpg)