Embed Size (px)
Citation preview

1
SAHARA MUTUAL FUND
Annual Report 2018-19
www.saharamutual.com
2
ANNUAL REPORT 2018-19 BOARD OF TRUSTEES Mr M R Siddiqui- Independent Trustee Mr S P Srivastava- Associate Trustee SAHARA MUTUAL FUND 97-98, 9th Floor, Atlanta Nariman Point Mumbai-400 021 SPONSOR Sahara India Financial Corporation Limited Sahara India Bhavan Kapoorthala Complex Lucknow-226 024 INVESTMENT MANAGER Sahara Asset Management Company Private Limited 97-98, 9th Floor, Atlanta Nariman Point Mumbai-400 021 REGISTRAR AND TRANSFER AGENT Karvy Computer Share Private Limited # 59, SKANDA, Puttana Road Basavangudi,, Bengaluru-560004 CUSTODIAN HDFC BANK LTD Empire Plaza 1, 4th Floor, LBS Marg, Vikhroli (W), Mumbai 400083 STATUTORY AUDITORS Chaturvedi & Partners Chartered Accountants B-102,Safalaya Behind Profit Center, Mahavir Nagar Kandivali (West), Mumbai 400067.

3
INDEX- PART I
Table of Contents Page No
Report of the Trustees 4
Independent Auditors Report on Quarterly Disclosure of Votes cast 16
Sahara Tax Gain Fund 17
Sahara Growth Fund 44
Sahara Midcap Fund 72
Sahara Wealth Plus Fund 100
Sahara Infrastructure Fund 129
Sahara R.E.A.L Fund 158
Sahara Banking and Financial Services Fund 186
Note: Auditors Report, Balance Sheet, Revenue, Schedules, Historical per Unit Statistics and Notes to
Accounts form part of each scheme.
4
REPORT OF THE TRUSTEES
We are pleased to present before you the ANNUAL REPORT of SAHARA MUTUAL FUND for the year ended March 31, 2019.
Overview of Equity Markets in 2018-19 Indian markets showed fortitude at the start of FY2018 19 and in the process, overcame multiple hurdles (i.e.
INR depreciation, Emerging markets sell-off, rising crude oil prices & rise in US 10-yr treasury yield). In fact,
the low marked in March 2018 (9,952) was not visited for the rest of the financial year. The period of chaos &
decline seen in February & March 2018 appeared to be a distant memory as the month of April 2018 brought
in a new tide of hope for the Indian indices; particularly for benchmark index (registering a rally of over 6% in
April 2018). Price performance showed that select index heavyweight stocks led from the front (i.e. HDFC,
HDFC Bank, RIL & TCS).
Despite multiple issues, previous financial year underlined the resilience & strength of Indian markets (Nifty
up ~15%). Nifty not only outperformed the MSCI emerging markets index (down 9%), but its global peers as
well (Both Dow Jones & S&P 500 up ~9% each & MSCI World index up 3%).What's more, even the macro
headwinds - a strong Dollar index and depreciating INR - had little effect on the market. This tenacity was
indeed remarkable given the fact that the rupee fell to a record low even as the Turkish lira crashed against
the US dollar. Turmoil in Turkey not only weighed on the Indian rupee but also on most Asian currencies. But
headline index hardly echoed street sentiments as both midcap & smallcaps indices did not participate with
the same gusto. It set the trend of underperformance of midcaps & small-caps for the rest of the financial year
(Nifty Midcap index lost 3% & Nifty Smallcap index tumbled 14%).
Later in December 2018, high voltage drama on the political front (i.e. state elections in Rajasthan, Madhya
Pradesh & Chattisgarh) kept indices on tenterhooks. However, markets chose to overlook BJP’s loss in key
state assembly election results as equities rebounded and even Rupee recovered significantly from day’s low
post the disruption events (including RBI’s governor resignation).
Apart from domestic issues (i.e. IL&FS and few other corporates defaulting on payments to lenders), global
economic worries also weighed heavily on Indian markets. Dow Jones registered its worst December,
recording a drop of ~9%, following a negative reaction to Fed’s interest rate hike and expectations of two more
increases in 2019. Market participants were spooked on concerns that continued rise in borrowing costs will
cause the economy to slow.
In February 2019, a shocking terror attack in Pulwama which took lives of at least 40 CRPF personnel left the
nation in a shock. Tremors of the same were felt on Dalal Street as Nifty marked a low of 10,586 post the
escalation of geo-political tension between the neighboring countries. The BJP Govt’s decision to conduct a
surgical strike at Balakot to avenge the Pulwama attack led to a strong nationalistic wave across the country
improving the sagging fortunes of the BJP and kindling hopes of a resounding victory in the ensuing Lok Sabha
elections. This triggered a catch up rally from latter half of February 2019 onwards with Nifty breaking out
from a prolonged consolidation period and the architects of the rally were Bank Nifty, Infrastructure & Midcaps.
Within the energy space, Reliance Industries was the major mover. Post the announcement of monetization
plans for tower and fibre assets of Reliance Jio, it saw a re-rating as the measure would lead to significant
reduction in debt. Meanwhile, Auto industry continued to remain under pressure on back of weak demand
environment across segments. With inventory levels piling up, wholesale volumes in March 2019 were
significantly weak. Increase in prices due to upfront payment of Insurance premium, increase in fuel prices
and slowdown in lending by the NBFCs due to the liquidity squeeze being the main reasons for the slowdown
in auto sales.
Overview of Debt Market in 2018-19 2018 saw markets everywhere, globally as well as domestically, behave like quicksilver – ever-shifting and unpredictable. The year has been one of the worst on record this decade for global bond markets. Rising benchmark interest rates, expectations of slower global growth and wavering outlook on oil prices have been
5
the key drivers for negative returns, dampening investor demands and widening spreads. The debt markets have seen a large move in both directions over the course of the year. The year was also an eventful one for debt market participants (IL&FS).The risk of contagion in the NBFC space, the year has been an eventful one. Despite 2018 being a year of negatives, the bond market outperformed equity markets for the year. The year 2019 is likely to be a year of reversals, furthering the investment case for debt markets. The year has ended with debt returns outperforming equity markets in many debt mutual fund categories. Credit risk was brought to the forefront once again, highlighting that debt funds are not risk-free investments and investors should heed caution while investing in relatively high-risk, high-reward debt products. The higher credit risk scenario has since diminished as reflected in normalised prices across the yield curve. Crude has been an impediment to the India story over the past few quarters. From a low in 2016 of approximately $30 per barrel, crude prices jumped to $82 per barrel in mid-September 2018 raising concerns on inflation and a possible breach of the fiscal deficit targets. A sharp reversal over the past few months has raised optimism levels given India is a large crude importer. This has also reflected positively across rates and the currency. We anticipate crude to remain fairly volatile over the next year given heightened geopolitical tensions and the demand-supply mismatch. India remained a relative favorite with foreign investors looking at emerging markets despite the overall global shift away from emerging markets. This is due to the bright spots of opportunity India continues to offer. It also retained its tag as the fastest growing nation by GDP growth rate as growth waned across most of the developing world amid a sagging global economic environment. Currently, India continues to offer high real rates and a stable currency and hence remains a strong contender for foreign debt capital. GDP numbers should be seen in context of a normalizing base post GST implementation. While the full impact of GST on the GDP base has not been captured, we anticipate the high crude oil prices during the quarter may have exasperated the downtick. This is likely to get balanced out in the coming quarters. The long-term story continues to remain intact given the strong high frequency numbers and strong corporate earnings. The IL&FS default sent shock waves across the NBFC space in early August 2018 as concerns over asset liability mismatches and poor risk management protocols in the quest for a growth blitzkrieg were brought to the fore. Timely action by RBI and confidence building measures by the government alleviated much of the contagion risk. An already dislocated bond market favouring short-tenor debt instruments saw some degree of aggravation as market participants took a back seat and were in a wait-and-watch mode as news flow drove debt market valuations. This was a short-term market liquidity crunch and re-emphasised the need for continuous credit evaluation and responsible investing. The market is now slowly finding its way back to normalcy as rates have returned to pre-crises levels.
Outlook for the period 2019-20
Equity Market:
The uncertainty with regards to the continuity of the reforms programs launched by the previous government
is now reduced with the incumbent government coming back to power with majority numbers. However, the
slowing global growth, ongoing US-China trade war etc. could have a negative impact on overall EM growth,
including that of India. While fiscal and monetary strategies would help arrest the slide in growth in the near-
term, it is unlikely to be able to push up GDP growth significantly in FY20, with growth expectations revised
down by the RBI to 7% from 7.2% in its June 2019 meet.
FY20 however will remain crucial for policy announcements and implementation by the new government, that
is likely to shape the future growth prospects of India. Agricultural reforms would be in focus in line with the
government’s target of doubling farm income. The Rs.25 lakh crores investment in the agricultural sector has
been promised. The Govt. is hoping to reduce wastage of food produce by setting up a network of warehouses.
Following through on its electoral promises as laid down in its manifesto the BJP Govt. has expanded the PM
Kisan Sanman Nidhi Yojana to all farmers from the current coverage of small and medium farmers. Another
key focal point will be investments in infrastructure sector. While the BJP manifesto places the target
ambitiously at Rs.100tn by year 2024, we hope for a more pragmatic approach given the limited fiscal space
available.
6
The auto sector could continue to languish due to changing emission regulations. The funding crunch facing
NBFCs dominated FY19 impacting consumption oriented sectors. This could continue to remain in focus in the
first half of FY20, given that the NBFC issue is a solvency issue rather than a liquidity issue and thus could take
time to sort itself out. Assuming no further accidents, some clarity on the sector can be expected in H2FY20.
With the Govt. trying to address farm distress on a war footing coupled with a normal monsoon we could see
some revival in the fortunes of FMCG companies in H2FY20.
Debt Market:
We do not believe that there is material risk of financial instability and hence RBI is likely to continue to focus on inflation trajectory. With the current inflation trajectory and RBI’s inflation projection for the year at 4%, we don’t see significant moves on the repo rate front for the rest of the financial year. As the shadow of the IL&FS saga and the NBFC liquidity crunch recede, 2019 is likely to be a better year for debt against the backdrop of lower crude and stable macros. However, the fiscal position is likely to remain an overhang given that current GST collections are far lower than budgeted expectations and non-tax revenue growth continues to remain tepid.
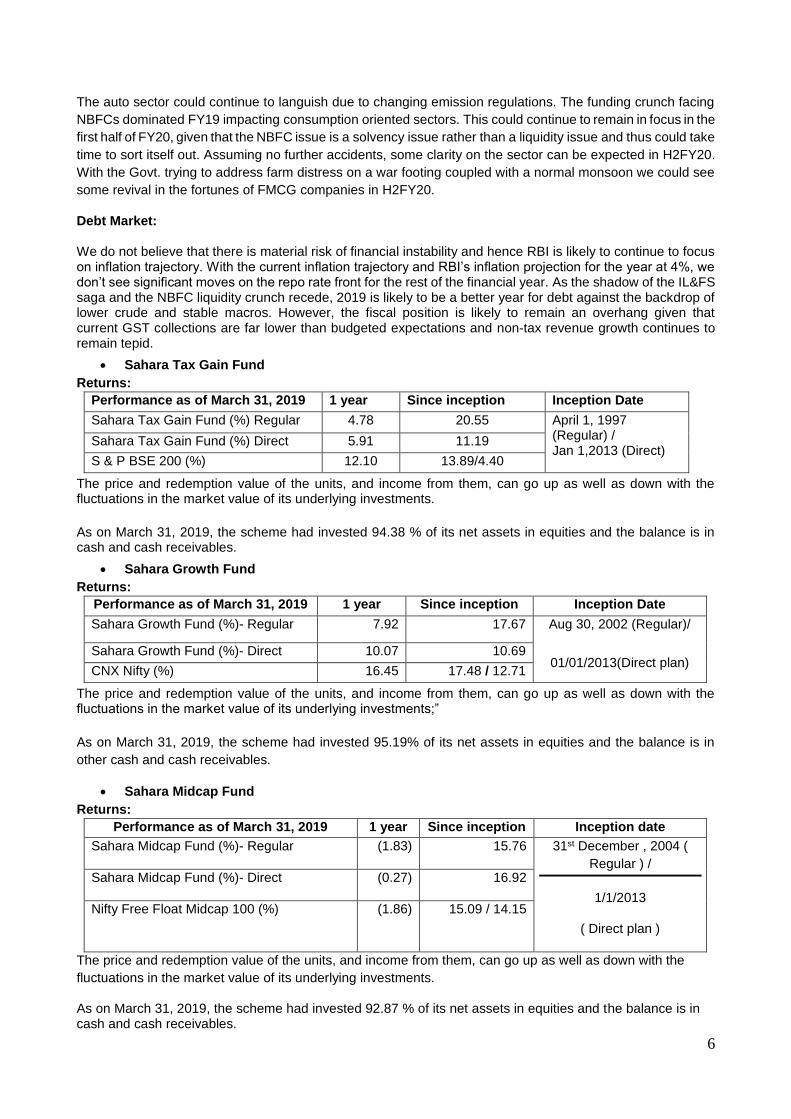
Sahara Tax Gain Fund
Returns:
Performance as of March 31, 2019 1 year Since inception Inception Date
Sahara Tax Gain Fund (%) Regular 4.78 20.55 April 1, 1997 (Regular) / Jan 1,2013 (Direct)
Sahara Tax Gain Fund (%) Direct 5.91 11.19
S & P BSE 200 (%) 12.10 13.89/4.40
The price and redemption value of the units, and income from them, can go up as well as down with the fluctuations in the market value of its underlying investments.
As on March 31, 2019, the scheme had invested 94.38 % of its net assets in equities and the balance is in cash and cash receivables.
Sahara Growth Fund
Returns:
Performance as of March 31, 2019 1 year Since inception Inception Date
Sahara Growth Fund (%)- Regular 7.92 17.67 Aug 30, 2002 (Regular)/
01/01/2013(Direct plan) Sahara Growth Fund (%)- Direct 10.07 10.69
CNX Nifty (%) 16.45 17.48 / 12.71
The price and redemption value of the units, and income from them, can go up as well as down with the fluctuations in the market value of its underlying investments;”
As on March 31, 2019, the scheme had invested 95.19% of its net assets in equities and the balance is in
other cash and cash receivables.
Sahara Midcap Fund
Returns:
Performance as of March 31, 2019 1 year Since inception Inception date
Sahara Midcap Fund (%)- Regular (1.83) 15.76 31st December , 2004 (
Regular ) /
1/1/2013
( Direct plan )
Sahara Midcap Fund (%)- Direct (0.27) 16.92
Nifty Free Float Midcap 100 (%) (1.86) 15.09 / 14.15
The price and redemption value of the units, and income from them, can go up as well as down with the
fluctuations in the market value of its underlying investments.
As on March 31, 2019, the scheme had invested 92.87 % of its net assets in equities and the balance is in cash and cash receivables.
7
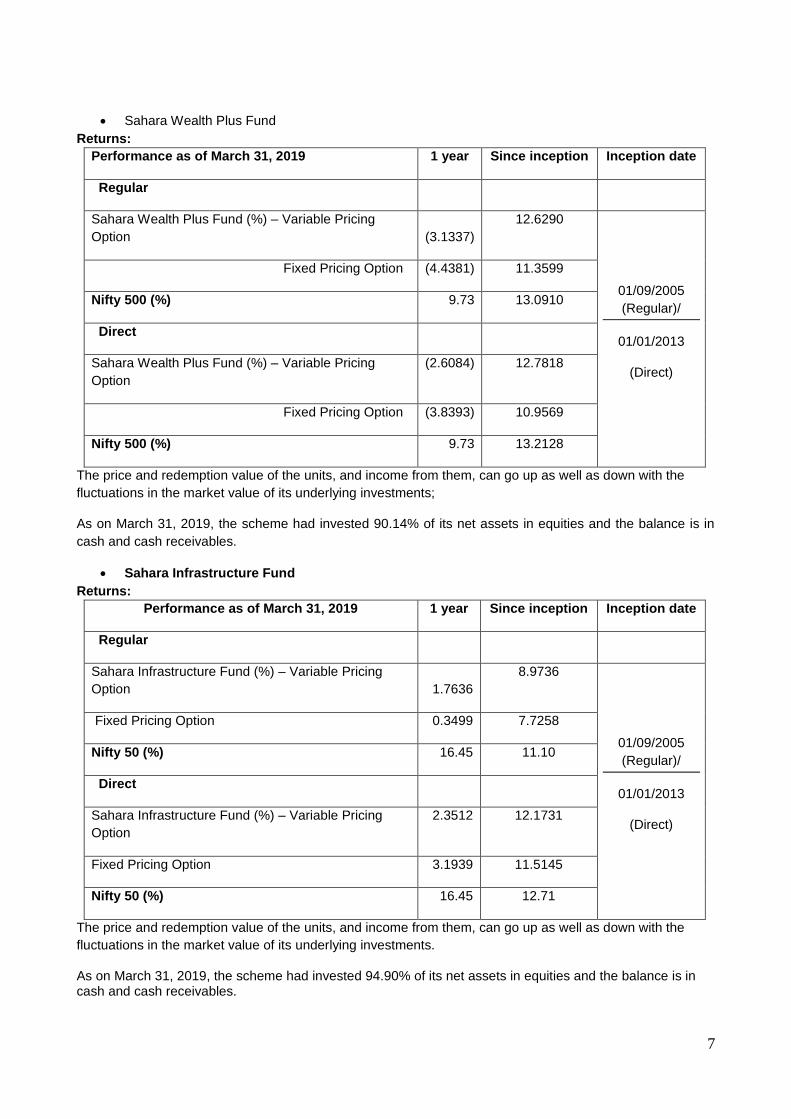
Sahara Wealth Plus Fund
Returns:
Performance as of March 31, 2019 1 year Since inception Inception date
Regular
Sahara Wealth Plus Fund (%) – Variable Pricing
Option (3.1337)
12.6290
01/09/2005
(Regular)/
01/01/2013
(Direct)
Fixed Pricing Option (4.4381) 11.3599
Nifty 500 (%) 9.73 13.0910
Direct
Sahara Wealth Plus Fund (%) – Variable Pricing
Option
(2.6084) 12.7818
Fixed Pricing Option (3.8393) 10.9569
Nifty 500 (%) 9.73 13.2128
The price and redemption value of the units, and income from them, can go up as well as down with the
fluctuations in the market value of its underlying investments;
As on March 31, 2019, the scheme had invested 90.14% of its net assets in equities and the balance is in
cash and cash receivables.
Sahara Infrastructure Fund
Returns:
Performance as of March 31, 2019 1 year Since inception Inception date
Regular
Sahara Infrastructure Fund (%) – Variable Pricing
Option 1.7636
8.9736
01/09/2005
(Regular)/
01/01/2013
(Direct)
Fixed Pricing Option 0.3499 7.7258
Nifty 50 (%) 16.45 11.10
Direct
Sahara Infrastructure Fund (%) – Variable Pricing
Option
2.3512 12.1731
Fixed Pricing Option 3.1939 11.5145
Nifty 50 (%) 16.45 12.71
The price and redemption value of the units, and income from them, can go up as well as down with the
fluctuations in the market value of its underlying investments.
As on March 31, 2019, the scheme had invested 94.90% of its net assets in equities and the balance is in cash and cash receivables.
8
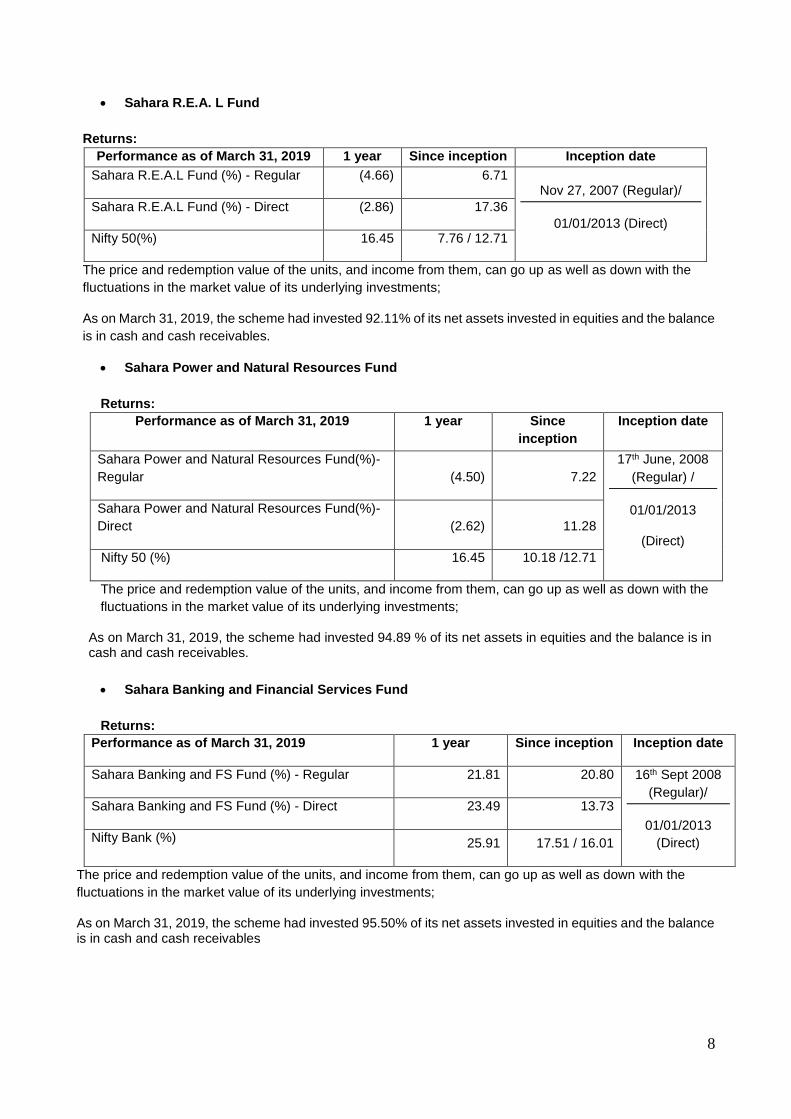
Sahara R.E.A. L Fund
Returns:
Performance as of March 31, 2019 1 year Since inception Inception date
Sahara R.E.A.L Fund (%) - Regular (4.66) 6.71 Nov 27, 2007 (Regular)/
01/01/2013 (Direct)
Sahara R.E.A.L Fund (%) - Direct (2.86) 17.36
Nifty 50(%) 16.45 7.76 / 12.71
The price and redemption value of the units, and income from them, can go up as well as down with the
fluctuations in the market value of its underlying investments;
As on March 31, 2019, the scheme had invested 92.11% of its net assets invested in equities and the balance
is in cash and cash receivables.
Sahara Power and Natural Resources Fund
Returns:
Performance as of March 31, 2019 1 year Since
inception
Inception date
Sahara Power and Natural Resources Fund(%)-
Regular (4.50) 7.22
17th June, 2008
(Regular) /
01/01/2013
(Direct)
Sahara Power and Natural Resources Fund(%)-
Direct (2.62) 11.28
Nifty 50 (%) 16.45 10.18 /12.71
The price and redemption value of the units, and income from them, can go up as well as down with the
fluctuations in the market value of its underlying investments;
As on March 31, 2019, the scheme had invested 94.89 % of its net assets in equities and the balance is in cash and cash receivables.
Sahara Banking and Financial Services Fund
Returns:
Performance as of March 31, 2019 1 year Since inception Inception date
Sahara Banking and FS Fund (%) - Regular 21.81 20.80 16th Sept 2008
(Regular)/
01/01/2013
(Direct)
Sahara Banking and FS Fund (%) - Direct 23.49 13.73
Nifty Bank (%) 25.91 17.51 / 16.01
The price and redemption value of the units, and income from them, can go up as well as down with the
fluctuations in the market value of its underlying investments;
As on March 31, 2019, the scheme had invested 95.50% of its net assets invested in equities and the balance is in cash and cash receivables
9
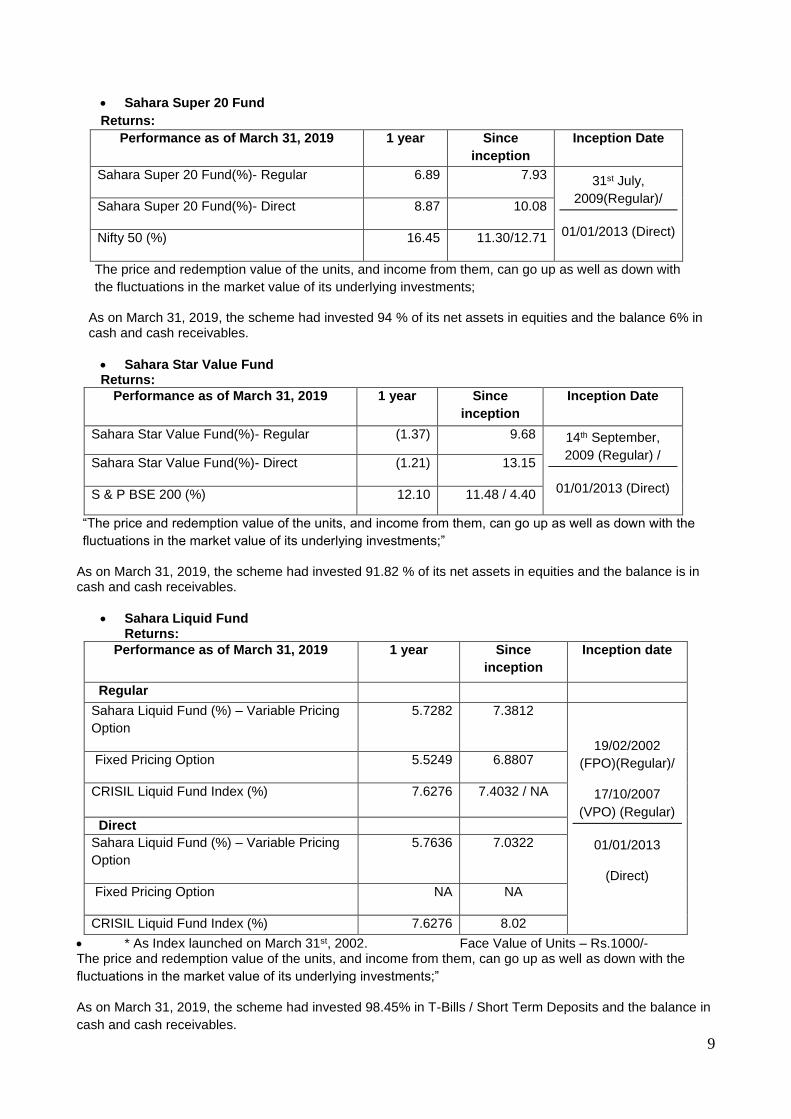
Sahara Super 20 Fund
Returns:
Performance as of March 31, 2019 1 year Since
inception
Inception Date
Sahara Super 20 Fund(%)- Regular 6.89 7.93 31st July,
2009(Regular)/
01/01/2013 (Direct)
Sahara Super 20 Fund(%)- Direct 8.87 10.08
Nifty 50 (%) 16.45 11.30/12.71
The price and redemption value of the units, and income from them, can go up as well as down with
the fluctuations in the market value of its underlying investments;
As on March 31, 2019, the scheme had invested 94 % of its net assets in equities and the balance 6% in cash and cash receivables.
Sahara Star Value Fund Returns:
Performance as of March 31, 2019 1 year Since
inception
Inception Date
Sahara Star Value Fund(%)- Regular (1.37) 9.68 14th September,
2009 (Regular) /
01/01/2013 (Direct)
Sahara Star Value Fund(%)- Direct (1.21) 13.15
S & P BSE 200 (%) 12.10 11.48 / 4.40
“The price and redemption value of the units, and income from them, can go up as well as down with the
fluctuations in the market value of its underlying investments;”
As on March 31, 2019, the scheme had invested 91.82 % of its net assets in equities and the balance is in cash and cash receivables.
Sahara Liquid Fund Returns:
Performance as of March 31, 2019 1 year Since
inception
Inception date
Regular
Sahara Liquid Fund (%) – Variable Pricing
Option
5.7282 7.3812
19/02/2002
(FPO)(Regular)/
17/10/2007
(VPO) (Regular)
01/01/2013
(Direct)
Fixed Pricing Option 5.5249 6.8807
CRISIL Liquid Fund Index (%) 7.6276 7.4032 / NA
Direct
Sahara Liquid Fund (%) – Variable Pricing
Option
5.7636 7.0322
Fixed Pricing Option NA NA
CRISIL Liquid Fund Index (%) 7.6276 8.02
* As Index launched on March 31st, 2002. Face Value of Units – Rs.1000/- The price and redemption value of the units, and income from them, can go up as well as down with the
fluctuations in the market value of its underlying investments;”
As on March 31, 2019, the scheme had invested 98.45% in T-Bills / Short Term Deposits and the balance in
cash and cash receivables.

10
2. Brief Background of Sponsor, Trust and AMC Company
a. Sahara Mutual Fund
Sahara Mutual Fund (SMF) has been established as a Trust by the Trust Deed (amended from time to time) dated 18th July, 1996 in accordance with the Indian Trusts Act, 1882, and duly registered under the Indian Registration Act, 1908, sponsored by Sahara India Financial Corporation Limited (“SIFCL”).
The Trustees have appointed Sahara Asset Management Company Private Limited as the Investment Manager to Sahara Mutual Fund to function as the Investment Manager for all the schemes of Sahara Mutual Fund. Sahara Mutual Fund was registered with SEBI on 1st October, 1996.
SEBI vide its Order no: WTM/PS/26/IMD/DOF-III/July/2015 dated 28th July, 2015 directed cancellation of
“Certificate of Registration” of Sahara Mutual Fund which was to be effective on expiry of six months from the
date of the Order. Further, SEBI also directed by the said Order that the Mutual Fund shall not take any new
subscription from investors. Accordingly, Sahara Mutual Fund has not taken any new subscription from the
investors (including existing investors) in line with the said SEBI order.
Sahara Asset Management Company Pvt. Ltd filed an appeal before the Securities Appellate Tribunal (SAT),
Mumbai to set aside the said SEBI order. SAT vide its order dated 9th December 2015 granted an interim stay
in the matter. SAT vide its order dated 28th July, 2017 dismissed the appeal made by Sahara AMC against the
SEBI order dated 28th July, 2015. However, SAT granted 6 weeks stay to approach the Hon’ble Supreme Court
in the matter. An appeal was filed on 7th September 2017 before the Hon’ble Supreme Court and the appeal
was dismissed vide its order dated 23rd October 2017.
SEBI vide its letter dated November 17, 2017 directed the cancellation of ‘Certificate of registration’ would be
effective six months from the date of the Hon’ble Supreme Court order dated 23rd October 2017.
Sahara Mutual Fund requested SEBI vide its letter dated 15th January 2018 to extend the date of cancellation
of ‘Certificate of registration’ till July 27th, 2018 for giving time for identification of a new sponsor and considering
the lock in period of certain unit holders’ investments in Sahara Tax Gain Fund.
A new sponsor was identified for Sahara Mutual Fund viz., One Life Capital Advisors Limited.
SEBI vide their letter dated 11th April 2018 ordered for winding up all the schemes except Sahara Tax Gain
Fund by 21st April 2018. An appeal was filed before SAT for a stay against the SEBI order dated April 11, 2018.In
view of the direction of SAT on 26th April 2018, a comprehensive appeal was filed.
SAT vide its order dated 3rd May 2018 directed that SEBI shall not enforce the orders impugned in the two
appeals till a decision on new sponsor’s application is communicated. The decision of SEBI on the application
made by One Life Capital Advisers Limited is awaited.
b. Board of Trustees
The Board of Trustees comprises of two trustees, Mr. S P Srivastava and Mr. M R Siddiqui.
The Board of Trustees is the exclusive owner of the Trust Fund and holds the same in trust for the benefit of the unit holders. The Board of Trustees has been discharging its duties and carrying out the responsibilities as provided in the Regulations and the Trust Deed. The Board of Trustees seeks to ensure that the Fund and the Schemes floated there under are managed by the AMC in accordance with the Trust Deed, the Regulations, directions and guidelines issued by the SEBI, the Stock Exchanges, the Association of Mutual Funds in India and other regulatory agencies.
3. Investment Objective of the Scheme.
i. Sahara Tax Gain Fund
The basic objective of Sahara Tax Gain Fund is to provide immediate tax relief and long term capital gains to investors.
11
ii. Sahara Growth Fund
The basic objective is to achieve capital appreciation by investing in equity and equity related instruments.
iii. Sahara Midcap Fund The objective to achieve long term capital growth at medium level of risks by investing primarily in mid–cap stocks
iv. Sahara Wealth Plus Fund The objective is to invest in equity and equity related instruments of companies that would be wealth builders in the long run.
v. Sahara Infrastructure Fund The investment objective is to provide income distribution and/or medium to long term capital gains by investing in equity/equity related instruments of companies mainly in the Infrastructure sector.
vi. Sahara R.E.A.L Fund The investment objective would be to provide long term capital gains by investing predominantly in equity / equity related instrument of companies in the Retailing, Entertainment & Media, Auto & auto ancillaries and Logistics sector.
vii. Sahara Banking and Financial Services Fund The investment objective to provide long term capital appreciation through investment in equities and equities related securities of companies whose business comprise of Banking / Financial Services, either whole or in part.
viii. Sahara Power and Natural Resources Fund The investment objective is to generate long term capital appreciation through investment in equities and equity related securities of companies engaged in the business of generation, transmission, distribution of Power or in those companies that are engaged directly or indirectly in any activity associated in the power sector or principally engaged in discovery, development, production, processing or distribution of natural resources.
ix. Sahara Super 20 Fund The investment objective of the scheme would be to provide long term capital appreciation by investing in predominantly equity and equity related securities of around 20 companies selected out of the top 100 largest market capitalization companies, at the point of investment.
x. Sahara Star Value Fund The investment objective would be to provide long term capital appreciation by investing predominantly in equity / equity related instruments of select companies based on value parameters
xi. Sahara Liquid Fund The investment objective is to create a highly liquid portfolio of good quality debt as well as money market instruments with a view to provide high liquidity and reasonable returns to the unit holders, while at all times emphasizing the importance of capital preservation.
4. Significant Accounting Policies:
The Balance Sheet and the Revenue Account together with the notes thereon have been prepared in
accordance with the accounting policies and standards specified in the Ninth Schedule of the Securities and
Exchange Board of India (Mutual Funds) Regulations, 1996 and amendments thereto, as applicable.
12
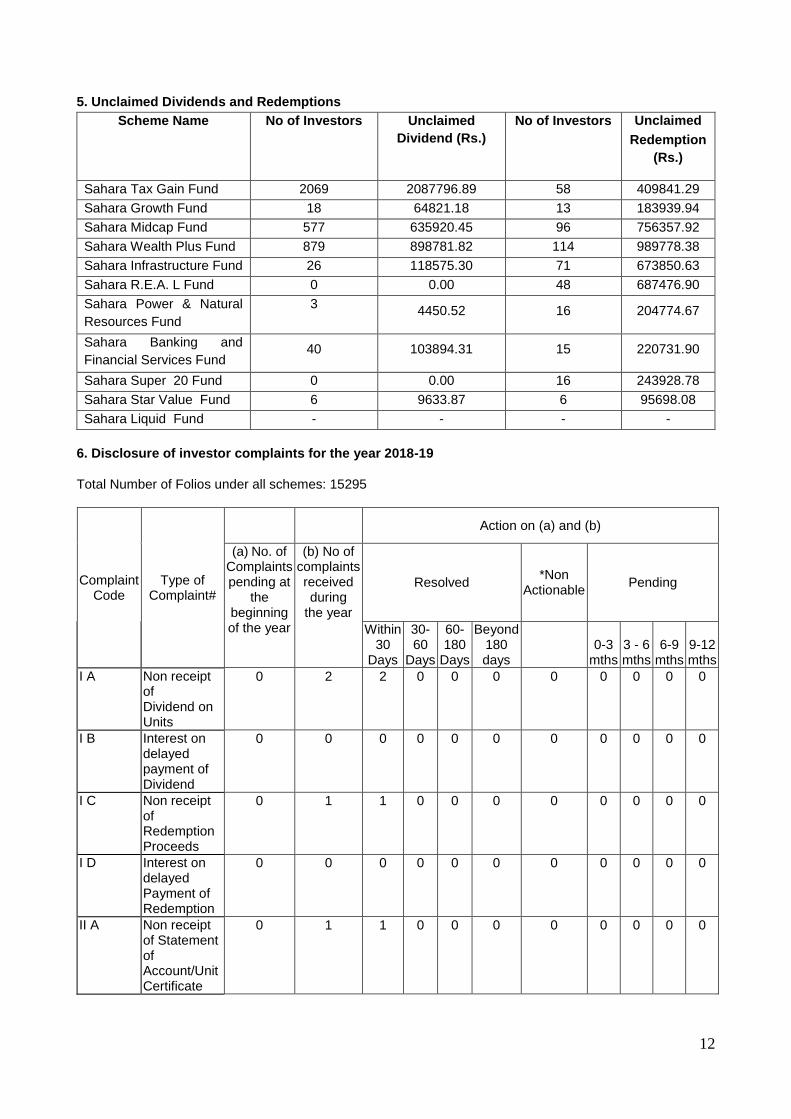
5. Unclaimed Dividends and Redemptions
Scheme Name No of Investors Unclaimed
Dividend (Rs.)
No of Investors Unclaimed
Redemption
(Rs.)
Sahara Tax Gain Fund 2069 2087796.89 58 409841.29
Sahara Growth Fund 18 64821.18 13 183939.94
Sahara Midcap Fund 577 635920.45 96 756357.92
Sahara Wealth Plus Fund 879 898781.82 114 989778.38
Sahara Infrastructure Fund 26 118575.30 71 673850.63
Sahara R.E.A. L Fund 0 0.00 48 687476.90
Sahara Power & Natural
Resources Fund
3 4450.52 16 204774.67
Sahara Banking and
Financial Services Fund 40 103894.31 15 220731.90
Sahara Super 20 Fund 0 0.00 16 243928.78
Sahara Star Value Fund 6 9633.87 6 95698.08
Sahara Liquid Fund - - - -
6. Disclosure of investor complaints for the year 2018-19
Total Number of Folios under all schemes: 15295
Complaint Code
Type of Complaint#
Action on (a) and (b)
(a) No. of Complaints pending at
the beginning of the year
(b) No of complaints received during
the year
Resolved *Non
Actionable Pending
Within 30
Days
30- 60
Days
60-180
Days
Beyond 180 days
0-3
mths 3 - 6 mths
6-9 mths
9-12 mths
I A Non receipt of Dividend on Units
0 2 2 0 0 0 0 0 0 0 0
I B Interest on delayed payment of Dividend
0 0 0 0 0 0 0 0 0 0 0
I C Non receipt of Redemption Proceeds
0 1 1 0 0 0 0 0 0 0 0
I D Interest on delayed Payment of Redemption
0 0 0 0 0 0 0 0 0 0 0
II A Non receipt of Statement of Account/Unit Certificate
0 1 1 0 0 0 0 0 0 0 0
13
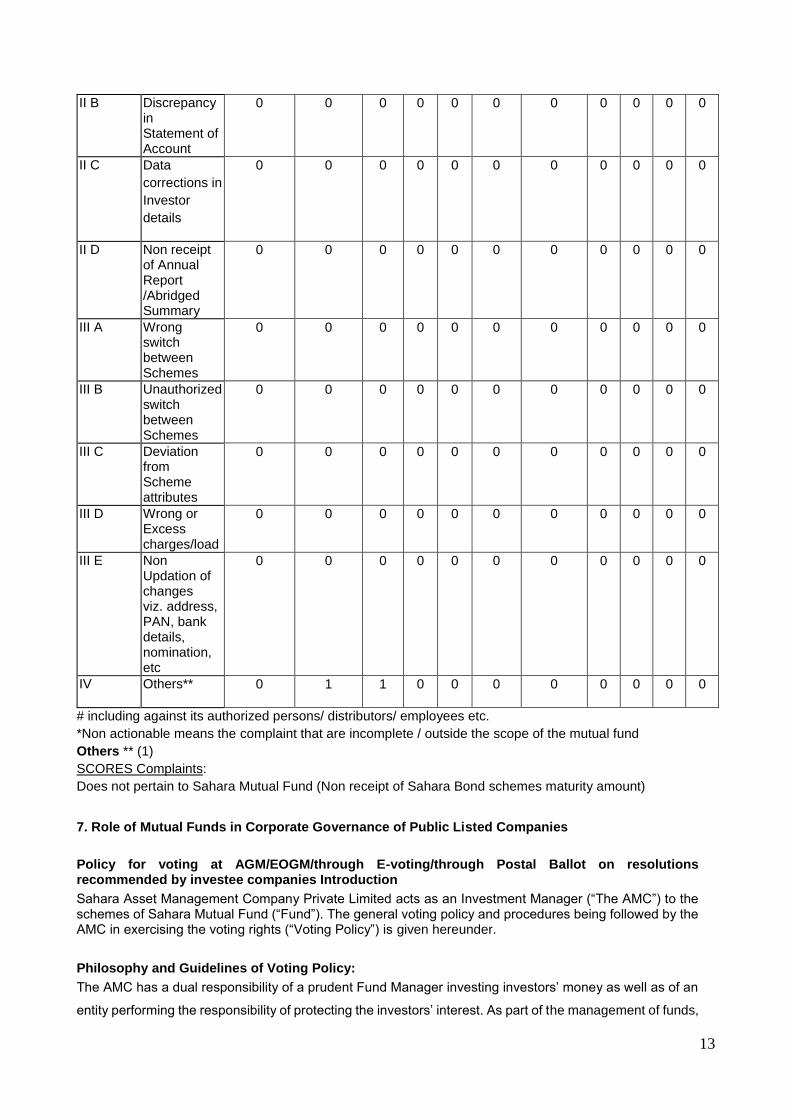
II B Discrepancy in Statement of Account
0 0 0 0 0 0 0 0 0 0 0
II C Data
corrections in
Investor
details
0 0 0 0 0 0 0 0 0 0 0
II D Non receipt of Annual Report /Abridged Summary
0 0 0 0 0 0 0 0 0 0 0
III A Wrong switch between Schemes
0 0 0 0 0 0 0 0 0 0 0
III B Unauthorized switch between Schemes
0 0 0 0 0 0 0 0 0 0 0
III C Deviation from Scheme attributes
0 0 0 0 0 0 0 0 0 0 0
III D Wrong or Excess charges/load
0 0 0 0 0 0 0 0 0 0 0
III E Non Updation of changes viz. address, PAN, bank details, nomination, etc
0 0 0 0 0 0 0 0 0 0 0
IV Others** 0 1 1 0 0 0 0 0 0 0 0
# including against its authorized persons/ distributors/ employees etc.
*Non actionable means the complaint that are incomplete / outside the scope of the mutual fund
Others ** (1)
SCORES Complaints:
Does not pertain to Sahara Mutual Fund (Non receipt of Sahara Bond schemes maturity amount)
7. Role of Mutual Funds in Corporate Governance of Public Listed Companies
Policy for voting at AGM/EOGM/through E-voting/through Postal Ballot on resolutions recommended by investee companies Introduction
Sahara Asset Management Company Private Limited acts as an Investment Manager (“The AMC”) to the schemes of Sahara Mutual Fund (“Fund”). The general voting policy and procedures being followed by the AMC in exercising the voting rights (“Voting Policy”) is given hereunder.
Philosophy and Guidelines of Voting Policy:
The AMC has a dual responsibility of a prudent Fund Manager investing investors’ money as well as of an
entity performing the responsibility of protecting the investors’ interest. As part of the management of funds,
14
irrespective of the scheme, the AMC ensures that investments are made in companies that meet investment
norms. It is expected that the investee company adheres to proper corporate governance standards. The
voting policy for the investee companies by the AMC is as under:
The AMC shall deal with voting on case to case basis. For this purpose, the AMC shall review various
notices of AGM/EOGM/Postal Ballot received from the investee companies from time to time and take
appropriate voting decision (for, against, abstain) with respect to the each resolution recommended by the
management/ shareholders of the companies. The AMC would generally agree with the management of
the Investee Company on routine matters, but may object by voting against or abstain, if it believes that it
has insufficient information or there is conflict of interests or the interest of the shareholders and /or the unit
holders’ interests are prejudiced in any manner.
As regards non-routine items, the Fund Manager (Equity) with assistance of the Equity Research
Department and in consultation with the Compliance Officer shall review each of such cases and take a
decision to vote. In case the AMC is against any non-routine item, it may decide to attend the meeting and
vote against that item. In some other such cases, it may decide to abstain based on one or more of the
factors like our small holding in the company, location of the venue of meeting, time/cost involved etc. For
these instances, the reasons for non-attendance will be recorded.
As per the decision taken by the AMC, it may depute an authorized person to attend and vote at
AGM/EOGM/through E-Voting/ through Postal Ballot appropriately keeping in mind the interest of unit
holders. AMC would maintain a record on the AGM/EOGM voting related matters.
Disclosure of Voting policy and Maintenance of Records:
This Policy on voting at AGM/EOGM/ through e-voting/ through postal ballot and suitable disclosure thereof is available on the website (www.saharamutual.com) of the Mutual Fund.
Note: For details of voting in the AGMs of the investee companies for the financial year 2018-19, unit holders can log on to the website (www.saharamutual.com) of the Fund. Further the said details are also available in the Annual Report of Sahara Mutual Fund for the period 2018-19. The details of voting shall be emailed/sent as and when requested by the unit holders free of cost.
8. Statutory Information.
a. The Sponsor is not responsible or liable for any loss resulting from the operation of the Schemes of the Fund beyond their initial contribution of Rs.1 lakh for setting up the Fund.
b. The price and redemption value of the units, and income from them, can go up as well as down with fluctuations in the market value of its underlying investments.
c. Full Annual Report is disclosed on the website (www.saharamutual.com) and shall be available for inspection at the Head Office of the Mutual Fund. Present and prospective unit holders can obtain copy of the trust deed, the full Annual Report of the Fund / AMC free of cost.
Acknowledgements
The Trustees would like to thank all the investors for reposing their faith and trust in Sahara Mutual Fund. The Trustees thank the Securities and Exchange Board of India, the Reserve Bank of India, the Sponsor, and the Board of the Sahara Asset Management Company Private Limited for their support, co-operation and guidance during the period.
15
We are also thankful to the Auditors, Registrar and Transfer Agents, Custodian, Banks, Depositories, AMFI/NISM Certified Distributors, KYC Registration Agencies and other service providers for their continuous support. The Trustees also appreciate the efforts made by the employees of Sahara Asset Management Company Private Limited and place on record their dedication, commitment and wholehearted support throughout the year.
We look forward for your continued support and assure you of our commitment at all times in managing the schemes of Sahara Mutual Fund.
For and on behalf of Sahara Mutual Fund
M R Siddiqui Trustee Place: Mumbai Date: 19th July, 2019
16
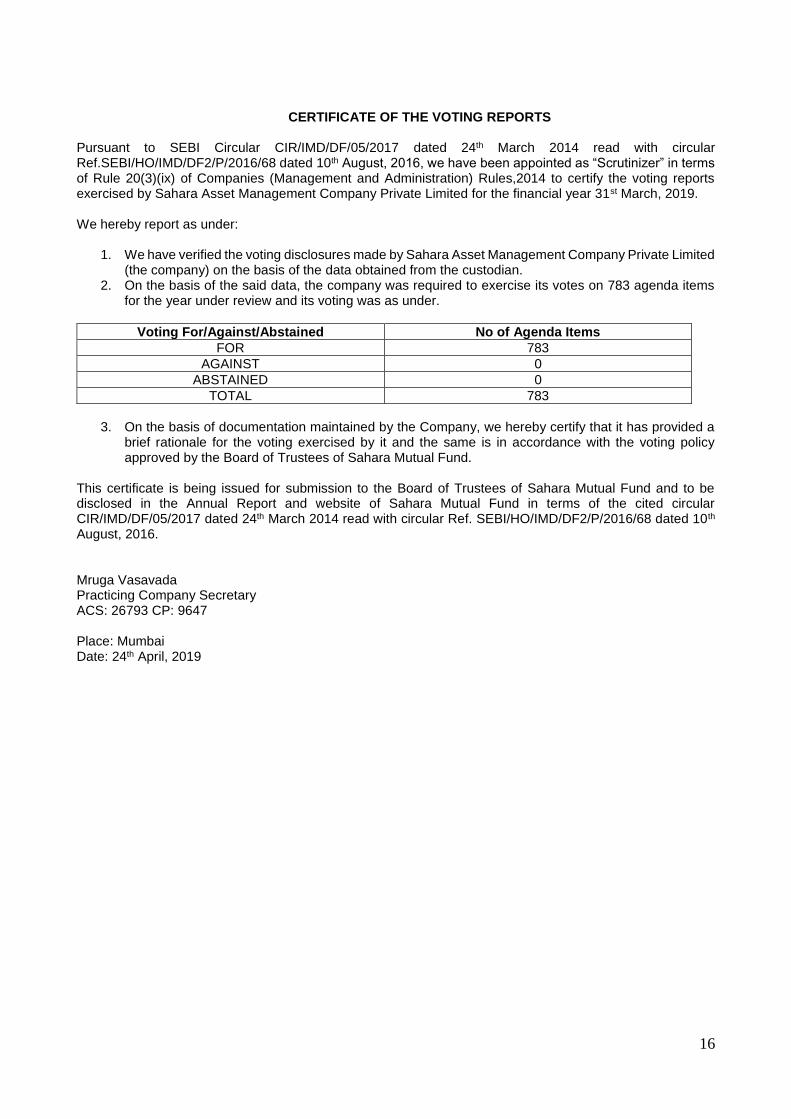
CERTIFICATE OF THE VOTING REPORTS
Pursuant to SEBI Circular CIR/IMD/DF/05/2017 dated 24th March 2014 read with circular Ref.SEBI/HO/IMD/DF2/P/2016/68 dated 10th August, 2016, we have been appointed as “Scrutinizer” in terms of Rule 20(3)(ix) of Companies (Management and Administration) Rules,2014 to certify the voting reports exercised by Sahara Asset Management Company Private Limited for the financial year 31st March, 2019. We hereby report as under:
1. We have verified the voting disclosures made by Sahara Asset Management Company Private Limited (the company) on the basis of the data obtained from the custodian.
2. On the basis of the said data, the company was required to exercise its votes on 783 agenda items for the year under review and its voting was as under.
Voting For/Against/Abstained No of Agenda Items
FOR 783
AGAINST 0
ABSTAINED 0
TOTAL 783
3. On the basis of documentation maintained by the Company, we hereby certify that it has provided a
brief rationale for the voting exercised by it and the same is in accordance with the voting policy approved by the Board of Trustees of Sahara Mutual Fund.
This certificate is being issued for submission to the Board of Trustees of Sahara Mutual Fund and to be disclosed in the Annual Report and website of Sahara Mutual Fund in terms of the cited circular CIR/IMD/DF/05/2017 dated 24th March 2014 read with circular Ref. SEBI/HO/IMD/DF2/P/2016/68 dated 10th August, 2016. Mruga Vasavada Practicing Company Secretary ACS: 26793 CP: 9647 Place: Mumbai Date: 24th April, 2019
17
INDEPENDENT AUDITOR’S REPORT To the Trustees of Sahara Mutual Fund- Sahara Tax Gain Fund Report on the Audit of the Financial Statements Opinion We have audited the accompanying financial statements of Sahara Mutual Fund – Sahara Tax Gain Fund (“the Scheme”), which comprise the Balance Sheet as at March 31, 2019,the Revenue Account and the Cash Flow Statement for the year then ended, and noted to the financial statements, including a summary of significant accounting policies and other explanatory information. In our opinion and to the best of our information and according to the explanations given to us, the aforesaid financial statements of the scheme give the information specified in the Ninth Schedule to the Securities and Exchange Board of India (Mutual Funds) Regulations, 1996 and amendments thereto (“the SEBI Regulations”), as applicable, in the manner so required and give a true and fair view in conformity with the accounting principles generally accepted in India: (a) in the case of the Balance Sheet, of the state of affairs of the Scheme as at March 31, 2019; (b) in the case of the Revenue Account, of the surplus for the year ended on that date. (c) in the case of the Cash Flow Statement, of the cash flows for the year ended on that date. Basis for Opinion We conducted our audit of the financial statements in accordance with the Standards on Auditing (SA’s) issued by the Institute of Chartered Accountants of India (“ICAI). Our responsibilities under those Standards are further described in the Auditor’s Responsibilities for the Audit of the Financial Statements section of our report. We are independent of the Trust/Scheme in accordance with the Code of Ethics issued by the Institute of Chartered Accountants of India together with the independence requirements that are relevant to our audit of the financial statements of the Scheme. Our audit has been conducted in accordance with the accounting policies and standards specified in the SEBI Regulations and amendments thereto, as applicable and we have fulfilled our other ethical responsibilities in accordance with these requirements and the Code of Ethics. We believe that the audit evidence we have obtained is sufficient and appropriate to provide a basis for our opinion. Emphasis of Matter We draw attention to the following matter in the Notes to the financial statements: a) Note no. 8.17 which states, inter alia, that Sahara Mutual Fund had requested SEBI in January 2018 to
extend the date of cancellation of ‘Certificate of registration’ till 27th July, 2018 considering the lock in period of certain unit holders’ investments in Sahara Tax gain fund as well as for giving time for identification of a new sponsor. However, SEBI ordered for winding up of all schemes against which Sahara Mutual Fund appealed before SAT for a stay of SEBI order. In the meanwhile, a new sponsor was identified for Sahara Mutual Fund viz., One Life Capital Advisors Limited.
SAT vide its order dated 3rd May,2018 directed that SEBI shall not enforce the orders impugned in the appeals till a decision on new sponsor’s application is communicated. The above indicates the existence of a material uncertainty that may cast significant doubt about Sahara Mutual Fund’s ability to continue as a going concern. However, the financial statements of the Scheme have been prepared on a going concern basis, pending the decision of the SEBI on the sponsor.
b) Note no. 8.18 which states that minimum four Trustees are required as per Reg. 15(1) read with para 22
of the Third Schedule (Contents of Trust Deed) of SEBI (Mutual Funds) Regulations 1996, has not been complied with.
c) As per the Reg. 21(1)(f), of SEBI (Mutual Funds) Regulations, 1996 and in compliance with the notification of Securities and Exchange Board of India (Mutual Funds) (Amendment) Regulations, 2014 dated May 6, 2014, the AMC should have maintained a Net Worth of minimum Rs.50 crs. The Net Worth of SAMC as on March 31, 2019 was Rs.5.02 crs (refer Note 8.19); thereby net worth criteria has not been complied with.
Our opinion is not modified in respect of the above matter.

18
Responsibilities of the Management and Those Charged with Governance for the Financial Statements The Trustees of Sahara Mutual Fund and the Board of Directors of Sahara Asset Management Company Private Limited (the “Directors”) are responsible for the preparation of these financial statements that give a true and fair view of the financial position and financial performance of the Scheme in accordance with the accounting policies and standards specified in the SEBI Regulations and amendments thereto, as applicable. This responsibility also includes maintenance of adequate accounting records for safeguarding the assets of the Scheme and for preventing and detecting frauds and other irregularities; selection and application of appropriate accounting policies; making judgements and estimates that are reasonable and prudent; and design, implementation and maintenance of adequate internal financial controls, that were operating effectively for ensuring the accuracy and completeness of the accounting records, relevant to the preparation and presentation of the financial statements that give a true and fair view and are free from material misstatement, whether due to fraud or error. In preparing the financial statements, management is responsible for assessing the Scheme’s ability to continue as a going concern, disclosing , as applicable, matters related to going concern and using the going concern basis of accounting unless management either intends to liquidate the Scheme or to cease operations or has no realistic alternative but to do so. Those charged with Governance are also responsible for overseeing the Scheme’s financial reporting process. Auditor’s Responsibility for the Audit of the Financial Statements Our objectives are to obtain reasonable assurance about whether the standalone financial statements as a whole are free from material misstatement, whether due to fraud or error, and to issue an auditor’s report that includes our opinion. Reasonable assurance is a high level of assurance, but is not a guarantee that an audit conducted in accordance with SAs will always detect a material misstatement when it exists. Misstatements can arise from fraud or error and are considered material if ,individually or in the aggregate, they could reasonably be expected to influence the economic decisions of users taken on the basis of these standalone financial statements. As part of an audit in accordance with SAs, we exercise professional judgment and maintain professional skepticism throughout the audit. We also: • Identify and assess the risks of material misstatement of the standalone financial statements, whether due to fraud or error, design and perform audit procedures responsive to those risks, and obtain audit evidence that is sufficient and appropriate to provide a basis for our opinion. The risk of not detecting a material misstatement resulting from fraud is higher than for one resulting from error, as fraud may involve collusion, forgery, intentional omissions, misrepresentations, or the override of internal control. • Obtain an understanding of internal financial controls relevant to the audit in order to design audit procedures that are appropriate in the circumstances, but not for the purpose of expressing an opinion on effectiveness of the Company’s internal financial controls. • Evaluate the appropriateness of accounting policies used and the reasonableness of accounting estimates and related disclosures made by management. • Conclude on the appropriateness of management’s use of the going concern basis of accounting and, based on the audit evidence obtained, whether a material uncertainty exists related to events or conditions that may cast significant doubt on the ability of the Company to continue as a going concern. If we conclude that a material uncertainty exists, we are required to draw attention in our auditor’s report to the related disclosures in the standalone financial statements or, if such disclosures are inadequate, to modify our opinion. Our conclusions are based on the audit evidence obtained up to the date of our auditor’s report. However, future events or conditions may cause the Company to cease to continue as a going concern. • Evaluate the overall presentation, structure and content of the standalone financial statements, including the disclosures, and whether the standalone financial statements represent the underlying transactions and events in a manner that achieves fair presentation.
19
We communicate with those charged with governance regarding, among other matters, the planned scope and timing of the audit and significant audit findings, including any significant deficiencies in internal control that we identify during our audit. We also provide those charged with governance with a statement that we have complied with relevant ethical requirements regarding independence, and to communicate with them all relationships and other matters that may reasonably be thought to bear on our independence, and where applicable, related safeguards.
Report on Other Legal and Regulatory Requirements
As required by the Securities and Exchange Board of India (Mutual Funds) Regulations, 1996 and amendments thereto, as applicable, we report that: a) We have sought and obtained all the information and explanations, which to the best of our knowledge and belief were necessary for the purpose of our audit. b) The Balance Sheet and Revenue Account dealt with by this Report are in agreement with the books of account of the Scheme. c) The statement of account has been prepared in accordance with the accounting policies and standards specified in the SEBI Regulations and amendments thereto, as applicable. d) We have reviewed the Valuation Policy being followed for the schemes of Sahara Mutual Fund. The Valuation Policy implemented for the Scheme is in line with the SEBI guidelines issued in this regard.
For Chaturvedi & Partners. Chartered Accountants (Firm’s Registration No. 307068E) Khyati Shah (Partner) Mem. No. 117510 Place: Mumbai Date: July 19, 2019
20
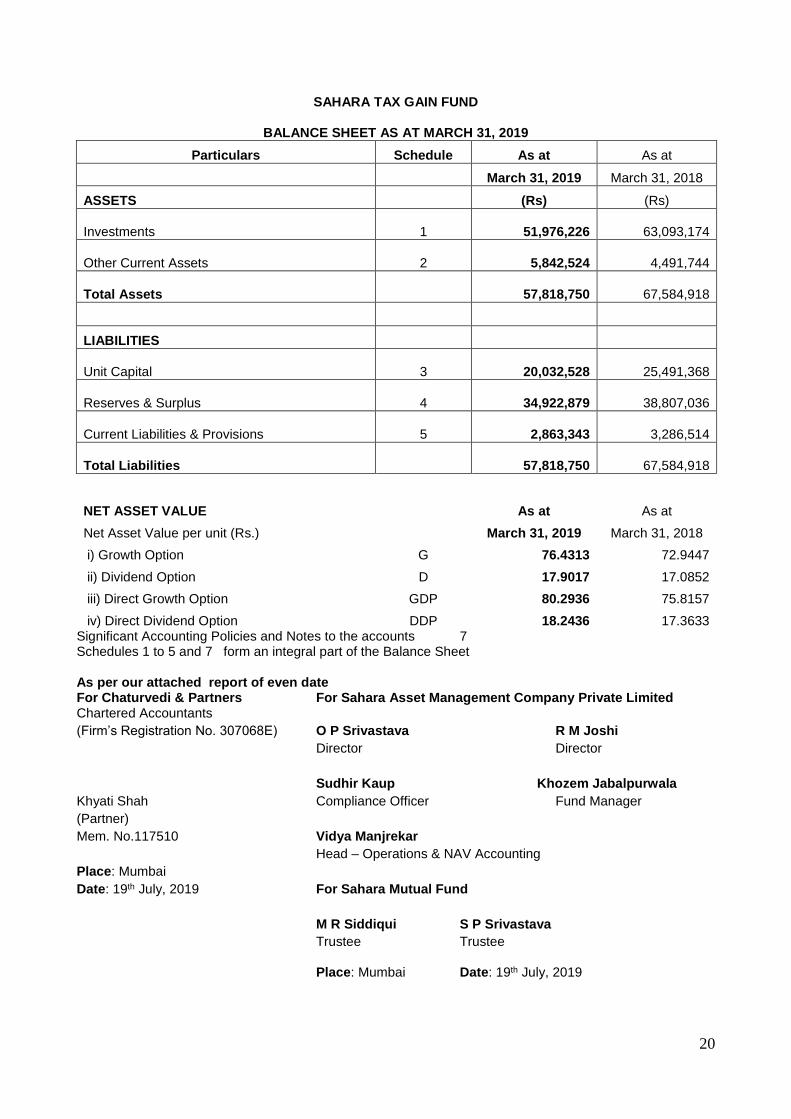
SAHARA TAX GAIN FUND
BALANCE SHEET AS AT MARCH 31, 2019
Particulars Schedule As at As at
March 31, 2019 March 31, 2018
ASSETS (Rs) (Rs)
Investments 1 51,976,226
63,093,174
Other Current Assets 2 5,842,524
4,491,744
Total Assets 57,818,750
67,584,918
LIABILITIES
Unit Capital 3 20,032,528
25,491,368
Reserves & Surplus 4 34,922,879
38,807,036
Current Liabilities & Provisions 5 2,863,343
3,286,514
Total Liabilities 57,818,750
67,584,918
NET ASSET VALUE As at As at
Net Asset Value per unit (Rs.) March 31, 2019 March 31, 2018
i) Growth Option G 76.4313 72.9447
ii) Dividend Option D 17.9017 17.0852
iii) Direct Growth Option GDP 80.2936 75.8157
iv) Direct Dividend Option DDP 18.2436 17.3633 Significant Accounting Policies and Notes to the accounts 7 Schedules 1 to 5 and 7 form an integral part of the Balance Sheet
As per our attached report of even date For Chaturvedi & Partners For Sahara Asset Management Company Private Limited Chartered Accountants
(Firm’s Registration No. 307068E) O P Srivastava R M Joshi
Director Director
Sudhir Kaup Khozem Jabalpurwala
Khyati Shah Compliance Officer Fund Manager
(Partner)
Mem. No.117510 Vidya Manjrekar
Head – Operations & NAV Accounting
Place: Mumbai
Date: 19th July, 2019 For Sahara Mutual Fund
M R Siddiqui S P Srivastava
Trustee Trustee Place: Mumbai Date: 19th July, 2019
21
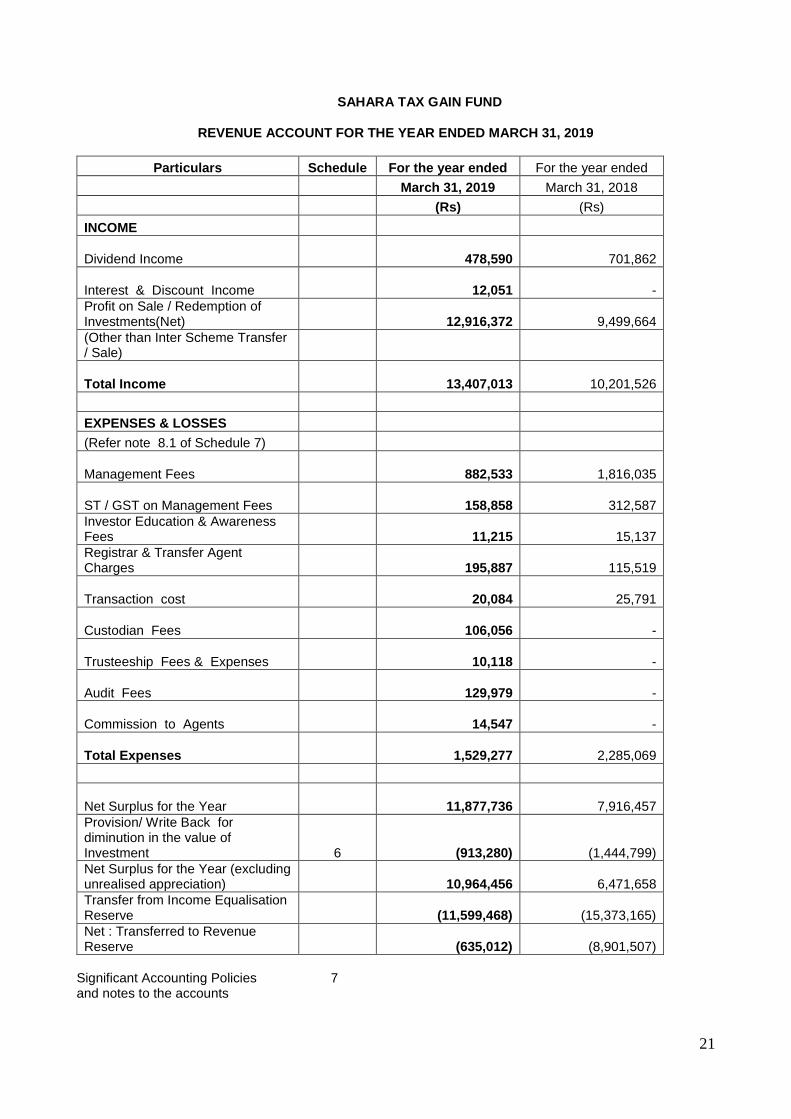
SAHARA TAX GAIN FUND
REVENUE ACCOUNT FOR THE YEAR ENDED MARCH 31, 2019
Particulars Schedule For the year ended For the year ended
March 31, 2019 March 31, 2018
(Rs) (Rs)
INCOME
Dividend Income
478,590
701,862
Interest & Discount Income
12,051 -
Profit on Sale / Redemption of Investments(Net)
12,916,372
9,499,664
(Other than Inter Scheme Transfer / Sale)
Total Income
13,407,013
10,201,526
EXPENSES & LOSSES
(Refer note 8.1 of Schedule 7)
Management Fees
882,533
1,816,035
ST / GST on Management Fees
158,858
312,587
Investor Education & Awareness Fees
11,215
15,137
Registrar & Transfer Agent Charges
195,887
115,519
Transaction cost
20,084
25,791
Custodian Fees
106,056 -
Trusteeship Fees & Expenses
10,118 -
Audit Fees
129,979 -
Commission to Agents
14,547 -
Total Expenses
1,529,277
2,285,069
Net Surplus for the Year
11,877,736
7,916,457
Provision/ Write Back for diminution in the value of Investment 6
(913,280)
(1,444,799)
Net Surplus for the Year (excluding unrealised appreciation)
10,964,456
6,471,658
Transfer from Income Equalisation Reserve
(11,599,468)
(15,373,165)
Net : Transferred to Revenue Reserve
(635,012)
(8,901,507)
Significant Accounting Policies 7 and notes to the accounts

22
Schedules 6 to 7 form an integral part of the Revenue Account
As per our attached report of even date For Chaturvedi & Partners For Sahara Asset Management Company Private Limited Chartered Accountants
(Firm’s Registration No. 307068E) O P Srivastava R M Joshi
Director Director
Sudhir Kaup Khozem Jabalpurwala
Khyati Shah Compliance Officer Fund Manager
(Partner)
Mem. No.117510 Vidya Manjrekar
Head – Operations & NAV Accounting
Place: Mumbai
Date: 19th July, 2019 For Sahara Mutual Fund
M R Siddiqui S P Srivastava
Trustee Trustee Place: Mumbai Date: 19th July, 2019

23
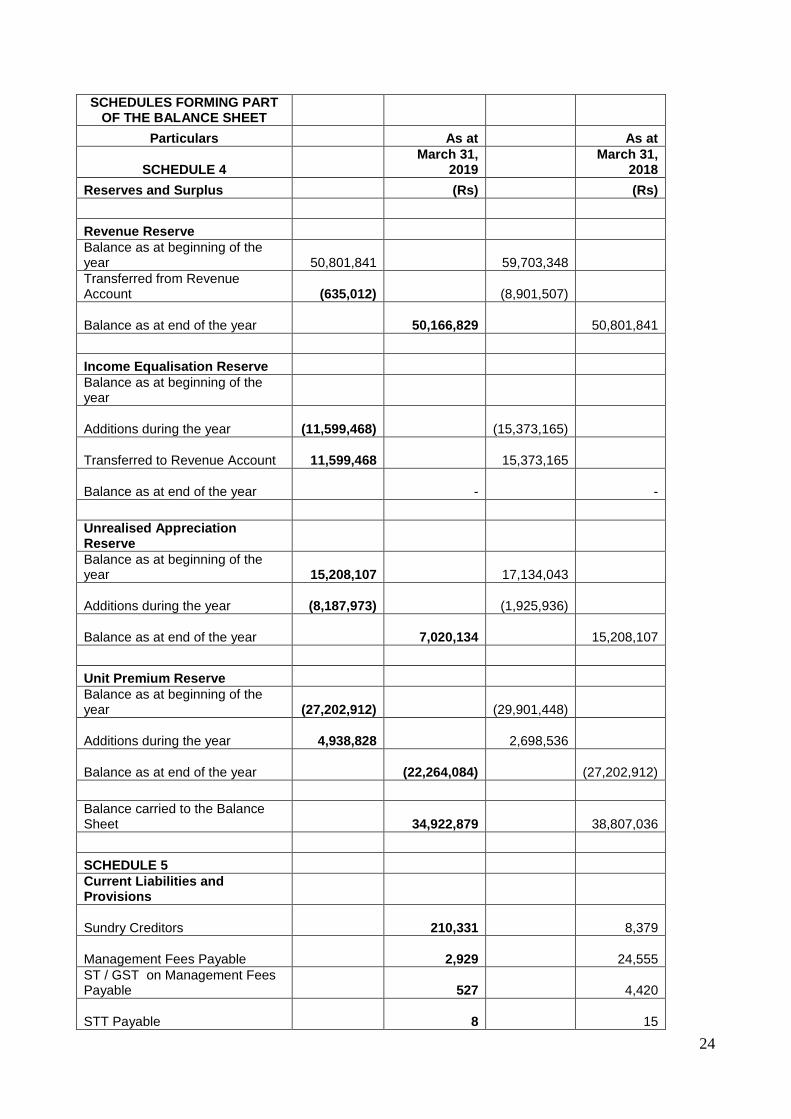
SAHARA TAX GAIN FUND SCHEDULES FORMING PART OF THE BALANCE SHEET
As at As at
March 31,
2019 March 31,
2018
Particulars (Rs) (Rs)
SCHEDULE 1
Investments
(Refer Note 8.13 of Schedule 7 for detailed Portfolio Statement)
Equity Shares
51,976,226
63,093,174
51,976,226
63,093,174
SCHEDULE 2
Other Current Assets
Balances with Banks in Current accounts
4,085,503
2,689,348
Investment - Liquid MF Units
1,739,307
1,784,682
Investment - Liquid MF Units - Investor Education
17,714
17,714
5,842,524
4,491,744
SCHEDULE 3
Unit Capital
Growth Option 286801.408 units of Rs.10 each G
2,868,014
3,255,800
(For 2017-2018 - 325579.982 units of Rs.10 each)
Dividend Option 1599135.105 units of Rs.10 each D
15,991,351
20,277,535
(For 2017-2018 - 2027753.472 units of Rs.10 each)
Direct Growth Option 36665.079 units of Rs.10 each GDP
366,651
431,094
(For 2017-2018 -43109.444 units of Rs.10 each)
Direct Dividend Option 80651.220 units of Rs.10 each DDP
806,512
1,526,939
(For 2017-2018 - 152693.940 units of Rs.10 each)
Total
20,032,528
25,491,368
(Refer Note 8.9 of Schedule 7)
24
SCHEDULES FORMING PART OF THE BALANCE SHEET
Particulars As at As at
SCHEDULE 4 March 31,
2019 March 31,
2018
Reserves and Surplus (Rs) (Rs)
Revenue Reserve
Balance as at beginning of the year
50,801,841
59,703,348
Transferred from Revenue Account
(635,012)
(8,901,507)
Balance as at end of the year
50,166,829
50,801,841
Income Equalisation Reserve
Balance as at beginning of the year
Additions during the year
(11,599,468)
(15,373,165)
Transferred to Revenue Account
11,599,468
15,373,165
Balance as at end of the year
-
-
Unrealised Appreciation Reserve
Balance as at beginning of the year
15,208,107
17,134,043
Additions during the year
(8,187,973)
(1,925,936)
Balance as at end of the year
7,020,134
15,208,107
Unit Premium Reserve
Balance as at beginning of the year
(27,202,912)
(29,901,448)
Additions during the year
4,938,828
2,698,536
Balance as at end of the year
(22,264,084)
(27,202,912)
Balance carried to the Balance Sheet
34,922,879
38,807,036
SCHEDULE 5
Current Liabilities and Provisions
Sundry Creditors
210,331
8,379
Management Fees Payable
2,929
24,555
ST / GST on Management Fees Payable
527
4,420
STT Payable
8
15
25
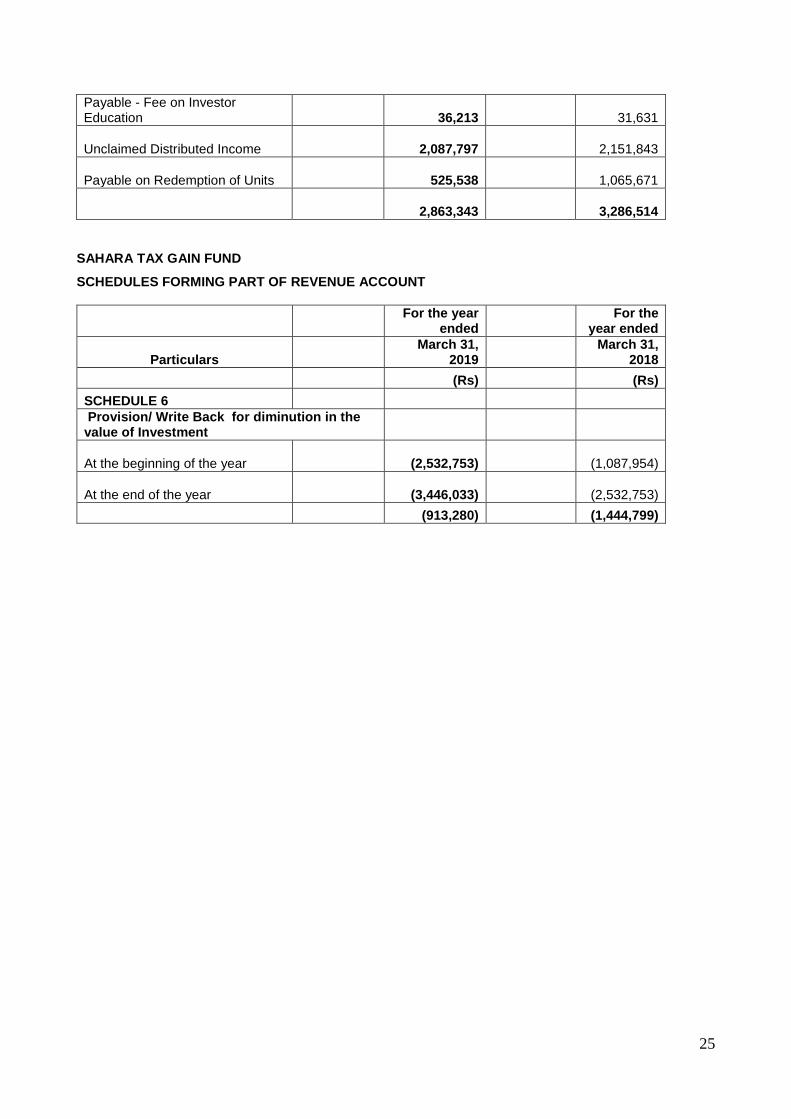
Payable - Fee on Investor Education
36,213
31,631
Unclaimed Distributed Income
2,087,797
2,151,843
Payable on Redemption of Units
525,538
1,065,671
2,863,343
3,286,514
SAHARA TAX GAIN FUND
SCHEDULES FORMING PART OF REVENUE ACCOUNT
For the year
ended For the
year ended
Particulars March 31,
2019 March 31,
2018
(Rs) (Rs)
SCHEDULE 6
Provision/ Write Back for diminution in the value of Investment
At the beginning of the year
(2,532,753)
(1,087,954)
At the end of the year
(3,446,033)
(2,532,753)
(913,280) (1,444,799)
26
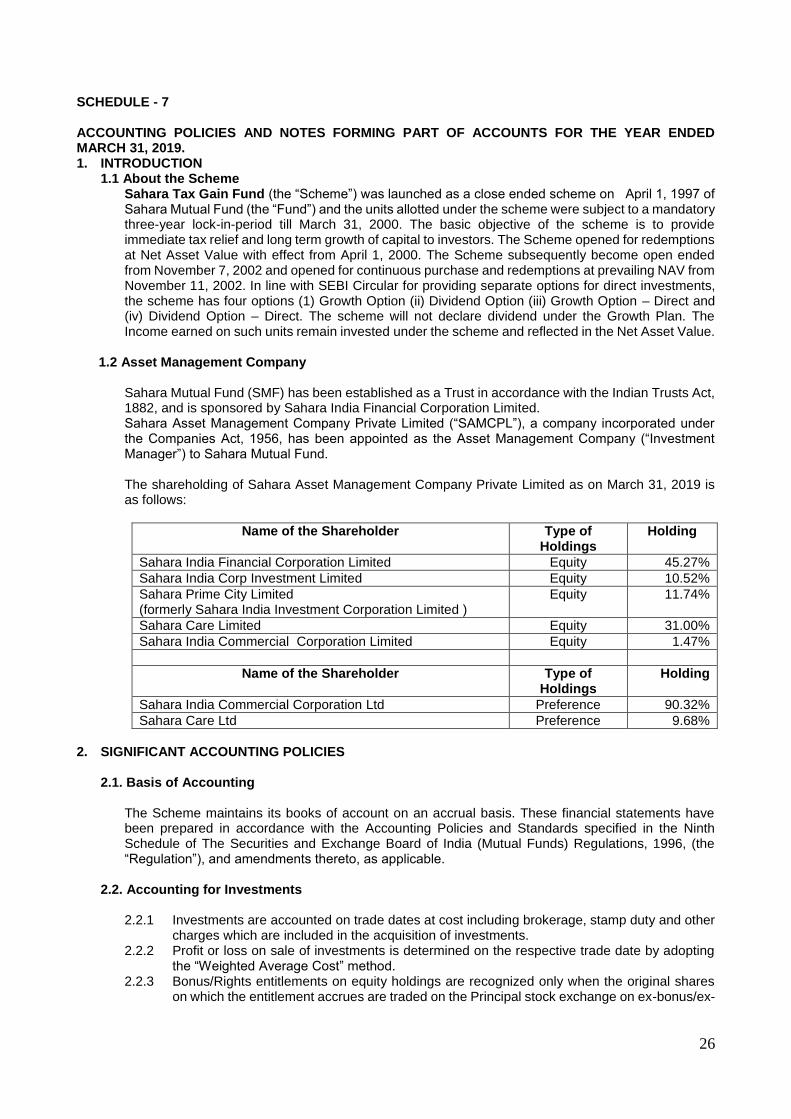
SCHEDULE - 7
ACCOUNTING POLICIES AND NOTES FORMING PART OF ACCOUNTS FOR THE YEAR ENDED MARCH 31, 2019. 1. INTRODUCTION
1.1 About the Scheme Sahara Tax Gain Fund (the “Scheme”) was launched as a close ended scheme on April 1, 1997 of Sahara Mutual Fund (the “Fund”) and the units allotted under the scheme were subject to a mandatory three-year lock-in-period till March 31, 2000. The basic objective of the scheme is to provide immediate tax relief and long term growth of capital to investors. The Scheme opened for redemptions at Net Asset Value with effect from April 1, 2000. The Scheme subsequently become open ended from November 7, 2002 and opened for continuous purchase and redemptions at prevailing NAV from November 11, 2002. In line with SEBI Circular for providing separate options for direct investments, the scheme has four options (1) Growth Option (ii) Dividend Option (iii) Growth Option – Direct and (iv) Dividend Option – Direct. The scheme will not declare dividend under the Growth Plan. The Income earned on such units remain invested under the scheme and reflected in the Net Asset Value.
1.2 Asset Management Company
Sahara Mutual Fund (SMF) has been established as a Trust in accordance with the Indian Trusts Act, 1882, and is sponsored by Sahara India Financial Corporation Limited. Sahara Asset Management Company Private Limited (“SAMCPL”), a company incorporated under the Companies Act, 1956, has been appointed as the Asset Management Company (“Investment Manager”) to Sahara Mutual Fund. The shareholding of Sahara Asset Management Company Private Limited as on March 31, 2019 is as follows:
Name of the Shareholder Type of Holdings
Holding
Sahara India Financial Corporation Limited Equity 45.27%
Sahara India Corp Investment Limited Equity 10.52%
Sahara Prime City Limited (formerly Sahara India Investment Corporation Limited )
Equity 11.74%
Sahara Care Limited Equity 31.00%
Sahara India Commercial Corporation Limited Equity 1.47%
Name of the Shareholder Type of Holdings
Holding
Sahara India Commercial Corporation Ltd Preference 90.32%
Sahara Care Ltd Preference 9.68%
2. SIGNIFICANT ACCOUNTING POLICIES
2.1. Basis of Accounting
The Scheme maintains its books of account on an accrual basis. These financial statements have been prepared in accordance with the Accounting Policies and Standards specified in the Ninth Schedule of The Securities and Exchange Board of India (Mutual Funds) Regulations, 1996, (the “Regulation”), and amendments thereto, as applicable.
2.2. Accounting for Investments 2.2.1 Investments are accounted on trade dates at cost including brokerage, stamp duty and other
charges which are included in the acquisition of investments. 2.2.2 Profit or loss on sale of investments is determined on the respective trade date by adopting
the “Weighted Average Cost” method. 2.2.3 Bonus/Rights entitlements on equity holdings are recognized only when the original shares
on which the entitlement accrues are traded on the Principal stock exchange on ex-bonus/ex-
27
rights basis respectively. In respect of unlisted/ non- traded securities, the Bonus/Rights on equity holdings are recognized only on the receipt of the Bonus/Rights.
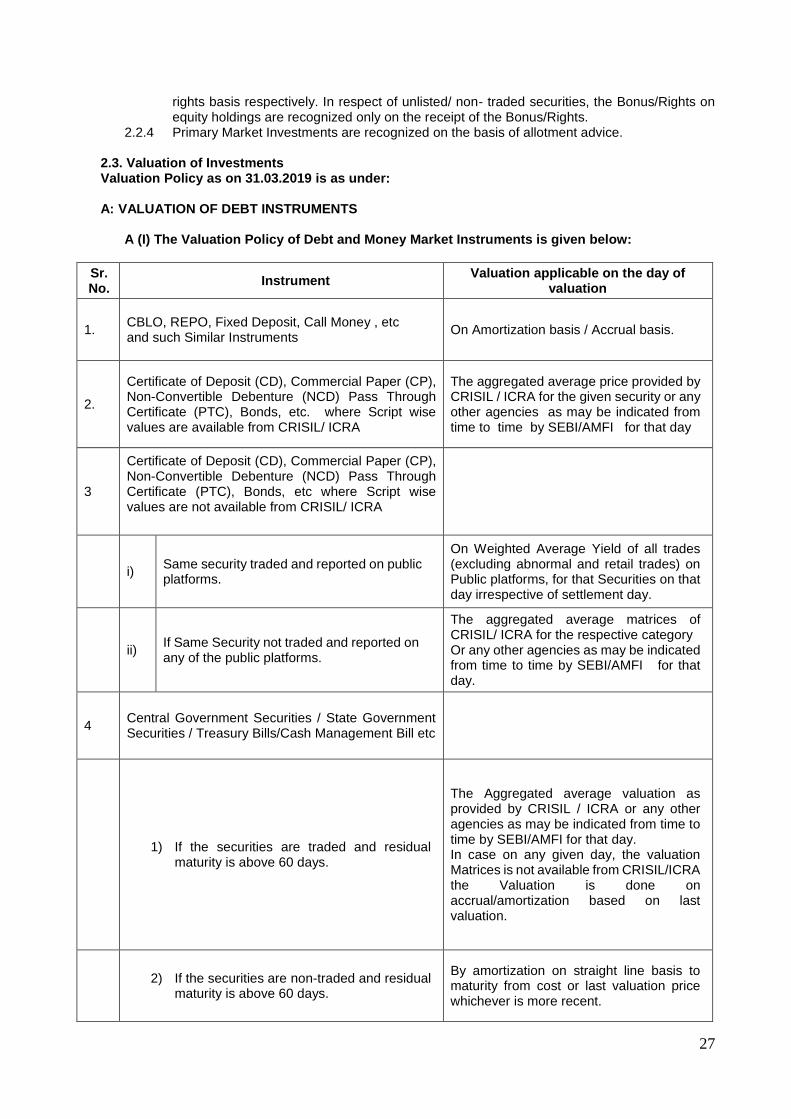
2.2.4 Primary Market Investments are recognized on the basis of allotment advice. 2.3. Valuation of Investments Valuation Policy as on 31.03.2019 is as under: A: VALUATION OF DEBT INSTRUMENTS
A (I) The Valuation Policy of Debt and Money Market Instruments is given below:
Sr. No.
Instrument Valuation applicable on the day of
valuation
1.
CBLO, REPO, Fixed Deposit, Call Money , etc and such Similar Instruments
On Amortization basis / Accrual basis.
2.
Certificate of Deposit (CD), Commercial Paper (CP), Non-Convertible Debenture (NCD) Pass Through Certificate (PTC), Bonds, etc. where Script wise values are available from CRISIL/ ICRA
The aggregated average price provided by CRISIL / ICRA for the given security or any other agencies as may be indicated from time to time by SEBI/AMFI for that day
3
Certificate of Deposit (CD), Commercial Paper (CP), Non-Convertible Debenture (NCD) Pass Through Certificate (PTC), Bonds, etc where Script wise values are not available from CRISIL/ ICRA
i) Same security traded and reported on public platforms.
On Weighted Average Yield of all trades (excluding abnormal and retail trades) on Public platforms, for that Securities on that day irrespective of settlement day.
ii) If Same Security not traded and reported on any of the public platforms.
The aggregated average matrices of CRISIL/ ICRA for the respective category Or any other agencies as may be indicated from time to time by SEBI/AMFI for that day.
4 Central Government Securities / State Government Securities / Treasury Bills/Cash Management Bill etc
1) If the securities are traded and residual
maturity is above 60 days.
The Aggregated average valuation as provided by CRISIL / ICRA or any other agencies as may be indicated from time to time by SEBI/AMFI for that day. In case on any given day, the valuation Matrices is not available from CRISIL/ICRA the Valuation is done on accrual/amortization based on last valuation.
2) If the securities are non-traded and residual
maturity is above 60 days.
By amortization on straight line basis to maturity from cost or last valuation price whichever is more recent.
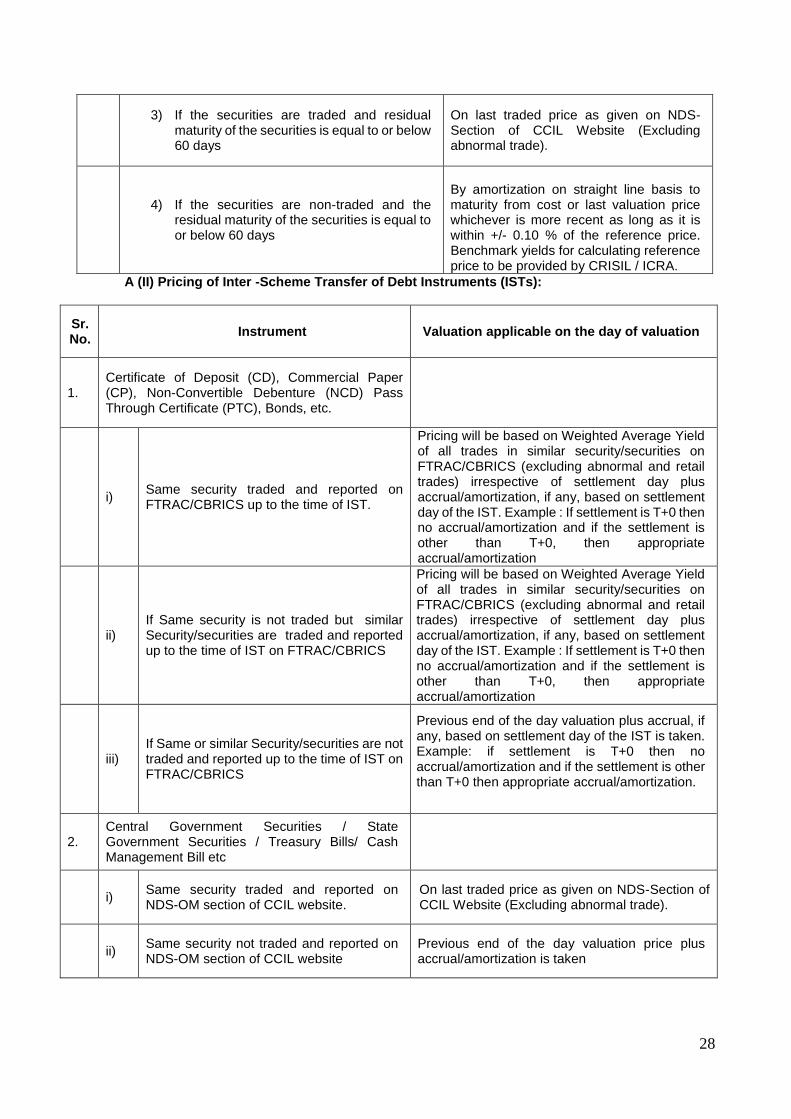
28
3) If the securities are traded and residual
maturity of the securities is equal to or below 60 days
On last traded price as given on NDS-Section of CCIL Website (Excluding abnormal trade).
4) If the securities are non-traded and the
residual maturity of the securities is equal to or below 60 days
By amortization on straight line basis to maturity from cost or last valuation price whichever is more recent as long as it is within +/- 0.10 % of the reference price. Benchmark yields for calculating reference price to be provided by CRISIL / ICRA.
A (II) Pricing of Inter -Scheme Transfer of Debt Instruments (ISTs):
Sr. No.
Instrument Valuation applicable on the day of valuation
1. Certificate of Deposit (CD), Commercial Paper (CP), Non-Convertible Debenture (NCD) Pass Through Certificate (PTC), Bonds, etc.
i) Same security traded and reported on FTRAC/CBRICS up to the time of IST.
Pricing will be based on Weighted Average Yield of all trades in similar security/securities on FTRAC/CBRICS (excluding abnormal and retail trades) irrespective of settlement day plus accrual/amortization, if any, based on settlement day of the IST. Example : If settlement is T+0 then no accrual/amortization and if the settlement is other than T+0, then appropriate accrual/amortization
ii) If Same security is not traded but similar Security/securities are traded and reported up to the time of IST on FTRAC/CBRICS
Pricing will be based on Weighted Average Yield of all trades in similar security/securities on FTRAC/CBRICS (excluding abnormal and retail trades) irrespective of settlement day plus accrual/amortization, if any, based on settlement day of the IST. Example : If settlement is T+0 then no accrual/amortization and if the settlement is other than T+0, then appropriate accrual/amortization
iii) If Same or similar Security/securities are not traded and reported up to the time of IST on FTRAC/CBRICS
Previous end of the day valuation plus accrual, if any, based on settlement day of the IST is taken. Example: if settlement is T+0 then no accrual/amortization and if the settlement is other than T+0 then appropriate accrual/amortization.
2. Central Government Securities / State Government Securities / Treasury Bills/ Cash Management Bill etc
i) Same security traded and reported on NDS-OM section of CCIL website.
On last traded price as given on NDS-Section of CCIL Website (Excluding abnormal trade).
ii) Same security not traded and reported on NDS-OM section of CCIL website
Previous end of the day valuation price plus accrual/amortization is taken
29
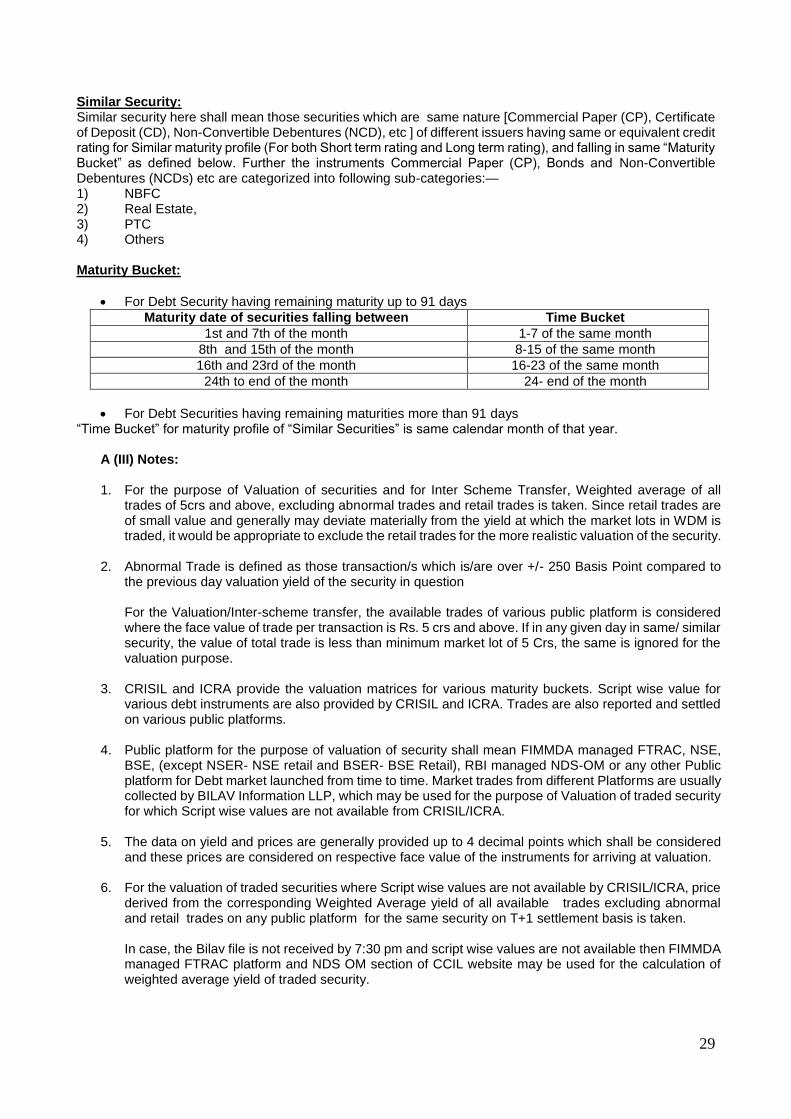
Similar Security: Similar security here shall mean those securities which are same nature [Commercial Paper (CP), Certificate of Deposit (CD), Non-Convertible Debentures (NCD), etc ] of different issuers having same or equivalent credit rating for Similar maturity profile (For both Short term rating and Long term rating), and falling in same “Maturity Bucket” as defined below. Further the instruments Commercial Paper (CP), Bonds and Non-Convertible Debentures (NCDs) etc are categorized into following sub-categories:— 1) NBFC 2) Real Estate, 3) PTC 4) Others Maturity Bucket:
For Debt Security having remaining maturity up to 91 days
Maturity date of securities falling between Time Bucket
1st and 7th of the month 1-7 of the same month
8th and 15th of the month 8-15 of the same month
16th and 23rd of the month 16-23 of the same month
24th to end of the month 24- end of the month
For Debt Securities having remaining maturities more than 91 days “Time Bucket” for maturity profile of “Similar Securities” is same calendar month of that year.
A (III) Notes:
1. For the purpose of Valuation of securities and for Inter Scheme Transfer, Weighted average of all trades of 5crs and above, excluding abnormal trades and retail trades is taken. Since retail trades are of small value and generally may deviate materially from the yield at which the market lots in WDM is traded, it would be appropriate to exclude the retail trades for the more realistic valuation of the security.
2. Abnormal Trade is defined as those transaction/s which is/are over +/- 250 Basis Point compared to the previous day valuation yield of the security in question For the Valuation/Inter-scheme transfer, the available trades of various public platform is considered where the face value of trade per transaction is Rs. 5 crs and above. If in any given day in same/ similar security, the value of total trade is less than minimum market lot of 5 Crs, the same is ignored for the valuation purpose.
3. CRISIL and ICRA provide the valuation matrices for various maturity buckets. Script wise value for various debt instruments are also provided by CRISIL and ICRA. Trades are also reported and settled on various public platforms.
4. Public platform for the purpose of valuation of security shall mean FIMMDA managed FTRAC, NSE, BSE, (except NSER- NSE retail and BSER- BSE Retail), RBI managed NDS-OM or any other Public platform for Debt market launched from time to time. Market trades from different Platforms are usually collected by BILAV Information LLP, which may be used for the purpose of Valuation of traded security for which Script wise values are not available from CRISIL/ICRA.
5. The data on yield and prices are generally provided up to 4 decimal points which shall be considered and these prices are considered on respective face value of the instruments for arriving at valuation.
6. For the valuation of traded securities where Script wise values are not available by CRISIL/ICRA, price derived from the corresponding Weighted Average yield of all available trades excluding abnormal and retail trades on any public platform for the same security on T+1 settlement basis is taken.
In case, the Bilav file is not received by 7:30 pm and script wise values are not available then FIMMDA managed FTRAC platform and NDS OM section of CCIL website may be used for the calculation of weighted average yield of traded security.
30
7. For non traded securities where Script wise values are not available, the valuation is done on the price derived from the corresponding the aggregated yield matrices for the respective category as provided by CRISIL/ICRA on T+1 settlement basis.
8. For Government Securities, SDL, T-Bills, Cash Management Bill etc, the valuation is done on
aggregated Script wise pricing as provided by CRISL/ICRA and as applicable for that day. In the absence of Script wise values the valuation is based on aggregated matrices if available from CRISIL/ICRA on T+1 settlement and as applicable for that day.
9. In case the valuation matrices/Script wise value is available either from CRISIL/ICRA up to a
reasonable time limit, the same is considered for arriving at valuation.
10. In respect of on any day neither the Script wise value nor the valuation Matrices is available from CRISIL/ICRA within the reasonable time limit, the Valuation is done on the basis of accrual/amortization based on the last valuation.
B: VALUATION OF EQUITY INSTRUMENTS 1. Traded Equity Securities When an equity security is not traded on any Stock Exchange on a particular valuation day, the value at which it was traded on the selected Stock Exchange, as the case may be, on the earliest previous day is used provided such date is not more than thirty days prior to valuation date. 2. Thinly Traded Equity / Equity Related Securities
(a) When trading in an equity and/or equity related securities (such as convertible debentures, equity warrants etc.) in a month is both less than Rs.5lacs in value and the total volume is less than 50,000 shares, the security is considered as thinly traded security.
(b) In order to determine whether a security is thinly traded or not, the volumes traded in all recognized
Stock Exchanges in India would be taken into account.
(c) Where a Stock Exchange identifies the thinly traded securities by applying the above parameters for the preceding calendar month and publishes or provides the required information along with the daily quotations, the same would be used for valuation.
(d) If the shares are not listed on the Stock Exchanges which provide such information, then we would make our own analysis in line with the above criteria to check whether such securities are thinly traded or not.
3. Non-traded / Suspended Securities When an equity security is not traded on any Stock Exchange for a period of thirty days prior to the valuation date, the Script would be treated as a non traded security. When an equity security is suspended up to thirty days, then the last traded price is considered for valuation of that security. If an equity security is suspended for more than thirty days, then the AMC or Trustees would decide the valuation norms to be followed and such norms would be documented and recorded. The valuation methodology for thinly traded equity securities, Non-traded equity securities would be as follows: Based on the latest available Balance Sheet, net worth would be calculated as follows:
(a) Net Worth per share = [share capital+ reserves (excluding revaluation reserves) – Misc. expenditure and Debit Balance in P&L A/c] Divided by No. of Paid up Shares.
(b) Average capitalization rate (P/E ratio) for the industry based upon NSE prices or BSE prices and discounted by 75% i.e. only 25% of the Industry average P/E would be taken as capitalization rate (P/E ratio). Earnings per Share (EPS) of the latest audited annual accounts would be considered for this purpose.
31
(c) The value as per the net worth value per share and the capital earning value calculated as above
would be averaged and further discounted by 10% for illiquidity so as to arrive at the fair value per share.
(d) In case the EPS is negative, EPS value for that year would be taken as zero for arriving at capitalized
earning.
(e) In case, where the latest Balance Sheet of the company is not available within nine months from the close of the year, unless the accounting year is changed, the shares of such companies would be valued at zero.
(f) In case, an individual security accounts for more than 5% of the total assets of the scheme, an Independent Valuer would be appointed for the valuation of the said security. To determine if a security accounts for more than 5 per cent of the total assets of the scheme, it would be valued by the procedure above and the proportion which it bears to the total net assets of the scheme to which it belongs will be compared on the date of valuation.
4. Unlisted Equity Methodology for Valuation - unlisted equity shares of a company would be valued "in good faith" as below:
a) Based on the latest available Balance Sheet, net worth would be calculated as follows:
1. Net Worth per share = [share capital+ reserves (excluding revaluation reserves) – Misc. expenditure and Debit Balance in P&L A/c] Divided by No. of Paid up Shares.
2. After taking into account the outstanding warrants and options, Net Worth per share would again be calculated and is = [Share Capital + consideration on exercise of Option and/or Warrants received/receivable by the Company + Free Reserves (excluding Revaluation Reserves) – Miscellaneous expenditure not written off or deferred revenue expenditure, intangible assets and accumulated losses] / Number of Paid up Shares plus Number of Shares that would be obtained on conversion and/or exercise of Outstanding Warrants and Options.
3. The lower of (1) and (2) above would be used for calculation of Net Worth per share and for further
calculation in (c) below.
b) Average capitalization rate (P/E ratio) for the industry based upon NSE prices or BSE prices and discounted by 75% i.e. only 25% of the Industry average P/E would be taken as capitalization rate (P/E ratio). Earnings per Share (EPS) of the latest audited annual accounts would be considered for this purpose.
c) The value as per the net worth value per share and the capital earning value calculated as above would be averaged and further discounted by 15% for illiquidity so as to arrive at the fair value per share.
The above valuation methodology would be subject to the following conditions:
a) All calculations would be based on audited accounts.
b) If the latest Balance Sheet of the company is not available within nine months from the close of the year, unless the accounting year is changed, the shares of such companies would be valued at zero.
c) If the Net Worth of the company is negative, the share would be marked down to zero.
d) In case the EPS is negative, EPS value for that year would be taken as zero for arriving at capitalized
earning.
e) In case an individual security accounts for more than 5 per cent of the total assets of the scheme, an Independent Valuer would be appointed for the valuation of the said security. To determine if a security accounts for more than 5 per cent of the total assets of the scheme, it is valued in accordance with the procedure as mentioned above on the date of valuation.
32
5. Demerger Generally on demerger, a listed security gets bifurcated into two or more shares. The valuation of these de-merged companies would depend on the following scenarios:
a) Both the shares are traded immediately on de-merger: In this case both the shares would be valued at respective traded prices.
b) Shares of only one company continued to be traded on de-merger: Traded shares would be valued
at traded price and the other security would to be valued at traded value on the day before the de merger less value of the traded security post de merger. In case value of the share of de-merged company is equal or in excess of the value of the pre de-merger share, then the non-traded share would be valued at zero, till the date it is listed.
c) Both the shares are not traded on de-merger: Shares of de-merged companies would be valued equal
to the pre de merger value up to a period of 30 days from the date of de merger till the date it is listed. The market price of the shares of the de-merged company one day prior to ex-date would be bifurcated over the de-merged shares. The market value of the shares would be bifurcated on a fair value basis, based on available information on the de-merger scheme.
d) In case shares of either of the companies are not traded for more than 30 days: Then it would be
treated as unlisted security, and valued accordingly till the date these are listed. 6. Preference Shares
Preference Shares valuation guidelines would be as follows:
a) Traded preference shares would be valued as per traded prices. b) Non traded Preference Shares I. Redeemable Preference Shares
i. Convertible preference share would be valued like convertible debentures.
In general in respect of convertible debentures and bonds, the non-convertible and convertible components would be valued separately. The non-convertible component would be valued on the same basis as would be applicable to a debt instrument. The convertible component would be valued on the same basis as would be applicable to an equity instrument. If a convertible preference share does not pay dividend then it would be treated like non convertible debentures.
ii. Non-Convertible preference share would be valued like a debt instrument.
II. Irredeemable preference shares would be valued on perpetual basis. It is like a constant dividend equity share.
7. Warrants
a) In respect of warrants to subscribe for shares attached to instruments, the warrants would be valued at the value of the share which would be obtained on exercise of the warrants as reduced by the amount which would be payable on exercise of the warrant. A discount similar to the discount to be determined in respect on convertible debentures is deducted to account for the period, which must elapse before the warrant can be exercised.
b) In case the warrants are traded separately they would be valued as per the valuation guidelines
applicable to Equity Shares. 8. Rights Until they are traded, the value of "rights" shares would be calculated as:
Vr = n ÷ m x (Pex - Pof) Where Vr = Value of rights
33
n = no. of rights offered m = no. of original shares held Pex = Ex-rights price Pof = Rights Offer Price
Where the rights are not treated pari passu with the existing shares, suitable adjustment would be made to the value of rights. Where it is decided not to subscribe for the rights but to renounce them and renunciations are being traded, the rights would be valued at the renunciation value. 9. Derivatives Market values of traded open futures and option contracts would be determined with respect to the exchange on which contracted originally, i.e., a future or an option contracted on the National Stock Exchange (NSE) would be valued at the closing price on the NSE. The price of the same futures and option contract on the Bombay Stock Exchange (BSE) cannot be considered for the purpose of valuation, unless the futures or option itself has been contracted on the BSE. The same will be valued at closing price if the contract is traded on the valuation day. In case there is no trade on valuation day then the same would be valued at Settlement prices. However, the contracts which are going to expire on valuation date would be valued at Settlement prices only. 10. Mutual Fund Units
a) In case of traded Mutual Fund schemes, the units would be valued at closing price on the stock exchange on which they are traded like equity instruments. In case the units are not traded for more than 7 days, last declared Repurchase Price (the price at which Mutual Fund schemes buys its units back) would be considered for valuation.
b) If the last available Repurchase price is older than 7 days, the valuation will be done at the last available
NAV reduced by illiquidity discount. The illiquidity discount will be 10% of NAV or as decided by the Valuation Committee.
c) In case of non-traded Mutual Fund scheme, the last declared Repurchase Price (the price at which
Mutual Fund schemes buys its units back) would be considered for valuation.
d) In case of Investments made by a scheme into the other scheme of Sahara Mutual Fund,if valuation date being the last day of the financial year falling on a non-business day,then the computed NAV would be considered for valuation on March 31.
Related matters
i) In case the income accrued on debt instruments is not received even after 90 days past the due date, the asset is termed as Non Performing Assets (NPAs) and all provisions/guidelines with respect to income accrual, provisioning etc as contained in SEBI circulars/guidelines issued from time to time shall apply and the valuation of such securities will be done accordingly. In case the company starts servicing the debt, re-schedulement is allowed, the applicable provision in SEBI circulars shall apply for provisioning and reclassification of the asset
ii) In case of any other instruments not covered in the policy above, the same is referred to the Investment
and Valuation Committee which is empowered to take decision. iii) In case of any perceived conflict of interest while valuating the securities, the matter is dealt and decided
by Investment and Valuation Committee.
iv) For non– business day the valuation is done on aggregated Script wise prices as provided by CRISIL/ICRA. In absence of Script wise prices the valuation is done on accrual basis/amortization basis based on last valuation
v) In case of exceptional circumstances like, policy announcements by government/regulatory bodies, natural disasters, public disturbances, extreme volatility in capital market, shut down of market, war etc and on those days if Script wise value or valuation matrices are not available from CRISIL/ICRA and if
34
security is not traded, the valuation for the day is done based on last valuation plus accrual/amortization or as may decided by the Investment and Valuation Committee.
vi) The Valuation Policy is reviewed by the Statutory Auditor at least once in a financial year.
vii) Valuation Policy as updated and approved by the Board of AMC / Board of Trustees is applicable for the schemes of Sahara Mutual Fund
2.3.1 Valuation of securities not covered under the above valuation policy: The total exposure in securities, which do not fall under above valuation norms, shall not exceed 5% of the total AUM of the scheme.
In case of any other instruments not covered in the policy above, the same shall be referred to the Investment and Valuation Committee which is empowered to take decision. Investment in such securities is to be valued by a method approved by the Investment and Valuation Committee and the same will be reported to the Board of Trustees. 2.3.2 Unrealized Appreciation/Depreciation.
In accordance with the Guidance Note on Accounting for Investments in the Financial Statements of Mutual Funds issued by the Institute of Chartered Accountants of India, the unrealized appreciation determined separately for each individual investment is directly transferred to the “Unrealized Appreciation Reserve Account” i.e. without routing it through the revenue account.
The provision for depreciation in value of investments determined separately for each individual investment is recognized in the revenue account. The loss (realized) on investments sold / transferred during the year is charged to revenue account, instead of being first adjusted against the provision for depreciation, if already created in the prior year, as recommended by the said Guidance Note. However, this departure from the Guidance Note does not have any net impact on the Scheme’s net assets or results for the year.
2.4 Revenue Recognition
2.4.1 Income and Expenses are recognized on accrual basis. 2.4.2 Interest on funds invested in short term deposits with scheduled commercial banks is
recognized on accrual basis. 2.4.3 Dividend income earned by the scheme is recognized on the date the share is quoted on ex-
dividend basis on principal stock exchange. 2.4.4 Proportionate realized gains on investments out of sales / repurchase proceeds at the time of
sale / repurchase of units are transferred to revenue Account from Unit Premium Reserve. 3. Net Asset Value for Growth/Dividend Options:
The net asset value of the units is determined separately for units issued under the Growth Option, Dividend Option, Growth Option – Direct and Dividend Option – Direct. For reporting the net asset value of the Growth Option, Dividend Option, Growth Option – Direct and Dividend Option - Direct, daily income earned, including realized and unrealized gain or loss in the value of investments and expenses incurred by the scheme are allocated to the options in proportion to the value of the net assets.
4. Unit Premium Reserve Account
Upon issue and redemption of units, the net premium or discount to the face value of units is adjusted against the unit premium reserve account of the Scheme, after an appropriate amount of the issue proceeds and redemption payout is credited or debited respectively to the income equalization account.
5. Income Equalization Account
An appropriate part of the sale proceeds or the redemption amount, as the case may be, is transferred to income equalization account. The total distributable surplus (without considering unrealized appreciation) upto the date of issue/ redemption of units has been taken into account for the purpose of ascertaining the amount to be transferred to Equalization Account on a daily basis. The net balance in this account is transferred to the Revenue Account at the end of the year.
35
6. Load Charges Service tax on exit load , if any, shall be paid out of the exit load proceeds and exit load net of service tax, if any, shall be credited to the scheme.
7. Unclaimed Redemption
In line with SEBI circular no. MFD/CIR/9/120 /2000 dated November 24, 2000 and SEBI circular no. SEBI/HO/IMD/DF2/CIR/P/2016/37 dated February 25, 2016, the unclaimed redemption and unclaimed dividend amounts may be deployed by the mutual funds in call money market or money market instruments and also be allowed to be invested in a separate plan of Liquid Scheme/ Money Market Mutual Fund scheme floated by Mutual Funds specifically for deployment of the unclaimed amounts. The investors who claim these amounts during a period of three years from the due date shall be paid initial unclaimed amount along with the income earned on its deployment. Investors who claim these amounts after 3 years, shall be paid initial unclaimed amount along with the income earned on its deployment till the end of the third year. After the third year, the income earned on such unclaimed amounts shall be used for the purpose of investor education. Further, AMC shall not be permitted to charge any exit load in this plan and TER (Total Expense Ratio) of such plans shall be capped at 50 bps. The AMC should make continuous effort to remind the investors through letters to take their unclaimed amounts.
8. NOTES ON ACCOUNTS 8.1 Management Fees, Trusteeship Fees, Custodian Fees, Scheme Expenses
Management Fees Management Fees (inclusive of GST) has been computed at 1.86% (P.Y. 2.81%) on average net assets calculated on a daily basis. Trusteeship Fees & Expenses In accordance with Deed of Trust dated 18th July 1996 between the Settler and the Trustees, an annual fee of Rs.1,00,000/- per Trustee is payable. During the financial year 2018-19, the Trusteeship fees and expenses amounted to Rs.97637.68. However, due to small AUM of the scheme, only an amount of Rs.10118.06 was charged to the scheme expenses and the balance amount was borne by the AMC. Custodian Charges HDFC Bank Ltd provides Custodial Services to the scheme for which fees is paid as per the agreement. Scheme Expenses As per guidelines issued vide SEBI circular dated October 22, 2018, the schemes related expenses had to be fully managed from the Total Expense Ratio (TER). During the financial year 2018-19 due to small size of AUM of the scheme only certain expenses have been paid from TER and the balance amount had been borne by the AMC, details are as under:
(Amount in Rs.)
Particulars Total Expenses Charged to Scheme TER
Balance borne by AMC
R & T Expenses 432097.39 195886.72 236210.67
Custodian Fees 253294.42 06056.11 147238.31
Audit Fees 224629.76 129979.08 94650.68
8.2 Provision for tax has not been made since the income of the scheme is exempt from tax under
Section 10(23D) of the Income Tax Act, 1961.
8.3 Transactions with Brokers in excess of 5% or more of the aggregate purchases and sale of securities made by the Fund have been reported to the Trustees on a Bimonthly basis.
36
8.4 During the year ended 31.03.2019 the Registrar and Transfer Agent charges amounting to
Rs.1,95,886.72 (PY:Rs.0.00) constitutes 12.81% (PY:0.00%) of the total scheme expenses
8.5 Transactions with Associates/related parties/group companies of Sponsor/AMC Brokerage / Commission on sale of units by the Scheme or by the Asset Management Company given to associates, pursuant to Regulation 25(8): Related Party:- Sahara India Financial Corporation Ltd(SIFCL):(sponsor)
Commission to SIFCL made for sale of units of the MF for the current year ended 31st March 2019.
(Rs. in lakhs)
Tax Gain Fund Growth Fund
Mid cap Fund
Wealth Plus Fund
Infrastructure Fund
0.0541 0.0026 0.0053 0.0005 0.0047
(Rs. in lakhs)
Star Value Fund Banking & Financial Services Fund
0.0003 0.0112
Commission to SIFCL made for sale of units of the MF for the previous year ended 31st March 2018. (Rs.In lakhs)
Tax Gain Fund Growth Fund
Liquid Fund
Mid cap Fund
Wealth Plus Fund
Infrastructure Fund
0.0920 0.0053 0.0003 0.0251 0.0005 0.0050
(Rs. In lakhs)
Star Value Fund Super 20 Fund Power and Natural Resources Fund
Banking & Financial Services Fund
0.0008 0.0001 - 0.0184
Commission to SIFCL
Name of associate / related parties /
group companies of Sponsor / AMC
Nature of association / nature
of relation
Period Covered
Business given (Rs cr and % of total business
received by the fund)
Commission paid (Rs & % of total commission
paid by the fund
1 2 3 4 5
SIFCL Sponsor / Mutual Fund Distributor
April 18-March 19
0.00
Rs.7874.96; 9.20%
SIFCL Sponsor / Mutual Fund Distributor
April 17-March 18
0.00
Rs.14755.39; 8.10%
In column No 5, the amount relates to trail commission.
Brokerage paid to Associates / Related Parties / Group Companies of Sponsor/AMC
Name of associate / related parties /
group companies of Sponsor / AMC
Nature of association /
nature of relation
Period Covered
Value of Transaction (in Rs, Cr & of Total value of Transaction of the
Fund)
Brokerage (Rs Cr & % of total brokerage paid
by the Fund)
- - - - -
There are no associate brokers, hence not applicable for the period April – Mar 2019 & April – Mar 2018.
8.6 The Aggregate value of Investments purchased and sold (Including Redemption) during the year as a percentage of daily average net asset value;
Purchases
Year Amount in Rs. % of Daily Average
2018-19 6,92,32,642 123.39
2017-18 2,09,28,334 27.64
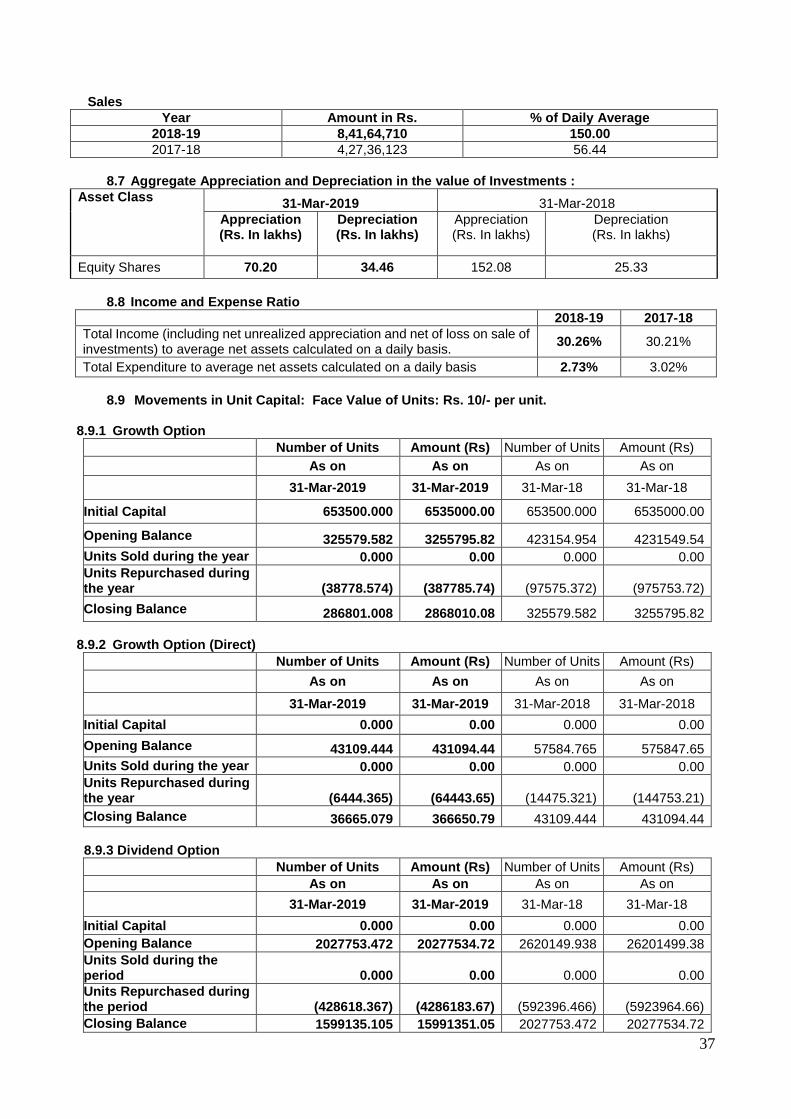
37
Sales
Year Amount in Rs. % of Daily Average
2018-19 8,41,64,710 150.00
2017-18 4,27,36,123 56.44
8.7 Aggregate Appreciation and Depreciation in the value of Investments :
Asset Class 31-Mar-2019 31-Mar-2018
Appreciation (Rs. In lakhs)
Depreciation (Rs. In lakhs)
Appreciation (Rs. In lakhs)
Depreciation (Rs. In lakhs)
Equity Shares 70.20 34.46 152.08 25.33
8.8 Income and Expense Ratio
2018-19 2017-18
Total Income (including net unrealized appreciation and net of loss on sale of investments) to average net assets calculated on a daily basis.
30.26% 30.21%
Total Expenditure to average net assets calculated on a daily basis 2.73% 3.02%
8.9 Movements in Unit Capital: Face Value of Units: Rs. 10/- per unit.
8.9.1 Growth Option
Number of Units Amount (Rs) Number of Units Amount (Rs)
As on As on As on As on
31-Mar-2019 31-Mar-2019 31-Mar-18 31-Mar-18
Initial Capital 653500.000 6535000.00 653500.000 6535000.00
Opening Balance 325579.582 3255795.82 423154.954 4231549.54
Units Sold during the year 0.000 0.00 0.000 0.00
Units Repurchased during the year (38778.574) (387785.74) (97575.372) (975753.72)
Closing Balance 286801.008 2868010.08 325579.582 3255795.82
8.9.2 Growth Option (Direct)
Number of Units Amount (Rs) Number of Units Amount (Rs)
As on As on As on As on
31-Mar-2019 31-Mar-2019 31-Mar-2018 31-Mar-2018
Initial Capital 0.000 0.00 0.000 0.00
Opening Balance 43109.444 431094.44 57584.765 575847.65
Units Sold during the year 0.000 0.00 0.000 0.00
Units Repurchased during the year (6444.365) (64443.65) (14475.321) (144753.21)
Closing Balance 36665.079 366650.79 43109.444 431094.44
8.9.3 Dividend Option
Number of Units Amount (Rs) Number of Units Amount (Rs)
As on As on As on As on
31-Mar-2019 31-Mar-2019 31-Mar-18 31-Mar-18
Initial Capital 0.000 0.00 0.000 0.00
Opening Balance 2027753.472 20277534.72 2620149.938 26201499.38
Units Sold during the period 0.000 0.00 0.000 0.00
Units Repurchased during the period (428618.367) (4286183.67) (592396.466) (5923964.66)
Closing Balance 1599135.105 15991351.05 2027753.472 20277534.72
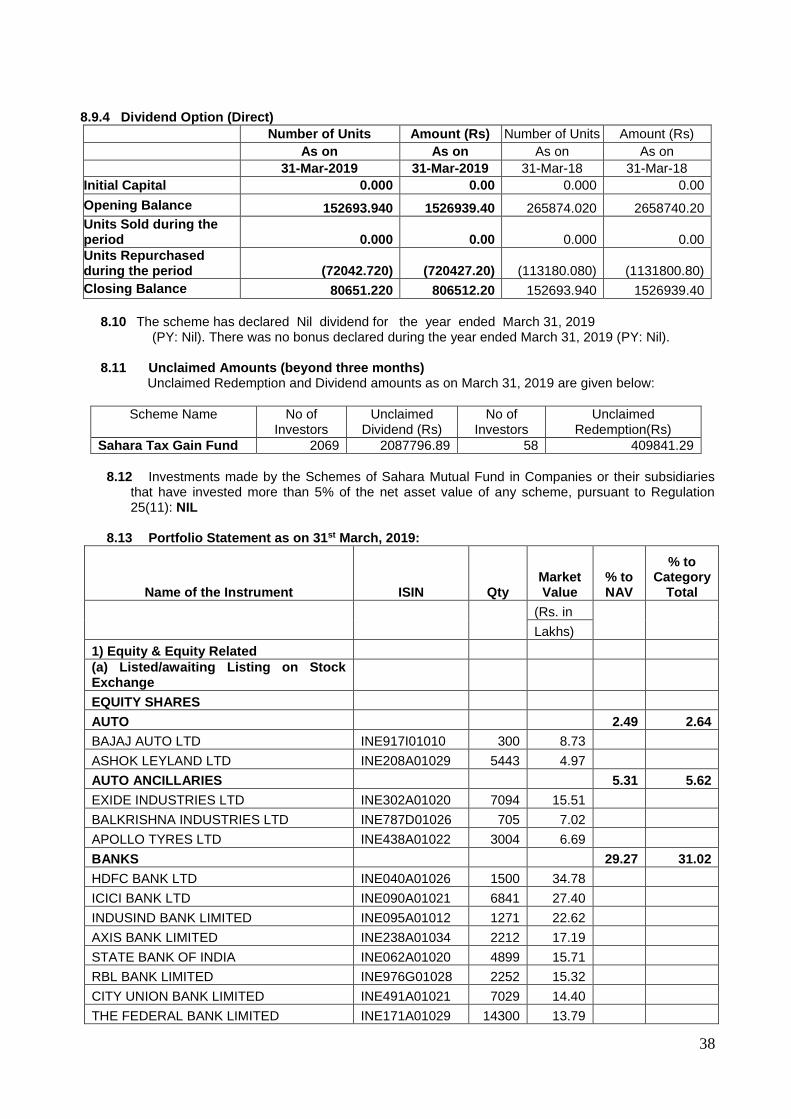
38
8.9.4 Dividend Option (Direct)
Number of Units Amount (Rs) Number of Units Amount (Rs)
As on As on As on As on
31-Mar-2019 31-Mar-2019 31-Mar-18 31-Mar-18
Initial Capital 0.000 0.00 0.000 0.00
Opening Balance 152693.940 1526939.40 265874.020 2658740.20
Units Sold during the period 0.000 0.00 0.000 0.00
Units Repurchased during the period (72042.720) (720427.20) (113180.080) (1131800.80)
Closing Balance 80651.220 806512.20 152693.940 1526939.40
8.10 The scheme has declared Nil dividend for the year ended March 31, 2019
(PY: Nil). There was no bonus declared during the year ended March 31, 2019 (PY: Nil).
8.11 Unclaimed Amounts (beyond three months) Unclaimed Redemption and Dividend amounts as on March 31, 2019 are given below:
Scheme Name No of Investors
Unclaimed Dividend (Rs)
No of Investors
Unclaimed Redemption(Rs)
Sahara Tax Gain Fund 2069 2087796.89 58 409841.29
8.12 Investments made by the Schemes of Sahara Mutual Fund in Companies or their subsidiaries
that have invested more than 5% of the net asset value of any scheme, pursuant to Regulation 25(11): NIL
8.13 Portfolio Statement as on 31st March, 2019:
Name of the Instrument ISIN Qty Market Value
% to NAV
% to Category
Total
(Rs. in
Lakhs)
1) Equity & Equity Related
(a) Listed/awaiting Listing on Stock Exchange
EQUITY SHARES
AUTO 2.49 2.64
BAJAJ AUTO LTD INE917I01010 300 8.73
ASHOK LEYLAND LTD INE208A01029 5443 4.97
AUTO ANCILLARIES 5.31 5.62
EXIDE INDUSTRIES LTD INE302A01020 7094 15.51
BALKRISHNA INDUSTRIES LTD INE787D01026 705 7.02
APOLLO TYRES LTD INE438A01022 3004 6.69
BANKS 29.27 31.02
HDFC BANK LTD INE040A01026 1500 34.78
ICICI BANK LTD INE090A01021 6841 27.40
INDUSIND BANK LIMITED INE095A01012 1271 22.62
AXIS BANK LIMITED INE238A01034 2212 17.19
STATE BANK OF INDIA INE062A01020 4899 15.71
RBL BANK LIMITED INE976G01028 2252 15.32
CITY UNION BANK LIMITED INE491A01021 7029 14.40
THE FEDERAL BANK LIMITED INE171A01029 14300 13.79
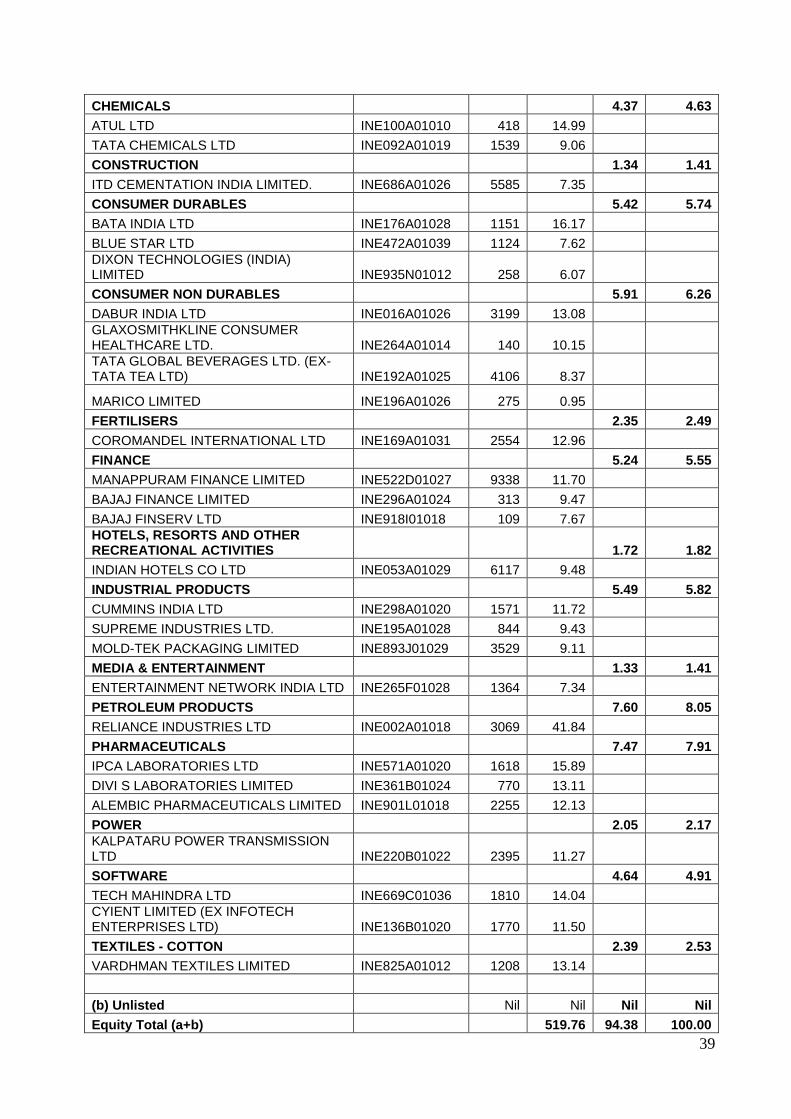
39
CHEMICALS 4.37 4.63
ATUL LTD INE100A01010 418 14.99
TATA CHEMICALS LTD INE092A01019 1539 9.06
CONSTRUCTION 1.34 1.41
ITD CEMENTATION INDIA LIMITED. INE686A01026 5585 7.35
CONSUMER DURABLES 5.42 5.74
BATA INDIA LTD INE176A01028 1151 16.17
BLUE STAR LTD INE472A01039 1124 7.62
DIXON TECHNOLOGIES (INDIA) LIMITED INE935N01012 258 6.07
CONSUMER NON DURABLES 5.91 6.26
DABUR INDIA LTD INE016A01026 3199 13.08
GLAXOSMITHKLINE CONSUMER HEALTHCARE LTD. INE264A01014 140 10.15
TATA GLOBAL BEVERAGES LTD. (EX- TATA TEA LTD) INE192A01025 4106 8.37
MARICO LIMITED INE196A01026 275 0.95
FERTILISERS 2.35 2.49
COROMANDEL INTERNATIONAL LTD INE169A01031 2554 12.96
FINANCE 5.24 5.55
MANAPPURAM FINANCE LIMITED INE522D01027 9338 11.70
BAJAJ FINANCE LIMITED INE296A01024 313 9.47
BAJAJ FINSERV LTD INE918I01018 109 7.67
HOTELS, RESORTS AND OTHER RECREATIONAL ACTIVITIES 1.72 1.82
INDIAN HOTELS CO LTD INE053A01029 6117 9.48
INDUSTRIAL PRODUCTS 5.49 5.82
CUMMINS INDIA LTD INE298A01020 1571 11.72
SUPREME INDUSTRIES LTD. INE195A01028 844 9.43
MOLD-TEK PACKAGING LIMITED INE893J01029 3529 9.11
MEDIA & ENTERTAINMENT 1.33 1.41
ENTERTAINMENT NETWORK INDIA LTD INE265F01028 1364 7.34
PETROLEUM PRODUCTS 7.60 8.05
RELIANCE INDUSTRIES LTD INE002A01018 3069 41.84
PHARMACEUTICALS 7.47 7.91
IPCA LABORATORIES LTD INE571A01020 1618 15.89
DIVI S LABORATORIES LIMITED INE361B01024 770 13.11
ALEMBIC PHARMACEUTICALS LIMITED INE901L01018 2255 12.13
POWER 2.05 2.17
KALPATARU POWER TRANSMISSION LTD INE220B01022 2395 11.27
SOFTWARE 4.64 4.91
TECH MAHINDRA LTD INE669C01036 1810 14.04
CYIENT LIMITED (EX INFOTECH ENTERPRISES LTD) INE136B01020 1770 11.50
TEXTILES - COTTON 2.39 2.53
VARDHMAN TEXTILES LIMITED INE825A01012 1208 13.14
(b) Unlisted Nil Nil Nil Nil
Equity Total (a+b) 519.76 94.38 100.00
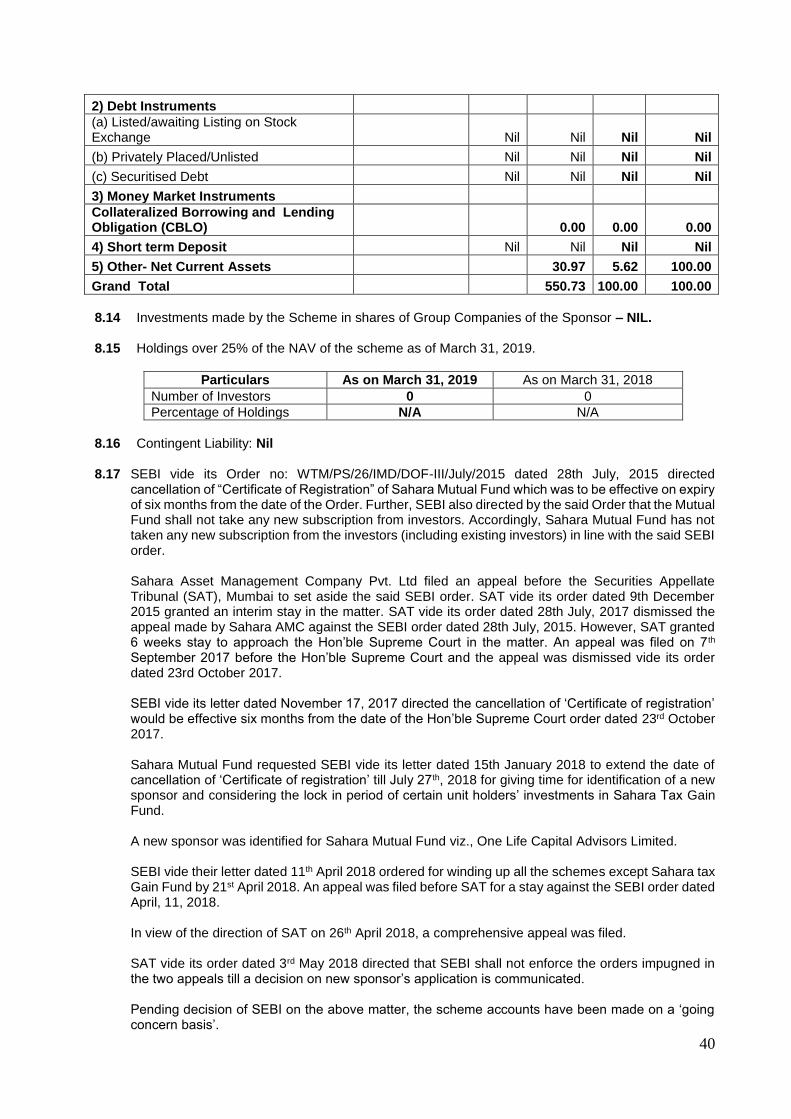
40
2) Debt Instruments
(a) Listed/awaiting Listing on Stock Exchange Nil Nil Nil Nil
(b) Privately Placed/Unlisted Nil Nil Nil Nil
(c) Securitised Debt Nil Nil Nil Nil
3) Money Market Instruments
Collateralized Borrowing and Lending Obligation (CBLO) 0.00 0.00 0.00
4) Short term Deposit Nil Nil Nil Nil
5) Other- Net Current Assets 30.97 5.62 100.00
Grand Total 550.73 100.00 100.00
8.14 Investments made by the Scheme in shares of Group Companies of the Sponsor – NIL.
8.15 Holdings over 25% of the NAV of the scheme as of March 31, 2019.
Particulars As on March 31, 2019 As on March 31, 2018
Number of Investors 0 0
Percentage of Holdings N/A N/A
8.16 Contingent Liability: Nil
8.17 SEBI vide its Order no: WTM/PS/26/IMD/DOF-III/July/2015 dated 28th July, 2015 directed
cancellation of “Certificate of Registration” of Sahara Mutual Fund which was to be effective on expiry of six months from the date of the Order. Further, SEBI also directed by the said Order that the Mutual Fund shall not take any new subscription from investors. Accordingly, Sahara Mutual Fund has not taken any new subscription from the investors (including existing investors) in line with the said SEBI order.
Sahara Asset Management Company Pvt. Ltd filed an appeal before the Securities Appellate Tribunal (SAT), Mumbai to set aside the said SEBI order. SAT vide its order dated 9th December 2015 granted an interim stay in the matter. SAT vide its order dated 28th July, 2017 dismissed the appeal made by Sahara AMC against the SEBI order dated 28th July, 2015. However, SAT granted 6 weeks stay to approach the Hon’ble Supreme Court in the matter. An appeal was filed on 7th September 2017 before the Hon’ble Supreme Court and the appeal was dismissed vide its order dated 23rd October 2017. SEBI vide its letter dated November 17, 2017 directed the cancellation of ‘Certificate of registration’ would be effective six months from the date of the Hon’ble Supreme Court order dated 23rd October 2017. Sahara Mutual Fund requested SEBI vide its letter dated 15th January 2018 to extend the date of cancellation of ‘Certificate of registration’ till July 27th, 2018 for giving time for identification of a new sponsor and considering the lock in period of certain unit holders’ investments in Sahara Tax Gain Fund. A new sponsor was identified for Sahara Mutual Fund viz., One Life Capital Advisors Limited. SEBI vide their letter dated 11th April 2018 ordered for winding up all the schemes except Sahara tax Gain Fund by 21st April 2018. An appeal was filed before SAT for a stay against the SEBI order dated April, 11, 2018. In view of the direction of SAT on 26th April 2018, a comprehensive appeal was filed. SAT vide its order dated 3rd May 2018 directed that SEBI shall not enforce the orders impugned in the two appeals till a decision on new sponsor’s application is communicated. Pending decision of SEBI on the above matter, the scheme accounts have been made on a ‘going concern basis’.
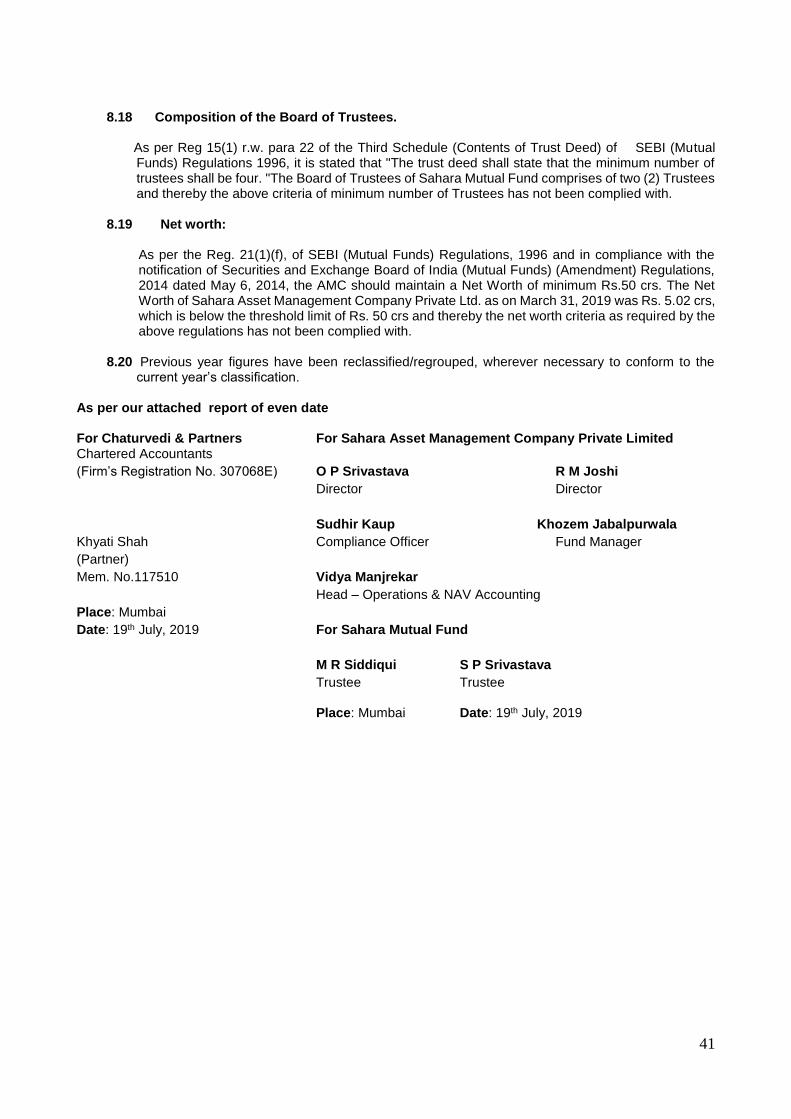
41
8.18 Composition of the Board of Trustees.
As per Reg 15(1) r.w. para 22 of the Third Schedule (Contents of Trust Deed) of SEBI (Mutual
Funds) Regulations 1996, it is stated that "The trust deed shall state that the minimum number of trustees shall be four. "The Board of Trustees of Sahara Mutual Fund comprises of two (2) Trustees and thereby the above criteria of minimum number of Trustees has not been complied with.
8.19 Net worth:
As per the Reg. 21(1)(f), of SEBI (Mutual Funds) Regulations, 1996 and in compliance with the notification of Securities and Exchange Board of India (Mutual Funds) (Amendment) Regulations, 2014 dated May 6, 2014, the AMC should maintain a Net Worth of minimum Rs.50 crs. The Net Worth of Sahara Asset Management Company Private Ltd. as on March 31, 2019 was Rs. 5.02 crs, which is below the threshold limit of Rs. 50 crs and thereby the net worth criteria as required by the above regulations has not been complied with.
8.20 Previous year figures have been reclassified/regrouped, wherever necessary to conform to the current year’s classification.
As per our attached report of even date
For Chaturvedi & Partners For Sahara Asset Management Company Private Limited Chartered Accountants
(Firm’s Registration No. 307068E) O P Srivastava R M Joshi
Director Director
Sudhir Kaup Khozem Jabalpurwala
Khyati Shah Compliance Officer Fund Manager
(Partner)
Mem. No.117510 Vidya Manjrekar
Head – Operations & NAV Accounting
Place: Mumbai
Date: 19th July, 2019 For Sahara Mutual Fund
M R Siddiqui S P Srivastava
Trustee Trustee Place: Mumbai Date: 19th July, 2019
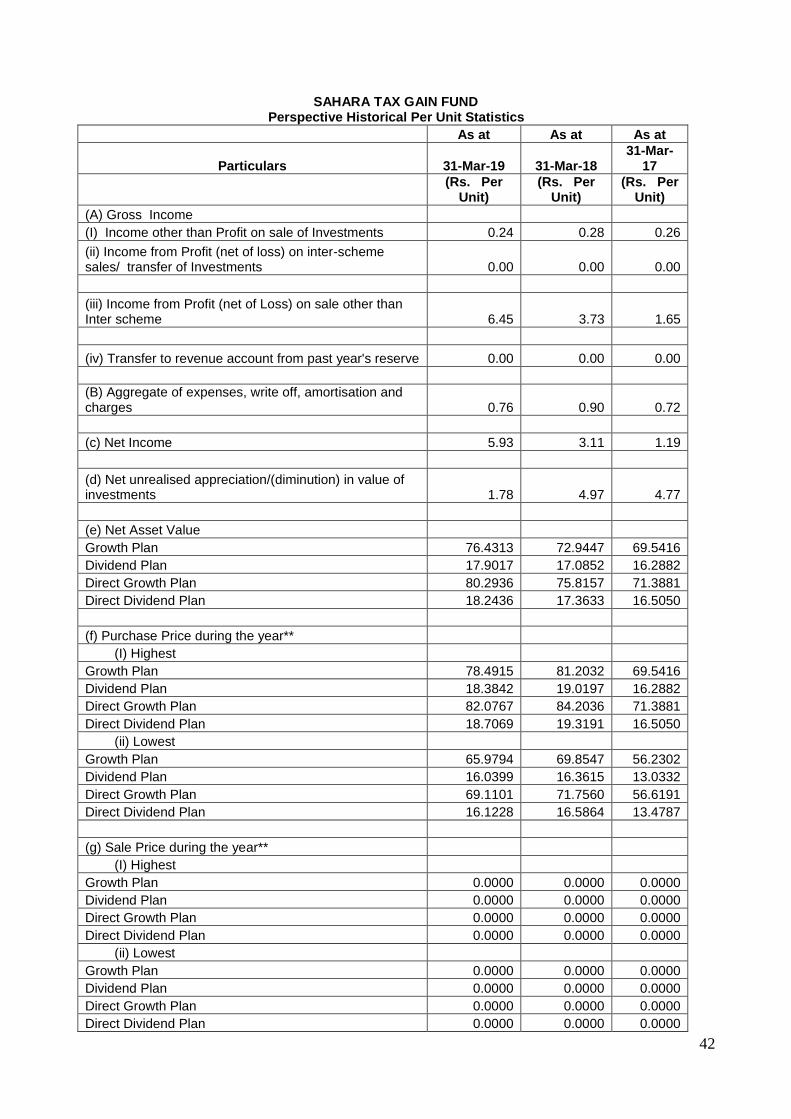
42
SAHARA TAX GAIN FUND Perspective Historical Per Unit Statistics
As at As at As at
Particulars 31-Mar-19 31-Mar-18
31-Mar-17
(Rs. Per
Unit) (Rs. Per
Unit) (Rs. Per
Unit)
(A) Gross Income
(I) Income other than Profit on sale of Investments 0.24 0.28 0.26
(ii) Income from Profit (net of loss) on inter-scheme sales/ transfer of Investments 0.00 0.00 0.00
(iii) Income from Profit (net of Loss) on sale other than Inter scheme 6.45 3.73 1.65
(iv) Transfer to revenue account from past year's reserve 0.00 0.00 0.00
(B) Aggregate of expenses, write off, amortisation and charges 0.76 0.90 0.72
(c) Net Income 5.93 3.11 1.19
(d) Net unrealised appreciation/(diminution) in value of investments 1.78 4.97 4.77
(e) Net Asset Value
Growth Plan 76.4313 72.9447 69.5416
Dividend Plan 17.9017 17.0852 16.2882
Direct Growth Plan 80.2936 75.8157 71.3881
Direct Dividend Plan 18.2436 17.3633 16.5050
(f) Purchase Price during the year**
(I) Highest
Growth Plan 78.4915 81.2032 69.5416
Dividend Plan 18.3842 19.0197 16.2882
Direct Growth Plan 82.0767 84.2036 71.3881
Direct Dividend Plan 18.7069 19.3191 16.5050
(ii) Lowest
Growth Plan 65.9794 69.8547 56.2302
Dividend Plan 16.0399 16.3615 13.0332
Direct Growth Plan 69.1101 71.7560 56.6191
Direct Dividend Plan 16.1228 16.5864 13.4787
(g) Sale Price during the year**
(I) Highest
Growth Plan 0.0000 0.0000 0.0000
Dividend Plan 0.0000 0.0000 0.0000
Direct Growth Plan 0.0000 0.0000 0.0000
Direct Dividend Plan 0.0000 0.0000 0.0000
(ii) Lowest
Growth Plan 0.0000 0.0000 0.0000
Dividend Plan 0.0000 0.0000 0.0000
Direct Growth Plan 0.0000 0.0000 0.0000
Direct Dividend Plan 0.0000 0.0000 0.0000
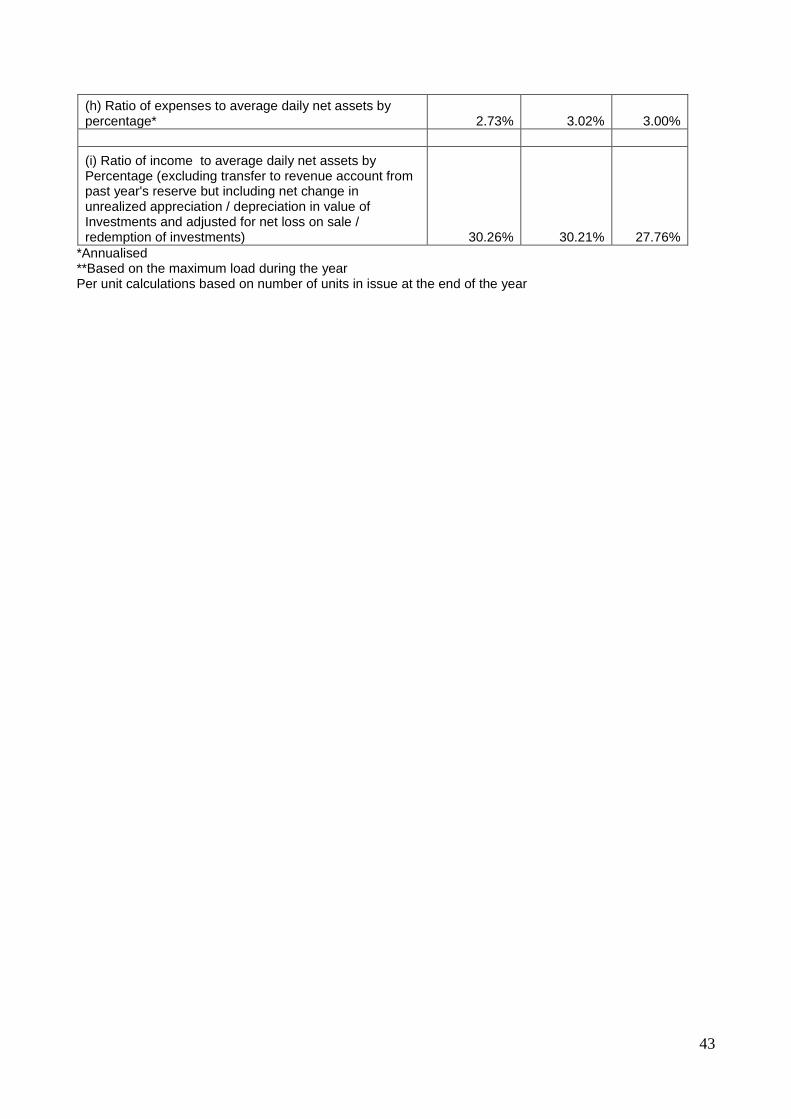
43
(h) Ratio of expenses to average daily net assets by percentage* 2.73% 3.02% 3.00%
(i) Ratio of income to average daily net assets by Percentage (excluding transfer to revenue account from past year's reserve but including net change in unrealized appreciation / depreciation in value of Investments and adjusted for net loss on sale / redemption of investments) 30.26% 30.21% 27.76%
*Annualised **Based on the maximum load during the year Per unit calculations based on number of units in issue at the end of the year

44
INDEPENDENT AUDITOR’S REPORT To the Trustees of Sahara Mutual Fund- Sahara Growth Fund Report on the Audit of the Financial Statements Opinion We have audited the accompanying financial statements of Sahara Mutual Fund – Sahara Growth Fund (“the Scheme”), which comprise the Balance Sheet as at March 31, 2019,the Revenue Account and the Cash Flow Statement for the year then ended, and noted to the financial statements, including a summary of significant accounting policies and other explanatory information. In our opinion and to the best of our information and according to the explanations given to us, the aforesaid financial statements of the scheme give the information specified in the Ninth Schedule to the Securities and Exchange Board of India (Mutual Funds) Regulations, 1996 and amendments thereto (“the SEBI Regulations”), as applicable, in the manner so required and give a true and fair view in conformity with the accounting principles generally accepted in India: (a) in the case of the Balance Sheet, of the state of affairs of the Scheme as at March 31, 2019; (b) in the case of the Revenue Account, of the surplus for the year ended on that date. (c) in the case of the Cash Flow Statement, of the cash flows for the year ended on that date. Basis for Opinion We conducted our audit of the financial statements in accordance with the Standards on Auditing (SA’s) issued by the Institute of Chartered Accountants of India (“ICAI). Our responsibilities under those Standards are further described in the Auditor’s Responsibilities for the Audit of the Financial Statements section of our report. We are independent of the Trust/Scheme in accordance with the Code of Ethics issued by the Institute of Chartered Accountants of India together with the independence requirements that are relevant to our audit of the financial statements of the Scheme. Our audit has been conducted in accordance with the accounting policies and standards specified in the SEBI Regulations and amendments thereto, as applicable and we have fulfilled our other ethical responsibilities in accordance with these requirements and the Code of Ethics. We believe that the audit evidence we have obtained is sufficient and appropriate to provide a basis for our opinion. Emphasis of Matter We draw attention to the following matter in the Notes to the financial statements: a) Note no. 8.17 which states, inter alia, that Sahara Mutual Fund had requested SEBI in January 2018 to
extend the date of cancellation of ‘Certificate of registration’ till 27th July, 2018 considering the lock in period of certain unit holders’ investments in Sahara Tax gain fund as well as for giving time for identification of a new sponsor. However, SEBI ordered for winding up of all schemes against which Sahara Mutual Fund appealed before SAT for a stay of SEBI order. In the meanwhile, a new sponsor was identified for Sahara Mutual Fund viz., One Life Capital Advisors Limited.
SAT vide its order dated 3rd May,2018 directed that SEBI shall not enforce the orders impugned in the appeals till a decision on new sponsor’s application is communicated. The above indicates the existence of a material uncertainty that may cast significant doubt about Sahara Mutual Fund’s ability to continue as a going concern. However, the financial statements of the Scheme have been prepared on a going concern basis, pending the decision of the SEBI on the sponsor.
b) Note no. 8.18 which states that minimum four Trustees are required as per Reg. 15(1) read with para 22
of the Third Schedule (Contents of Trust Deed) of SEBI (Mutual Funds) Regulations 1996, has not been complied with.
c) As per the Reg. 21(1)(f), of SEBI (Mutual Funds) Regulations, 1996 and in compliance with the notification of Securities and Exchange Board of India (Mutual Funds) (Amendment) Regulations, 2014 dated May 6, 2014, the AMC should have maintained a Net Worth of minimum Rs.50 crs. The Net Worth of SAMC as on March 31, 2019 was Rs.5.02 crs (refer Note 8.19); thereby net worth criteria has not been complied with.
Our opinion is not modified in respect of the above matter.

45
Responsibilities of the Management and Those Charged with Governance for the Financial Statements The Trustees of Sahara Mutual Fund and the Board of Directors of Sahara Asset Management Company Private Limited (the “Directors”) are responsible for the preparation of these financial statements that give a true and fair view of the financial position and financial performance of the Scheme in accordance with the accounting policies and standards specified in the SEBI Regulations and amendments thereto, as applicable. This responsibility also includes maintenance of adequate accounting records for safeguarding the assets of the Scheme and for preventing and detecting frauds and other irregularities; selection and application of appropriate accounting policies; making judgements and estimates that are reasonable and prudent; and design, implementation and maintenance of adequate internal financial controls, that were operating effectively for ensuring the accuracy and completeness of the accounting records, relevant to the preparation and presentation of the financial statements that give a true and fair view and are free from material misstatement, whether due to fraud or error. In preparing the financial statements, management is responsible for assessing the Scheme’s ability to continue as a going concern, disclosing , as applicable, matters related to going concern and using the going concern basis of accounting unless management either intends to liquidate the Scheme or to cease operations or has no realistic alternative but to do so. Those charged with Governance are also responsible for overseeing the Scheme’s financial reporting process. Auditor’s Responsibility for the Audit of the Financial Statements Our objectives are to obtain reasonable assurance about whether the standalone financial statements as a whole are free from material misstatement, whether due to fraud or error, and to issue an auditor’s report that includes our opinion. Reasonable assurance is a high level of assurance, but is not a guarantee that an audit conducted in accordance with SAs will always detect a material misstatement when it exists. Misstatements can arise from fraud or error and are considered material if ,individually or in the aggregate, they could reasonably be expected to influence the economic decisions of users taken on the basis of these standalone financial statements. As part of an audit in accordance with SAs, we exercise professional judgment and maintain professional skepticism throughout the audit. We also: • Identify and assess the risks of material misstatement of the standalone financial statements, whether due to fraud or error, design and perform audit procedures responsive to those risks, and obtain audit evidence that is sufficient and appropriate to provide a basis for our opinion. The risk of not detecting a material misstatement resulting from fraud is higher than for one resulting from error, as fraud may involve collusion, forgery, intentional omissions, misrepresentations, or the override of internal control. • Obtain an understanding of internal financial controls relevant to the audit in order to design audit procedures that are appropriate in the circumstances, but not for the purpose of expressing an opinion on effectiveness of the Company’s internal financial controls. • Evaluate the appropriateness of accounting policies used and the reasonableness of accounting estimates and related disclosures made by management. • Conclude on the appropriateness of management’s use of the going concern basis of accounting and, based on the audit evidence obtained, whether a material uncertainty exists related to events or conditions that may cast significant doubt on the ability of the Company to continue as a going concern. If we conclude that a material uncertainty exists, we are required to draw attention in our auditor’s report to the related disclosures in the standalone financial statements or, if such disclosures are inadequate, to modify our opinion. Our conclusions are based on the audit evidence obtained up to the date of our auditor’s report. However, future events or conditions may cause the Company to cease to continue as a going concern. • Evaluate the overall presentation, structure and content of the standalone financial statements, including the disclosures, and whether the standalone financial statements represent the underlying transactions and events in a manner that achieves fair presentation.

46
We communicate with those charged with governance regarding, among other matters, the planned scope and timing of the audit and significant audit findings, including any significant deficiencies in internal control that we identify during our audit. We also provide those charged with governance with a statement that we have complied with relevant ethical requirements regarding independence, and to communicate with them all relationships and other matters that may reasonably be thought to bear on our independence, and where applicable, related safeguards.
Report on Other Legal and Regulatory Requirements
As required by the Securities and Exchange Board of India (Mutual Funds) Regulations, 1996 and amendments thereto, as applicable, we report that: a) We have sought and obtained all the information and explanations, which to the best of our knowledge and belief were necessary for the purpose of our audit. b) The Balance Sheet and Revenue Account dealt with by this Report are in agreement with the books of account of the Scheme. c) The statement of account has been prepared in accordance with the accounting policies and standards specified in the SEBI Regulations and amendments thereto, as applicable. d) We have reviewed the Valuation Policy being followed for the schemes of Sahara Mutual Fund. The Valuation Policy implemented for the Scheme is in line with the SEBI guidelines issued in this regard.
For Chaturvedi & Partners. Chartered Accountants (Firm’s Registration No. 307068E) Khyati Shah (Partner) Mem. No. 117510 Place: Mumbai Date: July 19, 2019
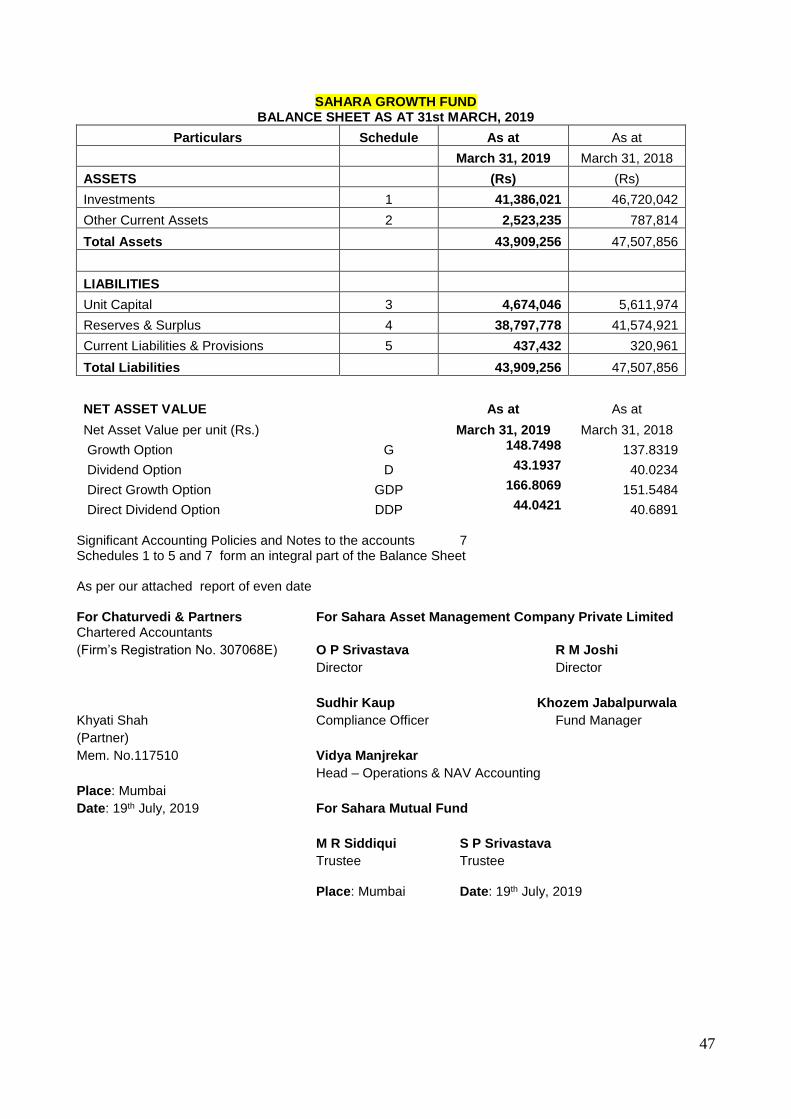
47
SAHARA GROWTH FUND BALANCE SHEET AS AT 31st MARCH, 2019
Particulars Schedule As at As at
March 31, 2019 March 31, 2018
ASSETS (Rs) (Rs)
Investments 1 41,386,021 46,720,042
Other Current Assets 2 2,523,235 787,814
Total Assets 43,909,256 47,507,856
LIABILITIES
Unit Capital 3 4,674,046 5,611,974
Reserves & Surplus 4 38,797,778 41,574,921
Current Liabilities & Provisions 5 437,432 320,961
Total Liabilities 43,909,256 47,507,856
NET ASSET VALUE As at As at
Net Asset Value per unit (Rs.) March 31, 2019 March 31, 2018
Growth Option G 148.7498 137.8319
Dividend Option D 43.1937 40.0234
Direct Growth Option GDP 166.8069 151.5484
Direct Dividend Option DDP 44.0421 40.6891 Significant Accounting Policies and Notes to the accounts 7 Schedules 1 to 5 and 7 form an integral part of the Balance Sheet As per our attached report of even date
For Chaturvedi & Partners For Sahara Asset Management Company Private Limited Chartered Accountants
(Firm’s Registration No. 307068E) O P Srivastava R M Joshi
Director Director
Sudhir Kaup Khozem Jabalpurwala
Khyati Shah Compliance Officer Fund Manager
(Partner)
Mem. No.117510 Vidya Manjrekar
Head – Operations & NAV Accounting
Place: Mumbai
Date: 19th July, 2019 For Sahara Mutual Fund
M R Siddiqui S P Srivastava
Trustee Trustee Place: Mumbai Date: 19th July, 2019

48
SAHARA GROWTH FUND
REVENUE ACCOUNT FOR THE YEAR ENDED MARCH 31, 2019
Particulars Schedule For the year
ended For the year
ended
March 31,
2019 March 31,
2018
(Rs) (Rs)
INCOME
Dividend 341,918 503,664
Interest & Discount Income
6,288 -
Other Income
146 -
Profit on Sale / Redemption of Investments(Net)
6,635,480
5,014,203
(Other than Inter Scheme Transfer / Sale)
Total Income
6,983,832
5,517,867
EXPENSES & LOSSES
(Refer note 8.1 of Schedule 7)
Management Fees
513,662
958,495
ST / GST on Management Fees
92,460
165,082
Investor Education & Awareness Fees
8,509
10,365
Registrar & Transfer Agent Charges
150,598
78,825
Transaction cost
15,345
17,629
Custodian Fees
81,918 -
Trusteeship Fees & Expenses
7,797 -
Audit Fees
100,386 -
Commission to Agents
2,608 -
Total Expenses
973,283
1,230,396
Net Surplus for the Year
6,010,549
4,287,471
Provision/ Write Back for diminution in the value of Investment 6
(256,196)
(38,647)
Net Surplus for the Year (excluding unrealised appreciation)
5,754,353
4,248,824
Transfer from Income Equalisation Reserve
(8,564,484)
(9,025,039)
Net : Transferred to Revenue Reserve
(2,810,131)
(4,776,215)
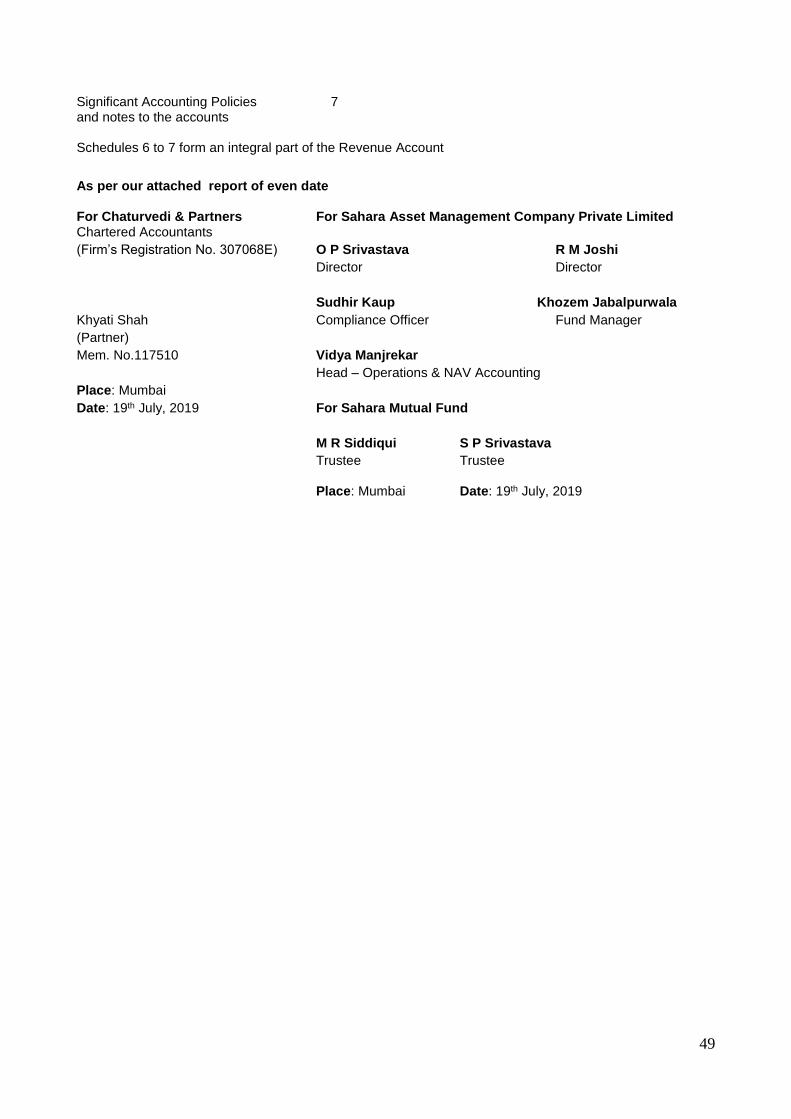
49
Significant Accounting Policies 7 and notes to the accounts Schedules 6 to 7 form an integral part of the Revenue Account
As per our attached report of even date For Chaturvedi & Partners For Sahara Asset Management Company Private Limited Chartered Accountants
(Firm’s Registration No. 307068E) O P Srivastava R M Joshi
Director Director
Sudhir Kaup Khozem Jabalpurwala
Khyati Shah Compliance Officer Fund Manager
(Partner)
Mem. No.117510 Vidya Manjrekar
Head – Operations & NAV Accounting
Place: Mumbai
Date: 19th July, 2019 For Sahara Mutual Fund
M R Siddiqui S P Srivastava
Trustee Trustee Place: Mumbai Date: 19th July, 2019
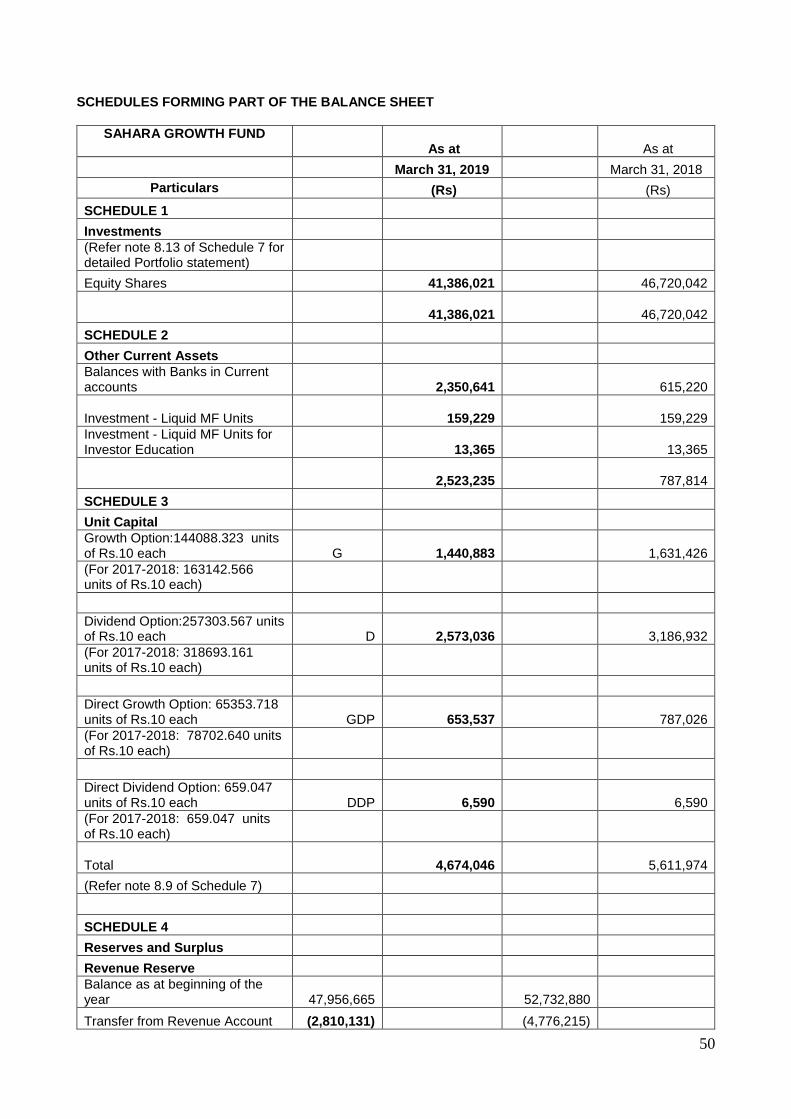
50
SCHEDULES FORMING PART OF THE BALANCE SHEET
SAHARA GROWTH FUND As at As at
March 31, 2019 March 31, 2018
Particulars (Rs) (Rs)
SCHEDULE 1
Investments
(Refer note 8.13 of Schedule 7 for detailed Portfolio statement)
Equity Shares 41,386,021 46,720,042
41,386,021
46,720,042
SCHEDULE 2
Other Current Assets
Balances with Banks in Current accounts
2,350,641
615,220
Investment - Liquid MF Units
159,229
159,229
Investment - Liquid MF Units for Investor Education
13,365
13,365
2,523,235
787,814
SCHEDULE 3
Unit Capital
Growth Option:144088.323 units of Rs.10 each G
1,440,883
1,631,426
(For 2017-2018: 163142.566 units of Rs.10 each)
Dividend Option:257303.567 units of Rs.10 each D
2,573,036
3,186,932
(For 2017-2018: 318693.161 units of Rs.10 each)
Direct Growth Option: 65353.718 units of Rs.10 each GDP
653,537
787,026
(For 2017-2018: 78702.640 units of Rs.10 each)
Direct Dividend Option: 659.047 units of Rs.10 each DDP
6,590
6,590
(For 2017-2018: 659.047 units of Rs.10 each)
Total
4,674,046
5,611,974
(Refer note 8.9 of Schedule 7)
SCHEDULE 4
Reserves and Surplus
Revenue Reserve
Balance as at beginning of the year 47,956,665 52,732,880
Transfer from Revenue Account (2,810,131) (4,776,215)
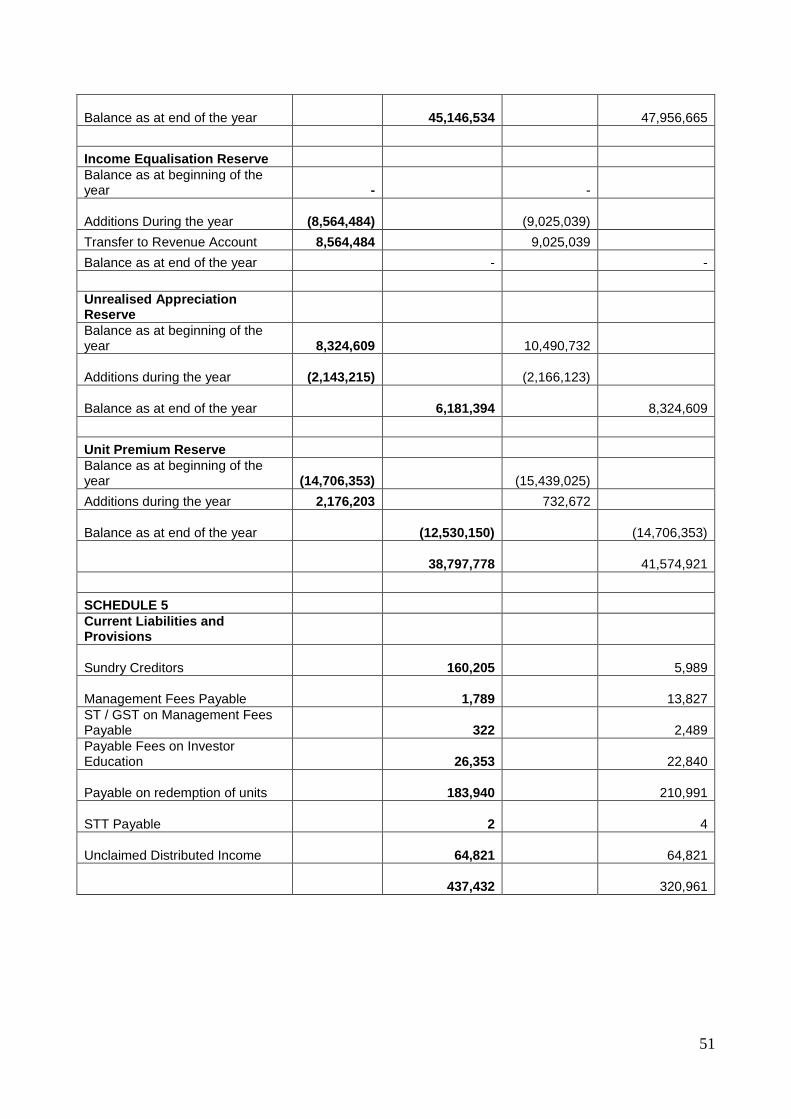
51
Balance as at end of the year
45,146,534
47,956,665
Income Equalisation Reserve
Balance as at beginning of the year - -
Additions During the year
(8,564,484) (9,025,039)
Transfer to Revenue Account 8,564,484 9,025,039
Balance as at end of the year - -
Unrealised Appreciation Reserve
Balance as at beginning of the year 8,324,609 10,490,732
Additions during the year
(2,143,215) (2,166,123)
Balance as at end of the year
6,181,394
8,324,609
Unit Premium Reserve
Balance as at beginning of the year
(14,706,353) (15,439,025)
Additions during the year 2,176,203 732,672
Balance as at end of the year
(12,530,150)
(14,706,353)
38,797,778
41,574,921
SCHEDULE 5
Current Liabilities and Provisions
Sundry Creditors
160,205
5,989
Management Fees Payable
1,789
13,827
ST / GST on Management Fees Payable
322
2,489
Payable Fees on Investor Education
26,353
22,840
Payable on redemption of units
183,940
210,991
STT Payable
2 4
Unclaimed Distributed Income
64,821
64,821
437,432
320,961
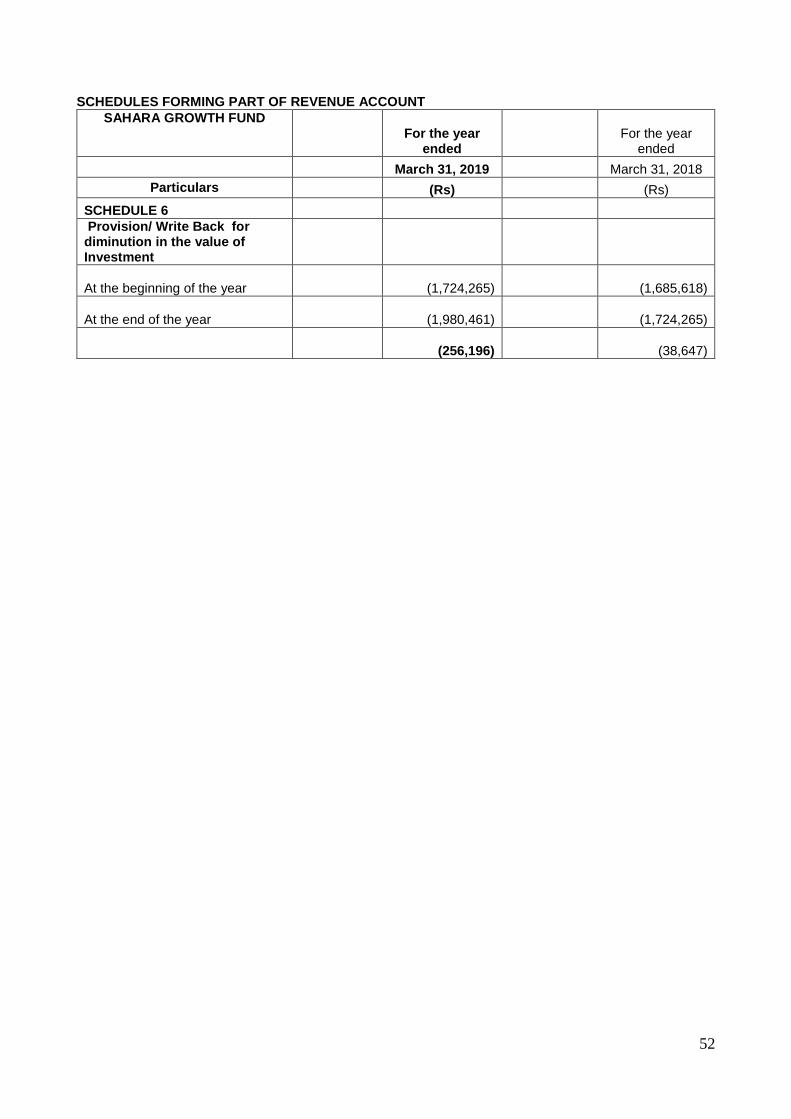
52
SCHEDULES FORMING PART OF REVENUE ACCOUNT
SAHARA GROWTH FUND
For the year
ended For the year
ended
March 31, 2019 March 31, 2018
Particulars (Rs) (Rs)
SCHEDULE 6
Provision/ Write Back for diminution in the value of Investment
At the beginning of the year
(1,724,265)
(1,685,618)
At the end of the year
(1,980,461)
(1,724,265)
(256,196)
(38,647)
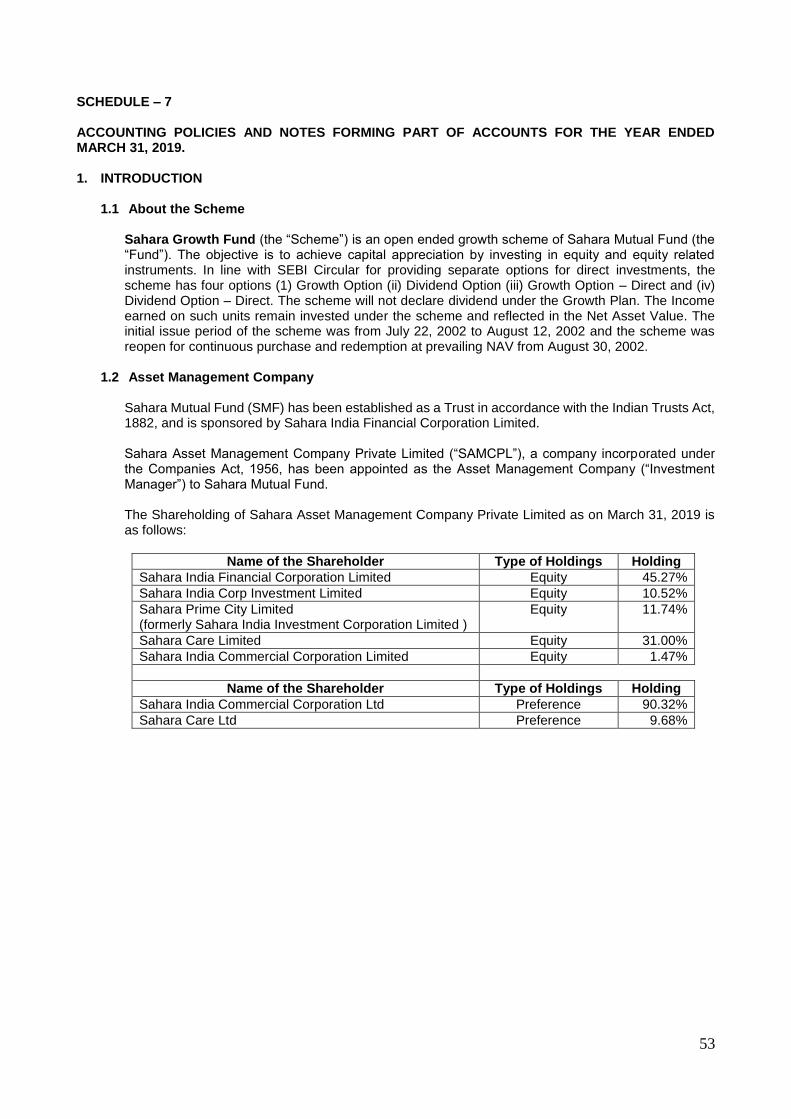
53
SCHEDULE – 7 ACCOUNTING POLICIES AND NOTES FORMING PART OF ACCOUNTS FOR THE YEAR ENDED MARCH 31, 2019. 1. INTRODUCTION
1.1 About the Scheme
Sahara Growth Fund (the “Scheme”) is an open ended growth scheme of Sahara Mutual Fund (the “Fund”). The objective is to achieve capital appreciation by investing in equity and equity related instruments. In line with SEBI Circular for providing separate options for direct investments, the scheme has four options (1) Growth Option (ii) Dividend Option (iii) Growth Option – Direct and (iv) Dividend Option – Direct. The scheme will not declare dividend under the Growth Plan. The Income earned on such units remain invested under the scheme and reflected in the Net Asset Value. The initial issue period of the scheme was from July 22, 2002 to August 12, 2002 and the scheme was reopen for continuous purchase and redemption at prevailing NAV from August 30, 2002.
1.2 Asset Management Company
Sahara Mutual Fund (SMF) has been established as a Trust in accordance with the Indian Trusts Act, 1882, and is sponsored by Sahara India Financial Corporation Limited. Sahara Asset Management Company Private Limited (“SAMCPL”), a company incorporated under the Companies Act, 1956, has been appointed as the Asset Management Company (“Investment Manager”) to Sahara Mutual Fund. The Shareholding of Sahara Asset Management Company Private Limited as on March 31, 2019 is as follows:
Name of the Shareholder Type of Holdings Holding
Sahara India Financial Corporation Limited Equity 45.27%
Sahara India Corp Investment Limited Equity 10.52%
Sahara Prime City Limited (formerly Sahara India Investment Corporation Limited )
Equity 11.74%
Sahara Care Limited Equity 31.00%
Sahara India Commercial Corporation Limited Equity 1.47%
Name of the Shareholder Type of Holdings Holding
Sahara India Commercial Corporation Ltd Preference 90.32%
Sahara Care Ltd Preference 9.68%
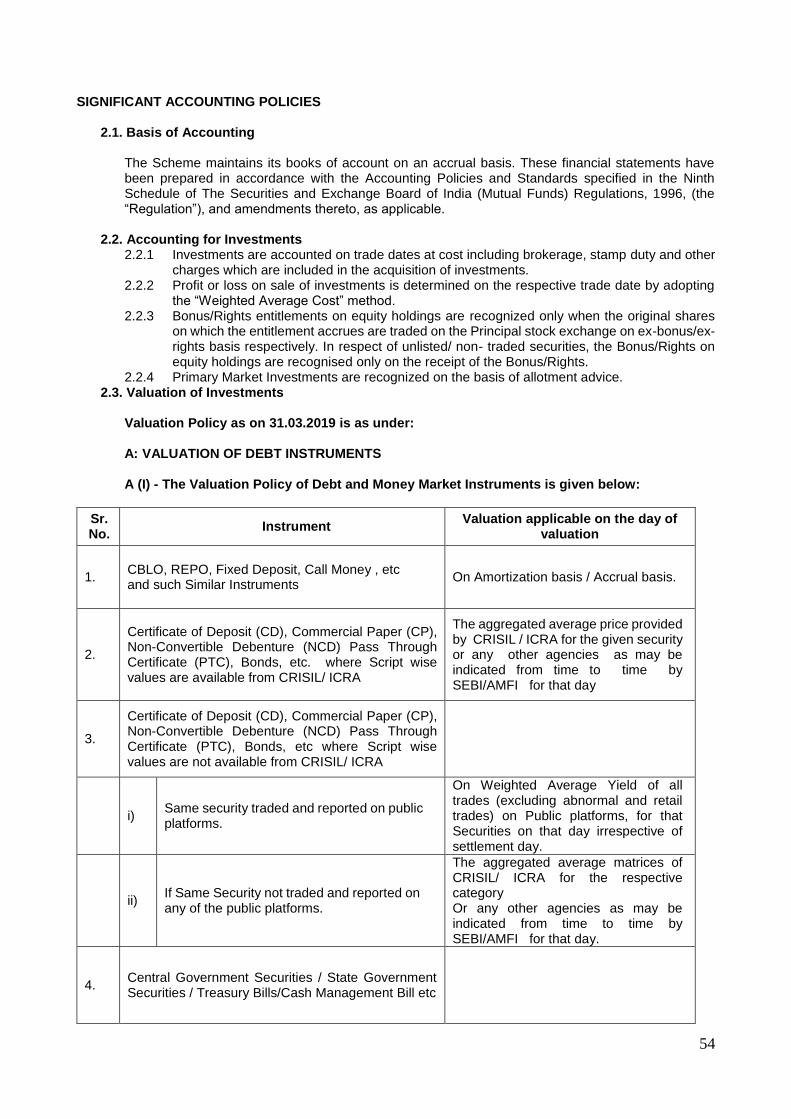
54
SIGNIFICANT ACCOUNTING POLICIES
2.1. Basis of Accounting
The Scheme maintains its books of account on an accrual basis. These financial statements have been prepared in accordance with the Accounting Policies and Standards specified in the Ninth Schedule of The Securities and Exchange Board of India (Mutual Funds) Regulations, 1996, (the “Regulation”), and amendments thereto, as applicable.
2.2. Accounting for Investments
2.2.1 Investments are accounted on trade dates at cost including brokerage, stamp duty and other charges which are included in the acquisition of investments.
2.2.2 Profit or loss on sale of investments is determined on the respective trade date by adopting the “Weighted Average Cost” method.
2.2.3 Bonus/Rights entitlements on equity holdings are recognized only when the original shares on which the entitlement accrues are traded on the Principal stock exchange on ex-bonus/ex-rights basis respectively. In respect of unlisted/ non- traded securities, the Bonus/Rights on equity holdings are recognised only on the receipt of the Bonus/Rights.
2.2.4 Primary Market Investments are recognized on the basis of allotment advice. 2.3. Valuation of Investments
Valuation Policy as on 31.03.2019 is as under:
A: VALUATION OF DEBT INSTRUMENTS A (I) - The Valuation Policy of Debt and Money Market Instruments is given below:
Sr. No.
Instrument Valuation applicable on the day of
valuation
1.
CBLO, REPO, Fixed Deposit, Call Money , etc and such Similar Instruments
On Amortization basis / Accrual basis.
2.
Certificate of Deposit (CD), Commercial Paper (CP), Non-Convertible Debenture (NCD) Pass Through Certificate (PTC), Bonds, etc. where Script wise values are available from CRISIL/ ICRA
The aggregated average price provided by CRISIL / ICRA for the given security or any other agencies as may be indicated from time to time by SEBI/AMFI for that day
3.
Certificate of Deposit (CD), Commercial Paper (CP), Non-Convertible Debenture (NCD) Pass Through Certificate (PTC), Bonds, etc where Script wise values are not available from CRISIL/ ICRA
i) Same security traded and reported on public platforms.
On Weighted Average Yield of all trades (excluding abnormal and retail trades) on Public platforms, for that Securities on that day irrespective of settlement day.
ii) If Same Security not traded and reported on any of the public platforms.
The aggregated average matrices of CRISIL/ ICRA for the respective category Or any other agencies as may be indicated from time to time by SEBI/AMFI for that day.
4. Central Government Securities / State Government Securities / Treasury Bills/Cash Management Bill etc
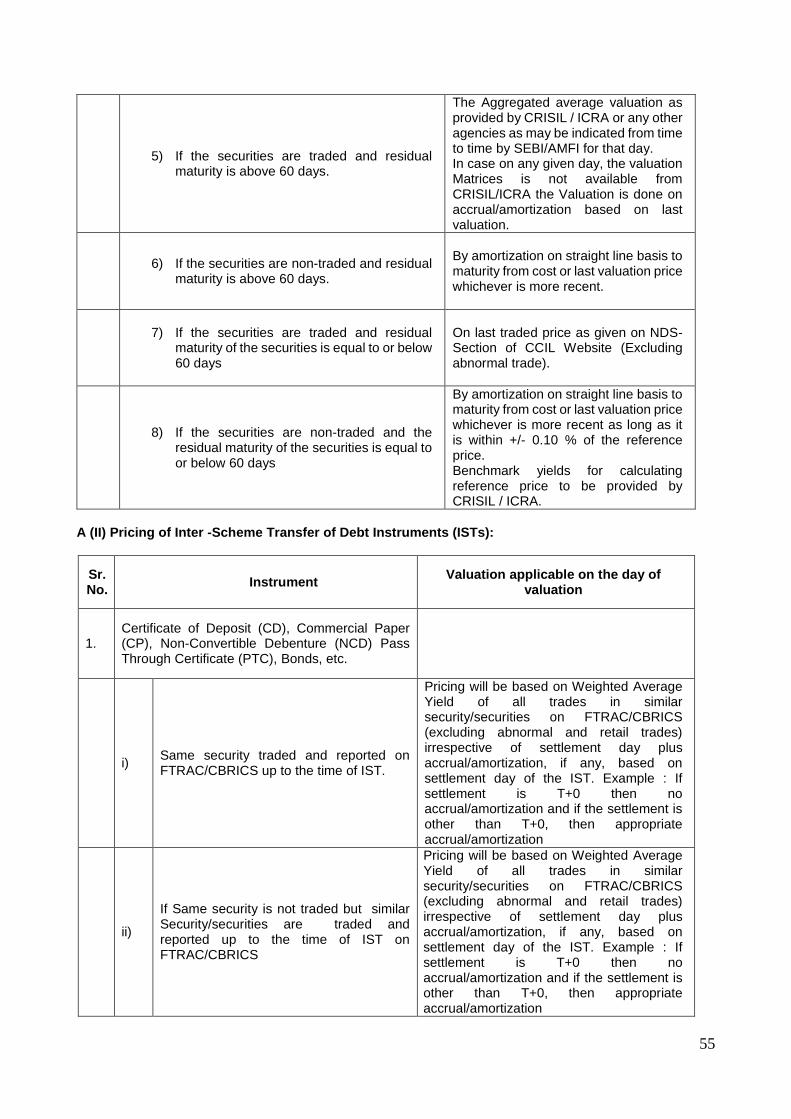
55
5) If the securities are traded and residual
maturity is above 60 days.
The Aggregated average valuation as provided by CRISIL / ICRA or any other agencies as may be indicated from time to time by SEBI/AMFI for that day. In case on any given day, the valuation Matrices is not available from CRISIL/ICRA the Valuation is done on accrual/amortization based on last valuation.
6) If the securities are non-traded and residual
maturity is above 60 days.
By amortization on straight line basis to maturity from cost or last valuation price whichever is more recent.
7) If the securities are traded and residual
maturity of the securities is equal to or below 60 days
On last traded price as given on NDS-Section of CCIL Website (Excluding abnormal trade).
8) If the securities are non-traded and the
residual maturity of the securities is equal to or below 60 days
By amortization on straight line basis to maturity from cost or last valuation price whichever is more recent as long as it is within +/- 0.10 % of the reference price. Benchmark yields for calculating reference price to be provided by CRISIL / ICRA.
A (II) Pricing of Inter -Scheme Transfer of Debt Instruments (ISTs):
Sr. No.
Instrument Valuation applicable on the day of
valuation
1. Certificate of Deposit (CD), Commercial Paper (CP), Non-Convertible Debenture (NCD) Pass Through Certificate (PTC), Bonds, etc.
i) Same security traded and reported on FTRAC/CBRICS up to the time of IST.
Pricing will be based on Weighted Average Yield of all trades in similar security/securities on FTRAC/CBRICS (excluding abnormal and retail trades) irrespective of settlement day plus accrual/amortization, if any, based on settlement day of the IST. Example : If settlement is T+0 then no accrual/amortization and if the settlement is other than T+0, then appropriate accrual/amortization
ii)
If Same security is not traded but similar Security/securities are traded and reported up to the time of IST on FTRAC/CBRICS
Pricing will be based on Weighted Average Yield of all trades in similar security/securities on FTRAC/CBRICS (excluding abnormal and retail trades) irrespective of settlement day plus accrual/amortization, if any, based on settlement day of the IST. Example : If settlement is T+0 then no accrual/amortization and if the settlement is other than T+0, then appropriate accrual/amortization
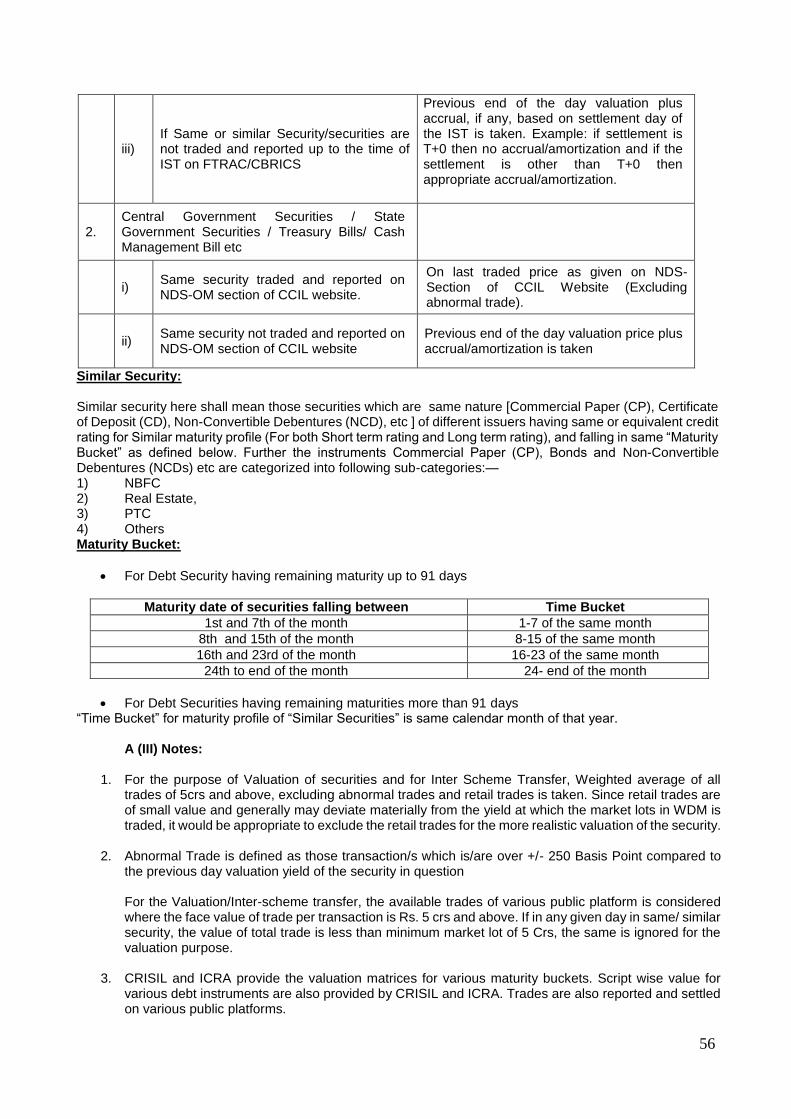
56
iii) If Same or similar Security/securities are not traded and reported up to the time of IST on FTRAC/CBRICS
Previous end of the day valuation plus accrual, if any, based on settlement day of the IST is taken. Example: if settlement is T+0 then no accrual/amortization and if the settlement is other than T+0 then appropriate accrual/amortization.
2. Central Government Securities / State Government Securities / Treasury Bills/ Cash Management Bill etc
i) Same security traded and reported on NDS-OM section of CCIL website.
On last traded price as given on NDS-Section of CCIL Website (Excluding abnormal trade).
ii) Same security not traded and reported on NDS-OM section of CCIL website
Previous end of the day valuation price plus accrual/amortization is taken
Similar Security: Similar security here shall mean those securities which are same nature [Commercial Paper (CP), Certificate of Deposit (CD), Non-Convertible Debentures (NCD), etc ] of different issuers having same or equivalent credit rating for Similar maturity profile (For both Short term rating and Long term rating), and falling in same “Maturity Bucket” as defined below. Further the instruments Commercial Paper (CP), Bonds and Non-Convertible Debentures (NCDs) etc are categorized into following sub-categories:— 1) NBFC 2) Real Estate, 3) PTC 4) Others Maturity Bucket:
For Debt Security having remaining maturity up to 91 days
Maturity date of securities falling between Time Bucket
1st and 7th of the month 1-7 of the same month
8th and 15th of the month 8-15 of the same month
16th and 23rd of the month 16-23 of the same month
24th to end of the month 24- end of the month
For Debt Securities having remaining maturities more than 91 days “Time Bucket” for maturity profile of “Similar Securities” is same calendar month of that year.
A (III) Notes:
1. For the purpose of Valuation of securities and for Inter Scheme Transfer, Weighted average of all trades of 5crs and above, excluding abnormal trades and retail trades is taken. Since retail trades are of small value and generally may deviate materially from the yield at which the market lots in WDM is traded, it would be appropriate to exclude the retail trades for the more realistic valuation of the security.
2. Abnormal Trade is defined as those transaction/s which is/are over +/- 250 Basis Point compared to the previous day valuation yield of the security in question For the Valuation/Inter-scheme transfer, the available trades of various public platform is considered where the face value of trade per transaction is Rs. 5 crs and above. If in any given day in same/ similar security, the value of total trade is less than minimum market lot of 5 Crs, the same is ignored for the valuation purpose.
3. CRISIL and ICRA provide the valuation matrices for various maturity buckets. Script wise value for various debt instruments are also provided by CRISIL and ICRA. Trades are also reported and settled on various public platforms.
57
4. Public platform for the purpose of valuation of security shall mean FIMMDA managed FTRAC, NSE, BSE, (except NSER- NSE retail and BSER- BSE Retail), RBI managed NDS-OM or any other Public platform for Debt market launched from time to time. Market trades from different Platforms are usually collected by BILAV Information LLP, which may be used for the purpose of Valuation of traded security for which Script wise values are not available from CRISIL/ICRA.
5. The data on yield and prices are generally provided up to 4 decimal points which shall be considered and these prices are considered on respective face value of the instruments for arriving at valuation.
6. For the valuation of traded securities where Script wise values are not available by CRISIL/ICRA, price derived from the corresponding Weighted Average yield of all available trades excluding abnormal and retail trades on any public platform for the same security on T+1 settlement basis is taken.
In case, the Bilav file is not received by 7:30 pm and script wise values are not available then FIMMDA managed FTRAC platform and NDS OM section of CCIL website may be used for the calculation of weighted average yield of traded security.
7. For non-traded securities where Script wise values are not available, the valuation is done on the price derived from the corresponding the aggregated yield matrices for the respective category as provided by CRISIL/ICRA on T+1 settlement basis.
8. For Government Securities, SDL, T-Bills, Cash Management Bill etc, the valuation is done on
aggregated Script wise pricing as provided by CRISL/ICRA and as applicable for that day. In the absence of Script wise values the valuation is based on aggregated matrices if available from CRISIL/ICRA on T+1 settlement and as applicable for that day.
9. In case the valuation matrices/Script wise value is available either from CRISIL/ICRA up to a
reasonable time limit, the same is considered for arriving at valuation.
10. In respect of on any day neither the Script wise value nor the valuation Matrices is available from CRISIL/ICRA within the reasonable time limit, the Valuation is done on the basis of accrual/amortization based on the last valuation.
B: VALUATION OF EQUITY INSTRUMENTS
1. Traded Equity Securities
When an equity security is not traded on any Stock Exchange on a particular valuation day, the value at which it was traded on the selected Stock Exchange, as the case may be, on the earliest previous day is used provided such date is not more than thirty days prior to valuation date. 2. Thinly Traded Equity / Equity Related Securities
(a) When trading in an equity and/or equity related securities (such as convertible debentures, equity
warrants etc.) in a month is both less than Rs.5lacs in value and the total volume is less than 50,000 shares, the security is considered as thinly traded security.
(b) In order to determine whether a security is thinly traded or not, the volumes traded in all recognized Stock Exchanges in India would be taken into account.
(c) Where a Stock Exchange identifies the thinly traded securities by applying the above parameters for
the preceding calendar month and publishes or provides the required information along with the daily quotations, the same would be used for valuation.
(d) If the shares are not listed on the Stock Exchanges which provide such information, then we would make our own analysis in line with the above criteria to check whether such securities are thinly traded or not.
58
3. Non-traded / Suspended Securities
When an equity security is not traded on any Stock Exchange for a period of thirty days prior to the valuation date, the Script would be treated as a non-traded security. When an equity security is suspended up to thirty days, then the last traded price is considered for valuation of that security. If an equity security is suspended for more than thirty days, then the AMC or Trustees would decide the valuation norms to be followed and such norms would be documented and recorded. The valuation methodology for thinly traded equity securities, Non-traded equity securities would be as follows:
Based on the latest available Balance Sheet, net worth would be calculated as follows:
(a) Net Worth per share = [share capital+ reserves (excluding revaluation reserves) – Misc. expenditure
and Debit Balance in P&L A/c] Divided by No. of Paid up Shares.
(b) Average capitalization rate (P/E ratio) for the industry based upon NSE prices or BSE prices and discounted by 75% i.e. only 25% of the Industry average P/E would be taken as capitalization rate (P/E ratio). Earnings per Share (EPS) of the latest audited annual accounts would be considered for this purpose.
(c) The value as per the net worth value per share and the capital earning value calculated as above
would be averaged and further discounted by 10% for illiquidity so as to arrive at the fair value per share.
(d) In case the EPS is negative, EPS value for that year would be taken as zero for arriving at capitalized
earning.
(e) In case, where the latest Balance Sheet of the company is not available within nine months from the close of the year, unless the accounting year is changed, the shares of such companies would be valued at zero.
(f) In case, an individual security accounts for more than 5% of the total assets of the scheme, an Independent Valuer would be appointed for the valuation of the said security. To determine if a security accounts for more than 5 per cent of the total assets of the scheme, it would be valued by the procedure above and the proportion which it bears to the total net assets of the scheme to which it belongs will be compared on the date of valuation.
4. Unlisted Equity
Methodology for Valuation - unlisted equity shares of a company would be valued "in good faith" as below:
a) Based on the latest available Balance Sheet, net worth would be calculated as follows:
1. Net Worth per share = [share capital+ reserves (excluding revaluation reserves) – Misc. expenditure
and Debit Balance in P&L A/c] Divided by No. of Paid up Shares.
2. After taking into account the outstanding warrants and options, Net Worth per share would again be calculated and is = [Share Capital + consideration on exercise of Option and/or Warrants received/receivable by the Company + Free Reserves (excluding Revaluation Reserves) – Miscellaneous expenditure not written off or deferred revenue expenditure, intangible assets and accumulated losses] / Number of Paid up Shares plus Number of Shares that would be obtained on conversion and/or exercise of Outstanding Warrants and Options.
3. The lower of (1) and (2) above would be used for calculation of Net Worth per share and for further
calculation in (c) below.
b) Average capitalization rate (P/E ratio) for the industry based upon NSE prices or BSE prices and discounted by 75% i.e. only 25% of the Industry average P/E would be taken as capitalization rate (P/E ratio). Earnings per Share (EPS) of the latest audited annual accounts would be considered for this purpose.
59
c) The value as per the net worth value per share and the capital earning value calculated as above
would be averaged and further discounted by 15% for illiquidity so as to arrive at the fair value per share.
The above valuation methodology would be subject to the following conditions:
a) All calculations would be based on audited accounts.
b) If the latest Balance Sheet of the company is not available within nine months from the close of the year, unless the accounting year is changed, the shares of such companies would be valued at zero.
c) If the Net Worth of the company is negative, the share would be marked down to zero.
d) In case the EPS is negative, EPS value for that year would be taken as zero for arriving at capitalized
earning.
e) In case an individual security accounts for more than 5 per cent of the total assets of the scheme, an Independent Valuer would be appointed for the valuation of the said security. To determine if a security accounts for more than 5 per cent of the total assets of the scheme, it is valued in accordance with the procedure as mentioned above on the date of valuation.
5. Demerger
Generally on demerger, a listed security gets bifurcated into two or more shares. The valuation of these de-merged companies would depend on the following scenarios:
a) Both the shares are traded immediately on de-merger: In this case both the shares would be valued
at respective traded prices.
b) Shares of only one company continued to be traded on de-merger: Traded shares would be valued at traded price and the other security would to be valued at traded value on the day before the de merger less value of the traded security post de merger. In case value of the share of de-merged company is equal or in excess of the value of the pre de-merger share, then the non-traded share would be valued at zero, till the date it is listed.
c) Both the shares are not traded on de-merger: Shares of de-merged companies would be valued equal
to the pre de merger value up to a period of 30 days from the date of de merger till the date it is listed. The market price of the shares of the de-merged company one day prior to ex-date would be bifurcated over the de-merged shares. The market value of the shares would be bifurcated on a fair value basis, based on available information on the de-merger scheme.
d) In case shares of either of the companies are not traded for more than 30 days: Then it would be
treated as unlisted security, and valued accordingly till the date these are listed. 6. Preference Shares
Preference Shares valuation guidelines would be as follows:
a) Traded preference shares would be valued as per traded prices. b) Non traded Preference Shares
I. Redeemable Preference Shares
i. Convertible preference share would be valued like convertible debentures.
In general in respect of convertible debentures and bonds, the non-convertible and convertible components would be valued separately. The non-convertible component would be valued on the same basis as would be applicable to a debt instrument. The convertible component would be valued on the same basis as would be applicable to an equity instrument.
If a convertible preference share does not pay dividend then it would be treated like non-convertible debentures.

60
ii. Non-Convertible preference share would be valued like a debt instrument.
II. Irredeemable preference shares would be valued on perpetual basis. It is like a constant dividend
equity share. 7. Warrants
a) In respect of warrants to subscribe for shares attached to instruments, the warrants would be valued at the value of the share which would be obtained on exercise of the warrants as reduced by the amount which would be payable on exercise of the warrant. A discount similar to the discount to be determined in respect on convertible debentures is deducted to account for the period, which must elapse before the warrant can be exercised.
b) In case the warrants are traded separately they would be valued as per the valuation guidelines applicable to Equity Shares.
8. Rights
Until they are traded, the value of "rights" shares would be calculated as: Vr = n ÷ m x (Pex - Pof) Where Vr = Value of rights n = no. of rights offered m = no. of original shares held Pex = Ex-rights price Pof = Rights Offer Price
Where the rights are not treated pari passu with the existing shares, suitable adjustment would be made to the value of rights. Where it is decided not to subscribe for the rights but to renounce them and renunciations are being traded, the rights would be valued at the renunciation value.
9. Derivatives
Market values of traded open futures and option contracts would be determined with respect to the exchange on which contracted originally, i.e., a future or an option contracted on the National Stock Exchange (NSE) would be valued at the closing price on the NSE. The price of the same futures and option contract on the Bombay Stock Exchange (BSE) cannot be considered for the purpose of valuation, unless the futures or option itself has been contracted on the BSE. The same will be valued at closing price if the contract is traded on the valuation day. In case there is no trade on valuation day then the same would be valued at Settlement prices. However, the contracts which are going to expire on valuation date would be valued at Settlement prices only.
10. Mutual Fund Units
a) In case of traded Mutual Fund schemes, the units would be valued at closing price on the stock exchange on which they are traded like equity instruments. In case the units are not traded for more than 7 days, last declared Repurchase Price (the price at which Mutual Fund schemes buys its units back) would be considered for valuation.
b) If the last available Repurchase price is older than 7 days, the valuation will be done at the last available NAV reduced by illiquidity discount. The illiquidity discount will be 10% of NAV or as decided by the Valuation Committee.
c) In case of non-traded Mutual Fund scheme, the last declared Repurchase Price (the price at which Mutual Fund schemes buys its units back) would be considered for valuation.
d) In case of Investments made by a scheme into the other scheme of Sahara Mutual Fund, if valuation date being the last day of the financial year falling on a non-business day,then the computed NAV would be considered for valuation on March 31.
61
Related matters viii) In case the income accrued on debt instruments is not received even after 90 days past the due date, the
asset is termed as Non-Performing Assets (NPAs) and all provisions/guidelines with respect to income accrual, provisioning etc as contained in SEBI circulars/guidelines issued from time to time shall apply and the valuation of such securities will be done accordingly. In case the company starts servicing the debt, re-schedulement is allowed, the applicable provision in SEBI circulars shall apply for provisioning and reclassification of the asset
ix) In case of any other instruments not covered in the policy above, the same is referred to the Investment and
Valuation Committee which is empowered to take decision.
x) In case of any perceived conflict of interest while valuating the securities, the matter is dealt and decided by Investment and Valuation Committee.
xi) For non– business day the valuation is done on aggregated Script wise prices as provided by CRISIL/ICRA.
In absence of Script wise prices the valuation is done on accrual basis/amortization basis based on last valuation
xii) In case of exceptional circumstances like, policy announcements by government/regulatory bodies, natural
disasters, public disturbances, extreme volatility in capital market, shut down of market, war etc and on those days if Script wise value or valuation matrices are not available from CRISIL/ICRA and if security is not traded, the valuation for the day is done based on last valuation plus accrual/amortization or as may decided by the Investment and Valuation Committee.
xiii) The Valuation Policy is reviewed by the Statutory Auditor at least once in a financial year.
xiv) Valuation Policy as updated and approved by the Board of AMC / Board of Trustees is applicable for the
schemes of Sahara Mutual Fund. 2.3.1 Valuation of securities not covered under the above valuation policy:
The total exposure in securities, which do not fall under above valuation norms, shall not exceed 5% of the total AUM of the scheme. In case of any other instruments not covered in the policy above, the same shall be referred to the Investment and Valuation Committee which is empowered to take decision. Investment in such securities is to be valued by a method approved by the Investment and Valuation Committee and the same will be reported to the Board of Trustees.
2.3.2 Unrealized Appreciation/Depreciation. In accordance with the Guidance Note on Accounting for Investments in the Financial Statements of Mutual Funds issued by the Institute of Chartered Accountants of India, the unrealized appreciation determined separately for each individual investment is directly transferred to the “Unrealized Appreciation Reserve Account” i.e. without routing it through the revenue account.
The provision for depreciation in value of investments determined separately for each individual investment is recognized in the revenue account. The loss (realized) on investments sold / transferred during the year is charged to revenue account, instead of being first adjusted against the provision for depreciation, if already created in the prior year, as recommended by the said Guidance Note. However, this departure from the Guidance Note does not have any net impact on the Scheme’s net assets or results for the year.
2.4 Revenue Recognition
2.4.1 Income and Expenses are recognized on accrual basis. 2.4.2 Interest on funds invested in short term deposits with scheduled commercial banks is
recognized on accrual basis. 2.4.3 Dividend income earned by the scheme is recognized on the date the share is quoted on ex-
dividend basis on principal stock exchange.
62
2.4.4 Proportionate realized gains on investments out of sales / repurchase proceeds at the time of sale / repurchase of units are transferred to revenue Account from Unit Premium Reserve.
3. Net Asset Value for Growth/Dividend Options:
The net asset value of the units is determined separately for units issued under the Growth Option, Dividend Option, Growth Option – Direct and Dividend Option – Direct. For reporting the net asset value of the Growth Option, Dividend Option, Growth Option – Direct and Dividend Option - Direct, daily income earned, including realized and unrealized gain or loss in the value of investments and expenses incurred by the scheme are allocated to the options in proportion to the value of the net assets.
4. Unit Premium Reserve Account
Upon issue and redemption of units, the net premium or discount to the face value of units is adjusted against the unit premium reserve account of the Scheme, after an appropriate amount of the issue proceeds and redemption payout is credited or debited respectively to the income equalization account.
5. Income Equalization Account
An appropriate part of the sale proceeds or the redemption amount, as the case may be, is transferred to income equalization account. The total distributable surplus (without considering unrealized appreciation) upto the date of issue/ redemption of units has been taken into account for the purpose of ascertaining the amount to be transferred to Equalization Account on a daily basis. The net balance in this account is transferred to the Revenue Account at the end of the year.
6. Load Charges
Service tax on exit load , if any, shall be paid out of the exit load proceeds and exit load net of service tax, if any, shall be credited to the scheme.
7. Unclaimed Redemption In line with SEBI circular no. MFD/CIR/9/120 /2000 dated November 24, 2000 and SEBI circular no. SEBI/HO/IMD/DF2/CIR/P/2016/37 dated February 25, 2016, the unclaimed redemption and unclaimed dividend amounts may be deployed by the mutual funds in call money market or money market instruments and also be allowed to be invested in a separate plan of Liquid Scheme/ Money Market Mutual Fund scheme floated by Mutual Funds specifically for deployment of the unclaimed amounts. The investors who claim these amounts during a period of three years from the due date shall be paid initial unclaimed amount along with the income earned on its deployment. Investors who claim these amounts after 3 years, shall be paid initial unclaimed amount along with the income earned on its deployment till the end of the third year. After the third year, the income earned on such unclaimed amounts shall be used for the purpose of investor education. Further, AMC shall not be permitted to charge any exit load in this plan and TER (Total Expense Ratio) of such plans shall be capped at 50 bps. The AMC should make continuous effort to remind the investors through letters to take their unclaimed amounts.
8. NOTES TO THE ACCOUNTS
8.1 Management Fees, Trusteeship Fees, Custodian Fees, Scheme Expenses.
Management Fees
Management Fees (inclusive of GST) has been computed at 1.42% (PY: 2.17%) on average net assets calculated on a daily basis.
Trusteeship Fees & Expenses
In accordance with Deed of Trust dated 18th July 1996 between the Settler and the Trustees, an annual fee of Rs.1,00,000/- per Trustee is payable. During the financial year 2018-19,the Trusteeship fees and expenses amounted to Rs.75225.12. However, due to small AUM of the scheme, only an amount of Rs.7796.66 was charged to the scheme expenses and the balance amount was borne by the AMC.
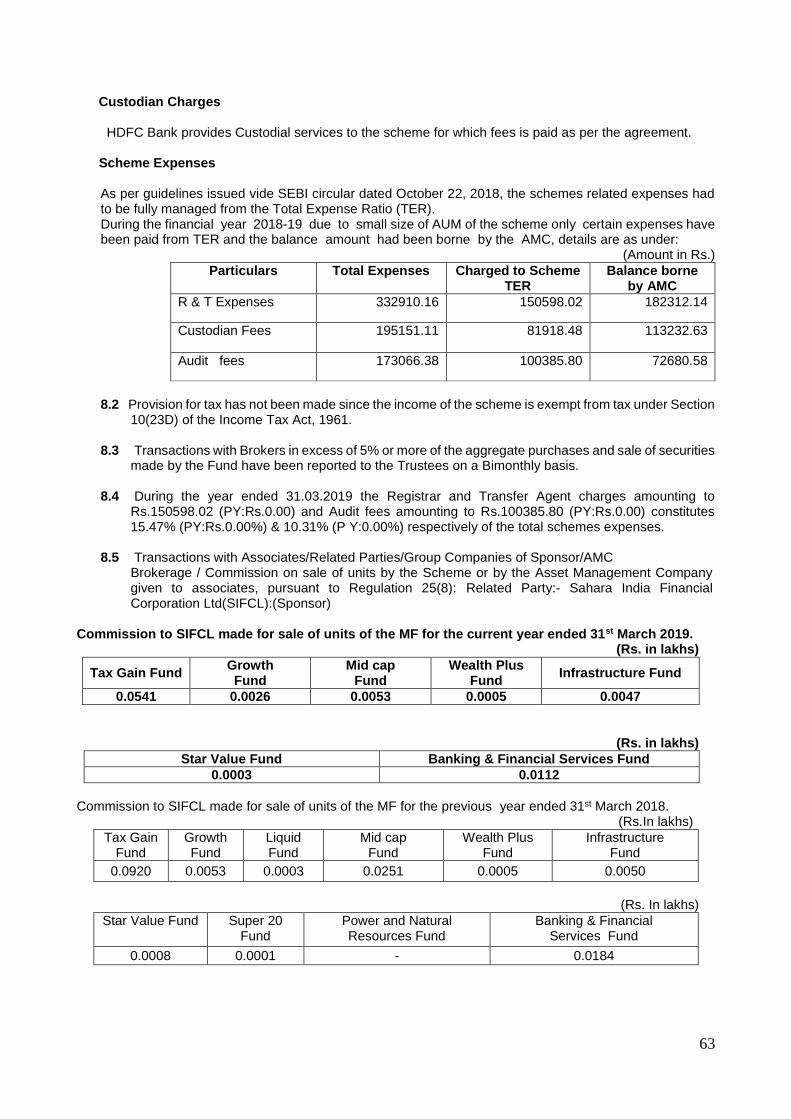
63
Custodian Charges
HDFC Bank provides Custodial services to the scheme for which fees is paid as per the agreement.
Scheme Expenses
As per guidelines issued vide SEBI circular dated October 22, 2018, the schemes related expenses had to be fully managed from the Total Expense Ratio (TER). During the financial year 2018-19 due to small size of AUM of the scheme only certain expenses have been paid from TER and the balance amount had been borne by the AMC, details are as under:
(Amount in Rs.)
Particulars Total Expenses Charged to Scheme TER
Balance borne by AMC
R & T Expenses 332910.16 150598.02 182312.14
Custodian Fees 195151.11 81918.48 113232.63
Audit fees 173066.38 100385.80 72680.58
8.2 Provision for tax has not been made since the income of the scheme is exempt from tax under Section
10(23D) of the Income Tax Act, 1961.
8.3 Transactions with Brokers in excess of 5% or more of the aggregate purchases and sale of securities made by the Fund have been reported to the Trustees on a Bimonthly basis.
8.4 During the year ended 31.03.2019 the Registrar and Transfer Agent charges amounting to
Rs.150598.02 (PY:Rs.0.00) and Audit fees amounting to Rs.100385.80 (PY:Rs.0.00) constitutes 15.47% (PY:Rs.0.00%) & 10.31% (P Y:0.00%) respectively of the total schemes expenses.
8.5 Transactions with Associates/Related Parties/Group Companies of Sponsor/AMC
Brokerage / Commission on sale of units by the Scheme or by the Asset Management Company given to associates, pursuant to Regulation 25(8): Related Party:- Sahara India Financial Corporation Ltd(SIFCL):(Sponsor)
Commission to SIFCL made for sale of units of the MF for the current year ended 31st March 2019.
(Rs. in lakhs)
(Rs. in lakhs)
Star Value Fund Banking & Financial Services Fund
0.0003 0.0112
Commission to SIFCL made for sale of units of the MF for the previous year ended 31st March 2018. (Rs.In lakhs)
Tax Gain Fund
Growth Fund
Liquid Fund
Mid cap Fund
Wealth Plus Fund
Infrastructure Fund
0.0920 0.0053 0.0003 0.0251 0.0005 0.0050
(Rs. In lakhs)
Star Value Fund Super 20 Fund
Power and Natural Resources Fund
Banking & Financial Services Fund
0.0008 0.0001 - 0.0184
Tax Gain Fund Growth Fund
Mid cap Fund
Wealth Plus Fund
Infrastructure Fund
0.0541 0.0026 0.0053 0.0005 0.0047
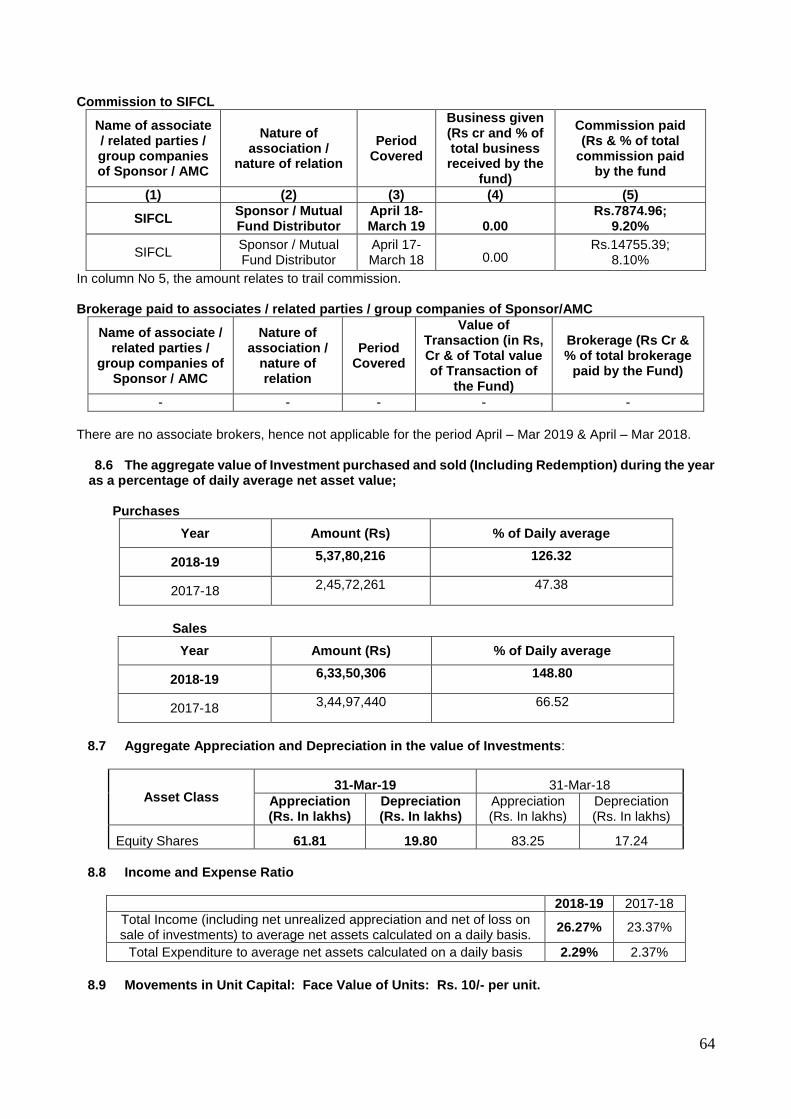
64
Commission to SIFCL
Name of associate / related parties / group companies of Sponsor / AMC
Nature of association /
nature of relation
Period Covered
Business given (Rs cr and % of total business received by the
fund)
Commission paid (Rs & % of total
commission paid by the fund
(1) (2) (3) (4) (5)
SIFCL Sponsor / Mutual Fund Distributor
April 18-March 19
0.00
Rs.7874.96; 9.20%
SIFCL Sponsor / Mutual Fund Distributor
April 17-March 18
0.00
Rs.14755.39; 8.10%
In column No 5, the amount relates to trail commission. Brokerage paid to associates / related parties / group companies of Sponsor/AMC
Name of associate / related parties /
group companies of Sponsor / AMC
Nature of association /
nature of relation
Period Covered
Value of Transaction (in Rs, Cr & of Total value of Transaction of
the Fund)
Brokerage (Rs Cr & % of total brokerage
paid by the Fund)
- - - - -
There are no associate brokers, hence not applicable for the period April – Mar 2019 & April – Mar 2018.
8.6 The aggregate value of Investment purchased and sold (Including Redemption) during the year as a percentage of daily average net asset value;
Purchases
Year Amount (Rs) % of Daily average
2018-19 5,37,80,216 126.32
2017-18 2,45,72,261 47.38
Sales
Year Amount (Rs) % of Daily average
2018-19 6,33,50,306 148.80
2017-18 3,44,97,440 66.52
8.7 Aggregate Appreciation and Depreciation in the value of Investments:
Asset Class 31-Mar-19 31-Mar-18
Appreciation (Rs. In lakhs)
Depreciation (Rs. In lakhs)
Appreciation (Rs. In lakhs)
Depreciation (Rs. In lakhs)
Equity Shares 61.81 19.80 83.25 17.24
8.8 Income and Expense Ratio
2018-19 2017-18
Total Income (including net unrealized appreciation and net of loss on sale of investments) to average net assets calculated on a daily basis.
26.27% 23.37%
Total Expenditure to average net assets calculated on a daily basis 2.29% 2.37%
8.9 Movements in Unit Capital: Face Value of Units: Rs. 10/- per unit.
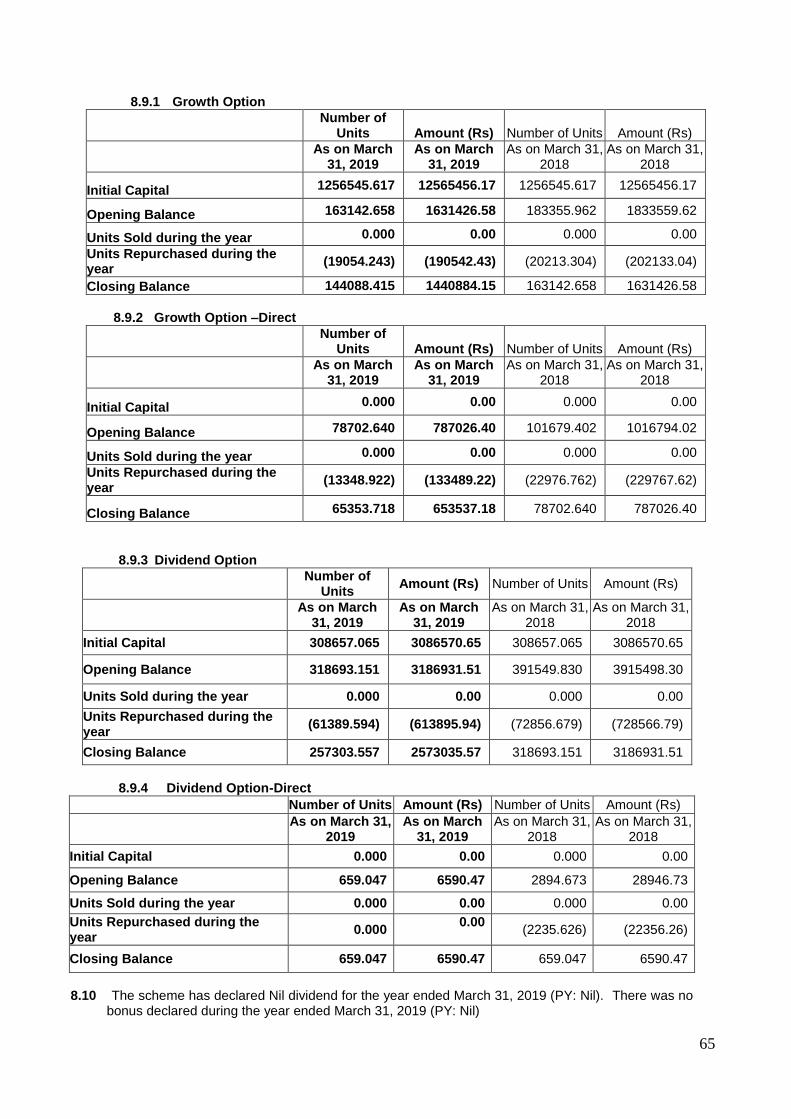
65
8.9.1 Growth Option
Number of
Units Amount (Rs) Number of Units Amount (Rs)
As on March
31, 2019 As on March
31, 2019 As on March 31,
2018 As on March 31,
2018
Initial Capital 1256545.617 12565456.17 1256545.617 12565456.17
Opening Balance 163142.658 1631426.58 183355.962 1833559.62
Units Sold during the year 0.000 0.00 0.000 0.00
Units Repurchased during the year
(19054.243) (190542.43) (20213.304) (202133.04)
Closing Balance 144088.415 1440884.15 163142.658 1631426.58
8.9.2 Growth Option –Direct
Number of
Units Amount (Rs) Number of Units Amount (Rs)
As on March
31, 2019 As on March
31, 2019 As on March 31,
2018 As on March 31,
2018
Initial Capital 0.000 0.00 0.000 0.00
Opening Balance 78702.640 787026.40 101679.402 1016794.02
Units Sold during the year 0.000 0.00 0.000 0.00
Units Repurchased during the year
(13348.922) (133489.22) (22976.762) (229767.62)
Closing Balance 65353.718 653537.18 78702.640 787026.40
8.9.3 Dividend Option
Number of
Units Amount (Rs) Number of Units Amount (Rs)
As on March
31, 2019 As on March
31, 2019 As on March 31,
2018 As on March 31,
2018
Initial Capital 308657.065 3086570.65 308657.065 3086570.65
Opening Balance 318693.151 3186931.51 391549.830 3915498.30
Units Sold during the year 0.000 0.00 0.000 0.00
Units Repurchased during the year
(61389.594) (613895.94) (72856.679) (728566.79)
Closing Balance 257303.557 2573035.57 318693.151 3186931.51
8.9.4 Dividend Option-Direct
Number of Units Amount (Rs) Number of Units Amount (Rs)
As on March 31,
2019 As on March
31, 2019 As on March 31,
2018 As on March 31,
2018
Initial Capital 0.000 0.00 0.000 0.00
Opening Balance 659.047 6590.47 2894.673 28946.73
Units Sold during the year 0.000 0.00 0.000 0.00
Units Repurchased during the year
0.000 0.00
(2235.626) (22356.26)
Closing Balance 659.047 6590.47 659.047 6590.47
8.10 The scheme has declared Nil dividend for the year ended March 31, 2019 (PY: Nil). There was no
bonus declared during the year ended March 31, 2019 (PY: Nil)
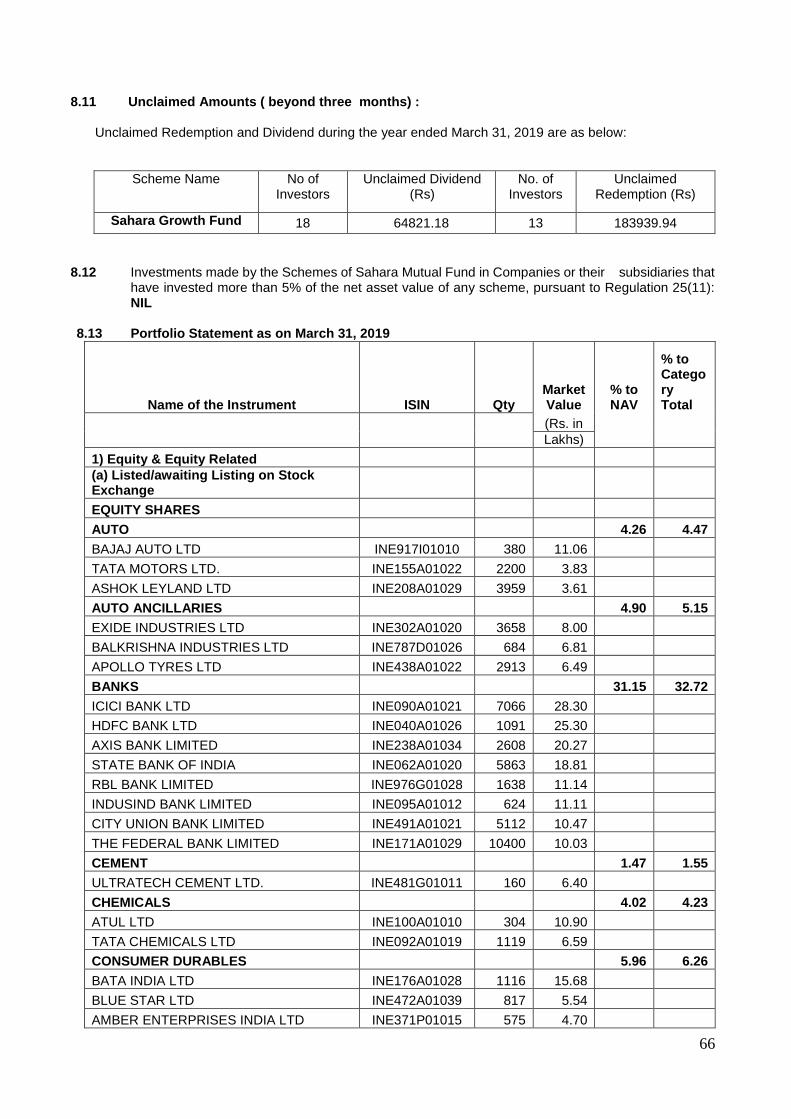
66
8.11 Unclaimed Amounts ( beyond three months) :
Unclaimed Redemption and Dividend during the year ended March 31, 2019 are as below:
Scheme Name No of Investors
Unclaimed Dividend (Rs)
No. of Investors
Unclaimed Redemption (Rs)
Sahara Growth Fund 18 64821.18 13 183939.94
8.12 Investments made by the Schemes of Sahara Mutual Fund in Companies or their subsidiaries that have invested more than 5% of the net asset value of any scheme, pursuant to Regulation 25(11): NIL
8.13 Portfolio Statement as on March 31, 2019
Name of the Instrument ISIN Qty Market Value
% to NAV
% to Category Total
(Rs. in
Lakhs)
1) Equity & Equity Related
(a) Listed/awaiting Listing on Stock Exchange
EQUITY SHARES
AUTO 4.26 4.47
BAJAJ AUTO LTD INE917I01010 380 11.06
TATA MOTORS LTD. INE155A01022 2200 3.83
ASHOK LEYLAND LTD INE208A01029 3959 3.61
AUTO ANCILLARIES 4.90 5.15
EXIDE INDUSTRIES LTD INE302A01020 3658 8.00
BALKRISHNA INDUSTRIES LTD INE787D01026 684 6.81
APOLLO TYRES LTD INE438A01022 2913 6.49
BANKS 31.15 32.72
ICICI BANK LTD INE090A01021 7066 28.30
HDFC BANK LTD INE040A01026 1091 25.30
AXIS BANK LIMITED INE238A01034 2608 20.27
STATE BANK OF INDIA INE062A01020 5863 18.81
RBL BANK LIMITED INE976G01028 1638 11.14
INDUSIND BANK LIMITED INE095A01012 624 11.11
CITY UNION BANK LIMITED INE491A01021 5112 10.47
THE FEDERAL BANK LIMITED INE171A01029 10400 10.03
CEMENT 1.47 1.55
ULTRATECH CEMENT LTD. INE481G01011 160 6.40
CHEMICALS 4.02 4.23
ATUL LTD INE100A01010 304 10.90
TATA CHEMICALS LTD INE092A01019 1119 6.59
CONSUMER DURABLES 5.96 6.26
BATA INDIA LTD INE176A01028 1116 15.68
BLUE STAR LTD INE472A01039 817 5.54
AMBER ENTERPRISES INDIA LTD INE371P01015 575 4.70
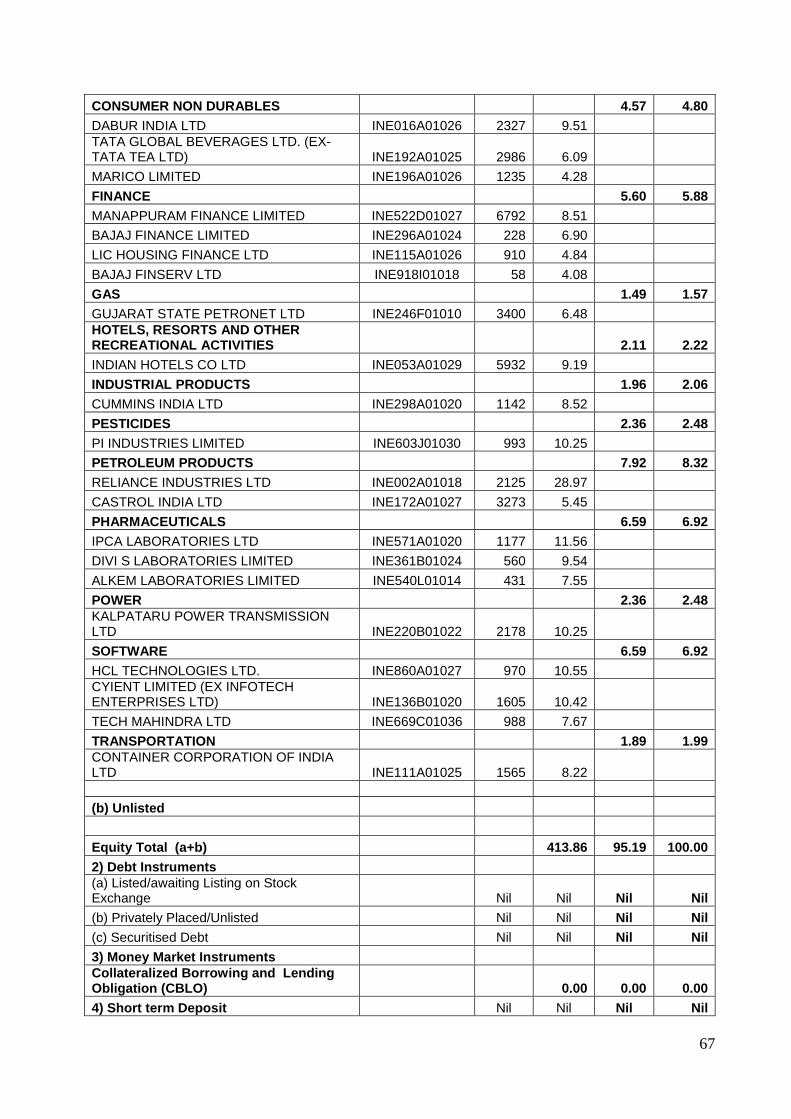
67
CONSUMER NON DURABLES 4.57 4.80
DABUR INDIA LTD INE016A01026 2327 9.51
TATA GLOBAL BEVERAGES LTD. (EX- TATA TEA LTD) INE192A01025 2986 6.09
MARICO LIMITED INE196A01026 1235 4.28
FINANCE 5.60 5.88
MANAPPURAM FINANCE LIMITED INE522D01027 6792 8.51
BAJAJ FINANCE LIMITED INE296A01024 228 6.90
LIC HOUSING FINANCE LTD INE115A01026 910 4.84
BAJAJ FINSERV LTD INE918I01018 58 4.08
GAS 1.49 1.57
GUJARAT STATE PETRONET LTD INE246F01010 3400 6.48
HOTELS, RESORTS AND OTHER RECREATIONAL ACTIVITIES 2.11 2.22
INDIAN HOTELS CO LTD INE053A01029 5932 9.19
INDUSTRIAL PRODUCTS 1.96 2.06
CUMMINS INDIA LTD INE298A01020 1142 8.52
PESTICIDES 2.36 2.48
PI INDUSTRIES LIMITED INE603J01030 993 10.25
PETROLEUM PRODUCTS 7.92 8.32
RELIANCE INDUSTRIES LTD INE002A01018 2125 28.97
CASTROL INDIA LTD INE172A01027 3273 5.45
PHARMACEUTICALS 6.59 6.92
IPCA LABORATORIES LTD INE571A01020 1177 11.56
DIVI S LABORATORIES LIMITED INE361B01024 560 9.54
ALKEM LABORATORIES LIMITED INE540L01014 431 7.55
POWER 2.36 2.48
KALPATARU POWER TRANSMISSION LTD INE220B01022 2178 10.25
SOFTWARE 6.59 6.92
HCL TECHNOLOGIES LTD. INE860A01027 970 10.55
CYIENT LIMITED (EX INFOTECH ENTERPRISES LTD) INE136B01020 1605 10.42
TECH MAHINDRA LTD INE669C01036 988 7.67
TRANSPORTATION 1.89 1.99
CONTAINER CORPORATION OF INDIA LTD INE111A01025 1565 8.22
(b) Unlisted
Equity Total (a+b) 413.86 95.19 100.00
2) Debt Instruments
(a) Listed/awaiting Listing on Stock Exchange Nil Nil Nil Nil
(b) Privately Placed/Unlisted Nil Nil Nil Nil
(c) Securitised Debt Nil Nil Nil Nil
3) Money Market Instruments
Collateralized Borrowing and Lending Obligation (CBLO) 0.00 0.00 0.00
4) Short term Deposit Nil Nil Nil Nil
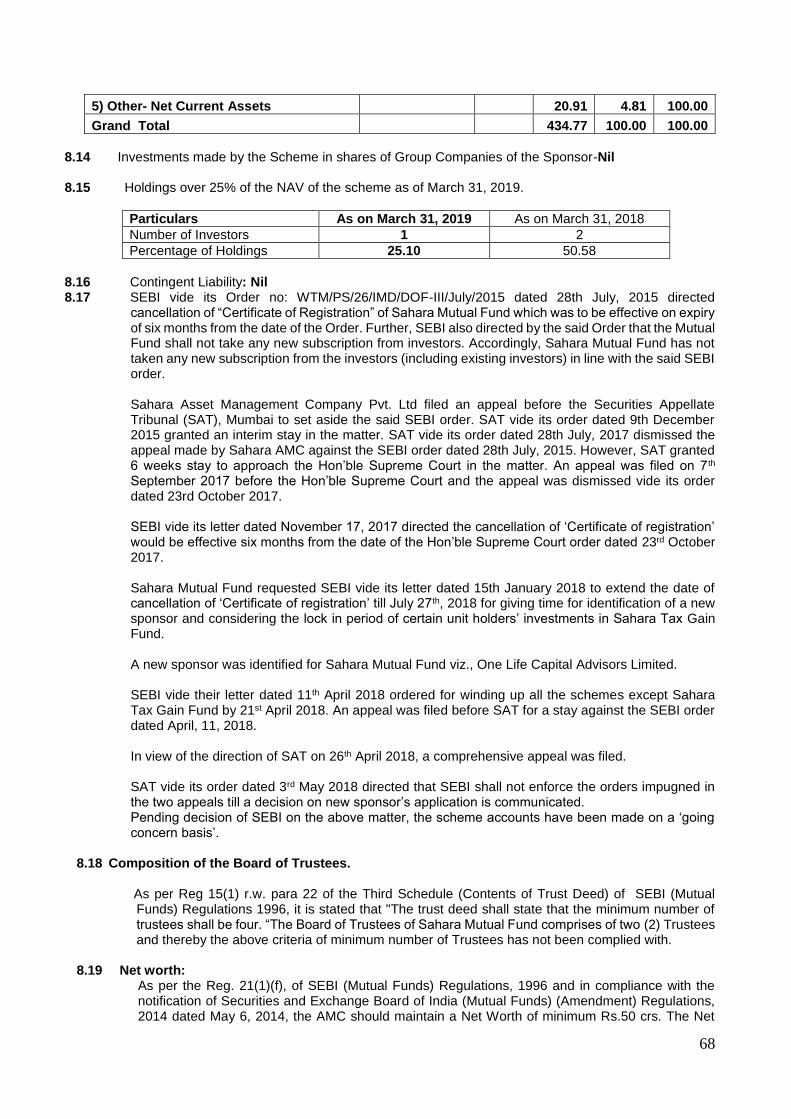
68
5) Other- Net Current Assets 20.91 4.81 100.00
Grand Total 434.77 100.00 100.00
8.14 Investments made by the Scheme in shares of Group Companies of the Sponsor-Nil
8.15 Holdings over 25% of the NAV of the scheme as of March 31, 2019.
Particulars As on March 31, 2019 As on March 31, 2018
Number of Investors 1 2
Percentage of Holdings 25.10 50.58
8.16 Contingent Liability: Nil 8.17 SEBI vide its Order no: WTM/PS/26/IMD/DOF-III/July/2015 dated 28th July, 2015 directed
cancellation of “Certificate of Registration” of Sahara Mutual Fund which was to be effective on expiry of six months from the date of the Order. Further, SEBI also directed by the said Order that the Mutual Fund shall not take any new subscription from investors. Accordingly, Sahara Mutual Fund has not taken any new subscription from the investors (including existing investors) in line with the said SEBI order.
Sahara Asset Management Company Pvt. Ltd filed an appeal before the Securities Appellate Tribunal (SAT), Mumbai to set aside the said SEBI order. SAT vide its order dated 9th December 2015 granted an interim stay in the matter. SAT vide its order dated 28th July, 2017 dismissed the appeal made by Sahara AMC against the SEBI order dated 28th July, 2015. However, SAT granted 6 weeks stay to approach the Hon’ble Supreme Court in the matter. An appeal was filed on 7th September 2017 before the Hon’ble Supreme Court and the appeal was dismissed vide its order dated 23rd October 2017. SEBI vide its letter dated November 17, 2017 directed the cancellation of ‘Certificate of registration’ would be effective six months from the date of the Hon’ble Supreme Court order dated 23rd October 2017. Sahara Mutual Fund requested SEBI vide its letter dated 15th January 2018 to extend the date of cancellation of ‘Certificate of registration’ till July 27th, 2018 for giving time for identification of a new sponsor and considering the lock in period of certain unit holders’ investments in Sahara Tax Gain Fund. A new sponsor was identified for Sahara Mutual Fund viz., One Life Capital Advisors Limited. SEBI vide their letter dated 11th April 2018 ordered for winding up all the schemes except Sahara Tax Gain Fund by 21st April 2018. An appeal was filed before SAT for a stay against the SEBI order dated April, 11, 2018. In view of the direction of SAT on 26th April 2018, a comprehensive appeal was filed. SAT vide its order dated 3rd May 2018 directed that SEBI shall not enforce the orders impugned in the two appeals till a decision on new sponsor’s application is communicated. Pending decision of SEBI on the above matter, the scheme accounts have been made on a ‘going concern basis’.
8.18 Composition of the Board of Trustees.
As per Reg 15(1) r.w. para 22 of the Third Schedule (Contents of Trust Deed) of SEBI (Mutual Funds) Regulations 1996, it is stated that "The trust deed shall state that the minimum number of trustees shall be four. “The Board of Trustees of Sahara Mutual Fund comprises of two (2) Trustees and thereby the above criteria of minimum number of Trustees has not been complied with.
8.19 Net worth:
As per the Reg. 21(1)(f), of SEBI (Mutual Funds) Regulations, 1996 and in compliance with the notification of Securities and Exchange Board of India (Mutual Funds) (Amendment) Regulations, 2014 dated May 6, 2014, the AMC should maintain a Net Worth of minimum Rs.50 crs. The Net
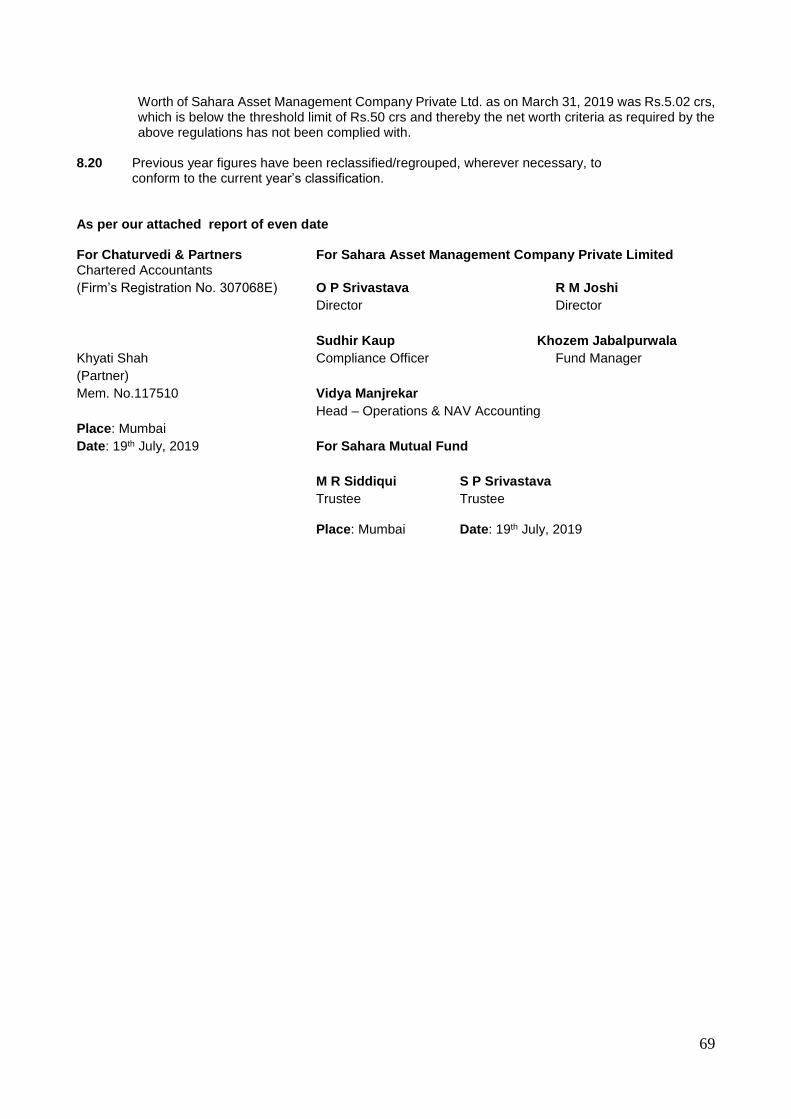
69
Worth of Sahara Asset Management Company Private Ltd. as on March 31, 2019 was Rs.5.02 crs, which is below the threshold limit of Rs.50 crs and thereby the net worth criteria as required by the above regulations has not been complied with.
8.20 Previous year figures have been reclassified/regrouped, wherever necessary, to conform to the current year’s classification.
As per our attached report of even date For Chaturvedi & Partners For Sahara Asset Management Company Private Limited Chartered Accountants
(Firm’s Registration No. 307068E) O P Srivastava R M Joshi
Director Director
Sudhir Kaup Khozem Jabalpurwala
Khyati Shah Compliance Officer Fund Manager
(Partner)
Mem. No.117510 Vidya Manjrekar
Head – Operations & NAV Accounting
Place: Mumbai
Date: 19th July, 2019 For Sahara Mutual Fund
M R Siddiqui S P Srivastava
Trustee Trustee Place: Mumbai Date: 19th July, 2019

70
SAHARA GROWTH FUND Perspective Historical Per Unit Statistics
As at As at As at
Particulars 31-Mar-19 31-Mar-18 31-Mar-17
(Rs. Per
Unit) (Rs. Per
Unit) (Rs. Per
Unit)
(a) Gross Income
(I) Income other than Profit on sale of Investments 0.75 0.90 0.84
(ii) Income from Profit (net of loss) on inter-scheme sales/transfer of Investments 0.00 0.00 0.00
(iii) Income from Profit (net of Loss) on sale other than Inter scheme 14.20 8.93 3.78
(iv) Transfer to revenue account from past year's reserve 0.00 0.00 0.00
(b) Aggregate of expenses, write off, amortisation and charges 2.08 2.19 1.88
(c) Net Income 12.86 7.64 2.74
(d) Net unrealised appreciation/(diminution) in value of Investments 8.99 11.76 12.96
(e) Net Asset Value
Growth Plan 148.7498
137.8319 134.2453
Dividend Plan 43.1937
40.0234 38.9820
Direct Growth Plan 166.8069 151.5484 143.4603
Direct Dividend Plan 44.0421 40.6891 39.5124
(f) Purchase Price during the year**
(I) Highest
Growth Plan 149.1647 151.7467 133.1709
Dividend Plan 43.3142 44.0640 38.9820
Direct Growth Plan 166.8069 166.0262 139.6645
Direct Dividend Plan 44.0931 44.7722 35.3553
(ii) Lowest
Growth Plan 125.9222 132.6727 105.8943
Dividend Plan 36.5651 38.5253 30.3153
Direct Growth Plan 140.6855 142.3753 111.6170
Direct Dividend Plan 37.2404 39.0664 32.6135
(g) Sale Price during the year**
(I) Highest
Growth Plan 0.0000 0.0000 0.0000
Dividend Plan 0.0000 0.0000 0.0000
Direct Growth Plan 0.0000 0.0000 0.0000
Direct Dividend Plan 0.0000 0.0000 0.0000
(ii) Lowest
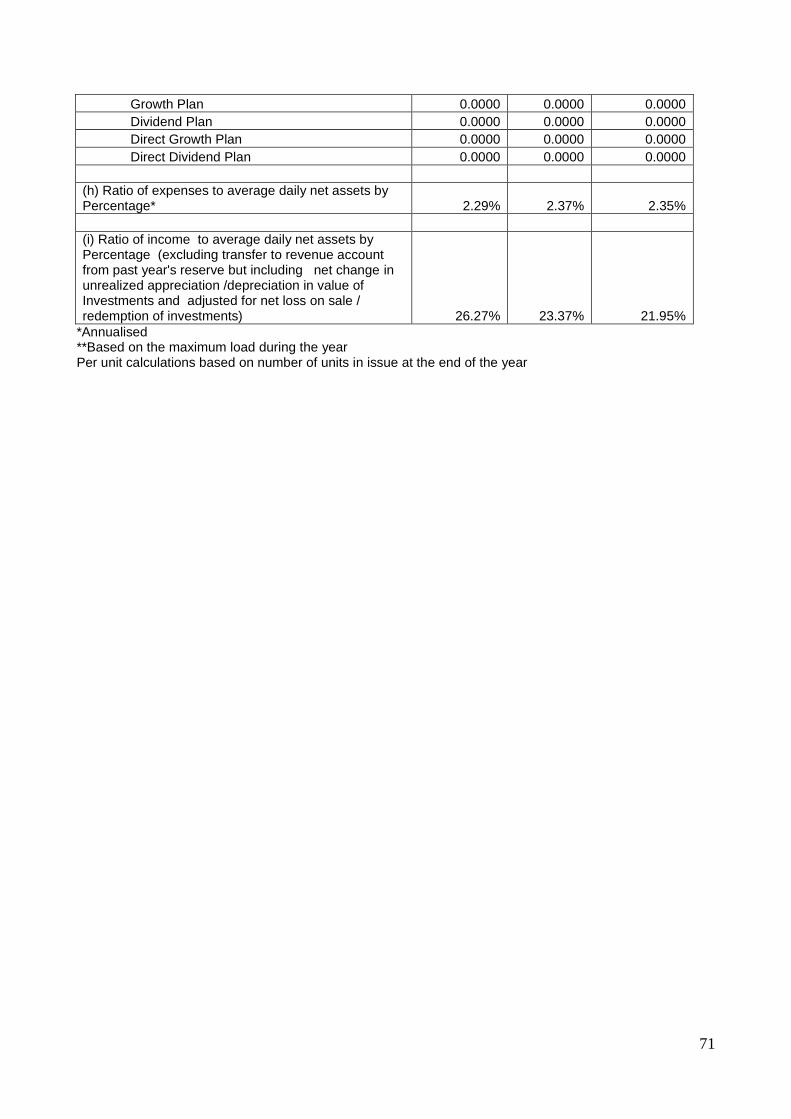
71
Growth Plan 0.0000 0.0000 0.0000
Dividend Plan 0.0000 0.0000 0.0000
Direct Growth Plan 0.0000 0.0000 0.0000
Direct Dividend Plan 0.0000 0.0000 0.0000
(h) Ratio of expenses to average daily net assets by Percentage* 2.29% 2.37% 2.35%
(i) Ratio of income to average daily net assets by Percentage (excluding transfer to revenue account from past year's reserve but including net change in unrealized appreciation /depreciation in value of Investments and adjusted for net loss on sale / redemption of investments) 26.27% 23.37% 21.95%
*Annualised **Based on the maximum load during the year Per unit calculations based on number of units in issue at the end of the year
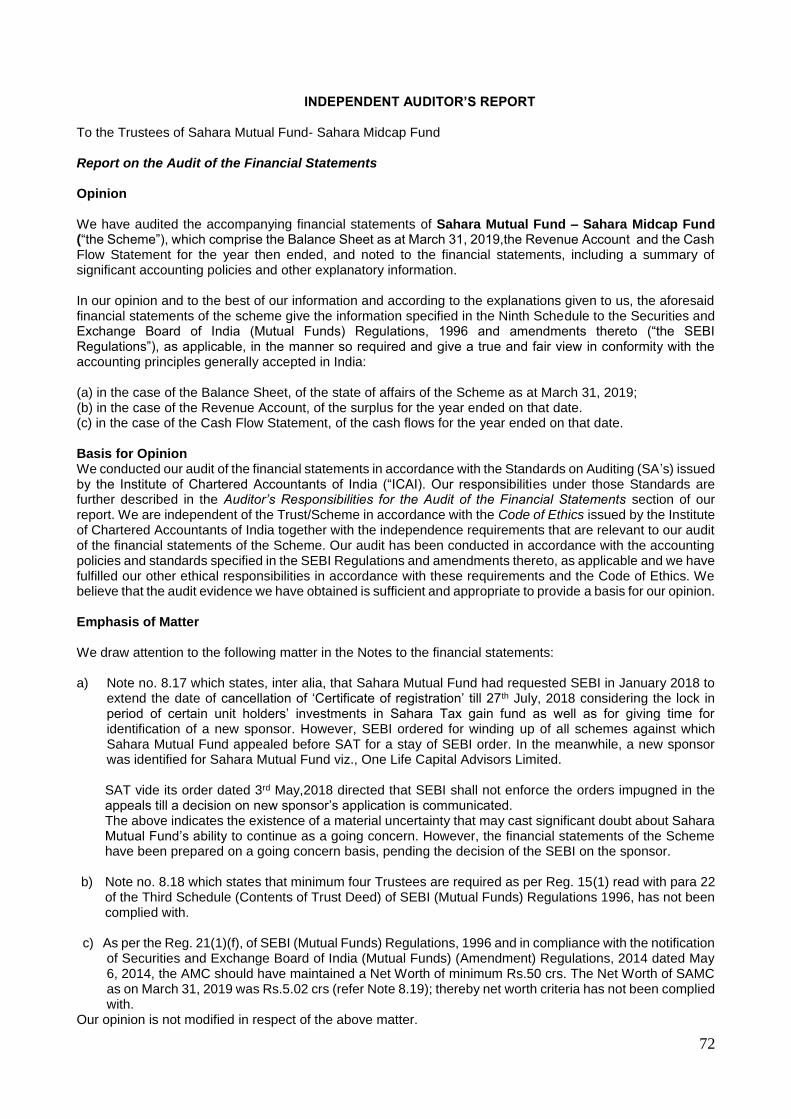
72
INDEPENDENT AUDITOR’S REPORT To the Trustees of Sahara Mutual Fund- Sahara Midcap Fund Report on the Audit of the Financial Statements Opinion We have audited the accompanying financial statements of Sahara Mutual Fund – Sahara Midcap Fund (“the Scheme”), which comprise the Balance Sheet as at March 31, 2019,the Revenue Account and the Cash Flow Statement for the year then ended, and noted to the financial statements, including a summary of significant accounting policies and other explanatory information. In our opinion and to the best of our information and according to the explanations given to us, the aforesaid financial statements of the scheme give the information specified in the Ninth Schedule to the Securities and Exchange Board of India (Mutual Funds) Regulations, 1996 and amendments thereto (“the SEBI Regulations”), as applicable, in the manner so required and give a true and fair view in conformity with the accounting principles generally accepted in India: (a) in the case of the Balance Sheet, of the state of affairs of the Scheme as at March 31, 2019; (b) in the case of the Revenue Account, of the surplus for the year ended on that date. (c) in the case of the Cash Flow Statement, of the cash flows for the year ended on that date. Basis for Opinion We conducted our audit of the financial statements in accordance with the Standards on Auditing (SA’s) issued by the Institute of Chartered Accountants of India (“ICAI). Our responsibilities under those Standards are further described in the Auditor’s Responsibilities for the Audit of the Financial Statements section of our report. We are independent of the Trust/Scheme in accordance with the Code of Ethics issued by the Institute of Chartered Accountants of India together with the independence requirements that are relevant to our audit of the financial statements of the Scheme. Our audit has been conducted in accordance with the accounting policies and standards specified in the SEBI Regulations and amendments thereto, as applicable and we have fulfilled our other ethical responsibilities in accordance with these requirements and the Code of Ethics. We believe that the audit evidence we have obtained is sufficient and appropriate to provide a basis for our opinion. Emphasis of Matter We draw attention to the following matter in the Notes to the financial statements: a) Note no. 8.17 which states, inter alia, that Sahara Mutual Fund had requested SEBI in January 2018 to
extend the date of cancellation of ‘Certificate of registration’ till 27th July, 2018 considering the lock in period of certain unit holders’ investments in Sahara Tax gain fund as well as for giving time for identification of a new sponsor. However, SEBI ordered for winding up of all schemes against which Sahara Mutual Fund appealed before SAT for a stay of SEBI order. In the meanwhile, a new sponsor was identified for Sahara Mutual Fund viz., One Life Capital Advisors Limited.
SAT vide its order dated 3rd May,2018 directed that SEBI shall not enforce the orders impugned in the appeals till a decision on new sponsor’s application is communicated. The above indicates the existence of a material uncertainty that may cast significant doubt about Sahara Mutual Fund’s ability to continue as a going concern. However, the financial statements of the Scheme have been prepared on a going concern basis, pending the decision of the SEBI on the sponsor.
b) Note no. 8.18 which states that minimum four Trustees are required as per Reg. 15(1) read with para 22
of the Third Schedule (Contents of Trust Deed) of SEBI (Mutual Funds) Regulations 1996, has not been complied with.
c) As per the Reg. 21(1)(f), of SEBI (Mutual Funds) Regulations, 1996 and in compliance with the notification of Securities and Exchange Board of India (Mutual Funds) (Amendment) Regulations, 2014 dated May 6, 2014, the AMC should have maintained a Net Worth of minimum Rs.50 crs. The Net Worth of SAMC as on March 31, 2019 was Rs.5.02 crs (refer Note 8.19); thereby net worth criteria has not been complied with.
Our opinion is not modified in respect of the above matter.

73
Responsibilities of the Management and Those Charged with Governance for the Financial Statements The Trustees of Sahara Mutual Fund and the Board of Directors of Sahara Asset Management Company Private Limited (the “Directors”) are responsible for the preparation of these financial statements that give a true and fair view of the financial position and financial performance of the Scheme in accordance with the accounting policies and standards specified in the SEBI Regulations and amendments thereto, as applicable. This responsibility also includes maintenance of adequate accounting records for safeguarding the assets of the Scheme and for preventing and detecting frauds and other irregularities; selection and application of appropriate accounting policies; making judgements and estimates that are reasonable and prudent; and design, implementation and maintenance of adequate internal financial controls, that were operating effectively for ensuring the accuracy and completeness of the accounting records, relevant to the preparation and presentation of the financial statements that give a true and fair view and are free from material misstatement, whether due to fraud or error. In preparing the financial statements, management is responsible for assessing the Scheme’s ability to continue as a going concern, disclosing , as applicable, matters related to going concern and using the going concern basis of accounting unless management either intends to liquidate the Scheme or to cease operations or has no realistic alternative but to do so. Those charged with Governance are also responsible for overseeing the Scheme’s financial reporting process. Auditor’s Responsibility for the Audit of the Financial Statements Our objectives are to obtain reasonable assurance about whether the standalone financial statements as a whole are free from material misstatement, whether due to fraud or error, and to issue an auditor’s report that includes our opinion. Reasonable assurance is a high level of assurance, but is not a guarantee that an audit conducted in accordance with SAs will always detect a material misstatement when it exists. Misstatements can arise from fraud or error and are considered material if, individually or in the aggregate, they could reasonably be expected to influence the economic decisions of users taken on the basis of these standalone financial statements. As part of an audit in accordance with SAs, we exercise professional judgment and maintain professional skepticism throughout the audit. We also: • Identify and assess the risks of material misstatement of the standalone financial statements, whether due to fraud or error, design and perform audit procedures responsive to those risks, and obtain audit evidence that is sufficient and appropriate to provide a basis for our opinion. The risk of not detecting a material misstatement resulting from fraud is higher than for one resulting from error, as fraud may involve collusion, forgery, intentional omissions, misrepresentations, or the override of internal control. • Obtain an understanding of internal financial controls relevant to the audit in order to design audit procedures that are appropriate in the circumstances, but not for the purpose of expressing an opinion on effectiveness of the Company’s internal financial controls. • Evaluate the appropriateness of accounting policies used and the reasonableness of accounting estimates and related disclosures made by management. • Conclude on the appropriateness of management’s use of the going concern basis of accounting and, based on the audit evidence obtained, whether a material uncertainty exists related to events or conditions that may cast significant doubt on the ability of the Company to continue as a going concern. If we conclude that a material uncertainty exists, we are required to draw attention in our auditor’s report to the related disclosures in the standalone financial statements or, if such disclosures are inadequate, to modify our opinion. Our conclusions are based on the audit evidence obtained up to the date of our auditor’s report. However, future events or conditions may cause the Company to cease to continue as a going concern. • Evaluate the overall presentation, structure and content of the standalone financial statements, including the disclosures, and whether the standalone financial statements represent the underlying transactions and events in a manner that achieves fair presentation.

74
We communicate with those charged with governance regarding, among other matters, the planned scope and timing of the audit and significant audit findings, including any significant deficiencies in internal control that we identify during our audit. We also provide those charged with governance with a statement that we have complied with relevant ethical requirements regarding independence, and to communicate with them all relationships and other matters that may reasonably be thought to bear on our independence, and where applicable, related safeguards.
Report on Other Legal and Regulatory Requirements
As required by the Securities and Exchange Board of India (Mutual Funds) Regulations, 1996 and amendments thereto, as applicable, we report that: a) We have sought and obtained all the information and explanations, which to the best of our knowledge and belief were necessary for the purpose of our audit. b) The Balance Sheet and Revenue Account dealt with by this Report are in agreement with the books of account of the Scheme. c) The statement of account has been prepared in accordance with the accounting policies and standards specified in the SEBI Regulations and amendments thereto, as applicable. d) We have reviewed the Valuation Policy being followed for the schemes of Sahara Mutual Fund. The Valuation Policy implemented for the Scheme is in line with the SEBI guidelines issued in this regard.
For Chaturvedi & Partners. Chartered Accountants (Firm’s Registration No. 307068E) Khyati Shah (Partner) Mem. No. 117510 Place: Mumbai Date: July 19, 2019
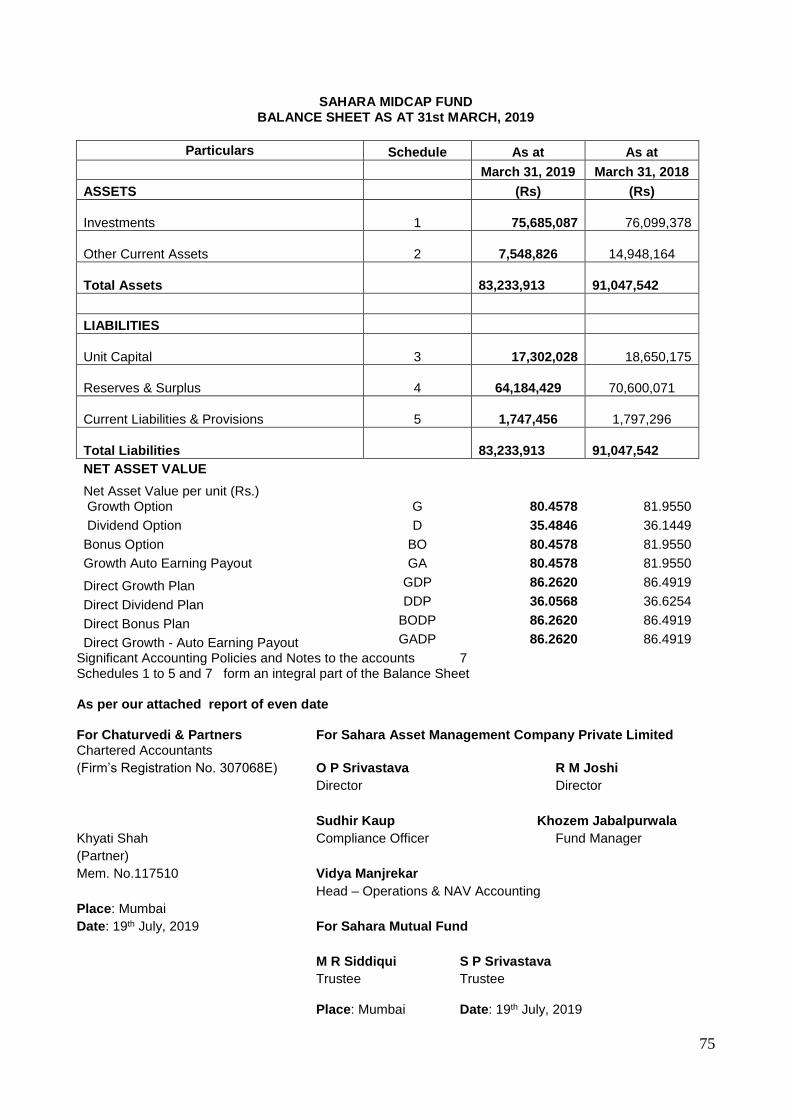
75
SAHARA MIDCAP FUND BALANCE SHEET AS AT 31st MARCH, 2019
Particulars Schedule As at As at
March 31, 2019 March 31, 2018
ASSETS (Rs) (Rs)
Investments 1
75,685,087
76,099,378
Other Current Assets 2
7,548,826
14,948,164
Total Assets 83,233,913
91,047,542
LIABILITIES
Unit Capital 3
17,302,028
18,650,175
Reserves & Surplus 4
64,184,429
70,600,071
Current Liabilities & Provisions 5
1,747,456
1,797,296
Total Liabilities 83,233,913
91,047,542
NET ASSET VALUE
Net Asset Value per unit (Rs.) Growth Option G 80.4578 81.9550
Dividend Option D 35.4846 36.1449
Bonus Option BO 80.4578 81.9550
Growth Auto Earning Payout GA 80.4578 81.9550
Direct Growth Plan GDP 86.2620 86.4919
Direct Dividend Plan DDP 36.0568 36.6254
Direct Bonus Plan BODP 86.2620 86.4919
Direct Growth - Auto Earning Payout GADP 86.2620 86.4919
Significant Accounting Policies and Notes to the accounts 7 Schedules 1 to 5 and 7 form an integral part of the Balance Sheet
As per our attached report of even date For Chaturvedi & Partners For Sahara Asset Management Company Private Limited Chartered Accountants
(Firm’s Registration No. 307068E) O P Srivastava R M Joshi
Director Director
Sudhir Kaup Khozem Jabalpurwala
Khyati Shah Compliance Officer Fund Manager
(Partner)
Mem. No.117510 Vidya Manjrekar
Head – Operations & NAV Accounting
Place: Mumbai
Date: 19th July, 2019 For Sahara Mutual Fund
M R Siddiqui S P Srivastava
Trustee Trustee Place: Mumbai Date: 19th July, 2019
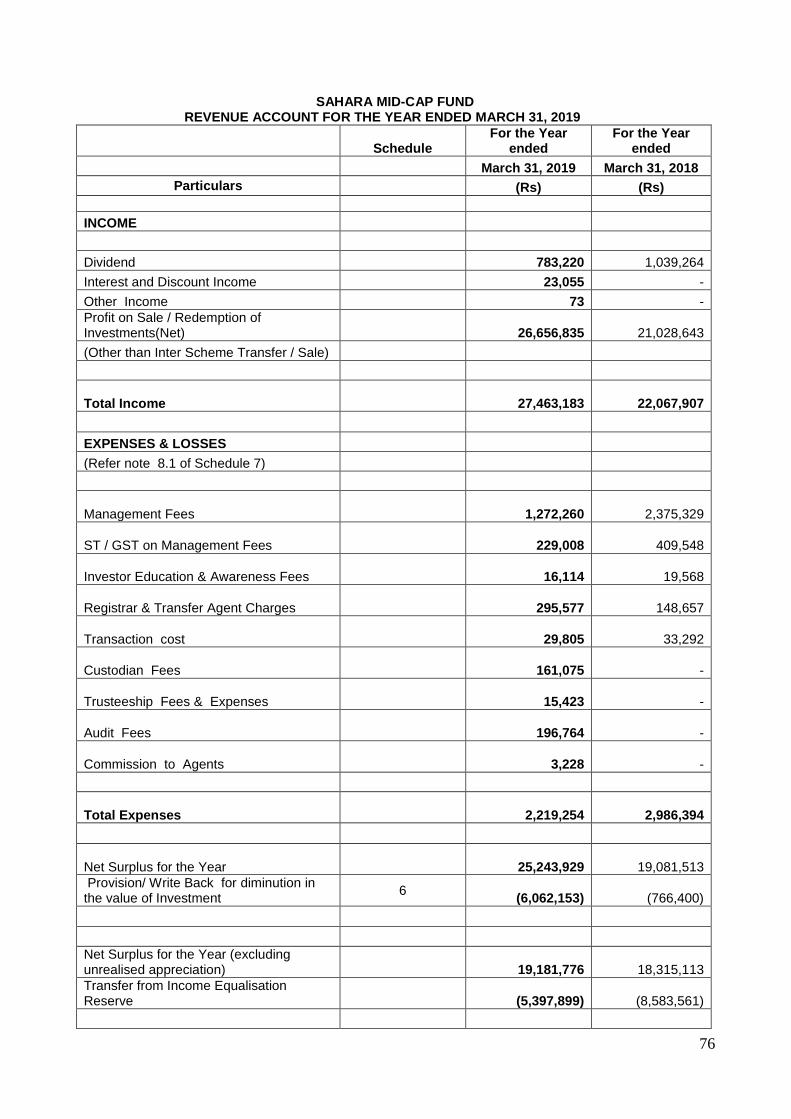
76
SAHARA MID-CAP FUND REVENUE ACCOUNT FOR THE YEAR ENDED MARCH 31, 2019
Schedule For the Year
ended For the Year
ended
March 31, 2019 March 31, 2018
Particulars (Rs) (Rs)
INCOME
Dividend 783,220 1,039,264
Interest and Discount Income 23,055 -
Other Income 73 -
Profit on Sale / Redemption of Investments(Net)
26,656,835
21,028,643
(Other than Inter Scheme Transfer / Sale)
Total Income
27,463,183
22,067,907
EXPENSES & LOSSES
(Refer note 8.1 of Schedule 7)
Management Fees
1,272,260
2,375,329
ST / GST on Management Fees
229,008
409,548
Investor Education & Awareness Fees
16,114
19,568
Registrar & Transfer Agent Charges
295,577
148,657
Transaction cost
29,805
33,292
Custodian Fees
161,075 -
Trusteeship Fees & Expenses
15,423 -
Audit Fees
196,764 -
Commission to Agents
3,228 -
Total Expenses
2,219,254
2,986,394
Net Surplus for the Year
25,243,929
19,081,513
Provision/ Write Back for diminution in the value of Investment
6
(6,062,153)
(766,400)
Net Surplus for the Year (excluding unrealised appreciation)
19,181,776
18,315,113
Transfer from Income Equalisation Reserve
(5,397,899)
(8,583,561)
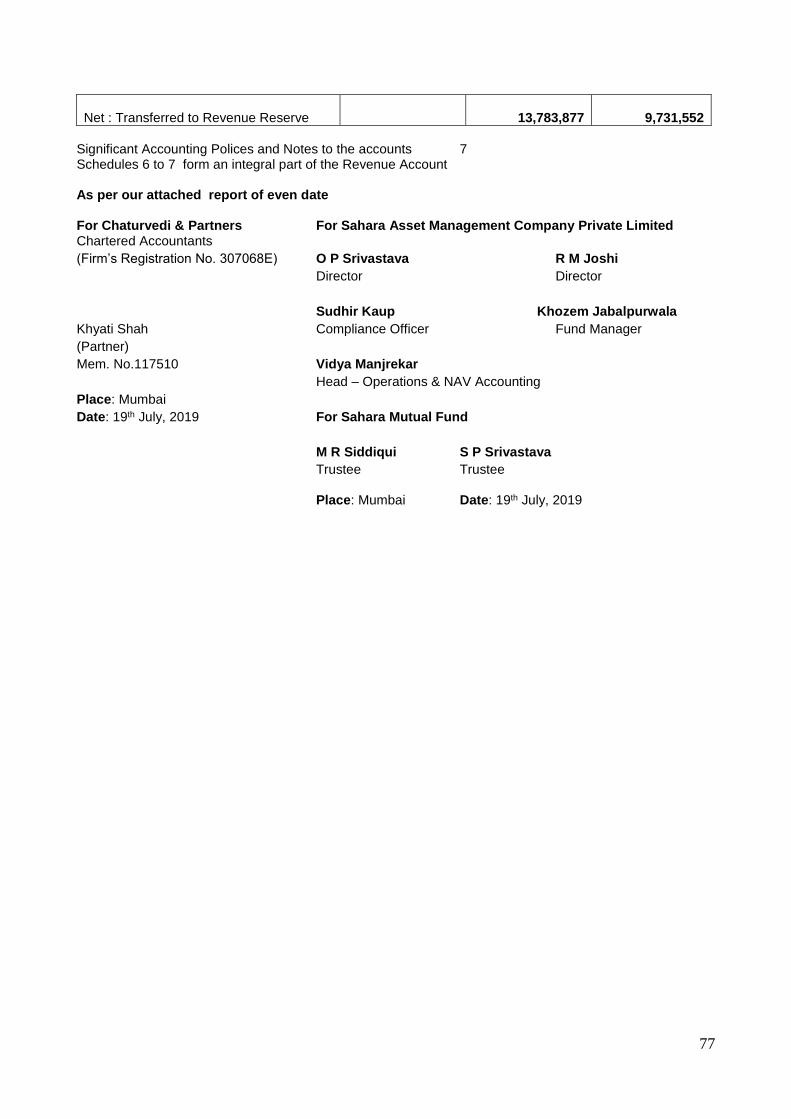
77
Net : Transferred to Revenue Reserve
13,783,877
9,731,552
Significant Accounting Polices and Notes to the accounts 7 Schedules 6 to 7 form an integral part of the Revenue Account As per our attached report of even date For Chaturvedi & Partners For Sahara Asset Management Company Private Limited Chartered Accountants
(Firm’s Registration No. 307068E) O P Srivastava R M Joshi
Director Director
Sudhir Kaup Khozem Jabalpurwala
Khyati Shah Compliance Officer Fund Manager
(Partner)
Mem. No.117510 Vidya Manjrekar
Head – Operations & NAV Accounting
Place: Mumbai
Date: 19th July, 2019 For Sahara Mutual Fund
M R Siddiqui S P Srivastava
Trustee Trustee Place: Mumbai Date: 19th July, 2019
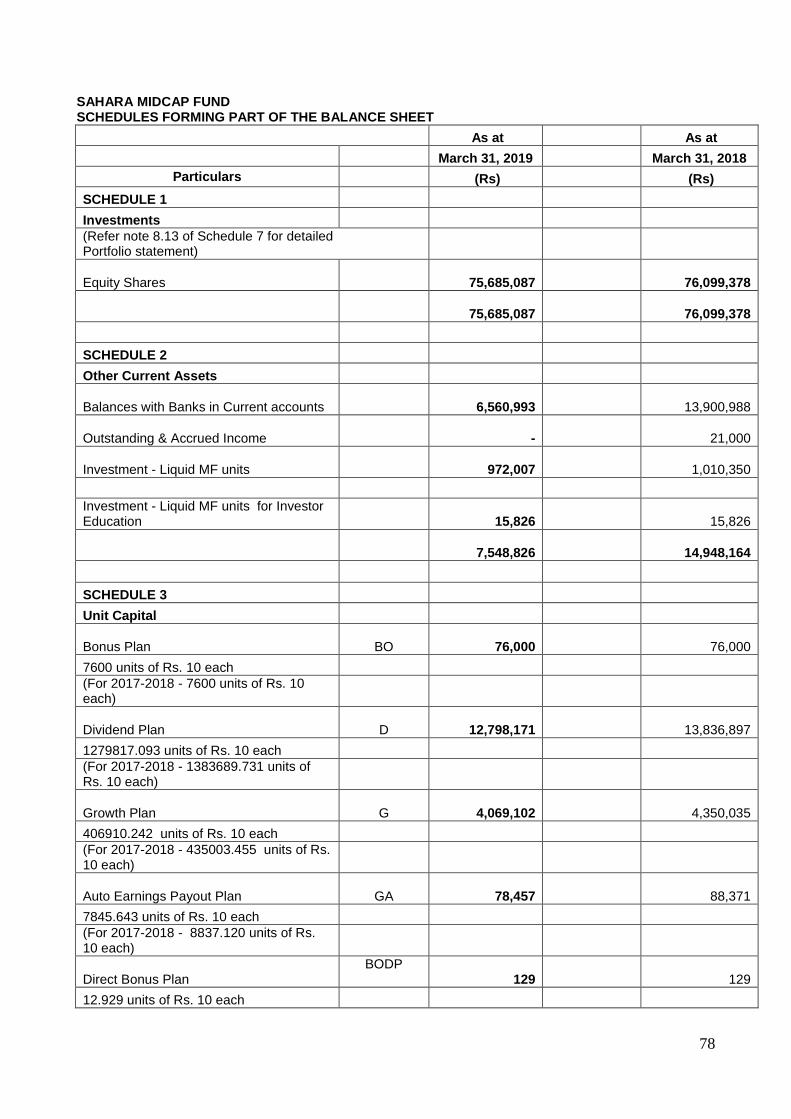
78
SAHARA MIDCAP FUND SCHEDULES FORMING PART OF THE BALANCE SHEET
As at As at
March 31, 2019 March 31, 2018
Particulars (Rs) (Rs)
SCHEDULE 1
Investments
(Refer note 8.13 of Schedule 7 for detailed Portfolio statement)
Equity Shares
75,685,087
76,099,378
75,685,087
76,099,378
SCHEDULE 2
Other Current Assets
Balances with Banks in Current accounts
6,560,993
13,900,988
Outstanding & Accrued Income -
21,000
Investment - Liquid MF units
972,007
1,010,350
Investment - Liquid MF units for Investor Education
15,826
15,826
7,548,826
14,948,164
SCHEDULE 3
Unit Capital
Bonus Plan BO
76,000
76,000
7600 units of Rs. 10 each
(For 2017-2018 - 7600 units of Rs. 10 each)
Dividend Plan D
12,798,171
13,836,897
1279817.093 units of Rs. 10 each
(For 2017-2018 - 1383689.731 units of Rs. 10 each)
Growth Plan G
4,069,102
4,350,035
406910.242 units of Rs. 10 each
(For 2017-2018 - 435003.455 units of Rs. 10 each)
Auto Earnings Payout Plan GA
78,457
88,371
7845.643 units of Rs. 10 each
(For 2017-2018 - 8837.120 units of Rs. 10 each)
Direct Bonus Plan BODP
129
129
12.929 units of Rs. 10 each
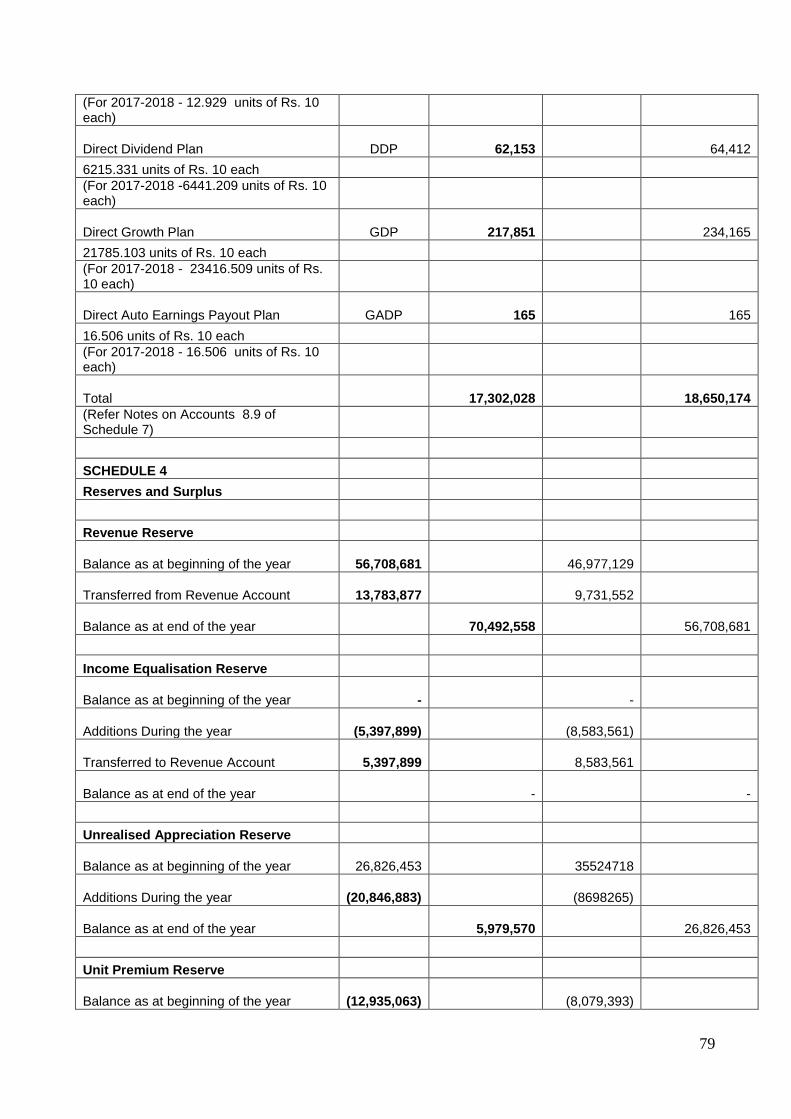
79
(For 2017-2018 - 12.929 units of Rs. 10 each)
Direct Dividend Plan DDP
62,153
64,412
6215.331 units of Rs. 10 each
(For 2017-2018 -6441.209 units of Rs. 10 each)
Direct Growth Plan GDP
217,851
234,165
21785.103 units of Rs. 10 each
(For 2017-2018 - 23416.509 units of Rs. 10 each)
Direct Auto Earnings Payout Plan GADP
165
165
16.506 units of Rs. 10 each
(For 2017-2018 - 16.506 units of Rs. 10 each)
Total
17,302,028
18,650,174
(Refer Notes on Accounts 8.9 of Schedule 7)
SCHEDULE 4
Reserves and Surplus
Revenue Reserve
Balance as at beginning of the year
56,708,681
46,977,129
Transferred from Revenue Account
13,783,877
9,731,552
Balance as at end of the year
70,492,558
56,708,681
Income Equalisation Reserve
Balance as at beginning of the year
- -
Additions During the year
(5,397,899)
(8,583,561)
Transferred to Revenue Account
5,397,899
8,583,561
Balance as at end of the year
-
-
Unrealised Appreciation Reserve
Balance as at beginning of the year
26,826,453 35524718
Additions During the year
(20,846,883) (8698265)
Balance as at end of the year
5,979,570
26,826,453
Unit Premium Reserve
Balance as at beginning of the year
(12,935,063)
(8,079,393)
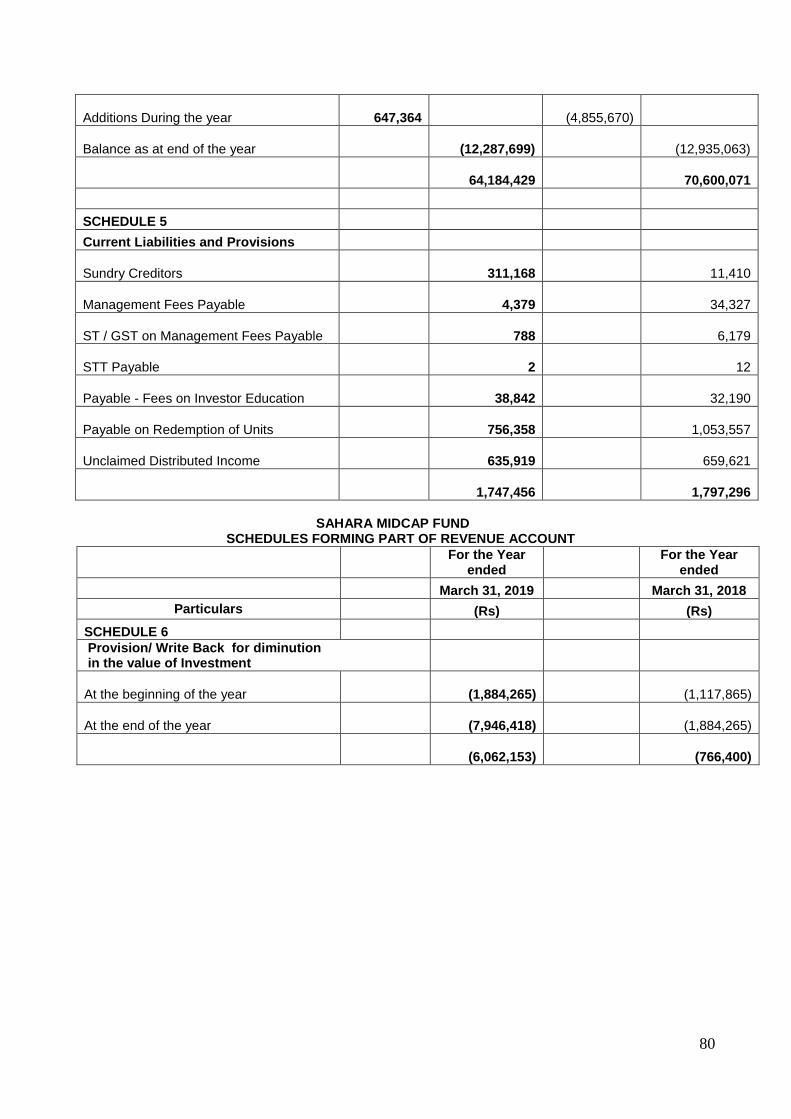
80
Additions During the year
647,364
(4,855,670)
Balance as at end of the year
(12,287,699)
(12,935,063)
64,184,429
70,600,071
SCHEDULE 5
Current Liabilities and Provisions
Sundry Creditors
311,168
11,410
Management Fees Payable
4,379
34,327
ST / GST on Management Fees Payable
788
6,179
STT Payable
2
12
Payable - Fees on Investor Education
38,842
32,190
Payable on Redemption of Units 756,358
1,053,557
Unclaimed Distributed Income
635,919
659,621
1,747,456
1,797,296
SAHARA MIDCAP FUND
SCHEDULES FORMING PART OF REVENUE ACCOUNT
For the Year
ended For the Year
ended
March 31, 2019 March 31, 2018
Particulars (Rs) (Rs)
SCHEDULE 6
Provision/ Write Back for diminution in the value of Investment
At the beginning of the year
(1,884,265)
(1,117,865)
At the end of the year
(7,946,418)
(1,884,265)
(6,062,153)
(766,400)
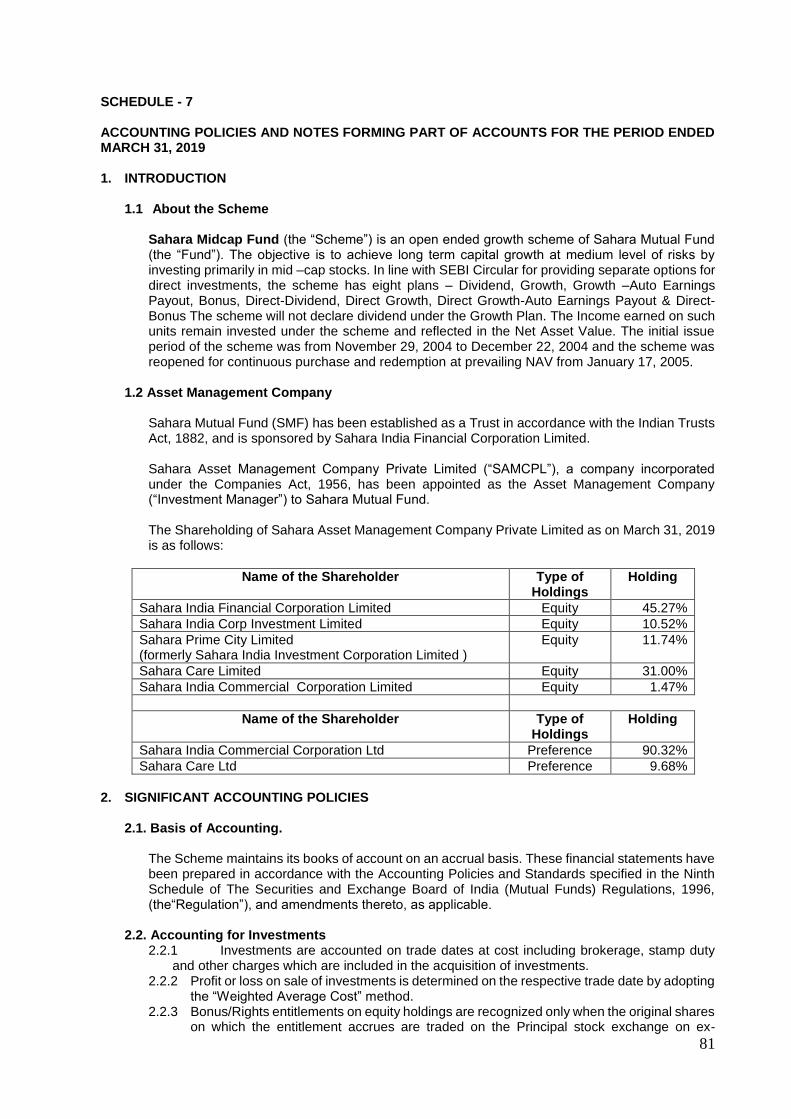
81
SCHEDULE - 7 ACCOUNTING POLICIES AND NOTES FORMING PART OF ACCOUNTS FOR THE PERIOD ENDED MARCH 31, 2019
1. INTRODUCTION
1.1 About the Scheme
Sahara Midcap Fund (the “Scheme”) is an open ended growth scheme of Sahara Mutual Fund (the “Fund”). The objective is to achieve long term capital growth at medium level of risks by investing primarily in mid –cap stocks. In line with SEBI Circular for providing separate options for direct investments, the scheme has eight plans – Dividend, Growth, Growth –Auto Earnings Payout, Bonus, Direct-Dividend, Direct Growth, Direct Growth-Auto Earnings Payout & Direct-Bonus The scheme will not declare dividend under the Growth Plan. The Income earned on such units remain invested under the scheme and reflected in the Net Asset Value. The initial issue period of the scheme was from November 29, 2004 to December 22, 2004 and the scheme was reopened for continuous purchase and redemption at prevailing NAV from January 17, 2005.
1.2 Asset Management Company
Sahara Mutual Fund (SMF) has been established as a Trust in accordance with the Indian Trusts Act, 1882, and is sponsored by Sahara India Financial Corporation Limited. Sahara Asset Management Company Private Limited (“SAMCPL”), a company incorporated under the Companies Act, 1956, has been appointed as the Asset Management Company (“Investment Manager”) to Sahara Mutual Fund. The Shareholding of Sahara Asset Management Company Private Limited as on March 31, 2019 is as follows:
Name of the Shareholder Type of Holdings
Holding
Sahara India Financial Corporation Limited Equity 45.27%
Sahara India Corp Investment Limited Equity 10.52%
Sahara Prime City Limited (formerly Sahara India Investment Corporation Limited )
Equity 11.74%
Sahara Care Limited Equity 31.00%
Sahara India Commercial Corporation Limited Equity 1.47%
Name of the Shareholder Type of Holdings
Holding
Sahara India Commercial Corporation Ltd Preference 90.32%
Sahara Care Ltd Preference 9.68%
2. SIGNIFICANT ACCOUNTING POLICIES
2.1. Basis of Accounting.
The Scheme maintains its books of account on an accrual basis. These financial statements have been prepared in accordance with the Accounting Policies and Standards specified in the Ninth Schedule of The Securities and Exchange Board of India (Mutual Funds) Regulations, 1996, (the“Regulation”), and amendments thereto, as applicable.
2.2. Accounting for Investments
2.2.1 Investments are accounted on trade dates at cost including brokerage, stamp duty and other charges which are included in the acquisition of investments.
2.2.2 Profit or loss on sale of investments is determined on the respective trade date by adopting the “Weighted Average Cost” method.
2.2.3 Bonus/Rights entitlements on equity holdings are recognized only when the original shares on which the entitlement accrues are traded on the Principal stock exchange on ex-

82
bonus/ex-rights basis respectively. In respect of unlisted/ non- traded securities, the Bonus/Rights on equity holdings are recognised only on the receipt of the Bonus/Rights.
2.2.4 Primary Market Investments are recognized on the basis of allotment advice. 2.3. Valuation of Investments
Valuation Policy as on 31.03.2019 is as under.
A: VALUATION OF DEBT INSTRUMENTS
A (I) - The Valuation Policy of Debt and Money Market Instruments is given below:
A (II) Pricing of Inter -Scheme Transfer of Debt Instruments (ISTs):
Sr. No.
Instrument Valuation applicable on the day of
valuation
1.
CBLO, REPO, Fixed Deposit, Call Money , etc and such Similar Instruments
On Amortization basis / Accrual basis.
2.
Certificate of Deposit (CD), Commercial Paper (CP), Non-Convertible Debenture (NCD) Pass Through Certificate (PTC), Bonds, etc. where Script wise values are available from CRISIL/ ICRA
The aggregated average price provided by CRISIL / ICRA for the given security or any other agencies as may be indicated from time to time by SEBI/AMFI for that day
3.
Certificate of Deposit (CD), Commercial Paper (CP), Non-Convertible Debenture (NCD) Pass Through Certificate (PTC), Bonds, etc where Script wise values are not available from CRISIL/ ICRA
i) Same security traded and reported on public platforms.
On Weighted Average Yield of all trades (excluding abnormal and retail trades) on Public platforms, for that Securities on that day irrespective of settlement day.
ii) If Same Security not traded and reported on any of the public platforms.
The aggregated average matrices of CRISIL/ ICRA for the respective category Or any other agencies as may be indicated from time to time by SEBI/AMFI for that day.
4 Central Government Securities / State Government Securities / Treasury Bills/Cash Management Bill etc
1) If the securities are traded and residual
maturity is above 60 days.
The Aggregated average valuation as provided by CRISIL / ICRA or any other agencies as may be indicated from time to time by SEBI/AMFI for that day. In case on any given day, the valuation Matrices is not available from CRISIL/ICRA the Valuation is done on accrual/amortization based on last valuation.
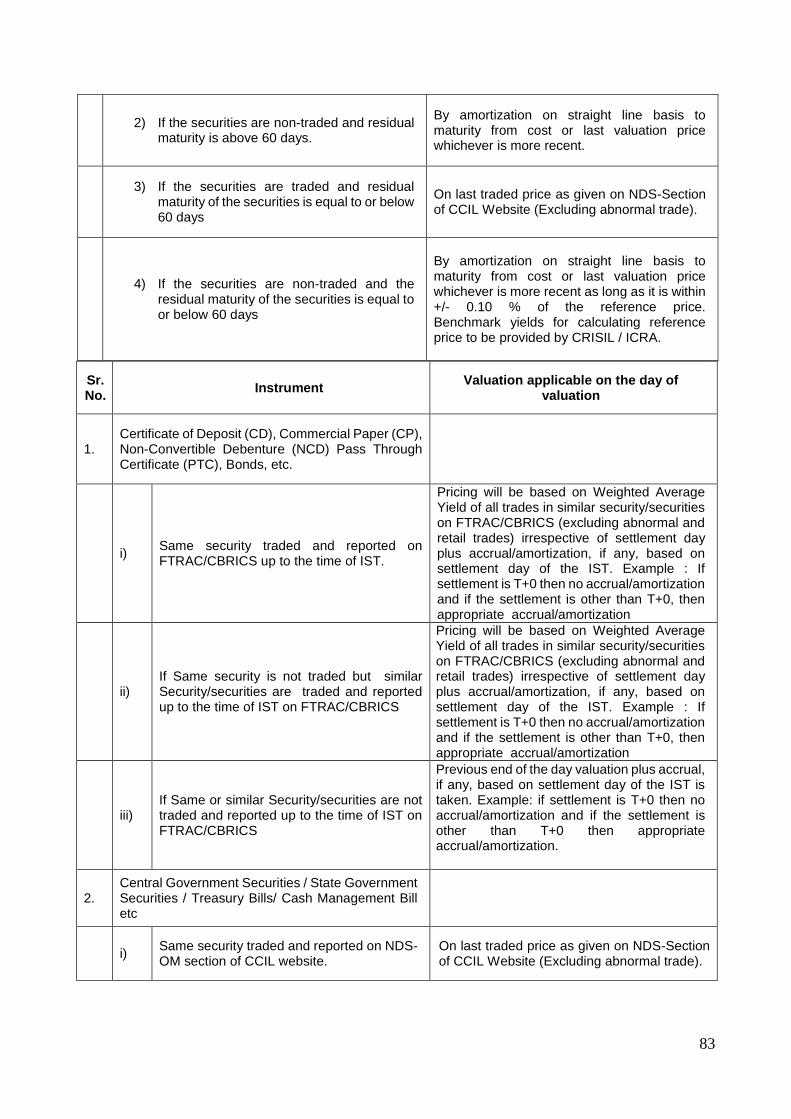
83
Sr. No.
Instrument Valuation applicable on the day of
valuation
1. Certificate of Deposit (CD), Commercial Paper (CP), Non-Convertible Debenture (NCD) Pass Through Certificate (PTC), Bonds, etc.
i) Same security traded and reported on FTRAC/CBRICS up to the time of IST.
Pricing will be based on Weighted Average Yield of all trades in similar security/securities on FTRAC/CBRICS (excluding abnormal and retail trades) irrespective of settlement day plus accrual/amortization, if any, based on settlement day of the IST. Example : If settlement is T+0 then no accrual/amortization and if the settlement is other than T+0, then appropriate accrual/amortization
ii) If Same security is not traded but similar Security/securities are traded and reported up to the time of IST on FTRAC/CBRICS
Pricing will be based on Weighted Average Yield of all trades in similar security/securities on FTRAC/CBRICS (excluding abnormal and retail trades) irrespective of settlement day plus accrual/amortization, if any, based on settlement day of the IST. Example : If settlement is T+0 then no accrual/amortization and if the settlement is other than T+0, then appropriate accrual/amortization
iii) If Same or similar Security/securities are not traded and reported up to the time of IST on FTRAC/CBRICS
Previous end of the day valuation plus accrual, if any, based on settlement day of the IST is taken. Example: if settlement is T+0 then no accrual/amortization and if the settlement is other than T+0 then appropriate accrual/amortization.
2. Central Government Securities / State Government Securities / Treasury Bills/ Cash Management Bill etc
i) Same security traded and reported on NDS-OM section of CCIL website.
On last traded price as given on NDS-Section of CCIL Website (Excluding abnormal trade).
2) If the securities are non-traded and residual
maturity is above 60 days.
By amortization on straight line basis to maturity from cost or last valuation price whichever is more recent.
3) If the securities are traded and residual
maturity of the securities is equal to or below 60 days
On last traded price as given on NDS-Section of CCIL Website (Excluding abnormal trade).
4) If the securities are non-traded and the
residual maturity of the securities is equal to or below 60 days
By amortization on straight line basis to maturity from cost or last valuation price whichever is more recent as long as it is within +/- 0.10 % of the reference price. Benchmark yields for calculating reference price to be provided by CRISIL / ICRA.
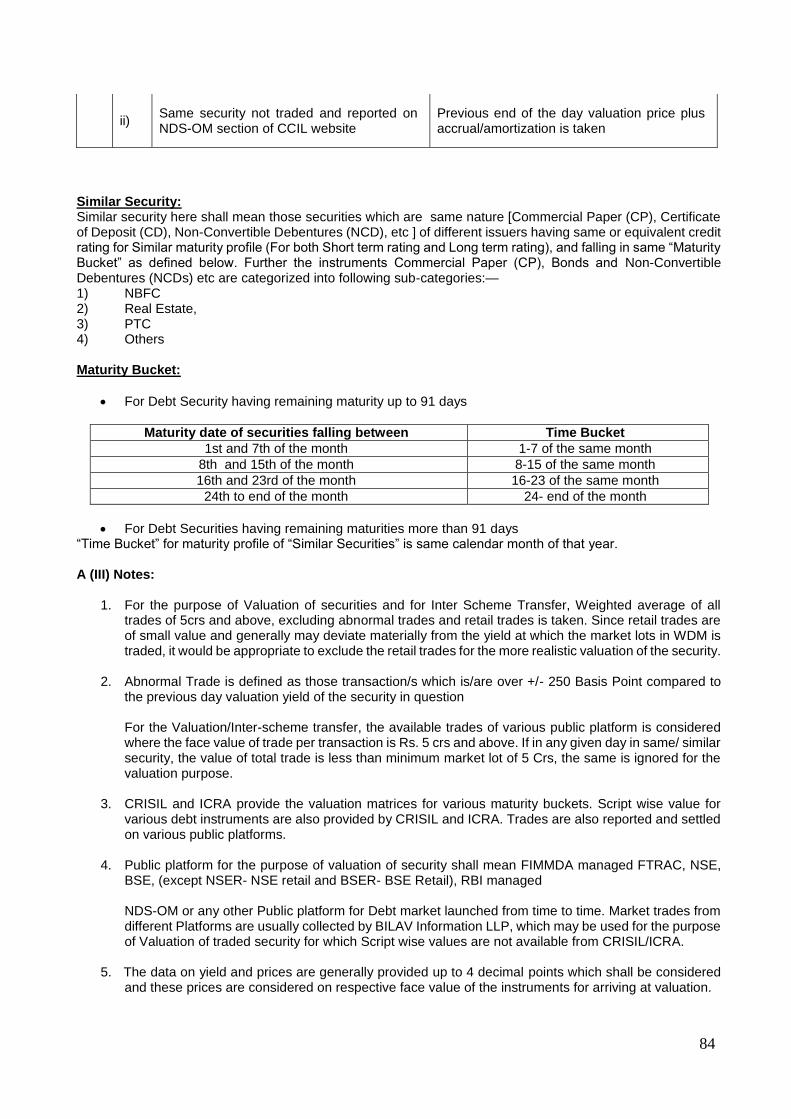
84
ii) Same security not traded and reported on NDS-OM section of CCIL website
Previous end of the day valuation price plus accrual/amortization is taken
Similar Security: Similar security here shall mean those securities which are same nature [Commercial Paper (CP), Certificate of Deposit (CD), Non-Convertible Debentures (NCD), etc ] of different issuers having same or equivalent credit rating for Similar maturity profile (For both Short term rating and Long term rating), and falling in same “Maturity Bucket” as defined below. Further the instruments Commercial Paper (CP), Bonds and Non-Convertible Debentures (NCDs) etc are categorized into following sub-categories:— 1) NBFC 2) Real Estate, 3) PTC 4) Others Maturity Bucket:
For Debt Security having remaining maturity up to 91 days
Maturity date of securities falling between Time Bucket
1st and 7th of the month 1-7 of the same month
8th and 15th of the month 8-15 of the same month
16th and 23rd of the month 16-23 of the same month
24th to end of the month 24- end of the month
For Debt Securities having remaining maturities more than 91 days “Time Bucket” for maturity profile of “Similar Securities” is same calendar month of that year. A (III) Notes:
1. For the purpose of Valuation of securities and for Inter Scheme Transfer, Weighted average of all trades of 5crs and above, excluding abnormal trades and retail trades is taken. Since retail trades are of small value and generally may deviate materially from the yield at which the market lots in WDM is traded, it would be appropriate to exclude the retail trades for the more realistic valuation of the security.
2. Abnormal Trade is defined as those transaction/s which is/are over +/- 250 Basis Point compared to the previous day valuation yield of the security in question For the Valuation/Inter-scheme transfer, the available trades of various public platform is considered where the face value of trade per transaction is Rs. 5 crs and above. If in any given day in same/ similar security, the value of total trade is less than minimum market lot of 5 Crs, the same is ignored for the valuation purpose.
3. CRISIL and ICRA provide the valuation matrices for various maturity buckets. Script wise value for various debt instruments are also provided by CRISIL and ICRA. Trades are also reported and settled on various public platforms.
4. Public platform for the purpose of valuation of security shall mean FIMMDA managed FTRAC, NSE, BSE, (except NSER- NSE retail and BSER- BSE Retail), RBI managed NDS-OM or any other Public platform for Debt market launched from time to time. Market trades from different Platforms are usually collected by BILAV Information LLP, which may be used for the purpose of Valuation of traded security for which Script wise values are not available from CRISIL/ICRA.
5. The data on yield and prices are generally provided up to 4 decimal points which shall be considered
and these prices are considered on respective face value of the instruments for arriving at valuation.
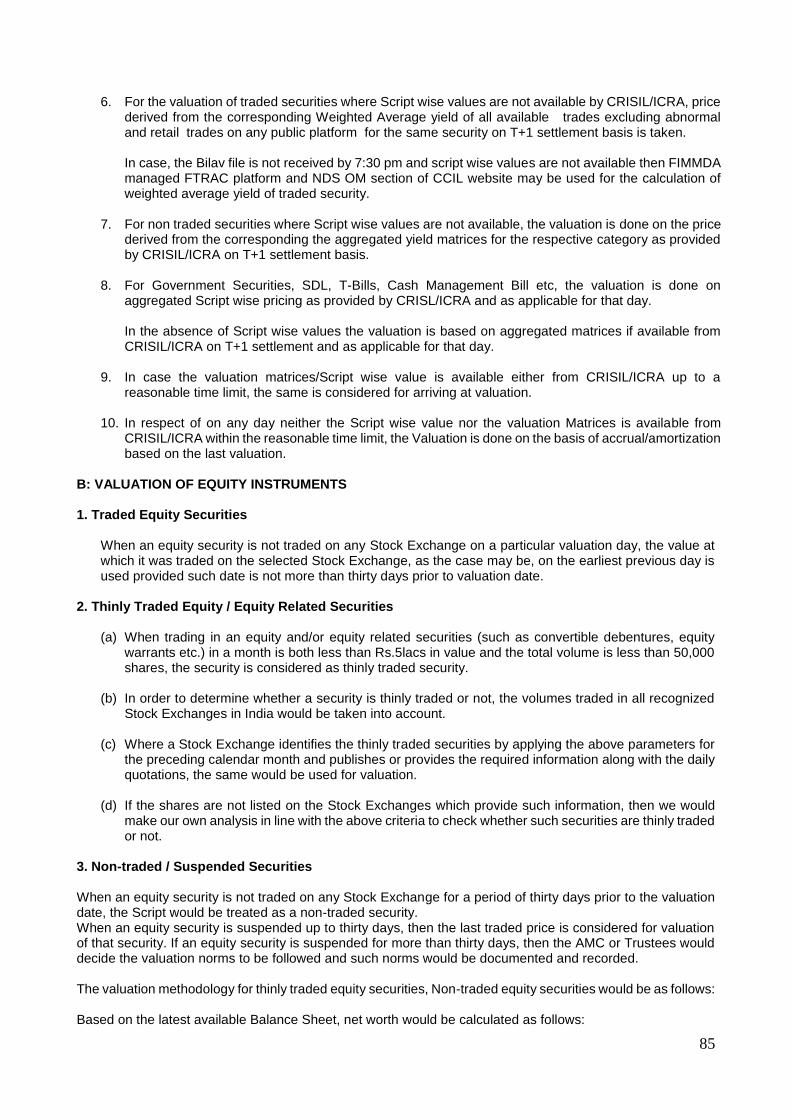
85
6. For the valuation of traded securities where Script wise values are not available by CRISIL/ICRA, price derived from the corresponding Weighted Average yield of all available trades excluding abnormal and retail trades on any public platform for the same security on T+1 settlement basis is taken.
In case, the Bilav file is not received by 7:30 pm and script wise values are not available then FIMMDA managed FTRAC platform and NDS OM section of CCIL website may be used for the calculation of weighted average yield of traded security.
7. For non traded securities where Script wise values are not available, the valuation is done on the price derived from the corresponding the aggregated yield matrices for the respective category as provided by CRISIL/ICRA on T+1 settlement basis.
8. For Government Securities, SDL, T-Bills, Cash Management Bill etc, the valuation is done on
aggregated Script wise pricing as provided by CRISL/ICRA and as applicable for that day. In the absence of Script wise values the valuation is based on aggregated matrices if available from CRISIL/ICRA on T+1 settlement and as applicable for that day.
9. In case the valuation matrices/Script wise value is available either from CRISIL/ICRA up to a
reasonable time limit, the same is considered for arriving at valuation.
10. In respect of on any day neither the Script wise value nor the valuation Matrices is available from CRISIL/ICRA within the reasonable time limit, the Valuation is done on the basis of accrual/amortization based on the last valuation.
B: VALUATION OF EQUITY INSTRUMENTS
1. Traded Equity Securities
When an equity security is not traded on any Stock Exchange on a particular valuation day, the value at which it was traded on the selected Stock Exchange, as the case may be, on the earliest previous day is used provided such date is not more than thirty days prior to valuation date.
2. Thinly Traded Equity / Equity Related Securities
(a) When trading in an equity and/or equity related securities (such as convertible debentures, equity warrants etc.) in a month is both less than Rs.5lacs in value and the total volume is less than 50,000 shares, the security is considered as thinly traded security.
(b) In order to determine whether a security is thinly traded or not, the volumes traded in all recognized
Stock Exchanges in India would be taken into account.
(c) Where a Stock Exchange identifies the thinly traded securities by applying the above parameters for the preceding calendar month and publishes or provides the required information along with the daily quotations, the same would be used for valuation.
(d) If the shares are not listed on the Stock Exchanges which provide such information, then we would make our own analysis in line with the above criteria to check whether such securities are thinly traded or not.
3. Non-traded / Suspended Securities When an equity security is not traded on any Stock Exchange for a period of thirty days prior to the valuation date, the Script would be treated as a non-traded security. When an equity security is suspended up to thirty days, then the last traded price is considered for valuation of that security. If an equity security is suspended for more than thirty days, then the AMC or Trustees would decide the valuation norms to be followed and such norms would be documented and recorded. The valuation methodology for thinly traded equity securities, Non-traded equity securities would be as follows: Based on the latest available Balance Sheet, net worth would be calculated as follows:
86
(a) Net Worth per share = [share capital+ reserves (excluding revaluation reserves) – Misc. expenditure
and Debit Balance in P&L A/c] Divided by No. of Paid up Shares.
(b) Average capitalization rate (P/E ratio) for the industry based upon NSE prices or BSE prices and discounted by 75% i.e. only 25% of the Industry average P/E would be taken as capitalization rate (P/E ratio). Earnings per Share (EPS) of the latest audited annual accounts would be considered for this purpose.
(c) The value as per the net worth value per share and the capital earning value calculated as above
would be averaged and further discounted by 10% for illiquidity so as to arrive at the fair value per share.
(d) In case the EPS is negative, EPS value for that year would be taken as zero for arriving at capitalized
earning.
(e) In case, where the latest Balance Sheet of the company is not available within nine months from the close of the year, unless the accounting year is changed, the shares of such companies would be valued at zero.
(f) In case, an individual security accounts for more than 5% of the total assets of the scheme, an
Independent Valuer would be appointed for the valuation of the said security. To determine if a security accounts for more than 5 per cent of the total assets of the scheme, it would be valued by the procedure above and the proportion which it bears to the total net assets of the scheme to which it belongs will be compared on the date of valuation.
4. Unlisted Equity Methodology for Valuation - unlisted equity shares of a company would be valued "in good faith" as below:
a) Based on the latest available Balance Sheet, net worth would be calculated as follows:
1. Net Worth per share = [share capital+ reserves (excluding revaluation reserves) – Misc. expenditure and Debit Balance in P&L A/c] Divided by No. of Paid up Shares.
2. After taking into account the outstanding warrants and options, Net Worth per share would again be calculated and is = [Share Capital + consideration on exercise of Option and/or Warrants received/receivable by the Company + Free Reserves (excluding Revaluation Reserves) – Miscellaneous expenditure not written off or deferred revenue expenditure, intangible assets and accumulated losses] / Number of Paid up Shares plus Number of Shares that would be obtained on conversion and/or exercise of Outstanding Warrants and Options.
3. The lower of (1) and (2) above would be used for calculation of Net Worth per share and for further
calculation in (c) below.
b) Average capitalization rate (P/E ratio) for the industry based upon NSE prices or BSE prices and discounted by 75% i.e. only 25% of the Industry average P/E would be taken as capitalization rate (P/E ratio). Earnings per Share (EPS) of the latest audited annual accounts would be considered for this purpose.
c) The value as per the net worth value per share and the capital earning value calculated as above would be averaged and further discounted by 15% for illiquidity so as to arrive at the fair value per share.
The above valuation methodology would be subject to the following conditions:
a) All calculations would be based on audited accounts. b) If the latest Balance Sheet of the company is not available within nine months from the close of the
year, unless the accounting year is changed, the shares of such companies would be valued at zero. c) If the Net Worth of the company is negative, the share would be marked down to zero.

87
d) In case the EPS is negative, EPS value for that year would be taken as zero for arriving at capitalized earning.
e) In case an individual security accounts for more than 5 per cent of the total assets of the scheme, an Independent Valuer would be appointed for the valuation of the said security. To determine if a security accounts for more than 5 per cent of the total assets of the scheme, it is valued in accordance with the procedure as mentioned above on the date of valuation.
5. Demerger Generally on demerger, a listed security gets bifurcated into two or more shares. The valuation of these de-merged companies would depend on the following scenarios:
a) Both the shares are traded immediately on de-merger: In this case both the shares would be valued at respective traded prices.
b) Shares of only one company continued to be traded on de-merger: Traded shares would be valued
at traded price and the other security would to be valued at traded value on the day before the de merger less value of the traded security post de merger. In case value of the share of de-merged company is equal or in excess of the value of the pre de-merger share, then the non traded share would be valued at zero, till the date it is listed.
c) Both the shares are not traded on de-merger: Shares of de-merged companies would be valued equal to the pre de merger value up to a period of 30 days from the date of de merger till the date it is listed. The market price of the shares of the de-merged company one day prior to ex-date would be bifurcated over the de-merged shares. The market value of the shares would be bifurcated on a fair value basis, based on available information on the de-merger scheme.
d) In case shares of either of the companies are not traded for more than 30 days: Then it would be
treated as unlisted security, and valued accordingly till the date these are listed. 6. Preference Shares
Preference Shares valuation guidelines would be as follows:
a) Traded preference shares would be valued as per traded prices. b) Non traded Preference Shares
(I). Redeemable Preference Shares
i. Convertible preference share would be valued like convertible debentures.
In general in respect of convertible debentures and bonds, the non-convertible and convertible components would be valued separately. The non-convertible component would be valued on the same basis as would be applicable to a debt instrument. The convertible component would be valued on the same basis as would be applicable to an equity instrument.
If a convertible preference share does not pay dividend then it would be treated like non-convertible debentures.
ii. Non-Convertible preference share would be valued like a debt instrument.
(II). Irredeemable preference shares would be valued on perpetual basis. It is like a constant dividend equity share.
7. Warrants
a) In respect of warrants to subscribe for shares attached to instruments, the warrants would be valued at the value of the share which would be obtained on exercise of the warrants as reduced by the amount which would be payable on exercise of the warrant. A discount similar to the discount to be determined in respect on convertible debentures is deducted to account for the period, which must elapse before the warrant can be exercised.
88
b) In case the warrants are traded separately they would be valued as per the valuation guidelines
applicable to Equity Shares. 8. Rights
Until they are traded, the value of "rights" shares would be calculated as: Vr = n ÷ m x (Pex - Pof) Where Vr = Value of rights n = no. of rights offered m = no. of original shares held Pex = Ex-rights price Pof = Rights Offer Price
Where the rights are not treated pari passu with the existing shares, suitable adjustment would be made to the value of rights. Where it is decided not to subscribe for the rights but to renounce them and renunciations are being traded, the rights would be valued at the renunciation value. 9. Derivatives Market values of traded open futures and option contracts would be determined with respect to the exchange on which contracted originally, i.e., a future or an option contracted on the National Stock Exchange (NSE) would be valued at the closing price on the NSE. The price of the same futures and option contract on the Bombay Stock Exchange (BSE) cannot be considered for the purpose of valuation, unless the futures or option itself has been contracted on the BSE. The same will be valued at closing price if the contract is traded on the valuation day. In case there is no trade on valuation day then the same would be valued at Settlement prices. However, the contracts which are going to expire on valuation date would be valued at Settlement prices only. 10. Mutual Fund Units
a) In case of traded Mutual Fund schemes, the units would be valued at closing price on the stock exchange on which they are traded like equity instruments. In case the units are not traded for more than 7 days, last declared Repurchase Price (the price at which Mutual Fund schemes buys its units back) would be considered for valuation.
b) If the last available Repurchase price is older than 7 days, the valuation will be done at the last available NAV reduced by illiquidity discount. The illiquidity discount will be 10% of NAV or as decided by the Valuation Committee.
c) In case of non-traded Mutual Fund scheme, the last declared Repurchase Price (the price at which Mutual Fund schemes buys its units back) would be considered for valuation.
d) In case of Investments made by a scheme into the other scheme of Sahara Mutual Fund, if valuation date being the last day of the financial year falling on a non-business day, then the computed NAV would be considered for valuation on March 31.
Related matters i) In case the income accrued on debt instruments is not received even after 90 days past the due date, the
asset is termed as Non-Performing Assets (NPAs) and all provisions/guidelines with respect to income accrual, provisioning etc as contained in SEBI circulars/guidelines issued from time to time shall apply and the valuation of such securities will be done accordingly. In case the company starts servicing the debt, re-schedulement is allowed, the applicable provision in SEBI circulars shall apply for provisioning and reclassification of the asset
ii) In case of any other instruments not covered in the policy above, the same is referred to the Investment and
Valuation Committee which is empowered to take decision.
89
iii) In case of any perceived conflict of interest while valuating the securities, the matter is dealt and decided by
Investment and Valuation Committee.
iv) For non– business day the valuation is done on aggregated Script wise prices as provided by CRISIL/ICRA. In absence of Script wise prices the valuation is done on accrual basis/amortization basis based on last valuation
v) In case of exceptional circumstances like, policy announcements by government/regulatory bodies, natural
disasters, public disturbances, extreme volatility in capital market, shut down of market, war etc and on those days if Script wise value or valuation matrices are not available from CRISIL/ICRA and if security is not traded, the valuation for the day is done based on last valuation plus accrual/amortization or as may decided by the Investment and Valuation Committee.
vi) The Valuation Policy is reviewed by the Statutory Auditor at least once in a financial year.
vii) Valuation Policy as updated and approved by the Board of AMC / Board of Trustees is applicable for the
schemes of Sahara Mutual Fund
2.3.1 Valuation of securities not covered under the above valuation policy: The total exposure in securities, which do not fall under above valuation norms, shall not exceed 5% of the total AUM of the scheme.
In case of any other instruments not covered in the policy above, the same shall be referred to the Investment and Valuation Committee which is empowered to take decision. Investment in such securities is to be valued by a method approved by the Investment and Valuation Committee and the same will be reported to the Board of Trustees. 2.3.2 Unrealised Appreciation/Depreciation. In accordance with the Guidance Note on Accounting for Investments in the Financial Statements of Mutual Funds issued by the Institute of Chartered Accountants of India, the unrealized appreciation determined separately for each individual investment is directly transferred to the “Unrealized Appreciation Reserve Account” i.e. without routing it through the revenue account.
The provision for depreciation in value of investments determined separately for each individual investment is recognized in the revenue account. The loss (realized) on investments sold / transferred during the year is charged to revenue account, instead of being first adjusted against the provision for depreciation, if already created in the prior year, as recommended by the said Guidance Note. However, this departure from the Guidance Note does not have any net impact on the Scheme’s net assets or results for the year.
2.4 Revenue Recognition
2.4.1 Income and Expenses are recognized on accrual basis. 2.4.2 Interest on funds invested in short term deposits with scheduled commercial banks is
recognized on accrual basis. 2.4.3 Dividend income earned by the scheme is recognized on the date the share is quoted on ex-
dividend basis on principal stock exchange. 2.4.4 Proportionate realized gains on investments out of sales / repurchase proceeds at the time of
sale / repurchase of units are transferred to revenue Account from Unit Premium Reserve. 3. Net Asset Value for Growth/Dividend Options:
The net asset value of the units is determined separately for units issued under the Growth Option, Dividend Option, Growth Option – Direct and Dividend Option – Direct. For reporting the net asset value of the Growth Option, Dividend Option, Growth Option – Direct and Dividend Option - Direct, daily income earned, including realized and unrealized gain or loss in the value of investments and expenses incurred by the scheme are allocated to the options in proportion to the value of the net assets.
90
4. Unit Premium Reserve Account Upon issue and redemption of units, the net premium or discount to the face value of units is adjusted against the unit premium reserve account of the Scheme, after an appropriate amount of the issue proceeds and redemption payout is credited or debited respectively to the income equalization account. 5. Income Equalisation Account
An appropriate part of the sale proceeds or the redemption amount, as the case may be, is transferred to income equalization account. The total distributable surplus (without considering unrealized appreciation) upto the date of issue/ redemption of units has been taken into account for the purpose of ascertaining the amount to be transferred to Equalization Account on a daily basis. The net balance in this account is transferred to the Revenue Account at the end of the year.
6. Load Charges
Service tax on exit load , if any, shall be paid out of the exit load proceeds and exit load net of service tax, if any, shall be credited to the scheme.
. 7. Unclaimed Redemption. In line with SEBI circular no. MFD/CIR/9/120 /2000 dated November 24, 2000 and SEBI circular no. SEBI/HO/IMD/DF2/CIR/P/2016/37 dated February 25, 2016, the unclaimed redemption and unclaimed dividend amounts may be deployed by the mutual funds in call money market or money market instruments and also be allowed to be invested in a separate plan of Liquid Scheme/ Money Market Mutual Fund scheme floated by Mutual Funds specifically for deployment of the unclaimed amounts. The investors who claim these amounts during a period of three years from the due date shall be paid initial unclaimed amount along with the income earned on its deployment. Investors who claim these amounts after 3 years, shall be paid initial unclaimed amount along with the income earned on its deployment till the end of the third year. After the third year, the income earned on such unclaimed amounts shall be used for the purpose of investor education. Further, AMC shall not be permitted to charge any exit load in this plan and TER (Total Expense Ratio) of such plans shall be capped at 50 bps. The AMC should make continuous effort to remind the investors through letters to take their unclaimed amounts.
8. NOTES TO THE ACCOUNTS
8.1 Management Fees ,Trusteeship Fees ,Custodian Fees, Scheme Expenses
Management Fees
Management Fees (inclusive of GST) has been computed at 1.86% (PY: 2.84%) on average net assets calculated on a daily basis.
Trusteeship Fees & Expenses
In accordance with Deed of Trust dated 18th July 1996 between the Settler and the Trustees, an annual fee of Rs.1,00,000/- per Trustee is payable. During the financial year 2018-19, the Trusteeship fees and expenses amounted to Rs.147609.40. However, due to small AUM of the scheme, only an amount of Rs.15423.06 was charged to the scheme expenses and the balance amount was borne by the AMC.
Custodian Charges
HDFC Bank provides Custodial services to the scheme for which fees is paid as per the agreement.
Scheme Expenses As per guidelines issued vide SEBI circular dated October 22, 2018, the schemes related expenses had to be fully managed from the Total Expense Ratio (TER). During the financial year 2018-19 due to small size of AUM of the scheme only the certain expenses have been paid from TER and the balance amount had been borne by the AMC, details are as under:
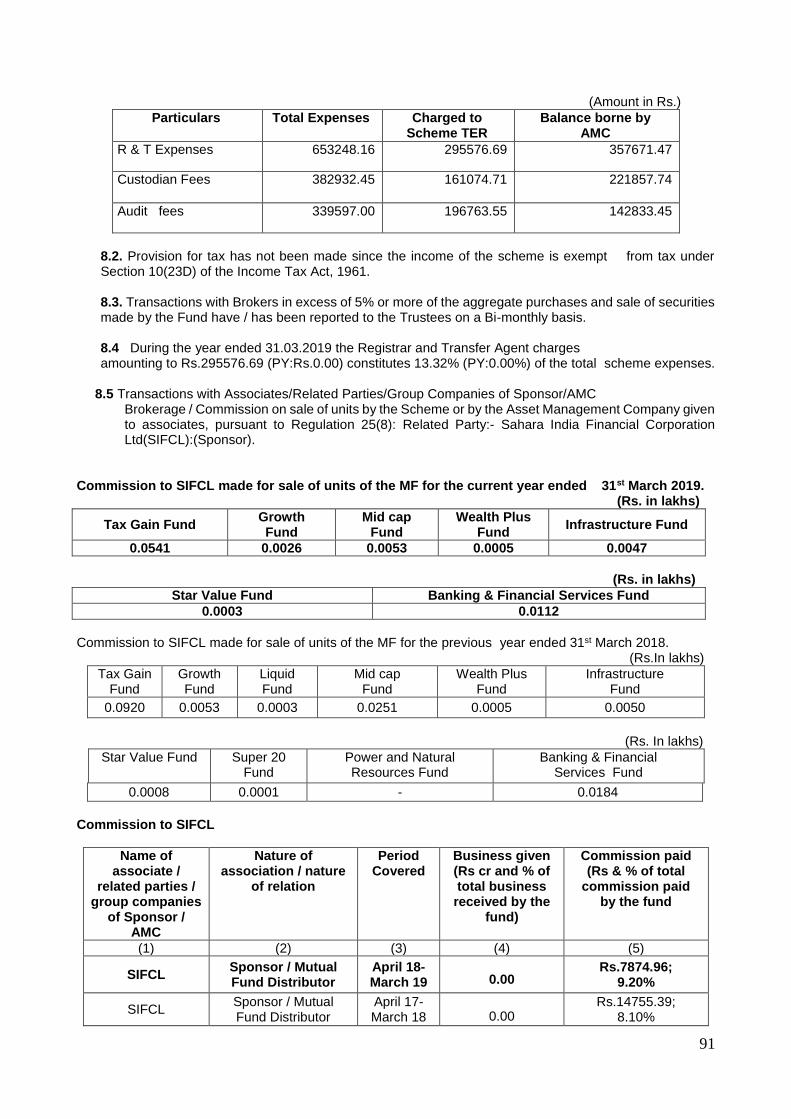
91
(Amount in Rs.)
Particulars Total Expenses Charged to Scheme TER
Balance borne by AMC
R & T Expenses 653248.16 295576.69 357671.47
Custodian Fees 382932.45 161074.71 221857.74
Audit fees 339597.00 196763.55 142833.45
8.2. Provision for tax has not been made since the income of the scheme is exempt from tax under Section 10(23D) of the Income Tax Act, 1961.
8.3. Transactions with Brokers in excess of 5% or more of the aggregate purchases and sale of securities made by the Fund have / has been reported to the Trustees on a Bi-monthly basis. 8.4 During the year ended 31.03.2019 the Registrar and Transfer Agent charges amounting to Rs.295576.69 (PY:Rs.0.00) constitutes 13.32% (PY:0.00%) of the total scheme expenses.
8.5 Transactions with Associates/Related Parties/Group Companies of Sponsor/AMC
Brokerage / Commission on sale of units by the Scheme or by the Asset Management Company given to associates, pursuant to Regulation 25(8): Related Party:- Sahara India Financial Corporation Ltd(SIFCL):(Sponsor).
Commission to SIFCL made for sale of units of the MF for the current year ended 31st March 2019.
(Rs. in lakhs)
Tax Gain Fund Growth Fund
Mid cap Fund
Wealth Plus Fund
Infrastructure Fund
0.0541 0.0026 0.0053 0.0005 0.0047
(Rs. in lakhs)
Star Value Fund Banking & Financial Services Fund
0.0003 0.0112
Commission to SIFCL made for sale of units of the MF for the previous year ended 31st March 2018. (Rs.In lakhs)
Tax Gain Fund
Growth Fund
Liquid Fund
Mid cap Fund
Wealth Plus Fund
Infrastructure Fund
0.0920 0.0053 0.0003 0.0251 0.0005 0.0050
(Rs. In lakhs)
Star Value Fund Super 20 Fund
Power and Natural Resources Fund
Banking & Financial Services Fund
0.0008 0.0001 - 0.0184
Commission to SIFCL
Name of associate /
related parties / group companies
of Sponsor / AMC
Nature of association / nature
of relation
Period Covered
Business given (Rs cr and % of total business received by the
fund)
Commission paid (Rs & % of total
commission paid by the fund
(1) (2) (3) (4) (5)
SIFCL Sponsor / Mutual Fund Distributor
April 18-March 19
0.00
Rs.7874.96; 9.20%
SIFCL Sponsor / Mutual Fund Distributor
April 17-March 18
0.00
Rs.14755.39; 8.10%
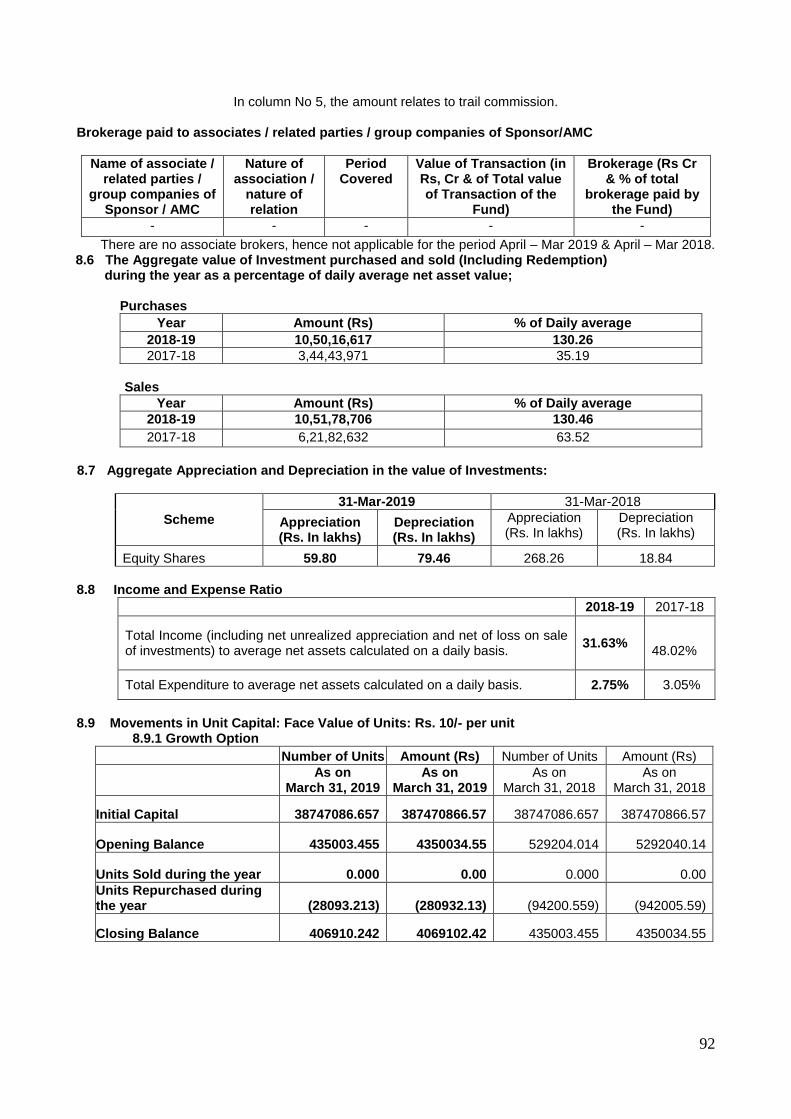
92
In column No 5, the amount relates to trail commission.
Brokerage paid to associates / related parties / group companies of Sponsor/AMC
Name of associate / related parties /
group companies of Sponsor / AMC
Nature of association /
nature of relation
Period Covered
Value of Transaction (in Rs, Cr & of Total value of Transaction of the
Fund)
Brokerage (Rs Cr & % of total
brokerage paid by the Fund)
- - - - -
There are no associate brokers, hence not applicable for the period April – Mar 2019 & April – Mar 2018. 8.6 The Aggregate value of Investment purchased and sold (Including Redemption)
during the year as a percentage of daily average net asset value;
Purchases
Year Amount (Rs) % of Daily average
2018-19 10,50,16,617 130.26
2017-18 3,44,43,971 35.19
Sales
Year Amount (Rs) % of Daily average
2018-19 10,51,78,706 130.46
2017-18 6,21,82,632 63.52
8.7 Aggregate Appreciation and Depreciation in the value of Investments:
Scheme
31-Mar-2019 31-Mar-2018
Appreciation (Rs. In lakhs)
Depreciation (Rs. In lakhs)
Appreciation (Rs. In lakhs)
Depreciation (Rs. In lakhs)
Equity Shares 59.80 79.46 268.26 18.84
8.8 Income and Expense Ratio
2018-19 2017-18
Total Income (including net unrealized appreciation and net of loss on sale of investments) to average net assets calculated on a daily basis.
31.63% 48.02%
Total Expenditure to average net assets calculated on a daily basis. 2.75% 3.05%
8.9 Movements in Unit Capital: Face Value of Units: Rs. 10/- per unit
8.9.1 Growth Option
Number of Units Amount (Rs) Number of Units Amount (Rs)
As on
March 31, 2019 As on
March 31, 2019 As on
March 31, 2018 As on
March 31, 2018
Initial Capital 38747086.657 387470866.57 38747086.657 387470866.57
Opening Balance 435003.455 4350034.55 529204.014 5292040.14
Units Sold during the year 0.000 0.00 0.000 0.00
Units Repurchased during the year (28093.213) (280932.13) (94200.559) (942005.59)
Closing Balance 406910.242 4069102.42 435003.455 4350034.55
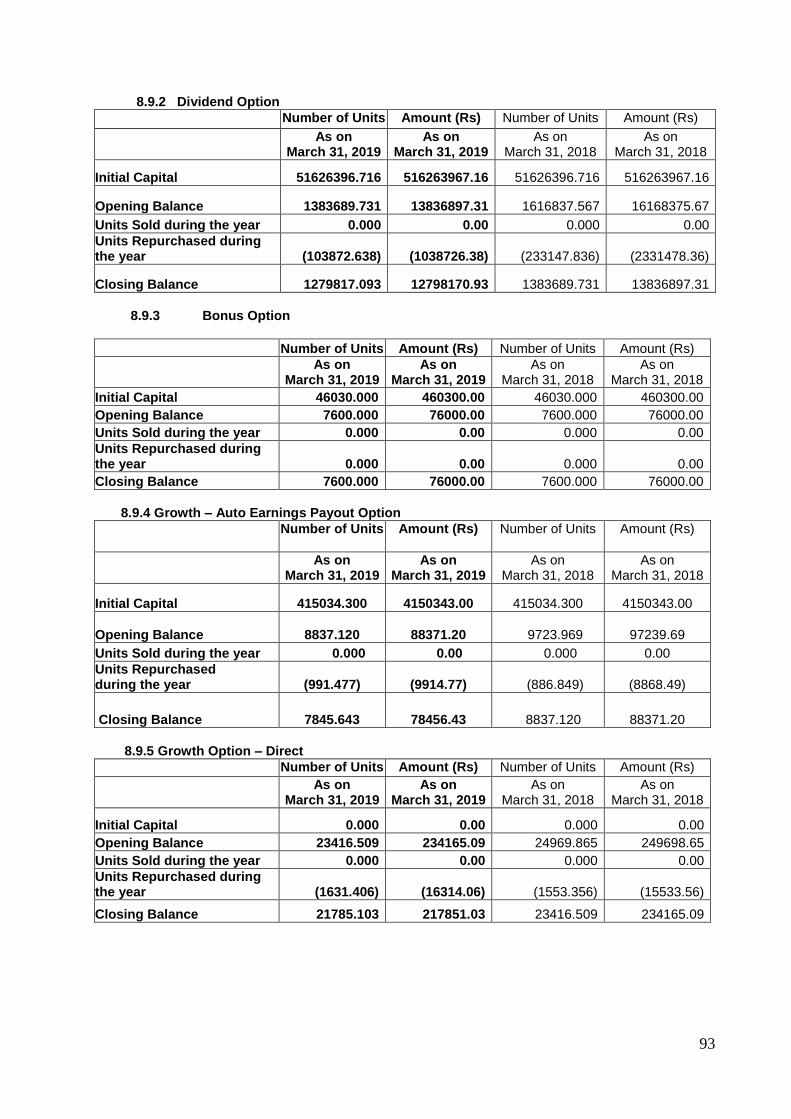
93
8.9.2 Dividend Option
Number of Units Amount (Rs) Number of Units Amount (Rs)
As on
March 31, 2019 As on
March 31, 2019 As on
March 31, 2018 As on
March 31, 2018
Initial Capital 51626396.716 516263967.16 51626396.716 516263967.16
Opening Balance 1383689.731 13836897.31 1616837.567 16168375.67
Units Sold during the year 0.000 0.00 0.000 0.00
Units Repurchased during the year (103872.638) (1038726.38) (233147.836) (2331478.36)
Closing Balance 1279817.093 12798170.93 1383689.731 13836897.31
8.9.3 Bonus Option
Number of Units Amount (Rs) Number of Units Amount (Rs)
As on
March 31, 2019 As on
March 31, 2019 As on
March 31, 2018 As on
March 31, 2018
Initial Capital 46030.000 460300.00 46030.000 460300.00
Opening Balance 7600.000 76000.00 7600.000 76000.00
Units Sold during the year 0.000 0.00 0.000 0.00
Units Repurchased during the year 0.000 0.00 0.000 0.00
Closing Balance 7600.000 76000.00 7600.000 76000.00
8.9.4 Growth – Auto Earnings Payout Option
Number of Units Amount (Rs) Number of Units Amount (Rs)
As on
March 31, 2019 As on
March 31, 2019 As on
March 31, 2018 As on
March 31, 2018
Initial Capital 415034.300 4150343.00 415034.300 4150343.00
Opening Balance 8837.120
88371.20 9723.969 97239.69
Units Sold during the year 0.000 0.00 0.000 0.00
Units Repurchased during the year (991.477) (9914.77) (886.849) (8868.49)
Closing Balance 7845.643 78456.43 8837.120
88371.20
8.9.5 Growth Option – Direct
Number of Units Amount (Rs) Number of Units Amount (Rs)
As on
March 31, 2019 As on
March 31, 2019 As on
March 31, 2018 As on
March 31, 2018
Initial Capital 0.000 0.00 0.000 0.00
Opening Balance 23416.509 234165.09 24969.865 249698.65
Units Sold during the year 0.000 0.00 0.000 0.00
Units Repurchased during the year (1631.406) (16314.06) (1553.356) (15533.56)
Closing Balance 21785.103 217851.03 23416.509 234165.09
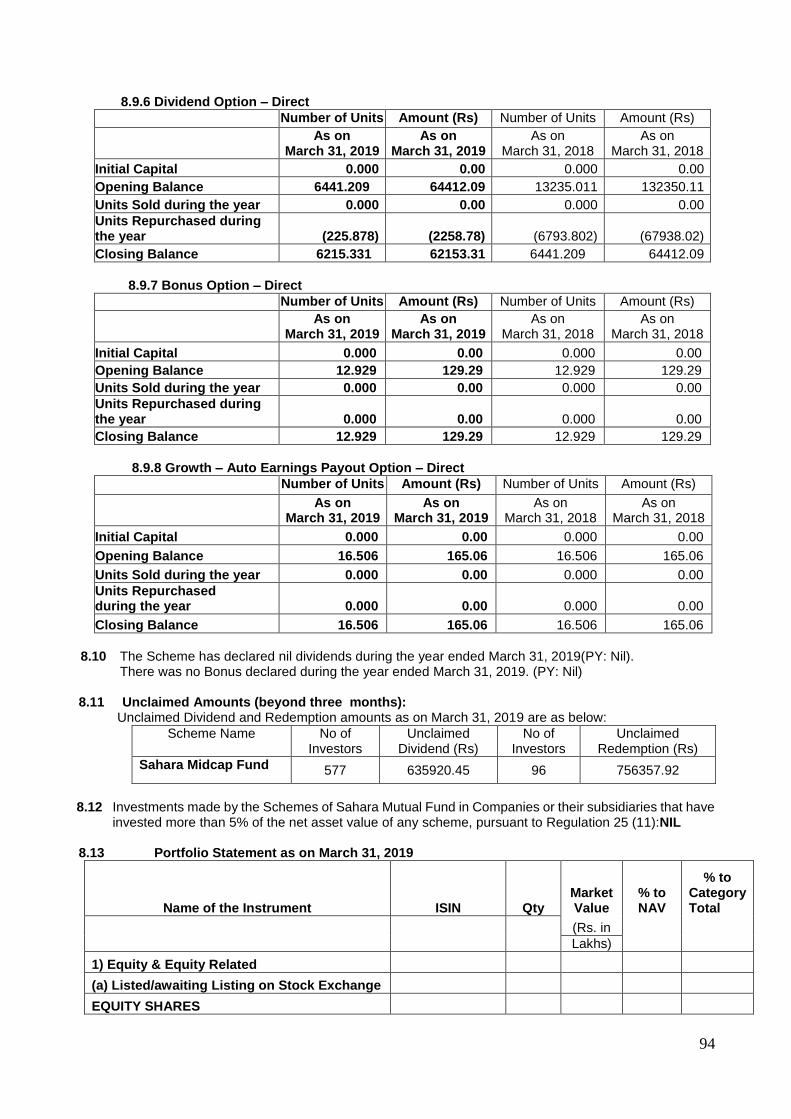
94
8.9.6 Dividend Option – Direct
Number of Units Amount (Rs) Number of Units Amount (Rs)
As on
March 31, 2019 As on
March 31, 2019 As on
March 31, 2018 As on
March 31, 2018
Initial Capital 0.000 0.00 0.000 0.00
Opening Balance 6441.209 64412.09 13235.011 132350.11
Units Sold during the year 0.000 0.00 0.000 0.00
Units Repurchased during the year (225.878) (2258.78) (6793.802) (67938.02)
Closing Balance 6215.331 62153.31 6441.209 64412.09
8.9.7 Bonus Option – Direct
Number of Units Amount (Rs) Number of Units Amount (Rs)
As on
March 31, 2019 As on
March 31, 2019 As on
March 31, 2018 As on
March 31, 2018
Initial Capital 0.000 0.00 0.000 0.00
Opening Balance 12.929 129.29 12.929 129.29
Units Sold during the year 0.000 0.00 0.000 0.00
Units Repurchased during the year 0.000 0.00 0.000 0.00
Closing Balance 12.929 129.29 12.929 129.29
8.9.8 Growth – Auto Earnings Payout Option – Direct
Number of Units Amount (Rs) Number of Units Amount (Rs)
As on
March 31, 2019 As on
March 31, 2019 As on
March 31, 2018 As on
March 31, 2018
Initial Capital 0.000 0.00 0.000 0.00
Opening Balance 16.506 165.06 16.506 165.06
Units Sold during the year 0.000 0.00 0.000 0.00
Units Repurchased during the year 0.000 0.00 0.000 0.00
Closing Balance 16.506 165.06 16.506 165.06
8.10 The Scheme has declared nil dividends during the year ended March 31, 2019(PY: Nil).
There was no Bonus declared during the year ended March 31, 2019. (PY: Nil) 8.11 Unclaimed Amounts (beyond three months): Unclaimed Dividend and Redemption amounts as on March 31, 2019 are as below:
Scheme Name No of Investors
Unclaimed Dividend (Rs)
No of Investors
Unclaimed Redemption (Rs)
Sahara Midcap Fund 577 635920.45 96 756357.92
8.12 Investments made by the Schemes of Sahara Mutual Fund in Companies or their subsidiaries that have
invested more than 5% of the net asset value of any scheme, pursuant to Regulation 25 (11):NIL
8.13 Portfolio Statement as on March 31, 2019
Name of the Instrument ISIN Qty Market Value
% to NAV
% to Category Total
(Rs. in
Lakhs)
1) Equity & Equity Related
(a) Listed/awaiting Listing on Stock Exchange
EQUITY SHARES
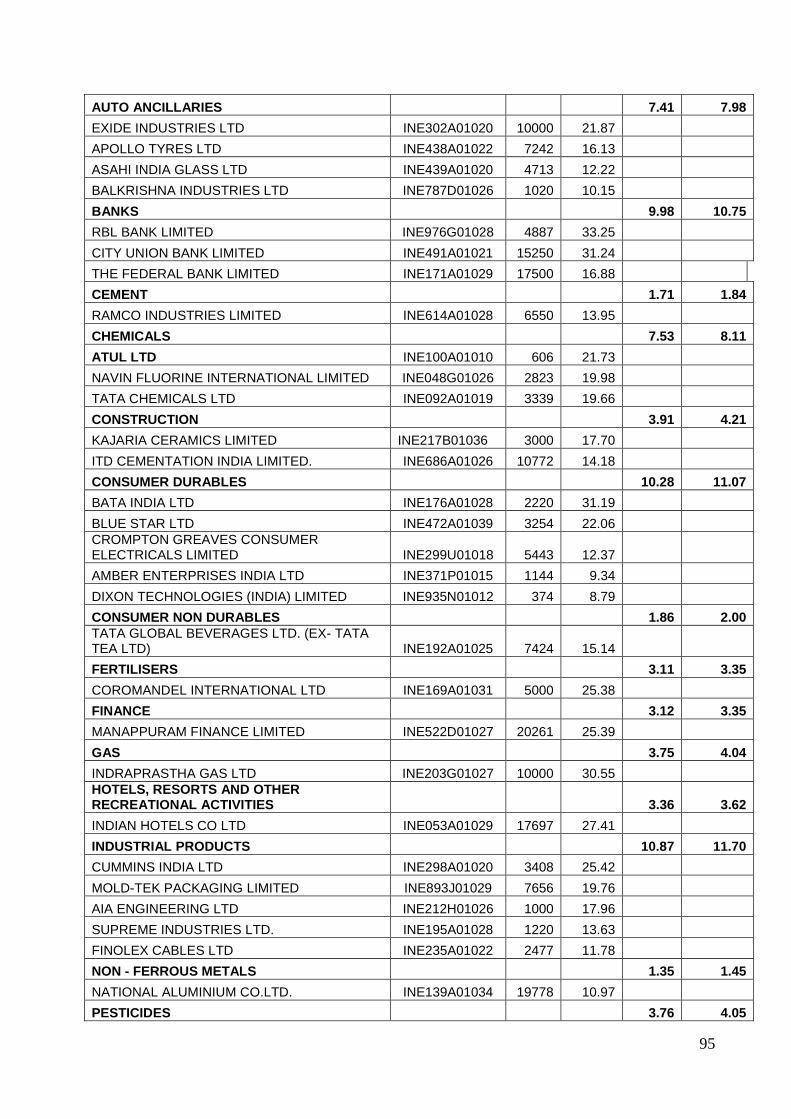
95
AUTO ANCILLARIES 7.41 7.98
EXIDE INDUSTRIES LTD INE302A01020 10000 21.87
APOLLO TYRES LTD INE438A01022 7242 16.13
ASAHI INDIA GLASS LTD INE439A01020 4713 12.22
BALKRISHNA INDUSTRIES LTD INE787D01026 1020 10.15
BANKS 9.98 10.75
RBL BANK LIMITED INE976G01028 4887 33.25
CITY UNION BANK LIMITED INE491A01021 15250 31.24
THE FEDERAL BANK LIMITED INE171A01029 17500 16.88
CEMENT 1.71 1.84
RAMCO INDUSTRIES LIMITED INE614A01028 6550 13.95
CHEMICALS 7.53 8.11
ATUL LTD INE100A01010 606 21.73
NAVIN FLUORINE INTERNATIONAL LIMITED INE048G01026 2823 19.98
TATA CHEMICALS LTD INE092A01019 3339 19.66
CONSTRUCTION 3.91 4.21
KAJARIA CERAMICS LIMITED INE217B01036 3000 17.70
ITD CEMENTATION INDIA LIMITED. INE686A01026 10772 14.18
CONSUMER DURABLES 10.28 11.07
BATA INDIA LTD INE176A01028 2220 31.19
BLUE STAR LTD INE472A01039 3254 22.06
CROMPTON GREAVES CONSUMER ELECTRICALS LIMITED INE299U01018 5443 12.37
AMBER ENTERPRISES INDIA LTD INE371P01015 1144 9.34
DIXON TECHNOLOGIES (INDIA) LIMITED INE935N01012 374 8.79
CONSUMER NON DURABLES 1.86 2.00
TATA GLOBAL BEVERAGES LTD. (EX- TATA TEA LTD) INE192A01025 7424 15.14
FERTILISERS 3.11 3.35
COROMANDEL INTERNATIONAL LTD INE169A01031 5000 25.38
FINANCE 3.12 3.35
MANAPPURAM FINANCE LIMITED INE522D01027 20261 25.39
GAS 3.75 4.04
INDRAPRASTHA GAS LTD INE203G01027 10000 30.55
HOTELS, RESORTS AND OTHER RECREATIONAL ACTIVITIES 3.36 3.62
INDIAN HOTELS CO LTD INE053A01029 17697 27.41
INDUSTRIAL PRODUCTS 10.87 11.70
CUMMINS INDIA LTD INE298A01020 3408 25.42
MOLD-TEK PACKAGING LIMITED INE893J01029 7656 19.76
AIA ENGINEERING LTD INE212H01026 1000 17.96
SUPREME INDUSTRIES LTD. INE195A01028 1220 13.63
FINOLEX CABLES LTD INE235A01022 2477 11.78
NON - FERROUS METALS 1.35 1.45
NATIONAL ALUMINIUM CO.LTD. INE139A01034 19778 10.97
PESTICIDES 3.76 4.05
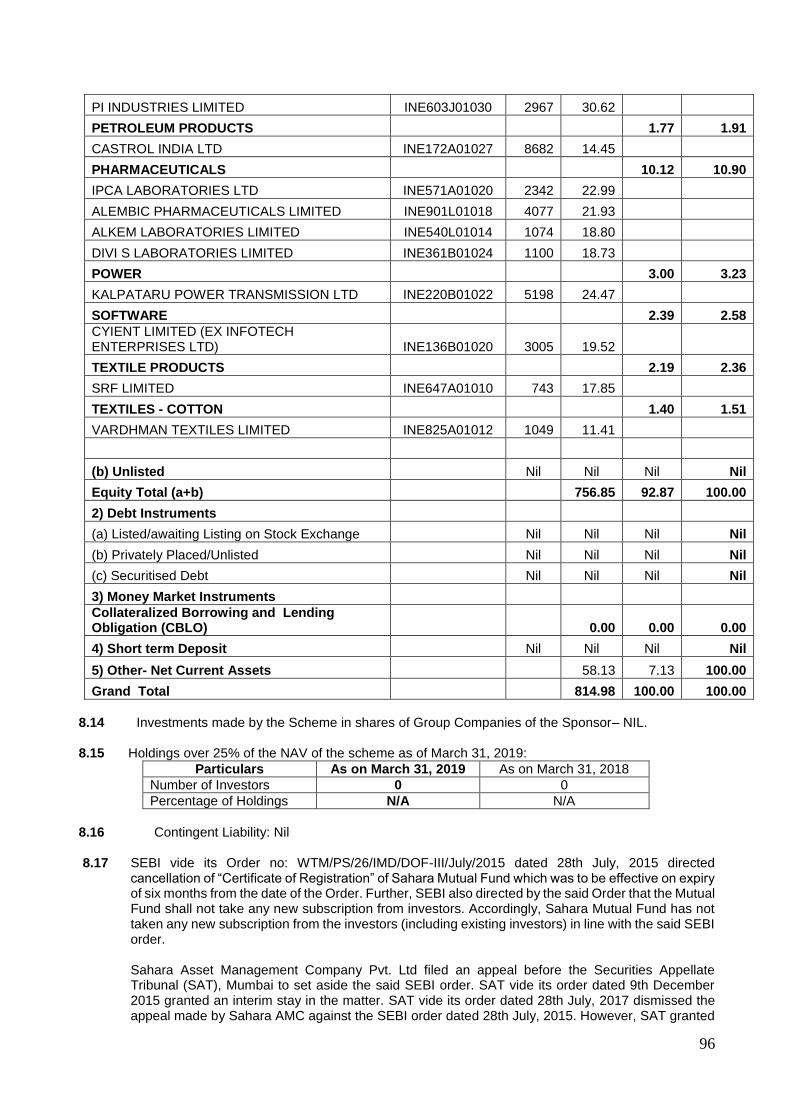
96
PI INDUSTRIES LIMITED INE603J01030 2967 30.62
PETROLEUM PRODUCTS 1.77 1.91
CASTROL INDIA LTD INE172A01027 8682 14.45
PHARMACEUTICALS 10.12 10.90
IPCA LABORATORIES LTD INE571A01020 2342 22.99
ALEMBIC PHARMACEUTICALS LIMITED INE901L01018 4077 21.93
ALKEM LABORATORIES LIMITED INE540L01014 1074 18.80
DIVI S LABORATORIES LIMITED INE361B01024 1100 18.73
POWER 3.00 3.23
KALPATARU POWER TRANSMISSION LTD INE220B01022 5198 24.47
SOFTWARE 2.39 2.58
CYIENT LIMITED (EX INFOTECH ENTERPRISES LTD) INE136B01020 3005 19.52
TEXTILE PRODUCTS 2.19 2.36
SRF LIMITED INE647A01010 743 17.85
TEXTILES - COTTON 1.40 1.51
VARDHMAN TEXTILES LIMITED INE825A01012 1049 11.41
(b) Unlisted Nil Nil Nil Nil
Equity Total (a+b) 756.85 92.87 100.00
2) Debt Instruments
(a) Listed/awaiting Listing on Stock Exchange Nil Nil Nil Nil
(b) Privately Placed/Unlisted Nil Nil Nil Nil
(c) Securitised Debt Nil Nil Nil Nil
3) Money Market Instruments
Collateralized Borrowing and Lending Obligation (CBLO) 0.00 0.00 0.00
4) Short term Deposit Nil Nil Nil Nil
5) Other- Net Current Assets 58.13 7.13 100.00
Grand Total 814.98 100.00 100.00
8.14 Investments made by the Scheme in shares of Group Companies of the Sponsor– NIL.
8.15 Holdings over 25% of the NAV of the scheme as of March 31, 2019:
Particulars As on March 31, 2019 As on March 31, 2018
Number of Investors 0 0
Percentage of Holdings N/A N/A
8.16 Contingent Liability: Nil
8.17 SEBI vide its Order no: WTM/PS/26/IMD/DOF-III/July/2015 dated 28th July, 2015 directed
cancellation of “Certificate of Registration” of Sahara Mutual Fund which was to be effective on expiry of six months from the date of the Order. Further, SEBI also directed by the said Order that the Mutual Fund shall not take any new subscription from investors. Accordingly, Sahara Mutual Fund has not taken any new subscription from the investors (including existing investors) in line with the said SEBI order. Sahara Asset Management Company Pvt. Ltd filed an appeal before the Securities Appellate Tribunal (SAT), Mumbai to set aside the said SEBI order. SAT vide its order dated 9th December 2015 granted an interim stay in the matter. SAT vide its order dated 28th July, 2017 dismissed the appeal made by Sahara AMC against the SEBI order dated 28th July, 2015. However, SAT granted
97
6 weeks stay to approach the Hon’ble Supreme Court in the matter. An appeal was filed on 7th September 2017 before the Hon’ble Supreme Court and the appeal was dismissed vide its order dated 23rd October 2017 SEBI vide its letter dated November 17, 2017 directed the cancellation of ‘Certificate of registration’ would be effective six months from the date of the Hon’ble Supreme Court order dated 23rd October 2017. Sahara Mutual Fund requested SEBI vide its letter dated 15th January 2018 to extend the date of cancellation of ‘Certificate of registration’ till July 27th, 2018 for giving time for identification of a new sponsor and considering the lock in period of certain unit holders’ investments in Sahara Tax Gain Fund. A new sponsor was identified for Sahara Mutual Fund viz., One Life Capital Advisors Limited. SEBI vide their letter dated 11th April 2018 ordered for winding up all the schemes except Sahara Tax Gain Fund by 21st April 2018. An appeal was filed before SAT for a stay against the SEBI order dated April, 11, 2018. In view of the direction of SAT on 26th April 2018, a comprehensive appeal was filed. SAT vide its order dated 3rd May 2018 directed that SEBI shall not enforce the orders impugned in the two appeals till a decision on new sponsor’s application is communicated.Pending decision of SEBI on the above matter, the scheme accounts have been made on a ‘going concern basis’.
8.18 Composition of the Board of Trustees. As per Reg 15(1) r.w. para 22 of the Third Schedule (Contents of Trust Deed) of SEBI (Mutual Funds) Regulations 1996, it is stated that "The trust deed shall state that the minimum number of trustees shall be four." The Board of Trustees of Sahara Mutual Fund comprises of two (2) Trustees and thereby the above criteria of minimum number of Trustees has not been complied with.
8.19 Net worth:
As per the Reg. 21(1)(f), of SEBI (Mutual Funds) Regulations, 1996 and in compliance with the notification of Securities and Exchange Board of India (Mutual Funds) (Amendment) Regulations, 2014 dated May 6, 2014, the AMC should maintain a Net Worth of minimum Rs.50 crs. The Net Worth of Sahara Asset Management Company Private Ltd. as on March 31, 2019 was Rs.5.02 crs, which is below the threshold limit of Rs.50 crs and thereby the net worth criteria as required by the above regulations has not been complied with.
8.20 Previous year figures have been reclassified / regrouped wherever necessary
to conform to the current year’s classification. As per our attached report of even date For Chaturvedi & Partners For Sahara Asset Management Company Private Limited Chartered Accountants
(Firm’s Registration No. 307068E) O P Srivastava R M Joshi
Director Director
Sudhir Kaup Khozem Jabalpurwala
Khyati Shah Compliance Officer Fund Manager
(Partner)
Mem. No.117510 Vidya Manjrekar
Head – Operations & NAV Accounting
Place: Mumbai
Date: 19th July, 2019 For Sahara Mutual Fund
M R Siddiqui S P Srivastava
Trustee Trustee Place: Mumbai Date: 19th July, 2019
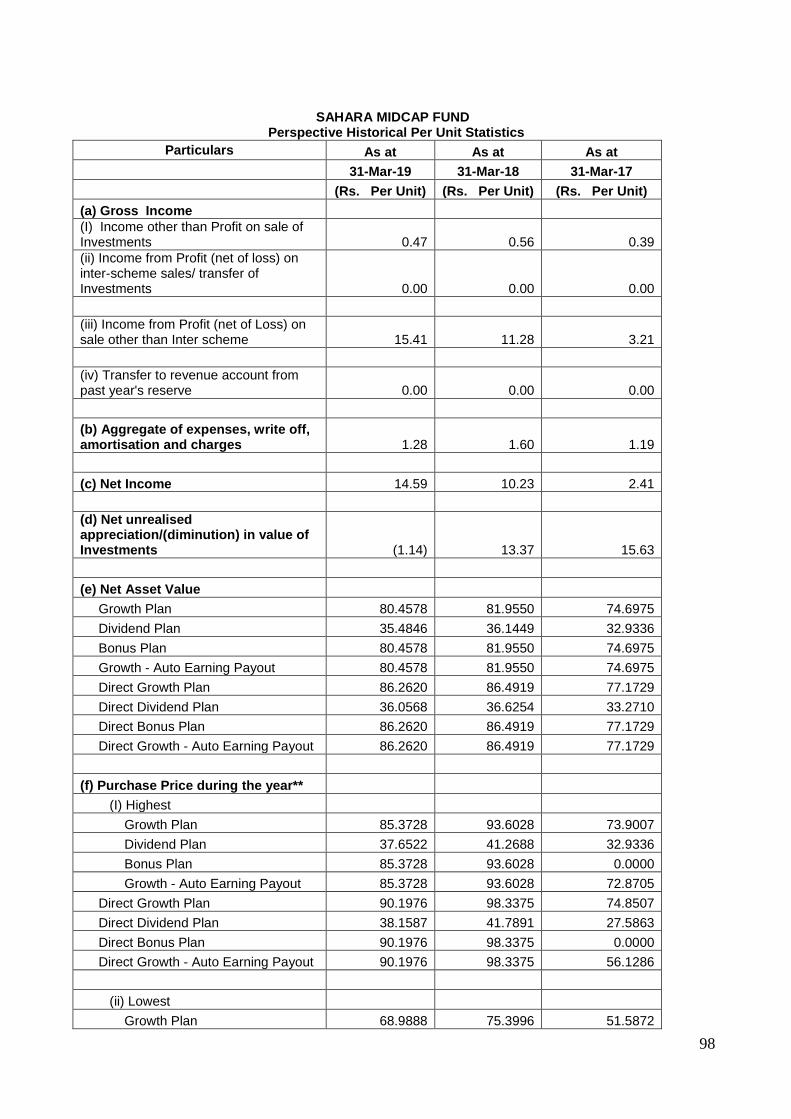
98
SAHARA MIDCAP FUND
Perspective Historical Per Unit Statistics
Particulars As at As at As at
31-Mar-19 31-Mar-18 31-Mar-17
(Rs. Per Unit) (Rs. Per Unit) (Rs. Per Unit)
(a) Gross Income
(I) Income other than Profit on sale of Investments 0.47 0.56 0.39
(ii) Income from Profit (net of loss) on inter-scheme sales/ transfer of Investments 0.00 0.00 0.00
(iii) Income from Profit (net of Loss) on sale other than Inter scheme 15.41 11.28 3.21
(iv) Transfer to revenue account from past year's reserve 0.00 0.00 0.00
(b) Aggregate of expenses, write off, amortisation and charges 1.28 1.60 1.19
(c) Net Income 14.59 10.23 2.41
(d) Net unrealised appreciation/(diminution) in value of Investments (1.14) 13.37 15.63
(e) Net Asset Value
Growth Plan 80.4578 81.9550 74.6975
Dividend Plan 35.4846 36.1449 32.9336
Bonus Plan 80.4578 81.9550 74.6975
Growth - Auto Earning Payout 80.4578 81.9550 74.6975
Direct Growth Plan 86.2620 86.4919 77.1729
Direct Dividend Plan 36.0568 36.6254 33.2710
Direct Bonus Plan 86.2620 86.4919 77.1729
Direct Growth - Auto Earning Payout 86.2620 86.4919 77.1729
(f) Purchase Price during the year**
(I) Highest
Growth Plan 85.3728 93.6028 73.9007
Dividend Plan 37.6522 41.2688 32.9336
Bonus Plan 85.3728 93.6028 0.0000
Growth - Auto Earning Payout 85.3728 93.6028 72.8705
Direct Growth Plan 90.1976 98.3375 74.8507
Direct Dividend Plan 38.1587 41.7891 27.5863
Direct Bonus Plan 90.1976 98.3375 0.0000
Direct Growth - Auto Earning Payout 90.1976 98.3375 56.1286
(ii) Lowest
Growth Plan 68.9888 75.3996 51.5872
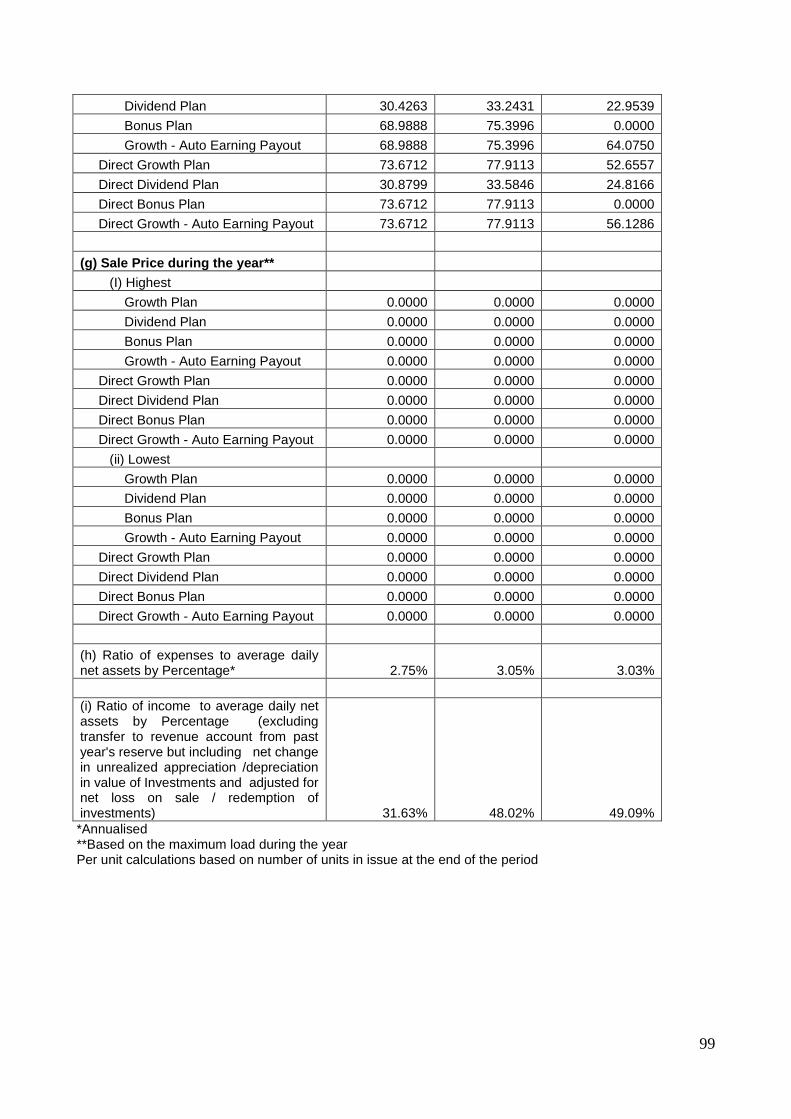
99
Dividend Plan 30.4263 33.2431 22.9539
Bonus Plan 68.9888 75.3996 0.0000
Growth - Auto Earning Payout 68.9888 75.3996 64.0750
Direct Growth Plan 73.6712 77.9113 52.6557
Direct Dividend Plan 30.8799 33.5846 24.8166
Direct Bonus Plan 73.6712 77.9113 0.0000
Direct Growth - Auto Earning Payout 73.6712 77.9113 56.1286
(g) Sale Price during the year**
(I) Highest
Growth Plan 0.0000 0.0000 0.0000
Dividend Plan 0.0000 0.0000 0.0000
Bonus Plan 0.0000 0.0000 0.0000
Growth - Auto Earning Payout 0.0000 0.0000 0.0000
Direct Growth Plan 0.0000 0.0000 0.0000
Direct Dividend Plan 0.0000 0.0000 0.0000
Direct Bonus Plan 0.0000 0.0000 0.0000
Direct Growth - Auto Earning Payout 0.0000 0.0000 0.0000
(ii) Lowest
Growth Plan 0.0000 0.0000 0.0000
Dividend Plan 0.0000 0.0000 0.0000
Bonus Plan 0.0000 0.0000 0.0000
Growth - Auto Earning Payout 0.0000 0.0000 0.0000
Direct Growth Plan 0.0000 0.0000 0.0000
Direct Dividend Plan 0.0000 0.0000 0.0000
Direct Bonus Plan 0.0000 0.0000 0.0000
Direct Growth - Auto Earning Payout 0.0000 0.0000 0.0000
(h) Ratio of expenses to average daily net assets by Percentage* 2.75% 3.05% 3.03%
(i) Ratio of income to average daily net assets by Percentage (excluding transfer to revenue account from past year's reserve but including net change in unrealized appreciation /depreciation in value of Investments and adjusted for net loss on sale / redemption of investments) 31.63% 48.02% 49.09%
*Annualised **Based on the maximum load during the year Per unit calculations based on number of units in issue at the end of the period
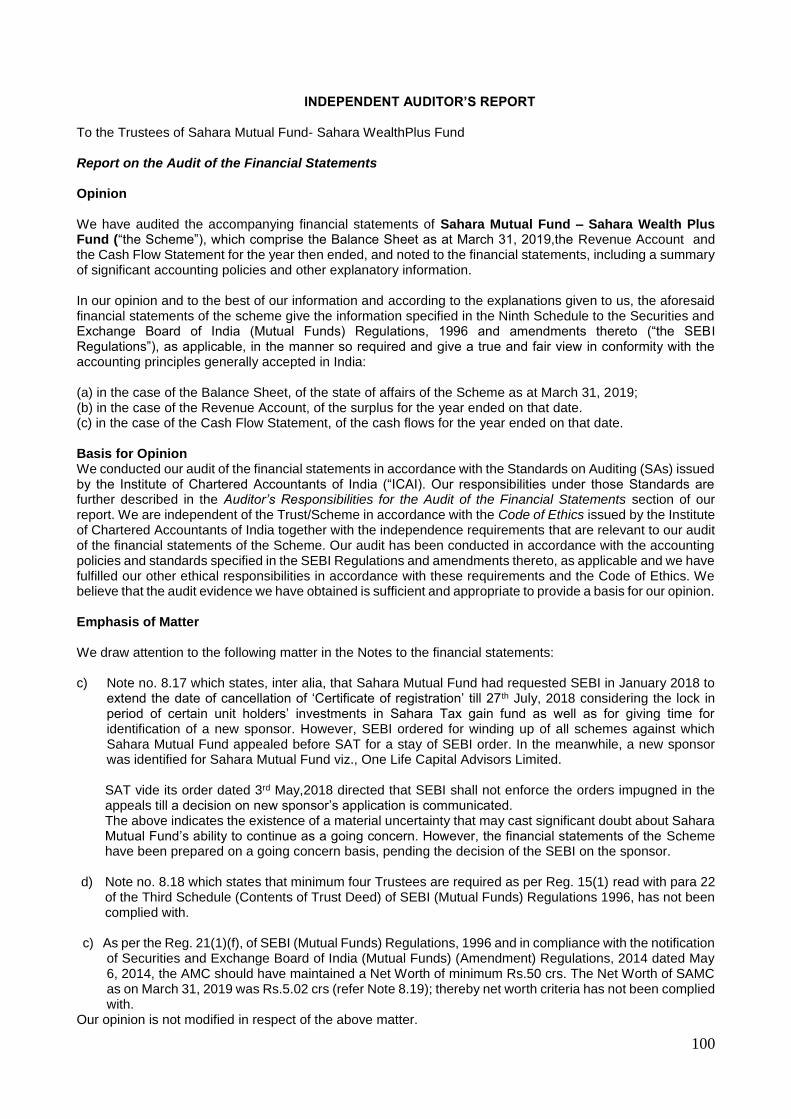
100
INDEPENDENT AUDITOR’S REPORT To the Trustees of Sahara Mutual Fund- Sahara WealthPlus Fund Report on the Audit of the Financial Statements Opinion We have audited the accompanying financial statements of Sahara Mutual Fund – Sahara Wealth Plus Fund (“the Scheme”), which comprise the Balance Sheet as at March 31, 2019,the Revenue Account and the Cash Flow Statement for the year then ended, and noted to the financial statements, including a summary of significant accounting policies and other explanatory information. In our opinion and to the best of our information and according to the explanations given to us, the aforesaid financial statements of the scheme give the information specified in the Ninth Schedule to the Securities and Exchange Board of India (Mutual Funds) Regulations, 1996 and amendments thereto (“the SEBI Regulations”), as applicable, in the manner so required and give a true and fair view in conformity with the accounting principles generally accepted in India: (a) in the case of the Balance Sheet, of the state of affairs of the Scheme as at March 31, 2019; (b) in the case of the Revenue Account, of the surplus for the year ended on that date. (c) in the case of the Cash Flow Statement, of the cash flows for the year ended on that date. Basis for Opinion We conducted our audit of the financial statements in accordance with the Standards on Auditing (SAs) issued by the Institute of Chartered Accountants of India (“ICAI). Our responsibilities under those Standards are further described in the Auditor’s Responsibilities for the Audit of the Financial Statements section of our report. We are independent of the Trust/Scheme in accordance with the Code of Ethics issued by the Institute of Chartered Accountants of India together with the independence requirements that are relevant to our audit of the financial statements of the Scheme. Our audit has been conducted in accordance with the accounting policies and standards specified in the SEBI Regulations and amendments thereto, as applicable and we have fulfilled our other ethical responsibilities in accordance with these requirements and the Code of Ethics. We believe that the audit evidence we have obtained is sufficient and appropriate to provide a basis for our opinion. Emphasis of Matter We draw attention to the following matter in the Notes to the financial statements: c) Note no. 8.17 which states, inter alia, that Sahara Mutual Fund had requested SEBI in January 2018 to
extend the date of cancellation of ‘Certificate of registration’ till 27th July, 2018 considering the lock in period of certain unit holders’ investments in Sahara Tax gain fund as well as for giving time for identification of a new sponsor. However, SEBI ordered for winding up of all schemes against which Sahara Mutual Fund appealed before SAT for a stay of SEBI order. In the meanwhile, a new sponsor was identified for Sahara Mutual Fund viz., One Life Capital Advisors Limited.
SAT vide its order dated 3rd May,2018 directed that SEBI shall not enforce the orders impugned in the appeals till a decision on new sponsor’s application is communicated. The above indicates the existence of a material uncertainty that may cast significant doubt about Sahara Mutual Fund’s ability to continue as a going concern. However, the financial statements of the Scheme have been prepared on a going concern basis, pending the decision of the SEBI on the sponsor.
d) Note no. 8.18 which states that minimum four Trustees are required as per Reg. 15(1) read with para 22
of the Third Schedule (Contents of Trust Deed) of SEBI (Mutual Funds) Regulations 1996, has not been complied with.
c) As per the Reg. 21(1)(f), of SEBI (Mutual Funds) Regulations, 1996 and in compliance with the notification of Securities and Exchange Board of India (Mutual Funds) (Amendment) Regulations, 2014 dated May 6, 2014, the AMC should have maintained a Net Worth of minimum Rs.50 crs. The Net Worth of SAMC as on March 31, 2019 was Rs.5.02 crs (refer Note 8.19); thereby net worth criteria has not been complied with.
Our opinion is not modified in respect of the above matter.

101
Responsibilities of the Management and Those Charged with Governance for the Financial Statements The Trustees of Sahara Mutual Fund and the Board of Directors of Sahara Asset Management Company Private Limited (the “Directors”) are responsible for the preparation of these financial statements that give a true and fair view of the financial position and financial performance of the Scheme in accordance with the accounting policies and standards specified in the SEBI Regulations and amendments thereto, as applicable. This responsibility also includes maintenance of adequate accounting records for safeguarding the assets of the Scheme and for preventing and detecting frauds and other irregularities; selection and application of appropriate accounting policies; making judgements and estimates that are reasonable and prudent; and design, implementation and maintenance of adequate internal financial controls, that were operating effectively for ensuring the accuracy and completeness of the accounting records, relevant to the preparation and presentation of the financial statements that give a true and fair view and are free from material misstatement, whether due to fraud or error. In preparing the financial statements, management is responsible for assessing the Scheme’s ability to continue as a going concern, disclosing , as applicable, matters related to going concern and using the going concern basis of accounting unless management either intends to liquidate the Scheme or to cease operations or has no realistic alternative but to do so. Those charged with Governance are also responsible for overseeing the Scheme’s financial reporting process. Auditor’s Responsibility for the Audit of the Financial Statements Our objectives are to obtain reasonable assurance about whether the standalone financial statements as a whole are free from material misstatement, whether due to fraud or error, and to issue an auditor’s report that includes our opinion. Reasonable assurance is a high level of assurance, but is not a guarantee that an audit conducted in accordance with SAs will always detect a material misstatement when it exists. Misstatements can arise from fraud or error and are considered material if, individually or in the aggregate, they could reasonably be expected to influence the economic decisions of users taken on the basis of these standalone financial statements. As part of an audit in accordance with SAs, we exercise professional judgment and maintain professional skepticism throughout the audit. We also: • Identify and assess the risks of material misstatement of the standalone financial statements, whether due to fraud or error, design and perform audit procedures responsive to those risks, and obtain audit evidence that is sufficient and appropriate to provide a basis for our opinion. The risk of not detecting a material misstatement resulting from fraud is higher than for one resulting from error, as fraud may involve collusion, forgery, intentional omissions, misrepresentations, or the override of internal control. • Obtain an understanding of internal financial controls relevant to the audit in order to design audit procedures that are appropriate in the circumstances, but not for the purpose of expressing an opinion on effectiveness of the Company’s internal financial controls. • Evaluate the appropriateness of accounting policies used and the reasonableness of accounting estimates and related disclosures made by management. • Conclude on the appropriateness of management’s use of the going concern basis of accounting and, based on the audit evidence obtained, whether a material uncertainty exists related to events or conditions that may cast significant doubt on the ability of the Company to continue as a going concern. If we conclude that a material uncertainty exists, we are required to draw attention in our auditor’s report to the related disclosures in the standalone financial statements or, if such disclosures are inadequate, to modify our opinion. Our conclusions are based on the audit evidence obtained up to the date of our auditor’s report. However, future events or conditions may cause the Company to cease to continue as a going concern. • Evaluate the overall presentation, structure and content of the standalone financial statements, including the disclosures, and whether the standalone financial statements represent the underlying transactions and events in a manner that achieves fair presentation.

102
We communicate with those charged with governance regarding, among other matters, the planned scope and timing of the audit and significant audit findings, including any significant deficiencies in internal control that we identify during our audit. We also provide those charged with governance with a statement that we have complied with relevant ethical requirements regarding independence, and to communicate with them all relationships and other matters that may reasonably be thought to bear on our independence, and where applicable, related safeguards.
Report on Other Legal and Regulatory Requirements
As required by the Securities and Exchange Board of India (Mutual Funds) Regulations, 1996 and amendments thereto, as applicable, we report that: a) We have sought and obtained all the information and explanations, which to the best of our knowledge and belief were necessary for the purpose of our audit. b) The Balance Sheet and Revenue Account dealt with by this Report are in agreement with the books of account of the Scheme. c) The statement of account has been prepared in accordance with the accounting policies and standards specified in the SEBI Regulations and amendments thereto, as applicable. d) We have reviewed the Valuation Policy being followed for the schemes of Sahara Mutual Fund. The Valuation Policy implemented for the Scheme is in line with the SEBI guidelines issued in this regard.
For Chaturvedi & Partners. Chartered Accountants (Firm’s Registration No. 307068E) Khyati Shah (Partner) Mem. No. 117510 Place: Mumbai Date: July 19, 2019
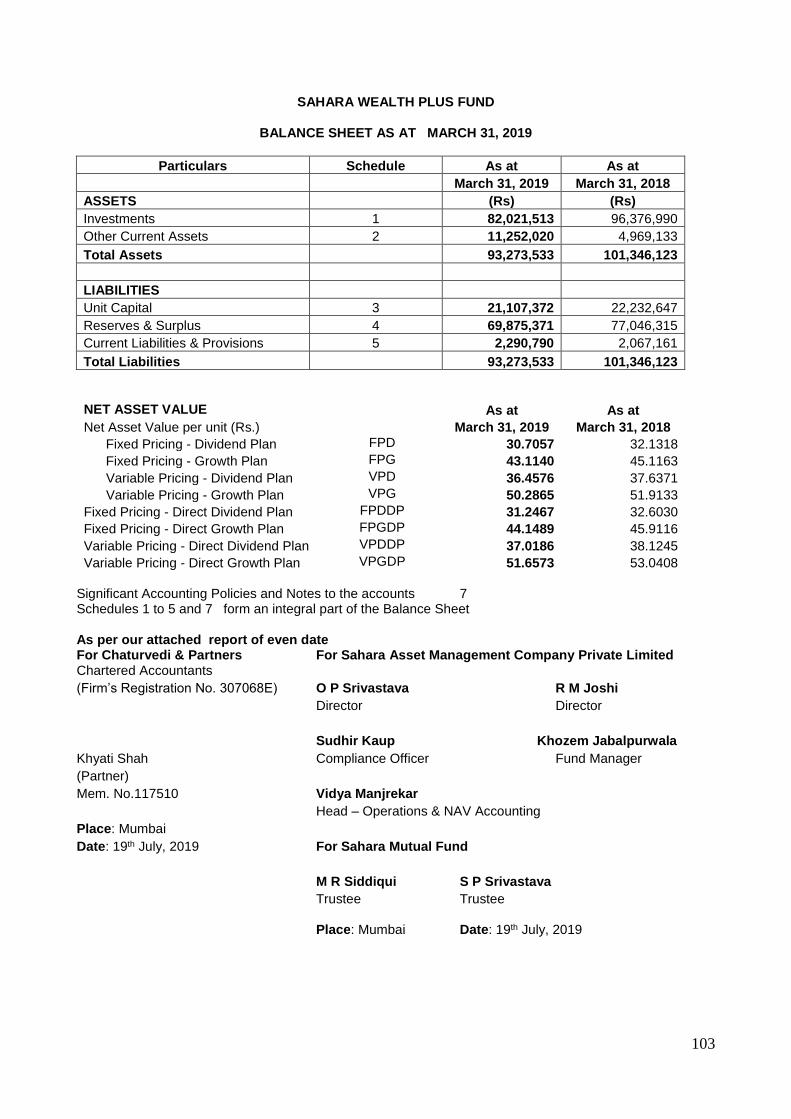
103
SAHARA WEALTH PLUS FUND
BALANCE SHEET AS AT MARCH 31, 2019
Particulars Schedule As at As at
March 31, 2019 March 31, 2018
ASSETS (Rs) (Rs)
Investments 1 82,021,513 96,376,990
Other Current Assets 2 11,252,020 4,969,133
Total Assets 93,273,533 101,346,123
LIABILITIES
Unit Capital 3 21,107,372 22,232,647
Reserves & Surplus 4 69,875,371 77,046,315
Current Liabilities & Provisions 5 2,290,790 2,067,161
Total Liabilities 93,273,533 101,346,123
NET ASSET VALUE As at As at
Net Asset Value per unit (Rs.) March 31, 2019 March 31, 2018
Fixed Pricing - Dividend Plan FPD 30.7057 32.1318
Fixed Pricing - Growth Plan FPG 43.1140 45.1163
Variable Pricing - Dividend Plan VPD 36.4576 37.6371
Variable Pricing - Growth Plan VPG 50.2865 51.9133
Fixed Pricing - Direct Dividend Plan FPDDP 31.2467 32.6030
Fixed Pricing - Direct Growth Plan FPGDP 44.1489 45.9116
Variable Pricing - Direct Dividend Plan VPDDP 37.0186 38.1245
Variable Pricing - Direct Growth Plan VPGDP 51.6573 53.0408 Significant Accounting Policies and Notes to the accounts 7 Schedules 1 to 5 and 7 form an integral part of the Balance Sheet
As per our attached report of even date For Chaturvedi & Partners For Sahara Asset Management Company Private Limited Chartered Accountants
(Firm’s Registration No. 307068E) O P Srivastava R M Joshi
Director Director
Sudhir Kaup Khozem Jabalpurwala
Khyati Shah Compliance Officer Fund Manager
(Partner)
Mem. No.117510 Vidya Manjrekar
Head – Operations & NAV Accounting
Place: Mumbai
Date: 19th July, 2019 For Sahara Mutual Fund
M R Siddiqui S P Srivastava
Trustee Trustee Place: Mumbai Date: 19th July, 2019
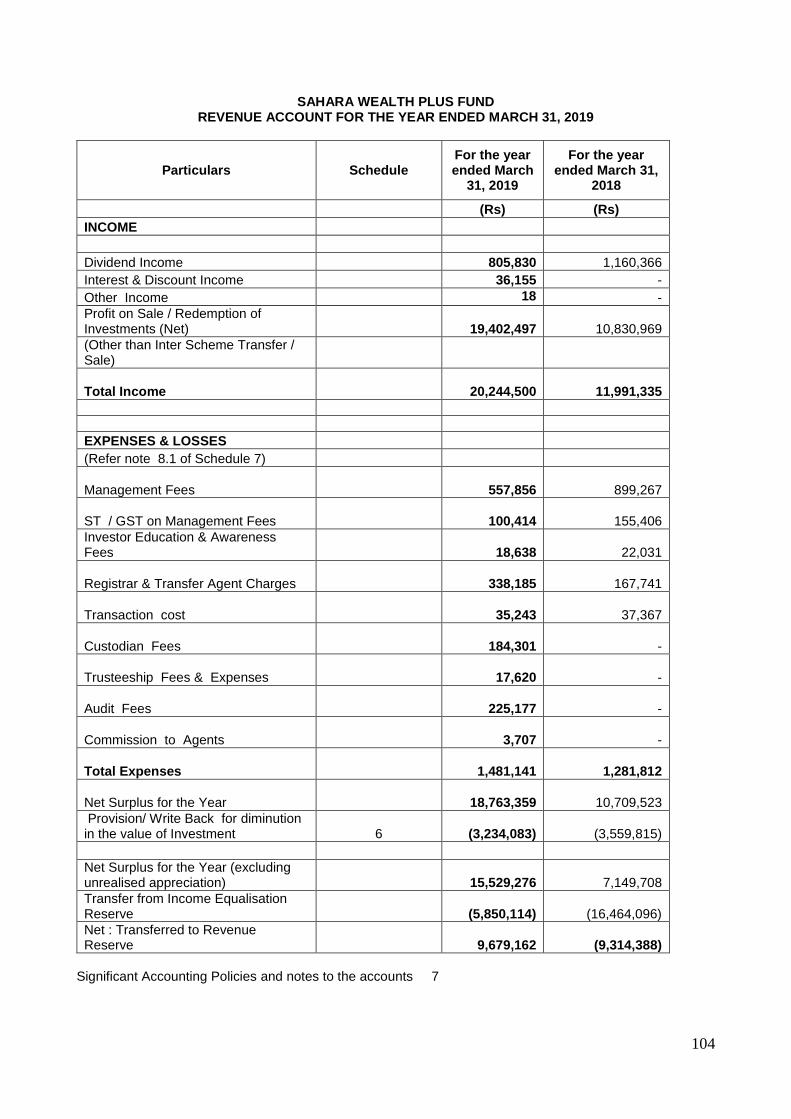
104
SAHARA WEALTH PLUS FUND REVENUE ACCOUNT FOR THE YEAR ENDED MARCH 31, 2019
Significant Accounting Policies and notes to the accounts 7
Particulars Schedule For the year ended March
31, 2019
For the year ended March 31,
2018
(Rs) (Rs)
INCOME
Dividend Income 805,830 1,160,366
Interest & Discount Income 36,155 -
Other Income 18 -
Profit on Sale / Redemption of Investments (Net)
19,402,497
10,830,969
(Other than Inter Scheme Transfer / Sale)
Total Income
20,244,500
11,991,335
EXPENSES & LOSSES
(Refer note 8.1 of Schedule 7)
Management Fees
557,856
899,267
ST / GST on Management Fees
100,414
155,406
Investor Education & Awareness Fees
18,638
22,031
Registrar & Transfer Agent Charges
338,185
167,741
Transaction cost
35,243
37,367
Custodian Fees
184,301 -
Trusteeship Fees & Expenses
17,620 -
Audit Fees
225,177 -
Commission to Agents
3,707 -
Total Expenses
1,481,141
1,281,812
Net Surplus for the Year
18,763,359
10,709,523
Provision/ Write Back for diminution in the value of Investment 6
(3,234,083)
(3,559,815)
Net Surplus for the Year (excluding unrealised appreciation)
15,529,276
7,149,708
Transfer from Income Equalisation Reserve
(5,850,114)
(16,464,096)
Net : Transferred to Revenue Reserve
9,679,162
(9,314,388)

105
Schedules 6 to 7 form an integral part of the Revenue Account
As per our attached report of even date For Chaturvedi & Partners For Sahara Asset Management Company Private Limited Chartered Accountants
(Firm’s Registration No. 307068E) O P Srivastava R M Joshi
Director Director
Sudhir Kaup Khozem Jabalpurwala
Khyati Shah Compliance Officer Fund Manager
(Partner)
Mem. No.117510 Vidya Manjrekar
Head – Operations & NAV Accounting
Place: Mumbai
Date: 19th July, 2019 For Sahara Mutual Fund
M R Siddiqui S P Srivastava
Trustee Trustee Place: Mumbai Date: 19th July, 2019
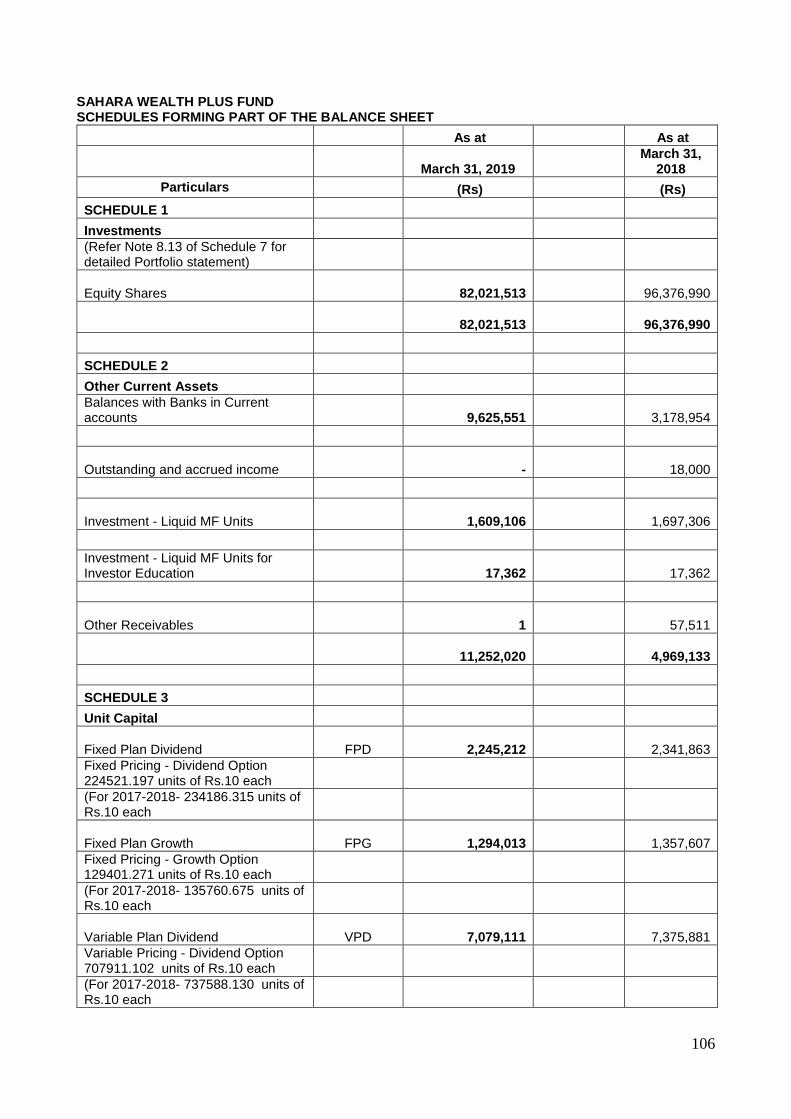
106
SAHARA WEALTH PLUS FUND SCHEDULES FORMING PART OF THE BALANCE SHEET
As at As at
March 31, 2019 March 31,
2018
Particulars (Rs) (Rs)
SCHEDULE 1
Investments
(Refer Note 8.13 of Schedule 7 for detailed Portfolio statement)
Equity Shares
82,021,513
96,376,990
82,021,513
96,376,990
SCHEDULE 2
Other Current Assets
Balances with Banks in Current accounts
9,625,551
3,178,954
Outstanding and accrued income -
18,000
Investment - Liquid MF Units
1,609,106
1,697,306
Investment - Liquid MF Units for Investor Education
17,362
17,362
Other Receivables
1
57,511
11,252,020
4,969,133
SCHEDULE 3
Unit Capital
Fixed Plan Dividend FPD
2,245,212
2,341,863
Fixed Pricing - Dividend Option 224521.197 units of Rs.10 each
(For 2017-2018- 234186.315 units of Rs.10 each
Fixed Plan Growth FPG
1,294,013
1,357,607
Fixed Pricing - Growth Option 129401.271 units of Rs.10 each
(For 2017-2018- 135760.675 units of Rs.10 each
Variable Plan Dividend VPD
7,079,111
7,375,881
Variable Pricing - Dividend Option 707911.102 units of Rs.10 each
(For 2017-2018- 737588.130 units of Rs.10 each
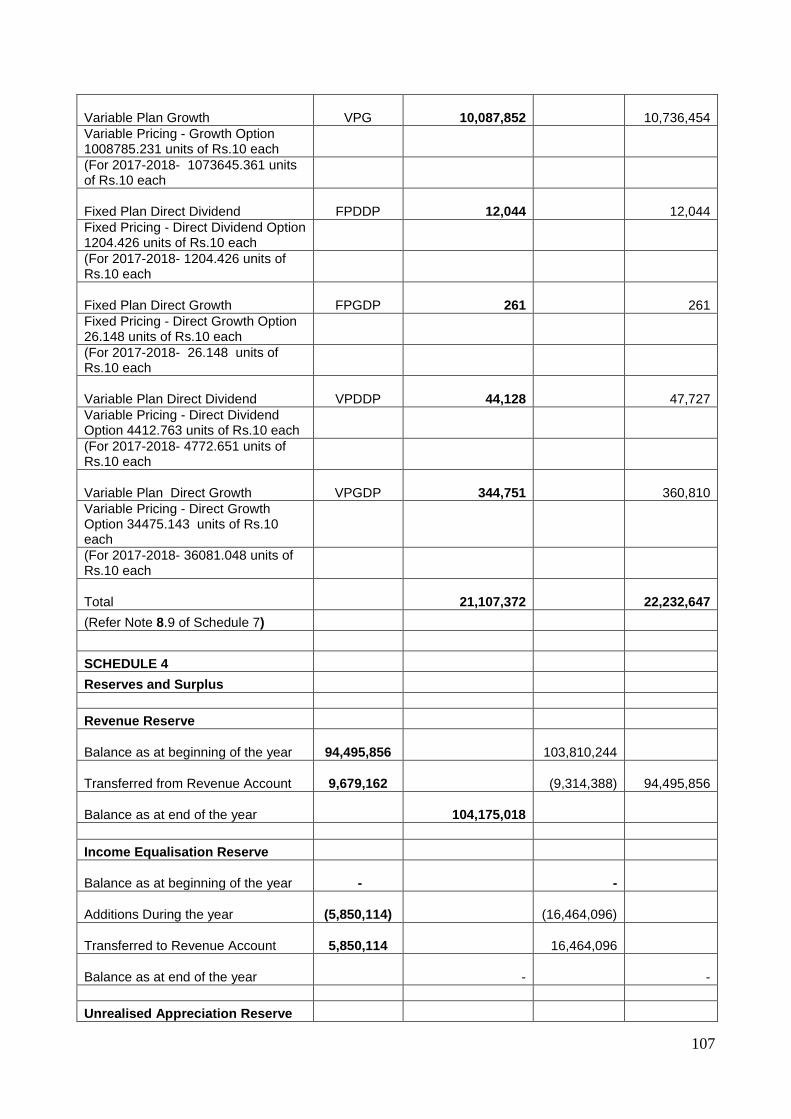
107
Variable Plan Growth VPG
10,087,852
10,736,454
Variable Pricing - Growth Option 1008785.231 units of Rs.10 each
(For 2017-2018- 1073645.361 units of Rs.10 each
Fixed Plan Direct Dividend FPDDP
12,044
12,044
Fixed Pricing - Direct Dividend Option 1204.426 units of Rs.10 each
(For 2017-2018- 1204.426 units of Rs.10 each
Fixed Plan Direct Growth FPGDP
261
261
Fixed Pricing - Direct Growth Option 26.148 units of Rs.10 each
(For 2017-2018- 26.148 units of Rs.10 each
Variable Plan Direct Dividend VPDDP
44,128
47,727
Variable Pricing - Direct Dividend Option 4412.763 units of Rs.10 each
(For 2017-2018- 4772.651 units of Rs.10 each
Variable Plan Direct Growth VPGDP
344,751
360,810
Variable Pricing - Direct Growth Option 34475.143 units of Rs.10 each
(For 2017-2018- 36081.048 units of Rs.10 each
Total
21,107,372
22,232,647
(Refer Note 8.9 of Schedule 7)
SCHEDULE 4
Reserves and Surplus
Revenue Reserve
Balance as at beginning of the year
94,495,856
103,810,244
Transferred from Revenue Account
9,679,162
(9,314,388)
94,495,856
Balance as at end of the year
104,175,018
Income Equalisation Reserve
Balance as at beginning of the year -
-
Additions During the year
(5,850,114)
(16,464,096)
Transferred to Revenue Account
5,850,114
16,464,096
Balance as at end of the year -
-
Unrealised Appreciation Reserve

108
Balance as at beginning of the year
24,198,501
24,696,876
Additions During the year
(18,797,966)
(498,375)
Balance as at end of the year
5,400,535
24,198,501
Unit Premium Reserve
Balance as at beginning of the year
(41,648,042)
(44,125,040)
Additions During the year
1,947,860
2,476,998
Balance as at end of the year
(39,700,182)
(41,648,042)
69,875,371
77,046,315
SCHEDULE 5
Current Liabilities and Provisions
Sundry Creditors
356,369
12,292
Management Fees Payable 1737
15,809
ST / GST on Management Fees
313
2,846
Payable on redemption of units
989,778
1,055,677
STT Payable
2
5
Payable - Fee on Investor Education
43,810
36,098
Distribution Payable
898,781
944,434
2,290,790
2,067,161
SAHARA WEALTH PLUS FUND SCHEDULES FORMING PART OF REVENUE ACCOUNT
For the year
ended For the year
ended
March 31, 2019 March 31,
2018
Particulars (Rs) (Rs)
SCHEDULE 6
Provision/ Write Back for diminution in the value of Investment
At the beginning of the year
(5,482,633)
(1,922,818)
At the end of the year
(8,716,716)
(5,482,633)
(3,234,083)
(3,559,815)
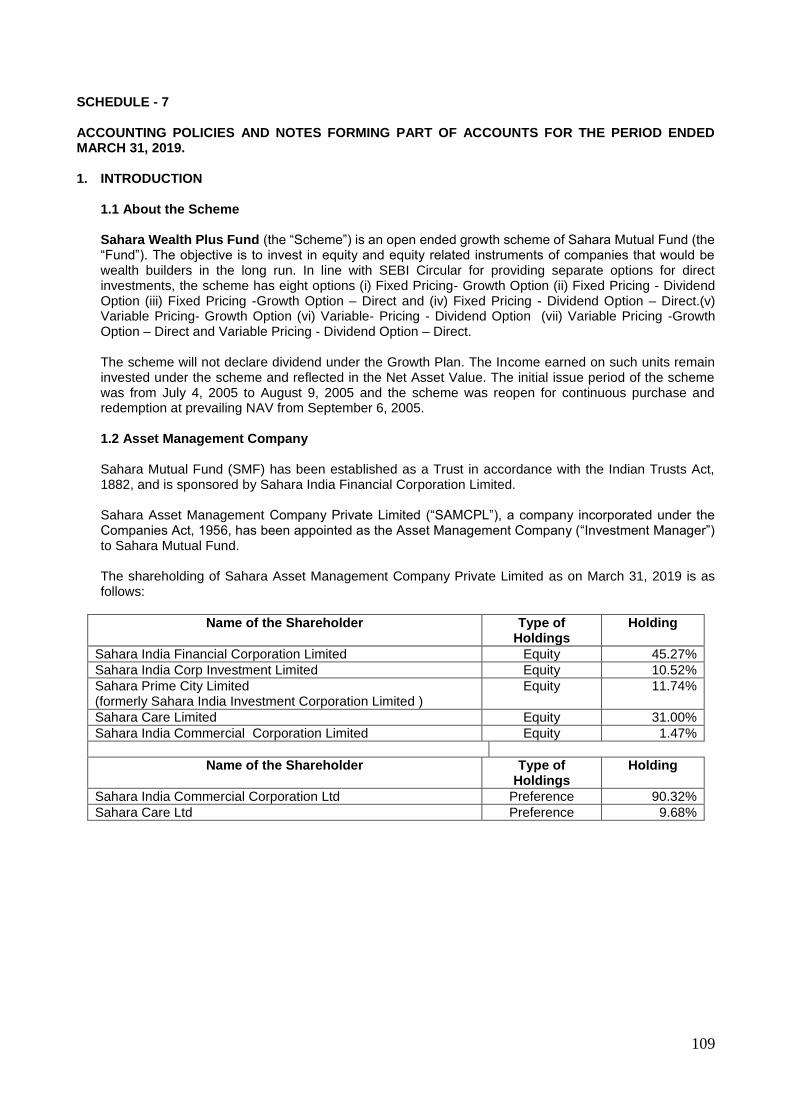
109
SCHEDULE - 7
ACCOUNTING POLICIES AND NOTES FORMING PART OF ACCOUNTS FOR THE PERIOD ENDED MARCH 31, 2019. 1. INTRODUCTION
1.1 About the Scheme Sahara Wealth Plus Fund (the “Scheme”) is an open ended growth scheme of Sahara Mutual Fund (the “Fund”). The objective is to invest in equity and equity related instruments of companies that would be wealth builders in the long run. In line with SEBI Circular for providing separate options for direct investments, the scheme has eight options (i) Fixed Pricing- Growth Option (ii) Fixed Pricing - Dividend Option (iii) Fixed Pricing -Growth Option – Direct and (iv) Fixed Pricing - Dividend Option – Direct.(v) Variable Pricing- Growth Option (vi) Variable- Pricing - Dividend Option (vii) Variable Pricing -Growth Option – Direct and Variable Pricing - Dividend Option – Direct. The scheme will not declare dividend under the Growth Plan. The Income earned on such units remain invested under the scheme and reflected in the Net Asset Value. The initial issue period of the scheme was from July 4, 2005 to August 9, 2005 and the scheme was reopen for continuous purchase and redemption at prevailing NAV from September 6, 2005.
1.2 Asset Management Company
Sahara Mutual Fund (SMF) has been established as a Trust in accordance with the Indian Trusts Act, 1882, and is sponsored by Sahara India Financial Corporation Limited.
Sahara Asset Management Company Private Limited (“SAMCPL”), a company incorporated under the Companies Act, 1956, has been appointed as the Asset Management Company (“Investment Manager”) to Sahara Mutual Fund.
The shareholding of Sahara Asset Management Company Private Limited as on March 31, 2019 is as follows:
Name of the Shareholder Type of Holdings
Holding
Sahara India Financial Corporation Limited Equity 45.27%
Sahara India Corp Investment Limited Equity 10.52%
Sahara Prime City Limited (formerly Sahara India Investment Corporation Limited )
Equity 11.74%
Sahara Care Limited Equity 31.00%
Sahara India Commercial Corporation Limited Equity 1.47%
Name of the Shareholder Type of Holdings
Holding
Sahara India Commercial Corporation Ltd Preference 90.32%
Sahara Care Ltd Preference 9.68%
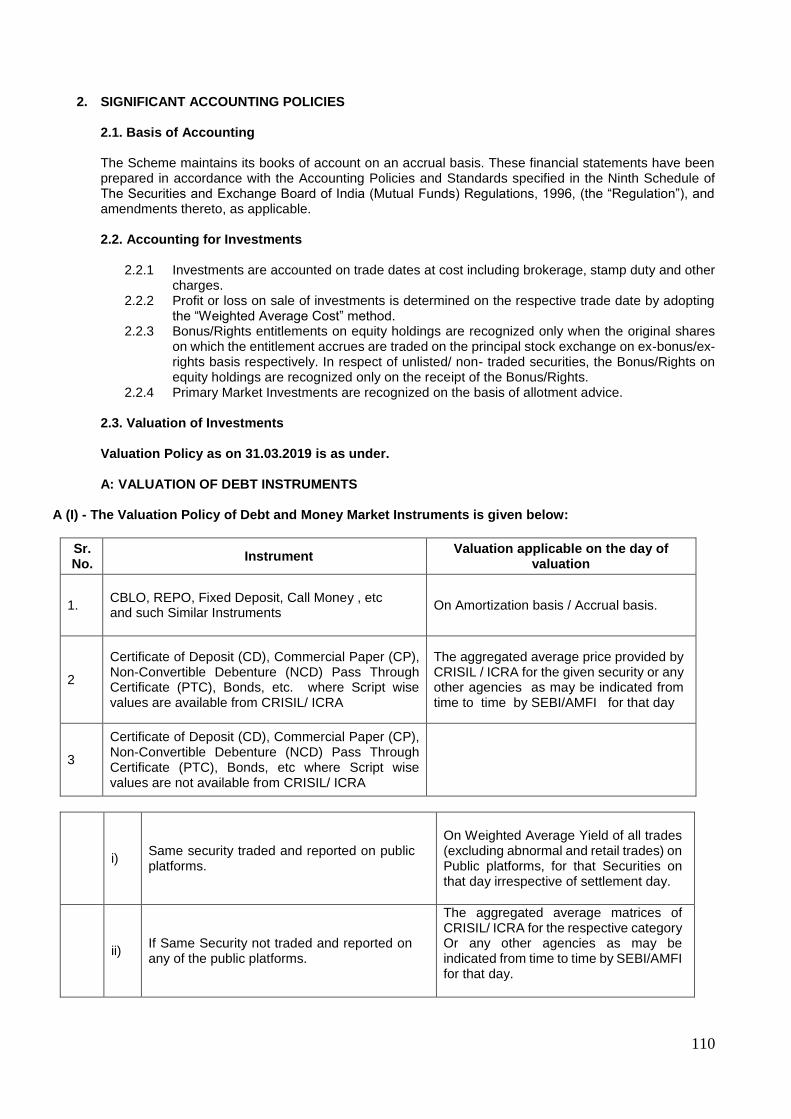
110
2. SIGNIFICANT ACCOUNTING POLICIES
2.1. Basis of Accounting The Scheme maintains its books of account on an accrual basis. These financial statements have been prepared in accordance with the Accounting Policies and Standards specified in the Ninth Schedule of The Securities and Exchange Board of India (Mutual Funds) Regulations, 1996, (the “Regulation”), and amendments thereto, as applicable. 2.2. Accounting for Investments
2.2.1 Investments are accounted on trade dates at cost including brokerage, stamp duty and other
charges. 2.2.2 Profit or loss on sale of investments is determined on the respective trade date by adopting
the “Weighted Average Cost” method. 2.2.3 Bonus/Rights entitlements on equity holdings are recognized only when the original shares
on which the entitlement accrues are traded on the principal stock exchange on ex-bonus/ex-rights basis respectively. In respect of unlisted/ non- traded securities, the Bonus/Rights on equity holdings are recognized only on the receipt of the Bonus/Rights.
2.2.4 Primary Market Investments are recognized on the basis of allotment advice.
2.3. Valuation of Investments Valuation Policy as on 31.03.2019 is as under.
A: VALUATION OF DEBT INSTRUMENTS
A (I) - The Valuation Policy of Debt and Money Market Instruments is given below:
Sr. No.
Instrument Valuation applicable on the day of
valuation
1.
CBLO, REPO, Fixed Deposit, Call Money , etc and such Similar Instruments
On Amortization basis / Accrual basis.
2
Certificate of Deposit (CD), Commercial Paper (CP), Non-Convertible Debenture (NCD) Pass Through Certificate (PTC), Bonds, etc. where Script wise values are available from CRISIL/ ICRA
The aggregated average price provided by CRISIL / ICRA for the given security or any other agencies as may be indicated from time to time by SEBI/AMFI for that day
3
Certificate of Deposit (CD), Commercial Paper (CP), Non-Convertible Debenture (NCD) Pass Through Certificate (PTC), Bonds, etc where Script wise values are not available from CRISIL/ ICRA
i) Same security traded and reported on public platforms.
On Weighted Average Yield of all trades (excluding abnormal and retail trades) on Public platforms, for that Securities on that day irrespective of settlement day.
ii) If Same Security not traded and reported on any of the public platforms.
The aggregated average matrices of CRISIL/ ICRA for the respective category Or any other agencies as may be indicated from time to time by SEBI/AMFI for that day.
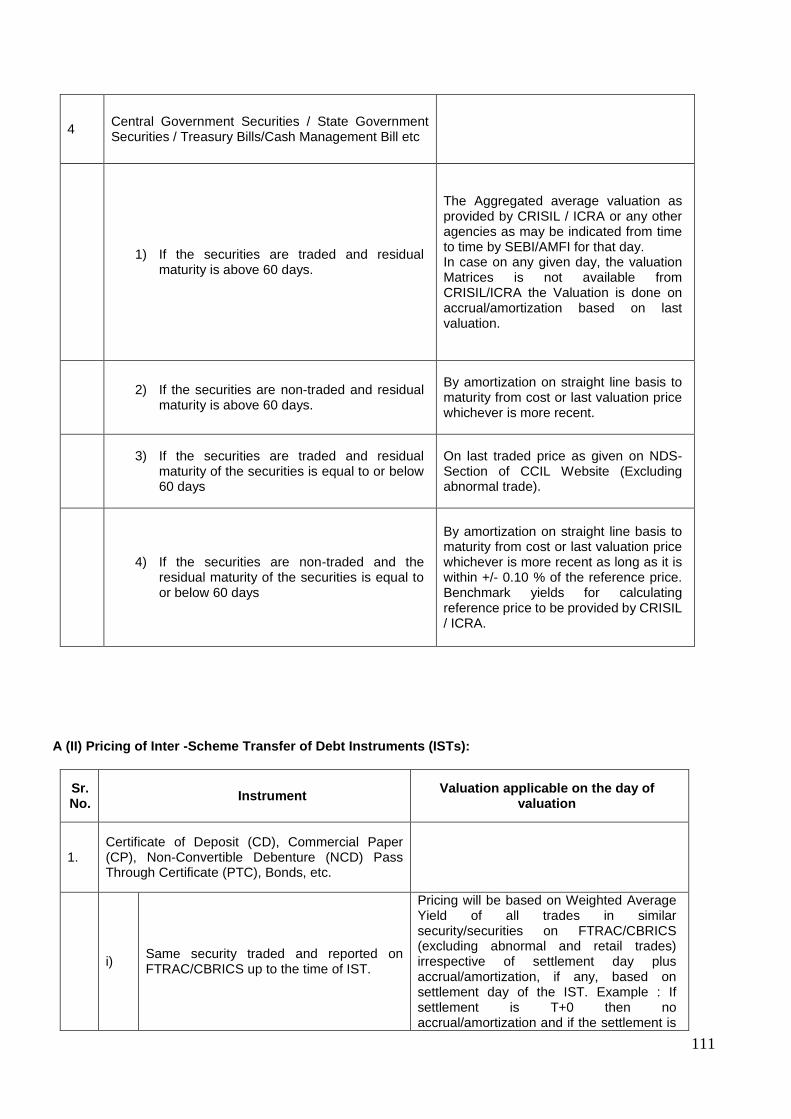
111
A (II) Pricing of Inter -Scheme Transfer of Debt Instruments (ISTs):
Sr. No.
Instrument Valuation applicable on the day of
valuation
1. Certificate of Deposit (CD), Commercial Paper (CP), Non-Convertible Debenture (NCD) Pass Through Certificate (PTC), Bonds, etc.
i) Same security traded and reported on FTRAC/CBRICS up to the time of IST.
Pricing will be based on Weighted Average Yield of all trades in similar security/securities on FTRAC/CBRICS (excluding abnormal and retail trades) irrespective of settlement day plus accrual/amortization, if any, based on settlement day of the IST. Example : If settlement is T+0 then no accrual/amortization and if the settlement is
4 Central Government Securities / State Government Securities / Treasury Bills/Cash Management Bill etc
1) If the securities are traded and residual
maturity is above 60 days.
The Aggregated average valuation as provided by CRISIL / ICRA or any other agencies as may be indicated from time to time by SEBI/AMFI for that day. In case on any given day, the valuation Matrices is not available from CRISIL/ICRA the Valuation is done on accrual/amortization based on last valuation.
2) If the securities are non-traded and residual
maturity is above 60 days.
By amortization on straight line basis to maturity from cost or last valuation price whichever is more recent.
3) If the securities are traded and residual
maturity of the securities is equal to or below 60 days
On last traded price as given on NDS-Section of CCIL Website (Excluding abnormal trade).
4) If the securities are non-traded and the
residual maturity of the securities is equal to or below 60 days
By amortization on straight line basis to maturity from cost or last valuation price whichever is more recent as long as it is within +/- 0.10 % of the reference price. Benchmark yields for calculating reference price to be provided by CRISIL / ICRA.

112
other than T+0, then appropriate accrual/amortization
ii) If Same security is not traded but similar Security/securities are traded and reported up to the time of IST on FTRAC/CBRICS
Pricing will be based on Weighted Average Yield of all trades in similar security/securities on FTRAC/CBRICS (excluding abnormal and retail trades) irrespective of settlement day plus accrual/amortization, if any, based on settlement day of the IST. Example : If settlement is T+0 then no accrual/amortization and if the settlement is other than T+0, then appropriate accrual/amortization
iii) If Same or similar Security/securities are not traded and reported up to the time of IST on FTRAC/CBRICS
Previous end of the day valuation plus accrual, if any, based on settlement day of the IST is taken. Example: if settlement is T+0 then no accrual/amortization and if the settlement is other than T+0 then appropriate accrual/amortization.
2. Central Government Securities / State Government Securities / Treasury Bills/ Cash Management Bill etc
i) Same security traded and reported on NDS-OM section of CCIL website.
On last traded price as given on NDS-Section of CCIL Website (Excluding abnormal trade).
ii) Same security not traded and reported on NDS-OM section of CCIL website
Previous end of the day valuation price plus accrual/amortization is taken
Similar Security: Similar security here shall mean those securities which are same nature [Commercial Paper (CP), Certificate of Deposit (CD), Non-Convertible Debentures (NCD), etc ] of different issuers having same or equivalent credit rating for Similar maturity profile (For both Short term rating and Long term rating), and falling in same “Maturity Bucket” as defined below. Further the instruments Commercial Paper (CP), Bonds and Non-Convertible Debentures (NCDs) etc are categorized into following sub-categories:— 1) NBFC 2) Real Estate, 3) PTC 4) Others Maturity Bucket:
For Debt Security having remaining maturity up to 91 days
Maturity date of securities falling between Time Bucket
1st and 7th of the month 1-7 of the same month
8th and 15th of the month 8-15 of the same month
16th and 23rd of the month 16-23 of the same month
24th to end of the month 24- end of the month
For Debt Securities having remaining maturities more than 91 days “Time Bucket” for maturity profile of “Similar Securities” is same calendar month of that year.
113
A (III) Notes:
1. For the purpose of Valuation of securities and for Inter Scheme Transfer, Weighted average of all trades of 5crs and above, excluding abnormal trades and retail trades is taken. Since retail trades are of small value and generally may deviate materially from the yield at which the market lots in WDM is traded, it would be appropriate to exclude the retail trades for the more realistic valuation of the security.
2. Abnormal Trade is defined as those transaction/s which is/are over +/- 250 Basis Point compared to the previous day valuation yield of the security in question For the Valuation/Inter-scheme transfer, the available trades of various public platform is considered where the face value of trade per transaction is Rs. 5 crs and above. If in any given day in same/ similar security, the value of total trade is less than minimum market lot of 5 Crs, the same is ignored for the valuation purpose.
3. CRISIL and ICRA provide the valuation matrices for various maturity buckets. Script wise value for various debt instruments are also provided by CRISIL and ICRA. Trades are also reported and settled on various public platforms.
4. Public platform for the purpose of valuation of security shall mean FIMMDA managed FTRAC, NSE, BSE, (except NSER- NSE retail and BSER- BSE Retail), RBI managed NDS-OM or any other Public platform for Debt market launched from time to time. Market trades from different Platforms are usually collected by BILAV Information LLP, which may be used for the purpose of Valuation of traded security for which Script wise values are not available from CRISIL/ICRA.
5. The data on yield and prices are generally provided up to 4 decimal points which shall be considered
and these prices are considered on respective face value of the instruments for arriving at valuation.
6. For the valuation of traded securities where Script wise values are not available by CRISIL/ICRA, price derived from the corresponding Weighted Average yield of all available trades excluding abnormal and retail trades on any public platform for the same security on T+1 settlement basis is taken.
In case, the Bilav file is not received by 7:30 pm and script wise values are not available then FIMMDA managed FTRAC platform and NDS OM section of CCIL website may be used for the calculation of weighted average yield of traded security.
7. For non traded securities where Script wise values are not available, the valuation is done on the price derived from the corresponding the aggregated yield matrices for the respective category as provided by CRISIL/ICRA on T+1 settlement basis.
8. For Government Securities, SDL, T-Bills, Cash Management Bill etc, the valuation is done on
aggregated Script wise pricing as provided by CRISL/ICRA and as applicable for that day. In the absence of Script wise values the valuation is based on aggregated matrices if available from CRISIL/ICRA on T+1 settlement and as applicable for that day.
9. In case the valuation matrices/Script wise value is available either from CRISIL/ICRA up to a
reasonable time limit, the same is considered for arriving at valuation.
10. In respect of on any day neither the Script wise value nor the valuation Matrices is available from CRISIL/ICRA within the reasonable time limit, the Valuation is done on the basis of accrual/amortization based on the last valuation.
B: VALUATION OF EQUITY INSTRUMENTS
1. Traded Equity Securities When an equity security is not traded on any Stock Exchange on a particular valuation day, the value at which it was traded on the selected Stock Exchange, as the case may be, on the earliest previous day is used provided such date is not more than thirty days prior to valuation date.
114
2. Thinly Traded Equity / Equity Related Securities
(a) When trading in an equity and/or equity related securities (such as convertible debentures, equity warrants etc.) in a month is both less than Rs.5lacs in value and the total volume is less than 50,000 shares, the security is considered as thinly traded security.
(b) In order to determine whether a security is thinly traded or not, the volumes traded in all recognized
Stock Exchanges in India would be taken into account.
(c) Where a Stock Exchange identifies the thinly traded securities by applying the above parameters for the preceding calendar month and publishes or provides the required information along with the daily quotations, the same would be used for valuation.
(d) If the shares are not listed on the Stock Exchanges which provide such information, then we would make our own analysis in line with the above criteria to check whether such securities are thinly traded or not.
3. Non-traded / Suspended Securities When an equity security is not traded on any Stock Exchange for a period of thirty days prior to the valuation date, the Script would be treated as a non-traded security. When an equity security is suspended up to thirty days, then the last traded price is considered for valuation of that security. If an equity security is suspended for more than thirty days, then the AMC or Trustees would decide the valuation norms to be followed and such norms would be documented and recorded. The valuation methodology for thinly traded equity securities, Non-traded equity securities would be as follows: Based on the latest available Balance Sheet, net worth would be calculated as follows:
(a) Net Worth per share = [share capital+ reserves (excluding revaluation reserves) – Misc. expenditure and Debit Balance in P&L A/c] Divided by No. of Paid up Shares.
(b) Average capitalization rate (P/E ratio) for the industry based upon NSE prices or BSE prices and discounted by 75% i.e. only 25% of the Industry average P/E would be taken as capitalization rate (P/E ratio). Earnings per Share (EPS) of the latest audited annual accounts would be considered for this purpose.
(c) The value as per the net worth value per share and the capital earning value calculated as above
would be averaged and further discounted by 10% for illiquidity so as to arrive at the fair value per share.
(d) In case the EPS is negative, EPS value for that year would be taken as zero for arriving at capitalized
earning.
(e) In case, where the latest Balance Sheet of the company is not available within nine months from the close of the year, unless the accounting year is changed, the shares of such companies would be valued at zero.
(f) In case, an individual security accounts for more than 5% of the total assets of the scheme, an
Independent Valuer would be appointed for the valuation of the said security. To determine if a security accounts for more than 5 per cent of the total assets of the scheme, it would be valued by the procedure above and the proportion which it bears to the total net assets of the scheme to which it belongs will be compared on the date of valuation.
4. Unlisted Equity Methodology for Valuation - unlisted equity shares of a company would be valued "in good faith" as below:
a) Based on the latest available Balance Sheet, net worth would be calculated as follows:
115
1. Net Worth per share = [share capital+ reserves (excluding revaluation reserves) – Misc. expenditure and Debit Balance in P&L A/c] Divided by No. of Paid up Shares.
2. After taking into account the outstanding warrants and options, Net Worth per share would again be calculated and is = [Share Capital + consideration on exercise of Option and/or Warrants received/receivable by the Company + Free Reserves (excluding Revaluation Reserves) – Miscellaneous expenditure not written off or deferred revenue expenditure, intangible assets and accumulated losses] / Number of Paid up Shares plus Number of Shares that would be obtained on conversion and/or exercise of Outstanding Warrants and Options.
3. The lower of (1) and (2) above would be used for calculation of Net Worth per share and for further
calculation in (c) below.
b) Average capitalization rate (P/E ratio) for the industry based upon NSE prices or BSE prices and discounted by 75% i.e. only 25% of the Industry average P/E would be taken as capitalization rate (P/E ratio). Earnings per Share (EPS) of the latest audited annual accounts would be considered for this purpose.
c) The value as per the net worth value per share and the capital earning value calculated as above would be averaged and further discounted by 15% for illiquidity so as to arrive at the fair value per share.
The above valuation methodology would be subject to the following conditions:
a) All calculations would be based on audited accounts.
b) If the latest Balance Sheet of the company is not available within nine months from the close of the year, unless the accounting year is changed, the shares of such companies would be valued at zero.
c) If the Net Worth of the company is negative, the share would be marked down to zero.
d) In case the EPS is negative, EPS value for that year would be taken as zero for arriving at capitalized
earning.
e) In case an individual security accounts for more than 5 per cent of the total assets of the scheme, an Independent Valuer would be appointed for the valuation of the said security. To determine if a security accounts for more than 5 per cent of the total assets of the scheme, it is valued in accordance with the procedure as mentioned above on the date of valuation.
5. Demerger Generally on demerger, a listed security gets bifurcated into two or more shares. The valuation of these de-merged companies would depend on the following scenarios:
a) Both the shares are traded immediately on de-merger: In this case both the shares would be valued at respective traded prices.
b) Shares of only one company continued to be traded on de-merger: Traded shares would be valued
at traded price and the other security would to be valued at traded value on the day before the de merger less value of the traded security post de merger. In case value of the share of de-merged company is equal or in excess of the value of the pre de-merger share, then the non-traded share would be valued at zero, till the date it is listed.
c) Both the shares are not traded on de-merger: Shares of de-merged companies would be valued equal
to the pre de merger value up to a period of 30 days from the date of de merger till the date it is listed. The market price of the shares of the de-merged company one day prior to ex-date would be bifurcated over the de-merged shares. The market value of the shares would be bifurcated on a fair value basis, based on available information on the de-merger scheme.
d) In case shares of either of the companies are not traded for more than 30 days: Then it would be
treated as unlisted security, and valued accordingly till the date these are listed.
116
6. Preference Shares
Preference Shares valuation guidelines would be as follows:
a) Traded preference shares would be valued as per traded prices. b) Non traded Preference Shares
(I). Redeemable Preference Shares i. Convertible preference share would be valued like convertible debentures.
In general in respect of convertible debentures and bonds, the non-convertible and convertible components would be valued separately. The non-convertible component would be valued on the same basis as would be applicable to a debt instrument. The convertible component would be valued on the same basis as would be applicable to an equity instrument.
If a convertible preference share does not pay dividend then it would be treated like non-convertible debentures.
ii. Non-Convertible preference share would be valued like a debt instrument.
(II). Irredeemable preference shares would be valued on perpetual basis. It is like a constant dividend equity share.
7. Warrants
a) In respect of warrants to subscribe for shares attached to instruments, the warrants would be valued
at the value of the share which would be obtained on exercise of the warrants as reduced by the amount which would be payable on exercise of the warrant. A discount similar to the discount to be determined in respect on convertible debentures is deducted to account for the period, which must elapse before the warrant can be exercised.
b) In case the warrants are traded separately they would be valued as per the valuation guidelines
applicable to Equity Shares. 8. Rights
Until they are traded, the value of "rights" shares would be calculated as: Vr = n ÷ m x (Pex - Pof) Where Vr = Value of rights n = no. of rights offered m = no. of original shares held Pex = Ex-rights price Pof = Rights Offer Price Where the rights are not treated pari passu with the existing shares, suitable adjustment would be made to the value of rights. Where it is decided not to subscribe for the rights but to renounce them and renunciations are being traded, the rights would be valued at the renunciation value.
9. Derivatives
Market values of traded open futures and option contracts would be determined with respect to the exchange on which contracted originally, i.e., a future or an option contracted on the National Stock Exchange (NSE) would be valued at the closing price on the NSE.
The price of the same futures and option contract on the Bombay Stock Exchange (BSE) cannot be considered for the purpose of valuation, unless the futures or option itself has been contracted on the BSE.
The same will be valued at closing price if the contract is traded on the valuation day. In case there is no trade on valuation day then the same would be valued at Settlement prices.
117
However, the contracts which are going to expire on valuation date would be valued at Settlement prices only.
10. Mutual Fund Units
a) In case of traded Mutual Fund schemes, the units would be valued at closing price on the stock exchange on which they are traded like equity instruments. In case the units are not traded for more than 7 days, last declared Repurchase Price (the price at which Mutual Fund schemes buys its units back) would be considered for valuation.
b) If the last available Repurchase price is older than 7 days, the valuation will be done at the last
available NAV reduced by illiquidity discount. The illiquidity discount will be 10% of NAV or as decided by the Valuation Committee.
c) In case of non-traded Mutual Fund scheme, the last declared Repurchase Price (the price at which
Mutual Fund schemes buys its units back) would be considered for valuation.
d) In case of Investments made by a scheme into the other scheme of Sahara Mutual Fund, if valuation date being the last day of the financial year falling on a non-business day, then the computed NAV would be considered for valuation on March 31.
Related matters i) In case the income accrued on debt instruments is not received even after 90 days past the due date, the
asset is termed as Non-Performing Assets (NPAs) and all provisions/guidelines with respect to income accrual, provisioning etc as contained in SEBI circulars/guidelines issued from time to time shall apply and the valuation of such securities will be done accordingly. In case the company starts servicing the debt, re-schedulement is allowed, the applicable provision in SEBI circulars shall apply for provisioning and reclassification of the asset
ii) In case of any other instruments not covered in the policy above, the same is referred to the Investment and
Valuation Committee which is empowered to take decision.
iii) In case of any perceived conflict of interest while valuating the securities, the matter is dealt and decided by Investment and Valuation Committee.
iv) For non– business day the valuation is done on aggregated script wise prices as provided by CRISIL/ICRA.
In absence of Script wise prices the valuation is done on accrual basis/amortization basis based on last valuation
v) In case of exceptional circumstances like, policy announcements by government/regulatory bodies, natural
disasters, public disturbances, extreme volatility in capital market, shut down of market, war etc and on those days if Script wise value or valuation matrices are not available from CRISIL/ICRA and if security is not traded, the valuation for the day is done based on last valuation plus accrual/amortization or as may be decided by the Investment and Valuation Committee.
vi) The Valuation Policy is reviewed by the Statutory Auditor at least once in a financial year.
vii) Valuation Policy as updated and approved by the Board of AMC / Board of Trustees is applicable for the
schemes of Sahara Mutual Fund
2.3.1 Valuation of securities not covered under the above valuation policy:
The total exposure in securities, which do not fall under above valuation norms, shall not exceed 5% of the total AUM of the scheme. In case of any other instruments not covered in the policy above, the same shall be referred to the Investment and Valuation Committee which is empowered to take decision.
Investment in such securities is to be valued by a method approved by the Investment and Valuation Committee and the same will be reported to the Board of Trustees.

118
2.3.2 Unrealised Appreciation/Depreciation. In accordance with the Guidance Note on Accounting for Investments in the Financial Statements of Mutual Funds issued by the Institute of Chartered Accountants of India, the unrealized appreciation determined separately for each individual investment is directly transferred to the “Unrealized Appreciation Reserve Account” i.e. without routing it through the revenue account.
The provision for depreciation in value of investments determined separately for each individual investment is recognized in the revenue account. The loss (realized) on investments sold / transferred during the year is charged to revenue account, instead of being first adjusted against the provision for depreciation, if already created in the prior year, as recommended by the said Guidance Note. However, this departure from the Guidance Note does not have any net impact on the Scheme’s net assets or results for the year.
2.4 Revenue Recognition
2.4.1 Income and Expenses are recognized on accrual basis. 2.4.2 Interest on funds invested in short term deposits with scheduled commercial banks is
recognized on accrual basis. 2.4.3 Dividend income earned by the scheme is recognized on the date the share is quoted on ex-
dividend basis on principal stock exchange. 2.4.4 Proportionate realized gains on investments out of sales / repurchase proceeds at the time of
sale / repurchase of units are transferred to revenue Account from Unit Premium Reserve.
3. Net Asset Value for Growth/Dividend Options: The net asset value of the units is determined separately for units issued under the Growth Option, Dividend Option, Growth Option – Direct and Dividend Option – Direct. For reporting the net asset value of the Growth Option, Dividend Option, Growth Option – Direct and Dividend Option - Direct, daily income earned, including realized and unrealized gain or loss in the value of investments and expenses incurred by the scheme are allocated to the options in proportion to the value of the net assets.
4. Unit Premium Reserve Account
Upon issue and redemption of units, the net premium or discount to the face value of units is adjusted against the unit premium reserve account of the Scheme, after an appropriate amount of the issue proceeds and redemption payout is credited or debited respectively to the income equalization account.
5. Income Equalisation Account
An appropriate part of the sale proceeds or the redemption amount, as the case may be, is transferred to income equalization account. The total distributable surplus (without considering unrealized appreciation) upto the date of issue/ redemption of units has been taken into account for the purpose of ascertaining the amount to be transferred to Equalization Account on a daily basis. The net balance in this account is transferred to the Revenue Account at the end of the year.
6. Load Charges
Service tax on exit load , if any, shall be paid out of the exit load proceeds and exit load net of service tax, if any, shall be credited to the scheme.
7. Unclaimed Redemption. In line with SEBI circular no. MFD/CIR/9/120 /2000 dated November 24, 2000 and SEBI circular no. SEBI/HO/IMD/DF2/CIR/P/2016/37 dated February 25, 2016, the unclaimed redemption and unclaimed dividend amounts may be deployed by the mutual funds in call money market or money market instruments and also be allowed to be invested in a separate plan of Liquid Scheme/ Money Market Mutual Fund scheme floated by Mutual Funds specifically for deployment of the unclaimed amounts. The investors who claim these amounts during a period of three years from the due date shall be paid initial unclaimed amount along with the income earned on its deployment. Investors who claim these amounts after 3 years, shall be paid initial unclaimed amount along with the income earned on its deployment till the end of the third year. After the third year, the income earned on such unclaimed amounts shall be used for the purpose of investor education. Further, AMC shall not be permitted to charge any exit load
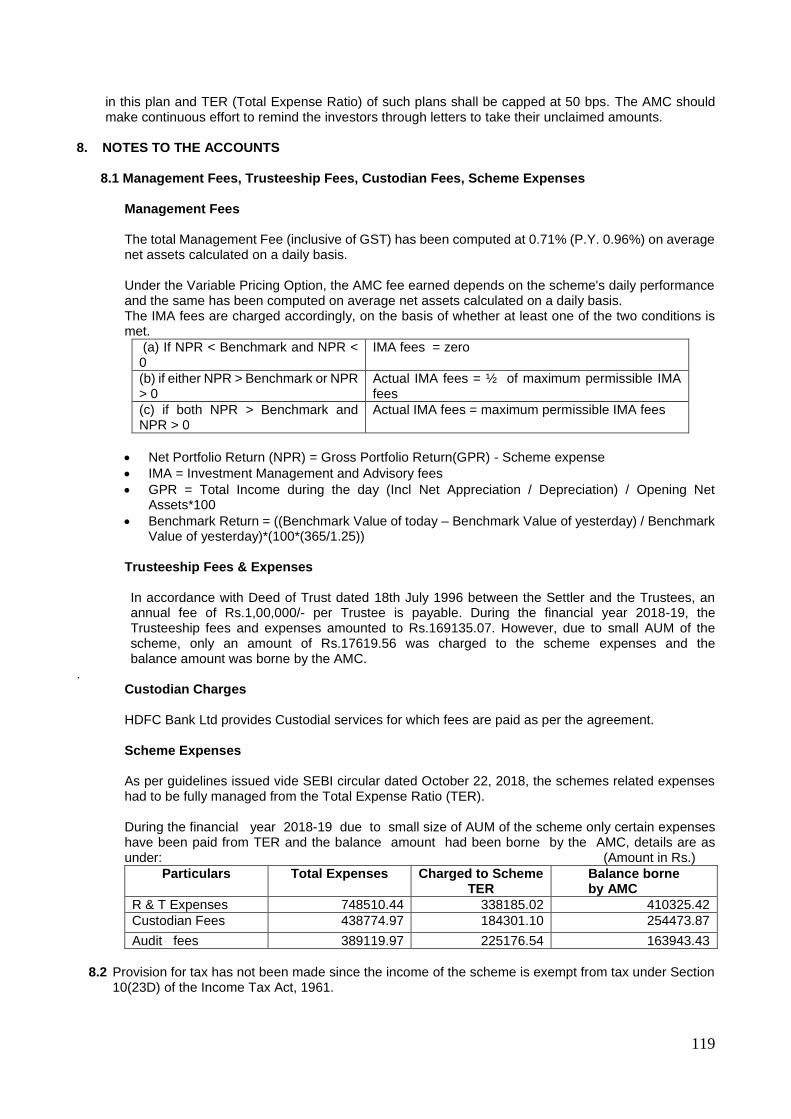
119
in this plan and TER (Total Expense Ratio) of such plans shall be capped at 50 bps. The AMC should make continuous effort to remind the investors through letters to take their unclaimed amounts.
8. NOTES TO THE ACCOUNTS 8.1 Management Fees, Trusteeship Fees, Custodian Fees, Scheme Expenses
Management Fees
The total Management Fee (inclusive of GST) has been computed at 0.71% (P.Y. 0.96%) on average net assets calculated on a daily basis. Under the Variable Pricing Option, the AMC fee earned depends on the scheme's daily performance and the same has been computed on average net assets calculated on a daily basis. The IMA fees are charged accordingly, on the basis of whether at least one of the two conditions is met.
(a) If NPR < Benchmark and NPR < 0
IMA fees = zero
(b) if either NPR > Benchmark or NPR > 0
Actual IMA fees = ½ of maximum permissible IMA fees
(c) if both NPR > Benchmark and NPR > 0
Actual IMA fees = maximum permissible IMA fees
Net Portfolio Return (NPR) = Gross Portfolio Return(GPR) - Scheme expense
IMA = Investment Management and Advisory fees
GPR = Total Income during the day (Incl Net Appreciation / Depreciation) / Opening Net Assets*100
Benchmark Return = ((Benchmark Value of today – Benchmark Value of yesterday) / Benchmark Value of yesterday)*(100*(365/1.25))
Trusteeship Fees & Expenses
In accordance with Deed of Trust dated 18th July 1996 between the Settler and the Trustees, an annual fee of Rs.1,00,000/- per Trustee is payable. During the financial year 2018-19, the Trusteeship fees and expenses amounted to Rs.169135.07. However, due to small AUM of the scheme, only an amount of Rs.17619.56 was charged to the scheme expenses and the balance amount was borne by the AMC.
. Custodian Charges
HDFC Bank Ltd provides Custodial services for which fees are paid as per the agreement. Scheme Expenses As per guidelines issued vide SEBI circular dated October 22, 2018, the schemes related expenses had to be fully managed from the Total Expense Ratio (TER).
During the financial year 2018-19 due to small size of AUM of the scheme only certain expenses have been paid from TER and the balance amount had been borne by the AMC, details are as under: (Amount in Rs.)
Particulars Total Expenses Charged to Scheme TER
Balance borne by AMC
R & T Expenses 748510.44 338185.02 410325.42
Custodian Fees 438774.97 184301.10 254473.87
Audit fees 389119.97 225176.54 163943.43
8.2 Provision for tax has not been made since the income of the scheme is exempt from tax under Section
10(23D) of the Income Tax Act, 1961.
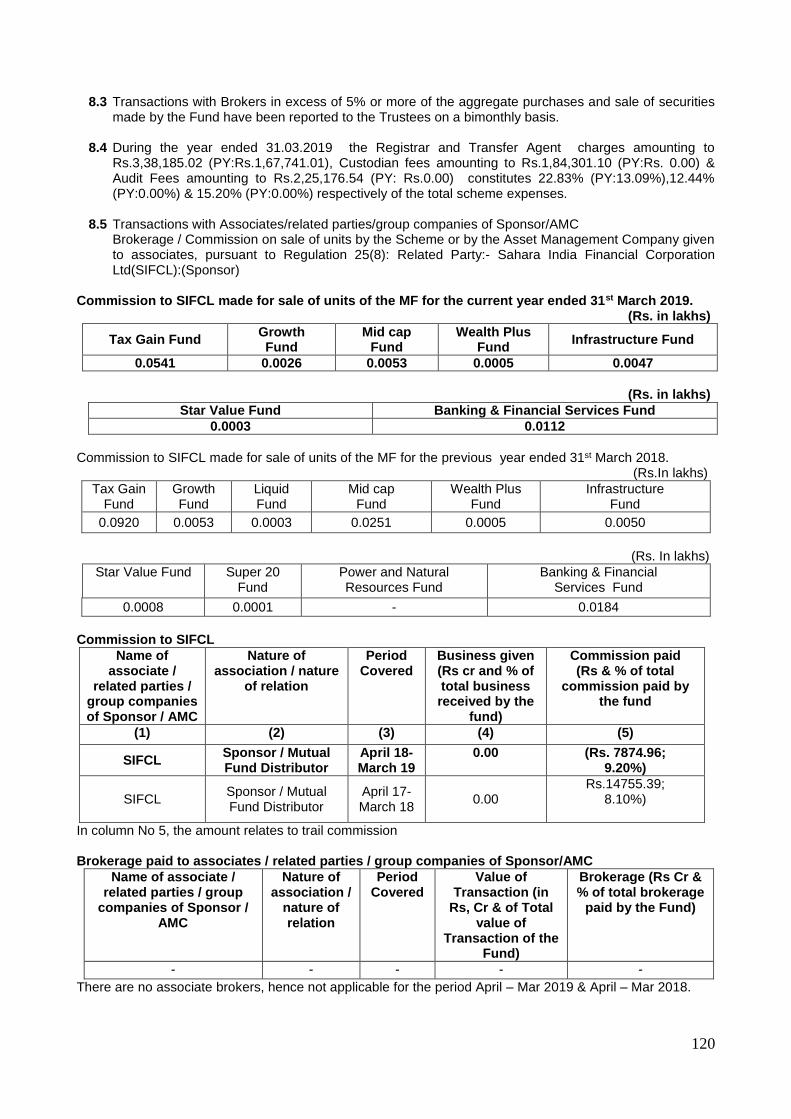
120
8.3 Transactions with Brokers in excess of 5% or more of the aggregate purchases and sale of securities made by the Fund have been reported to the Trustees on a bimonthly basis.
8.4 During the year ended 31.03.2019 the Registrar and Transfer Agent charges amounting to
Rs.3,38,185.02 (PY:Rs.1,67,741.01), Custodian fees amounting to Rs.1,84,301.10 (PY:Rs. 0.00) & Audit Fees amounting to Rs.2,25,176.54 (PY: Rs.0.00) constitutes 22.83% (PY:13.09%),12.44% (PY:0.00%) & 15.20% (PY:0.00%) respectively of the total scheme expenses.
8.5 Transactions with Associates/related parties/group companies of Sponsor/AMC
Brokerage / Commission on sale of units by the Scheme or by the Asset Management Company given to associates, pursuant to Regulation 25(8): Related Party:- Sahara India Financial Corporation Ltd(SIFCL):(Sponsor)
Commission to SIFCL made for sale of units of the MF for the current year ended 31st March 2019.
(Rs. in lakhs)
Tax Gain Fund Growth Fund
Mid cap Fund
Wealth Plus Fund
Infrastructure Fund
0.0541 0.0026 0.0053 0.0005 0.0047
(Rs. in lakhs)
Star Value Fund Banking & Financial Services Fund
0.0003 0.0112
Commission to SIFCL made for sale of units of the MF for the previous year ended 31st March 2018. (Rs.In lakhs)
Tax Gain Fund
Growth Fund
Liquid Fund
Mid cap Fund
Wealth Plus Fund
Infrastructure Fund
0.0920 0.0053 0.0003 0.0251 0.0005 0.0050
(Rs. In lakhs)
Star Value Fund Super 20 Fund
Power and Natural Resources Fund
Banking & Financial Services Fund
0.0008 0.0001 - 0.0184
Commission to SIFCL
In column No 5, the amount relates to trail commission Brokerage paid to associates / related parties / group companies of Sponsor/AMC
Name of associate / related parties / group
companies of Sponsor / AMC
Nature of association /
nature of relation
Period Covered
Value of Transaction (in
Rs, Cr & of Total value of
Transaction of the Fund)
Brokerage (Rs Cr & % of total brokerage
paid by the Fund)
- - - - -
There are no associate brokers, hence not applicable for the period April – Mar 2019 & April – Mar 2018.
Name of associate /
related parties / group companies of Sponsor / AMC
Nature of association / nature
of relation
Period Covered
Business given (Rs cr and % of total business received by the
fund)
Commission paid (Rs & % of total
commission paid by the fund
(1) (2) (3) (4) (5)
SIFCL Sponsor / Mutual Fund Distributor
April 18-March 19
0.00
(Rs. 7874.96; 9.20%)
SIFCL Sponsor / Mutual Fund Distributor
April 17-March 18
0.00 Rs.14755.39;
8.10%)
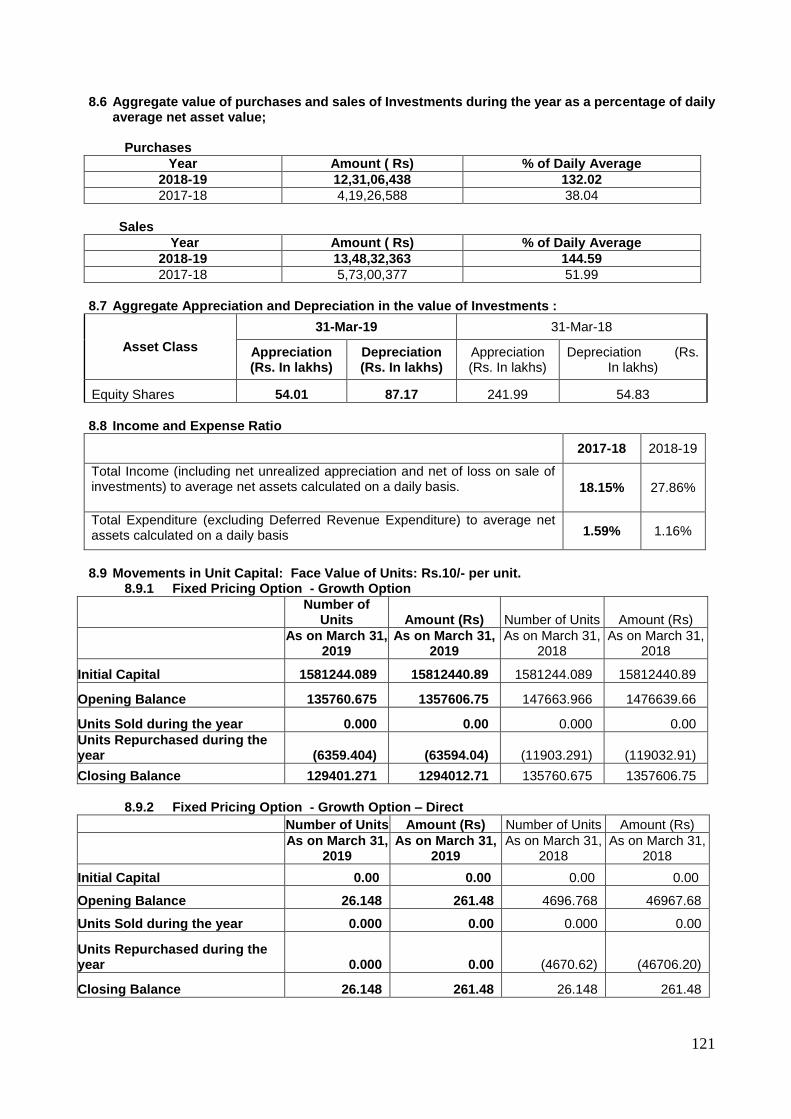
121
8.6 Aggregate value of purchases and sales of Investments during the year as a percentage of daily average net asset value;
Purchases
Year Amount ( Rs) % of Daily Average
2018-19 12,31,06,438 132.02
2017-18 4,19,26,588 38.04
Sales
Year Amount ( Rs) % of Daily Average
2018-19 13,48,32,363 144.59
2017-18 5,73,00,377 51.99
8.7 Aggregate Appreciation and Depreciation in the value of Investments :
Asset Class
31-Mar-19 31-Mar-18
Appreciation (Rs. In lakhs)
Depreciation (Rs. In lakhs)
Appreciation (Rs. In lakhs)
Depreciation (Rs. In lakhs)
Equity Shares 54.01 87.17 241.99 54.83
8.8 Income and Expense Ratio
2017-18 2018-19
Total Income (including net unrealized appreciation and net of loss on sale of investments) to average net assets calculated on a daily basis. 18.15% 27.86%
Total Expenditure (excluding Deferred Revenue Expenditure) to average net assets calculated on a daily basis 1.59% 1.16%
8.9 Movements in Unit Capital: Face Value of Units: Rs.10/- per unit.
8.9.1 Fixed Pricing Option - Growth Option
Number of
Units Amount (Rs) Number of Units Amount (Rs)
As on March 31,
2019 As on March 31,
2019 As on March 31,
2018 As on March 31,
2018
Initial Capital 1581244.089 15812440.89 1581244.089 15812440.89
Opening Balance 135760.675 1357606.75 147663.966 1476639.66
Units Sold during the year 0.000 0.00 0.000 0.00
Units Repurchased during the year (6359.404) (63594.04) (11903.291) (119032.91)
Closing Balance 129401.271 1294012.71 135760.675 1357606.75
8.9.2 Fixed Pricing Option - Growth Option – Direct
Number of Units Amount (Rs) Number of Units Amount (Rs)
As on March 31,
2019 As on March 31,
2019 As on March 31,
2018 As on March 31,
2018
Initial Capital 0.00 0.00 0.00 0.00
Opening Balance 26.148 261.48 4696.768 46967.68
Units Sold during the year 0.000 0.00 0.000 0.00
Units Repurchased during the year 0.000
0.00 (4670.62) (46706.20)
Closing Balance 26.148 261.48 26.148 261.48
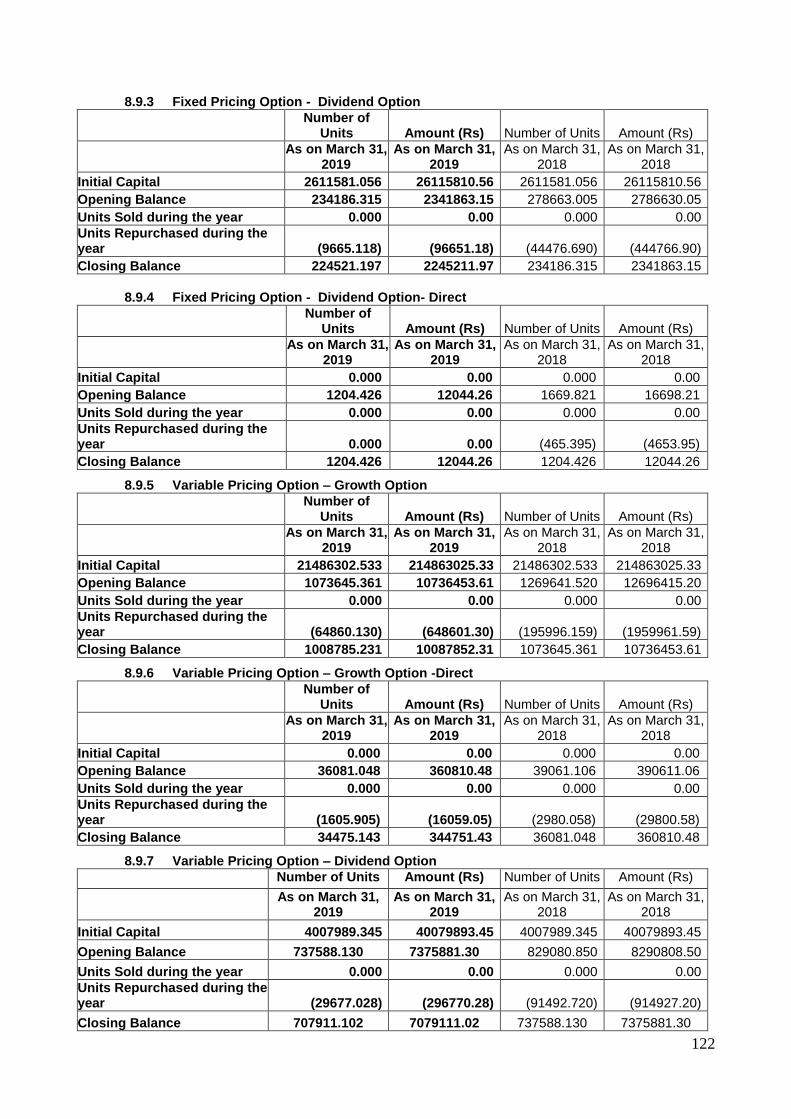
122
8.9.3 Fixed Pricing Option - Dividend Option
Number of
Units Amount (Rs) Number of Units Amount (Rs)
As on March 31,
2019 As on March 31,
2019 As on March 31,
2018 As on March 31,
2018
Initial Capital 2611581.056 26115810.56 2611581.056 26115810.56
Opening Balance 234186.315 2341863.15 278663.005 2786630.05
Units Sold during the year 0.000 0.00 0.000 0.00
Units Repurchased during the year (9665.118) (96651.18) (44476.690) (444766.90)
Closing Balance 224521.197 2245211.97 234186.315 2341863.15
8.9.4 Fixed Pricing Option - Dividend Option- Direct
Number of
Units Amount (Rs) Number of Units Amount (Rs)
As on March 31,
2019 As on March 31,
2019 As on March 31,
2018 As on March 31,
2018
Initial Capital 0.000 0.00 0.000 0.00
Opening Balance 1204.426 12044.26 1669.821 16698.21
Units Sold during the year 0.000 0.00 0.000 0.00
Units Repurchased during the year 0.000 0.00 (465.395) (4653.95)
Closing Balance 1204.426 12044.26 1204.426 12044.26
8.9.5 Variable Pricing Option – Growth Option
Number of
Units Amount (Rs) Number of Units Amount (Rs)
As on March 31,
2019 As on March 31,
2019 As on March 31,
2018 As on March 31,
2018
Initial Capital 21486302.533 214863025.33 21486302.533 214863025.33
Opening Balance 1073645.361 10736453.61 1269641.520 12696415.20
Units Sold during the year 0.000 0.00 0.000 0.00
Units Repurchased during the year (64860.130) (648601.30) (195996.159) (1959961.59)
Closing Balance 1008785.231 10087852.31 1073645.361 10736453.61 8.9.6 Variable Pricing Option – Growth Option -Direct
Number of
Units Amount (Rs) Number of Units Amount (Rs)
As on March 31,
2019 As on March 31,
2019 As on March 31,
2018 As on March 31,
2018
Initial Capital 0.000 0.00 0.000 0.00
Opening Balance 36081.048 360810.48 39061.106 390611.06
Units Sold during the year 0.000 0.00 0.000 0.00
Units Repurchased during the year (1605.905) (16059.05) (2980.058) (29800.58)
Closing Balance 34475.143 344751.43 36081.048 360810.48
8.9.7 Variable Pricing Option – Dividend Option
Number of Units Amount (Rs) Number of Units Amount (Rs)
As on March 31,
2019 As on March 31,
2019 As on March 31,
2018 As on March 31,
2018
Initial Capital 4007989.345 40079893.45 4007989.345 40079893.45
Opening Balance 737588.130 7375881.30 829080.850 8290808.50
Units Sold during the year 0.000 0.00 0.000 0.00
Units Repurchased during the year (29677.028) (296770.28) (91492.720) (914927.20)
Closing Balance 707911.102 7079111.02 737588.130 7375881.30
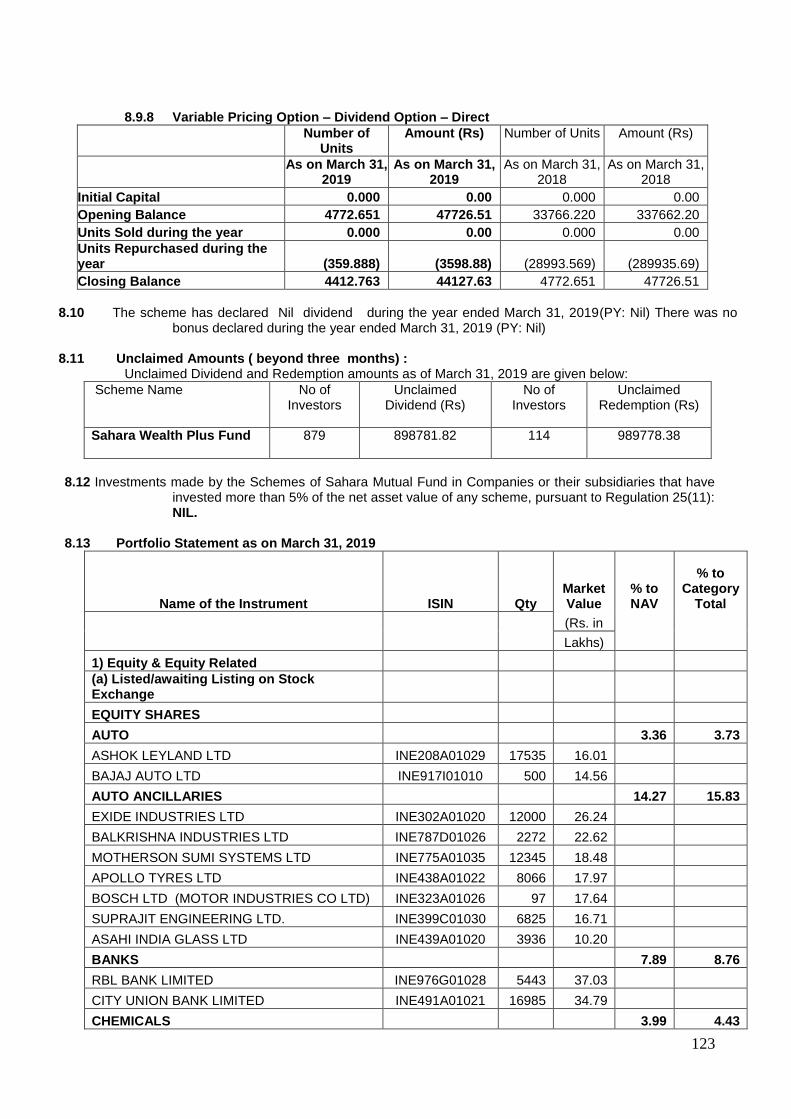
123
8.9.8 Variable Pricing Option – Dividend Option – Direct
Number of Units
Amount (Rs) Number of Units Amount (Rs)
As on March 31,
2019 As on March 31,
2019 As on March 31,
2018 As on March 31,
2018
Initial Capital 0.000 0.00 0.000 0.00
Opening Balance 4772.651 47726.51 33766.220 337662.20
Units Sold during the year 0.000 0.00 0.000 0.00
Units Repurchased during the year (359.888) (3598.88) (28993.569) (289935.69)
Closing Balance 4412.763 44127.63 4772.651 47726.51
8.10 The scheme has declared Nil dividend during the year ended March 31, 2019(PY: Nil) There was no
bonus declared during the year ended March 31, 2019 (PY: Nil)
8.11 Unclaimed Amounts ( beyond three months) : Unclaimed Dividend and Redemption amounts as of March 31, 2019 are given below:
Scheme Name No of Investors
Unclaimed Dividend (Rs)
No of Investors
Unclaimed Redemption (Rs)
Sahara Wealth Plus Fund 879
898781.82
114
989778.38
8.12 Investments made by the Schemes of Sahara Mutual Fund in Companies or their subsidiaries that have
invested more than 5% of the net asset value of any scheme, pursuant to Regulation 25(11): NIL.
8.13 Portfolio Statement as on March 31, 2019
Name of the Instrument ISIN Qty Market Value
% to NAV
% to Category
Total
(Rs. in
Lakhs)
1) Equity & Equity Related
(a) Listed/awaiting Listing on Stock Exchange
EQUITY SHARES
AUTO 3.36 3.73
ASHOK LEYLAND LTD INE208A01029 17535 16.01
BAJAJ AUTO LTD INE917I01010 500 14.56
AUTO ANCILLARIES 14.27 15.83
EXIDE INDUSTRIES LTD INE302A01020 12000 26.24
BALKRISHNA INDUSTRIES LTD INE787D01026 2272 22.62
MOTHERSON SUMI SYSTEMS LTD INE775A01035 12345 18.48
APOLLO TYRES LTD INE438A01022 8066 17.97
BOSCH LTD (MOTOR INDUSTRIES CO LTD) INE323A01026 97 17.64
SUPRAJIT ENGINEERING LTD. INE399C01030 6825 16.71
ASAHI INDIA GLASS LTD INE439A01020 3936 10.20
BANKS 7.89 8.76
RBL BANK LIMITED INE976G01028 5443 37.03
CITY UNION BANK LIMITED INE491A01021 16985 34.79
CHEMICALS 3.99 4.43
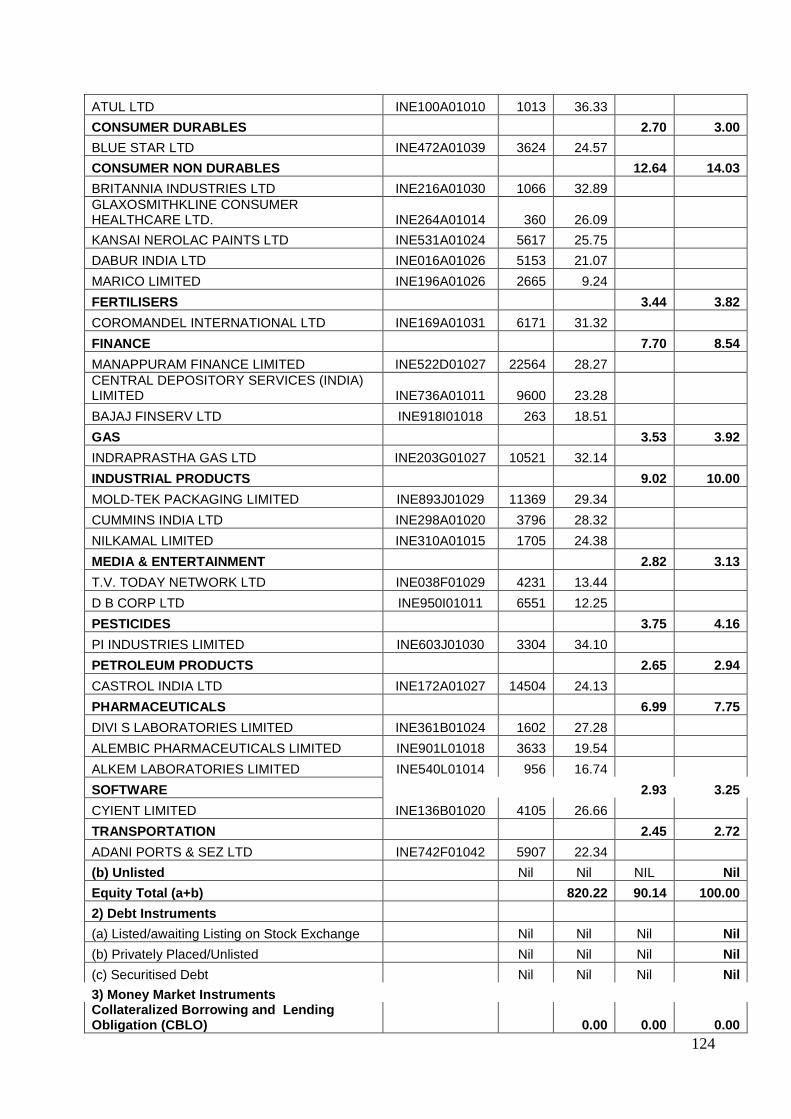
124
ATUL LTD INE100A01010 1013 36.33
CONSUMER DURABLES 2.70 3.00
BLUE STAR LTD INE472A01039 3624 24.57
CONSUMER NON DURABLES 12.64 14.03
BRITANNIA INDUSTRIES LTD INE216A01030 1066 32.89
GLAXOSMITHKLINE CONSUMER HEALTHCARE LTD. INE264A01014 360 26.09
KANSAI NEROLAC PAINTS LTD INE531A01024 5617 25.75
DABUR INDIA LTD INE016A01026 5153 21.07
MARICO LIMITED INE196A01026 2665 9.24
FERTILISERS 3.44 3.82
COROMANDEL INTERNATIONAL LTD INE169A01031 6171 31.32
FINANCE 7.70 8.54
MANAPPURAM FINANCE LIMITED INE522D01027 22564 28.27
CENTRAL DEPOSITORY SERVICES (INDIA) LIMITED INE736A01011 9600 23.28
BAJAJ FINSERV LTD INE918I01018 263 18.51
GAS 3.53 3.92
INDRAPRASTHA GAS LTD INE203G01027 10521 32.14
INDUSTRIAL PRODUCTS 9.02 10.00
MOLD-TEK PACKAGING LIMITED INE893J01029 11369 29.34
CUMMINS INDIA LTD INE298A01020 3796 28.32
NILKAMAL LIMITED INE310A01015 1705 24.38
MEDIA & ENTERTAINMENT 2.82 3.13
T.V. TODAY NETWORK LTD INE038F01029 4231 13.44
D B CORP LTD INE950I01011 6551 12.25
PESTICIDES 3.75 4.16
PI INDUSTRIES LIMITED INE603J01030 3304 34.10
PETROLEUM PRODUCTS 2.65 2.94
CASTROL INDIA LTD INE172A01027 14504 24.13
PHARMACEUTICALS 6.99 7.75
DIVI S LABORATORIES LIMITED INE361B01024 1602 27.28
ALEMBIC PHARMACEUTICALS LIMITED INE901L01018 3633 19.54
ALKEM LABORATORIES LIMITED INE540L01014 956 16.74
SOFTWARE 2.93 3.25
CYIENT LIMITED INE136B01020 4105 26.66
TRANSPORTATION 2.45 2.72
ADANI PORTS & SEZ LTD INE742F01042 5907 22.34
(b) Unlisted Nil Nil NIL Nil
Equity Total (a+b) 820.22 90.14 100.00
2) Debt Instruments
(a) Listed/awaiting Listing on Stock Exchange Nil Nil Nil Nil
(b) Privately Placed/Unlisted Nil Nil Nil Nil
(c) Securitised Debt Nil Nil Nil Nil
3) Money Market Instruments Collateralized Borrowing and Lending Obligation (CBLO) 0.00 0.00 0.00
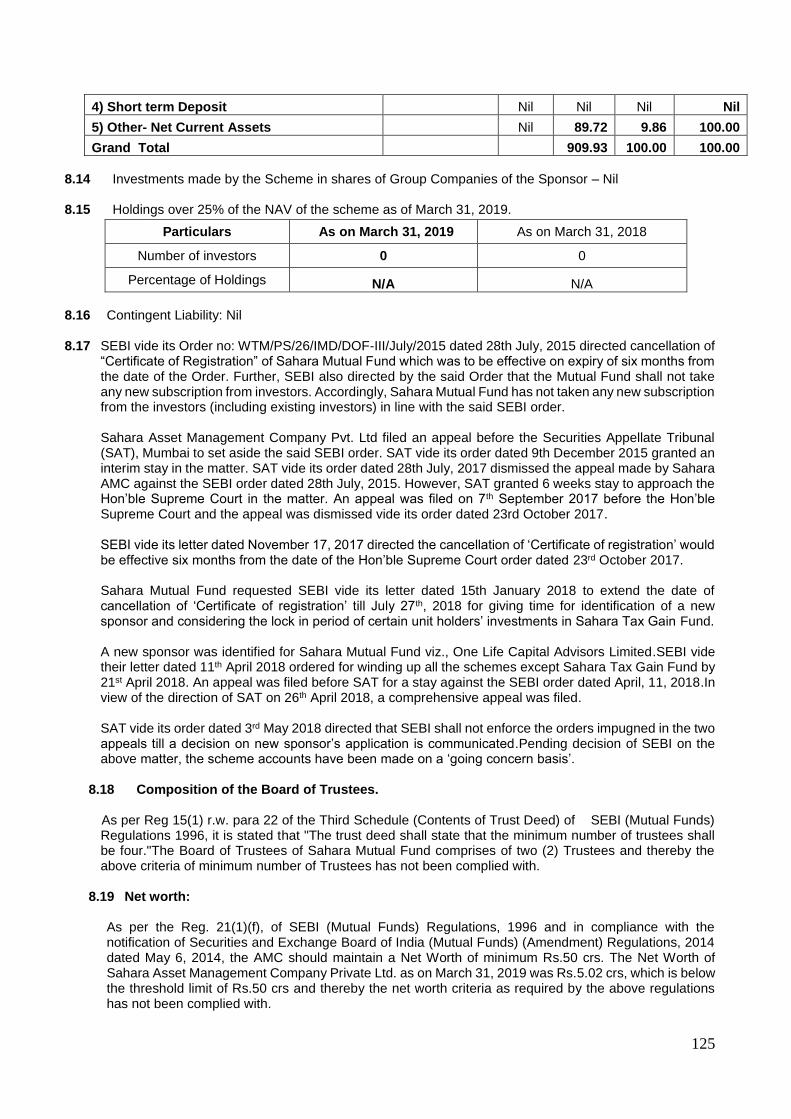
125
4) Short term Deposit Nil Nil Nil Nil
5) Other- Net Current Assets Nil 89.72 9.86 100.00
Grand Total 909.93 100.00 100.00
8.14 Investments made by the Scheme in shares of Group Companies of the Sponsor – Nil
8.15 Holdings over 25% of the NAV of the scheme as of March 31, 2019.
8.16 Contingent Liability: Nil
8.17 SEBI vide its Order no: WTM/PS/26/IMD/DOF-III/July/2015 dated 28th July, 2015 directed cancellation of
“Certificate of Registration” of Sahara Mutual Fund which was to be effective on expiry of six months from the date of the Order. Further, SEBI also directed by the said Order that the Mutual Fund shall not take any new subscription from investors. Accordingly, Sahara Mutual Fund has not taken any new subscription from the investors (including existing investors) in line with the said SEBI order.
Sahara Asset Management Company Pvt. Ltd filed an appeal before the Securities Appellate Tribunal (SAT), Mumbai to set aside the said SEBI order. SAT vide its order dated 9th December 2015 granted an interim stay in the matter. SAT vide its order dated 28th July, 2017 dismissed the appeal made by Sahara AMC against the SEBI order dated 28th July, 2015. However, SAT granted 6 weeks stay to approach the Hon’ble Supreme Court in the matter. An appeal was filed on 7th September 2017 before the Hon’ble Supreme Court and the appeal was dismissed vide its order dated 23rd October 2017. SEBI vide its letter dated November 17, 2017 directed the cancellation of ‘Certificate of registration’ would be effective six months from the date of the Hon’ble Supreme Court order dated 23rd October 2017. Sahara Mutual Fund requested SEBI vide its letter dated 15th January 2018 to extend the date of cancellation of ‘Certificate of registration’ till July 27th, 2018 for giving time for identification of a new sponsor and considering the lock in period of certain unit holders’ investments in Sahara Tax Gain Fund. A new sponsor was identified for Sahara Mutual Fund viz., One Life Capital Advisors Limited.SEBI vide their letter dated 11th April 2018 ordered for winding up all the schemes except Sahara Tax Gain Fund by 21st April 2018. An appeal was filed before SAT for a stay against the SEBI order dated April, 11, 2018.In view of the direction of SAT on 26th April 2018, a comprehensive appeal was filed. SAT vide its order dated 3rd May 2018 directed that SEBI shall not enforce the orders impugned in the two appeals till a decision on new sponsor’s application is communicated.Pending decision of SEBI on the above matter, the scheme accounts have been made on a ‘going concern basis’.
8.18 Composition of the Board of Trustees.
As per Reg 15(1) r.w. para 22 of the Third Schedule (Contents of Trust Deed) of SEBI (Mutual Funds)
Regulations 1996, it is stated that "The trust deed shall state that the minimum number of trustees shall be four."The Board of Trustees of Sahara Mutual Fund comprises of two (2) Trustees and thereby the above criteria of minimum number of Trustees has not been complied with.
8.19 Net worth:
As per the Reg. 21(1)(f), of SEBI (Mutual Funds) Regulations, 1996 and in compliance with the notification of Securities and Exchange Board of India (Mutual Funds) (Amendment) Regulations, 2014 dated May 6, 2014, the AMC should maintain a Net Worth of minimum Rs.50 crs. The Net Worth of Sahara Asset Management Company Private Ltd. as on March 31, 2019 was Rs.5.02 crs, which is below the threshold limit of Rs.50 crs and thereby the net worth criteria as required by the above regulations has not been complied with.
Particulars As on March 31, 2019 As on March 31, 2018
Number of investors 0 0
Percentage of Holdings N/A N/A
126
8.20 Previous year figures have been reclassified/regrouped, wherever necessary, to conform to the current year’s classification.
As per our attached report of even date
For Chaturvedi & Partners For Sahara Asset Management Company Private Limited Chartered Accountants
(Firm’s Registration No. 307068E) O P Srivastava R M Joshi
Director Director
Sudhir Kaup Khozem Jabalpurwala
Khyati Shah Compliance Officer Fund Manager
(Partner)
Mem. No.117510 Vidya Manjrekar
Head – Operations & NAV Accounting
Place: Mumbai
Date: 19th July, 2019 For Sahara Mutual Fund
M R Siddiqui S P Srivastava
Trustee Trustee Place: Mumbai Date: 19th July, 2019
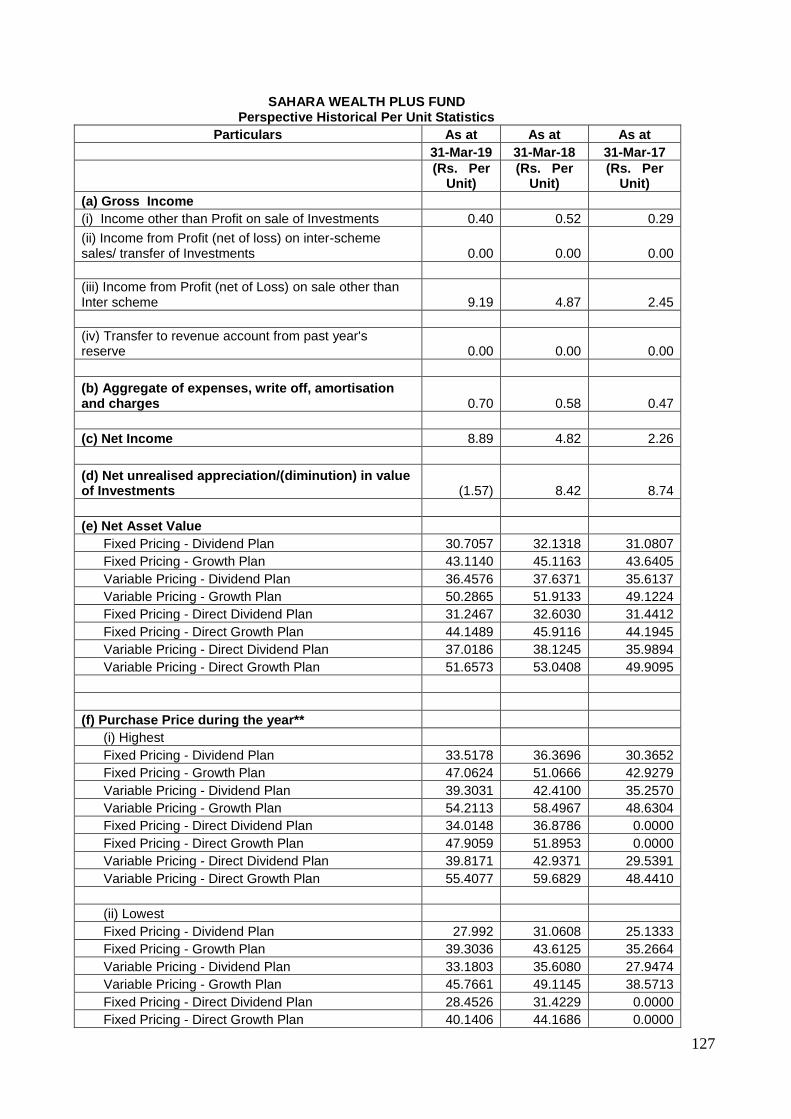
127
SAHARA WEALTH PLUS FUND Perspective Historical Per Unit Statistics
Particulars As at As at As at
31-Mar-19 31-Mar-18 31-Mar-17
(Rs. Per
Unit) (Rs. Per
Unit) (Rs. Per
Unit)
(a) Gross Income
(i) Income other than Profit on sale of Investments 0.40 0.52 0.29
(ii) Income from Profit (net of loss) on inter-scheme sales/ transfer of Investments 0.00 0.00 0.00
(iii) Income from Profit (net of Loss) on sale other than Inter scheme 9.19 4.87 2.45
(iv) Transfer to revenue account from past year's reserve 0.00 0.00 0.00
(b) Aggregate of expenses, write off, amortisation and charges 0.70 0.58 0.47
(c) Net Income 8.89 4.82 2.26
(d) Net unrealised appreciation/(diminution) in value of Investments (1.57) 8.42 8.74
(e) Net Asset Value
Fixed Pricing - Dividend Plan 30.7057 32.1318 31.0807
Fixed Pricing - Growth Plan 43.1140 45.1163 43.6405
Variable Pricing - Dividend Plan 36.4576 37.6371 35.6137
Variable Pricing - Growth Plan 50.2865 51.9133 49.1224
Fixed Pricing - Direct Dividend Plan 31.2467 32.6030 31.4412
Fixed Pricing - Direct Growth Plan 44.1489 45.9116 44.1945
Variable Pricing - Direct Dividend Plan 37.0186 38.1245 35.9894
Variable Pricing - Direct Growth Plan 51.6573 53.0408 49.9095
(f) Purchase Price during the year**
(i) Highest
Fixed Pricing - Dividend Plan 33.5178 36.3696 30.3652
Fixed Pricing - Growth Plan 47.0624 51.0666 42.9279
Variable Pricing - Dividend Plan 39.3031 42.4100 35.2570
Variable Pricing - Growth Plan 54.2113 58.4967 48.6304
Fixed Pricing - Direct Dividend Plan 34.0148 36.8786 0.0000
Fixed Pricing - Direct Growth Plan 47.9059 51.8953 0.0000
Variable Pricing - Direct Dividend Plan 39.8171 42.9371 29.5391
Variable Pricing - Direct Growth Plan 55.4077 59.6829 48.4410
(ii) Lowest
Fixed Pricing - Dividend Plan 27.992 31.0608 25.1333
Fixed Pricing - Growth Plan 39.3036 43.6125 35.2664
Variable Pricing - Dividend Plan 33.1803 35.6080 27.9474
Variable Pricing - Growth Plan 45.7661 49.1145 38.5713
Fixed Pricing - Direct Dividend Plan 28.4526 31.4229 0.0000
Fixed Pricing - Direct Growth Plan 40.1406 44.1686 0.0000
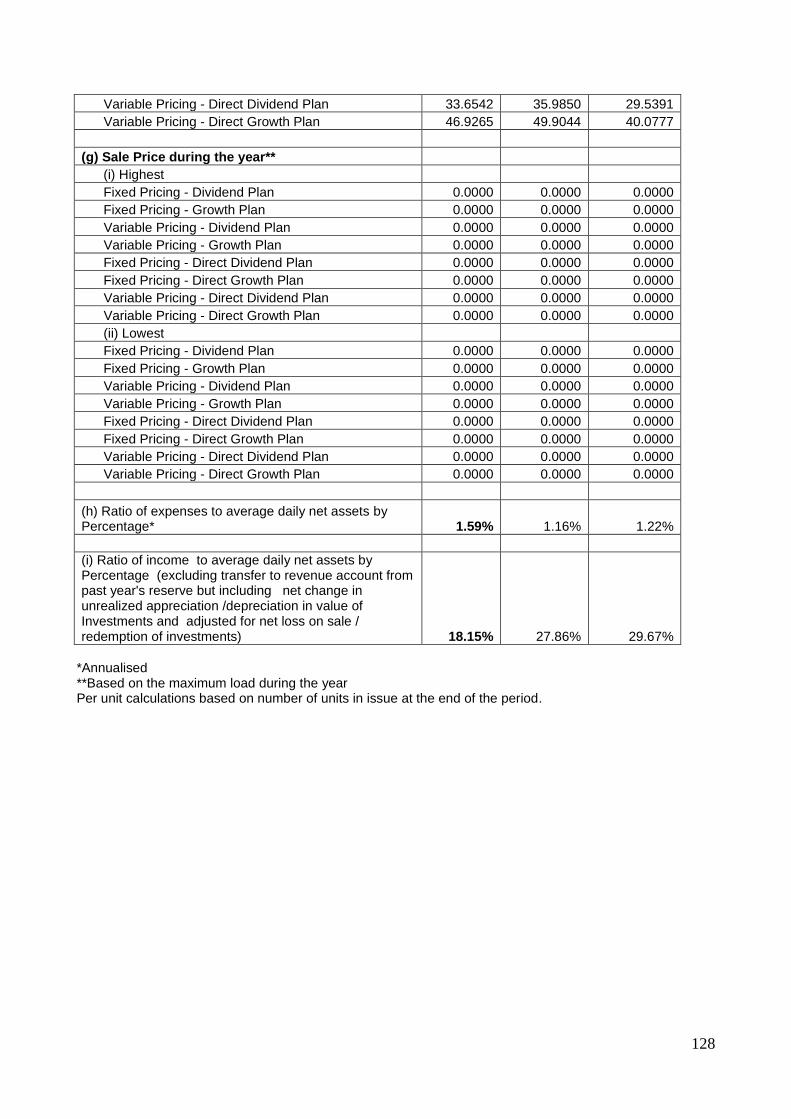
128
Variable Pricing - Direct Dividend Plan 33.6542 35.9850 29.5391
Variable Pricing - Direct Growth Plan 46.9265 49.9044 40.0777
(g) Sale Price during the year**
(i) Highest
Fixed Pricing - Dividend Plan 0.0000 0.0000 0.0000
Fixed Pricing - Growth Plan 0.0000 0.0000 0.0000
Variable Pricing - Dividend Plan 0.0000 0.0000 0.0000
Variable Pricing - Growth Plan 0.0000 0.0000 0.0000
Fixed Pricing - Direct Dividend Plan 0.0000 0.0000 0.0000
Fixed Pricing - Direct Growth Plan 0.0000 0.0000 0.0000
Variable Pricing - Direct Dividend Plan 0.0000 0.0000 0.0000
Variable Pricing - Direct Growth Plan 0.0000 0.0000 0.0000
(ii) Lowest
Fixed Pricing - Dividend Plan 0.0000 0.0000 0.0000
Fixed Pricing - Growth Plan 0.0000 0.0000 0.0000
Variable Pricing - Dividend Plan 0.0000 0.0000 0.0000
Variable Pricing - Growth Plan 0.0000 0.0000 0.0000
Fixed Pricing - Direct Dividend Plan 0.0000 0.0000 0.0000
Fixed Pricing - Direct Growth Plan 0.0000 0.0000 0.0000
Variable Pricing - Direct Dividend Plan 0.0000 0.0000 0.0000
Variable Pricing - Direct Growth Plan 0.0000 0.0000 0.0000
(h) Ratio of expenses to average daily net assets by Percentage* 1.59% 1.16% 1.22%
(i) Ratio of income to average daily net assets by Percentage (excluding transfer to revenue account from past year's reserve but including net change in unrealized appreciation /depreciation in value of Investments and adjusted for net loss on sale / redemption of investments) 18.15% 27.86% 29.67%
*Annualised **Based on the maximum load during the year Per unit calculations based on number of units in issue at the end of the period.

129
INDEPENDENT AUDITOR’S REPORT To the Trustees of Sahara Mutual Fund- Sahara Infrastructure Fund Report on the Audit of the Financial Statements Opinion We have audited the accompanying financial statements of Sahara Mutual Fund – Sahara Infrastructure Fund (“the Scheme”), which comprise the Balance Sheet as at March 31, 2019, the Revenue Account and the Cash Flow Statement for the year then ended, and noted to the financial statements, including a summary of significant accounting policies and other explanatory information. In our opinion and to the best of our information and according to the explanations given to us, the aforesaid financial statements of the scheme give the information specified in the Ninth Schedule to the Securities and Exchange Board of India (Mutual Funds) Regulations, 1996 and amendments thereto (“the SEBI Regulations”), as applicable, in the manner so required and give a true and fair view in conformity with the accounting principles generally accepted in India: (a) in the case of the Balance Sheet, of the state of affairs of the Scheme as at March 31, 2019; (b) in the case of the Revenue Account, of the surplus for the year ended on that date. (c) in the case of the Cash Flow Statement, of the cash flows for the year ended on that date. Basis for Opinion We conducted our audit of the financial statements in accordance with the Standards on Auditing (SAs) issued by the Institute of Chartered Accountants of India (“ICAI). Our responsibilities under those Standards are further described in the Auditor’s Responsibilities for the Audit of the Financial Statements section of our report. We are independent of the Trust/Scheme in accordance with the Code of Ethics issued by the Institute of Chartered Accountants of India together with the independence requirements that are relevant to our audit of the financial statements of the Scheme. Our audit has been conducted in accordance with the accounting policies and standards specified in the SEBI Regulations and amendments thereto, as applicable and we have fulfilled our other ethical responsibilities in accordance with these requirements and the Code of Ethics. We believe that the audit evidence we have obtained is sufficient and appropriate to provide a basis for our opinion. Emphasis of Matter We draw attention to the following matter in the Notes to the financial statements: e) Note no. 8.17 which states, inter alia, that Sahara Mutual Fund had requested SEBI in January 2018 to
extend the date of cancellation of ‘Certificate of registration’ till 27th July, 2018 considering the lock in period of certain unit holders’ investments in Sahara Tax gain fund as well as for giving time for identification of a new sponsor. However, SEBI ordered for winding up of all schemes against which Sahara Mutual Fund appealed before SAT for a stay of SEBI order. In the meanwhile, a new sponsor was identified for Sahara Mutual Fund viz., One Life Capital Advisors Limited.
SAT vide its order dated 3rd May,2018 directed that SEBI shall not enforce the orders impugned in the appeals till a decision on new sponsor’s application is communicated. The above indicates the existence of a material uncertainty that may cast significant doubt about Sahara Mutual Fund’s ability to continue as a going concern. However, the financial statements of the Scheme have been prepared on a going concern basis, pending the decision of the SEBI on the sponsor.
f) Note no. 8.18 which states that minimum four Trustees are required as per Reg. 15(1) read with para 22
of the Third Schedule (Contents of Trust Deed) of SEBI (Mutual Funds) Regulations 1996, has not been complied with.
c) As per the Reg. 21(1)(f), of SEBI (Mutual Funds) Regulations, 1996 and in compliance with the notification of Securities and Exchange Board of India (Mutual Funds) (Amendment) Regulations, 2014 dated May 6, 2014, the AMC should have maintained a Net Worth of minimum Rs.50 crs. The Net Worth of SAMC as on March 31, 2019 was Rs.5.02 crs (refer Note 8.19); thereby net worth criteria has not been complied with.
Our opinion is not modified in respect of the above matter.

130
Responsibilities of the Management and Those Charged with Governance for the Financial Statements The Trustees of Sahara Mutual Fund and the Board of Directors of Sahara Asset Management Company Private Limited (the “Directors”) are responsible for the preparation of these financial statements that give a true and fair view of the financial position and financial performance of the Scheme in accordance with the accounting policies and standards specified in the SEBI Regulations and amendments thereto, as applicable. This responsibility also includes maintenance of adequate accounting records for safeguarding the assets of the Scheme and for preventing and detecting frauds and other irregularities; selection and application of appropriate accounting policies; making judgements and estimates that are reasonable and prudent; and design, implementation and maintenance of adequate internal financial controls, that were operating effectively for ensuring the accuracy and completeness of the accounting records, relevant to the preparation and presentation of the financial statements that give a true and fair view and are free from material misstatement, whether due to fraud or error. In preparing the financial statements, management is responsible for assessing the Scheme’s ability to continue as a going concern, disclosing , as applicable, matters related to going concern and using the going concern basis of accounting unless management either intends to liquidate the Scheme or to cease operations or has no realistic alternative but to do so. Those charged with Governance are also responsible for overseeing the Scheme’s financial reporting process. Auditor’s Responsibility for the Audit of the Financial Statements Our objectives are to obtain reasonable assurance about whether the standalone financial statements as a whole are free from material misstatement, whether due to fraud or error, and to issue an auditor’s report that includes our opinion. Reasonable assurance is a high level of assurance, but is not a guarantee that an audit conducted in accordance with SAs will always detect a material misstatement when it exists. Misstatements can arise from fraud or error and are considered material if ,individually or in the aggregate, they could reasonably be expected to influence the economic decisions of users taken on the basis of these standalone financial statements. As part of an audit in accordance with SAs, we exercise professional judgment and maintain professional skepticism throughout the audit. We also: • Identify and assess the risks of material misstatement of the standalone financial statements, whether due to fraud or error, design and perform audit procedures responsive to those risks, and obtain audit evidence that is sufficient and appropriate to provide a basis for our opinion. The risk of not detecting a material misstatement resulting from fraud is higher than for one resulting from error, as fraud may involve collusion, forgery, intentional omissions, misrepresentations, or the override of internal control. • Obtain an understanding of internal financial controls relevant to the audit in order to design audit procedures that are appropriate in the circumstances, but not for the purpose of expressing an opinion on effectiveness of the Company’s internal financial controls. • Evaluate the appropriateness of accounting policies used and the reasonableness of accounting estimates and related disclosures made by management. • Conclude on the appropriateness of management’s use of the going concern basis of accounting and, based on the audit evidence obtained, whether a material uncertainty exists related to events or conditions that may cast significant doubt on the ability of the Company to continue as a going concern. If we conclude that a material uncertainty exists, we are required to draw attention in our auditor’s report to the related disclosures in the standalone financial statements or, if such disclosures are inadequate, to modify our opinion. Our conclusions are based on the audit evidence obtained up to the date of our auditor’s report. However, future events or conditions may cause the Company to cease to continue as a going concern. • Evaluate the overall presentation, structure and content of the standalone financial statements, including the disclosures, and whether the standalone financial statements represent the underlying transactions and events in a manner that achieves fair presentation.

131
We communicate with those charged with governance regarding, among other matters, the planned scope and timing of the audit and significant audit findings, including any significant deficiencies in internal control that we identify during our audit. We also provide those charged with governance with a statement that we have complied with relevant ethical requirements regarding independence, and to communicate with them all relationships and other matters that may reasonably be thought to bear on our independence, and where applicable, related safeguards.
Report on Other Legal and Regulatory Requirements
As required by the Securities and Exchange Board of India (Mutual Funds) Regulations, 1996 and amendments thereto, as applicable, we report that: a) We have sought and obtained all the information and explanations, which to the best of our knowledge and belief were necessary for the purpose of our audit. b) The Balance Sheet and Revenue Account dealt with by this Report are in agreement with the books of account of the Scheme. c) The statement of account has been prepared in accordance with the accounting policies and standards specified in the SEBI Regulations and amendments thereto, as applicable. d) We have reviewed the Valuation Policy being followed for the schemes of Sahara Mutual Fund. The Valuation Policy implemented for the Scheme is in line with the SEBI guidelines issued in this regard.
For Chaturvedi & Partners. Chartered Accountants (Firm’s Registration No. 307068E) Khyati Shah (Partner) Mem. No. 117510 Place: Mumbai Date: July 19, 2019
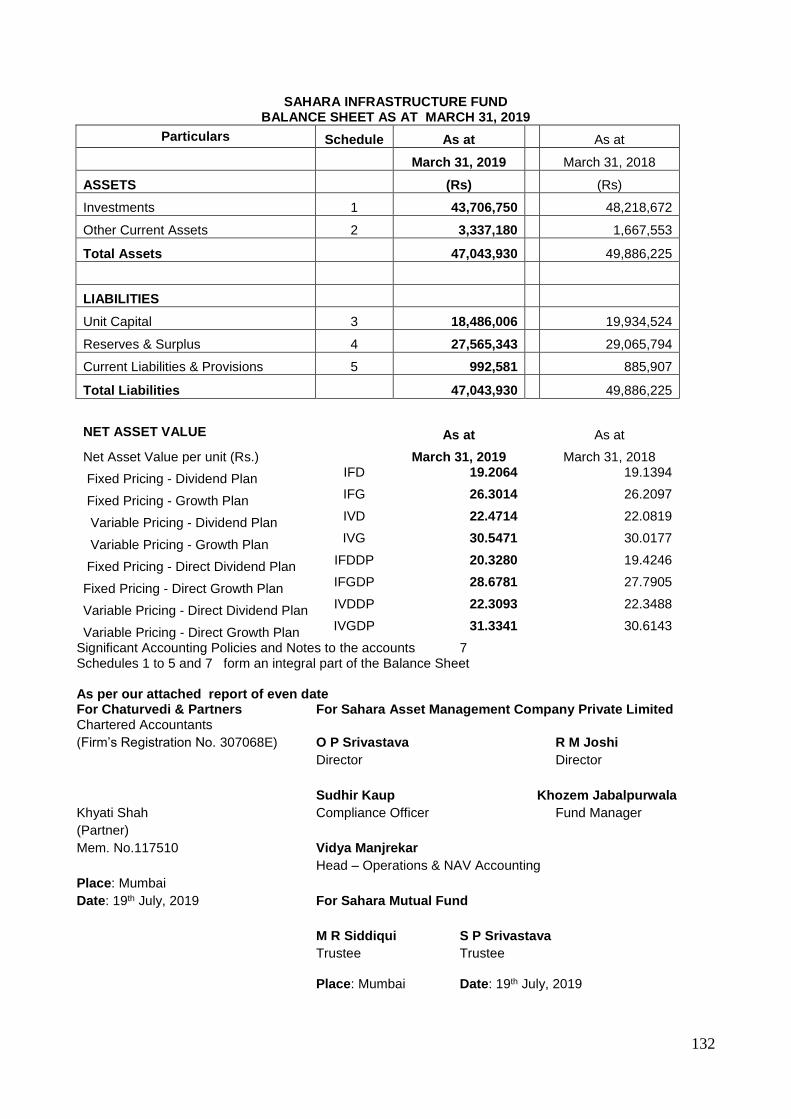
132
SAHARA INFRASTRUCTURE FUND BALANCE SHEET AS AT MARCH 31, 2019
Particulars Schedule As at As at
March 31, 2019 March 31, 2018
ASSETS (Rs) (Rs)
Investments 1 43,706,750 48,218,672
Other Current Assets 2 3,337,180 1,667,553
Total Assets 47,043,930 49,886,225
LIABILITIES
Unit Capital 3 18,486,006 19,934,524
Reserves & Surplus 4 27,565,343 29,065,794
Current Liabilities & Provisions 5 992,581 885,907
Total Liabilities 47,043,930 49,886,225
NET ASSET VALUE As at As at
Net Asset Value per unit (Rs.) March 31, 2019 March 31, 2018
Fixed Pricing - Dividend Plan IFD 19.2064
19.1394
Fixed Pricing - Growth Plan IFG 26.3014
26.2097
Variable Pricing - Dividend Plan IVD 22.4714
22.0819
Variable Pricing - Growth Plan IVG 30.5471
30.0177
Fixed Pricing - Direct Dividend Plan IFDDP 20.3280
19.4246
Fixed Pricing - Direct Growth Plan IFGDP 28.6781
27.7905
Variable Pricing - Direct Dividend Plan IVDDP 22.3093
22.3488
Variable Pricing - Direct Growth Plan IVGDP 31.3341
30.6143
Significant Accounting Policies and Notes to the accounts 7 Schedules 1 to 5 and 7 form an integral part of the Balance Sheet
As per our attached report of even date For Chaturvedi & Partners For Sahara Asset Management Company Private Limited Chartered Accountants
(Firm’s Registration No. 307068E) O P Srivastava R M Joshi
Director Director
Sudhir Kaup Khozem Jabalpurwala
Khyati Shah Compliance Officer Fund Manager
(Partner)
Mem. No.117510 Vidya Manjrekar
Head – Operations & NAV Accounting
Place: Mumbai
Date: 19th July, 2019 For Sahara Mutual Fund
M R Siddiqui S P Srivastava
Trustee Trustee Place: Mumbai Date: 19th July, 2019
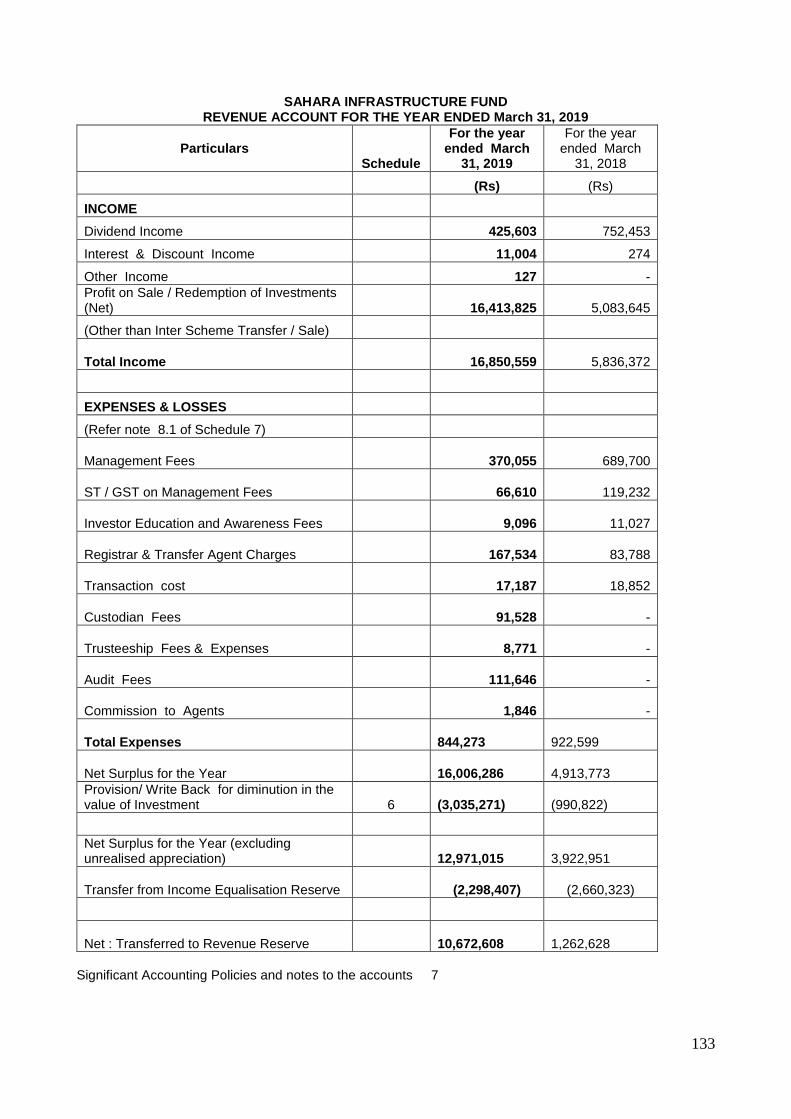
133
SAHARA INFRASTRUCTURE FUND REVENUE ACCOUNT FOR THE YEAR ENDED March 31, 2019
Particulars Schedule
For the year ended March
31, 2019
For the year ended March
31, 2018
(Rs) (Rs)
INCOME
Dividend Income 425,603 752,453
Interest & Discount Income 11,004 274
Other Income 127 -
Profit on Sale / Redemption of Investments (Net) 16,413,825 5,083,645
(Other than Inter Scheme Transfer / Sale)
Total Income
16,850,559
5,836,372
EXPENSES & LOSSES
(Refer note 8.1 of Schedule 7)
Management Fees
370,055
689,700
ST / GST on Management Fees
66,610
119,232
Investor Education and Awareness Fees
9,096
11,027
Registrar & Transfer Agent Charges
167,534
83,788
Transaction cost
17,187
18,852
Custodian Fees
91,528 -
Trusteeship Fees & Expenses
8,771 -
Audit Fees
111,646 -
Commission to Agents
1,846 -
Total Expenses 844,273
922,599
Net Surplus for the Year 16,006,286
4,913,773
Provision/ Write Back for diminution in the value of Investment 6
(3,035,271)
(990,822)
Net Surplus for the Year (excluding unrealised appreciation)
12,971,015
3,922,951
Transfer from Income Equalisation Reserve
(2,298,407)
(2,660,323)
Net : Transferred to Revenue Reserve 10,672,608
1,262,628
Significant Accounting Policies and notes to the accounts 7
134
Schedules 6 to 7 form an integral part of the Revenue Account
As per our attached report of even date For Chaturvedi & Partners For Sahara Asset Management Company Private Limited Chartered Accountants
(Firm’s Registration No. 307068E) O P Srivastava R M Joshi
Director Director
Sudhir Kaup Khozem Jabalpurwala
Khyati Shah Compliance Officer Fund Manager
(Partner)
Mem. No.117510 Vidya Manjrekar
Head – Operations & NAV Accounting
Place: Mumbai
Date: 19th July, 2019 For Sahara Mutual Fund
M R Siddiqui S P Srivastava
Trustee Trustee Place: Mumbai Date: 19th July, 2019
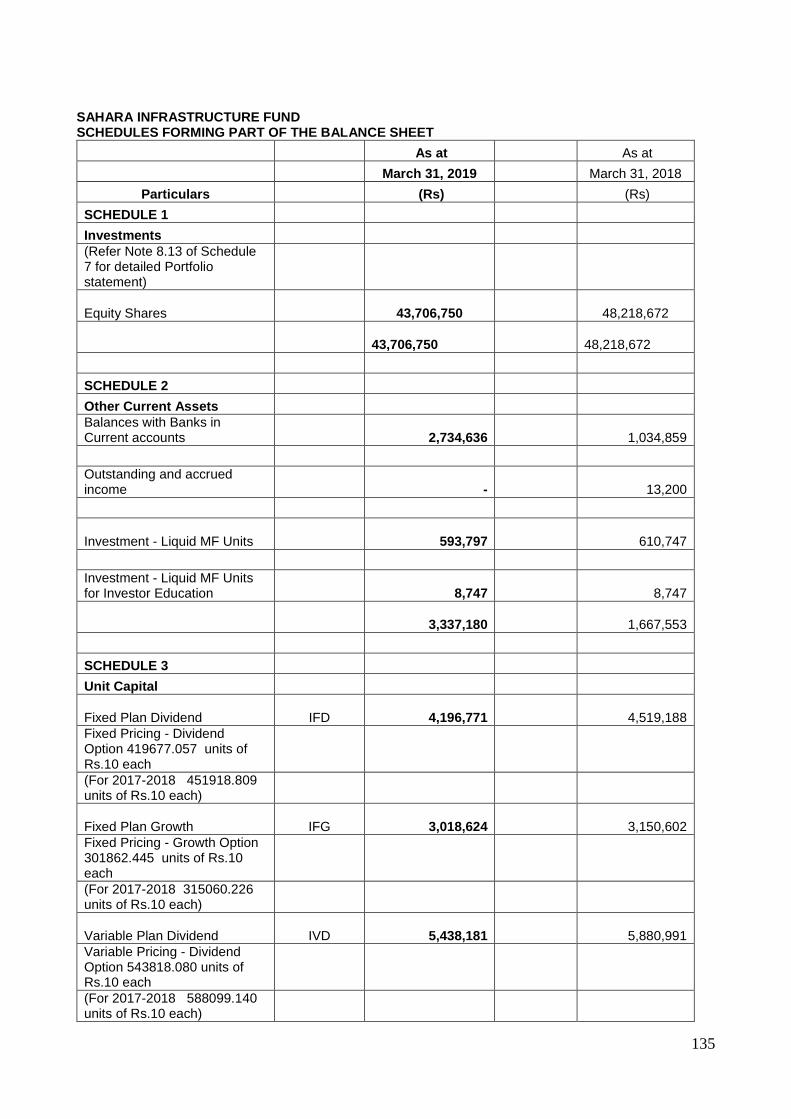
135
SAHARA INFRASTRUCTURE FUND SCHEDULES FORMING PART OF THE BALANCE SHEET
As at As at
March 31, 2019 March 31, 2018
Particulars (Rs) (Rs)
SCHEDULE 1
Investments
(Refer Note 8.13 of Schedule 7 for detailed Portfolio statement)
Equity Shares
43,706,750
48,218,672
43,706,750
48,218,672
SCHEDULE 2
Other Current Assets
Balances with Banks in Current accounts
2,734,636
1,034,859
Outstanding and accrued income -
13,200
Investment - Liquid MF Units 593,797
610,747
Investment - Liquid MF Units for Investor Education 8,747
8,747
3,337,180
1,667,553
SCHEDULE 3
Unit Capital
Fixed Plan Dividend IFD
4,196,771
4,519,188
Fixed Pricing - Dividend Option 419677.057 units of Rs.10 each
(For 2017-2018 451918.809 units of Rs.10 each)
Fixed Plan Growth IFG
3,018,624
3,150,602
Fixed Pricing - Growth Option 301862.445 units of Rs.10 each
(For 2017-2018 315060.226 units of Rs.10 each)
Variable Plan Dividend IVD
5,438,181
5,880,991
Variable Pricing - Dividend Option 543818.080 units of Rs.10 each
(For 2017-2018 588099.140 units of Rs.10 each)
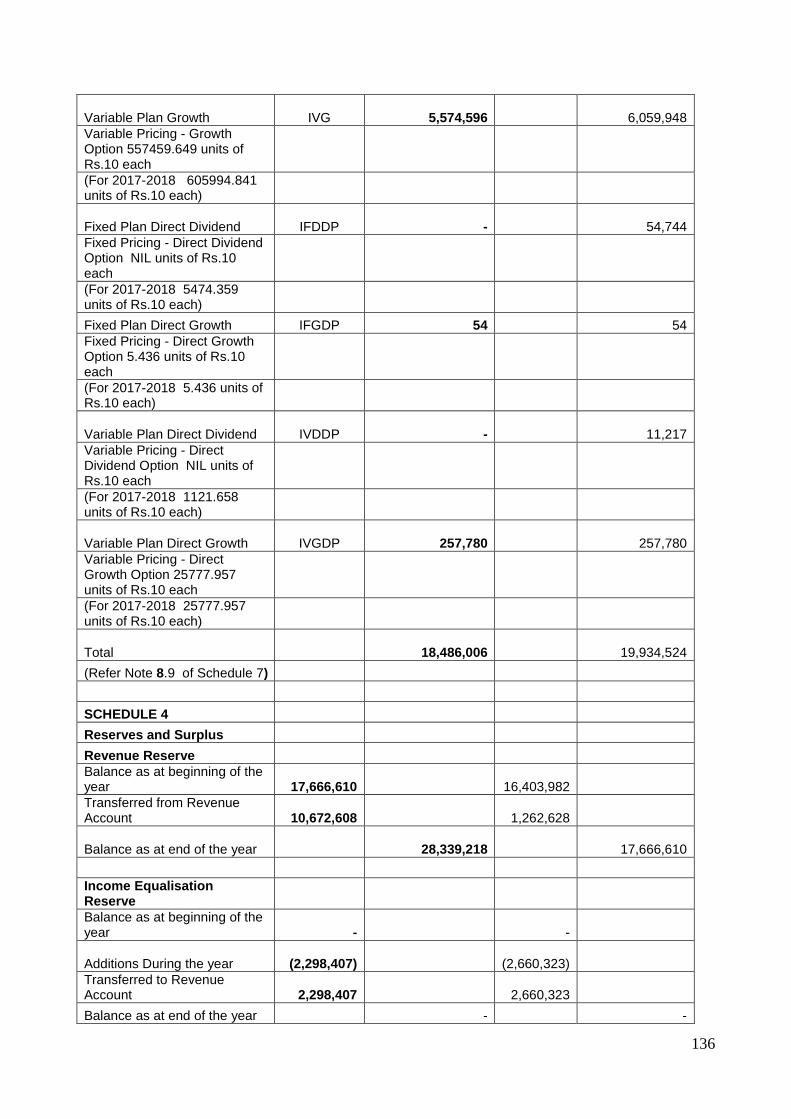
136
Variable Plan Growth IVG
5,574,596
6,059,948
Variable Pricing - Growth Option 557459.649 units of Rs.10 each
(For 2017-2018 605994.841 units of Rs.10 each)
Fixed Plan Direct Dividend IFDDP -
54,744
Fixed Pricing - Direct Dividend Option NIL units of Rs.10 each
(For 2017-2018 5474.359 units of Rs.10 each)
Fixed Plan Direct Growth IFGDP 54 54
Fixed Pricing - Direct Growth Option 5.436 units of Rs.10 each
(For 2017-2018 5.436 units of Rs.10 each)
Variable Plan Direct Dividend IVDDP -
11,217
Variable Pricing - Direct Dividend Option NIL units of Rs.10 each
(For 2017-2018 1121.658 units of Rs.10 each)
Variable Plan Direct Growth IVGDP 257,780
257,780
Variable Pricing - Direct Growth Option 25777.957 units of Rs.10 each
(For 2017-2018 25777.957 units of Rs.10 each)
Total
18,486,006
19,934,524
(Refer Note 8.9 of Schedule 7)
SCHEDULE 4
Reserves and Surplus
Revenue Reserve
Balance as at beginning of the year 17,666,610
16,403,982
Transferred from Revenue Account 10,672,608
1,262,628
Balance as at end of the year
28,339,218
17,666,610
Income Equalisation Reserve
Balance as at beginning of the year - -
Additions During the year
(2,298,407)
(2,660,323)
Transferred to Revenue Account 2,298,407
2,660,323
Balance as at end of the year - -
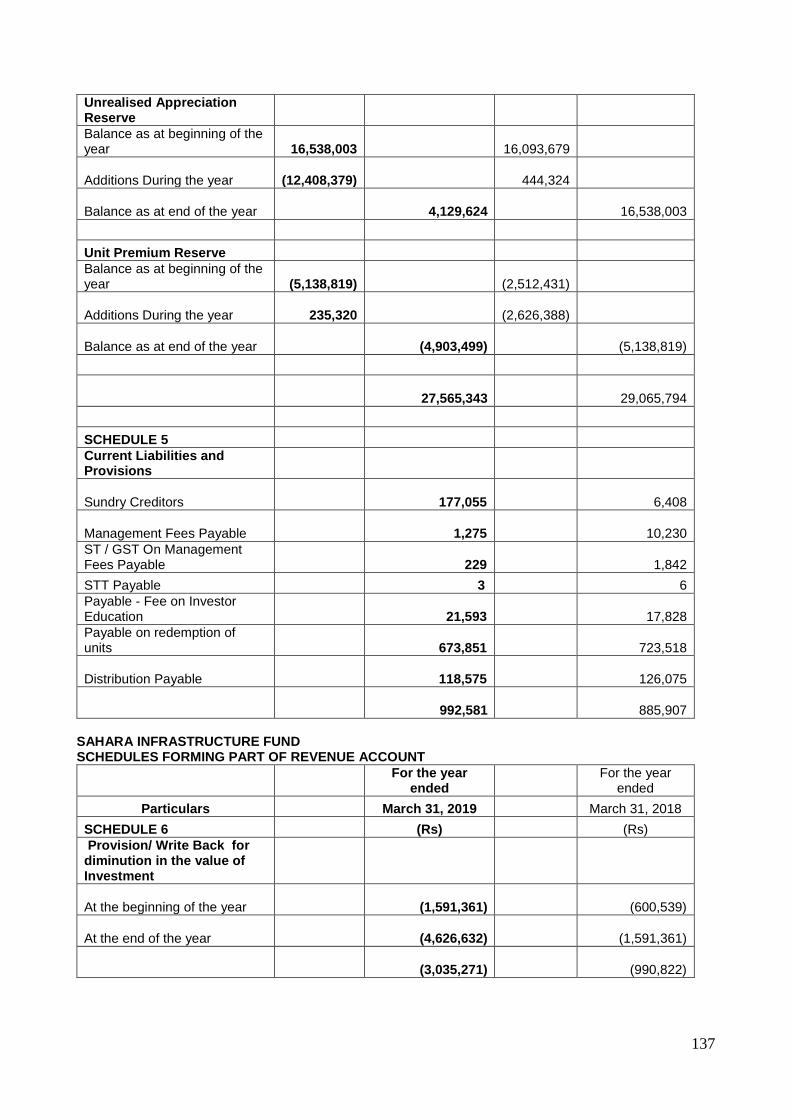
137
Unrealised Appreciation Reserve
Balance as at beginning of the year 16,538,003
16,093,679
Additions During the year
(12,408,379)
444,324
Balance as at end of the year
4,129,624
16,538,003
Unit Premium Reserve
Balance as at beginning of the year
(5,138,819)
(2,512,431)
Additions During the year 235,320
(2,626,388)
Balance as at end of the year
(4,903,499)
(5,138,819)
27,565,343
29,065,794
SCHEDULE 5
Current Liabilities and Provisions
Sundry Creditors 177,055
6,408
Management Fees Payable 1,275
10,230
ST / GST On Management Fees Payable 229
1,842
STT Payable 3 6
Payable - Fee on Investor Education 21,593
17,828
Payable on redemption of units 673,851
723,518
Distribution Payable 118,575
126,075
992,581
885,907
SAHARA INFRASTRUCTURE FUND SCHEDULES FORMING PART OF REVENUE ACCOUNT
For the year
ended For the year
ended
Particulars March 31, 2019 March 31, 2018
SCHEDULE 6 (Rs) (Rs)
Provision/ Write Back for diminution in the value of Investment
At the beginning of the year
(1,591,361)
(600,539)
At the end of the year
(4,626,632)
(1,591,361)
(3,035,271)
(990,822)
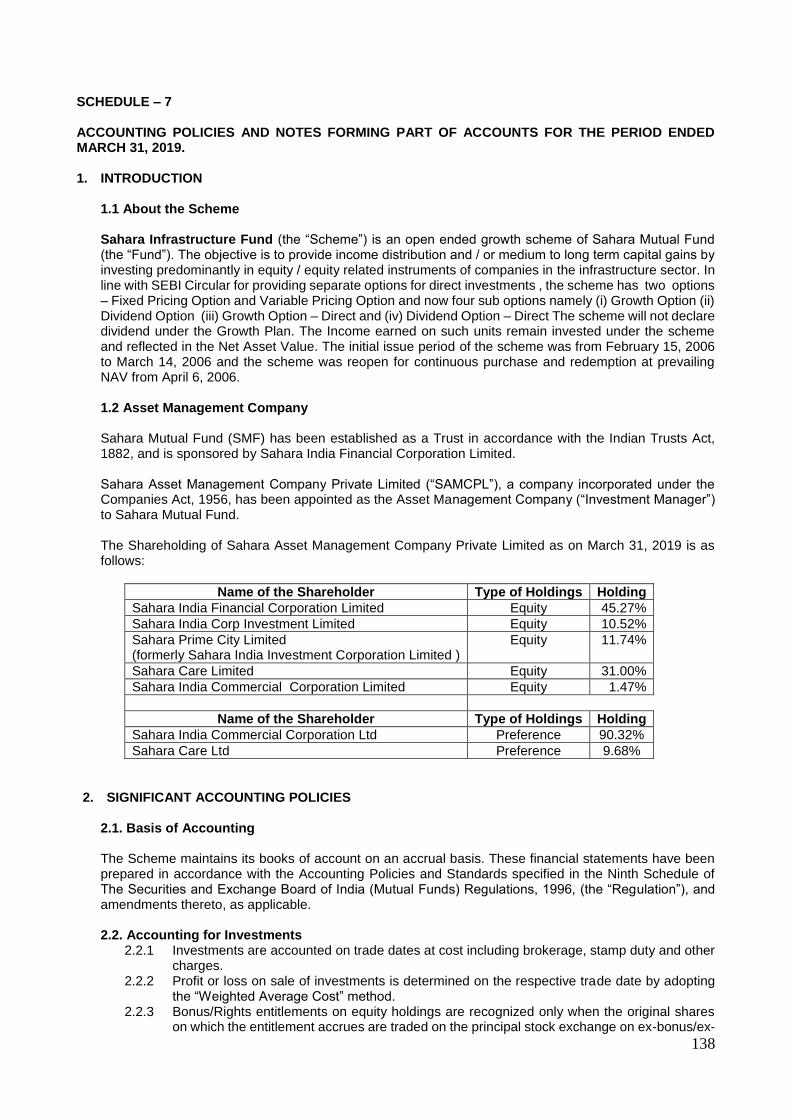
138
SCHEDULE – 7 ACCOUNTING POLICIES AND NOTES FORMING PART OF ACCOUNTS FOR THE PERIOD ENDED MARCH 31, 2019. 1. INTRODUCTION
1.1 About the Scheme Sahara Infrastructure Fund (the “Scheme”) is an open ended growth scheme of Sahara Mutual Fund (the “Fund”). The objective is to provide income distribution and / or medium to long term capital gains by investing predominantly in equity / equity related instruments of companies in the infrastructure sector. In line with SEBI Circular for providing separate options for direct investments , the scheme has two options – Fixed Pricing Option and Variable Pricing Option and now four sub options namely (i) Growth Option (ii) Dividend Option (iii) Growth Option – Direct and (iv) Dividend Option – Direct The scheme will not declare dividend under the Growth Plan. The Income earned on such units remain invested under the scheme and reflected in the Net Asset Value. The initial issue period of the scheme was from February 15, 2006 to March 14, 2006 and the scheme was reopen for continuous purchase and redemption at prevailing NAV from April 6, 2006.
1.2 Asset Management Company
Sahara Mutual Fund (SMF) has been established as a Trust in accordance with the Indian Trusts Act, 1882, and is sponsored by Sahara India Financial Corporation Limited. Sahara Asset Management Company Private Limited (“SAMCPL”), a company incorporated under the Companies Act, 1956, has been appointed as the Asset Management Company (“Investment Manager”) to Sahara Mutual Fund.
The Shareholding of Sahara Asset Management Company Private Limited as on March 31, 2019 is as follows:
Name of the Shareholder Type of Holdings Holding
Sahara India Financial Corporation Limited Equity 45.27%
Sahara India Corp Investment Limited Equity 10.52%
Sahara Prime City Limited (formerly Sahara India Investment Corporation Limited )
Equity 11.74%
Sahara Care Limited Equity 31.00%
Sahara India Commercial Corporation Limited Equity 1.47%
Name of the Shareholder Type of Holdings Holding
Sahara India Commercial Corporation Ltd Preference 90.32%
Sahara Care Ltd Preference 9.68%
2. SIGNIFICANT ACCOUNTING POLICIES
2.1. Basis of Accounting
The Scheme maintains its books of account on an accrual basis. These financial statements have been prepared in accordance with the Accounting Policies and Standards specified in the Ninth Schedule of The Securities and Exchange Board of India (Mutual Funds) Regulations, 1996, (the “Regulation”), and amendments thereto, as applicable. 2.2. Accounting for Investments
2.2.1 Investments are accounted on trade dates at cost including brokerage, stamp duty and other charges.
2.2.2 Profit or loss on sale of investments is determined on the respective trade date by adopting the “Weighted Average Cost” method.
2.2.3 Bonus/Rights entitlements on equity holdings are recognized only when the original shares on which the entitlement accrues are traded on the principal stock exchange on ex-bonus/ex-
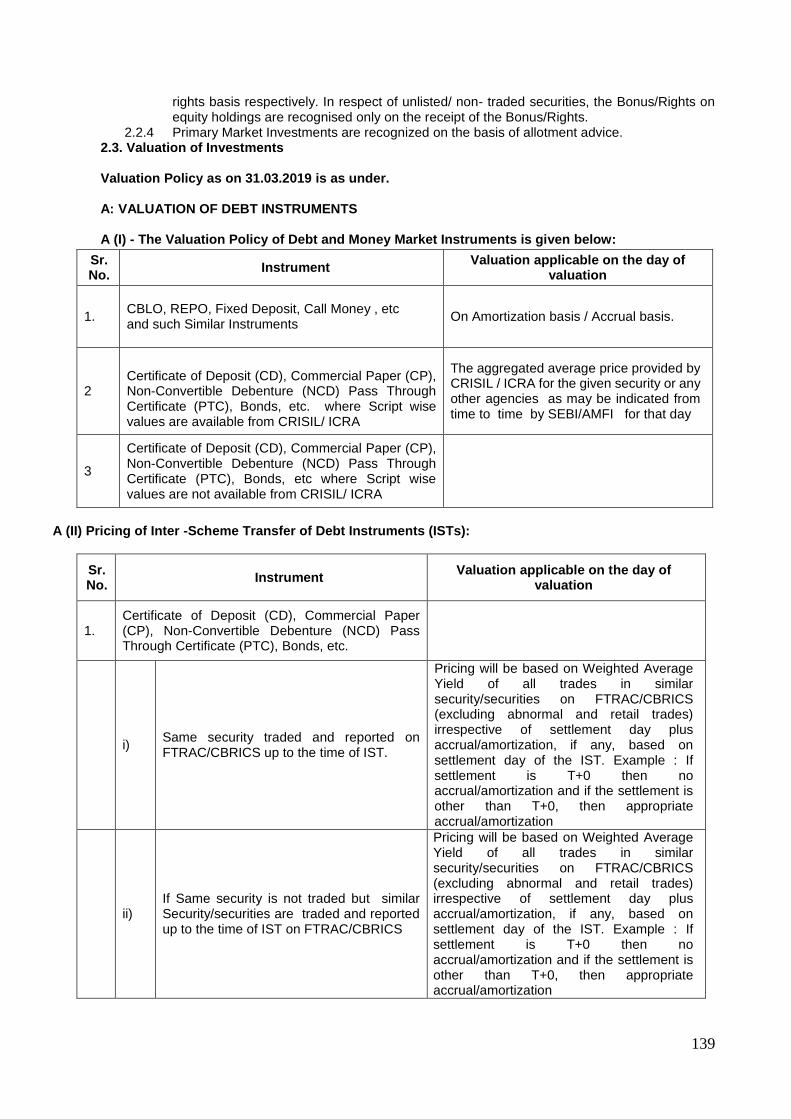
139
rights basis respectively. In respect of unlisted/ non- traded securities, the Bonus/Rights on equity holdings are recognised only on the receipt of the Bonus/Rights.
2.2.4 Primary Market Investments are recognized on the basis of allotment advice. 2.3. Valuation of Investments
Valuation Policy as on 31.03.2019 is as under.
A: VALUATION OF DEBT INSTRUMENTS
A (I) - The Valuation Policy of Debt and Money Market Instruments is given below:
A (II) Pricing of Inter -Scheme Transfer of Debt Instruments (ISTs):
Sr. No.
Instrument Valuation applicable on the day of
valuation
1. Certificate of Deposit (CD), Commercial Paper (CP), Non-Convertible Debenture (NCD) Pass Through Certificate (PTC), Bonds, etc.
i) Same security traded and reported on FTRAC/CBRICS up to the time of IST.
Pricing will be based on Weighted Average Yield of all trades in similar security/securities on FTRAC/CBRICS (excluding abnormal and retail trades) irrespective of settlement day plus accrual/amortization, if any, based on settlement day of the IST. Example : If settlement is T+0 then no accrual/amortization and if the settlement is other than T+0, then appropriate accrual/amortization
ii) If Same security is not traded but similar Security/securities are traded and reported up to the time of IST on FTRAC/CBRICS
Pricing will be based on Weighted Average Yield of all trades in similar security/securities on FTRAC/CBRICS (excluding abnormal and retail trades) irrespective of settlement day plus accrual/amortization, if any, based on settlement day of the IST. Example : If settlement is T+0 then no accrual/amortization and if the settlement is other than T+0, then appropriate accrual/amortization
Sr. No.
Instrument Valuation applicable on the day of
valuation
1.
CBLO, REPO, Fixed Deposit, Call Money , etc and such Similar Instruments
On Amortization basis / Accrual basis.
2
Certificate of Deposit (CD), Commercial Paper (CP), Non-Convertible Debenture (NCD) Pass Through Certificate (PTC), Bonds, etc. where Script wise values are available from CRISIL/ ICRA
The aggregated average price provided by CRISIL / ICRA for the given security or any other agencies as may be indicated from time to time by SEBI/AMFI for that day
3
Certificate of Deposit (CD), Commercial Paper (CP), Non-Convertible Debenture (NCD) Pass Through Certificate (PTC), Bonds, etc where Script wise values are not available from CRISIL/ ICRA
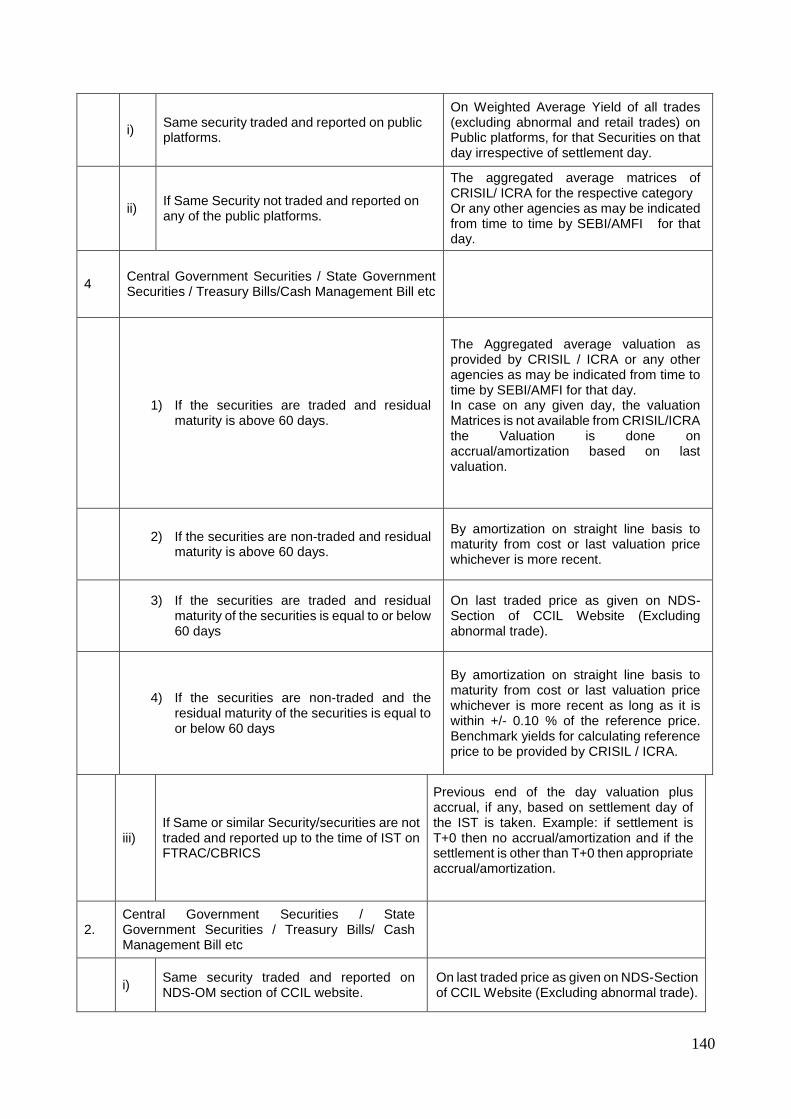
140
iii) If Same or similar Security/securities are not traded and reported up to the time of IST on FTRAC/CBRICS
Previous end of the day valuation plus accrual, if any, based on settlement day of the IST is taken. Example: if settlement is T+0 then no accrual/amortization and if the settlement is other than T+0 then appropriate accrual/amortization.
2. Central Government Securities / State Government Securities / Treasury Bills/ Cash Management Bill etc
i) Same security traded and reported on NDS-OM section of CCIL website.
On last traded price as given on NDS-Section of CCIL Website (Excluding abnormal trade).
i) Same security traded and reported on public platforms.
On Weighted Average Yield of all trades (excluding abnormal and retail trades) on Public platforms, for that Securities on that day irrespective of settlement day.
ii) If Same Security not traded and reported on any of the public platforms.
The aggregated average matrices of CRISIL/ ICRA for the respective category Or any other agencies as may be indicated from time to time by SEBI/AMFI for that day.
4 Central Government Securities / State Government Securities / Treasury Bills/Cash Management Bill etc
1) If the securities are traded and residual
maturity is above 60 days.
The Aggregated average valuation as provided by CRISIL / ICRA or any other agencies as may be indicated from time to time by SEBI/AMFI for that day. In case on any given day, the valuation Matrices is not available from CRISIL/ICRA the Valuation is done on accrual/amortization based on last valuation.
2) If the securities are non-traded and residual
maturity is above 60 days.
By amortization on straight line basis to maturity from cost or last valuation price whichever is more recent.
3) If the securities are traded and residual
maturity of the securities is equal to or below 60 days
On last traded price as given on NDS-Section of CCIL Website (Excluding abnormal trade).
4) If the securities are non-traded and the
residual maturity of the securities is equal to or below 60 days
By amortization on straight line basis to maturity from cost or last valuation price whichever is more recent as long as it is within +/- 0.10 % of the reference price. Benchmark yields for calculating reference price to be provided by CRISIL / ICRA.
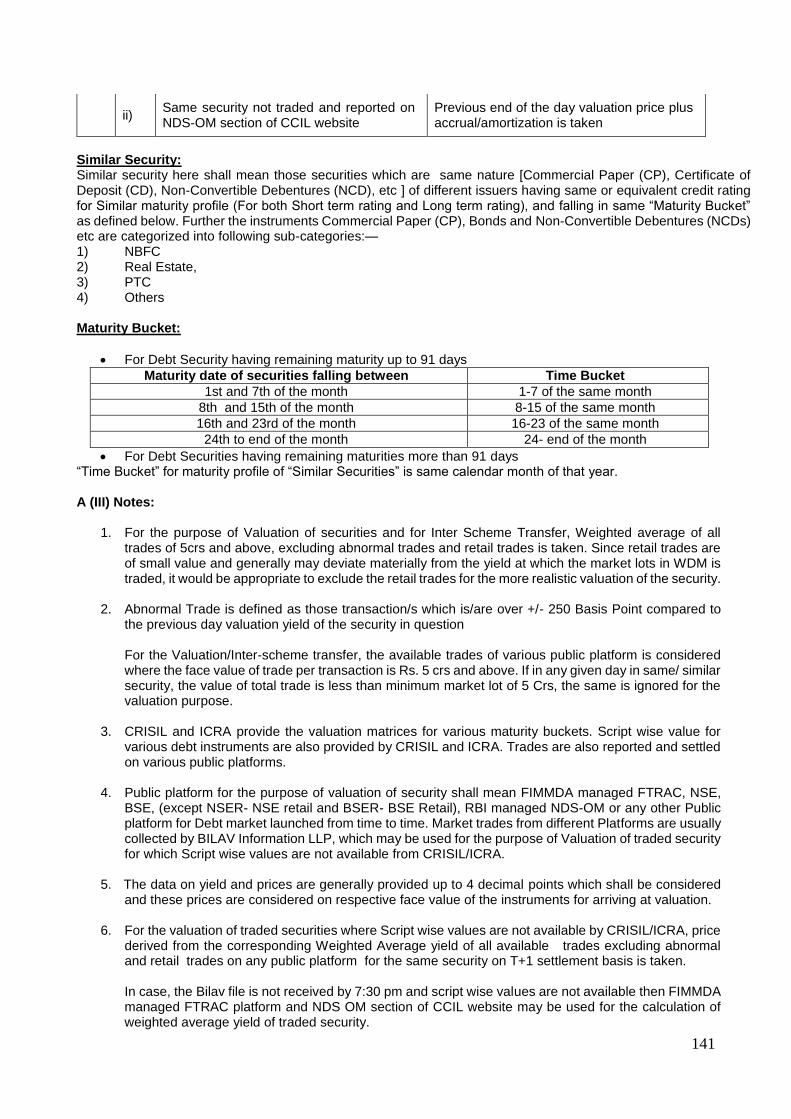
141
ii) Same security not traded and reported on NDS-OM section of CCIL website
Previous end of the day valuation price plus accrual/amortization is taken
Similar Security: Similar security here shall mean those securities which are same nature [Commercial Paper (CP), Certificate of Deposit (CD), Non-Convertible Debentures (NCD), etc ] of different issuers having same or equivalent credit rating for Similar maturity profile (For both Short term rating and Long term rating), and falling in same “Maturity Bucket” as defined below. Further the instruments Commercial Paper (CP), Bonds and Non-Convertible Debentures (NCDs) etc are categorized into following sub-categories:— 1) NBFC 2) Real Estate, 3) PTC 4) Others Maturity Bucket:
For Debt Security having remaining maturity up to 91 days
Maturity date of securities falling between Time Bucket
1st and 7th of the month 1-7 of the same month
8th and 15th of the month 8-15 of the same month
16th and 23rd of the month 16-23 of the same month
24th to end of the month 24- end of the month
For Debt Securities having remaining maturities more than 91 days “Time Bucket” for maturity profile of “Similar Securities” is same calendar month of that year. A (III) Notes:
1. For the purpose of Valuation of securities and for Inter Scheme Transfer, Weighted average of all trades of 5crs and above, excluding abnormal trades and retail trades is taken. Since retail trades are of small value and generally may deviate materially from the yield at which the market lots in WDM is traded, it would be appropriate to exclude the retail trades for the more realistic valuation of the security.
2. Abnormal Trade is defined as those transaction/s which is/are over +/- 250 Basis Point compared to the previous day valuation yield of the security in question For the Valuation/Inter-scheme transfer, the available trades of various public platform is considered where the face value of trade per transaction is Rs. 5 crs and above. If in any given day in same/ similar security, the value of total trade is less than minimum market lot of 5 Crs, the same is ignored for the valuation purpose.
3. CRISIL and ICRA provide the valuation matrices for various maturity buckets. Script wise value for various debt instruments are also provided by CRISIL and ICRA. Trades are also reported and settled on various public platforms.
4. Public platform for the purpose of valuation of security shall mean FIMMDA managed FTRAC, NSE, BSE, (except NSER- NSE retail and BSER- BSE Retail), RBI managed NDS-OM or any other Public platform for Debt market launched from time to time. Market trades from different Platforms are usually collected by BILAV Information LLP, which may be used for the purpose of Valuation of traded security for which Script wise values are not available from CRISIL/ICRA.
5. The data on yield and prices are generally provided up to 4 decimal points which shall be considered and these prices are considered on respective face value of the instruments for arriving at valuation.
6. For the valuation of traded securities where Script wise values are not available by CRISIL/ICRA, price derived from the corresponding Weighted Average yield of all available trades excluding abnormal and retail trades on any public platform for the same security on T+1 settlement basis is taken.
In case, the Bilav file is not received by 7:30 pm and script wise values are not available then FIMMDA managed FTRAC platform and NDS OM section of CCIL website may be used for the calculation of weighted average yield of traded security.
142
7. For non traded securities where Script wise values are not available, the valuation is done on the price
derived from the corresponding the aggregated yield matrices for the respective category as provided by CRISIL/ICRA on T+1 settlement basis.
8. For Government Securities, SDL, T-Bills, Cash Management Bill etc, the valuation is done on
aggregated Script wise pricing as provided by CRISL/ICRA and as applicable for that day. In the absence of Script wise values the valuation is based on aggregated matrices if available from CRISIL/ICRA on T+1 settlement and as applicable for that day.
9. In case the valuation matrices/Script wise value is available either from CRISIL/ICRA up to a
reasonable time limit, the same is considered for arriving at valuation.
10. In respect of on any day neither the Script wise value nor the valuation Matrices is available from CRISIL/ICRA within the reasonable time limit, the Valuation is done on the basis of accrual/amortization based on the last valuation.
B: VALUATION OF EQUITY INSTRUMENTS
1. Traded Equity Securities When an equity security is not traded on any Stock Exchange on a particular valuation day, the value at which it was traded on the selected Stock Exchange, as the case may be, on the earliest previous day is used provided such date is not more than thirty days prior to valuation date. 2. Thinly Traded Equity / Equity Related Securities
(a) When trading in an equity and/or equity related securities (such as convertible debentures, equity warrants etc.) in a month is both less than Rs.5lacs in value and the total volume is less than 50,000 shares, the security is considered as thinly traded security.
(b) In order to determine whether a security is thinly traded or not, the volumes traded in all recognized
Stock Exchanges in India would be taken into account.
(c) Where a Stock Exchange identifies the thinly traded securities by applying the above parameters for the preceding calendar month and publishes or provides the required information along with the daily quotations, the same would be used for valuation.
(d) If the shares are not listed on the Stock Exchanges which provide such information, then we would make our own analysis in line with the above criteria to check whether such securities are thinly traded or not.
3. Non-traded / Suspended Securities When an equity security is not traded on any Stock Exchange for a period of thirty days prior to the valuation date, the Script would be treated as a non traded security. When an equity security is suspended up to thirty days, then the last traded price is considered for valuation of that security. If an equity security is suspended for more than thirty days, then the AMC or Trustees would decide the valuation norms to be followed and such norms would be documented and recorded. The valuation methodology for thinly traded equity securities, Non-traded equity securities would be as follows: Based on the latest available Balance Sheet, net worth would be calculated as follows:
(a) Net Worth per share = [share capital+ reserves (excluding revaluation reserves) – Misc. expenditure and Debit Balance in P&L A/c] Divided by No. of Paid up Shares.
(b) Average capitalization rate (P/E ratio) for the industry based upon NSE prices or BSE prices and discounted by 75% i.e. only 25% of the Industry average P/E would be taken as capitalization rate
143
(P/E ratio). Earnings per Share (EPS) of the latest audited annual accounts would be considered for this purpose.
(c) The value as per the net worth value per share and the capital earning value calculated as above
would be averaged and further discounted by 10% for illiquidity so as to arrive at the fair value per share.
(d) In case the EPS is negative, EPS value for that year would be taken as zero for arriving at capitalized
earning.
(e) In case, where the latest Balance Sheet of the company is not available within nine months from the close of the year, unless the accounting year is changed, the shares of such companies would be valued at zero.
(f) In case, an individual security accounts for more than 5% of the total assets of the scheme, an
Independent Valuer would be appointed for the valuation of the said security. To determine if a security accounts for more than 5 per cent of the total assets of the scheme, it would be valued by the procedure above and the proportion which it bears to the total net assets of the scheme to which it belongs will be compared on the date of valuation.
4. Unlisted Equity Methodology for Valuation - unlisted equity shares of a company would be valued "in good faith" as below:
a) Based on the latest available Balance Sheet, net worth would be calculated as follows:
1. Net Worth per share = [share capital+ reserves (excluding revaluation reserves) – Misc. expenditure and Debit Balance in P&L A/c] Divided by No. of Paid up Shares.
2. After taking into account the outstanding warrants and options, Net Worth per share would again be calculated and is = [Share Capital + consideration on exercise of Option and/or Warrants received/receivable by the Company + Free Reserves (excluding Revaluation Reserves) – Miscellaneous expenditure not written off or deferred revenue expenditure, intangible assets and accumulated losses] / Number of Paid up Shares plus Number of Shares that would be obtained on conversion and/or exercise of Outstanding Warrants and Options.
3. The lower of (1) and (2) above would be used for calculation of Net Worth per share and for further
calculation in (c) below.
b) Average capitalization rate (P/E ratio) for the industry based upon NSE prices or BSE prices and discounted by 75% i.e. only 25% of the Industry average P/E would be taken as capitalization rate (P/E ratio). Earnings per Share (EPS) of the latest audited annual accounts would be considered for this purpose.
c) The value as per the net worth value per share and the capital earning value calculated as above would be averaged and further discounted by 15% for illiquidity so as to arrive at the fair value per share.
The above valuation methodology would be subject to the following conditions:
a) All calculations would be based on audited accounts.
b) If the latest Balance Sheet of the company is not available within nine months from the close of the year, unless the accounting year is changed, the shares of such companies would be valued at zero.
c) If the Net Worth of the company is negative, the share would be marked down to zero.
d) In case the EPS is negative, EPS value for that year would be taken as zero for arriving at capitalized
earning.
144
e) In case an individual security accounts for more than 5 per cent of the total assets of the scheme, an Independent Valuer would be appointed for the valuation of the said security. To determine if a security accounts for more than 5 per cent of the total assets of the scheme, it is valued in accordance with the procedure as mentioned above on the date of valuation.
5. Demerger Generally on demerger, a listed security gets bifurcated into two or more shares. The valuation of these de-merged companies would depend on the following scenarios:
a) Both the shares are traded immediately on de-merger: In this case both the shares would be valued at respective traded prices.
b) Shares of only one company continued to be traded on de-merger: Traded shares would be valued at traded price and the other security would to be valued at traded value on the day before the de merger less value of the traded security post de merger. In case value of the share of de-merged company is equal or in excess of the value of the pre de-merger share, then the non traded share would be valued at zero, till the date it is listed.
c) Both the shares are not traded on de-merger: Shares of de-merged companies would be valued equal
to the pre de merger value up to a period of 30 days from the date of de merger till the date it is listed. The market price of the shares of the de-merged company one day prior to ex-date would be bifurcated over the de-merged shares. The market value of the shares would be bifurcated on a fair value basis, based on available information on the de-merger scheme.
d) In case shares of either of the companies are not traded for more than 30 days: Then it would be treated as unlisted security, and valued accordingly till the date these are listed.
6. Preference Shares
Preference Shares valuation guidelines would be as follows:
a) Traded preference shares would be valued as per traded prices. b) Non traded Preference Shares
(I). Redeemable Preference Shares
i. Convertible preference share would be valued like convertible debentures. In general in respect of convertible debentures and bonds, the non-convertible and convertible components would be valued separately. The non-convertible component would be valued on the same basis as would be applicable to a debt instrument. The convertible component would be valued on the same basis as would be applicable to an equity instrument.
If a convertible preference share does not pay dividend then it would be treated like non convertible debentures.
ii. Non-Convertible preference share would be valued like a debt instrument.
(II). Irredeemable preference shares would be valued on perpetual basis. It is like a constant dividend equity share.
7. Warrants
a) In respect of warrants to subscribe for shares attached to instruments, the warrants would be valued at the value of the share which would be obtained on exercise of the warrants as reduced by the amount which would be payable on exercise of the warrant. A discount similar to the discount to be determined in respect on convertible debentures is deducted to account for the period, which must elapse before the warrant can be exercised.
145
b) In case the warrants are traded separately they would be valued as per the valuation guidelines applicable to Equity Shares.
8. Rights Until they are traded, the value of "rights" shares would be calculated as:
Vr = n ÷ m x (Pex - Pof) Where Vr = Value of rights n = no. of rights offered m = no. of original shares held Pex = Ex-rights price Pof = Rights Offer Price
Where the rights are not treated pari passu with the existing shares, suitable adjustment would be made to the value of rights. Where it is decided not to subscribe for the rights but to renounce them and renunciations are being traded, the rights would be valued at the renunciation value. 9. Derivatives Market values of traded open futures and option contracts would be determined with respect to the exchange on which contracted originally, i.e., a future or an option contracted on the National Stock Exchange (NSE) would be valued at the closing price on the NSE. The price of the same futures and option contract on the Bombay Stock Exchange (BSE) cannot be considered for the purpose of valuation, unless the futures or option itself has been contracted on the BSE. The same will be valued at closing price if the contract is traded on the valuation day. In case there is no trade on valuation day then the same would be valued at Settlement prices. However, the contracts which are going to expire on valuation date would be valued at Settlement prices only. 10. Mutual Fund Units a) In case of traded Mutual Fund schemes, the units would be valued at closing price on the stock exchange
on which they are traded like equity instruments. In case the units are not traded for more than 7 days, last declared Repurchase Price (the price at which Mutual Fund schemes buys its units back) would be considered for valuation.
b) If the last available Repurchase price is older than 7 days, the valuation will be done at the last available NAV reduced by illiquidity discount. The illiquidity discount will be 10% of NAV or as decided by the Valuation Committee.
c) In case of non-traded Mutual Fund scheme, the last declared Repurchase Price (the price at which Mutual Fund schemes buys its units back) would be considered for valuation.
d) In case of Investments made by a scheme into the other scheme of Sahara Mutual Fund, if valuation date being the last day of the financial year falling on a non-business day, then the computed NAV would be considered for valuation on March 31.
Related matters i) In case the income accrued on debt instruments is not received even after 90 days past the due date, the
asset is termed as Non Performing Assets (NPAs) and all provisions/guidelines with respect to income accrual, provisioning etc as contained in SEBI circulars/guidelines issued from time to time shall apply and the valuation of such securities will be done accordingly. In case the company starts servicing the debt, re-schedulement is allowed, the applicable provision in SEBI circulars shall apply for provisioning and reclassification of the asset
ii) In case of any other instruments not covered in the policy above, the same is referred to the Investment and
Valuation Committee which is empowered to take decision.

146
iii) In case of any perceived conflict of interest while valuating the securities, the matter is dealt and decided by Investment and Valuation Committee.
iv) For non– business day the valuation is done on aggregated script wise prices as provided by CRISIL/ICRA.
In absence of Script wise prices the valuation is done on accrual basis/amortization basis based on last valuation
v) In case of exceptional circumstances like, policy announcements by government/regulatory bodies, natural
disasters, public disturbances, extreme volatility in capital market, shut down of market, war etc and on those days if Script wise value or valuation matrices are not available from CRISIL/ICRA and if security is not traded, the valuation for the day is done based on last valuation plus accrual/amortization or as may decided by the Investment and Valuation Committee.
vi) The Valuation Policy is reviewed by the Statutory Auditor at least once in a financial year.
vii) Valuation Policy as updated and approved by the Board of AMC / Board of Trustees is applicable for the
schemes of Sahara Mutual Fund
2.3.1 Valuation of securities not covered under the above valuation policy:
The total exposure in securities, which do not fall under above valuation norms, shall not exceed 5% of the total AUM of the scheme.
In case of any other instruments not covered in the policy above, the same shall be referred to the Investment and Valuation Committee which is empowered to take decision. Investment in such securities is to be valued by a method approved by the Investment and Valuation Committee and the same will be reported to the Board of Trustees. 2.3.2 Unrealised Appreciation/Depreciation. In accordance with the Guidance Note on Accounting for Investments in the Financial Statements of Mutual Funds issued by the Institute of Chartered Accountants of India, the unrealized appreciation determined separately for each individual investment is directly transferred to the “Unrealized Appreciation Reserve Account” i.e. without routing it through the revenue account.
The provision for depreciation in value of investments determined separately for each individual investment is recognized in the revenue account. The loss (realized) on investments sold / transferred during the year is charged to revenue account, instead of being first adjusted against the provision for depreciation, if already created in the prior year, as recommended by the said Guidance Note. However, this departure from the Guidance Note does not have any net impact on the Scheme’s net assets or results for the year.
2.4 Revenue Recognition 2.4.1 Income and Expenses are recognized on accrual basis. 2.4.2 Interest on funds invested in short term deposits with scheduled commercial banks is recognized
on accrual basis. 2.4.3 Dividend income earned by the scheme is recognized on the date the share is quoted on ex-dividend
basis on principal stock exchange. 2.4.4 Proportionate realized gains on investments out of sales / repurchase proceeds at the time of sale
/ repurchase of units are transferred to revenue Account from Unit Premium Reserve.
3. Net Asset Value for Growth/Dividend Options:
The net asset value of the units is determined separately for units issued under the Growth Option, Dividend Option, Growth Option – Direct and Dividend Option – Direct. For reporting the net asset value of the Growth Option, Dividend Option, Growth Option – Direct and Dividend Option - Direct, daily income earned, including realized and unrealized gain or loss in the value of investments and expenses incurred by the scheme are allocated to the options in proportion to the value of the net assets.
147
4. Unit Premium Reserve Account Upon issue and redemption of units, the net premium or discount to the face value of units is adjusted against the unit premium reserve account of the Scheme, after an appropriate amount of the issue proceeds and redemption payout is credited or debited respectively to the income equalization account.
5. Income Equalisation Account
An appropriate part of the sale proceeds or the redemption amount, as the case may be, is transferred to income equalization account. The total distributable surplus (without considering unrealized appreciation) upto the date of issue/ redemption of units has been taken into account for the purpose of ascertaining the amount to be transferred to Equalization Account on a daily basis. The net balance in this account is transferred to the Revenue Account at the end of the year.
6. Load Charges
Service tax on exit load , if any, shall be paid out of the exit load proceeds and exit load net of service tax, if any, shall be credited to the scheme.
7. Unclaimed Redemption. In line with SEBI circular no. MFD/CIR/9/120 /2000 dated November 24, 2000 and SEBI circular no. SEBI/HO/IMD/DF2/CIR/P/2016/37 dated February 25, 2016, the unclaimed redemption and unclaimed dividend amounts may be deployed by the mutual funds in call money market or money market instruments and also be allowed to be invested in a separate plan of Liquid Scheme/ Money Market Mutual Fund scheme floated by Mutual Funds specifically for deployment of the unclaimed amounts. The investors who claim these amounts during a period of three years from the due date shall be paid initial unclaimed amount along with the income earned on its deployment. Investors who claim these amounts after 3 years, shall be paid initial unclaimed amount along with the income earned on its deployment till the end of the third year. After the third year, the income earned on such unclaimed amounts shall be used for the purpose of investor education. Further, AMC shall not be permitted to charge any exit load in this plan and TER (Total Expense Ratio) of such plans shall be capped at 50 bps. The AMC should make continuous effort to remind the investors through letters to take their unclaimed amounts.
8. NOTES TO THE ACCOUNTS
8.1 Management Fees, Trusteeship Fees, Custodian Fees, Scheme Expenses Management Fees
The Management Fee (inclusive of GST) has been computed at 0.96% (P.Y. 1.47%) on average net assets calculated on a daily basis. Under the Variable Pricing Option, the AMC fee earned depends on the scheme's daily performance and the same has been computed on average net assets calculated on a dailybasis. The IMA fees are charged accordingly, on the basis of whether at least one of the two conditions is met.
(a) If NPR < Benchmark and NPR < 0 IMA fees = zero
(b) if either NPR > Benchmark or NPR > 0 Actual IMA fees = ½ of maximum permissible IMA fees
(c) if both NPR > Benchmark and NPR > 0 Actual IMA fees = maximum permissible IMA fees
Net Portfolio Return (NPR) = Gross Portfolio Return(GPR) - Scheme expense
IMA = Investment Management and Advisory fees
GPR = Total Income during the day (Incl Net Appreciation / Depreciation) / Opening Net Assets*100
Benchmark Return = ((Benchmark Value of today – Benchmark Value of yesterday) / Benchmark Value of yesterday)*(100*(365/1.25))
Trusteeship Fees & Expenses In accordance with Deed of Trust dated 18th July 1996 between the Settler and the Trustees, an annual fee of Rs.1,00,000/- per Trustee is payable. During the financial year 2018-19, the Trusteeship fees and
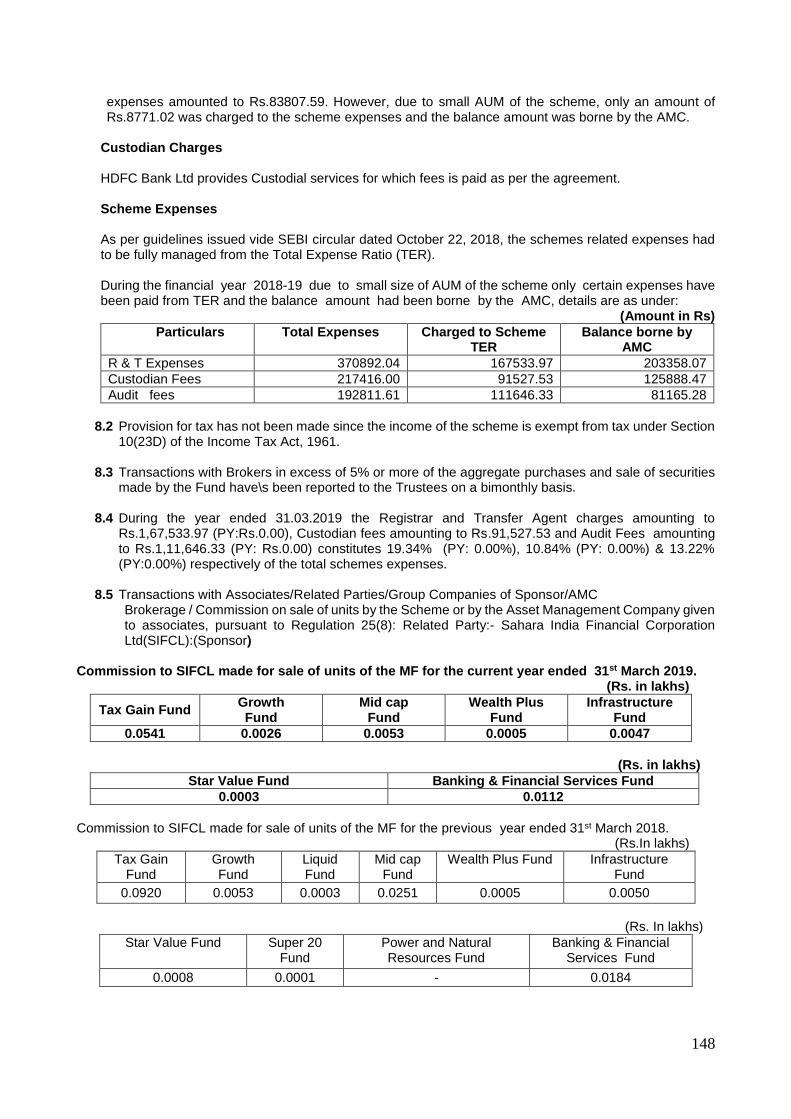
148
expenses amounted to Rs.83807.59. However, due to small AUM of the scheme, only an amount of Rs.8771.02 was charged to the scheme expenses and the balance amount was borne by the AMC.
Custodian Charges
HDFC Bank Ltd provides Custodial services for which fees is paid as per the agreement. Scheme Expenses As per guidelines issued vide SEBI circular dated October 22, 2018, the schemes related expenses had to be fully managed from the Total Expense Ratio (TER).
During the financial year 2018-19 due to small size of AUM of the scheme only certain expenses have been paid from TER and the balance amount had been borne by the AMC, details are as under:
(Amount in Rs)
Particulars Total Expenses Charged to Scheme TER
Balance borne by AMC
R & T Expenses 370892.04 167533.97 203358.07
Custodian Fees 217416.00 91527.53 125888.47
Audit fees 192811.61 111646.33 81165.28
8.2 Provision for tax has not been made since the income of the scheme is exempt from tax under Section
10(23D) of the Income Tax Act, 1961.
8.3 Transactions with Brokers in excess of 5% or more of the aggregate purchases and sale of securities made by the Fund have\s been reported to the Trustees on a bimonthly basis.
8.4 During the year ended 31.03.2019 the Registrar and Transfer Agent charges amounting to Rs.1,67,533.97 (PY:Rs.0.00), Custodian fees amounting to Rs.91,527.53 and Audit Fees amounting to Rs.1,11,646.33 (PY: Rs.0.00) constitutes 19.34% (PY: 0.00%), 10.84% (PY: 0.00%) & 13.22% (PY:0.00%) respectively of the total schemes expenses.
8.5 Transactions with Associates/Related Parties/Group Companies of Sponsor/AMC Brokerage / Commission on sale of units by the Scheme or by the Asset Management Company given to associates, pursuant to Regulation 25(8): Related Party:- Sahara India Financial Corporation Ltd(SIFCL):(Sponsor)
Commission to SIFCL made for sale of units of the MF for the current year ended 31st March 2019.
(Rs. in lakhs)
Tax Gain Fund Growth Fund
Mid cap Fund
Wealth Plus Fund
Infrastructure Fund
0.0541 0.0026 0.0053 0.0005 0.0047
(Rs. in lakhs)
Star Value Fund Banking & Financial Services Fund
0.0003 0.0112
Commission to SIFCL made for sale of units of the MF for the previous year ended 31st March 2018. (Rs.In lakhs)
Tax Gain Fund
Growth Fund
Liquid Fund
Mid cap Fund
Wealth Plus Fund Infrastructure Fund
0.0920 0.0053 0.0003 0.0251 0.0005 0.0050
(Rs. In lakhs)
Star Value Fund Super 20 Fund
Power and Natural Resources Fund
Banking & Financial Services Fund
0.0008 0.0001 - 0.0184
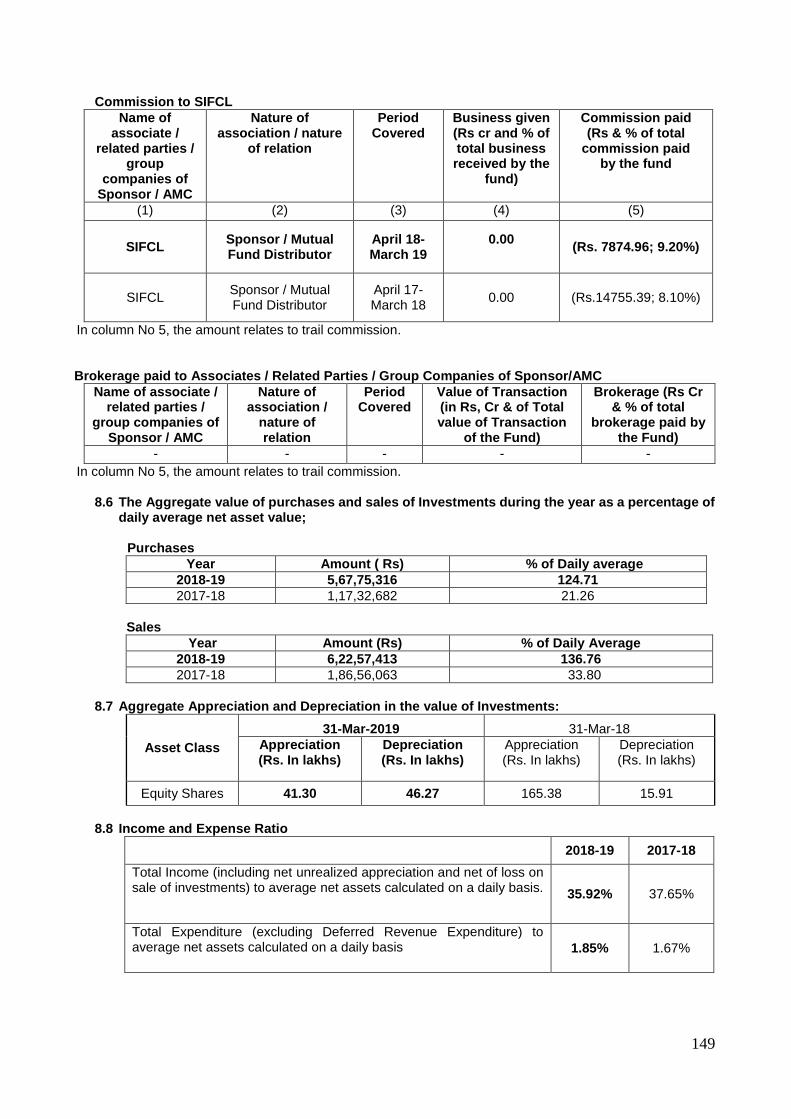
149
Commission to SIFCL
Name of associate /
related parties / group
companies of Sponsor / AMC
Nature of association / nature
of relation
Period Covered
Business given (Rs cr and % of total business received by the
fund)
Commission paid (Rs & % of total
commission paid by the fund
(1) (2) (3) (4) (5)
SIFCL Sponsor / Mutual Fund Distributor
April 18-March 19
0.00
(Rs. 7874.96; 9.20%)
SIFCL Sponsor / Mutual Fund Distributor
April 17-March 18
0.00 (Rs.14755.39; 8.10%)
In column No 5, the amount relates to trail commission.
Brokerage paid to Associates / Related Parties / Group Companies of Sponsor/AMC
Name of associate / related parties /
group companies of Sponsor / AMC
Nature of association /
nature of relation
Period Covered
Value of Transaction (in Rs, Cr & of Total value of Transaction
of the Fund)
Brokerage (Rs Cr & % of total
brokerage paid by the Fund)
- - - - -
In column No 5, the amount relates to trail commission.
8.6 The Aggregate value of purchases and sales of Investments during the year as a percentage of daily average net asset value;
Purchases
Year Amount ( Rs) % of Daily average
2018-19 5,67,75,316 124.71
2017-18 1,17,32,682 21.26
Sales
Year Amount (Rs) % of Daily Average
2018-19 6,22,57,413 136.76
2017-18 1,86,56,063 33.80
8.7 Aggregate Appreciation and Depreciation in the value of Investments:
Asset Class
31-Mar-2019 31-Mar-18
Appreciation (Rs. In lakhs)
Depreciation (Rs. In lakhs)
Appreciation (Rs. In lakhs)
Depreciation (Rs. In lakhs)
Equity Shares 41.30 46.27 165.38 15.91
8.8 Income and Expense Ratio
2018-19 2017-18
Total Income (including net unrealized appreciation and net of loss on sale of investments) to average net assets calculated on a daily basis.
35.92% 37.65%
Total Expenditure (excluding Deferred Revenue Expenditure) to average net assets calculated on a daily basis 1.85% 1.67%
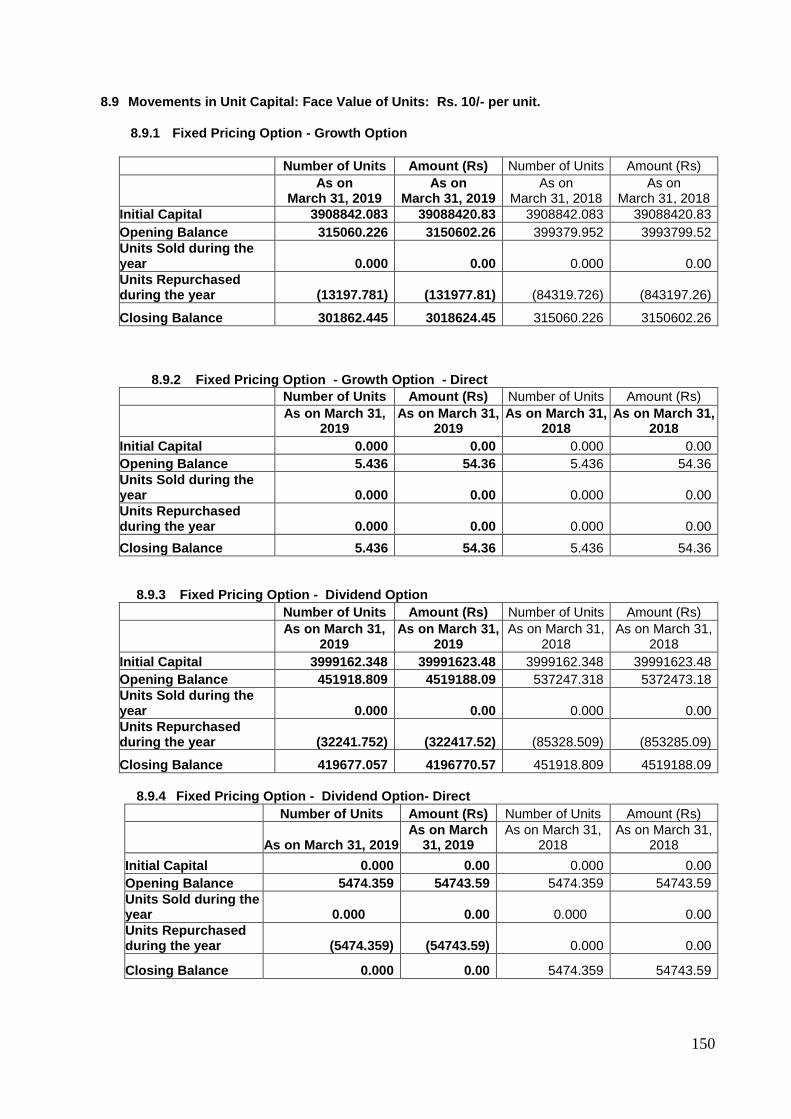
150
8.9 Movements in Unit Capital: Face Value of Units: Rs. 10/- per unit.
8.9.1 Fixed Pricing Option - Growth Option
Number of Units Amount (Rs) Number of Units Amount (Rs)
As on
March 31, 2019 As on
March 31, 2019 As on
March 31, 2018 As on
March 31, 2018
Initial Capital 3908842.083 39088420.83 3908842.083 39088420.83
Opening Balance 315060.226 3150602.26 399379.952 3993799.52
Units Sold during the year 0.000 0.00 0.000 0.00
Units Repurchased during the year (13197.781) (131977.81) (84319.726) (843197.26)
Closing Balance 301862.445 3018624.45 315060.226 3150602.26
8.9.2 Fixed Pricing Option - Growth Option - Direct
Number of Units Amount (Rs) Number of Units Amount (Rs)
As on March 31,
2019 As on March 31,
2019 As on March 31,
2018 As on March 31,
2018
Initial Capital 0.000 0.00 0.000 0.00
Opening Balance 5.436 54.36 5.436 54.36
Units Sold during the year 0.000 0.00 0.000 0.00
Units Repurchased during the year 0.000 0.00 0.000 0.00
Closing Balance 5.436 54.36 5.436 54.36
8.9.3 Fixed Pricing Option - Dividend Option
Number of Units Amount (Rs) Number of Units Amount (Rs)
As on March 31,
2019 As on March 31,
2019 As on March 31,
2018 As on March 31,
2018
Initial Capital 3999162.348 39991623.48 3999162.348 39991623.48
Opening Balance 451918.809 4519188.09 537247.318 5372473.18
Units Sold during the year 0.000 0.00 0.000 0.00
Units Repurchased during the year (32241.752) (322417.52) (85328.509) (853285.09)
Closing Balance 419677.057 4196770.57 451918.809 4519188.09
8.9.4 Fixed Pricing Option - Dividend Option- Direct
Number of Units Amount (Rs) Number of Units Amount (Rs)
As on March 31, 2019 As on March
31, 2019 As on March 31,
2018 As on March 31,
2018
Initial Capital 0.000 0.00 0.000 0.00
Opening Balance 5474.359 54743.59 5474.359 54743.59
Units Sold during the year 0.000 0.00 0.000 0.00
Units Repurchased during the year (5474.359) (54743.59) 0.000 0.00
Closing Balance 0.000 0.00 5474.359 54743.59
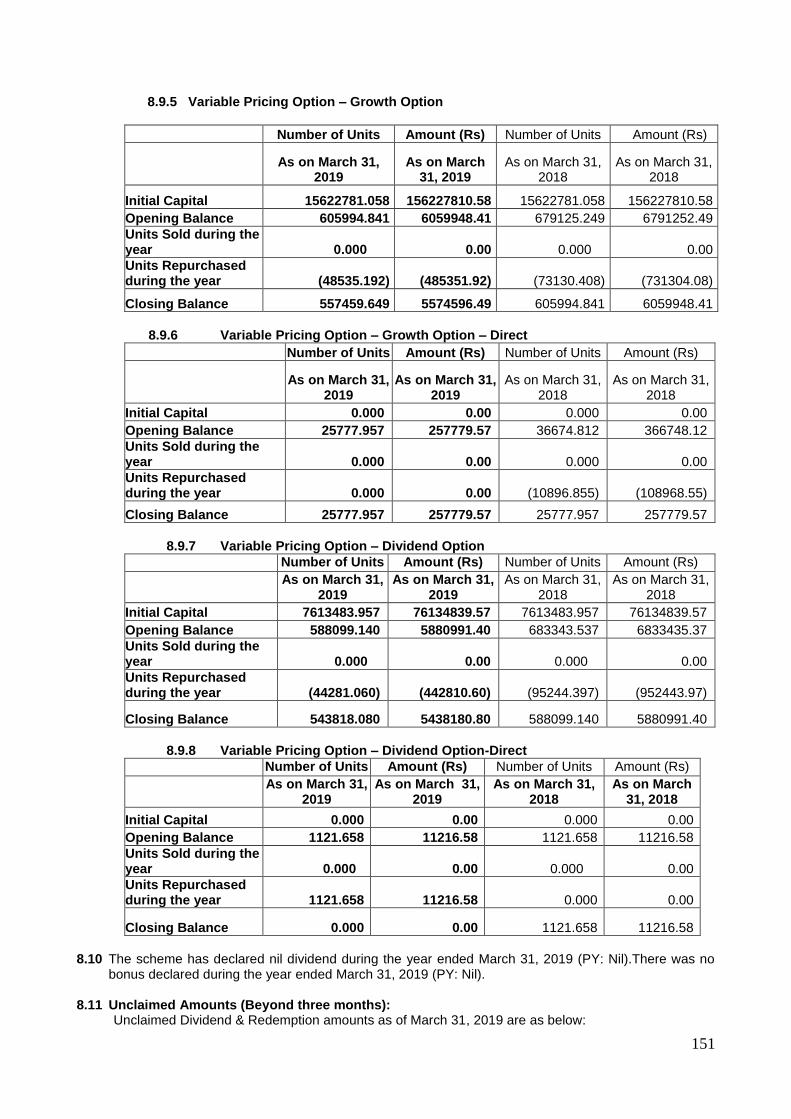
151
8.9.5 Variable Pricing Option – Growth Option
Number of Units Amount (Rs) Number of Units Amount (Rs)
As on March 31,
2019 As on March
31, 2019 As on March 31,
2018 As on March 31,
2018
Initial Capital 15622781.058 156227810.58 15622781.058 156227810.58
Opening Balance 605994.841 6059948.41 679125.249 6791252.49
Units Sold during the year 0.000 0.00 0.000 0.00
Units Repurchased during the year
(48535.192) (485351.92) (73130.408) (731304.08)
Closing Balance 557459.649 5574596.49 605994.841 6059948.41
8.9.6 Variable Pricing Option – Growth Option – Direct
Number of Units Amount (Rs) Number of Units Amount (Rs)
As on March 31,
2019 As on March 31,
2019 As on March 31,
2018 As on March 31,
2018
Initial Capital 0.000 0.00 0.000 0.00
Opening Balance 25777.957 257779.57 36674.812 366748.12
Units Sold during the year 0.000 0.00 0.000 0.00
Units Repurchased during the year 0.000 0.00 (10896.855) (108968.55)
Closing Balance 25777.957 257779.57 25777.957 257779.57
8.9.7 Variable Pricing Option – Dividend Option
Number of Units Amount (Rs) Number of Units Amount (Rs)
As on March 31,
2019 As on March 31,
2019 As on March 31,
2018 As on March 31,
2018
Initial Capital 7613483.957 76134839.57 7613483.957 76134839.57
Opening Balance 588099.140 5880991.40 683343.537 6833435.37
Units Sold during the year 0.000 0.00 0.000 0.00
Units Repurchased during the year (44281.060) (442810.60) (95244.397) (952443.97)
Closing Balance 543818.080 5438180.80 588099.140 5880991.40
8.9.8 Variable Pricing Option – Dividend Option-Direct
Number of Units Amount (Rs) Number of Units Amount (Rs)
As on March 31,
2019 As on March 31,
2019 As on March 31,
2018 As on March
31, 2018
Initial Capital 0.000 0.00 0.000 0.00
Opening Balance 1121.658 11216.58 1121.658 11216.58
Units Sold during the year 0.000 0.00 0.000 0.00
Units Repurchased during the year 1121.658 11216.58 0.000 0.00
Closing Balance 0.000 0.00 1121.658 11216.58
8.10 The scheme has declared nil dividend during the year ended March 31, 2019 (PY: Nil).There was no
bonus declared during the year ended March 31, 2019 (PY: Nil). 8.11 Unclaimed Amounts (Beyond three months): Unclaimed Dividend & Redemption amounts as of March 31, 2019 are as below:
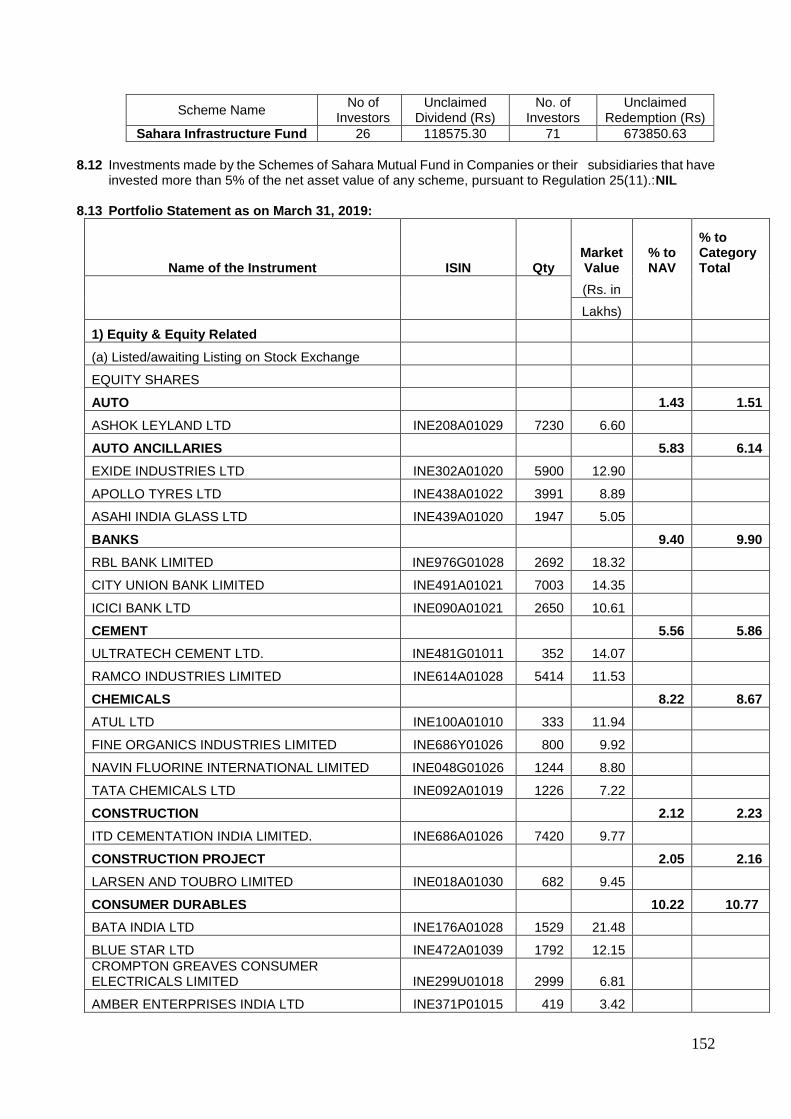
152
Scheme Name No of
Investors Unclaimed
Dividend (Rs) No. of
Investors Unclaimed
Redemption (Rs)
Sahara Infrastructure Fund 26 118575.30 71 673850.63
8.12 Investments made by the Schemes of Sahara Mutual Fund in Companies or their subsidiaries that have
invested more than 5% of the net asset value of any scheme, pursuant to Regulation 25(11).:NIL
8.13 Portfolio Statement as on March 31, 2019:
Name of the Instrument ISIN Qty Market Value
% to NAV
% to Category Total
(Rs. in
Lakhs)
1) Equity & Equity Related
(a) Listed/awaiting Listing on Stock Exchange
EQUITY SHARES
AUTO 1.43 1.51
ASHOK LEYLAND LTD INE208A01029 7230 6.60
AUTO ANCILLARIES 5.83 6.14
EXIDE INDUSTRIES LTD INE302A01020 5900 12.90
APOLLO TYRES LTD INE438A01022 3991 8.89
ASAHI INDIA GLASS LTD INE439A01020 1947 5.05
BANKS 9.40 9.90
RBL BANK LIMITED INE976G01028 2692 18.32
CITY UNION BANK LIMITED INE491A01021 7003 14.35
ICICI BANK LTD INE090A01021 2650 10.61
CEMENT 5.56 5.86
ULTRATECH CEMENT LTD. INE481G01011 352 14.07
RAMCO INDUSTRIES LIMITED INE614A01028 5414 11.53
CHEMICALS 8.22 8.67
ATUL LTD INE100A01010 333 11.94
FINE ORGANICS INDUSTRIES LIMITED INE686Y01026 800 9.92
NAVIN FLUORINE INTERNATIONAL LIMITED INE048G01026 1244 8.80
TATA CHEMICALS LTD INE092A01019 1226 7.22
CONSTRUCTION 2.12 2.23
ITD CEMENTATION INDIA LIMITED. INE686A01026 7420 9.77
CONSTRUCTION PROJECT 2.05 2.16
LARSEN AND TOUBRO LIMITED INE018A01030 682 9.45
CONSUMER DURABLES 10.22 10.77
BATA INDIA LTD INE176A01028 1529 21.48
BLUE STAR LTD INE472A01039 1792 12.15
CROMPTON GREAVES CONSUMER ELECTRICALS LIMITED INE299U01018 2999 6.81
AMBER ENTERPRISES INDIA LTD INE371P01015 419 3.42
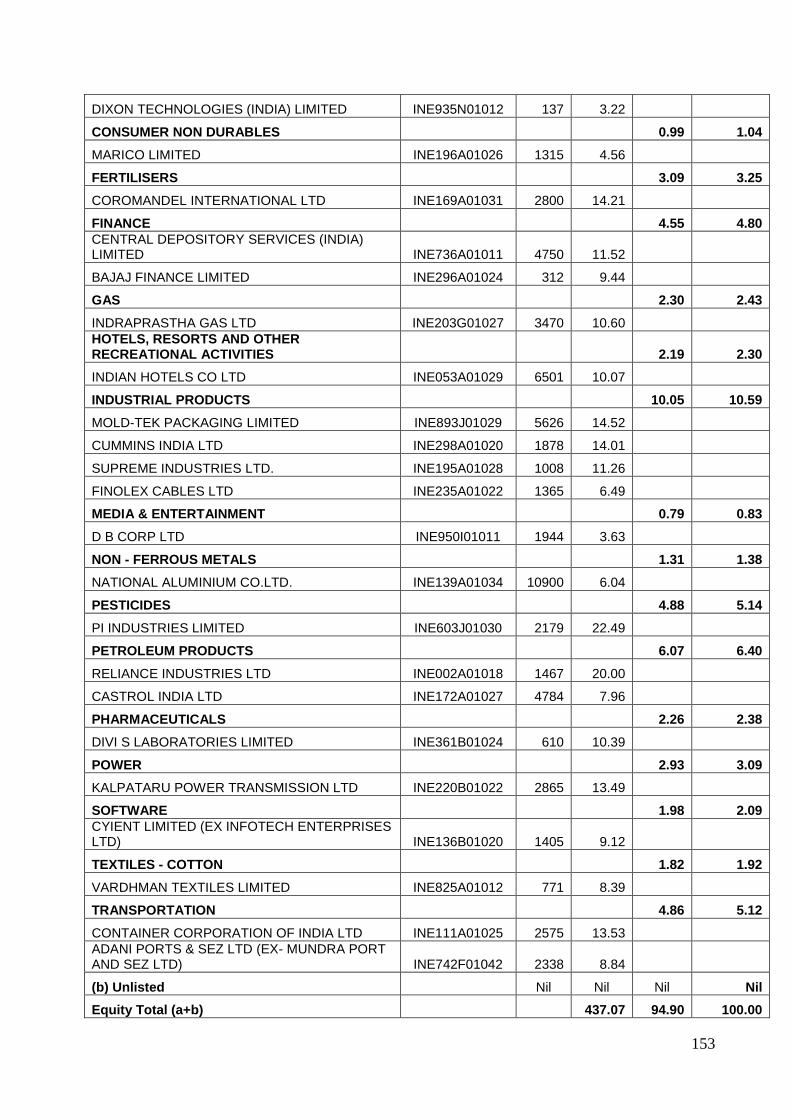
153
DIXON TECHNOLOGIES (INDIA) LIMITED INE935N01012 137 3.22
CONSUMER NON DURABLES 0.99 1.04
MARICO LIMITED INE196A01026 1315 4.56
FERTILISERS 3.09 3.25
COROMANDEL INTERNATIONAL LTD INE169A01031 2800 14.21
FINANCE 4.55 4.80
CENTRAL DEPOSITORY SERVICES (INDIA) LIMITED INE736A01011 4750 11.52
BAJAJ FINANCE LIMITED INE296A01024 312 9.44
GAS 2.30 2.43
INDRAPRASTHA GAS LTD INE203G01027 3470 10.60
HOTELS, RESORTS AND OTHER RECREATIONAL ACTIVITIES 2.19 2.30
INDIAN HOTELS CO LTD INE053A01029 6501 10.07
INDUSTRIAL PRODUCTS 10.05 10.59
MOLD-TEK PACKAGING LIMITED INE893J01029 5626 14.52
CUMMINS INDIA LTD INE298A01020 1878 14.01
SUPREME INDUSTRIES LTD. INE195A01028 1008 11.26
FINOLEX CABLES LTD INE235A01022 1365 6.49
MEDIA & ENTERTAINMENT 0.79 0.83
D B CORP LTD INE950I01011 1944 3.63
NON - FERROUS METALS 1.31 1.38
NATIONAL ALUMINIUM CO.LTD. INE139A01034 10900 6.04
PESTICIDES 4.88 5.14
PI INDUSTRIES LIMITED INE603J01030 2179 22.49
PETROLEUM PRODUCTS 6.07 6.40
RELIANCE INDUSTRIES LTD INE002A01018 1467 20.00
CASTROL INDIA LTD INE172A01027 4784 7.96
PHARMACEUTICALS 2.26 2.38
DIVI S LABORATORIES LIMITED INE361B01024 610 10.39
POWER 2.93 3.09
KALPATARU POWER TRANSMISSION LTD INE220B01022 2865 13.49
SOFTWARE 1.98 2.09
CYIENT LIMITED (EX INFOTECH ENTERPRISES LTD) INE136B01020 1405 9.12
TEXTILES - COTTON 1.82 1.92
VARDHMAN TEXTILES LIMITED INE825A01012 771 8.39
TRANSPORTATION 4.86 5.12
CONTAINER CORPORATION OF INDIA LTD INE111A01025 2575 13.53
ADANI PORTS & SEZ LTD (EX- MUNDRA PORT AND SEZ LTD) INE742F01042 2338 8.84
(b) Unlisted Nil Nil Nil Nil
Equity Total (a+b) 437.07 94.90 100.00
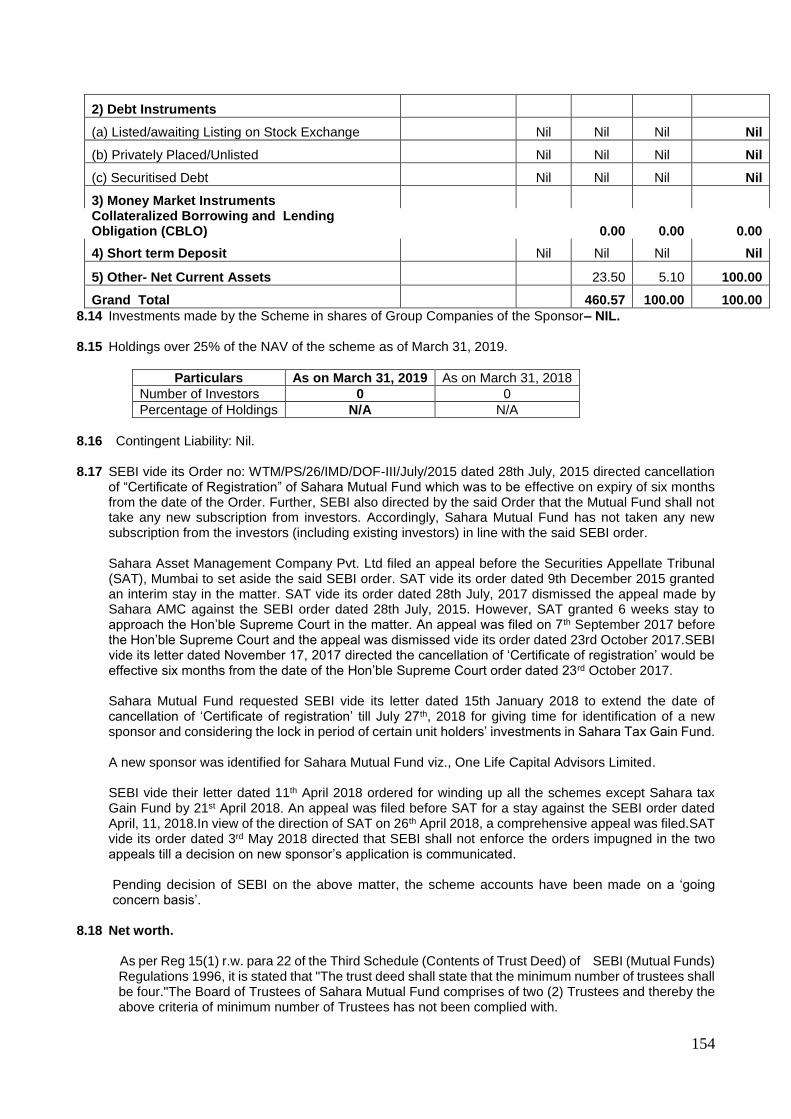
154
2) Debt Instruments
(a) Listed/awaiting Listing on Stock Exchange Nil Nil Nil Nil
(b) Privately Placed/Unlisted Nil Nil Nil Nil
(c) Securitised Debt Nil Nil Nil Nil
3) Money Market Instruments Collateralized Borrowing and Lending Obligation (CBLO) 0.00 0.00 0.00
4) Short term Deposit Nil Nil Nil Nil
5) Other- Net Current Assets 23.50 5.10 100.00
Grand Total 460.57 100.00 100.00
8.14 Investments made by the Scheme in shares of Group Companies of the Sponsor– NIL. 8.15 Holdings over 25% of the NAV of the scheme as of March 31, 2019.
Particulars As on March 31, 2019 As on March 31, 2018
Number of Investors 0 0
Percentage of Holdings N/A N/A
8.16 Contingent Liability: Nil. 8.17 SEBI vide its Order no: WTM/PS/26/IMD/DOF-III/July/2015 dated 28th July, 2015 directed cancellation
of “Certificate of Registration” of Sahara Mutual Fund which was to be effective on expiry of six months from the date of the Order. Further, SEBI also directed by the said Order that the Mutual Fund shall not take any new subscription from investors. Accordingly, Sahara Mutual Fund has not taken any new subscription from the investors (including existing investors) in line with the said SEBI order.
Sahara Asset Management Company Pvt. Ltd filed an appeal before the Securities Appellate Tribunal (SAT), Mumbai to set aside the said SEBI order. SAT vide its order dated 9th December 2015 granted an interim stay in the matter. SAT vide its order dated 28th July, 2017 dismissed the appeal made by Sahara AMC against the SEBI order dated 28th July, 2015. However, SAT granted 6 weeks stay to approach the Hon’ble Supreme Court in the matter. An appeal was filed on 7th September 2017 before the Hon’ble Supreme Court and the appeal was dismissed vide its order dated 23rd October 2017.SEBI vide its letter dated November 17, 2017 directed the cancellation of ‘Certificate of registration’ would be effective six months from the date of the Hon’ble Supreme Court order dated 23rd October 2017. Sahara Mutual Fund requested SEBI vide its letter dated 15th January 2018 to extend the date of cancellation of ‘Certificate of registration’ till July 27th, 2018 for giving time for identification of a new sponsor and considering the lock in period of certain unit holders’ investments in Sahara Tax Gain Fund. A new sponsor was identified for Sahara Mutual Fund viz., One Life Capital Advisors Limited. SEBI vide their letter dated 11th April 2018 ordered for winding up all the schemes except Sahara tax Gain Fund by 21st April 2018. An appeal was filed before SAT for a stay against the SEBI order dated April, 11, 2018.In view of the direction of SAT on 26th April 2018, a comprehensive appeal was filed.SAT vide its order dated 3rd May 2018 directed that SEBI shall not enforce the orders impugned in the two appeals till a decision on new sponsor’s application is communicated.
Pending decision of SEBI on the above matter, the scheme accounts have been made on a ‘going concern basis’.
8.18 Net worth.
As per Reg 15(1) r.w. para 22 of the Third Schedule (Contents of Trust Deed) of SEBI (Mutual Funds) Regulations 1996, it is stated that "The trust deed shall state that the minimum number of trustees shall be four."The Board of Trustees of Sahara Mutual Fund comprises of two (2) Trustees and thereby the above criteria of minimum number of Trustees has not been complied with.
155
8.19 Events occurring after Balance Sheet Date:
As per the Reg. 21(1)(f), of SEBI (Mutual Funds) Regulations, 1996 and in compliance with the notification of Securities and Exchange Board of India (Mutual Funds) (Amendment) Regulations, 2014 dated May 6, 2014, the AMC should maintain a Net Worth of minimum Rs.50 crs. The Net Worth of Sahara Asset Management Company Private Ltd. as on March 31, 2019 was Rs.5.02 crs, which is below the threshold limit of Rs.50 crs and thereby the net worth criteria as required by the above regulations has not been complied with.
8.20 Previous year figures have been reclassified/regrouped, wherever necessary, to
conform to the current year’s classification
As per our attached report of even date
For Chaturvedi & Partners For Sahara Asset Management Company Private Limited Chartered Accountants
(Firm’s Registration No. 307068E) O P Srivastava R M Joshi
Director Director
Sudhir Kaup Khozem Jabalpurwala
Khyati Shah Compliance Officer Fund Manager
(Partner)
Mem. No.117510 Vidya Manjrekar
Head – Operations & NAV Accounting
Place: Mumbai
Date: 19th July, 2019 For Sahara Mutual Fund
M R Siddiqui S P Srivastava
Trustee Trustee Place: Mumbai Date: 19th July, 2019
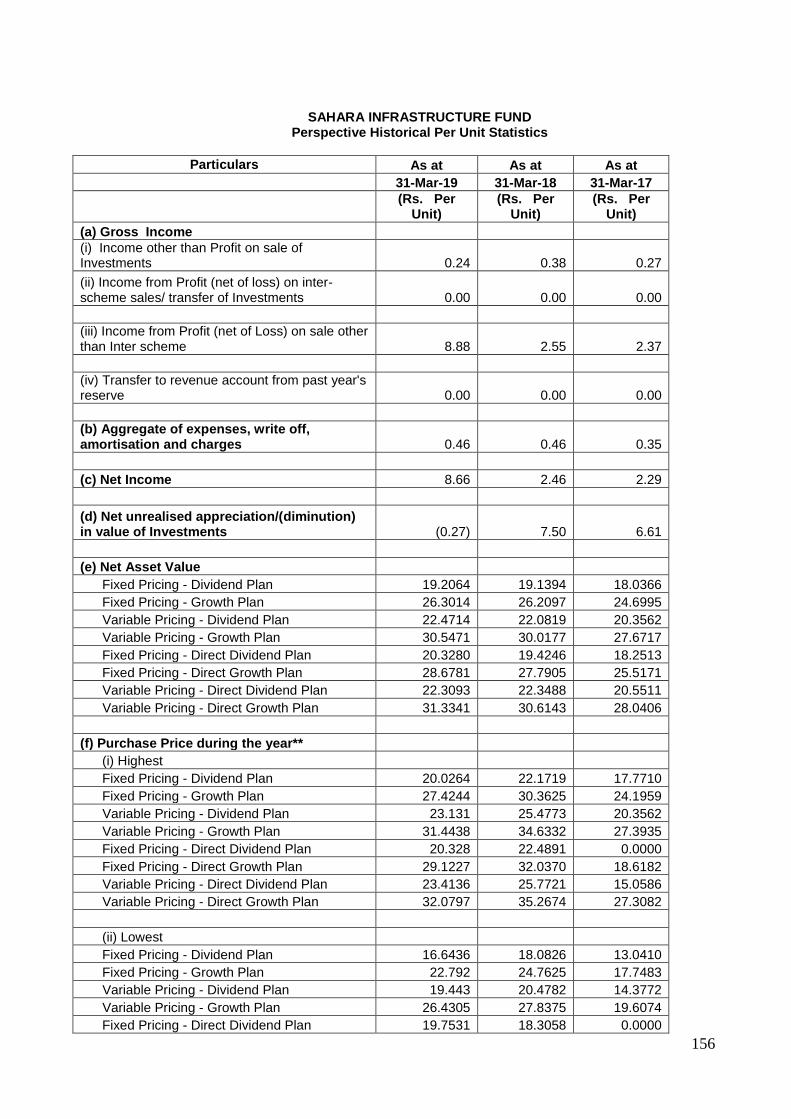
156
SAHARA INFRASTRUCTURE FUND
Perspective Historical Per Unit Statistics
Particulars As at As at As at
31-Mar-19 31-Mar-18 31-Mar-17
(Rs. Per
Unit) (Rs. Per
Unit) (Rs. Per
Unit)
(a) Gross Income
(i) Income other than Profit on sale of Investments 0.24 0.38 0.27
(ii) Income from Profit (net of loss) on inter-scheme sales/ transfer of Investments 0.00 0.00 0.00
(iii) Income from Profit (net of Loss) on sale other than Inter scheme 8.88 2.55 2.37
(iv) Transfer to revenue account from past year's reserve 0.00 0.00 0.00
(b) Aggregate of expenses, write off, amortisation and charges 0.46 0.46 0.35
(c) Net Income 8.66 2.46 2.29
(d) Net unrealised appreciation/(diminution) in value of Investments (0.27) 7.50 6.61
(e) Net Asset Value
Fixed Pricing - Dividend Plan 19.2064 19.1394 18.0366
Fixed Pricing - Growth Plan 26.3014 26.2097 24.6995
Variable Pricing - Dividend Plan 22.4714 22.0819 20.3562
Variable Pricing - Growth Plan 30.5471 30.0177 27.6717
Fixed Pricing - Direct Dividend Plan 20.3280 19.4246 18.2513
Fixed Pricing - Direct Growth Plan 28.6781 27.7905 25.5171
Variable Pricing - Direct Dividend Plan 22.3093 22.3488 20.5511
Variable Pricing - Direct Growth Plan 31.3341 30.6143 28.0406
(f) Purchase Price during the year**
(i) Highest
Fixed Pricing - Dividend Plan 20.0264 22.1719 17.7710
Fixed Pricing - Growth Plan 27.4244 30.3625 24.1959
Variable Pricing - Dividend Plan 23.131 25.4773 20.3562
Variable Pricing - Growth Plan 31.4438 34.6332 27.3935
Fixed Pricing - Direct Dividend Plan 20.328 22.4891 0.0000
Fixed Pricing - Direct Growth Plan 29.1227 32.0370 18.6182
Variable Pricing - Direct Dividend Plan 23.4136 25.7721 15.0586
Variable Pricing - Direct Growth Plan 32.0797 35.2674 27.3082
(ii) Lowest
Fixed Pricing - Dividend Plan 16.6436 18.0826 13.0410
Fixed Pricing - Growth Plan 22.792 24.7625 17.7483
Variable Pricing - Dividend Plan 19.443 20.4782 14.3772
Variable Pricing - Growth Plan 26.4305 27.8375 19.6074
Fixed Pricing - Direct Dividend Plan 19.7531 18.3058 0.0000
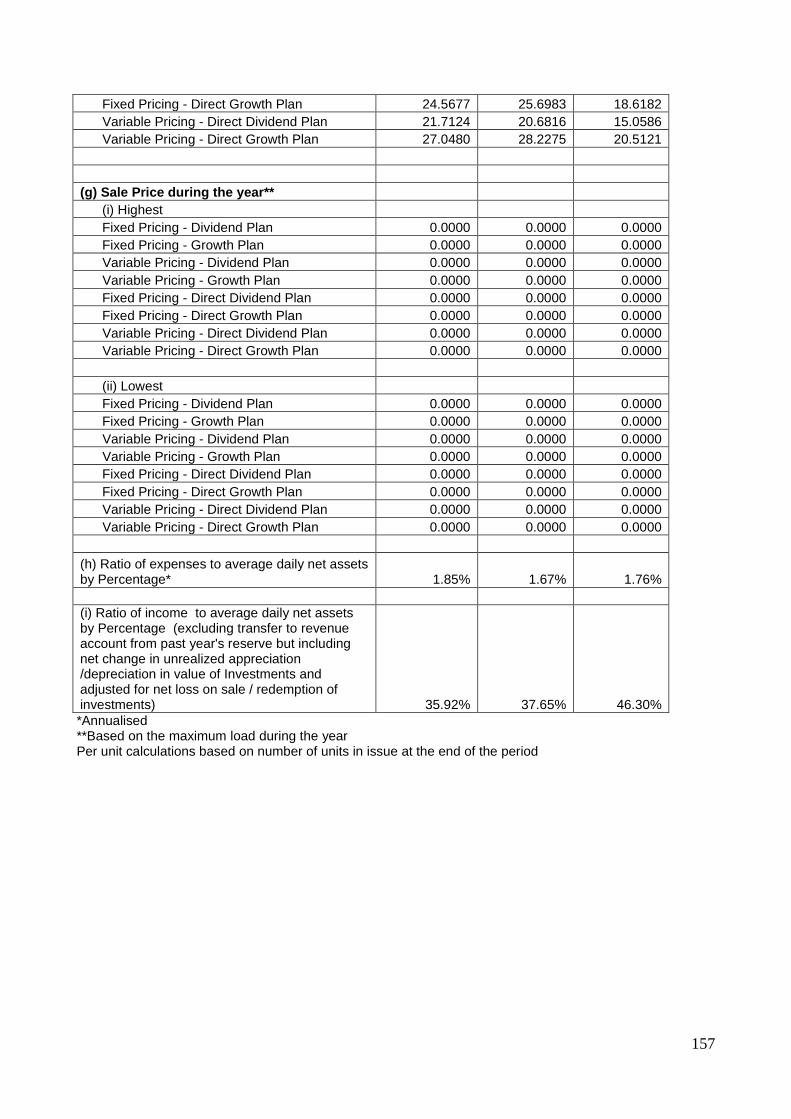
157
Fixed Pricing - Direct Growth Plan 24.5677 25.6983 18.6182
Variable Pricing - Direct Dividend Plan 21.7124 20.6816 15.0586
Variable Pricing - Direct Growth Plan 27.0480 28.2275 20.5121
(g) Sale Price during the year**
(i) Highest
Fixed Pricing - Dividend Plan 0.0000 0.0000 0.0000
Fixed Pricing - Growth Plan 0.0000 0.0000 0.0000
Variable Pricing - Dividend Plan 0.0000 0.0000 0.0000
Variable Pricing - Growth Plan 0.0000 0.0000 0.0000
Fixed Pricing - Direct Dividend Plan 0.0000 0.0000 0.0000
Fixed Pricing - Direct Growth Plan 0.0000 0.0000 0.0000
Variable Pricing - Direct Dividend Plan 0.0000 0.0000 0.0000
Variable Pricing - Direct Growth Plan 0.0000 0.0000 0.0000
(ii) Lowest
Fixed Pricing - Dividend Plan 0.0000 0.0000 0.0000
Fixed Pricing - Growth Plan 0.0000 0.0000 0.0000
Variable Pricing - Dividend Plan 0.0000 0.0000 0.0000
Variable Pricing - Growth Plan 0.0000 0.0000 0.0000
Fixed Pricing - Direct Dividend Plan 0.0000 0.0000 0.0000
Fixed Pricing - Direct Growth Plan 0.0000 0.0000 0.0000
Variable Pricing - Direct Dividend Plan 0.0000 0.0000 0.0000
Variable Pricing - Direct Growth Plan 0.0000 0.0000 0.0000
(h) Ratio of expenses to average daily net assets by Percentage* 1.85% 1.67% 1.76%
(i) Ratio of income to average daily net assets by Percentage (excluding transfer to revenue account from past year's reserve but including net change in unrealized appreciation /depreciation in value of Investments and adjusted for net loss on sale / redemption of investments) 35.92% 37.65% 46.30%
*Annualised **Based on the maximum load during the year Per unit calculations based on number of units in issue at the end of the period
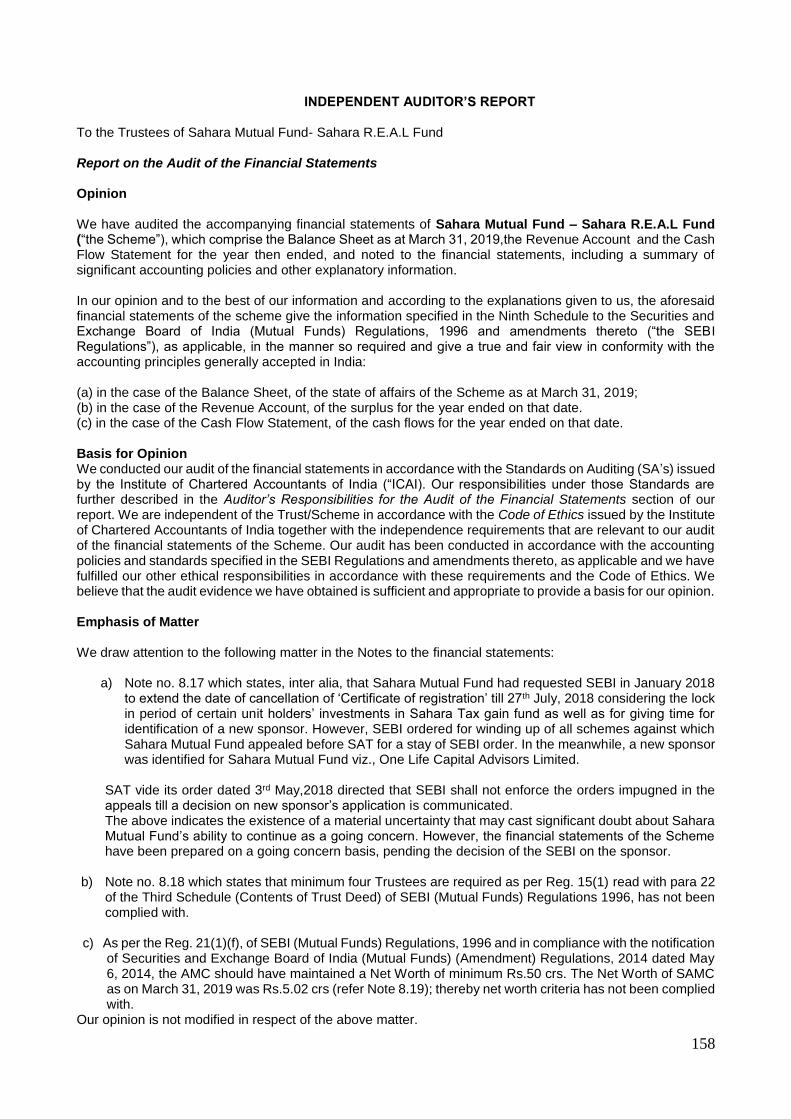
158
INDEPENDENT AUDITOR’S REPORT To the Trustees of Sahara Mutual Fund- Sahara R.E.A.L Fund Report on the Audit of the Financial Statements Opinion We have audited the accompanying financial statements of Sahara Mutual Fund – Sahara R.E.A.L Fund (“the Scheme”), which comprise the Balance Sheet as at March 31, 2019,the Revenue Account and the Cash Flow Statement for the year then ended, and noted to the financial statements, including a summary of significant accounting policies and other explanatory information. In our opinion and to the best of our information and according to the explanations given to us, the aforesaid financial statements of the scheme give the information specified in the Ninth Schedule to the Securities and Exchange Board of India (Mutual Funds) Regulations, 1996 and amendments thereto (“the SEBI Regulations”), as applicable, in the manner so required and give a true and fair view in conformity with the accounting principles generally accepted in India: (a) in the case of the Balance Sheet, of the state of affairs of the Scheme as at March 31, 2019; (b) in the case of the Revenue Account, of the surplus for the year ended on that date. (c) in the case of the Cash Flow Statement, of the cash flows for the year ended on that date. Basis for Opinion We conducted our audit of the financial statements in accordance with the Standards on Auditing (SA’s) issued by the Institute of Chartered Accountants of India (“ICAI). Our responsibilities under those Standards are further described in the Auditor’s Responsibilities for the Audit of the Financial Statements section of our report. We are independent of the Trust/Scheme in accordance with the Code of Ethics issued by the Institute of Chartered Accountants of India together with the independence requirements that are relevant to our audit of the financial statements of the Scheme. Our audit has been conducted in accordance with the accounting policies and standards specified in the SEBI Regulations and amendments thereto, as applicable and we have fulfilled our other ethical responsibilities in accordance with these requirements and the Code of Ethics. We believe that the audit evidence we have obtained is sufficient and appropriate to provide a basis for our opinion. Emphasis of Matter We draw attention to the following matter in the Notes to the financial statements:
a) Note no. 8.17 which states, inter alia, that Sahara Mutual Fund had requested SEBI in January 2018 to extend the date of cancellation of ‘Certificate of registration’ till 27th July, 2018 considering the lock in period of certain unit holders’ investments in Sahara Tax gain fund as well as for giving time for identification of a new sponsor. However, SEBI ordered for winding up of all schemes against which Sahara Mutual Fund appealed before SAT for a stay of SEBI order. In the meanwhile, a new sponsor was identified for Sahara Mutual Fund viz., One Life Capital Advisors Limited.
SAT vide its order dated 3rd May,2018 directed that SEBI shall not enforce the orders impugned in the appeals till a decision on new sponsor’s application is communicated. The above indicates the existence of a material uncertainty that may cast significant doubt about Sahara Mutual Fund’s ability to continue as a going concern. However, the financial statements of the Scheme have been prepared on a going concern basis, pending the decision of the SEBI on the sponsor.
b) Note no. 8.18 which states that minimum four Trustees are required as per Reg. 15(1) read with para 22
of the Third Schedule (Contents of Trust Deed) of SEBI (Mutual Funds) Regulations 1996, has not been complied with.
c) As per the Reg. 21(1)(f), of SEBI (Mutual Funds) Regulations, 1996 and in compliance with the notification of Securities and Exchange Board of India (Mutual Funds) (Amendment) Regulations, 2014 dated May 6, 2014, the AMC should have maintained a Net Worth of minimum Rs.50 crs. The Net Worth of SAMC as on March 31, 2019 was Rs.5.02 crs (refer Note 8.19); thereby net worth criteria has not been complied with.
Our opinion is not modified in respect of the above matter.

159
Responsibilities of the Management and Those Charged with Governance for the Financial Statements The Trustees of Sahara Mutual Fund and the Board of Directors of Sahara Asset Management Company Private Limited (the “Directors”) are responsible for the preparation of these financial statements that give a true and fair view of the financial position and financial performance of the Scheme in accordance with the accounting policies and standards specified in the SEBI Regulations and amendments thereto, as applicable. This responsibility also includes maintenance of adequate accounting records for safeguarding the assets of the Scheme and for preventing and detecting frauds and other irregularities; selection and application of appropriate accounting policies; making judgements and estimates that are reasonable and prudent; and design, implementation and maintenance of adequate internal financial controls, that were operating effectively for ensuring the accuracy and completeness of the accounting records, relevant to the preparation and presentation of the financial statements that give a true and fair view and are free from material misstatement, whether due to fraud or error. In preparing the financial statements, management is responsible for assessing the Scheme’s ability to continue as a going concern, disclosing , as applicable, matters related to going concern and using the going concern basis of accounting unless management either intends to liquidate the Scheme or to cease operations or has no realistic alternative but to do so. Those charged with Governance are also responsible for overseeing the Scheme’s financial reporting process. Auditor’s Responsibility for the Audit of the Financial Statements Our objectives are to obtain reasonable assurance about whether the standalone financial statements as a whole are free from material misstatement, whether due to fraud or error, and to issue an auditor’s report that includes our opinion. Reasonable assurance is a high level of assurance, but is not a guarantee that an audit conducted in accordance with SAs will always detect a material misstatement when it exists. Misstatements can arise from fraud or error and are considered material if ,individually or in the aggregate, they could reasonably be expected to influence the economic decisions of users taken on the basis of these standalone financial statements. As part of an audit in accordance with SAs, we exercise professional judgment and maintain professional skepticism throughout the audit. We also: • Identify and assess the risks of material misstatement of the standalone financial statements, whether due to fraud or error, design and perform audit procedures responsive to those risks, and obtain audit evidence that is sufficient and appropriate to provide a basis for our opinion. The risk of not detecting a material misstatement resulting from fraud is higher than for one resulting from error, as fraud may involve collusion, forgery, intentional omissions, misrepresentations, or the override of internal control. • Obtain an understanding of internal financial controls relevant to the audit in order to design audit procedures that are appropriate in the circumstances, but not for the purpose of expressing an opinion on effectiveness of the Company’s internal financial controls. • Evaluate the appropriateness of accounting policies used and the reasonableness of accounting estimates and related disclosures made by management. • Conclude on the appropriateness of management’s use of the going concern basis of accounting and, based on the audit evidence obtained, whether a material uncertainty exists related to events or conditions that may cast significant doubt on the ability of the Company to continue as a going concern. If we conclude that a material uncertainty exists, we are required to draw attention in our auditor’s report to the related disclosures in the standalone financial statements or, if such disclosures are inadequate, to modify our opinion. Our conclusions are based on the audit evidence obtained up to the date of our auditor’s report. However, future events or conditions may cause the Company to cease to continue as a going concern. • Evaluate the overall presentation, structure and content of the standalone financial statements, including the disclosures, and whether the standalone financial statements represent the underlying transactions and events in a manner that achieves fair presentation.

160
We communicate with those charged with governance regarding, among other matters, the planned scope and timing of the audit and significant audit findings, including any significant deficiencies in internal control that we identify during our audit. We also provide those charged with governance with a statement that we have complied with relevant ethical requirements regarding independence, and to communicate with them all relationships and other matters that may reasonably be thought to bear on our independence, and where applicable, related safeguards.
Report on Other Legal and Regulatory Requirements
As required by the Securities and Exchange Board of India (Mutual Funds) Regulations, 1996 and amendments thereto, as applicable, we report that: a) We have sought and obtained all the information and explanations, which to the best of our knowledge and belief were necessary for the purpose of our audit. b) The Balance Sheet and Revenue Account dealt with by this Report are in agreement with the books of account of the Scheme. c) The statement of account has been prepared in accordance with the accounting policies and standards specified in the SEBI Regulations and amendments thereto, as applicable. d) We have reviewed the Valuation Policy being followed for the schemes of Sahara Mutual Fund. The Valuation Policy implemented for the Scheme is in line with the SEBI guidelines issued in this regard.
For Chaturvedi & Partners. Chartered Accountants (Firm’s Registration No. 307068E) Khyati Shah (Partner) Mem. No. 117510 Place: Mumbai Date: July 19, 2019
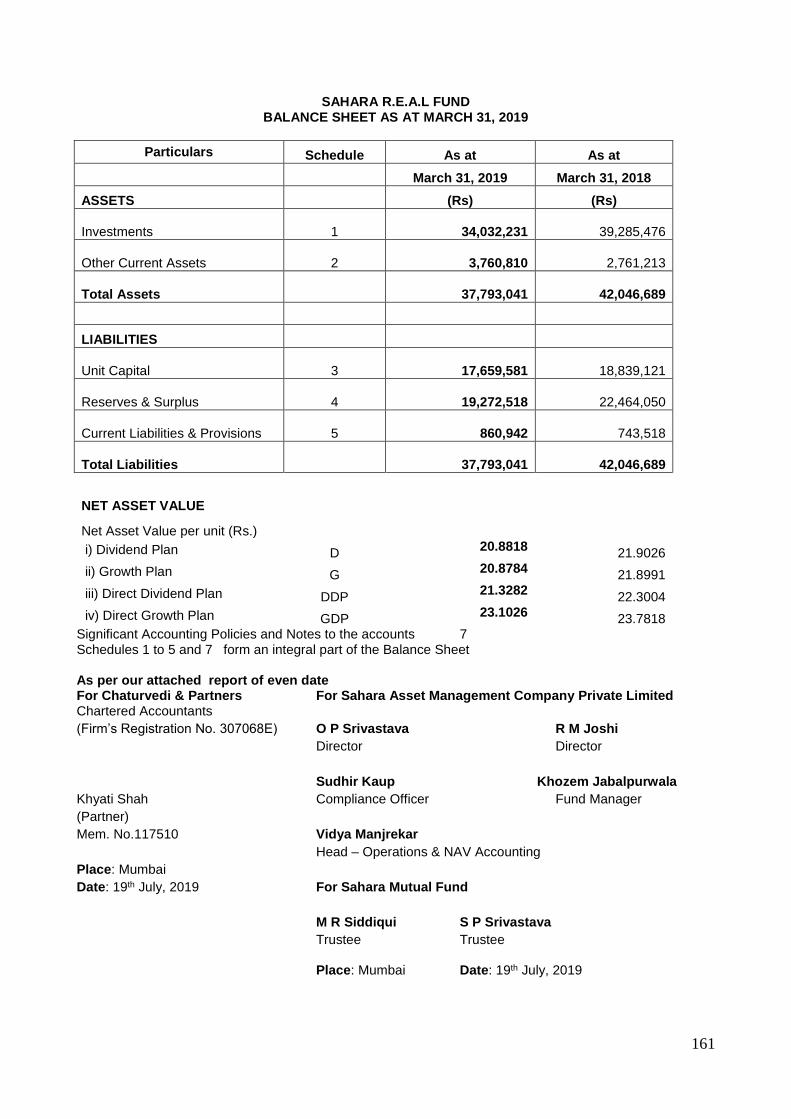
161
SAHARA R.E.A.L FUND BALANCE SHEET AS AT MARCH 31, 2019
Particulars Schedule As at As at
March 31, 2019 March 31, 2018
ASSETS (Rs) (Rs)
Investments 1
34,032,231
39,285,476
Other Current Assets 2
3,760,810
2,761,213
Total Assets
37,793,041
42,046,689
LIABILITIES
Unit Capital 3
17,659,581
18,839,121
Reserves & Surplus 4
19,272,518
22,464,050
Current Liabilities & Provisions 5
860,942
743,518
Total Liabilities
37,793,041
42,046,689
NET ASSET VALUE
Net Asset Value per unit (Rs.)
i) Dividend Plan D 20.8818
21.9026
ii) Growth Plan G 20.8784
21.8991
iii) Direct Dividend Plan DDP 21.3282
22.3004
iv) Direct Growth Plan GDP 23.1026
23.7818 Significant Accounting Policies and Notes to the accounts 7 Schedules 1 to 5 and 7 form an integral part of the Balance Sheet
As per our attached report of even date For Chaturvedi & Partners For Sahara Asset Management Company Private Limited Chartered Accountants
(Firm’s Registration No. 307068E) O P Srivastava R M Joshi
Director Director
Sudhir Kaup Khozem Jabalpurwala
Khyati Shah Compliance Officer Fund Manager
(Partner)
Mem. No.117510 Vidya Manjrekar
Head – Operations & NAV Accounting
Place: Mumbai
Date: 19th July, 2019 For Sahara Mutual Fund
M R Siddiqui S P Srivastava
Trustee Trustee Place: Mumbai Date: 19th July, 2019
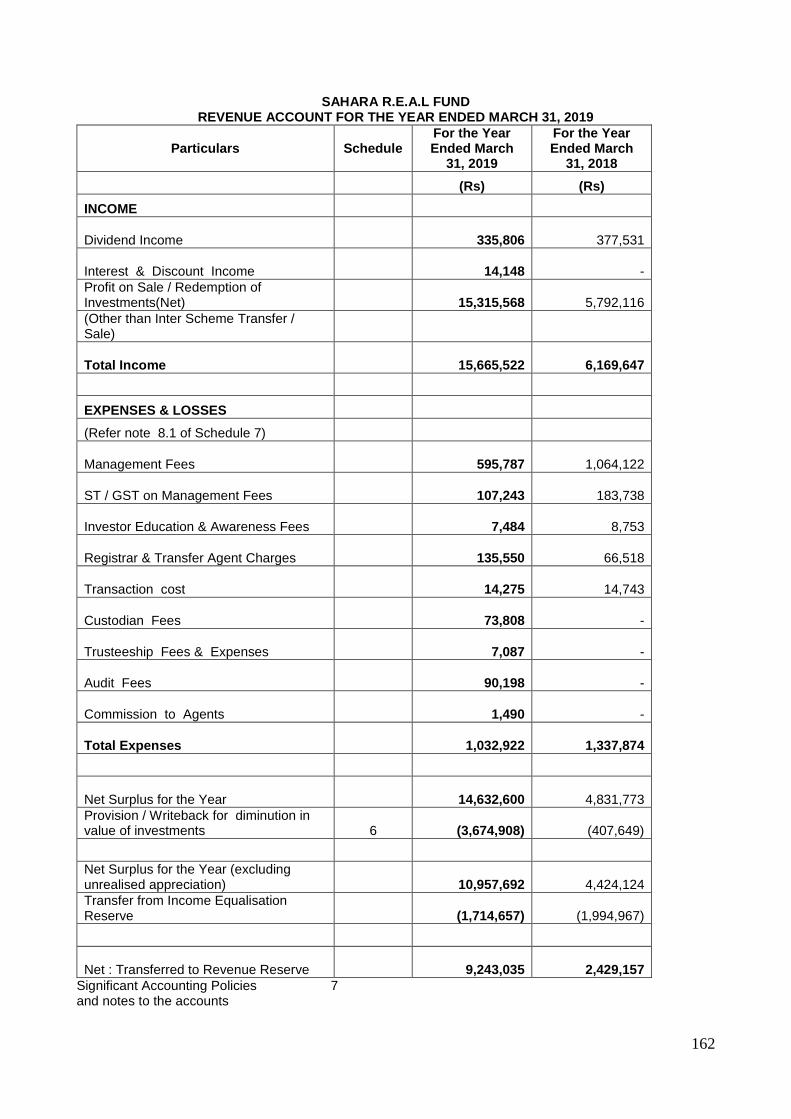
162
SAHARA R.E.A.L FUND REVENUE ACCOUNT FOR THE YEAR ENDED MARCH 31, 2019
Particulars Schedule For the Year Ended March
31, 2019
For the Year Ended March
31, 2018
(Rs) (Rs)
INCOME
Dividend Income
335,806
377,531
Interest & Discount Income
14,148 -
Profit on Sale / Redemption of Investments(Net) 15,315,568
5,792,116
(Other than Inter Scheme Transfer / Sale)
Total Income 15,665,522
6,169,647
EXPENSES & LOSSES
(Refer note 8.1 of Schedule 7)
Management Fees
595,787
1,064,122
ST / GST on Management Fees
107,243
183,738
Investor Education & Awareness Fees
7,484
8,753
Registrar & Transfer Agent Charges
135,550
66,518
Transaction cost
14,275
14,743
Custodian Fees
73,808 -
Trusteeship Fees & Expenses
7,087 -
Audit Fees
90,198 -
Commission to Agents
1,490 -
Total Expenses
1,032,922
1,337,874
Net Surplus for the Year
14,632,600
4,831,773
Provision / Writeback for diminution in value of investments 6
(3,674,908)
(407,649)
Net Surplus for the Year (excluding unrealised appreciation)
10,957,692
4,424,124
Transfer from Income Equalisation Reserve
(1,714,657)
(1,994,967)
Net : Transferred to Revenue Reserve
9,243,035
2,429,157
Significant Accounting Policies 7 and notes to the accounts
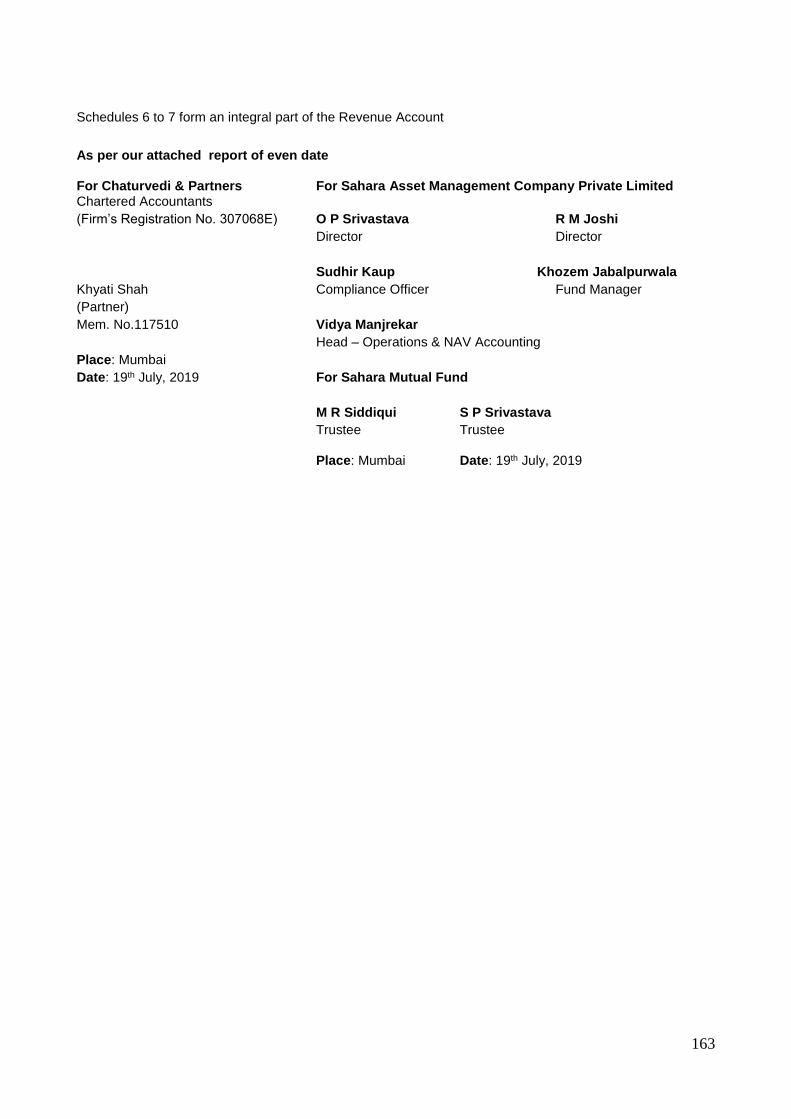
163
Schedules 6 to 7 form an integral part of the Revenue Account
As per our attached report of even date For Chaturvedi & Partners For Sahara Asset Management Company Private Limited Chartered Accountants
(Firm’s Registration No. 307068E) O P Srivastava R M Joshi
Director Director
Sudhir Kaup Khozem Jabalpurwala
Khyati Shah Compliance Officer Fund Manager
(Partner)
Mem. No.117510 Vidya Manjrekar
Head – Operations & NAV Accounting
Place: Mumbai
Date: 19th July, 2019 For Sahara Mutual Fund
M R Siddiqui S P Srivastava
Trustee Trustee Place: Mumbai Date: 19th July, 2019
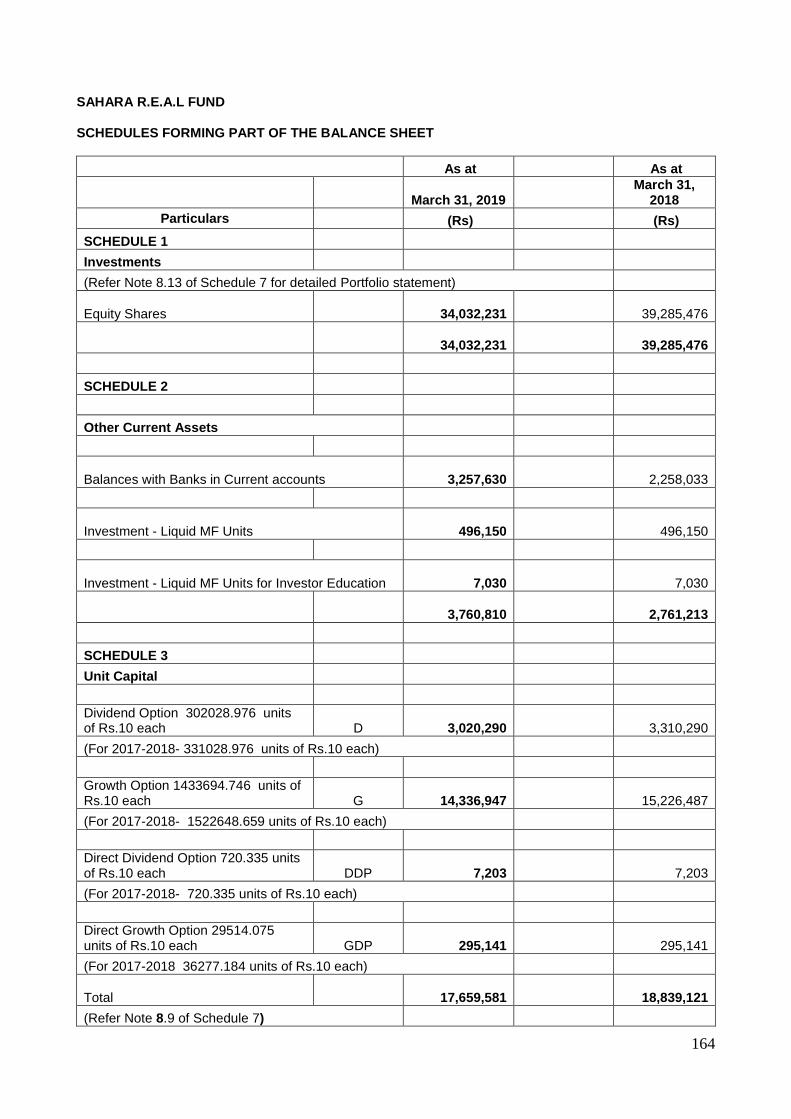
164
SAHARA R.E.A.L FUND
SCHEDULES FORMING PART OF THE BALANCE SHEET
As at As at
March 31, 2019 March 31,
2018
Particulars (Rs) (Rs)
SCHEDULE 1
Investments
(Refer Note 8.13 of Schedule 7 for detailed Portfolio statement)
Equity Shares
34,032,231
39,285,476
34,032,231
39,285,476
SCHEDULE 2
Other Current Assets
Balances with Banks in Current accounts
3,257,630
2,258,033
Investment - Liquid MF Units
496,150
496,150
Investment - Liquid MF Units for Investor Education
7,030
7,030
3,760,810
2,761,213
SCHEDULE 3
Unit Capital
Dividend Option 302028.976 units of Rs.10 each D
3,020,290
3,310,290
(For 2017-2018- 331028.976 units of Rs.10 each)
Growth Option 1433694.746 units of Rs.10 each G
14,336,947
15,226,487
(For 2017-2018- 1522648.659 units of Rs.10 each)
Direct Dividend Option 720.335 units of Rs.10 each DDP
7,203
7,203
(For 2017-2018- 720.335 units of Rs.10 each)
Direct Growth Option 29514.075 units of Rs.10 each GDP
295,141
295,141
(For 2017-2018 36277.184 units of Rs.10 each)
Total
17,659,581
18,839,121
(Refer Note 8.9 of Schedule 7)
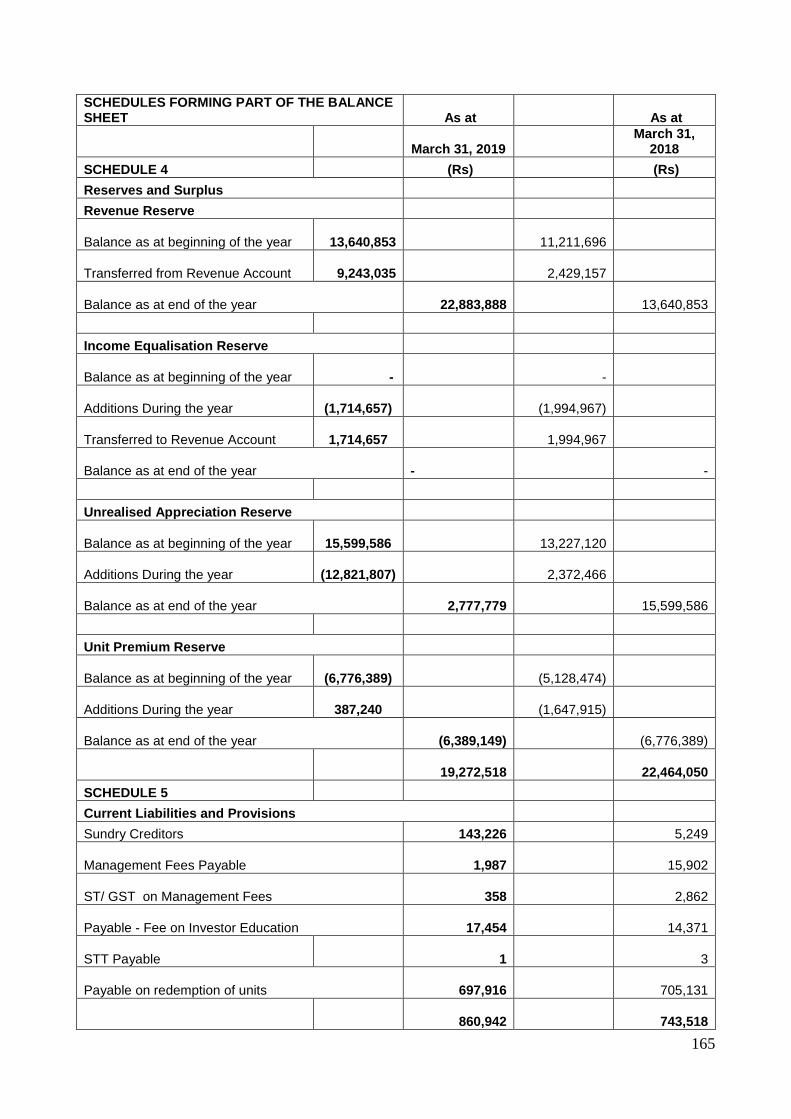
165
SCHEDULES FORMING PART OF THE BALANCE SHEET As at As at
March 31, 2019 March 31,
2018
SCHEDULE 4 (Rs) (Rs)
Reserves and Surplus
Revenue Reserve
Balance as at beginning of the year
13,640,853
11,211,696
Transferred from Revenue Account
9,243,035
2,429,157
Balance as at end of the year
22,883,888
13,640,853
Income Equalisation Reserve
Balance as at beginning of the year -
-
Additions During the year
(1,714,657)
(1,994,967)
Transferred to Revenue Account
1,714,657
1,994,967
Balance as at end of the year -
-
Unrealised Appreciation Reserve
Balance as at beginning of the year
15,599,586
13,227,120
Additions During the year
(12,821,807)
2,372,466
Balance as at end of the year
2,777,779
15,599,586
Unit Premium Reserve
Balance as at beginning of the year
(6,776,389)
(5,128,474)
Additions During the year
387,240
(1,647,915)
Balance as at end of the year
(6,389,149)
(6,776,389)
19,272,518
22,464,050
SCHEDULE 5
Current Liabilities and Provisions
Sundry Creditors 143,226 5,249
Management Fees Payable
1,987
15,902
ST/ GST on Management Fees
358
2,862
Payable - Fee on Investor Education
17,454
14,371
STT Payable
1
3
Payable on redemption of units
697,916
705,131
860,942
743,518
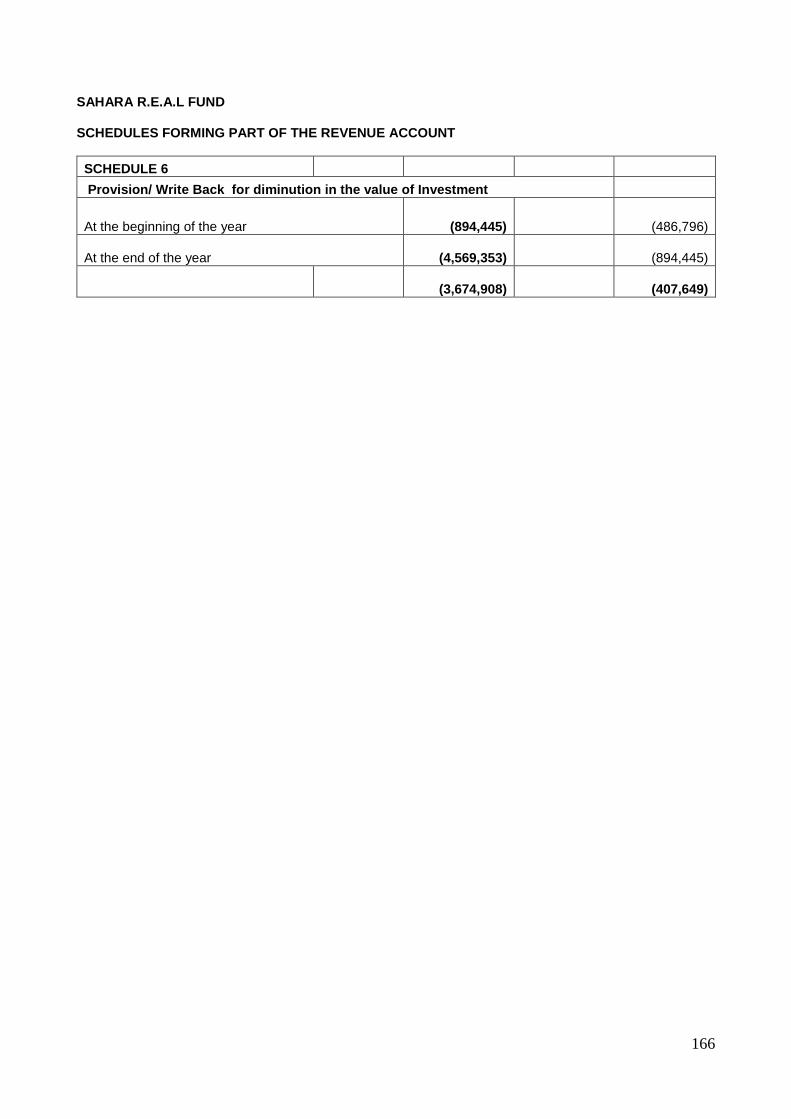
166
SAHARA R.E.A.L FUND
SCHEDULES FORMING PART OF THE REVENUE ACCOUNT
SCHEDULE 6
Provision/ Write Back for diminution in the value of Investment
At the beginning of the year
(894,445)
(486,796)
At the end of the year
(4,569,353)
(894,445)
(3,674,908)
(407,649)
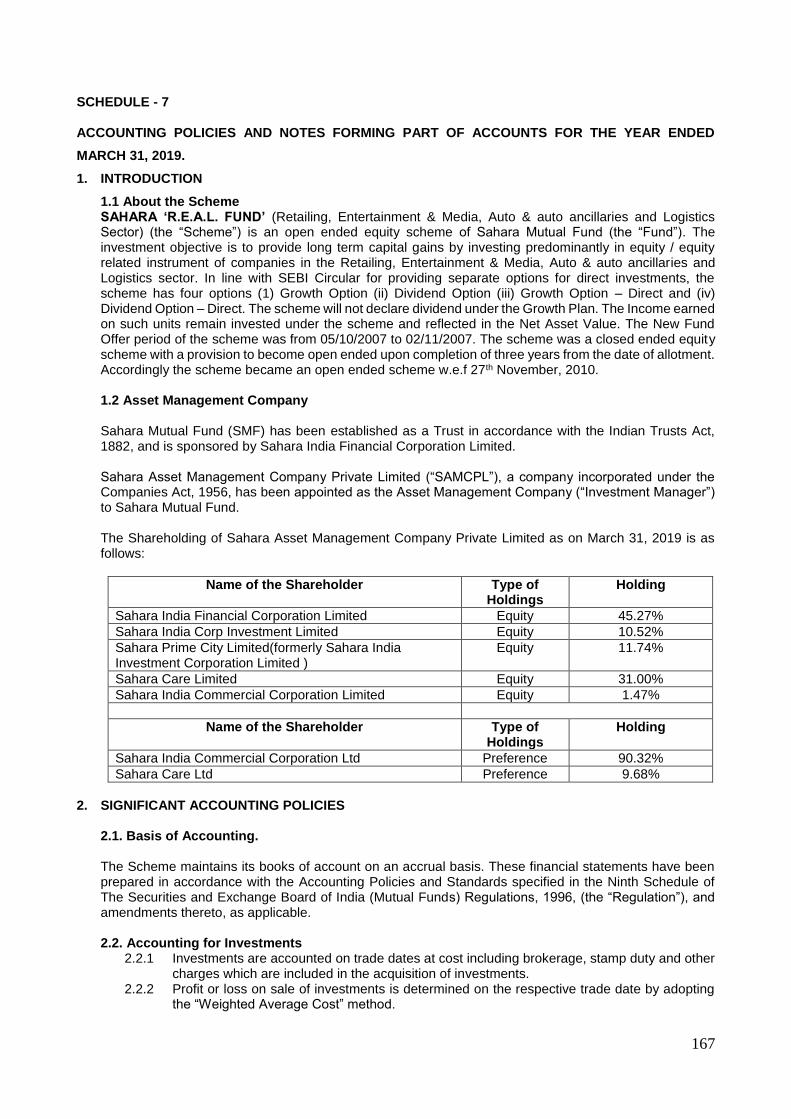
167
SCHEDULE - 7
ACCOUNTING POLICIES AND NOTES FORMING PART OF ACCOUNTS FOR THE YEAR ENDED
MARCH 31, 2019.
1. INTRODUCTION
1.1 About the Scheme SAHARA ‘R.E.A.L. FUND’ (Retailing, Entertainment & Media, Auto & auto ancillaries and Logistics Sector) (the “Scheme”) is an open ended equity scheme of Sahara Mutual Fund (the “Fund”). The investment objective is to provide long term capital gains by investing predominantly in equity / equity related instrument of companies in the Retailing, Entertainment & Media, Auto & auto ancillaries and Logistics sector. In line with SEBI Circular for providing separate options for direct investments, the scheme has four options (1) Growth Option (ii) Dividend Option (iii) Growth Option – Direct and (iv) Dividend Option – Direct. The scheme will not declare dividend under the Growth Plan. The Income earned on such units remain invested under the scheme and reflected in the Net Asset Value. The New Fund Offer period of the scheme was from 05/10/2007 to 02/11/2007. The scheme was a closed ended equity scheme with a provision to become open ended upon completion of three years from the date of allotment. Accordingly the scheme became an open ended scheme w.e.f 27th November, 2010. 1.2 Asset Management Company
Sahara Mutual Fund (SMF) has been established as a Trust in accordance with the Indian Trusts Act, 1882, and is sponsored by Sahara India Financial Corporation Limited.
Sahara Asset Management Company Private Limited (“SAMCPL”), a company incorporated under the Companies Act, 1956, has been appointed as the Asset Management Company (“Investment Manager”) to Sahara Mutual Fund.
The Shareholding of Sahara Asset Management Company Private Limited as on March 31, 2019 is as follows:
Name of the Shareholder Type of Holdings
Holding
Sahara India Financial Corporation Limited Equity 45.27%
Sahara India Corp Investment Limited Equity 10.52%
Sahara Prime City Limited(formerly Sahara India Investment Corporation Limited )
Equity 11.74%
Sahara Care Limited Equity 31.00%
Sahara India Commercial Corporation Limited Equity 1.47%
Name of the Shareholder Type of Holdings
Holding
Sahara India Commercial Corporation Ltd Preference 90.32%
Sahara Care Ltd Preference 9.68%
2. SIGNIFICANT ACCOUNTING POLICIES
2.1. Basis of Accounting. The Scheme maintains its books of account on an accrual basis. These financial statements have been prepared in accordance with the Accounting Policies and Standards specified in the Ninth Schedule of The Securities and Exchange Board of India (Mutual Funds) Regulations, 1996, (the “Regulation”), and amendments thereto, as applicable. 2.2. Accounting for Investments
2.2.1 Investments are accounted on trade dates at cost including brokerage, stamp duty and other charges which are included in the acquisition of investments.
2.2.2 Profit or loss on sale of investments is determined on the respective trade date by adopting the “Weighted Average Cost” method.
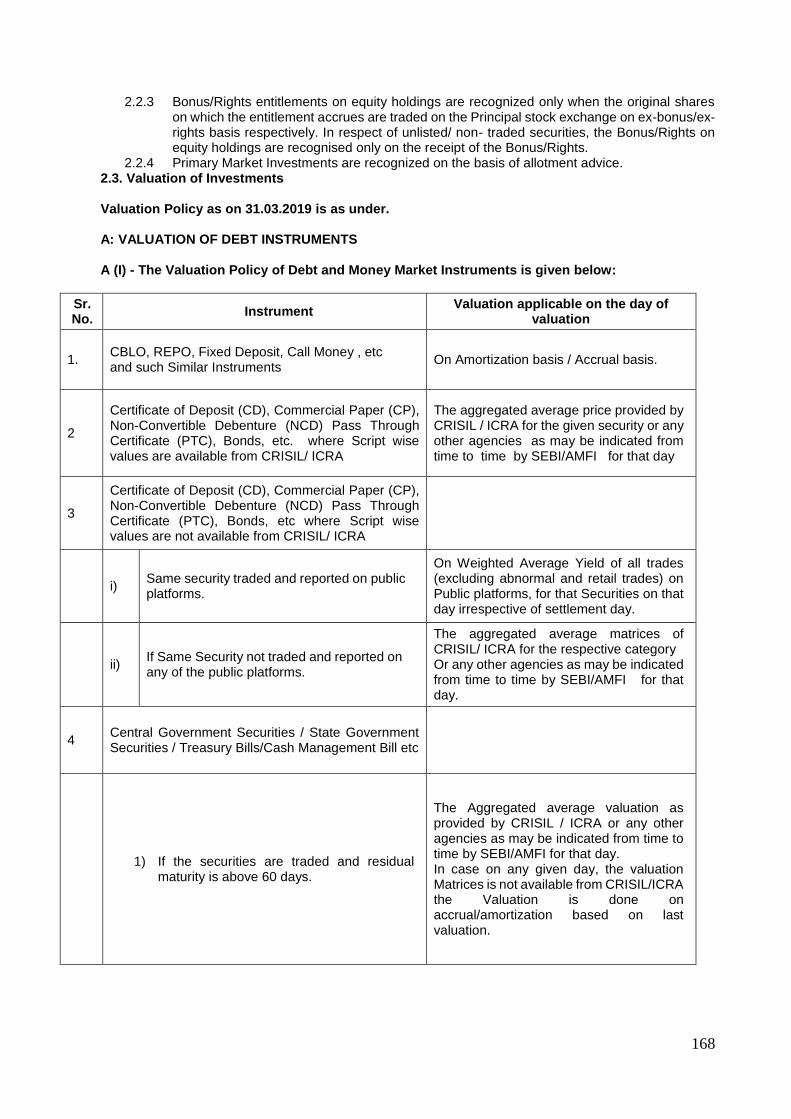
168
2.2.3 Bonus/Rights entitlements on equity holdings are recognized only when the original shares on which the entitlement accrues are traded on the Principal stock exchange on ex-bonus/ex-rights basis respectively. In respect of unlisted/ non- traded securities, the Bonus/Rights on equity holdings are recognised only on the receipt of the Bonus/Rights.
2.2.4 Primary Market Investments are recognized on the basis of allotment advice. 2.3. Valuation of Investments
Valuation Policy as on 31.03.2019 is as under.
A: VALUATION OF DEBT INSTRUMENTS
A (I) - The Valuation Policy of Debt and Money Market Instruments is given below:
Sr. No.
Instrument Valuation applicable on the day of
valuation
1. CBLO, REPO, Fixed Deposit, Call Money , etc and such Similar Instruments
On Amortization basis / Accrual basis.
2
Certificate of Deposit (CD), Commercial Paper (CP), Non-Convertible Debenture (NCD) Pass Through Certificate (PTC), Bonds, etc. where Script wise values are available from CRISIL/ ICRA
The aggregated average price provided by CRISIL / ICRA for the given security or any other agencies as may be indicated from time to time by SEBI/AMFI for that day
3
Certificate of Deposit (CD), Commercial Paper (CP), Non-Convertible Debenture (NCD) Pass Through Certificate (PTC), Bonds, etc where Script wise values are not available from CRISIL/ ICRA
i) Same security traded and reported on public platforms.
On Weighted Average Yield of all trades (excluding abnormal and retail trades) on Public platforms, for that Securities on that day irrespective of settlement day.
ii) If Same Security not traded and reported on any of the public platforms.
The aggregated average matrices of CRISIL/ ICRA for the respective category Or any other agencies as may be indicated from time to time by SEBI/AMFI for that day.
4 Central Government Securities / State Government Securities / Treasury Bills/Cash Management Bill etc
1) If the securities are traded and residual
maturity is above 60 days.
The Aggregated average valuation as provided by CRISIL / ICRA or any other agencies as may be indicated from time to time by SEBI/AMFI for that day. In case on any given day, the valuation Matrices is not available from CRISIL/ICRA the Valuation is done on accrual/amortization based on last valuation.

169
A (II) Pricing of Inter -Scheme Transfer of Debt Instruments (ISTs):
Sr. No.
Instrument Valuation applicable on the day of
valuation
1. Certificate of Deposit (CD), Commercial Paper (CP), Non-Convertible Debenture (NCD) Pass Through Certificate (PTC), Bonds, etc.
i) Same security traded and reported on FTRAC/CBRICS up to the time of IST.
Pricing will be based on Weighted Average Yield of all trades in similar security/securities on FTRAC/CBRICS (excluding abnormal and retail trades) irrespective of settlement day plus accrual/amortization, if any, based on settlement day of the IST. Example : If settlement is T+0 then no accrual/amortization and if the settlement is other than T+0, then appropriate accrual/amortization.
ii) If Same security is not traded but similar Security/securities are traded and reported up to the time of IST on FTRAC/CBRICS
Pricing will be based on Weighted Average Yield of all trades in similar security/securities on FTRAC/CBRICS (excluding abnormal and retail trades) irrespective of settlement day plus accrual/amortization, if any, based on settlement day of the IST. Example : If settlement is T+0 then no accrual/amortization and if the settlement is other than T+0, then appropriate accrual/amortization.
iii) If Same or similar Security/securities are not traded and reported up to the time of IST on FTRAC/CBRICS
Previous end of the day valuation plus accrual, if any, based on settlement day of the IST is taken. Example: if settlement is T+0 then no accrual/amortization and if the settlement is other than T+0 then appropriate accrual/amortization.
2. Central Government Securities / State Government Securities / Treasury Bills/ Cash Management Bill etc
2) If the securities are non-traded and residual
maturity is above 60 days.
By amortization on straight line basis to maturity from cost or last valuation price whichever is more recent.
3) If the securities are traded and residual
maturity of the securities is equal to or below 60 days
On last traded price as given on NDS-Section of CCIL Website (Excluding abnormal trade).
4) If the securities are non-traded and the
residual maturity of the securities is equal to or below 60 days
By amortization on straight line basis to maturity from cost or last valuation price whichever is more recent as long as it is within +/- 0.10 % of the reference price. Benchmark yields for calculating reference price to be provided by CRISIL / ICRA.
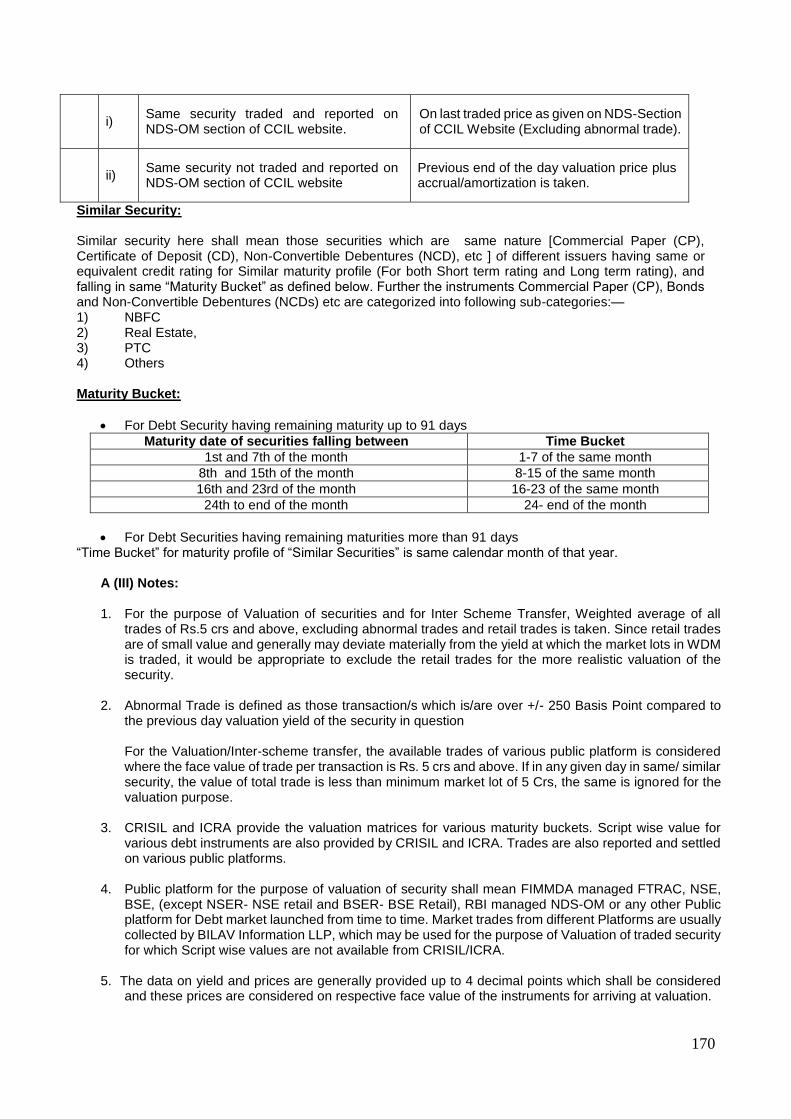
170
i) Same security traded and reported on NDS-OM section of CCIL website.
On last traded price as given on NDS-Section of CCIL Website (Excluding abnormal trade).
ii) Same security not traded and reported on NDS-OM section of CCIL website
Previous end of the day valuation price plus accrual/amortization is taken.
Similar Security: Similar security here shall mean those securities which are same nature [Commercial Paper (CP), Certificate of Deposit (CD), Non-Convertible Debentures (NCD), etc ] of different issuers having same or equivalent credit rating for Similar maturity profile (For both Short term rating and Long term rating), and falling in same “Maturity Bucket” as defined below. Further the instruments Commercial Paper (CP), Bonds and Non-Convertible Debentures (NCDs) etc are categorized into following sub-categories:— 1) NBFC 2) Real Estate, 3) PTC 4) Others Maturity Bucket:
For Debt Security having remaining maturity up to 91 days
Maturity date of securities falling between Time Bucket
1st and 7th of the month 1-7 of the same month
8th and 15th of the month 8-15 of the same month
16th and 23rd of the month 16-23 of the same month
24th to end of the month 24- end of the month
For Debt Securities having remaining maturities more than 91 days “Time Bucket” for maturity profile of “Similar Securities” is same calendar month of that year.
A (III) Notes:
1. For the purpose of Valuation of securities and for Inter Scheme Transfer, Weighted average of all trades of Rs.5 crs and above, excluding abnormal trades and retail trades is taken. Since retail trades are of small value and generally may deviate materially from the yield at which the market lots in WDM is traded, it would be appropriate to exclude the retail trades for the more realistic valuation of the security.
2. Abnormal Trade is defined as those transaction/s which is/are over +/- 250 Basis Point compared to the previous day valuation yield of the security in question For the Valuation/Inter-scheme transfer, the available trades of various public platform is considered where the face value of trade per transaction is Rs. 5 crs and above. If in any given day in same/ similar security, the value of total trade is less than minimum market lot of 5 Crs, the same is ignored for the valuation purpose.
3. CRISIL and ICRA provide the valuation matrices for various maturity buckets. Script wise value for various debt instruments are also provided by CRISIL and ICRA. Trades are also reported and settled on various public platforms.
4. Public platform for the purpose of valuation of security shall mean FIMMDA managed FTRAC, NSE, BSE, (except NSER- NSE retail and BSER- BSE Retail), RBI managed NDS-OM or any other Public platform for Debt market launched from time to time. Market trades from different Platforms are usually collected by BILAV Information LLP, which may be used for the purpose of Valuation of traded security for which Script wise values are not available from CRISIL/ICRA.
5. The data on yield and prices are generally provided up to 4 decimal points which shall be considered and these prices are considered on respective face value of the instruments for arriving at valuation.
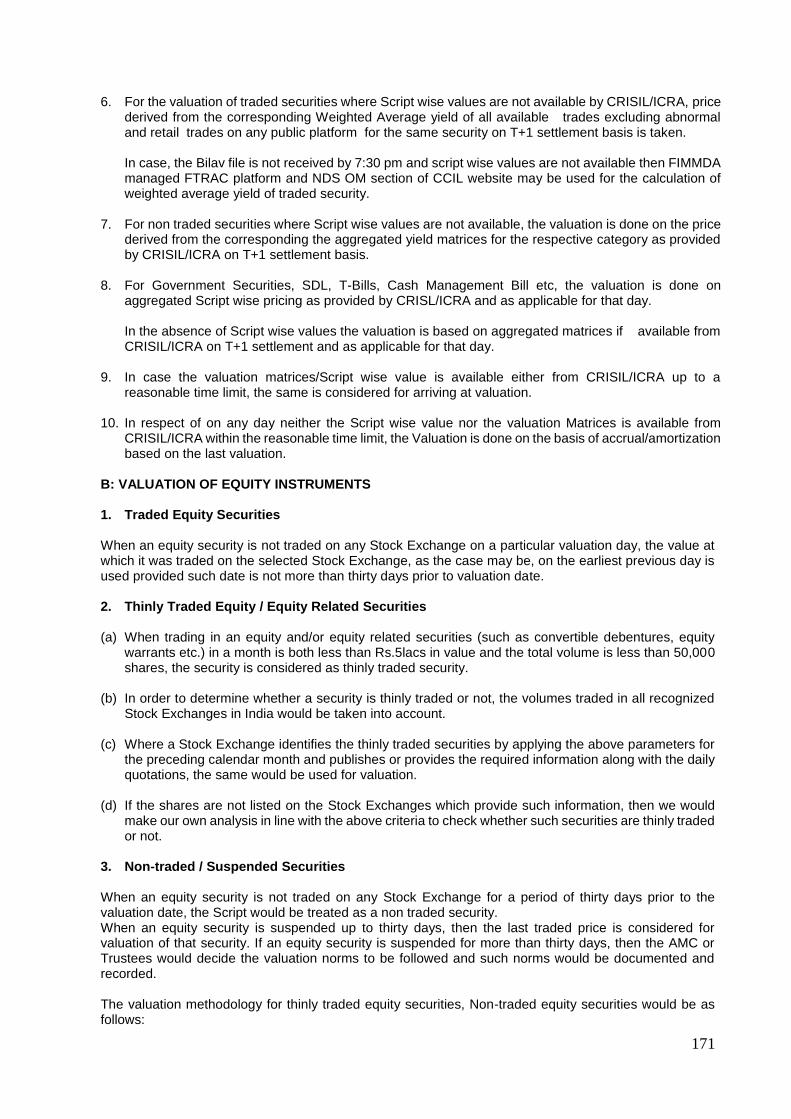
171
6. For the valuation of traded securities where Script wise values are not available by CRISIL/ICRA, price derived from the corresponding Weighted Average yield of all available trades excluding abnormal and retail trades on any public platform for the same security on T+1 settlement basis is taken.
In case, the Bilav file is not received by 7:30 pm and script wise values are not available then FIMMDA managed FTRAC platform and NDS OM section of CCIL website may be used for the calculation of weighted average yield of traded security.
7. For non traded securities where Script wise values are not available, the valuation is done on the price derived from the corresponding the aggregated yield matrices for the respective category as provided by CRISIL/ICRA on T+1 settlement basis.
8. For Government Securities, SDL, T-Bills, Cash Management Bill etc, the valuation is done on
aggregated Script wise pricing as provided by CRISL/ICRA and as applicable for that day. In the absence of Script wise values the valuation is based on aggregated matrices if available from CRISIL/ICRA on T+1 settlement and as applicable for that day.
9. In case the valuation matrices/Script wise value is available either from CRISIL/ICRA up to a
reasonable time limit, the same is considered for arriving at valuation.
10. In respect of on any day neither the Script wise value nor the valuation Matrices is available from CRISIL/ICRA within the reasonable time limit, the Valuation is done on the basis of accrual/amortization based on the last valuation.
B: VALUATION OF EQUITY INSTRUMENTS
1. Traded Equity Securities
When an equity security is not traded on any Stock Exchange on a particular valuation day, the value at which it was traded on the selected Stock Exchange, as the case may be, on the earliest previous day is used provided such date is not more than thirty days prior to valuation date.
2. Thinly Traded Equity / Equity Related Securities
(a) When trading in an equity and/or equity related securities (such as convertible debentures, equity
warrants etc.) in a month is both less than Rs.5lacs in value and the total volume is less than 50,000 shares, the security is considered as thinly traded security.
(b) In order to determine whether a security is thinly traded or not, the volumes traded in all recognized
Stock Exchanges in India would be taken into account.
(c) Where a Stock Exchange identifies the thinly traded securities by applying the above parameters for the preceding calendar month and publishes or provides the required information along with the daily quotations, the same would be used for valuation.
(d) If the shares are not listed on the Stock Exchanges which provide such information, then we would make our own analysis in line with the above criteria to check whether such securities are thinly traded or not.
3. Non-traded / Suspended Securities
When an equity security is not traded on any Stock Exchange for a period of thirty days prior to the valuation date, the Script would be treated as a non traded security. When an equity security is suspended up to thirty days, then the last traded price is considered for valuation of that security. If an equity security is suspended for more than thirty days, then the AMC or Trustees would decide the valuation norms to be followed and such norms would be documented and recorded.
The valuation methodology for thinly traded equity securities, Non-traded equity securities would be as follows:
172
Based on the latest available Balance Sheet, net worth would be calculated as follows:
(a) Net Worth per share = [share capital+ reserves (excluding revaluation reserves) – Misc. expenditure
and Debit Balance in P&L A/c] Divided by No. of Paid up Shares.
(b) Average capitalization rate (P/E ratio) for the industry based upon NSE prices or BSE prices and discounted by 75% i.e. only 25% of the Industry average P/E would be taken as capitalization rate (P/E ratio). Earnings per Share (EPS) of the latest audited annual accounts would be considered for this purpose.
(c) The value as per the net worth value per share and the capital earning value calculated as above
would be averaged and further discounted by 10% for illiquidity so as to arrive at the fair value per share.
(d) In case the EPS is negative, EPS value for that year would be taken as zero for arriving at capitalized
earning.
(e) In case, where the latest Balance Sheet of the company is not available within nine months from the close of the year, unless the accounting year is changed, the shares of such companies would be valued at zero.
(f) In case, an individual security accounts for more than 5% of the total assets of the scheme, an
Independent Valuer would be appointed for the valuation of the said security. To determine if a security accounts for more than 5 per cent of the total assets of the scheme, it would be valued by the procedure above and the proportion which it bears to the total net assets of the scheme to which it belongs will be compared on the date of valuation.
4. Unlisted Equity
Methodology for Valuation - unlisted equity shares of a company would be valued "in good faith" as below:
a) Based on the latest available Balance Sheet, net worth would be calculated as follows:
1. Net Worth per share = [Share Capital+ Reserves (excluding revaluation reserves) – Misc. expenditure
and Debit Balance in P&L A/c] Divided by No. of Paid up Shares.
2. After taking into account the outstanding warrants and options, Net Worth per share would again be calculated and is = [Share Capital + consideration on exercise of Option and/or Warrants received/receivable by the Company + Free Reserves (excluding Revaluation Reserves) – Miscellaneous expenditure not written off or deferred revenue expenditure, intangible assets and accumulated losses] / Number of Paid up Shares plus Number of Shares that would be obtained on conversion and/or exercise of Outstanding Warrants and Options.
3. The lower of (1) and (2) above would be used for calculation of Net Worth per share and for further
calculation in (c) below.
b) Average capitalization rate (P/E ratio) for the industry based upon NSE prices or BSE prices and discounted by 75% i.e. only 25% of the Industry average P/E would be taken as capitalization rate (P/E ratio). Earnings per Share (EPS) of the latest audited annual accounts would be considered for this purpose.
c) The value as per the net worth value per share and the capital earning value calculated as above would be averaged and further discounted by 15% for illiquidity so as to arrive at the fair value per share.
The above valuation methodology would be subject to the following conditions:
a) All calculations would be based on audited accounts.
173
b) If the latest Balance Sheet of the company is not available within nine months from the close of the year, unless the accounting year is changed, the shares of such companies would be valued at zero.
c) If the Net Worth of the company is negative, the share would be marked down to zero.
d) In case the EPS is negative, EPS value for that year would be taken as zero for arriving at capitalized
earning.
e) In case an individual security accounts for more than 5 per cent of the total assets of the scheme, an Independent Valuer would be appointed for the valuation of the said security. To determine if a security accounts for more than 5 per cent of the total assets of the scheme, it is valued in accordance with the procedure as mentioned above on the date of valuation.
5. Demerger
Generally on demerger, a listed security gets bifurcated into two or more shares. The valuation of these de-merged companies would depend on the following scenarios:
a) Both the shares are traded immediately on de-merger: In this case both the shares would be
valued at respective traded prices. b) Shares of only one company continued to be traded on de-merger: Traded shares would be
valued at traded price and the other security would to be valued at traded value on the day before the de merger less value of the traded security post de merger. In case value of the share of de-merged company is equal or in excess of the value of the pre de-merger share, then the non traded share would be valued at zero, till the date it is listed.
c) Both the shares are not traded on de-merger: Shares of de-merged companies would be valued
equal to the pre de merger value up to a period of 30 days from the date of de merger till the date it is listed. The market price of the shares of the de-merged company one day prior to ex-date would be bifurcated over the de-merged shares. The market value of the shares would be bifurcated on a fair value basis, based on available information on the de-merger scheme.
d) In case shares of either of the companies are not traded for more than 30 days: Then it would be
treated as unlisted security, and valued accordingly till the date these are listed.
6. Preference Shares
Preference Shares valuation guidelines would be as follows:
a) Traded preference shares would be valued as per traded prices. b) Non traded Preference Shares
(I). Redeemable Preference Shares
i. Convertible preference share would be valued like convertible debentures. In general in respect of convertible debentures and bonds, the non-convertible and convertible components would be valued separately. The non-convertible component would be valued on the same basis as would be applicable to a debt instrument. The convertible component would be valued on the same basis as would be applicable to an equity instrument.
If a convertible preference share does not pay dividend then it would be treated like non convertible debentures.
ii. Non-Convertible preference share would be valued like a debt instrument.
(II). Irredeemable preference shares would be valued on perpetual basis. It is like a constant dividend equity share.
174
7. Warrants
a) In respect of warrants to subscribe for shares attached to instruments, the warrants would be valued at the value of the share which would be obtained on exercise of the warrants as reduced by the amount which would be payable on exercise of the warrant. A discount similar to the discount to be determined in respect on convertible debentures is deducted to account for the period, which must elapse before the warrant can be exercised.
b) In case the warrants are traded separately they would be valued as per the valuation guidelines
applicable to Equity Shares.
8. Rights
Until they are traded, the value of "rights" shares would be calculated as: Vr = n ÷ m x (Pex - Pof) Where Vr = Value of rights n = no. of rights offered m = no. of original shares held Pex = Ex-rights price Pof = Rights Offer Price
Where the rights are not treated pari passu with the existing shares, suitable adjustment would be made to the value of rights. Where it is decided not to subscribe for the rights but to renounce them and renunciations are being traded, the rights would be valued at the renunciation value.
9. Derivatives
Market values of traded open futures and option contracts would be determined with respect to the exchange on which contracted originally, i.e., a future or an option contracted on the National Stock Exchange (NSE) would be valued at the closing price on the NSE. The price of the same futures and option contract on the Bombay Stock Exchange (BSE) cannot be considered for the purpose of valuation, unless the futures or option itself has been contracted on the BSE. The same will be valued at closing price if the contract is traded on the valuation day. In case there is no trade on valuation day then the same would be valued at Settlement prices. However, the contracts which are going to expire on valuation date would be valued at Settlement prices only.
10. Mutual Fund Units a) In case of traded Mutual Fund schemes, the units would be valued at closing price on the stock
exchange on which they are traded like equity instruments. In case the units are not traded for more than 7 days, last declared Repurchase Price (the price at which Mutual Fund schemes buys its units back) would be considered for valuation.
b) If the last available Repurchase price is older than 7 days, the valuation will be done at the last available NAV reduced by illiquidity discount. The illiquidity discount will be 10% of NAV or as decided by the Valuation Committee.
c) In case of non-traded Mutual Fund scheme, the last declared Repurchase Price (the price at which
Mutual Fund schemes buys its units back) would be considered for valuation. d) In case of Investments made by a scheme into the other scheme of Sahara Mutual Fund, if valuation
date being the last day of the financial year falling on a non-business day, then the computed NAV would be considered for valuation on March 31.
175
Related matters i) In case the income accrued on debt instruments is not received even after 90 days past the due date, the asset
is termed as Non Performing Assets (NPAs) and all provisions/guidelines with respect to income accrual, provisioning etc as contained in SEBI circulars/guidelines issued from time to time shall apply and the valuation of such securities will be done accordingly. In case the company starts servicing the debt, re-schedulement is allowed, the applicable provision in SEBI circulars shall apply for provisioning and reclassification of the asset
ii) In case of any other instruments not covered in the policy above, the same is referred to the Investment and
Valuation Committee which is empowered to take decision.
iii) In case of any perceived conflict of interest while valuating the securities, the matter is dealt and decided by Investment and Valuation Committee.
iv) For non– business day the valuation is done on aggregated Script wise prices as provided by CRISIL/ICRA.
In absence of Script wise prices the valuation is done on accrual basis/amortization basis based on last valuation
v) In case of exceptional circumstances like, policy announcements by government/regulatory bodies, natural
disasters, public disturbances, extreme volatility in capital market, shut down of market, war etc and on those days if Script wise value or valuation matrices are not available from CRISIL/ICRA and if security is not traded, the valuation for the day is done based on last valuation plus accrual/amortization or as may decided by the Investment and Valuation Committee.
vi) The Valuation Policy is reviewed by the Statutory Auditor at least once in a financial year.
vii) Valuation Policy as updated and approved by the Board of AMC / Board of Trustees is applicable for the
schemes of Sahara Mutual Fund.
2.3.1 Valuation of securities not covered under the above valuation policy:
The total exposure in securities, which do not fall under above valuation norms, shall not exceed 5% of the total AUM of the scheme.
In case of any other instruments not covered in the policy above, the same shall be referred to the Investment and Valuation Committee which is empowered to take decision.
Investment in such securities is to be valued by a method approved by the Investment and Valuation Committee and the same will be reported to the Board of Trustees.
2.3.2 Unrealised Appreciation/Depreciation. In accordance with the Guidance Note on Accounting for Investments in the Financial Statements of Mutual Funds issued by the Institute of Chartered Accountants of India, the unrealized appreciation determined separately for each individual investment is directly transferred to the “Unrealized Appreciation Reserve Account” i.e. without routing it through the revenue account.
The provision for depreciation in value of investments determined separately for each individual investment is recognized in the revenue account. The loss (realized) on investments sold / transferred during the year is charged to revenue account, instead of being first adjusted against the provision for depreciation, if already created in the prior year, as recommended by the said Guidance Note. However, this departure from the Guidance Note does not have any net impact on the Scheme’s net assets or results for the year.
2.4 Revenue Recognition
2.4.1 Income and Expenses are recognized on accrual basis. 2.4.2 Interest on funds invested in short term deposits with scheduled commercial banks is
recognized on accrual basis. 2.4.3 Dividend income earned by the scheme is recognized on the date the share is quoted on ex-
dividend basis on principal stock exchange. 2.4.4 Proportionate realized gains on investments out of sales / repurchase proceeds at the time of
sale / repurchase of units are transferred to revenue Account from Unit Premium Reserve.
176
3. Net Asset Value for Growth/Dividend Options:
The net asset value of the units is determined separately for units issued under the Growth Option, Dividend Option, Growth Option – Direct and Dividend Option – Direct. For reporting the net asset value of the Growth Option, Dividend Option, Growth Option – Direct and Dividend Option - Direct, daily income earned, including realized and unrealized gain or loss in the value of investments and expenses incurred by the scheme are allocated to the options in proportion to the value of the net assets.
4. Unit Premium Reserve Account
Upon issue and redemption of units, the net premium or discount to the face value of units is adjusted against the unit premium reserve account of the Scheme, after an appropriate amount of the issue proceeds and redemption payout is credited or debited respectively to the income equalization account.
5. Income Equalisation Account
An appropriate part of the sale proceeds or the redemption amount, as the case may be, is transferred to income equalization account. The total distributable surplus (without considering unrealized appreciation) upto the date of issue/ redemption of units has been taken into account for the purpose of ascertaining the amount to be transferred to Equalization Account on a daily basis. The net balance in this account is transferred to the Revenue Account at the end of the year.
6. Load Charges
Service tax on exit load , if any, shall be paid out of the exit load proceeds and exit load net of service tax, if any, shall be credited to the scheme.
7. Unclaimed Redemption. In line with SEBI circular no. MFD/CIR/9/120 /2000 dated November 24, 2000 and SEBI circular no. SEBI/HO/IMD/DF2/CIR/P/2016/37 dated February 25, 2016, the unclaimed redemption and unclaimed dividend amounts may be deployed by the mutual funds in call money market or money market instruments and also be allowed to be invested in a separate plan of Liquid Scheme/ Money Market Mutual Fund scheme floated by Mutual Funds specifically for deployment of the unclaimed amounts. The investors who claim these amounts during a period of three years from the due date shall be paid initial unclaimed amount along with the income earned on its deployment. Investors who claim these amounts after 3 years, shall be paid initial unclaimed amount along with the income earned on its deployment till the end of the third year. After the third year, the income earned on such unclaimed amounts shall be used for the purpose of investor education. Further, AMC shall not be permitted to charge any exit load in this plan and TER (Total Expense Ratio) of such plans shall be capped at 50 bps. The AMC should make continuous effort to remind the investors through letters to take their unclaimed amounts.
8. NOTES TO THE ACCOUNTS 8.1 Management Fees, Trusteeship Fees, Custodian Fees, Scheme Expenses
Management Fees
Management Fees (inclusive of GST) has been computed at 1.88% (P.Y. 2.85%) on average net assets calculated on a daily basis.
Trusteeship Fees & Expenses
In accordance with Deed of Trust dated 18th July 1996 between the Settler and the Trustees, an annual
fee of Rs.1,00,000/- per Trustee is payable. During the financial year 2018-19, the Trusteeship fees and expenses amounted to Rs.67803.67. However, due to small AUM of the scheme, only an amount of Rs.7087.26 was charged to the scheme expenses and the balance amount was borne by the AMC.
177
Custodian Charges
HDFC Bank provides Custodial services to the scheme for which fees is paid as per the agreement. Scheme Expenses
As per guidelines issued vide SEBI circular dated October 22, 2018, the schemes related expenses had to be fully managed from the Total Expense Ratio (TER).
During the financial year 2018-19 due to small size of AUM of the scheme only certain expenses have been paid from TER and the balance amount had been borne by the AMC, details are as under:
(Amount in Rs.)
Particulars Total Expenses Charged to Scheme TER
Balance borne by AMC
R & T Expenses 300066.42 135549.72 164516.70
Custodian Fees 175898.20 73808.41 102089.79
Audit fees 155992.26 90197.98 65794.28
8.2 Provision for tax has not been made since the income of the scheme is exempt from tax under Section 10(23D) of the Income Tax Act, 1961.
8.3 Transactions with Brokers in excess of 5% or more of the aggregate purchases and sale of securities made by the Fund have\s been reported to the Trustees on a Bimonthly basis.
8.4 During the year ended 31.03.2019 the Registrar and Transfer Agent charges amounting to Rs.135549.72 (PY: Rs.0.00) constitutes 13.12% (PY: 0.00%) of the total scheme expenses.
8.5 Transactions with Associates/related parties/group companies of Sponsor/AMC Brokerage / Commission on sale of units by the Scheme or by the Asset Management Company given to associates, pursuant to Regulation 25(8): Related Party:- Sahara India Financial Corporation Ltd(SIFCL):(Sponsor)
Commission to SIFCL made for sale of units of the MF for the current year ended 31st March 2019. (Rs. in lakhs)
Tax Gain Fund Growth Fund
Mid cap Fund
Wealth Plus Fund
Infrastructure Fund
0.0541 0.0026 0.0053 0.0005 0.0047
(Rs. in lakhs)
Star Value Fund Banking & Financial Services Fund
0.0003 0.0112
Commission to SIFCL made for sale of units of the MF for the previous year ended 31st March 2018. (Rs.In lakhs)
Tax Gain Fund
Growth Fund
Liquid Fund
Mid cap Fund
Wealth Plus Fund
Infrastructure Fund
0.0920 0.0053 0.0003 0.0251 0.0005 0.0050
(Rs. In lakhs)
Star Value Fund Super 20 Fund
Power and Natural Resources Fund
Banking & Financial Services Fund
0.0008 0.0001 - 0.0184
178
Commission to SIFCL
Name of associate / related parties / group
companies of Sponsor / AMC
Nature of association /
nature of relation
Period Covered
Business given (Rs cr
and % of total business
received by the fund)
Commission paid (Rs & % of total
commission paid by the fund
1 2 3 4 5
SIFCL Sponsor / Mutual Fund Distributor
April 18-March 19
0.00
Rs.7874.96; 9.20%
SIFCL Sponsor / Mutual Fund Distributor
April 17-March 18
0.00
Rs.14755.39; 8.10%
In column No 5, the amount relates to trail commission Brokerage paid to associates / related parties / group companies of Sponsor/AMC
Name of associate / related parties / group
companies of Sponsor / AMC
Nature of association /
nature of relation
Period Covered
Value of Transaction (in Rs, Cr & of Total value of Transaction of the
Fund)
Brokerage (Rs Cr & % of
total brokerage paid by the
Fund)
- - - - -
There are no associate brokers, hence not applicable for the period April – Mar 2019 & April – Mar 2018.
8.6 The aggregate value of Investment purchased and sold(Including Redemption) during the year as a percentage of daily average net asset value;
Purchases
Year Amount (Rs) % of Daily average
2018-19 5,07,75,176 135.54
2017-18 98,23,446 22.42
Sales
Year Amount (Rs) % of Daily average
2018-19 5,48,47,275 146.41
2017-18 1,71,08,165 39.05
8.7 Aggregate Appreciation and Depreciation in the value of Investments :
Asset Class 31-Mar-19 31-Mar-18
Appreciation (Rs. In lakhs)
Depreciation (Rs. In lakhs)
Appreciation (Rs. In lakhs)
Depreciation (Rs. In lakhs)
Equity Shares 27.78 45.69 156.00 8.94
8.8 Income and Expense Ratio
2018-19 2017-18
Total Income (including net unrealized appreciation and net of loss on sale of investments) to average net assets calculated on a daily basis.
37.03%
47.65%
Total Expenditure to average net assets calculated on a daily basis 2.76% 3.05%
179
8.9 Movements in Unit Capital : Face Value of Units : Rs. 10/- per unit.
8.9.1 Growth Option
Number of Units Amount
(Rs) Number of
Units Amount
(Rs)
As on
March 31, 2019 As on
March 31, 2019 As on March
31, 2018 As on
March 31, 2018
Initial Capital 10898668.702 108986687.02 10898668.702 108986687.02
Opening Balance 1522648.659 15226486.59 1750645.591 17506455.91
Units Sold during the year 0.000 0.00 0.000 0.00
Units Repurchased during the year (88953.913) (889539.13) (227996.932) (2279969.32)
Closing Balance 1433694.746 14336947.46 1522648.659 15226486.59
8.9.2 Growth Option (Direct)
Number of Units Amount
(Rs) Number of Units Amount
(Rs)
As on March
31, 2019 As on March
31, 2019 As on March
31, 2018 As on March
31, 2018
Initial Capital 0.000 0.00 0.000 0.00
Opening Balance 29514.075 295140.75 36277.184 362771.84
Units Sold during the year 0.000 0.00 0.000 0.00
Units Repurchased during the year 0.000 0.00 (6763.109) (67631.09)
Closing Balance 29514.075 295140.75 29514.075 295140.75
8.9.3 Dividend Option
Number of Units Amount
(Rs) Number of Units Amount
(Rs)
As on
March 31, 2019 As on
March 31, 2019 As on
March 31, 2018 As on
March 31, 2018
Initial Capital 3653051.558 36530515.58 3653051.558 36530515.58
Opening Balance 331028.976 3310289.76 410011.247 4100112.47
Units Sold during the year 0.000 0.00 0.000 0.00
Units Repurchased during the year (29000.000) (290000.00) (78982.271) (789822.71)
Closing Balance 302028.97 6 3020289.76 331028.976 3310289.76
8.9.4 Dividend Option(Direct)
Number of Units Amount
(Rs) Number of Units Amount
(Rs)
As on
March 31, 2019 As on
March 31, 2019 As on
March 31, 2018 As on
March 31, 2018
Initial Capital 0.00 0.00 0.00 0.00
Opening Balance 720.335 7203.35 720.335 7203.35
Units Sold during the year 0.000 0.00 0.000 0.00
Units Repurchased during the year 0.000 0.000 0.000 0.00
Closing Balance 720.335 7203.35 720.335 7203.35
8.10 The scheme has declared Nil dividend for the year ended March 31, 2019 (PY: Nil). There was no bonus declared during the year ended March 31, 2019 (PY: Nil). 8.11 Unclaimed Amounts (beyond three months): Unclaimed Dividend and Redemption amounts as on March 31, 2019 are as below:
Scheme name No of Investors Unclaimed Dividend (Rs)
No. of Investors
Unclaimed Redemption (Rs)
Sahara R.E.A.L Fund. - - 48 687476.9
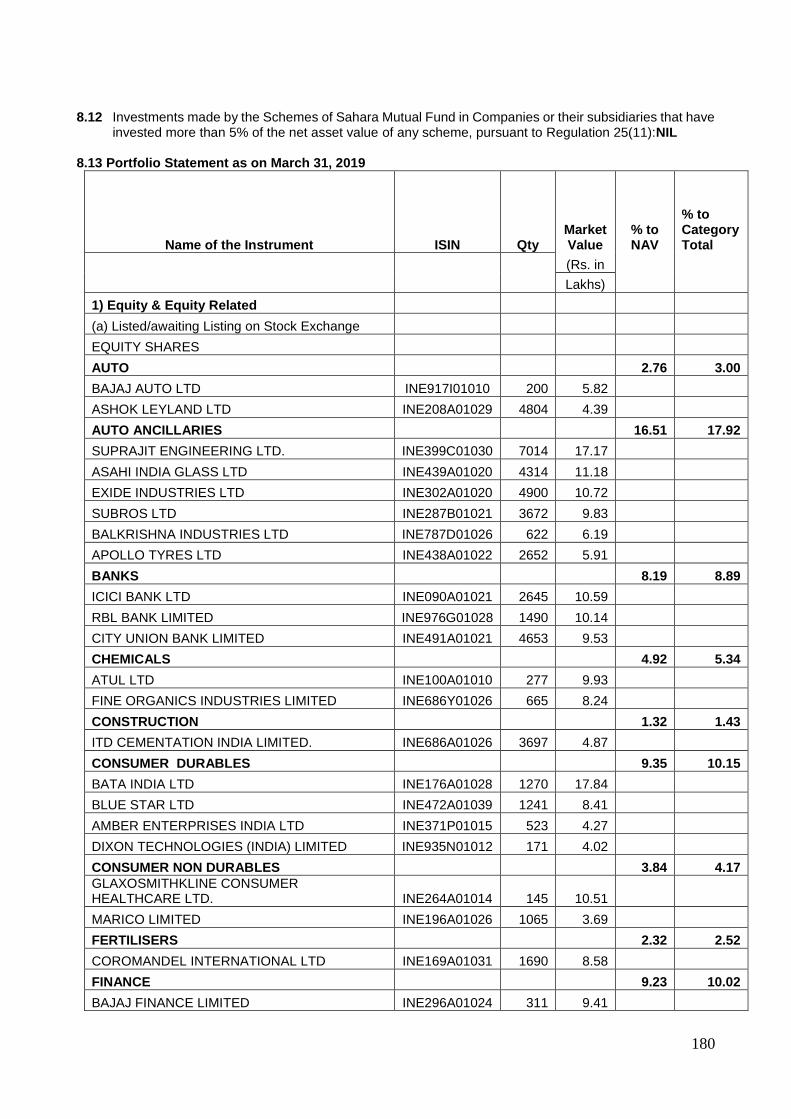
180
8.12 Investments made by the Schemes of Sahara Mutual Fund in Companies or their subsidiaries that have
invested more than 5% of the net asset value of any scheme, pursuant to Regulation 25(11):NIL 8.13 Portfolio Statement as on March 31, 2019
Name of the Instrument ISIN Qty Market Value
% to NAV
% to Category Total
(Rs. in
Lakhs)
1) Equity & Equity Related
(a) Listed/awaiting Listing on Stock Exchange
EQUITY SHARES
AUTO 2.76 3.00
BAJAJ AUTO LTD INE917I01010 200 5.82
ASHOK LEYLAND LTD INE208A01029 4804 4.39
AUTO ANCILLARIES 16.51 17.92
SUPRAJIT ENGINEERING LTD. INE399C01030 7014 17.17
ASAHI INDIA GLASS LTD INE439A01020 4314 11.18
EXIDE INDUSTRIES LTD INE302A01020 4900 10.72
SUBROS LTD INE287B01021 3672 9.83
BALKRISHNA INDUSTRIES LTD INE787D01026 622 6.19
APOLLO TYRES LTD INE438A01022 2652 5.91
BANKS 8.19 8.89
ICICI BANK LTD INE090A01021 2645 10.59
RBL BANK LIMITED INE976G01028 1490 10.14
CITY UNION BANK LIMITED INE491A01021 4653 9.53
CHEMICALS 4.92 5.34
ATUL LTD INE100A01010 277 9.93
FINE ORGANICS INDUSTRIES LIMITED INE686Y01026 665 8.24
CONSTRUCTION 1.32 1.43
ITD CEMENTATION INDIA LIMITED. INE686A01026 3697 4.87
CONSUMER DURABLES 9.35 10.15
BATA INDIA LTD INE176A01028 1270 17.84
BLUE STAR LTD INE472A01039 1241 8.41
AMBER ENTERPRISES INDIA LTD INE371P01015 523 4.27
DIXON TECHNOLOGIES (INDIA) LIMITED INE935N01012 171 4.02
CONSUMER NON DURABLES 3.84 4.17
GLAXOSMITHKLINE CONSUMER HEALTHCARE LTD. INE264A01014 145 10.51
MARICO LIMITED INE196A01026 1065 3.69
FERTILISERS 2.32 2.52
COROMANDEL INTERNATIONAL LTD INE169A01031 1690 8.58
FINANCE 9.23 10.02
BAJAJ FINANCE LIMITED INE296A01024 311 9.41
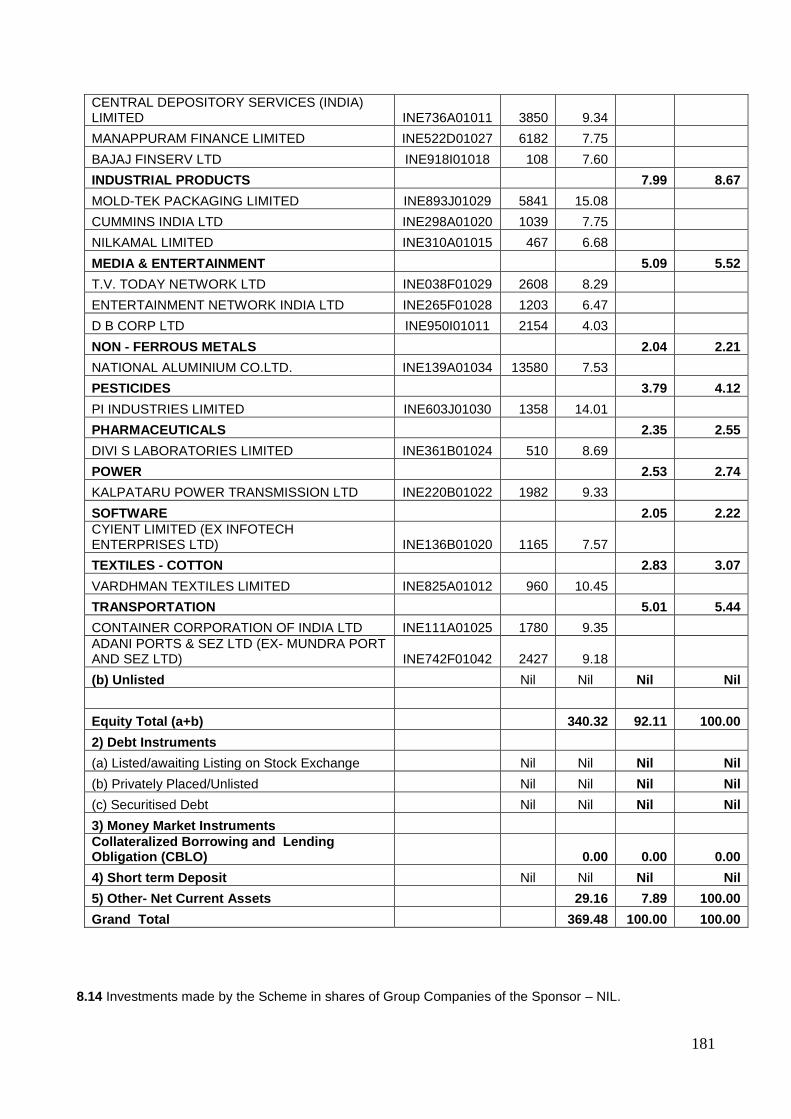
181
CENTRAL DEPOSITORY SERVICES (INDIA) LIMITED INE736A01011 3850 9.34
MANAPPURAM FINANCE LIMITED INE522D01027 6182 7.75
BAJAJ FINSERV LTD INE918I01018 108 7.60
INDUSTRIAL PRODUCTS 7.99 8.67
MOLD-TEK PACKAGING LIMITED INE893J01029 5841 15.08
CUMMINS INDIA LTD INE298A01020 1039 7.75
NILKAMAL LIMITED INE310A01015 467 6.68
MEDIA & ENTERTAINMENT 5.09 5.52
T.V. TODAY NETWORK LTD INE038F01029 2608 8.29
ENTERTAINMENT NETWORK INDIA LTD INE265F01028 1203 6.47
D B CORP LTD INE950I01011 2154 4.03
NON - FERROUS METALS 2.04 2.21
NATIONAL ALUMINIUM CO.LTD. INE139A01034 13580 7.53
PESTICIDES 3.79 4.12
PI INDUSTRIES LIMITED INE603J01030 1358 14.01
PHARMACEUTICALS 2.35 2.55
DIVI S LABORATORIES LIMITED INE361B01024 510 8.69
POWER 2.53 2.74
KALPATARU POWER TRANSMISSION LTD INE220B01022 1982 9.33
SOFTWARE 2.05 2.22
CYIENT LIMITED (EX INFOTECH ENTERPRISES LTD) INE136B01020 1165 7.57
TEXTILES - COTTON 2.83 3.07
VARDHMAN TEXTILES LIMITED INE825A01012 960 10.45
TRANSPORTATION 5.01 5.44
CONTAINER CORPORATION OF INDIA LTD INE111A01025 1780 9.35
ADANI PORTS & SEZ LTD (EX- MUNDRA PORT AND SEZ LTD) INE742F01042 2427 9.18
(b) Unlisted Nil Nil Nil Nil
Equity Total (a+b) 340.32 92.11 100.00
2) Debt Instruments
(a) Listed/awaiting Listing on Stock Exchange Nil Nil Nil Nil
(b) Privately Placed/Unlisted Nil Nil Nil Nil
(c) Securitised Debt Nil Nil Nil Nil
3) Money Market Instruments
Collateralized Borrowing and Lending Obligation (CBLO) 0.00 0.00 0.00
4) Short term Deposit Nil Nil Nil Nil
5) Other- Net Current Assets 29.16 7.89 100.00
Grand Total 369.48 100.00 100.00
8.14 Investments made by the Scheme in shares of Group Companies of the Sponsor – NIL.
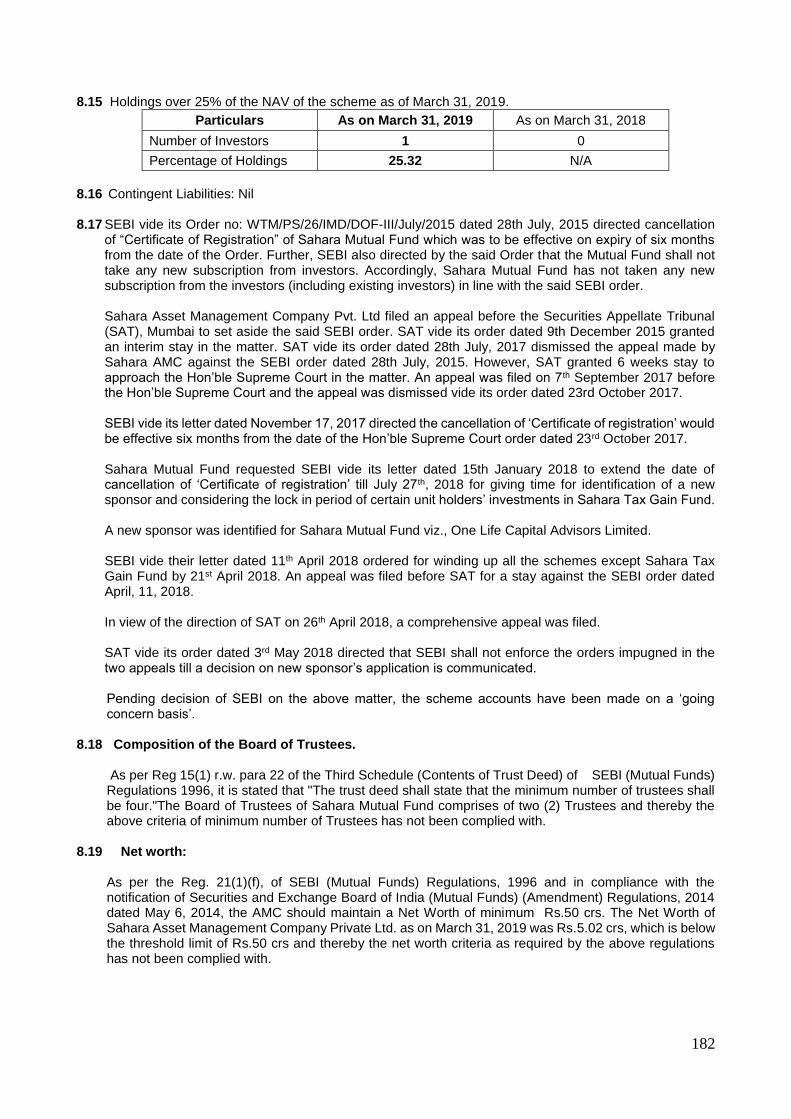
182
8.15 Holdings over 25% of the NAV of the scheme as of March 31, 2019.
Particulars As on March 31, 2019 As on March 31, 2018
Number of Investors 1 0
Percentage of Holdings 25.32 N/A
8.16 Contingent Liabilities: Nil
8.17 SEBI vide its Order no: WTM/PS/26/IMD/DOF-III/July/2015 dated 28th July, 2015 directed cancellation
of “Certificate of Registration” of Sahara Mutual Fund which was to be effective on expiry of six months from the date of the Order. Further, SEBI also directed by the said Order that the Mutual Fund shall not take any new subscription from investors. Accordingly, Sahara Mutual Fund has not taken any new subscription from the investors (including existing investors) in line with the said SEBI order.
Sahara Asset Management Company Pvt. Ltd filed an appeal before the Securities Appellate Tribunal (SAT), Mumbai to set aside the said SEBI order. SAT vide its order dated 9th December 2015 granted an interim stay in the matter. SAT vide its order dated 28th July, 2017 dismissed the appeal made by Sahara AMC against the SEBI order dated 28th July, 2015. However, SAT granted 6 weeks stay to approach the Hon’ble Supreme Court in the matter. An appeal was filed on 7th September 2017 before the Hon’ble Supreme Court and the appeal was dismissed vide its order dated 23rd October 2017. SEBI vide its letter dated November 17, 2017 directed the cancellation of ‘Certificate of registration’ would be effective six months from the date of the Hon’ble Supreme Court order dated 23rd October 2017. Sahara Mutual Fund requested SEBI vide its letter dated 15th January 2018 to extend the date of cancellation of ‘Certificate of registration’ till July 27th, 2018 for giving time for identification of a new sponsor and considering the lock in period of certain unit holders’ investments in Sahara Tax Gain Fund. A new sponsor was identified for Sahara Mutual Fund viz., One Life Capital Advisors Limited. SEBI vide their letter dated 11th April 2018 ordered for winding up all the schemes except Sahara Tax Gain Fund by 21st April 2018. An appeal was filed before SAT for a stay against the SEBI order dated April, 11, 2018. In view of the direction of SAT on 26th April 2018, a comprehensive appeal was filed. SAT vide its order dated 3rd May 2018 directed that SEBI shall not enforce the orders impugned in the two appeals till a decision on new sponsor’s application is communicated. Pending decision of SEBI on the above matter, the scheme accounts have been made on a ‘going concern basis’.
8.18 Composition of the Board of Trustees.
As per Reg 15(1) r.w. para 22 of the Third Schedule (Contents of Trust Deed) of SEBI (Mutual Funds) Regulations 1996, it is stated that "The trust deed shall state that the minimum number of trustees shall be four."The Board of Trustees of Sahara Mutual Fund comprises of two (2) Trustees and thereby the above criteria of minimum number of Trustees has not been complied with.
8.19 Net worth:
As per the Reg. 21(1)(f), of SEBI (Mutual Funds) Regulations, 1996 and in compliance with the notification of Securities and Exchange Board of India (Mutual Funds) (Amendment) Regulations, 2014 dated May 6, 2014, the AMC should maintain a Net Worth of minimum Rs.50 crs. The Net Worth of Sahara Asset Management Company Private Ltd. as on March 31, 2019 was Rs.5.02 crs, which is below the threshold limit of Rs.50 crs and thereby the net worth criteria as required by the above regulations has not been complied with.
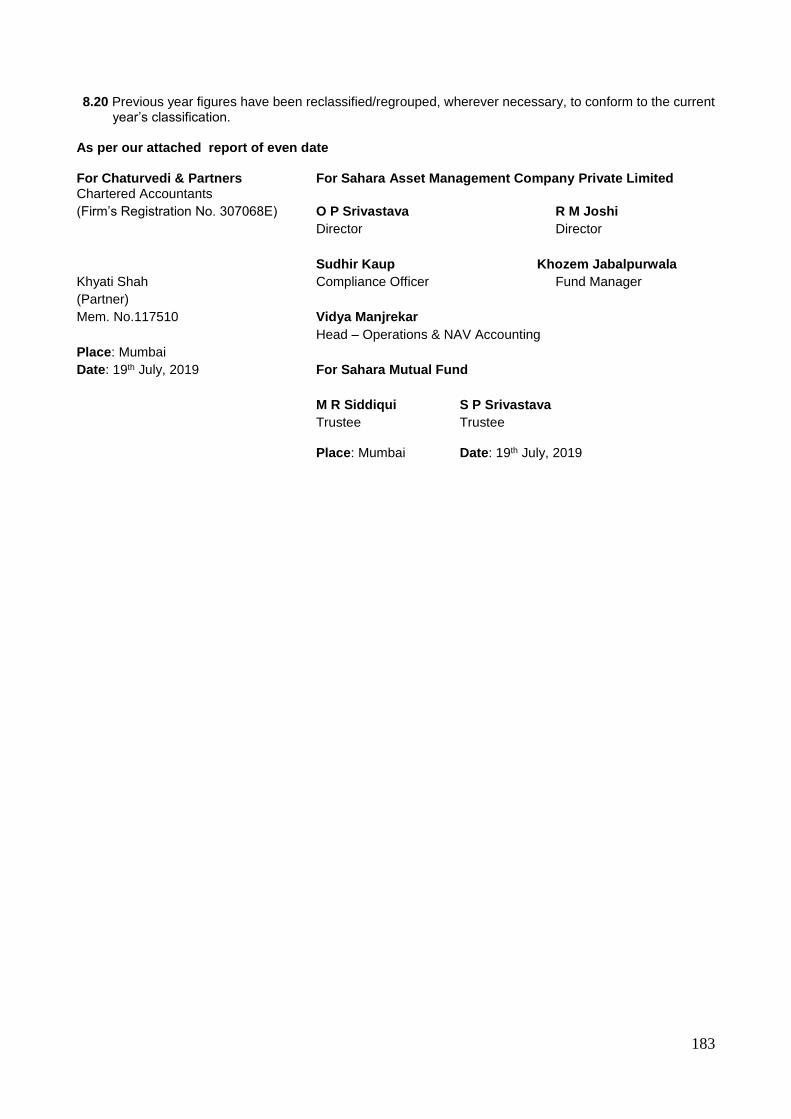
183
8.20 Previous year figures have been reclassified/regrouped, wherever necessary, to conform to the current year’s classification.
As per our attached report of even date
For Chaturvedi & Partners For Sahara Asset Management Company Private Limited Chartered Accountants
(Firm’s Registration No. 307068E) O P Srivastava R M Joshi
Director Director
Sudhir Kaup Khozem Jabalpurwala
Khyati Shah Compliance Officer Fund Manager
(Partner)
Mem. No.117510 Vidya Manjrekar
Head – Operations & NAV Accounting
Place: Mumbai
Date: 19th July, 2019 For Sahara Mutual Fund
M R Siddiqui S P Srivastava
Trustee Trustee Place: Mumbai Date: 19th July, 2019
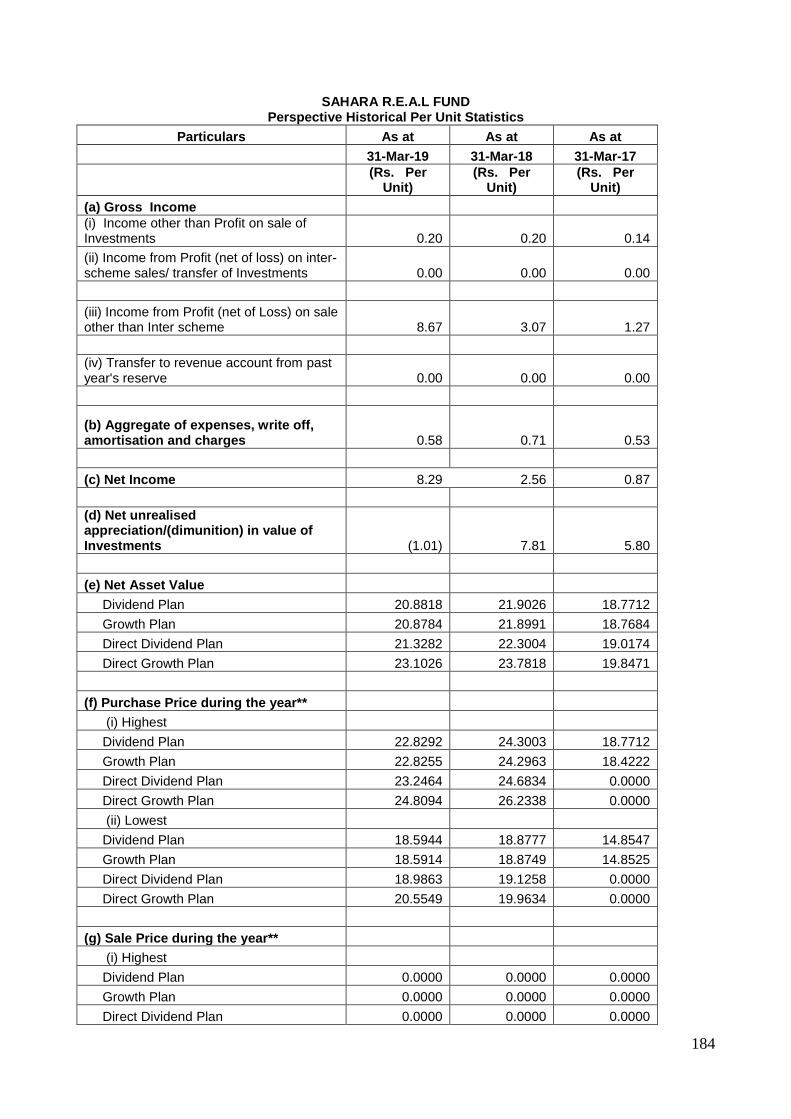
184
SAHARA R.E.A.L FUND Perspective Historical Per Unit Statistics
Particulars As at As at As at
31-Mar-19 31-Mar-18 31-Mar-17
(Rs. Per
Unit) (Rs. Per
Unit) (Rs. Per
Unit)
(a) Gross Income
(i) Income other than Profit on sale of Investments 0.20 0.20 0.14
(ii) Income from Profit (net of loss) on inter-scheme sales/ transfer of Investments 0.00 0.00 0.00
(iii) Income from Profit (net of Loss) on sale other than Inter scheme 8.67 3.07 1.27
(iv) Transfer to revenue account from past year's reserve 0.00 0.00 0.00
(b) Aggregate of expenses, write off, amortisation and charges 0.58 0.71 0.53
(c) Net Income 8.29 2.56 0.87
(d) Net unrealised appreciation/(dimunition) in value of Investments (1.01) 7.81 5.80
(e) Net Asset Value
Dividend Plan 20.8818 21.9026 18.7712
Growth Plan 20.8784 21.8991 18.7684
Direct Dividend Plan 21.3282 22.3004 19.0174
Direct Growth Plan 23.1026 23.7818 19.8471
(f) Purchase Price during the year**
(i) Highest
Dividend Plan 22.8292 24.3003 18.7712
Growth Plan 22.8255 24.2963 18.4222
Direct Dividend Plan 23.2464 24.6834 0.0000
Direct Growth Plan 24.8094 26.2338 0.0000
(ii) Lowest
Dividend Plan 18.5944 18.8777 14.8547
Growth Plan 18.5914 18.8749 14.8525
Direct Dividend Plan 18.9863 19.1258 0.0000
Direct Growth Plan 20.5549 19.9634 0.0000
(g) Sale Price during the year**
(i) Highest
Dividend Plan 0.0000 0.0000 0.0000
Growth Plan 0.0000 0.0000 0.0000
Direct Dividend Plan 0.0000 0.0000 0.0000
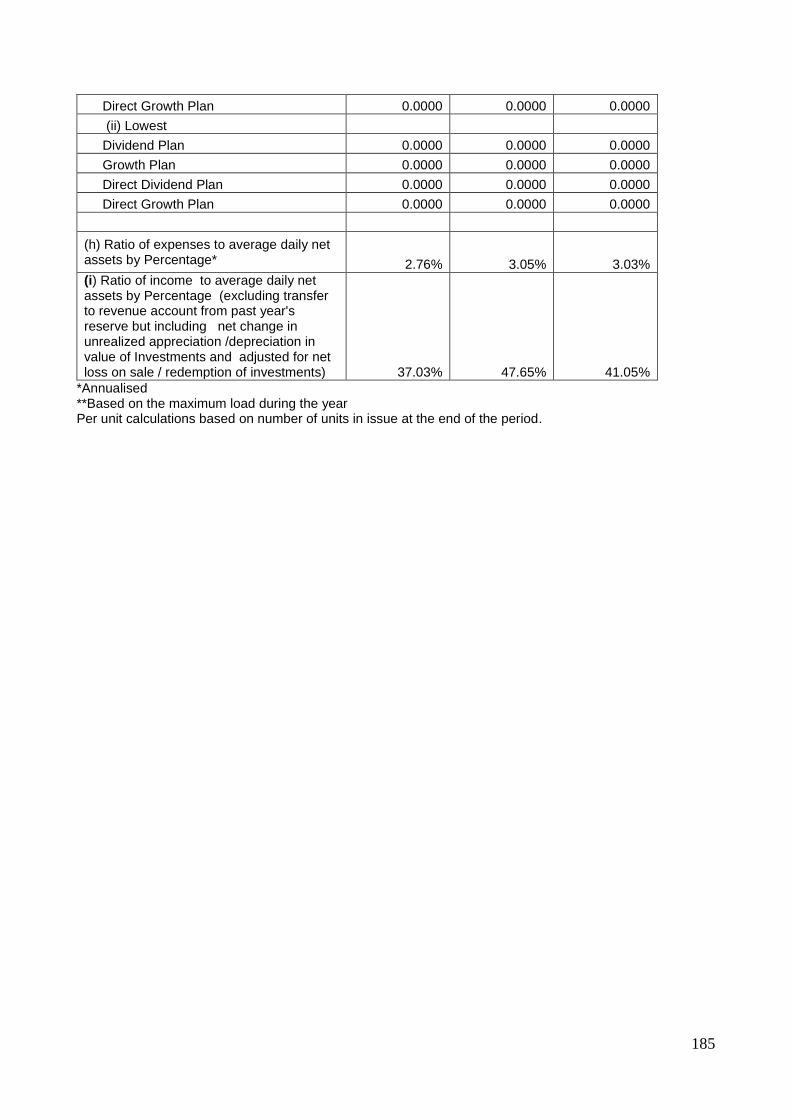
185
Direct Growth Plan 0.0000 0.0000 0.0000
(ii) Lowest
Dividend Plan 0.0000 0.0000 0.0000
Growth Plan 0.0000 0.0000 0.0000
Direct Dividend Plan 0.0000 0.0000 0.0000
Direct Growth Plan 0.0000 0.0000 0.0000
(h) Ratio of expenses to average daily net assets by Percentage* 2.76% 3.05% 3.03%
(i) Ratio of income to average daily net assets by Percentage (excluding transfer to revenue account from past year's reserve but including net change in unrealized appreciation /depreciation in value of Investments and adjusted for net loss on sale / redemption of investments) 37.03% 47.65% 41.05%
*Annualised **Based on the maximum load during the year Per unit calculations based on number of units in issue at the end of the period.
186
INDEPENDENT AUDITOR’S REPORT To the Trustees of Sahara Mutual Fund- Sahara Banking and Financial Services Fund Report on the Audit of the Financial Statements Opinion We have audited the accompanying financial statements of Sahara Mutual Fund – Sahara Banking and Financial Services Fund (“the Scheme”), which comprise the Balance Sheet as at March 31, 2019,the Revenue Account and the Cash Flow Statement for the year then ended, and noted to the financial statements, including a summary of significant accounting policies and other explanatory information. In our opinion and to the best of our information and according to the explanations given to us, the aforesaid financial statements of the scheme give the information specified in the Ninth Schedule to the Securities and Exchange Board of India (Mutual Funds) Regulations, 1996 and amendments thereto (“the SEBI Regulations”), as applicable, in the manner so required and give a true and fair view in conformity with the accounting principles generally accepted in India: (a) in the case of the Balance Sheet, of the state of affairs of the Scheme as at March 31, 2019; (b) in the case of the Revenue Account, of the surplus for the year ended on that date. (c) in the case of the Cash Flow Statement, of the cash flows for the year ended on that date. Basis for Opinion We conducted our audit of the financial statements in accordance with the Standards on Auditing (SA’s) issued by the Institute of Chartered Accountants of India (“ICAI). Our responsibilities under those Standards are further described in the Auditor’s Responsibilities for the Audit of the Financial Statements section of our report. We are independent of the Trust/Scheme in accordance with the Code of Ethics issued by the Institute of Chartered Accountants of India together with the independence requirements that are relevant to our audit of the financial statements of the Scheme. Our audit has been conducted in accordance with the accounting policies and standards specified in the SEBI Regulations and amendments thereto, as applicable and we have fulfilled our other ethical responsibilities in accordance with these requirements and the Code of Ethics. We believe that the audit evidence we have obtained is sufficient and appropriate to provide a basis for our opinion. Emphasis of Matter We draw attention to the following matter in the Notes to the financial statements:
a) Note no. 8.17 which states, inter alia, that Sahara Mutual Fund had requested SEBI in January 2018 to extend the date of cancellation of ‘Certificate of registration’ till 27th July, 2018 considering the lock in period of certain unit holders’ investments in Sahara Tax gain fund as well as for giving time for identification of a new sponsor. However, SEBI ordered for winding up of all schemes against which Sahara Mutual Fund appealed before SAT for a stay of SEBI order. In the meanwhile, a new sponsor was identified for Sahara Mutual Fund viz., One Life Capital Advisors Limited.
SAT vide its order dated 3rd May,2018 directed that SEBI shall not enforce the orders impugned in the appeals till a decision on new sponsor’s application is communicated. The above indicates the existence of a material uncertainty that may cast significant doubt about Sahara Mutual Fund’s ability to continue as a going concern. However, the financial statements of the Scheme have been prepared on a going concern basis, pending the decision of the SEBI on the sponsor.
b) Note no. 8.18 which states that minimum four Trustees are required as per Reg. 15(1) read with para 22
of the Third Schedule (Contents of Trust Deed) of SEBI (Mutual Funds) Regulations 1996, has not been complied with.
c) As per the Reg. 21(1)(f), of SEBI (Mutual Funds) Regulations, 1996 and in compliance with the notification of Securities and Exchange Board of India (Mutual Funds) (Amendment) Regulations, 2014 dated May 6, 2014, the AMC should have maintained a Net Worth of minimum Rs.50 crs. The Net Worth of SAMC as on March 31, 2019 was Rs.5.02 crs (refer Note 8.19); thereby net worth criteria has not been complied with.
Our opinion is not modified in respect of the above matter.
187
Responsibilities of the Management and Those Charged with Governance for the Financial Statements The Trustees of Sahara Mutual Fund and the Board of Directors of Sahara Asset Management Company Private Limited (the “Directors”) are responsible for the preparation of these financial statements that give a true and fair view of the financial position and financial performance of the Scheme in accordance with the accounting policies and standards specified in the SEBI Regulations and amendments thereto, as applicable. This responsibility also includes maintenance of adequate accounting records for safeguarding the assets of the Scheme and for preventing and detecting frauds and other irregularities; selection and application of appropriate accounting policies; making judgements and estimates that are reasonable and prudent; and design, implementation and maintenance of adequate internal financial controls, that were operating effectively for ensuring the accuracy and completeness of the accounting records, relevant to the preparation and presentation of the financial statements that give a true and fair view and are free from material misstatement, whether due to fraud or error. In preparing the financial statements, management is responsible for assessing the Scheme’s ability to continue as a going concern, disclosing , as applicable, matters related to going concern and using the going concern basis of accounting unless management either intends to liquidate the Scheme or to cease operations or has no realistic alternative but to do so. Those charged with Governance are also responsible for overseeing the Scheme’s financial reporting process. Auditor’s Responsibility for the Audit of the Financial Statements Our objectives are to obtain reasonable assurance about whether the standalone financial statements as a whole are free from material misstatement, whether due to fraud or error, and to issue an auditor’s report that includes our opinion. Reasonable assurance is a high level of assurance, but is not a guarantee that an audit conducted in accordance with SAs will always detect a material misstatement when it exists. Misstatements can arise from fraud or error and are considered material if ,individually or in the aggregate, they could reasonably be expected to influence the economic decisions of users taken on the basis of these standalone financial statements. As part of an audit in accordance with SAs, we exercise professional judgment and maintain professional skepticism throughout the audit. We also: • Identify and assess the risks of material misstatement of the standalone financial statements, whether due to fraud or error, design and perform audit procedures responsive to those risks, and obtain audit evidence that is sufficient and appropriate to provide a basis for our opinion. The risk of not detecting a material misstatement resulting from fraud is higher than for one resulting from error, as fraud may involve collusion, forgery, intentional omissions, misrepresentations, or the override of internal control. • Obtain an understanding of internal financial controls relevant to the audit in order to design audit procedures that are appropriate in the circumstances, but not for the purpose of expressing an opinion on effectiveness of the Company’s internal financial controls. • Evaluate the appropriateness of accounting policies used and the reasonableness of accounting estimates and related disclosures made by management. • Conclude on the appropriateness of management’s use of the going concern basis of accounting and, based on the audit evidence obtained, whether a material uncertainty exists related to events or conditions that may cast significant doubt on the ability of the Company to continue as a going concern. If we conclude that a material uncertainty exists, we are required to draw attention in our auditor’s report to the related disclosures in the standalone financial statements or, if such disclosures are inadequate, to modify our opinion. Our conclusions are based on the audit evidence obtained up to the date of our auditor’s report. However, future events or conditions may cause the Company to cease to continue as a going concern. • Evaluate the overall presentation, structure and content of the standalone financial statements, including the disclosures, and whether the standalone financial statements represent the underlying transactions and events in a manner that achieves fair presentation.

188
We communicate with those charged with governance regarding, among other matters, the planned scope and timing of the audit and significant audit findings, including any significant deficiencies in internal control that we identify during our audit. We also provide those charged with governance with a statement that we have complied with relevant ethical requirements regarding independence, and to communicate with them all relationships and other matters that may reasonably be thought to bear on our independence, and where applicable, related safeguards.
Report on Other Legal and Regulatory Requirements
As required by the Securities and Exchange Board of India (Mutual Funds) Regulations, 1996 and amendments thereto, as applicable, we report that: a) We have sought and obtained all the information and explanations, which to the best of our knowledge and belief were necessary for the purpose of our audit. b) The Balance Sheet and Revenue Account dealt with by this Report are in agreement with the books of account of the Scheme. c) The statement of account has been prepared in accordance with the accounting policies and standards specified in the SEBI Regulations and amendments thereto, as applicable. d) We have reviewed the Valuation Policy being followed for the schemes of Sahara Mutual Fund. The Valuation Policy implemented for the Scheme is in line with the SEBI guidelines issued in this regard.
For Chaturvedi & Partners. Chartered Accountants (Firm’s Registration No. 307068E) Khyati Shah (Partner) Mem. No. 117510 Place: Mumbai Date: July 19, 2019
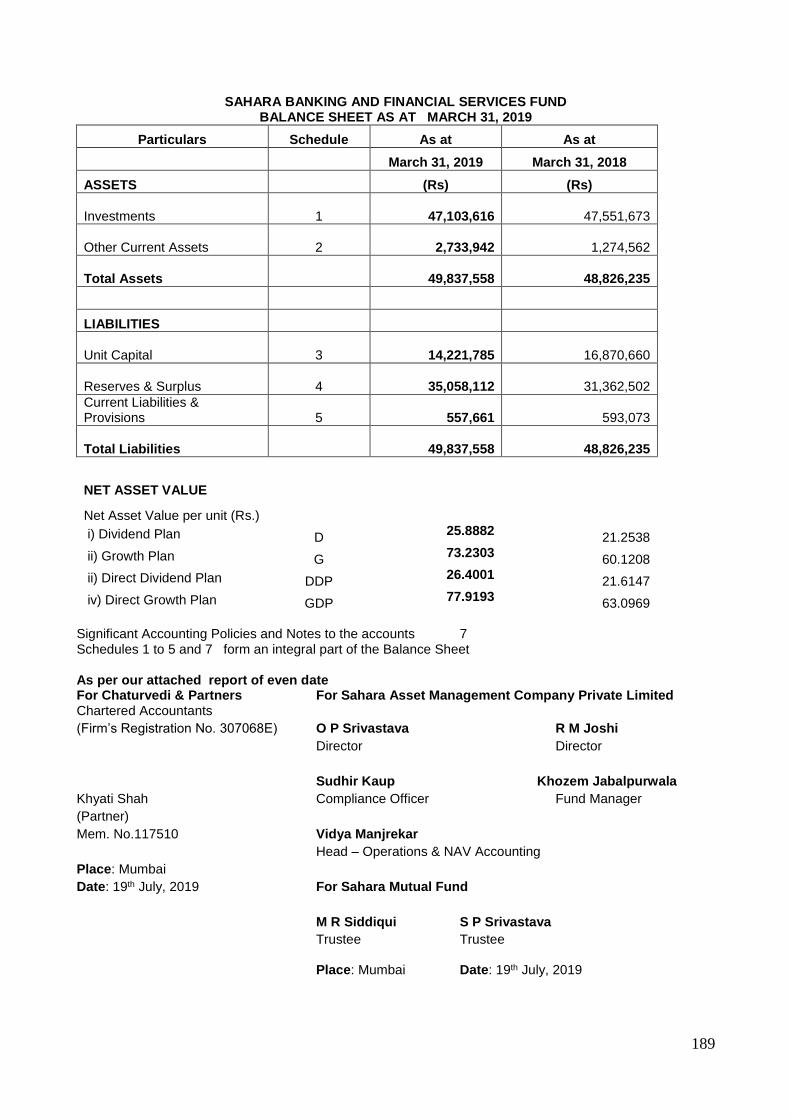
189
SAHARA BANKING AND FINANCIAL SERVICES FUND BALANCE SHEET AS AT MARCH 31, 2019
Particulars Schedule As at As at
March 31, 2019 March 31, 2018
ASSETS (Rs) (Rs)
Investments 1
47,103,616
47,551,673
Other Current Assets 2
2,733,942
1,274,562
Total Assets
49,837,558
48,826,235
LIABILITIES
Unit Capital 3
14,221,785
16,870,660
Reserves & Surplus 4
35,058,112
31,362,502
Current Liabilities & Provisions 5
557,661
593,073
Total Liabilities
49,837,558
48,826,235
NET ASSET VALUE
Net Asset Value per unit (Rs.)
i) Dividend Plan D 25.8882
21.2538
ii) Growth Plan G 73.2303
60.1208
ii) Direct Dividend Plan DDP 26.4001
21.6147
iv) Direct Growth Plan GDP 77.9193
63.0969 Significant Accounting Policies and Notes to the accounts 7 Schedules 1 to 5 and 7 form an integral part of the Balance Sheet
As per our attached report of even date For Chaturvedi & Partners For Sahara Asset Management Company Private Limited Chartered Accountants
(Firm’s Registration No. 307068E) O P Srivastava R M Joshi
Director Director
Sudhir Kaup Khozem Jabalpurwala
Khyati Shah Compliance Officer Fund Manager
(Partner)
Mem. No.117510 Vidya Manjrekar
Head – Operations & NAV Accounting
Place: Mumbai
Date: 19th July, 2019 For Sahara Mutual Fund
M R Siddiqui S P Srivastava
Trustee Trustee Place: Mumbai Date: 19th July, 2019
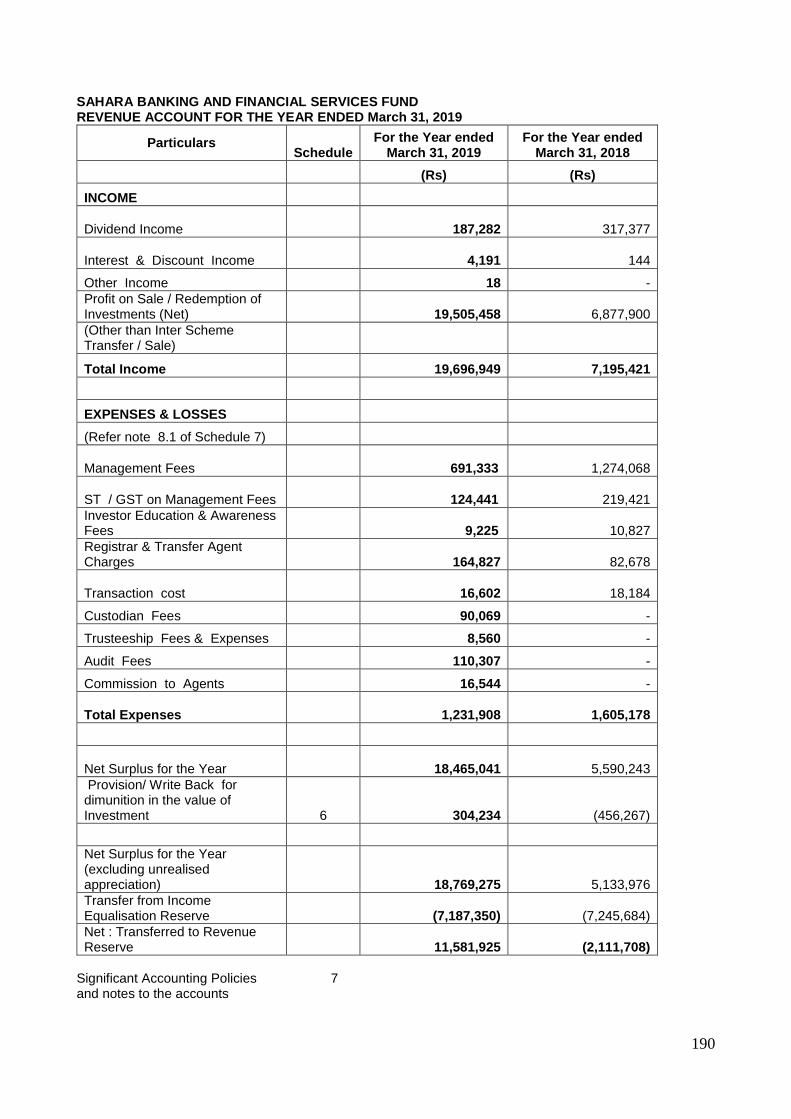
190
SAHARA BANKING AND FINANCIAL SERVICES FUND REVENUE ACCOUNT FOR THE YEAR ENDED March 31, 2019
Particulars Schedule
For the Year ended March 31, 2019
For the Year ended March 31, 2018
(Rs) (Rs)
INCOME
Dividend Income 187,282
317,377
Interest & Discount Income 4,191
144
Other Income 18 -
Profit on Sale / Redemption of Investments (Net) 19,505,458
6,877,900
(Other than Inter Scheme Transfer / Sale)
Total Income 19,696,949 7,195,421
EXPENSES & LOSSES
(Refer note 8.1 of Schedule 7)
Management Fees 691,333
1,274,068
ST / GST on Management Fees 124,441
219,421
Investor Education & Awareness Fees 9,225
10,827
Registrar & Transfer Agent Charges 164,827
82,678
Transaction cost 16,602
18,184
Custodian Fees 90,069 -
Trusteeship Fees & Expenses 8,560 -
Audit Fees 110,307 -
Commission to Agents 16,544 -
Total Expenses 1,231,908
1,605,178
Net Surplus for the Year 18,465,041
5,590,243
Provision/ Write Back for dimunition in the value of Investment 6 304,234
(456,267)
Net Surplus for the Year (excluding unrealised appreciation) 18,769,275
5,133,976
Transfer from Income Equalisation Reserve
(7,187,350)
(7,245,684)
Net : Transferred to Revenue Reserve 11,581,925
(2,111,708)
Significant Accounting Policies 7 and notes to the accounts
191
Schedules 6 to 7 form an integral part of the Revenue Account
As per our attached report of even date For Chaturvedi & Partners For Sahara Asset Management Company Private Limited Chartered Accountants
(Firm’s Registration No. 307068E) O P Srivastava R M Joshi
Director Director
Sudhir Kaup Khozem Jabalpurwala
Khyati Shah Compliance Officer Fund Manager
(Partner)
Mem. No.117510 Vidya Manjrekar
Head – Operations & NAV Accounting
Place: Mumbai
Date: 19th July, 2019 For Sahara Mutual Fund
M R Siddiqui S P Srivastava
Trustee Trustee Place: Mumbai Date: 19th July, 2019

192
SAHARA BANKING AND FINANCIAL SERVICES FUND SCHEDULES FORMING PART OF THE BALANCE SHEET
As at As at
March 31, 2019 March 31,
2018
Particulars (Rs) (Rs)
SCHEDULE 1
Investments
(Refer Note 8.13 of Schedule 7 for detailed Portfolio statement)
Equity Shares
47,103,616
47,551,673
47,103,616
47,551,673
SCHEDULE 2
Other Current Assets
Balances with Banks in Current accounts
2,426,177
962,823
Investment - Liquid MF Units
284,383
288,357
Investment - Liquid MF Units - Investor Education
23,382
23,382
2,733,942
1,274,562
SCHEDULE 3
Unit Capital
Dividend Option 1010007.170 units of Rs.10 each D
10,100,072
12,192,701
(For 2017-2018 - 1219270.080 units of Rs.10 each)
Growth Option 215051.378 units of Rs.10 each G
2,150,514
2,588,821
(For 2017-2018 -258882.084 units of Rs.10 each)
Direct Dividend Option 154667.157 units of Rs.10 each DDP
1,546,672
1,546,672
(For 2017-2018 - 154667.157 units of Rs.10 each)
Direct Growth Option 42452.704 units of Rs.10 each GDP
424,527
542,466
(For 2017-2018 -54246.582 units of Rs.10 each)
Total 14,221,785
16,870,660
(Refer Note 8.9 of Schedule 7)
SCHEDULE 4
Reserves and Surplus
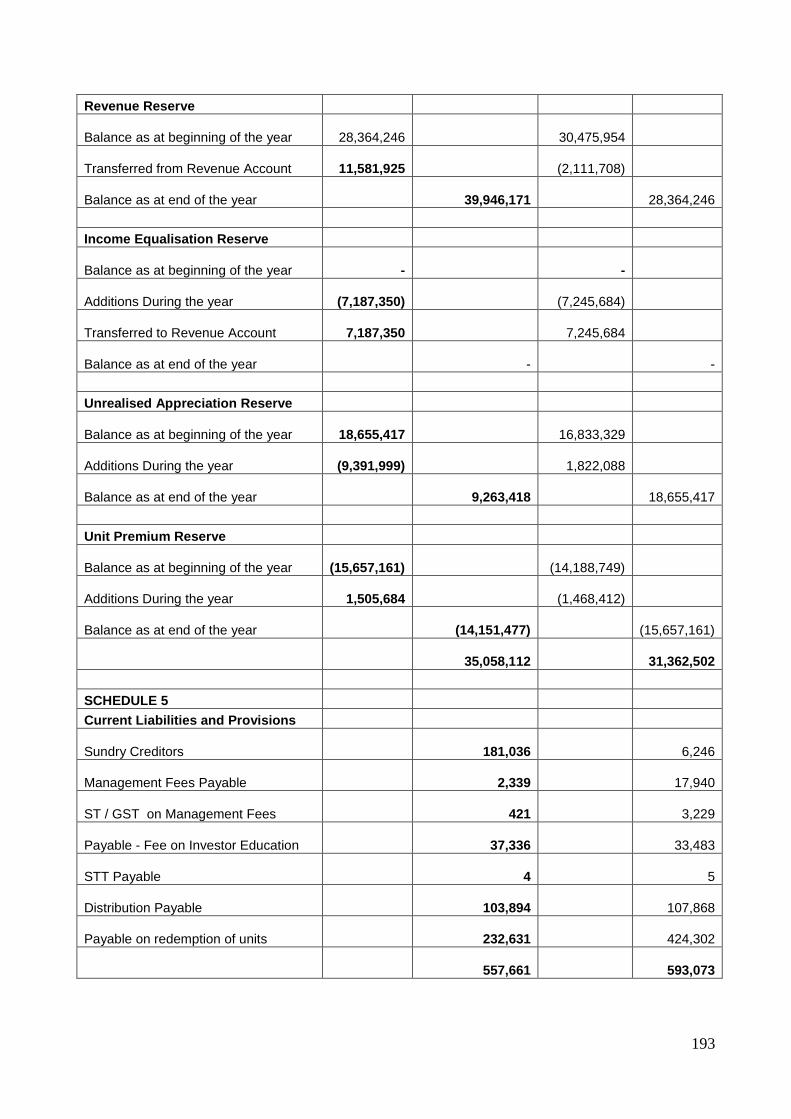
193
Revenue Reserve
Balance as at beginning of the year
28,364,246
30,475,954
Transferred from Revenue Account
11,581,925
(2,111,708)
Balance as at end of the year
39,946,171
28,364,246
Income Equalisation Reserve
Balance as at beginning of the year
- -
Additions During the year
(7,187,350)
(7,245,684)
Transferred to Revenue Account
7,187,350
7,245,684
Balance as at end of the year
-
-
Unrealised Appreciation Reserve
Balance as at beginning of the year
18,655,417
16,833,329
Additions During the year
(9,391,999)
1,822,088
Balance as at end of the year
9,263,418
18,655,417
Unit Premium Reserve
Balance as at beginning of the year
(15,657,161)
(14,188,749)
Additions During the year
1,505,684
(1,468,412)
Balance as at end of the year
(14,151,477)
(15,657,161)
35,058,112
31,362,502
SCHEDULE 5
Current Liabilities and Provisions
Sundry Creditors
181,036
6,246
Management Fees Payable
2,339
17,940
ST / GST on Management Fees
421
3,229
Payable - Fee on Investor Education
37,336
33,483
STT Payable
4
5
Distribution Payable
103,894
107,868
Payable on redemption of units
232,631
424,302
557,661
593,073

194
SAHARA BANKING AND FINANCIAL SERVICES FUND SCHEDULES FORMING PART OF THE REVENUE ACCOUNT
For the year
ended For the
year ended
March 31, 2019 March 31,
2018
Particulars (Rs) (Rs)
SCHEDULE 6
Provision/ Write Back for diminution in the value of Investment
At the beginning of the year
(456,267) -
At the end of the year
(152,033)
(456,267)
304,234
(456,267)
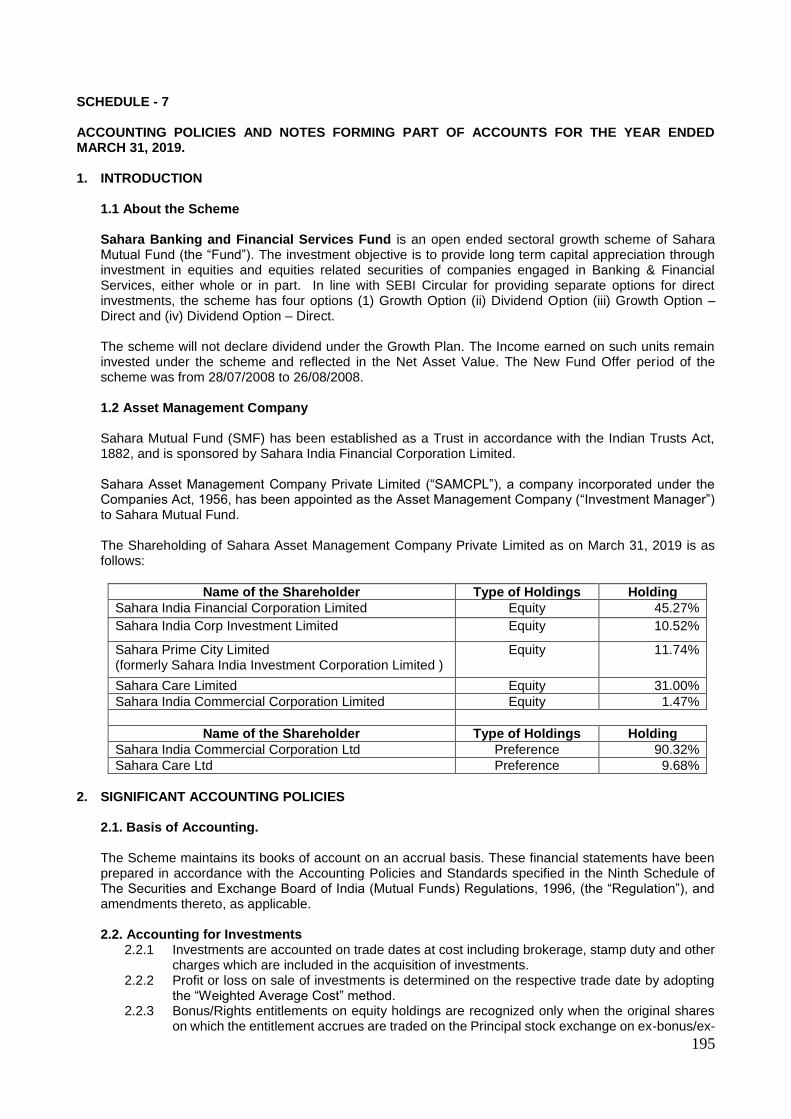
195
SCHEDULE - 7 ACCOUNTING POLICIES AND NOTES FORMING PART OF ACCOUNTS FOR THE YEAR ENDED MARCH 31, 2019. 1. INTRODUCTION
1.1 About the Scheme
Sahara Banking and Financial Services Fund is an open ended sectoral growth scheme of Sahara Mutual Fund (the “Fund”). The investment objective is to provide long term capital appreciation through investment in equities and equities related securities of companies engaged in Banking & Financial Services, either whole or in part. In line with SEBI Circular for providing separate options for direct investments, the scheme has four options (1) Growth Option (ii) Dividend Option (iii) Growth Option – Direct and (iv) Dividend Option – Direct. The scheme will not declare dividend under the Growth Plan. The Income earned on such units remain invested under the scheme and reflected in the Net Asset Value. The New Fund Offer period of the scheme was from 28/07/2008 to 26/08/2008. 1.2 Asset Management Company
Sahara Mutual Fund (SMF) has been established as a Trust in accordance with the Indian Trusts Act, 1882, and is sponsored by Sahara India Financial Corporation Limited.
Sahara Asset Management Company Private Limited (“SAMCPL”), a company incorporated under the Companies Act, 1956, has been appointed as the Asset Management Company (“Investment Manager”) to Sahara Mutual Fund.
The Shareholding of Sahara Asset Management Company Private Limited as on March 31, 2019 is as follows:
Name of the Shareholder Type of Holdings Holding
Sahara India Financial Corporation Limited Equity 45.27%
Sahara India Corp Investment Limited Equity 10.52%
Sahara Prime City Limited (formerly Sahara India Investment Corporation Limited )
Equity 11.74%
Sahara Care Limited Equity 31.00%
Sahara India Commercial Corporation Limited Equity 1.47%
Name of the Shareholder Type of Holdings Holding
Sahara India Commercial Corporation Ltd Preference 90.32%
Sahara Care Ltd Preference 9.68%
2. SIGNIFICANT ACCOUNTING POLICIES
2.1. Basis of Accounting. The Scheme maintains its books of account on an accrual basis. These financial statements have been prepared in accordance with the Accounting Policies and Standards specified in the Ninth Schedule of The Securities and Exchange Board of India (Mutual Funds) Regulations, 1996, (the “Regulation”), and amendments thereto, as applicable. 2.2. Accounting for Investments
2.2.1 Investments are accounted on trade dates at cost including brokerage, stamp duty and other charges which are included in the acquisition of investments.
2.2.2 Profit or loss on sale of investments is determined on the respective trade date by adopting the “Weighted Average Cost” method.
2.2.3 Bonus/Rights entitlements on equity holdings are recognized only when the original shares on which the entitlement accrues are traded on the Principal stock exchange on ex-bonus/ex-
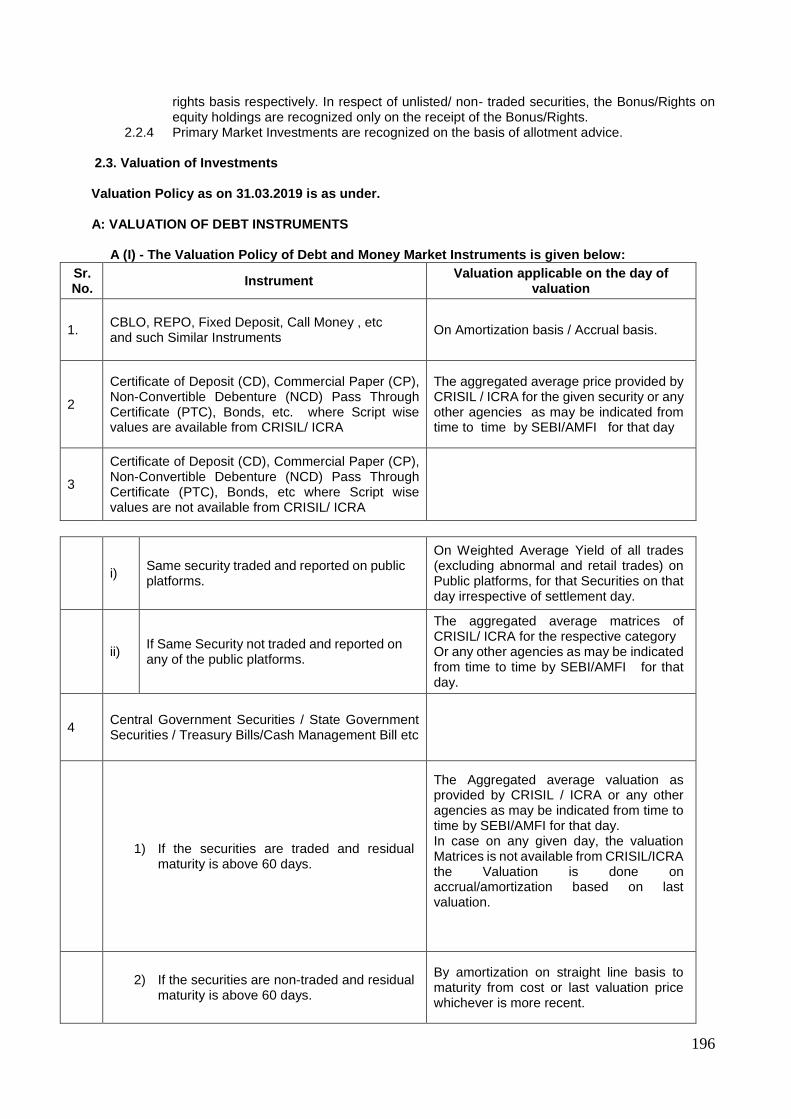
196
rights basis respectively. In respect of unlisted/ non- traded securities, the Bonus/Rights on equity holdings are recognized only on the receipt of the Bonus/Rights.
2.2.4 Primary Market Investments are recognized on the basis of allotment advice. 2.3. Valuation of Investments
Valuation Policy as on 31.03.2019 is as under. A: VALUATION OF DEBT INSTRUMENTS
A (I) - The Valuation Policy of Debt and Money Market Instruments is given below:
Sr. No.
Instrument Valuation applicable on the day of
valuation
1.
CBLO, REPO, Fixed Deposit, Call Money , etc and such Similar Instruments
On Amortization basis / Accrual basis.
2
Certificate of Deposit (CD), Commercial Paper (CP), Non-Convertible Debenture (NCD) Pass Through Certificate (PTC), Bonds, etc. where Script wise values are available from CRISIL/ ICRA
The aggregated average price provided by CRISIL / ICRA for the given security or any other agencies as may be indicated from time to time by SEBI/AMFI for that day
3
Certificate of Deposit (CD), Commercial Paper (CP), Non-Convertible Debenture (NCD) Pass Through Certificate (PTC), Bonds, etc where Script wise values are not available from CRISIL/ ICRA
i) Same security traded and reported on public platforms.
On Weighted Average Yield of all trades (excluding abnormal and retail trades) on Public platforms, for that Securities on that day irrespective of settlement day.
ii) If Same Security not traded and reported on any of the public platforms.
The aggregated average matrices of CRISIL/ ICRA for the respective category Or any other agencies as may be indicated from time to time by SEBI/AMFI for that day.
4 Central Government Securities / State Government Securities / Treasury Bills/Cash Management Bill etc
1) If the securities are traded and residual
maturity is above 60 days.
The Aggregated average valuation as provided by CRISIL / ICRA or any other agencies as may be indicated from time to time by SEBI/AMFI for that day. In case on any given day, the valuation Matrices is not available from CRISIL/ICRA the Valuation is done on accrual/amortization based on last valuation.
2) If the securities are non-traded and residual
maturity is above 60 days.
By amortization on straight line basis to maturity from cost or last valuation price whichever is more recent.
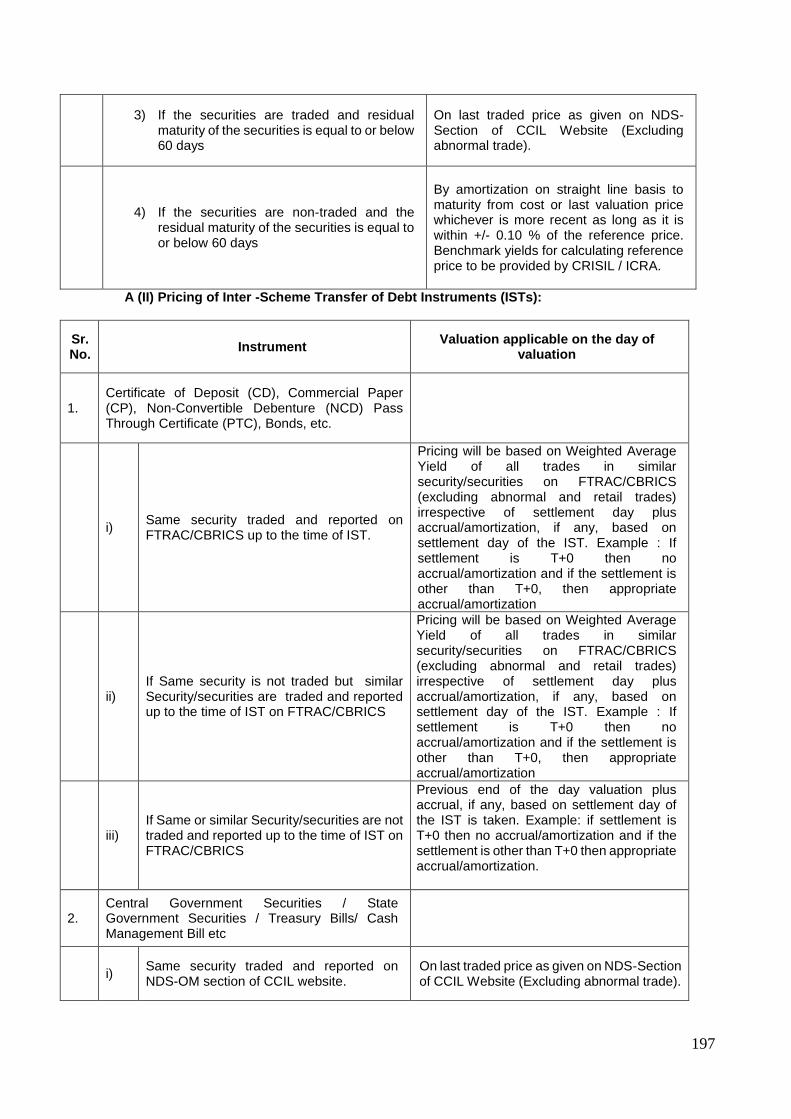
197
A (II) Pricing of Inter -Scheme Transfer of Debt Instruments (ISTs):
Sr. No.
Instrument Valuation applicable on the day of
valuation
1. Certificate of Deposit (CD), Commercial Paper (CP), Non-Convertible Debenture (NCD) Pass Through Certificate (PTC), Bonds, etc.
i) Same security traded and reported on FTRAC/CBRICS up to the time of IST.
Pricing will be based on Weighted Average Yield of all trades in similar security/securities on FTRAC/CBRICS (excluding abnormal and retail trades) irrespective of settlement day plus accrual/amortization, if any, based on settlement day of the IST. Example : If settlement is T+0 then no accrual/amortization and if the settlement is other than T+0, then appropriate accrual/amortization
ii) If Same security is not traded but similar Security/securities are traded and reported up to the time of IST on FTRAC/CBRICS
Pricing will be based on Weighted Average Yield of all trades in similar security/securities on FTRAC/CBRICS (excluding abnormal and retail trades) irrespective of settlement day plus accrual/amortization, if any, based on settlement day of the IST. Example : If settlement is T+0 then no accrual/amortization and if the settlement is other than T+0, then appropriate accrual/amortization
iii) If Same or similar Security/securities are not traded and reported up to the time of IST on FTRAC/CBRICS
Previous end of the day valuation plus accrual, if any, based on settlement day of the IST is taken. Example: if settlement is T+0 then no accrual/amortization and if the settlement is other than T+0 then appropriate accrual/amortization.
2. Central Government Securities / State Government Securities / Treasury Bills/ Cash Management Bill etc
i) Same security traded and reported on NDS-OM section of CCIL website.
On last traded price as given on NDS-Section of CCIL Website (Excluding abnormal trade).
3) If the securities are traded and residual
maturity of the securities is equal to or below 60 days
On last traded price as given on NDS-Section of CCIL Website (Excluding abnormal trade).
4) If the securities are non-traded and the
residual maturity of the securities is equal to or below 60 days
By amortization on straight line basis to maturity from cost or last valuation price whichever is more recent as long as it is within +/- 0.10 % of the reference price. Benchmark yields for calculating reference price to be provided by CRISIL / ICRA.
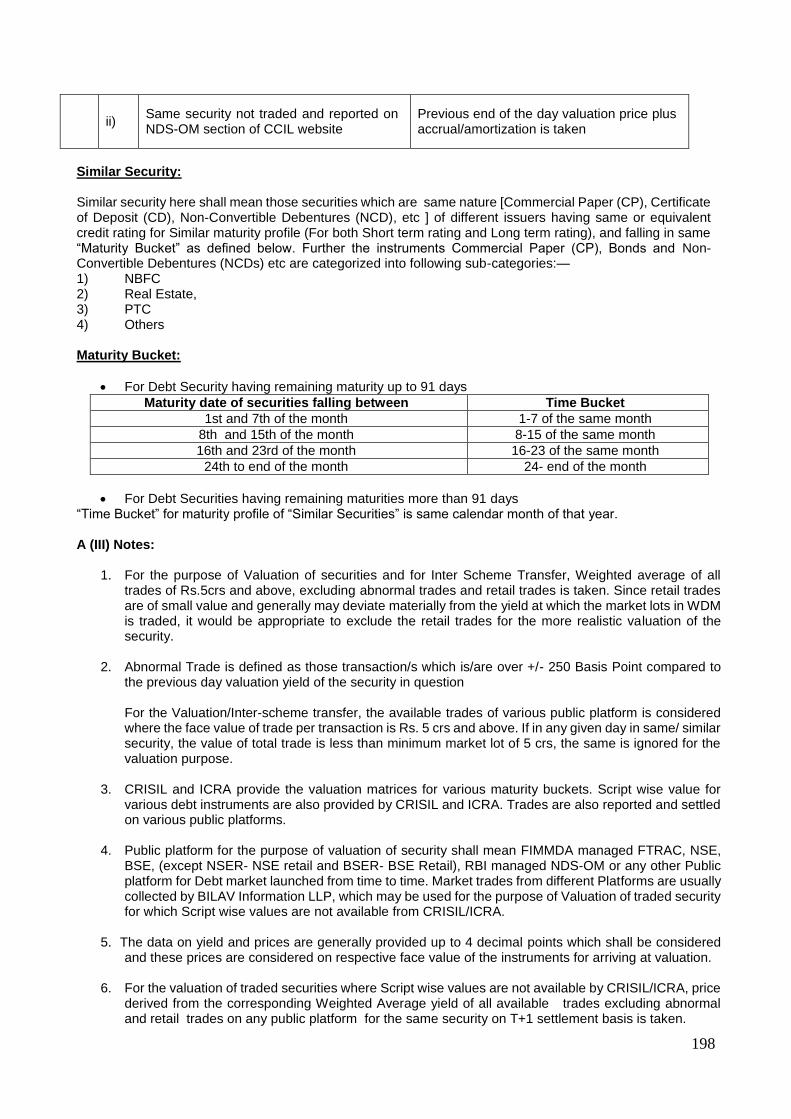
198
ii) Same security not traded and reported on NDS-OM section of CCIL website
Previous end of the day valuation price plus accrual/amortization is taken
Similar Security: Similar security here shall mean those securities which are same nature [Commercial Paper (CP), Certificate of Deposit (CD), Non-Convertible Debentures (NCD), etc ] of different issuers having same or equivalent credit rating for Similar maturity profile (For both Short term rating and Long term rating), and falling in same “Maturity Bucket” as defined below. Further the instruments Commercial Paper (CP), Bonds and Non-Convertible Debentures (NCDs) etc are categorized into following sub-categories:— 1) NBFC 2) Real Estate, 3) PTC 4) Others Maturity Bucket:
For Debt Security having remaining maturity up to 91 days
Maturity date of securities falling between Time Bucket
1st and 7th of the month 1-7 of the same month
8th and 15th of the month 8-15 of the same month
16th and 23rd of the month 16-23 of the same month
24th to end of the month 24- end of the month
For Debt Securities having remaining maturities more than 91 days “Time Bucket” for maturity profile of “Similar Securities” is same calendar month of that year. A (III) Notes:
1. For the purpose of Valuation of securities and for Inter Scheme Transfer, Weighted average of all trades of Rs.5crs and above, excluding abnormal trades and retail trades is taken. Since retail trades are of small value and generally may deviate materially from the yield at which the market lots in WDM is traded, it would be appropriate to exclude the retail trades for the more realistic valuation of the security.
2. Abnormal Trade is defined as those transaction/s which is/are over +/- 250 Basis Point compared to the previous day valuation yield of the security in question For the Valuation/Inter-scheme transfer, the available trades of various public platform is considered where the face value of trade per transaction is Rs. 5 crs and above. If in any given day in same/ similar security, the value of total trade is less than minimum market lot of 5 crs, the same is ignored for the valuation purpose.
3. CRISIL and ICRA provide the valuation matrices for various maturity buckets. Script wise value for various debt instruments are also provided by CRISIL and ICRA. Trades are also reported and settled on various public platforms.
4. Public platform for the purpose of valuation of security shall mean FIMMDA managed FTRAC, NSE, BSE, (except NSER- NSE retail and BSER- BSE Retail), RBI managed NDS-OM or any other Public platform for Debt market launched from time to time. Market trades from different Platforms are usually collected by BILAV Information LLP, which may be used for the purpose of Valuation of traded security for which Script wise values are not available from CRISIL/ICRA.
5. The data on yield and prices are generally provided up to 4 decimal points which shall be considered and these prices are considered on respective face value of the instruments for arriving at valuation.
6. For the valuation of traded securities where Script wise values are not available by CRISIL/ICRA, price derived from the corresponding Weighted Average yield of all available trades excluding abnormal and retail trades on any public platform for the same security on T+1 settlement basis is taken.
199
In case, the Bilav file is not received by 7:30 pm and script wise values are not available then FIMMDA managed FTRAC platform and NDS OM section of CCIL website may be used for the calculation of weighted average yield of traded security.
7. For non traded securities where Script wise values are not available, the valuation is done on the price derived from the corresponding the aggregated yield matrices for the respective category as provided by CRISIL/ICRA on T+1 settlement basis.
8. For Government Securities, SDL, T-Bills, Cash Management Bill etc, the valuation is done on
aggregated Script wise pricing as provided by CRISL/ICRA and as applicable for that day. In the absence of Script wise values the valuation is based on aggregated matrices if available from CRISIL/ICRA on T+1 settlement and as applicable for that day.
9. In case the valuation matrices/Script wise value is available either from CRISIL/ICRA up to a
reasonable time limit, the same is considered for arriving at valuation.
10. In respect of on any day neither the Script wise value nor the valuation Matrices is available from CRISIL/ICRA within the reasonable time limit, the Valuation is done on the basis of accrual/amortization based on the last valuation.
B: VALUATION OF EQUITY INSTRUMENTS
1. Traded Equity Securities When an equity security is not traded on any Stock Exchange on a particular valuation day, the value at which it was traded on the selected Stock Exchange, as the case may be, on the earliest previous day is used provided such date is not more than thirty days prior to valuation date. 2. Thinly Traded Equity / Equity Related Securities
(a) When trading in an equity and/or equity related securities (such as convertible debentures, equity warrants etc.) in a month is both less than Rs.5lacs in value and the total volume is less than 50,000 shares, the security is considered as thinly traded security.
(b) In order to determine whether a security is thinly traded or not, the volumes traded in all recognized Stock Exchanges in India would be taken into account.
(c) Where a Stock Exchange identifies the thinly traded securities by applying the above parameters for
the preceding calendar month and publishes or provides the required information along with the daily quotations, the same would be used for valuation.
(d) If the shares are not listed on the Stock Exchanges which provide such information, then we would make our own analysis in line with the above criteria to check whether such securities are thinly traded or not.
3. Non-traded / Suspended Securities When an equity security is not traded on any Stock Exchange for a period of thirty days prior to the valuation date, the Script would be treated as a non traded security. When an equity security is suspended up to thirty days, then the last traded price is considered for valuation of that security. If an equity security is suspended for more than thirty days, then the AMC or Trustees would decide the valuation norms to be followed and such norms would be documented and recorded. The valuation methodology for thinly traded equity securities, Non-traded equity securities would be as follows: Based on the latest available Balance Sheet, net worth would be calculated as follows:
(a) Net Worth per share = [share capital+ reserves (excluding revaluation reserves) – Misc. expenditure and Debit Balance in P&L A/c] Divided by No. of Paid up Shares.
200
(b) Average capitalization rate (P/E ratio) for the industry based upon NSE prices or BSE prices and discounted by 75% i.e. only 25% of the Industry average P/E would be taken as capitalization rate (P/E ratio). Earnings per Share (EPS) of the latest audited annual accounts would be considered for this purpose.
(c) The value as per the net worth value per share and the capital earning value calculated as above
would be averaged and further discounted by 10% for illiquidity so as to arrive at the fair value per share.
(d) In case the EPS is negative, EPS value for that year would be taken as zero for arriving at capitalized
earning.
(e) In case, where the latest Balance Sheet of the company is not available within nine months from the close of the year, unless the accounting year is changed, the shares of such companies would be valued at zero.
(f) In case, an individual security accounts for more than 5% of the total assets of the scheme, an
Independent Valuer would be appointed for the valuation of the said security. To determine if a security accounts for more than 5 per cent of the total assets of the scheme, it would be valued by the procedure above and the proportion which it bears to the total net assets of the scheme to which it belongs will be compared on the date of valuation.
4. Unlisted Equity Methodology for Valuation - unlisted equity shares of a company would be valued "in good faith" as below:
a) Based on the latest available Balance Sheet, net worth would be calculated as follows:
1. Net Worth per share = [share capital+ reserves (excluding revaluation reserves) – Misc. expenditure and Debit Balance in P&L A/c] Divided by No. of Paid up Shares.
2. After taking into account the outstanding warrants and options, Net Worth per share would again be calculated and is = [Share Capital + consideration on exercise of Option and/or Warrants received/receivable by the Company + Free Reserves (excluding Revaluation Reserves) – Miscellaneous expenditure not written off or deferred revenue expenditure, intangible assets and accumulated losses] / Number of Paid up Shares plus Number of Shares that would be obtained on conversion and/or exercise of Outstanding Warrants and Options.
3. The lower of (1) and (2) above would be used for calculation of Net Worth per share and for further
calculation in (c) below.
b) Average capitalization rate (P/E ratio) for the industry based upon NSE prices or BSE prices and discounted by 75% i.e. only 25% of the Industry average P/E would be taken as capitalization rate (P/E ratio). Earnings per Share (EPS) of the latest audited annual accounts would be considered for this purpose.
c) The value as per the net worth value per share and the capital earning value calculated as above would be averaged and further discounted by 15% for illiquidity so as to arrive at the fair value per share.
The above valuation methodology would be subject to the following conditions:
a) All calculations would be based on audited accounts.
b) If the latest Balance Sheet of the company is not available within nine months from the close of the year, unless the accounting year is changed, the shares of such companies would be valued at zero.
c) If the Net Worth of the company is negative, the share would be marked down to zero.
d) In case the EPS is negative, EPS value for that year would be taken as zero for arriving at capitalized
earning.
201
e) In case an individual security accounts for more than 5 per cent of the total assets of the scheme, an
Independent Valuer would be appointed for the valuation of the said security. To determine if a security accounts for more than 5 per cent of the total assets of the scheme, it is valued in accordance with the procedure as mentioned above on the date of valuation.
5. Demerger Generally on demerger, a listed security gets bifurcated into two or more shares. The valuation of these de-merged companies would depend on the following scenarios:
a) Both the shares are traded immediately on de-merger: In this case both the shares would be valued at respective traded prices.
b) Shares of only one company continued to be traded on de-merger: Traded shares would be valued
at traded price and the other security would to be valued at traded value on the day before the de merger less value of the traded security post de merger. In case value of the share of de-merged company is equal or in excess of the value of the pre de-merger share, then the non traded share would be valued at zero, till the date it is listed.
c) Both the shares are not traded on de-merger: Shares of de-merged companies would be valued equal
to the pre de merger value up to a period of 30 days from the date of de merger till the date it is listed. The market price of the shares of the de-merged company one day prior to ex-date would be bifurcated over the de-merged shares. The market value of the shares would be bifurcated on a fair value basis, based on available information on the de-merger scheme.
d) In case shares of either of the companies are not traded for more than 30 days: Then it would be
treated as unlisted security, and valued accordingly till the date these are listed. 6. Preference Shares
Preference Shares valuation guidelines would be as follows:
a) Traded preference shares would be valued as per traded prices. b) Non traded Preference Shares
(I). Redeemable Preference Shares
i. Convertible preference share would be valued like convertible debentures. In general in respect of convertible debentures and bonds, the non-convertible and convertible components would be valued separately. The non-convertible component would be valued on the same basis as would be applicable to a debt instrument. The convertible component would be valued on the same basis as would be applicable to an equity instrument.
If a convertible preference share does not pay dividend then it would be treated like non convertible debentures.
ii. Non-Convertible preference share would be valued like a debt instrument.
(II). Irredeemable preference shares would be valued on perpetual basis. It is like a constant dividend equity share.
7. Warrants
a) In respect of warrants to subscribe for shares attached to instruments, the warrants would be valued at the value of the share which would be obtained on exercise of the warrants as reduced by the amount which would be payable on exercise of the warrant. A discount similar to the discount to be determined in respect on convertible debentures is deducted to account for the period, which must elapse before the warrant can be exercised.
202
b) In case the warrants are traded separately they would be valued as per the valuation guidelines applicable to Equity Shares.
8. Rights Until they are traded, the value of "rights" shares would be calculated as:
Vr = n ÷ m x (Pex - Pof) Where Vr = Value of rights n = no. of rights offered m = no. of original shares held Pex = Ex-rights price Pof = Rights Offer Price
Where the rights are not treated pari passu with the existing shares, suitable adjustment would be made to the value of rights. Where it is decided not to subscribe for the rights but to renounce them and renunciations are being traded, the rights would be valued at the renunciation value. 9. Derivatives Market values of traded open futures and option contracts would be determined with respect to the exchange on which contracted originally, i.e., a future or an option contracted on the National Stock Exchange (NSE) would be valued at the closing price on the NSE. The price of the same futures and option contract on the Bombay Stock Exchange (BSE) cannot be considered for the purpose of valuation, unless the futures or option itself has been contracted on the BSE. The same will be valued at closing price if the contract is traded on the valuation day. In case there is no trade on valuation day then the same would be valued at Settlement prices. However, the contracts which are going to expire on valuation date would be valued at Settlement prices only. 10. Mutual Fund Units a) In case of traded Mutual Fund schemes, the units would be valued at closing price on the stock
exchange on which they are traded like equity instruments. In case the units are not traded for more than 7 days, last declared Repurchase Price (the price at which Mutual Fund schemes buys its units back) would be considered for valuation.
b) If the last available Repurchase price is older than 7 days, the valuation will be done at the last available NAV reduced by illiquidity discount. The illiquidity discount will be 10% of NAV or as decided by the Valuation Committee.
c) In case of non-traded Mutual Fund scheme, the last declared Repurchase Price (the price at which
Mutual Fund schemes buys its units back) would be considered for valuation. d) In case of Investments made by a scheme into the other scheme of Sahara Mutual Fund, if valuation
date being the last day of the financial year falling on a non-business day, then the computed NAV would be considered for valuation on March 31.
Related matters i) In case the income accrued on debt instruments is not received even after 90 days past the due date, the
asset is termed as Non Performing Assets (NPAs) and all provisions/guidelines with respect to income accrual, provisioning etc as contained in SEBI circulars/guidelines issued from time to time shall apply and the valuation of such securities will be done accordingly. In case the company starts servicing the debt, re-schedulement is allowed, the applicable provision in SEBI circulars shall apply for provisioning and reclassification of the asset
ii) In case of any other instruments not covered in the policy above, the same is referred to the Investment and
Valuation Committee which is empowered to take decision.
iii) In case of any perceived conflict of interest while valuating the securities, the matter is dealt and decided by Investment and Valuation Committee.
203
iv) For non– business day the valuation is done on aggregated Script wise prices as provided by CRISIL/ICRA.
In absence of Script wise prices the valuation is done on accrual basis/amortization basis based on last valuation
v) In case of exceptional circumstances like, policy announcements by government/regulatory bodies, natural
disasters, public disturbances, extreme volatility in capital market, shut down of market, war etc and on those days if Script wise value or valuation matrices are not available from CRISIL/ICRA and if security is not traded, the valuation for the day is done based on last valuation plus accrual/amortization or as may decided by the Investment and Valuation Committee.
vi) The Valuation Policy is reviewed by the Statutory Auditor at least once in a financial year.
vii) Valuation Policy as updated and approved by the Board of AMC / Board of Trustees is applicable for the
schemes of Sahara Mutual Fund.
2.3.1 Valuation of securities not covered under the above valuation policy:
The total exposure in securities, which do not fall under above valuation norms, shall not exceed 5% of the total AUM of the scheme.
In case of any other instruments not covered in the policy above, the same shall be referred to the Investment and Valuation Committee which is empowered to take decision. Investment in such securities is to be valued by a method approved by the Investment and Valuation Committee and the same will be reported to the Board of Trustees.
2.3.2 Unrealised Appreciation/Depreciation. In accordance with the Guidance Note on Accounting for Investments in the Financial Statements of Mutual Funds issued by the Institute of Chartered Accountants of India, the unrealized appreciation determined separately for each individual investment is directly transferred to the “Unrealized Appreciation Reserve Account” i.e. without routing it through the revenue account.
The provision for depreciation in value of investments determined separately for each individual investment is recognized in the revenue account. The loss (realized) on investments sold / transferred during the year is charged to revenue account, instead of being first adjusted against the provision for depreciation, if already created in the prior year, as recommended by the said Guidance Note. However, this departure from the Guidance Note does not have any net impact on the Scheme’s net assets or results for the year.
2.4 Revenue Recognition
2.4.1 Income and Expenses are recognized on accrual basis. 2.4.2 Interest on funds invested in short term deposits with scheduled commercial banks is recognized
on accrual basis. 2.4.3 Dividend income earned by the scheme is recognized on the date the share is quoted on ex-dividend
basis on principal stock exchange. 2.4.4 Proportionate realized gains on investments out of sales / repurchase proceeds at the time of sale
/ repurchase of units are transferred to revenue Account from Unit Premium Reserve. 3. Net Asset Value for Growth/Dividend Options:
The net asset value of the units is determined separately for units issued under the Growth Option, Dividend
Option, Growth Option – Direct and Dividend Option – Direct. For reporting the net asset value of the Growth Option, Dividend Option, Growth Option – Direct and Dividend Option - Direct, daily income earned, including realized and unrealized gain or loss in the value of investments and expenses incurred by the scheme are allocated to the options in proportion to the value of the net assets.
4. Unit Premium Reserve Account Upon issue and redemption of units, the net premium or discount to the face value of units is adjusted against the unit premium reserve account of the Scheme, after an appropriate amount of the issue proceeds and redemption payout is credited or debited respectively to the income equalization account.
204
5. Income Equalisation Account
An appropriate part of the sale proceeds or the redemption amount, as the case may be, is transferred to income equalization account. The total distributable surplus (without considering unrealized appreciation) upto the date of issue/ redemption of units has been taken into account for the purpose of ascertaining the amount to be transferred to Equalization Account on a daily basis. The net balance in this account is transferred to the Revenue Account at the end of the year. 6. Load Charges
Service tax on exit load , if any, shall be paid out of the exit load proceeds and exit load net of service tax, if any, shall be credited to the scheme.
. 7. Unclaimed Redemption.
In line with SEBI circular no. MFD/CIR/9/120 /2000 dated November 24, 2000 and SEBI circular no. SEBI/HO/IMD/DF2/CIR/P/2016/37 dated February 25, 2016, the unclaimed redemption and unclaimed dividend amounts may be deployed by the mutual funds in call money market or money market instruments and also be allowed to be invested in a separate plan of Liquid Scheme/ Money Market Mutual Fund scheme floated by Mutual Funds specifically for deployment of the unclaimed amounts. The investors who claim these amounts during a period of three years from the due date shall be paid initial unclaimed amount along with the income earned on its deployment. Investors who claim these amounts after 3 years, shall be paid initial unclaimed amount along with the income earned on its deployment till the end of the third year. After the third year, the income earned on such unclaimed amounts shall be used for the purpose of investor education. Further, AMC shall not be permitted to charge any exit load in this plan and TER (Total Expense Ratio) of such plans shall be capped at 50 bps. The AMC should make continuous effort to remind the investors through letters to take their unclaimed amounts.
. 8. NOTES TO THE ACCOUNTS
8.1 Management Fees, Trusteeship Fees, Custodian Fees, Scheme Expenses Management Fees
Management Fees (inclusive of GST) has been computed at 1.77% (P.Y. 2.76%) on average net assets calculated on a daily basis.
Trusteeship Fees & Expenses
In accordance with Deed of Trust dated 18th July 1996 between the Settler and the Trustees, an annual fee of Rs.1,00,000/- per Trustee is payable. During the financial year 2018-19, the Trusteeship fees and expenses amounted to Rs.82476.35. However, due to small AUM of the scheme, only an amount of Rs.8560.13 was charged to the scheme expenses and the balance amount was borne by the AMC. Custodian Charges HDFC Bank provides Custodial services to the scheme for which fees is paid as per the agreement.
Scheme Expenses As per guidelines issued vide SEBI circular dated October 22, 2018, the scheme related expenses had to be fully managed from the Total Expense Ratio (TER).
During the financial year 2018-19 due to small size of AUM of the scheme only certain expenses have been paid from TER and the balance amount had been borne by the AMC, details are as under:
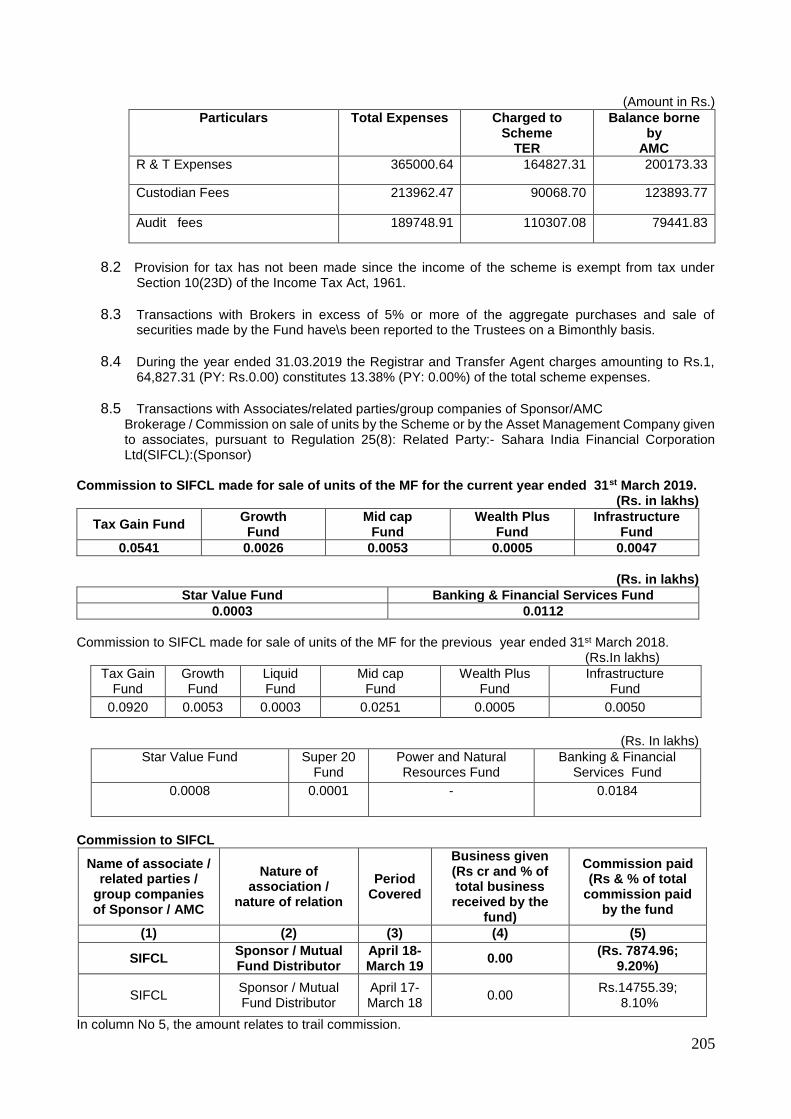
205
(Amount in Rs.)
Particulars Total Expenses Charged to Scheme
TER
Balance borne by
AMC
R & T Expenses 365000.64 164827.31 200173.33
Custodian Fees 213962.47 90068.70 123893.77
Audit fees 189748.91 110307.08 79441.83
8.2 Provision for tax has not been made since the income of the scheme is exempt from tax under Section 10(23D) of the Income Tax Act, 1961.
8.3 Transactions with Brokers in excess of 5% or more of the aggregate purchases and sale of securities made by the Fund have\s been reported to the Trustees on a Bimonthly basis.
8.4 During the year ended 31.03.2019 the Registrar and Transfer Agent charges amounting to Rs.1, 64,827.31 (PY: Rs.0.00) constitutes 13.38% (PY: 0.00%) of the total scheme expenses.
8.5 Transactions with Associates/related parties/group companies of Sponsor/AMC Brokerage / Commission on sale of units by the Scheme or by the Asset Management Company given to associates, pursuant to Regulation 25(8): Related Party:- Sahara India Financial Corporation Ltd(SIFCL):(Sponsor)
Commission to SIFCL made for sale of units of the MF for the current year ended 31st March 2019.
(Rs. in lakhs)
Tax Gain Fund Growth Fund
Mid cap Fund
Wealth Plus Fund
Infrastructure Fund
0.0541 0.0026 0.0053 0.0005 0.0047
(Rs. in lakhs)
Star Value Fund Banking & Financial Services Fund
0.0003 0.0112
Commission to SIFCL made for sale of units of the MF for the previous year ended 31st March 2018. (Rs.In lakhs)
Tax Gain Fund
Growth Fund
Liquid Fund
Mid cap Fund
Wealth Plus Fund
Infrastructure Fund
0.0920 0.0053 0.0003 0.0251 0.0005 0.0050
(Rs. In lakhs)
Star Value Fund Super 20 Fund
Power and Natural Resources Fund
Banking & Financial Services Fund
0.0008 0.0001 - 0.0184
Commission to SIFCL
Name of associate / related parties /
group companies of Sponsor / AMC
Nature of association /
nature of relation
Period Covered
Business given (Rs cr and % of total business received by the
fund)
Commission paid (Rs & % of total
commission paid by the fund
(1) (2) (3) (4) (5)
SIFCL Sponsor / Mutual Fund Distributor
April 18-March 19
0.00 (Rs. 7874.96;
9.20%)
SIFCL Sponsor / Mutual Fund Distributor
April 17-March 18
0.00 Rs.14755.39;
8.10%
In column No 5, the amount relates to trail commission.
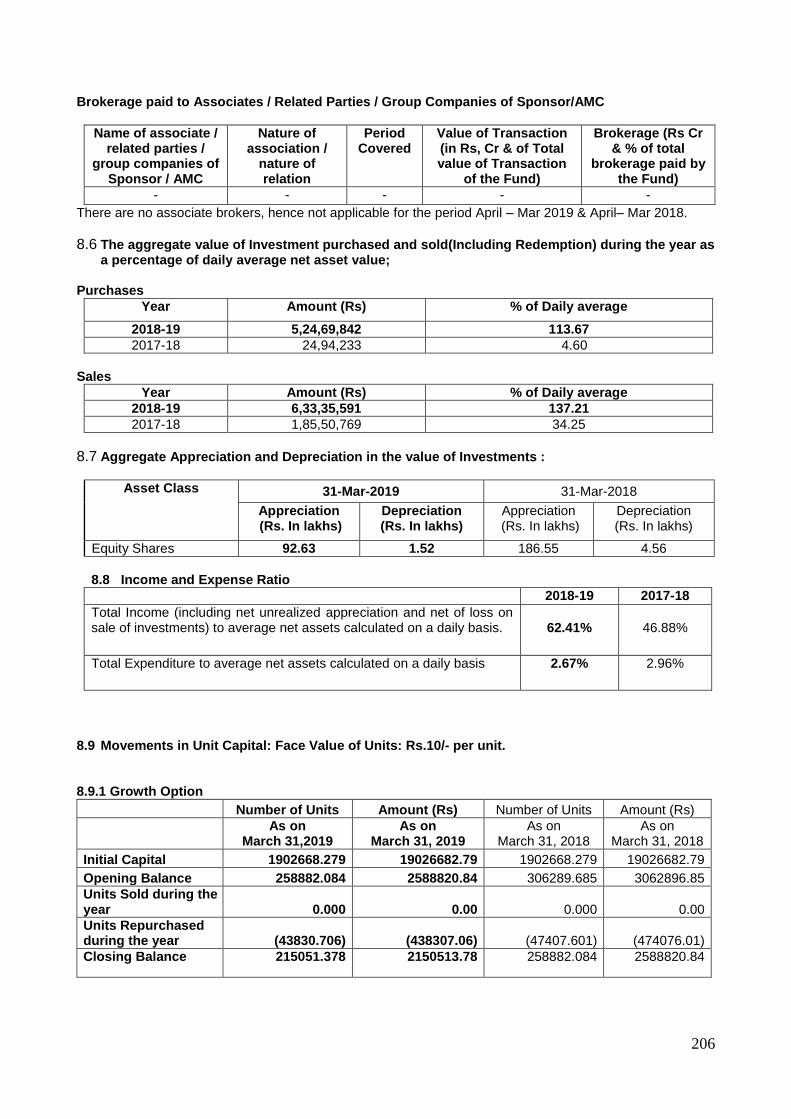
206
Brokerage paid to Associates / Related Parties / Group Companies of Sponsor/AMC
Name of associate / related parties /
group companies of Sponsor / AMC
Nature of association /
nature of relation
Period Covered
Value of Transaction (in Rs, Cr & of Total value of Transaction
of the Fund)
Brokerage (Rs Cr & % of total
brokerage paid by the Fund)
- - - - -
There are no associate brokers, hence not applicable for the period April – Mar 2019 & April– Mar 2018.
8.6 The aggregate value of Investment purchased and sold(Including Redemption) during the year as a percentage of daily average net asset value;
Purchases
Year Amount (Rs) % of Daily average
2018-19 5,24,69,842 113.67
2017-18 24,94,233 4.60
Sales
Year Amount (Rs) % of Daily average
2018-19 6,33,35,591 137.21
2017-18 1,85,50,769 34.25
8.7 Aggregate Appreciation and Depreciation in the value of Investments :
Asset Class 31-Mar-2019 31-Mar-2018
Appreciation (Rs. In lakhs)
Depreciation (Rs. In lakhs)
Appreciation (Rs. In lakhs)
Depreciation (Rs. In lakhs)
Equity Shares 92.63 1.52 186.55 4.56
8.8 Income and Expense Ratio
2018-19 2017-18
Total Income (including net unrealized appreciation and net of loss on sale of investments) to average net assets calculated on a daily basis.
62.41%
46.88%
Total Expenditure to average net assets calculated on a daily basis 2.67% 2.96%
8.9 Movements in Unit Capital: Face Value of Units: Rs.10/- per unit. 8.9.1 Growth Option
Number of Units Amount (Rs) Number of Units Amount (Rs)
As on
March 31,2019 As on
March 31, 2019 As on
March 31, 2018 As on
March 31, 2018
Initial Capital 1902668.279 19026682.79 1902668.279 19026682.79
Opening Balance 258882.084 2588820.84 306289.685 3062896.85
Units Sold during the year 0.000 0.00 0.000 0.00
Units Repurchased during the year (43830.706) (438307.06) (47407.601) (474076.01)
Closing Balance 215051.378 2150513.78 258882.084 2588820.84
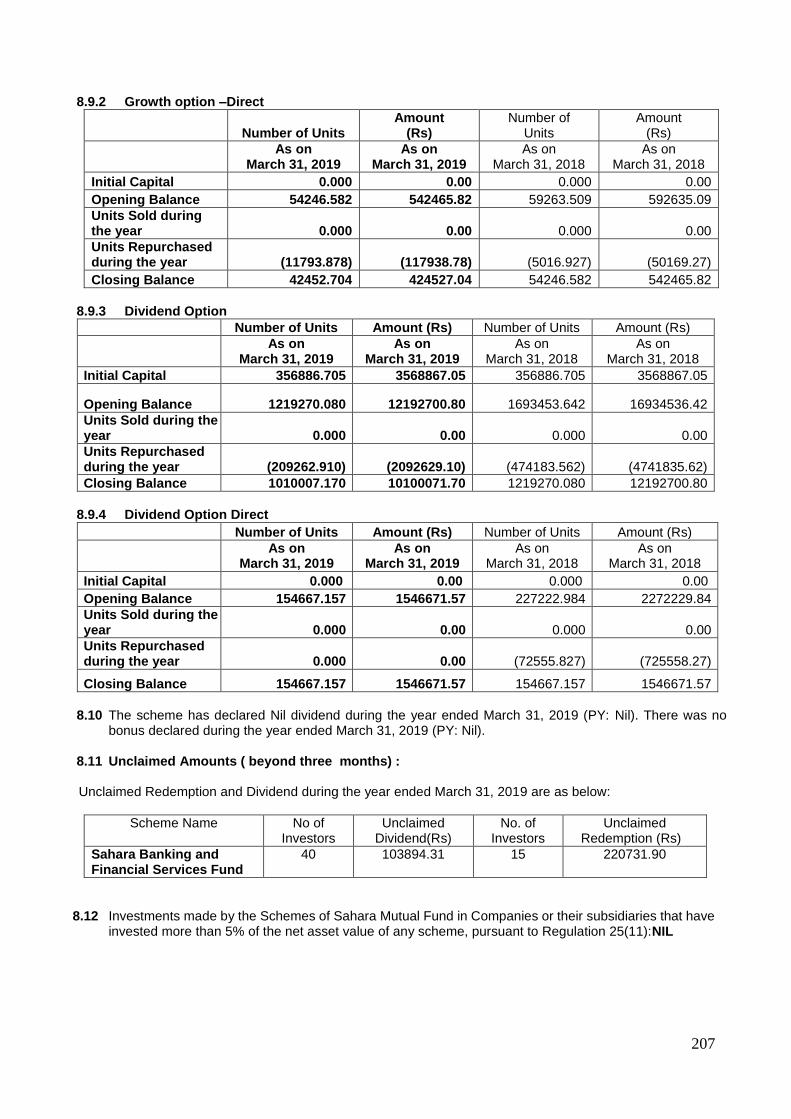
207
8.9.2 Growth option –Direct
Number of Units Amount
(Rs) Number of
Units Amount
(Rs)
As on
March 31, 2019 As on
March 31, 2019 As on
March 31, 2018 As on
March 31, 2018
Initial Capital 0.000 0.00 0.000 0.00
Opening Balance 54246.582 542465.82 59263.509 592635.09
Units Sold during the year 0.000 0.00 0.000 0.00
Units Repurchased during the year (11793.878) (117938.78) (5016.927) (50169.27)
Closing Balance 42452.704 424527.04 54246.582 542465.82
8.9.3 Dividend Option
Number of Units Amount (Rs) Number of Units Amount (Rs)
As on
March 31, 2019 As on
March 31, 2019 As on
March 31, 2018 As on
March 31, 2018
Initial Capital 356886.705 3568867.05 356886.705 3568867.05
Opening Balance 1219270.080 12192700.80 1693453.642 16934536.42
Units Sold during the year 0.000 0.00 0.000 0.00
Units Repurchased during the year (209262.910) (2092629.10) (474183.562) (4741835.62)
Closing Balance 1010007.170 10100071.70 1219270.080 12192700.80
8.9.4 Dividend Option Direct
Number of Units Amount (Rs) Number of Units Amount (Rs)
As on
March 31, 2019 As on
March 31, 2019 As on
March 31, 2018 As on
March 31, 2018
Initial Capital 0.000 0.00 0.000 0.00
Opening Balance 154667.157 1546671.57 227222.984 2272229.84
Units Sold during the year 0.000 0.00 0.000 0.00
Units Repurchased during the year
0.000 0.00 (72555.827) (725558.27)
Closing Balance 154667.157 1546671.57 154667.157 1546671.57
8.10 The scheme has declared Nil dividend during the year ended March 31, 2019 (PY: Nil). There was no
bonus declared during the year ended March 31, 2019 (PY: Nil). 8.11 Unclaimed Amounts ( beyond three months) : Unclaimed Redemption and Dividend during the year ended March 31, 2019 are as below:
Scheme Name No of Investors
Unclaimed Dividend(Rs)
No. of Investors
Unclaimed Redemption (Rs)
Sahara Banking and Financial Services Fund
40
103894.31
15
220731.90
8.12 Investments made by the Schemes of Sahara Mutual Fund in Companies or their subsidiaries that have invested more than 5% of the net asset value of any scheme, pursuant to Regulation 25(11):NIL
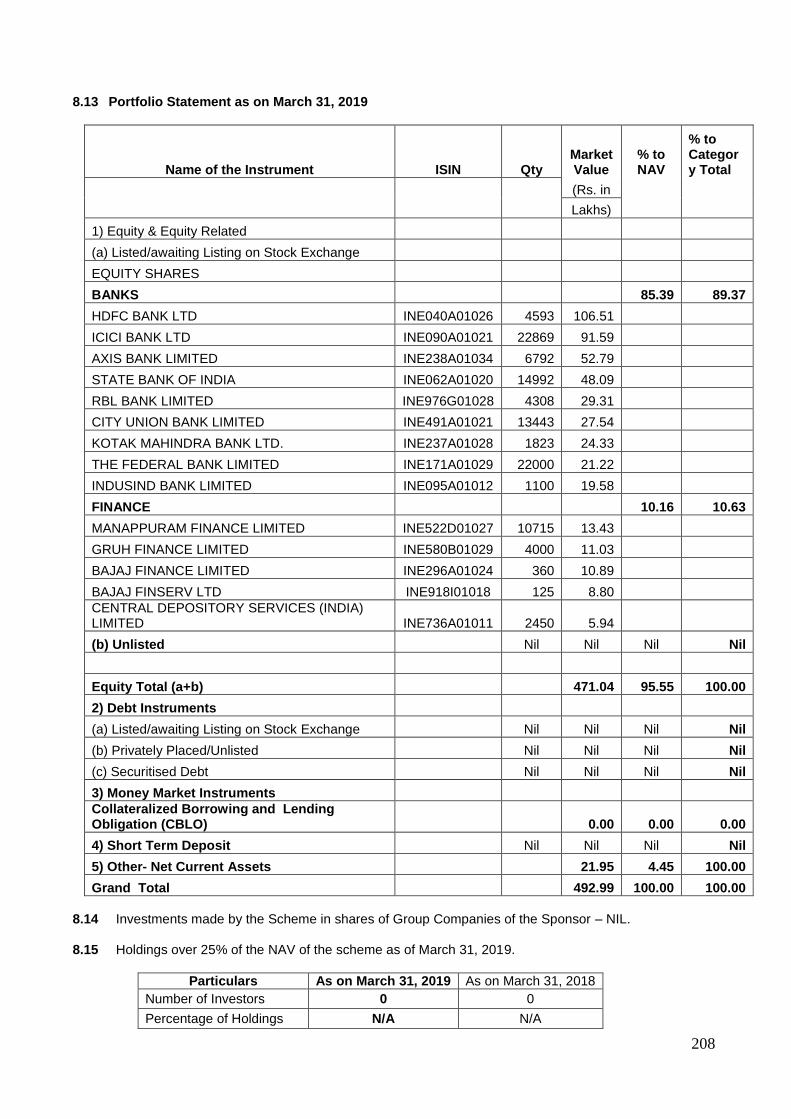
208
8.13 Portfolio Statement as on March 31, 2019
Name of the Instrument ISIN Qty Market Value
% to NAV
% to Category Total
(Rs. in
Lakhs)
1) Equity & Equity Related
(a) Listed/awaiting Listing on Stock Exchange
EQUITY SHARES
BANKS 85.39 89.37
HDFC BANK LTD INE040A01026 4593 106.51
ICICI BANK LTD INE090A01021 22869 91.59
AXIS BANK LIMITED INE238A01034 6792 52.79
STATE BANK OF INDIA INE062A01020 14992 48.09
RBL BANK LIMITED INE976G01028 4308 29.31
CITY UNION BANK LIMITED INE491A01021 13443 27.54
KOTAK MAHINDRA BANK LTD. INE237A01028 1823 24.33
THE FEDERAL BANK LIMITED INE171A01029 22000 21.22
INDUSIND BANK LIMITED INE095A01012 1100 19.58
FINANCE 10.16 10.63
MANAPPURAM FINANCE LIMITED INE522D01027 10715 13.43
GRUH FINANCE LIMITED INE580B01029 4000 11.03
BAJAJ FINANCE LIMITED INE296A01024 360 10.89
BAJAJ FINSERV LTD INE918I01018 125 8.80
CENTRAL DEPOSITORY SERVICES (INDIA) LIMITED INE736A01011 2450 5.94
(b) Unlisted Nil Nil Nil Nil
Equity Total (a+b) 471.04 95.55 100.00
2) Debt Instruments
(a) Listed/awaiting Listing on Stock Exchange Nil Nil Nil Nil
(b) Privately Placed/Unlisted Nil Nil Nil Nil
(c) Securitised Debt Nil Nil Nil Nil
3) Money Market Instruments
Collateralized Borrowing and Lending Obligation (CBLO) 0.00 0.00 0.00
4) Short Term Deposit Nil Nil Nil Nil
5) Other- Net Current Assets 21.95 4.45 100.00
Grand Total 492.99 100.00 100.00
8.14 Investments made by the Scheme in shares of Group Companies of the Sponsor – NIL.
8.15 Holdings over 25% of the NAV of the scheme as of March 31, 2019.
Particulars As on March 31, 2019 As on March 31, 2018
Number of Investors 0 0
Percentage of Holdings N/A N/A

209
8.16 Contingent Liabilities: Nil
8.17 SEBI vide its Order no: WTM/PS/26/IMD/DOF-III/July/2015 dated 28th July, 2015 directed cancellation
of “Certificate of Registration” of Sahara Mutual Fund which was to be effective on expiry of six months from the date of the Order. Further, SEBI also directed by the said Order that the Mutual Fund shall not take any new subscription from investors. Accordingly, Sahara Mutual Fund has not taken any new subscription from the investors (including existing investors) in line with the said SEBI order.
Sahara Asset Management Company Pvt. Ltd filed an appeal before the Securities Appellate Tribunal (SAT), Mumbai to set aside the said SEBI order. SAT vide its order dated 9th December 2015 granted an interim stay in the matter. SAT vide its order dated 28th July, 2017 dismissed the appeal made by Sahara AMC against the SEBI order dated 28th July, 2015. However, SAT granted 6 weeks stay to approach the Hon’ble Supreme Court in the matter. An appeal was filed on 7th September 2017 before the Hon’ble Supreme Court and the appeal was dismissed vide its order dated 23rd October 2017.
SEBI vide its letter dated November 17, 2017 directed the cancellation of ‘Certificate of registration’ would be effective six months from the date of the Hon’ble Supreme Court order dated 23rd October 2017.
Sahara Mutual Fund requested SEBI vide its letter dated 15th January 2018 to extend the date of cancellation of ‘Certificate of registration’ till July 27th, 2018 for giving time for identification of a new sponsor and considering the lock in period of certain unit holders’ investments in Sahara Tax Gain Fund.
A new sponsor was identified for Sahara Mutual Fund viz., One Life Capital Advisors Limited.
SEBI vide their letter dated 11th April 2018 ordered for winding up all the schemes except Sahara Tax Gain Fund by 21st April 2018. An appeal was filed before SAT for a stay against the SEBI order dated April, 11, 2018.
In view of the direction of SAT on 26th April 2018 a comprehensive appeal was filed.
SAT vide its order dated 3rd May 2018 directed that SEBI shall not enforce the orders impugned in the two appeals till a decision on new sponsor’s application is communicated.
Pending decision of SEBI on the above matter, the scheme accounts have been made on a ‘going concern basis’.
8.18 Composition of the Board of Trustees.
As per Reg 15(1) r.w. para 22 of the Third Schedule (Contents of Trust Deed) of SEBI (Mutual Funds) Regulations 1996, it is stated that "The trust deed shall state that the minimum number of trustees shall be four. “The Board of Trustees of Sahara Mutual Fund comprises of two (2) Trustees and thereby the above criteria of minimum number of Trustees has not been complied with.
8.19 Net worth:
As per the Reg. 21(1)(f), of SEBI (Mutual Funds) Regulations, 1996 and in compliance with the notification of Securities and Exchange Board of India (Mutual Funds) (Amendment) Regulations, 2014 dated May 6, 2014, the AMC should maintain a Net Worth of minimum Rs.50 crs. The Net Worth of Sahara Asset Management Company Private Ltd. as on March 31, 2019 was Rs.5.02 crs, which is below the threshold limit of Rs.50 crs and thereby the net worth criteria as required by the above regulations has not been complied with.

210
8.20 Previous year figures have been reclassified/regrouped, wherever nnecessary, to conform to the current year’s classification.
As per our attached report of even date
For Chaturvedi & Partners For Sahara Asset Management Company Private Limited Chartered Accountants
(Firm’s Registration No. 307068E) O P Srivastava R M Joshi
Director Director
Sudhir Kaup Khozem Jabalpurwala
Khyati Shah Compliance Officer Fund Manager
(Partner)
Mem. No.117510 Vidya Manjrekar
Head – Operations & NAV Accounting
Place: Mumbai
Date: 19th July, 2019 For Sahara Mutual Fund
M R Siddiqui S P Srivastava
Trustee Trustee Place: Mumbai Date: 19th July, 2019
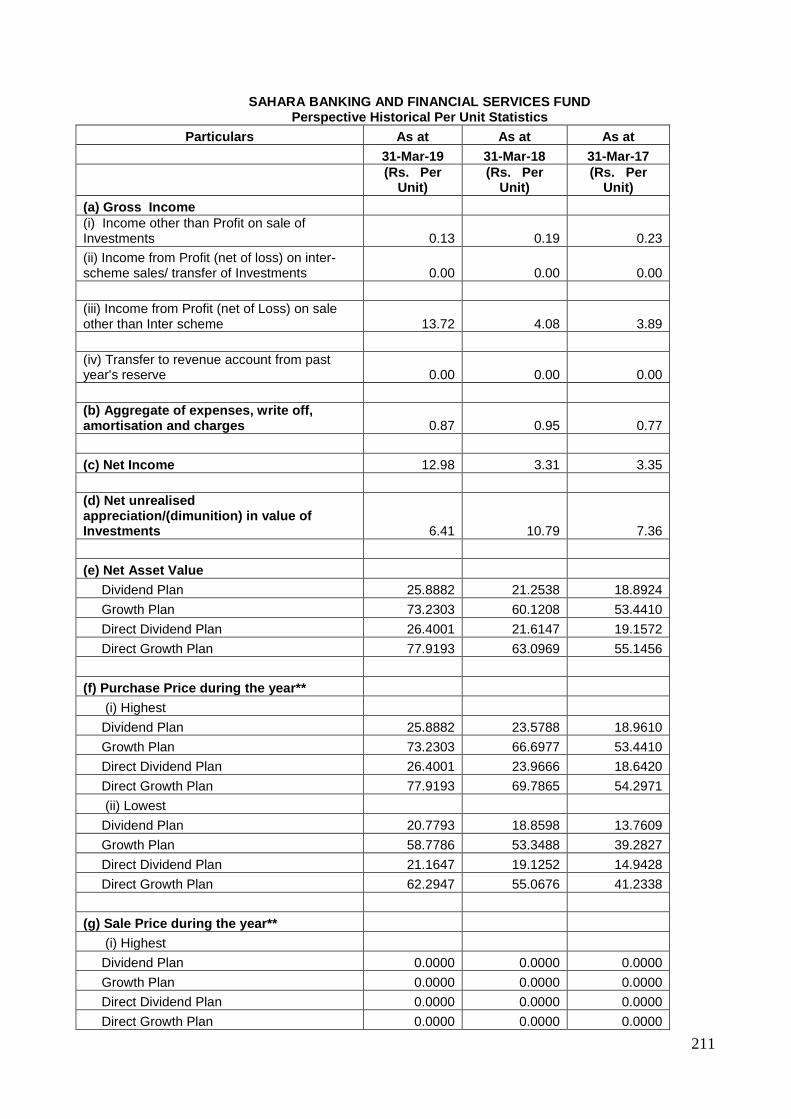
211
SAHARA BANKING AND FINANCIAL SERVICES FUND Perspective Historical Per Unit Statistics
Particulars As at As at As at
31-Mar-19 31-Mar-18 31-Mar-17
(Rs. Per
Unit) (Rs. Per
Unit) (Rs. Per
Unit)
(a) Gross Income
(i) Income other than Profit on sale of Investments 0.13 0.19 0.23
(ii) Income from Profit (net of loss) on inter-scheme sales/ transfer of Investments 0.00 0.00 0.00
(iii) Income from Profit (net of Loss) on sale other than Inter scheme 13.72 4.08 3.89
(iv) Transfer to revenue account from past year's reserve 0.00 0.00 0.00
(b) Aggregate of expenses, write off, amortisation and charges 0.87 0.95 0.77
(c) Net Income 12.98 3.31 3.35
(d) Net unrealised appreciation/(dimunition) in value of Investments 6.41 10.79 7.36
(e) Net Asset Value
Dividend Plan 25.8882 21.2538 18.8924
Growth Plan 73.2303 60.1208 53.4410
Direct Dividend Plan 26.4001 21.6147 19.1572
Direct Growth Plan 77.9193 63.0969 55.1456
(f) Purchase Price during the year**
(i) Highest
Dividend Plan 25.8882 23.5788 18.9610
Growth Plan 73.2303 66.6977 53.4410
Direct Dividend Plan 26.4001 23.9666 18.6420
Direct Growth Plan 77.9193 69.7865 54.2971
(ii) Lowest
Dividend Plan 20.7793 18.8598 13.7609
Growth Plan 58.7786 53.3488 39.2827
Direct Dividend Plan 21.1647 19.1252 14.9428
Direct Growth Plan 62.2947 55.0676 41.2338
(g) Sale Price during the year**
(i) Highest
Dividend Plan 0.0000 0.0000 0.0000
Growth Plan 0.0000 0.0000 0.0000
Direct Dividend Plan 0.0000 0.0000 0.0000
Direct Growth Plan 0.0000 0.0000 0.0000
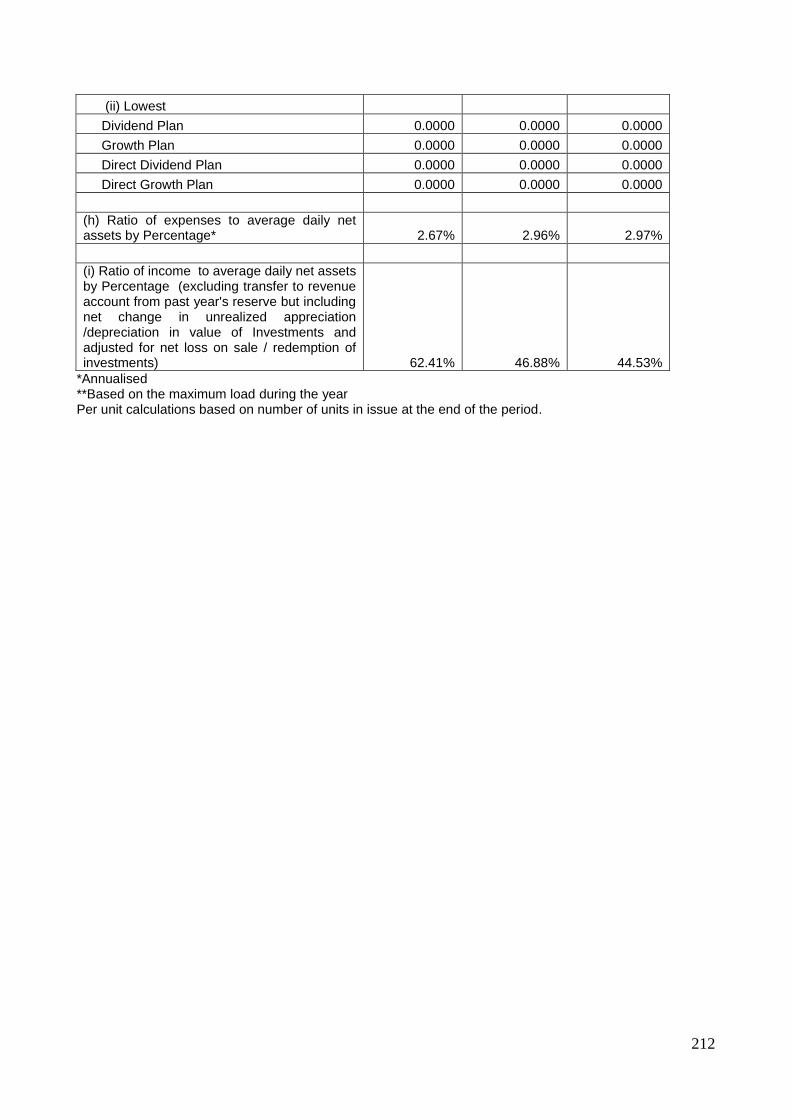
212
(ii) Lowest
Dividend Plan 0.0000 0.0000 0.0000
Growth Plan 0.0000 0.0000 0.0000
Direct Dividend Plan 0.0000 0.0000 0.0000
Direct Growth Plan 0.0000 0.0000 0.0000
(h) Ratio of expenses to average daily net assets by Percentage* 2.67% 2.96% 2.97%
(i) Ratio of income to average daily net assets by Percentage (excluding transfer to revenue account from past year's reserve but including net change in unrealized appreciation /depreciation in value of Investments and adjusted for net loss on sale / redemption of investments) 62.41% 46.88% 44.53%
*Annualised **Based on the maximum load during the year Per unit calculations based on number of units in issue at the end of the period.