Embed Size (px)
Citation preview
Document-No. ITD-0315-RP-0006-S3 Infoterra GmbH Version: 1.00 Date: 14.11.2003 Infoterra Page: 2 of 20
SAGE SERVICES & PRODUCTS AVAILABLE TODAY INTRODUCTION The project aims at the GMES priority themes “Environmental Stress” and “Land Cover”. The pre-cursor services address the European Water Framework Directive (WFD) and the Soil Protection Initative (SPI). In order to monitor and improve environmental conditions, the cardinal needs of planners and decision makers on available, reliable, and affordable information delivered in time on environmental pressure and stress have to be served.
The implementation of the new European policies WFD & SPI are a challenge to most legal bodies in charge. For example, the demand for water basin management plans addressed by the WFD, and reporting schemes on GIS basis requested from the EC, will impose a real paradigm change: instead of statistical data from sampling and point measurements (today’s standard approaches), spatial information on is increasingly required on national and local scales. In addition, the Euro-pean Commission put strong efforts on harmonised reporting from the member states, which re-quires harmonisation of thematic content and data formats in order to make reports comparable at European level. Here, EO based geo-information data provided by SAGE will contribute signifi-cantly.
SAGE directly addresses the requirements of core users dealing with implementation of the WFD and SPI, and representing different environmental conditions (boreal, central European, Alpine, Mediterranean), different information levels (European, regional, national, local), and different end user-organisations (European Commission – European Environmental Agency (EEA), Ministries of Environment from member states and local end user groups; e.g. federal state ministries or re-gional water / soil authorities). Due to their high interest in SAGE, the core users actively partici-pate in the project, their activities being coordinated by the European Topic Centre Terrestrial Envi-ronment (ETC-TE).
To serve the needs of many different end user-segments, which have been identified during the preparation of the SAGE proposal and the first months of the project, SAGE reflects:
• hot spot mapping or sampling approaches at local / regional level
• complete coverage in significantly reduced scales at international level
• different end user infrastructures; e.g. an agency which has an information service already installed and which likes to improve their service will request only for better landcover in-formation, while other customers may ask for a complete service on agri-environmental risk maps or indicators for planning, control and response actions. SAGE pre-cursor services comprise
o AquaSAGE with Water Quality, Water Shortage and Indicators (pressure & state indi-cators)
o SoilSAGE with pressure and state indicators.
Document-No. ITD-0315-RP-0006-S3 Infoterra GmbH Version: 1.00 Date: 14.11.2003 Infoterra Page: 3 of 20
The key goal is to support the responsible authorities in establishing sustainable management of their water basins and their soils. A better understanding and the early detection of potential risks and sources of environmental degradation will contribute towards a reduction of costs for mitiga-tion, maintenance and sustainable management of the environment as well. In addition, SAGE will be an important step towards a harmonized reporting scheme for the European Union as a whole.
The salient features to achieve SAGE´s objectives have already been identified by ESA and are recognised by the study team. They constitute the GSE´s objectives and milestones:
• The involvement of end users for “closing the loop” between the operational results ob-tained from the present generation of EO satellites and the definition of future systems.
• The demonstration of EO based information precursor services which are based on proven technology and which are capable to deliver in time reliable and affordable information.
• The identification of cross-cutting issues of a GSE core service basis, addressing for in-stance a harmonised production chain for landcover / land use (LC/LU) information as “in-termediate” products.
The technical realisation of SAGE is based on an open concept for both the infrastructure (space, ground and services) and the partner network. As an overall principle, the design first of all reflects the user needs translated into SAGE´s product portfolio.
Document-No. ITD-0315-RP-0006-S3 Infoterra GmbH Version: 1.00 Date: 14.11.2003 Infoterra Page: 4 of 20
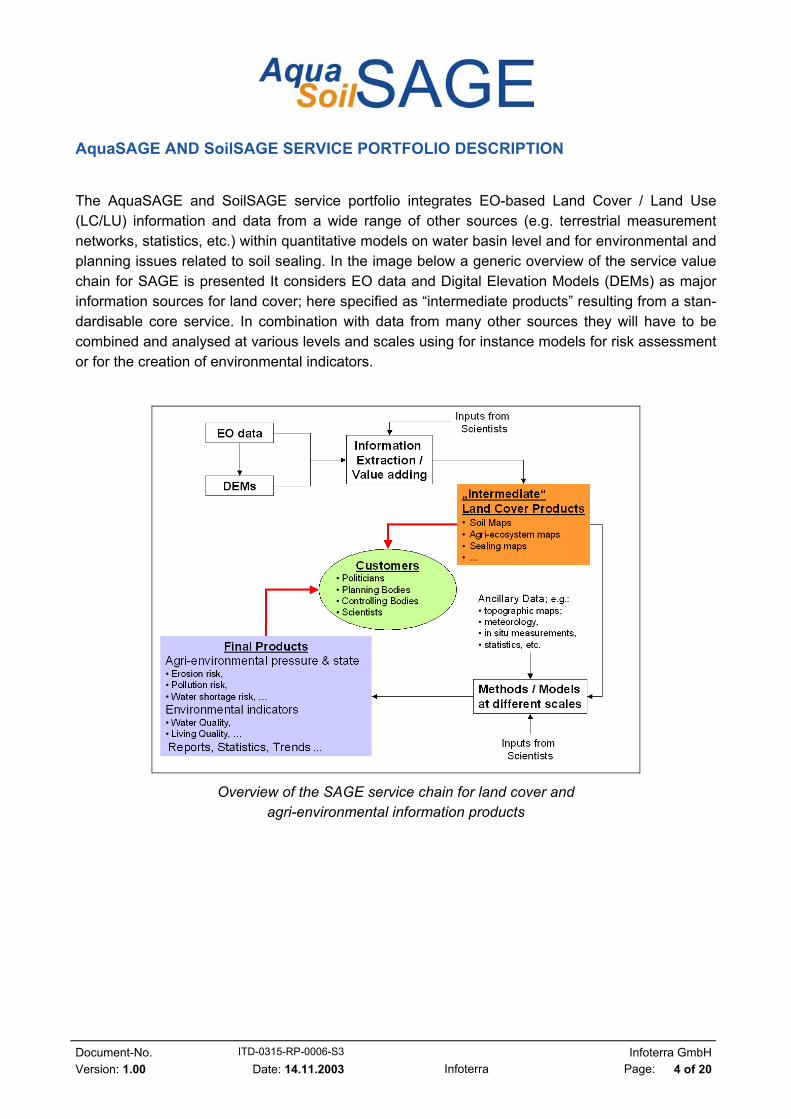
AquaSAGE AND SoilSAGE SERVICE PORTFOLIO DESCRIPTION The AquaSAGE and SoilSAGE service portfolio integrates EO-based Land Cover / Land Use (LC/LU) information and data from a wide range of other sources (e.g. terrestrial measurement networks, statistics, etc.) within quantitative models on water basin level and for environmental and planning issues related to soil sealing. In the image below a generic overview of the service value chain for SAGE is presented It considers EO data and Digital Elevation Models (DEMs) as major information sources for land cover; here specified as “intermediate products” resulting from a stan-dardisable core service. In combination with data from many other sources they will have to be combined and analysed at various levels and scales using for instance models for risk assessment or for the creation of environmental indicators.
Overview of the SAGE service chain for land cover and agri-environmental information products
Document-No. ITD-0315-RP-0006-S3 Infoterra GmbH Version: 1.00 Date: 14.11.2003 Infoterra Page: 5 of 20
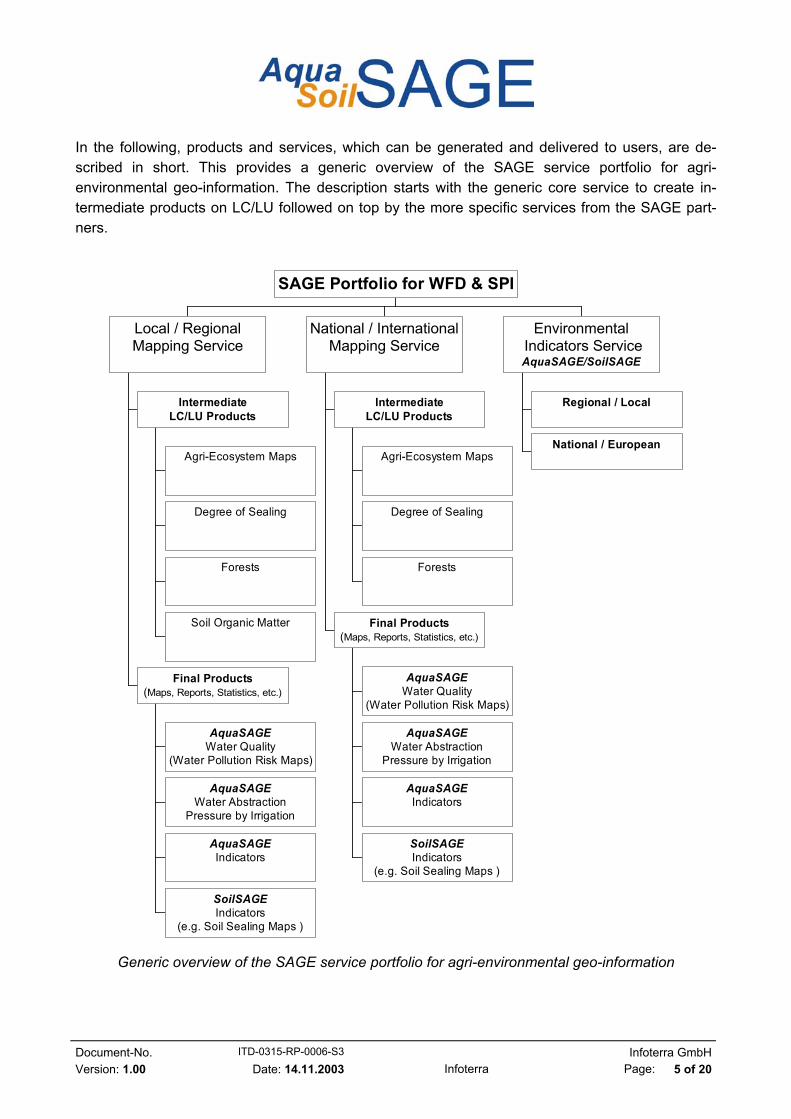
In the following, products and services, which can be generated and delivered to users, are de-scribed in short. This provides a generic overview of the SAGE service portfolio for agri-environmental geo-information. The description starts with the generic core service to create in-termediate products on LC/LU followed on top by the more specific services from the SAGE part-ners.
Agri-Ecosystem Maps
Degree of Sealing
Forests
Soil Organic Matter
IntermediateLC/LU Products
AquaSAGEWater Quality
(Water Pollution Risk Maps)
AquaSAGEWater Abstraction
Pressure by Irrigation
AquaSAGEIndicators
SoilSAGEIndicators
(e.g. Soil Sealing Maps )
Final Products(Maps, Reports, Statistics, etc.)
Local / RegionalMapping Service
Agri-Ecosystem Maps
Degree of Sealing
Forests
IntermediateLC/LU Products
AquaSAGEWater Quality
(Water Pollution Risk Maps)
AquaSAGEWater Abstraction
Pressure by Irrigation
AquaSAGEIndicators
SoilSAGEIndicators
(e.g. Soil Sealing Maps )
Final Products(Maps, Reports, Statistics, etc.)
National / InternationalMapping Service
Regional / Local
National / European
Environmental Indicators ServiceAquaSAGE/SoilSAGE
SAGE Portfolio for WFD & SPI
Generic overview of the SAGE service portfolio for agri-environmental geo-information
Document-No. ITD-0315-RP-0006-S3 Infoterra GmbH Version: 1.00 Date: 14.11.2003 Infoterra Page: 6 of 20
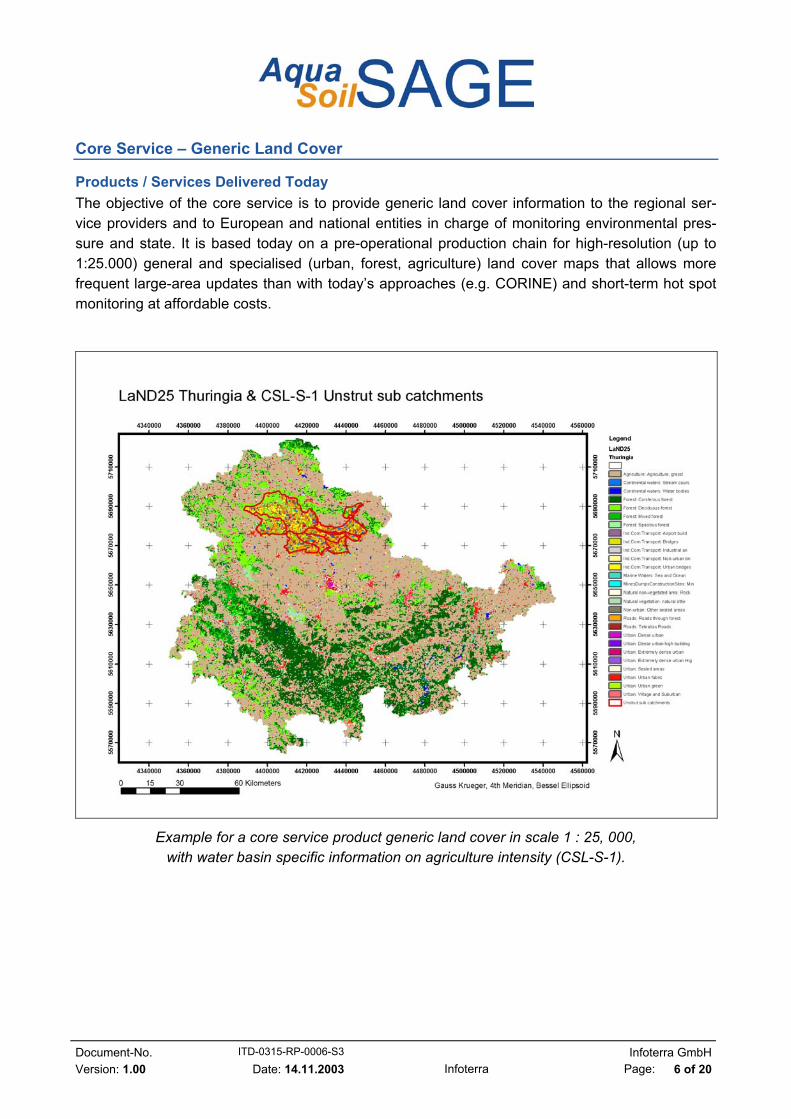
Core Service – Generic Land Cover
Products / Services Delivered Today The objective of the core service is to provide generic land cover information to the regional ser-vice providers and to European and national entities in charge of monitoring environmental pres-sure and state. It is based today on a pre-operational production chain for high-resolution (up to 1:25.000) general and specialised (urban, forest, agriculture) land cover maps that allows more frequent large-area updates than with today’s approaches (e.g. CORINE) and short-term hot spot monitoring at affordable costs.
Example for a core service product generic land cover in scale 1 : 25, 000, with water basin specific information on agriculture intensity (CSL-S-1).
Document-No. ITD-0315-RP-0006-S3 Infoterra GmbH Version: 1.00 Date: 14.11.2003 Infoterra Page: 7 of 20
Methodology The end-user needs on LC/LU are satisfied in a way, which is to a certain extent consistent with the CLC nomenclature, the only European standard on EO based LC/LU data bases. This assures that overall consistency and comparability are maintained as far as possible, and relevant informa-tion is delivered in a harmonised way.
As CLC is far from optimal for many end users working at regional / local level SAGE offers:
1. Identification of smaller land cover features (e.g. 1-5 ha resolution cells) by maintaining the thematic content,
2. Creation of higher level of detail of the thematic content (e.g. CLC level 4 and beyond) by maintaining the scale
3. Improving both, scale and thematic content For this reason, a hierarchical approach is applied, following CLC nomenclature, as far as possi-ble. LU/LC information is provided down to CLC level 3 in a standardized but significantly improved way according to EU definitions. This will assure the capability of up-scaling the results to national and international level and the possibility of integration into European LU/LC approaches. CLC “Level 4” items will be derived w.r.t. the specific national, regional or local user needs, but fitting into the overall CLC nomenclature as required from the CORINE program [EEA, 1995 & EEA, 2000].
Today’s Constraints Besides data availability over long periods and large areas a critical issue is the lack of harmonised reporting schemes for geo-information data at European level. However, as far as the European Reporting Directive and INSPIRE are not in place it has to be assured by a “late customising ap-proach” that national and regional special requirements from users can be met.
For a coherent production of LC/LU the European community of service providers includes an im-portant number of institutions, but the community is fragmented and has not been organized to bridge the gap. It is fragmented in its applications and geographical scopes (often national), result-ing in a disorganized duplication of activities.
Major Benefits EO based information on Land Cover / Land Use (LC/LU) is a cross-cutting issue because such in-formation is mandatory for describing a multitude of environmental conditions. Hence, it’s cost ef-fective and sustainable provision to end user segments will improve significantly management and planning activities at all levels from European customers down to regional applications, by preserv-ing time and money for the users and by improving output results from subsequent modelling ap-proaches.
Document-No. ITD-0315-RP-0006-S3 Infoterra GmbH Version: 1.00 Date: 14.11.2003 Infoterra Page: 8 of 20
AquaSAGE: Surface and ground water quality AquaSAGE – boreal forests
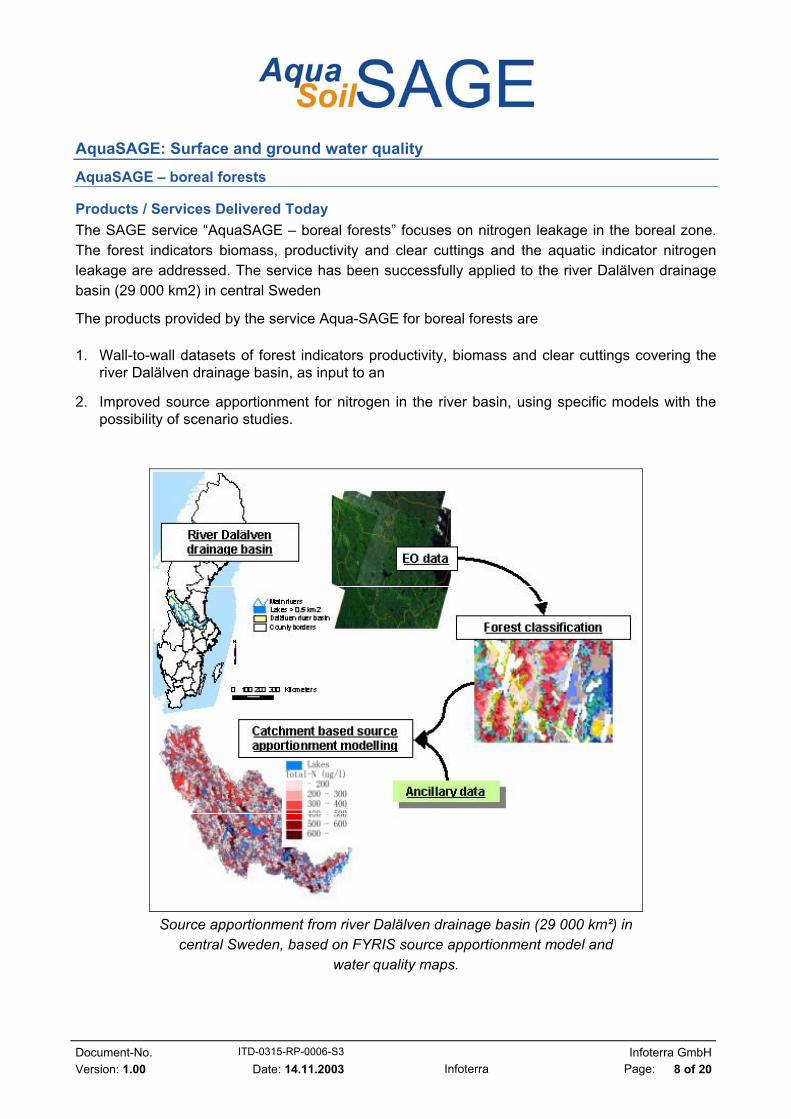
Products / Services Delivered Today The SAGE service “AquaSAGE – boreal forests” focuses on nitrogen leakage in the boreal zone. The forest indicators biomass, productivity and clear cuttings and the aquatic indicator nitrogen leakage are addressed. The service has been successfully applied to the river Dalälven drainage basin (29 000 km2) in central Sweden
The products provided by the service Aqua-SAGE for boreal forests are
1. Wall-to-wall datasets of forest indicators productivity, biomass and clear cuttings covering the river Dalälven drainage basin, as input to an
2. Improved source apportionment for nitrogen in the river basin, using specific models with the possibility of scenario studies.
Source apportionment from river Dalälven drainage basin (29 000 km²) in
central Sweden, based on FYRIS source apportionment model and water quality maps.
Document-No. ITD-0315-RP-0006-S3 Infoterra GmbH Version: 1.00 Date: 14.11.2003 Infoterra Page: 9 of 20
The intermediate products (forest indicators) are primarily used as improved input to a refined source apportionment model for nitrogen in the drainage basin, i.e. the final product, but they may also be used for other purposes (e.g. terrestrial monitoring).
The final products from the service are the source apportionment for the river basin based on the source apportionment model (FYRIS model) and water quality maps.
Methodology The catchment characteristics will be based on official maps and the intermediate products, i.e. the improved spatial information on forest indicators. Ancillary data used in the modelling will be data on e.g. point sources, nitrogen deposition, runoff and land use (other than forest).
For clear cut mapping, a methodology for change detection is used, developed and implemented in a software tool within the ENFORMA project (EC FP4 project ENV-CT97-0423).
For mapping of forest biomass and productivity a classification of tree species composition and age is applied which was specifically adapted for handling a mixture of reference data from differ-ent sources. The approach is non-parametric and the images are de-noised using wavelet-transformations. Estimation of biomass and productivity (growth) are then derived from the tree species classification.
Today’s Constraints The areas to be covered in Scandinavia are large and the time period needed to cover a specific area, e.g. an entire drainage basin, varies depending on the availability of individual cloud free sat-ellite scenes. The cloud coverage also affects the possible up-dating frequency which for monitor-ing purposes probably will have to be defined as an interval, e.g. target on every year for some purposes but allowing an interval 2 – 6 years.
The lack of suitable, cloud-free, scenes implies that in the future a stabilized service (the whole chain of satellite data processing, source apportionment, validation etc.) with up-dated deliverables will have to be able to handle data from different years in different parts of the drainage basin.
Major Benefits EO-based information will provide wall-to-wall data on forest indicators covering drainage basins. This will make it possible to incorporate homogeneous data with higher spatial and thematic reso-lution than presently available for use in source apportionment for example for the river Dalälven. It will also allow for a refined definition of element loss (nitrogen) from forest land. The data will be implemented together with ancillary data (GIS layers on sub catchments, monitoring data etc.) into the FYRIS source apportionment model, which in turn will provide an improved estimate of nitrogen leakage from boreal forests.
Document-No. ITD-0315-RP-0006-S3 Infoterra GmbH Version: 1.00 Date: 14.11.2003 Infoterra Page: 10 of 20
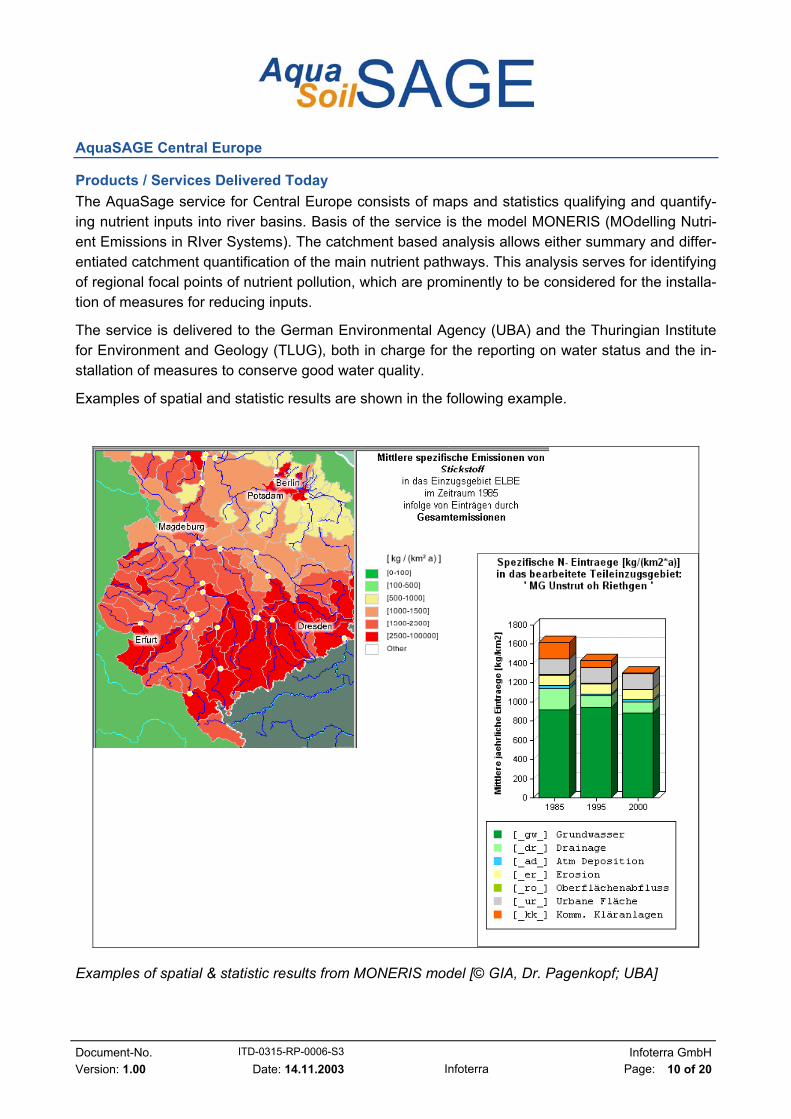
AquaSAGE Central Europe
Products / Services Delivered Today The AquaSage service for Central Europe consists of maps and statistics qualifying and quantify-ing nutrient inputs into river basins. Basis of the service is the model MONERIS (MOdelling Nutri-ent Emissions in RIver Systems). The catchment based analysis allows either summary and differ-entiated catchment quantification of the main nutrient pathways. This analysis serves for identifying of regional focal points of nutrient pollution, which are prominently to be considered for the installa-tion of measures for reducing inputs.
The service is delivered to the German Environmental Agency (UBA) and the Thuringian Institute for Environment and Geology (TLUG), both in charge for the reporting on water status and the in-stallation of measures to conserve good water quality.
Examples of spatial and statistic results are shown in the following example.
Examples of spatial & statistic results from MONERIS model [© GIA, Dr. Pagenkopf; UBA]
Document-No. ITD-0315-RP-0006-S3 Infoterra GmbH Version: 1.00 Date: 14.11.2003 Infoterra Page: 11 of 20
Methodology The model MONERIS was developed and applied to estimate the nutrient inputs into river basins of Germany by point sources and various diffuse pathways. The model is based on data of river flow and water quality as well as a geographical information system (GIS), which includes digital maps and extensive statistical information.
Whereas point emissions from waste water treatment plants and industrial sources are directly dis-charged into the rivers, diffuse emissions into surface waters are caused by the sum of different pathways, which are realised by separate flow components. This separation of the components of diffuse sources is necessary, because nutrient concentrations and relevant processes for the pathways are mostly very different.
Consequently seven pathways are considered:
• point sources • atmospheric deposition • erosion • surface runoff • groundwater • tile drainage • paved urban areas
Most important input parameters are especially LC/LU information detailed to agricultural crop types which are provided by the SAGE core service.
Today’s Constraints Besides availability of EO data in terms of large scale mapping of important LC/LU classes in rea-sonable time periods, another critical issue is the availability of harmonized additional data sets like statistics and thematic maps. A lot of work has to be done in preparation of input data while the modelling approach itself is settled. This is especially true for international approaches.
Major Benefits The MONERIS model approach can easily be transferred to other regions and river catchments and delivers standardized outputs important for reporting on the WFD. Thus, a standardized re-porting approach with comparable outputs could be established through using this service on a re-gional scale and aggregating to national or international scale. The usage of catchment areas as the regional entities instead of legislative borders leads to easy integration into WFD reporting schemes required from the European Commission. Also the integration of all important pathways into the modelling approach guarantees a holistic consideration of all possible nutrient inputs into river systems.
Document-No. ITD-0315-RP-0006-S3 Infoterra GmbH Version: 1.00 Date: 14.11.2003 Infoterra Page: 12 of 20
AquaSAGE: Water Abstraction Pressure by Irrigation
Products / Services Delivered Today The service consists in the provision of GIS based information reporting on the water abstraction pressure by irrigation in homogeneous hydrographical units of a catchment. It is made up of two products:
• A land cover map displaying irrigated crops. The first version of this product is presently available. It has a high-resolution and covers sub-catchment sectors. The second version will be a low-resolution product covering the complete catchment. It will be appropriate for most application cases of AquaSAGE. It will be available in France by the completion of SAGE (2004),
• A map of the irrigated surfaces combined with a map of the irrigation volumes per hydro-graphical unit. The irrigation volumes are computed for the year of the land cover and for a quinquennial and a decennial dry year.
These products have been generated for two pilot areas (System Neste, France and Flumen Irriga-tion Unit, Spain). They are to be delivered to national (e.g. National Environmental Institute) and regional (e.g. District Environmental Agencies, Water Catchment Agencies and Water Suppliers) every one or two years.
Methodology The high-resolution land cover results from a supervised classification based on the NDVI (Normal-ised Difference Vegetation Index) or on spectral bands (red, near infrared and middle infrared) (Landsat, SPOT). The images are acquired at key dates of the crops development. Inserting the land cover into a GIS software allows to generate the map of irrigated surfaces per hydrographical unit. A low-resolution version of this map will be produced from MERIS images. It is destined to re-place the high-resolution product due to the lower cost and higher availability of MERIS images.
The irrigation heights per hydrographical unit are computed from a model taking into account the plant water demand according to the FAO (Food and Agriculture Organisation of UNO) method, the precipitations and the soil water content (for France) or irrigation efficiency (for Spain). The soil characteristics and the irrigation efficiency are measured from ground surveys or calibrated from the water volumes invoiced by the water suppliers. Multiplying the map of irrigated surfaces by the irrigation heights provides the map of irrigation volumes per hydrographical unit.
Today´s Constraints The main constraint on this service is the availability of complete and accurate databases on the soil properties. It also depends on the availability of satellite images. The use of the low-resolution sensor MERIS will restrict this constraint.
Document-No. ITD-0315-RP-0006-S3 Infoterra GmbH Version: 1.00 Date: 14.11.2003 Infoterra Page: 13 of 20
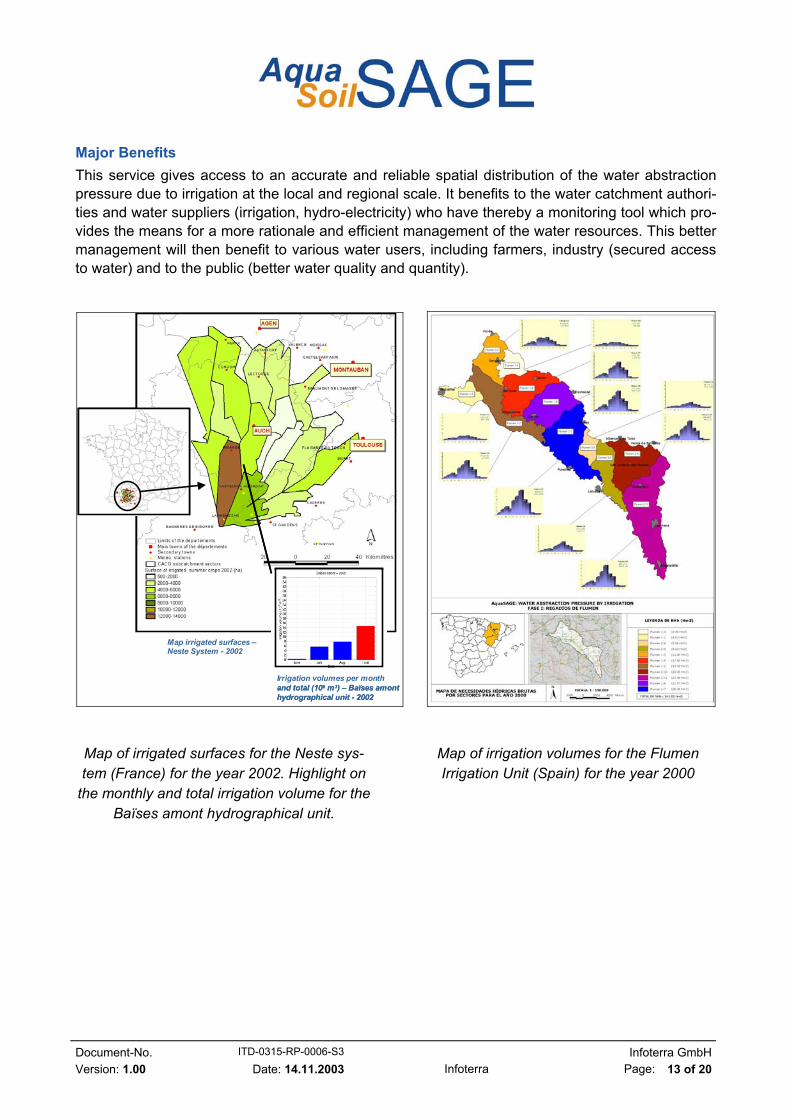
Major Benefits This service gives access to an accurate and reliable spatial distribution of the water abstraction pressure due to irrigation at the local and regional scale. It benefits to the water catchment authori-ties and water suppliers (irrigation, hydro-electricity) who have thereby a monitoring tool which pro-vides the means for a more rationale and efficient management of the water resources. This better management will then benefit to various water users, including farmers, industry (secured access to water) and to the public (better water quality and quantity).
Map irrigated surfaces –Neste System - 2002
Irrigation volumes per monthand total (106 m3) – Baïses amonthydrographical unit - 2002
Map irrigated surfaces –Neste System - 2002
Irrigation volumes per monthand total (106 m3) – Baïses amonthydrographical unit - 2002
Map of irrigated surfaces for the Neste sys-tem (France) for the year 2002. Highlight on
the monthly and total irrigation volume for the Baïses amont hydrographical unit.
Map of irrigation volumes for the Flumen Irrigation Unit (Spain) for the year 2000
Document-No. ITD-0315-RP-0006-S3 Infoterra GmbH Version: I1.00 Date: 14.11.2003 Infoterra Page: 14 of 20
Agri-environmental indicators
Products / Services Delivered Today
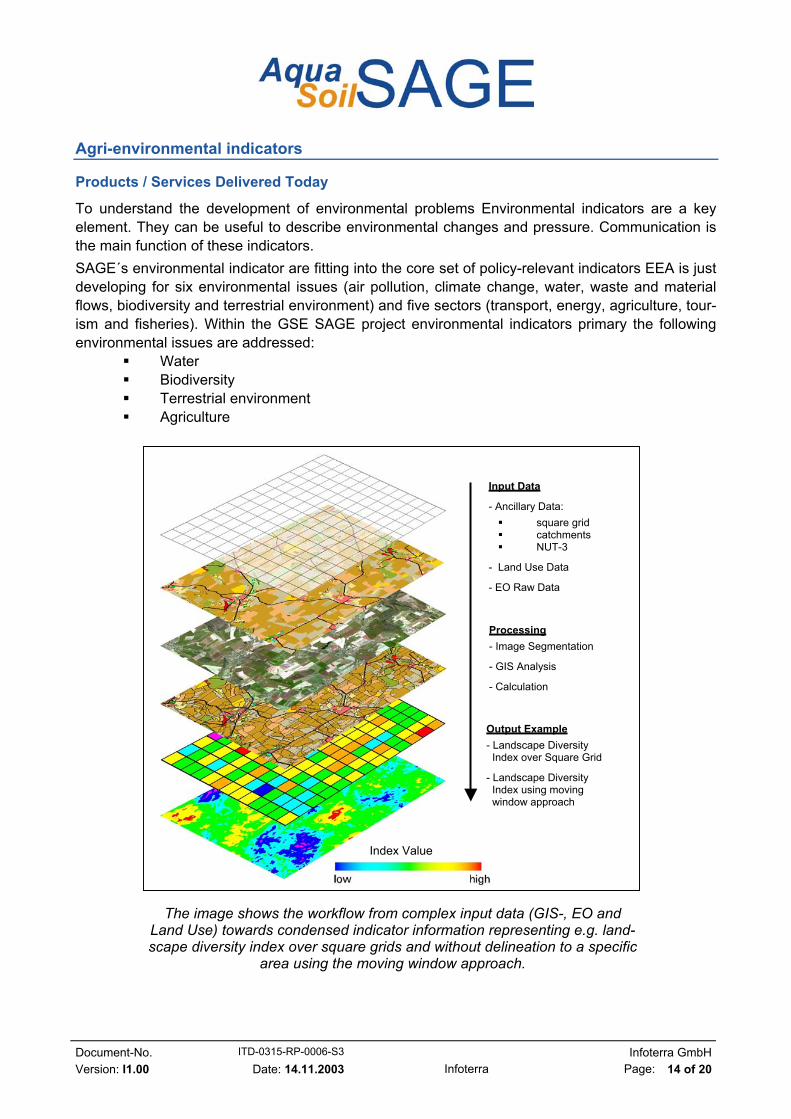
To understand the development of environmental problems Environmental indicators are a key element. They can be useful to describe environmental changes and pressure. Communication is the main function of these indicators. SAGE´s environmental indicator are fitting into the core set of policy-relevant indicators EEA is just developing for six environmental issues (air pollution, climate change, water, waste and material flows, biodiversity and terrestrial environment) and five sectors (transport, energy, agriculture, tour-ism and fisheries). Within the GSE SAGE project environmental indicators primary the following environmental issues are addressed:
Water Biodiversity Terrestrial environment Agriculture
The image shows the workflow from complex input data (GIS-, EO and Land Use) towards condensed indicator information representing e.g. land-scape diversity index over square grids and without delineation to a specific
area using the moving window approach.
Output Example - Landscape Diversity Index over Square Grid
- Landscape Diversity Index using moving window approach
Input Data
- Ancillary Data: square grid catchments NUT-3
- Land Use Data
- EO Raw Data
Processing - Image Segmentation
- GIS Analysis
- Calculation
Index Value
Document-No. ITD-0315-RP-0006-S3 Infoterra GmbH Version: I1.00 Date: 14.11.2003 Infoterra Page: 15 of 20
Finally the service provides a set of indicators providing indicator maps and statistical data over catchments, NUTS 3 areas as well as 1 x 1 km grid cells. Additionally the technique of “moving windows” allows the production of results without delineation of raster cells or administrative units. It addresses primarily EU- and national environmental agencies, agriculture and landscape plan-ning authorities, non-governmental environmental groups, planners, etc.
Methodology The products follow as far as applicable and reasonable the guide-lines and proposals of EEA and EUROSTAT and relevance is commonly assessed with reference to the Pressure/State/Response model (PSR) developed by OECD.
The basis for derivation of the selected environmental indicators are the CLC compatible generic land cover product (CSL-S-1) delivered from Infoterra and multi-temporal EO data. Using common of the shelf software (COTS) the indicators are derived via object-based image segmentation algo-rithms and GIS operations.
Today’s Constraints Most spatial environmental indicators are based on CORINE Landcover (CLC) data. However, CLC is not the universal tool and, on many occasions, CLC data needs to be improved regarding accuracy and to be supplemented with other data on land cover and land use to provide a sound and relevant source for the production of useful information. The scale of CLC (1:100 000) and the size of the smallest mapping unit (25 ha) restrict the sensitivity of the tool. The updating over an average period of 10 years is also a limitation. Particularly in areas changing at a high pace or in areas under stress (e.g. coastal zones, urban zones, protected zones) it is necessary to have a more detailed inventory in order to capture changes of a smaller magnitude and, as well, to have more frequent updating.
Major Benefits Environmental indicators over large areas in a comprehensive and standardised way allow com-parison between regions (i.e. catchments) with lower bias to detect non-natural changes. Because of this a quick reaction by policy makers and authorities on actual trends in the state of the envi-ronment (e.g. improvement versus degradation) is possible. The geometric resolution and the re-peat rate of CORINE land cover (10 years) is to low for accuracy and actual indicators. Therefore, the benefit of SAGE indicators are to give information about changes of smaller magnitudes and to have more frequent updating. Additionally the indicators are designed as follows that they fit to the core set of policy-relevant indicators EEA is just developing for six environmental issues.
Document-No. ITD-0315-RP-0006-S3 Infoterra GmbH Version: I1.00 Date: 14.11.2003 Infoterra Page: 16 of 20
Soil Sealing
Products / Services Delivered Today The SoilSAGE products/services are maps and statistics related to land consumption and soil seal-ing and its change during the 1990ies. SoilSAGE is about to deliver this information to a national (e.g. Federal Environment Agencies) and several regional users (e.g. Landesregierung Vorarl-berg). This has been done already for 1 pilot provinces in Austria at two scales (1:100.000 and 1:25.000), and two others will follow. The products are based on spaceborne EO data, aerial pho-tography, maps, and other ancillary data, such as demographic and zoning data, etc. The EO component serves to derive land cover and soil sealing data, where the land cover component ap-plies the CORINE LC nomenclature (level 1 and partly level 2/3).
A significantly improved LC (compared to CORINE in terms of minimum mapping unit 1ha and 0.25 ha, respectively) delivers a thematic accuracy of at least 95% for the artificial areas. The GIS com-ponent (including modelling approaches) of SoilSAGE co-analyses the EO derived results with an-cillary data. The results describe and quantify the amount of land consumption in relation to demo-graphic data, and assess the ecological and geophysical impact of soil sealing.
Methodology
Besides standard geometrical pre-processing steps the EO methodology is composed of a se-quence of methods of information extraction from the satellite data (SPOT, ERS, Landsat), i.e. automated image classification techniques, visual refinement of the classification results for correc-tion and class refinement, and vegetation index based derivation of the degree of soil sealing. An intrinsic component of the methodology is the validation of the thematic results via aerial photogra-phy. Subsequently the LC products serve to generate secondary products via GIS analysis and models along with demographic and geo-spatial data, such as land use zoning data.
Today’s Constraints Today’s major constraints are EO data availability, missing thematic and geometric standards of the products, and the new characteristics of the provided information. Many users are not familiar with satellite derived products or may not accept them due to their lower geometric precision than that of aerial photography and cadastral or land use zoning based information (with lower thematic accuracy) they are currently using.
Major Benefits Major benefits arise from the consistency, timeliness, the spatial coverage, and from the localised nature of EO derived information on land consumption as opposed to the aggregated nature of the existent information. The latter allows for a spatial co-analysis of EO data and other geospatial data, which in turn enables localised impact assessment of land consumption and soil sealing as needed in many applications of spatial planning.
Document-No. ITD-0315-RP-0006-S3 Infoterra GmbH Version: I1.00 Date: 14.11.2003 Infoterra Page: 17 of 20
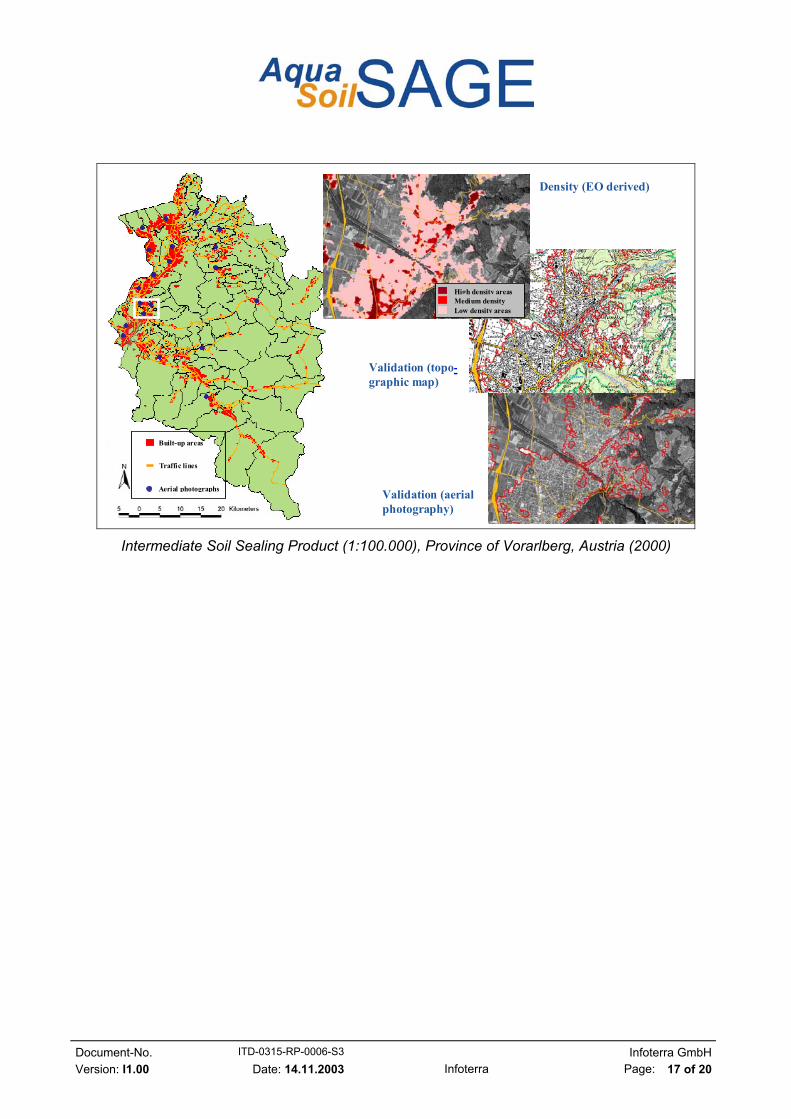
Built-up areas
Traffic lines
Aerial photographs
Validation (topo-graphic map)
Validation (aerial photography)
Medium density High density areas
Low density areas
Density (EO derived)
Intermediate Soil Sealing Product (1:100.000), Province of Vorarlberg, Austria (2000)
Document-No. ITD-0315-RP-0006-S3 Infoterra GmbH Version: I1.00 Date: 14.11.2003 Infoterra Page: 18 of 20
AquaSAGE AND SoilSAGE SERVICES IN THE NEXT 2 TO 5 YEARS SAGE will be based on existing European service networks to assure harmonised reporting to European bodies (e.g. EEA, DG ENV) and to support in addition national up to regional require-ments from member states. The fragmented and money strapped service provider scene (repre-sented here by the SAGE team and comparable partnerships established by Infoterra) is ready to build a strong Open Service Partnership within the GMES service implementation process driven by EC, ESA and member states.
The Open Service Concept envisaged will assure that the key issues for SAGE´s success can be addressed; i.e.:
• Reliability: by establishing user-accepted standards for thematic content and accuracy and service providers committed to a GMES approved quality production process. This implies regulatory frameworks, like the Reporting Directive and accepted EO based products.
• Affordability: by emphasising centralisation where necessary and appropriate in order to achieve a standardized approach and by establishing flexible, modular production and de-livery chains. This way, a lot of image processing and interpretation work can be carried out more effectively (i.e. faster, cheaper and much more standardised) and harmonised than with current project based approaches. However, it is recognised as well that any central-ised data analysis approach has to stop at a certain stage, in order to address specific na-tional, regional, ecological, or socio-economical conditions effectively. This is reflected in SAGE by late customising along the processing chain (i.e. from core services towards final products).
• Availability: by integrated value chains with open interfaces (w.r.t. INSPIRE, OGC, Report-ing Directive) and multi-mission / multi-sensor approaches to allow for continuous data streams and maximal flexibility.
• Sustainability: by networking and production at European level to assure continuous work load and economic feasibility through serving several markets and market segments.
The schedule for the service roll-out permits flexible up-scaling from single projects via partner networks (allowing the specialisation of partners) up to centralised core services linked to special-ised value adders in a maturing market.
The pre-condition of approved and sustainable GMES services for land applications will be as-sured via open data access to multi-mission EO data. Of similar importance is the open market ac-cess which allows all stake holders to step in or out at any time under commercial conditions.
Document-No. ITD-0315-RP-0006-S3 Infoterra GmbH Version: I1.00 Date: 14.11.2003 Infoterra Page: 19 of 20
THE SAGE USER GROUP
European Environment Agency
Chris Steenmans Kongens Nytorv 6 Copenhagen K 1050 Denmark P: +45 333 67151 F: +45 333 67 116 Chris.Steenmans @eea.eu.int
ETC Terrestrial Envi-ronment
Stefan Kleeschulte Torre C5-S, 4th floor E-08193 Bellaterra Barcelona, Spain P: +34 935 81 3549 F: +34 935 81 3545 Stefan.Kleeschulte @uab.es
Swedish Environmental Protection Agency
Jannica Häggbom Blekholmsterrassen 36 S-106 48 Stockholm Sweden P: +46 8 698 1000 F: +46 8 202 925 Jannica.Haggbom @naturvardsverket.se
County Administration Board of Dalarna
Hans Olofsson Länsstyrelsen I Dalarnas län SE-791 84 Falun Sweden P: +46 23 81242 F: +46 23 81118 [email protected]
Federal Environment Agency Austria
Gebhard Banko Spittolauer Laende 5 1090 Vienna Austria P: +43 131 3040 F: +43 131 3045400 [email protected]
Amt der Vorarlberger Landesregierung
Johannes Kanonier Abt. VIIa/VoGIS Landhaus 6901 Bregenz, Austria P: +43 5574 5110 F: +43 5574 51180 johannes.kanonier @vlr.gv.at
Umweltbundesamt
Birgit Mohaupt-Jahr Bismarckplatz 1 Postfach 33 00 22 14191 Berlin Germany P: +49 30 890 32751 F: +49 30 890 32907 [email protected]
Landesanstalt für Wald u. Forstwirtschaft
Sergej Chmara Jägerstr. 1 99867 Gotha Germany P: +49 3621 225 331 F: +49 3621 225 222 Chmara @forst.thueringen.de
Institut Francais de l´Environment
Francis Bertrand Department des Milieux et des Territoires 61, bd Alexandre Martin 45058 Orléans Cedex 1 France P: +33 238 797 878 F: +33 238 797 870 [email protected]
Management of Hydrau-lic Public Dominion
Confederación Hidro-gráfica del Ebro D.J. Iñigo Hereza Do-mínguez Paseo de Sagasta, 24-28 50071 Zaragoza, Spain Phone: +34 976 22 19 93 E-mail: ihereza @chebro.es
Document-No. ITD-0315-RP-0006-S3 Infoterra GmbH Version: I1.00 Date: 14.11.2003 Infoterra Page: 20 of 20
THE SAGE CONSORTIUM
Service Providers Astrium SAS Phillipe Duthil Ground Systems, Applications & Services 31, Av. des Cosmonautes 31402 Toulouse Cedex 4 France P: +33 562 19 64 23 F: +33 562 19 97 81 phillipe.duthil @astrium.eads.net GAF AG Dr. Tobias Wever Arnulfstr. 197 80634 Muenchen Germany P: +49 89 121 528 60 F: +49 89 121 528 79 [email protected] Geoville Informations-systeme & Datenver-arbeitung GmbH Dr. Christian Hoffmann Museumstraße 9-11 A-6020 Innsbruck, Austria P: +43 512 56 202 10 F: +43 512 56 202 122 [email protected] Infoterra GmbH Dr. Steffen Kuntz 88039 Friedrichshafen Germany P: +49 7545 8 9969 F: +49 7545 8 1337 steffen.kuntz @infoterra-global.com National Land Survey, Metria Miljöanalys Kerstin Nordström P.O. Box 24154 SE-104 51 Stockholm Sweden P: +46 8 579 972 74 F: +46 8 579 972 80 [email protected] TRAGSATEC Javier Fernández Casals Dpto. Teledetección C/ Conde de Peñalver 84, 2 C 28006 Madrid, Spain T: +34 91 396 90 61 [email protected]
Research Partners ALTERRA Dr. Bob Su P.O. Box 47 6700 AA Waageningen, Netherlands P: +31 317 47 4509 F: +31 317 41 9000 [email protected] ARC Seibersdorf Research Dr. Gerhard Triebning Space Applications Division 2444 Seibersdorf, Austria P: +43 50550 2020 F: +43 50550 2010 gerhard.triebnig @arcs.ac.at Ing.büro Dr. Feldwisch Dr. Norbert Feldwisch Hindenburgplatz 1 51429 Bergisch Gladbach P: +49 2204-4228-50 F: +49 2204-4228-51 [email protected] Institut für Landwirtschaftl. Betriebslehre Universität Hohenheim Priv-Doz Sylvia Herrmann Schloss Osthof Süd 70593 StuttgartGermany T: +49 711 459 2543 F: +49 711 459 2555 [email protected] Mediterranean Agronomic Institute of Chania Dr. Ioannis Gitas Alsyllion Agrokepion, (P.O. Box 85) 73100 Chania, Crete-Greece P: +30 28210 81151 F: +30 28210 811 580 [email protected] Swedish University of Agri-cultural Science Prof. Bo Ranneby Centre of Biostochastics SE- 901 83 Umeå Sweden T: +46 90 786 59 19 F: +46 90 786 60 73 bo.ranneby @sekon.slu.se
Swedish University of Agricultural Science Ass. Prof. Stefan Löfgren Dept. of Env. Assessment P.O. Box 7050 SE-750 07 Uppsala, Sweden T: +46 18 673128 F: +46 18 673156 [email protected] Vienna University of Technology Univ. Prof. Dipl.-Ing. Dr. techn. Wolfgang Wagner Institute of Photogrammetry & Remote Sensing Gusshausstrasse 27-29 1040 Vienna, Austria P: +43 1 58801 12225 F: +43 1 58801 12299 wolfgang.wagner+e122 @tuwien.ac.at System Developers Astrium GmbH Axel Kopsch 88039 Friedrichshafen Germany P: +49 7545 8 3471 F: +49 7545 8 4105 axel.kopsch @astrium.eads.net DLR Oberpfaffenhofen Erhard Diedrich 82234 Wessling, Germany P: +49 8153 28 2658 F: +49 8153 28 1448 [email protected] Consultants ECOLOGIC Tanja Dräger Pfalzburger Strasse 43/44 10717 Berlin, Germany P: +49 30 86880105 F: +49 30 86880 100 [email protected] ECORYS Transport – NEI Robert Piers P.O. BOX 4175 3006 AD Rotterdam, The Netherlands P: +31 10 4538606 F: +31 10 4523680 [email protected]
Strategic Group JRC – IES Jean Meyer-Roux I-21020 Ispra, Italy P: +39 03 337 89514 F: +39 03 327 85230 [email protected] EEA Chris Steenmans Kongens Nytorv 6 1050 Copenhagen K, Den-mark P: +45 333 67 116 F: +45 333 67 151 chris.steenmans @eea.eu.int Bundesministerium für Um-welt, Naturschutz und Reak-torsicherheit Dr. Hartmut Streuff Heinrich-v-Stephan-Str. 1 53175 Bonn, Germany P: +49 1888 3052180 F: +49 1888 3053972 hartmut.streuff @bmu.bund.de