Embed Size (px)
Citation preview
Sage Group plc Preliminary Results for the year ending 30 September 2015
Stephen KellyChief Executive Officer
Agenda:
• Executive summary
• CFO review of the year
• Progress
• Outlook
• Q&A
1
The following presentation is being made only to, and is only directed at, persons to whom such presentation may lawfully be communicated (“relevant persons”). Any person who is not a relevant person should not act or rely on this presentation or any of its contents. Information in the following presentation relating to the price at which relevant investments have been bought or sold in the past or the yield on such investments cannot be relied upon as a guide to the future performance of such investments.
• This presentation does not constitute an offering of securities or otherwise constitute an invitation or inducement to any person to underwrite, subscribe for or otherwise acquire securities in The Sage Group plc (the “Company”) or any company which is a subsidiary of the Company.
• The release, publication, distribution or this presentation in certain jurisdictions may be restricted by law, and therefore persons in such jurisdictions into which this presentation is released, published or distributed should inform themselves about, and observe, such restrictions.
• Certain statements contained in this presentation constitute forward-looking statements. All statements other than statements of historical facts included in this presentation, including, without limitation, those regarding the Company’s financial condition, business strategy, plans and objectives, are forward-looking statements. These forward-looking statements can be identified by the use of forward-looking terminology, including the terms “believes”, “estimates”, “anticipates”, “expects”, “intends”, “may”, “will”, or “should” or, in each case, their negative or other variations or comparable terminology. Such forward-looking statements involve known and unknown risks, uncertainties and other factors, which may cause the actual results, performance or achievements of
the Company, or industry results, to be materially different from any future results, performance or achievements expressed or implied by such forward-looking statements. Such forward-looking statements are based on numerous assumptions regarding the Company’s present and future business strategies and the environment in which the Company will operate in the future. Such risks, uncertainties and other factors include, among others: Inherent difficulty in predicting customer behaviour; customers may not respond as we expected to our sales and marketing activities; the competitive environment; our ability to adapt to technological change; business interruption or failure of our systems architecture and communication systems; problems with implementing upgrades to our applications and supporting information technology infrastructure; any failure to properly use and protect personal customer information and data; our ability to manage and maintain third party business partnerships; increased regulation of our businesses; any failure to process transactions effectively; any failure to adequately protect against potential fraudulent activities; any significant quality problems or delays; the global macro-economic environment; our inability to attract, retain and develop talented people; our ability to repurchase shares; our inability to adequately protect our intellectual property rights; disruptions, expenses and risks associated with any acquisitions and divestitures; amortisation of acquired intangible assets and impairment charges; our use of debt to finance acquisitions or other activities; and the cost of, and potential adverse results in, litigation involving intellectual property, competition authority, shareholder and other matters. These forward-looking statements speak only as at the date of this presentation. Except as required by the Financial Conduct Authority, or by law, the Company does not undertake any obligation to update or revise publicly any forward-looking statement, whether as a result of new information, future events, or otherwise.
Safe harbor statement
2
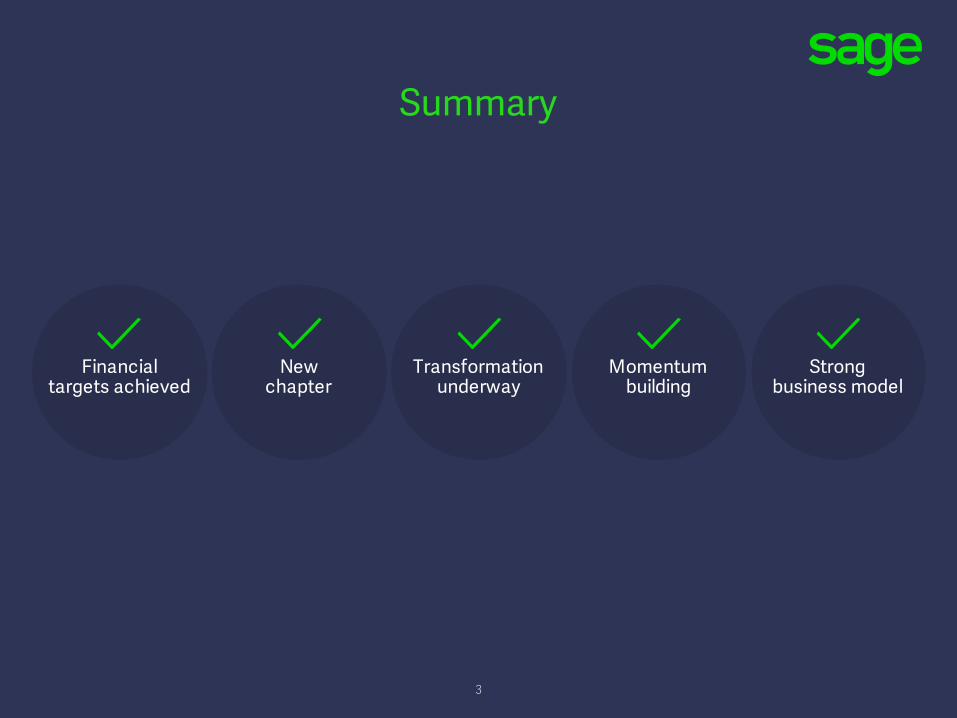
Financial targets achieved
Newchapter
Transformation underway
Momentumbuilding
Strongbusiness model
Summary
3
Steve HareChief Financial Officer
4
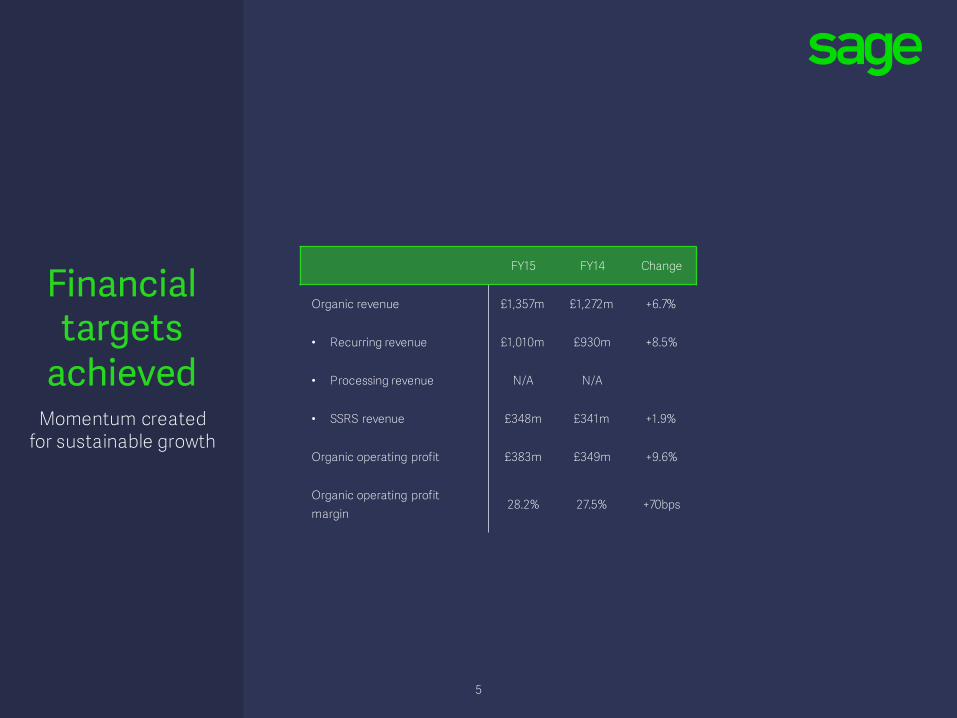
FY15 FY14 Change
Organic revenue £1,357m £1,272m +6.7%
• Recurring revenue £1,010m £930m +8.5%
• Processing revenue N/A N/A
• SSRS revenue £348m £341m +1.9%
Organic operating profit £383m £349m +9.6%
Organic operating profit margin
28.2% 27.5% +70bps
Financial targets
achievedMomentum created
for sustainable growth
5
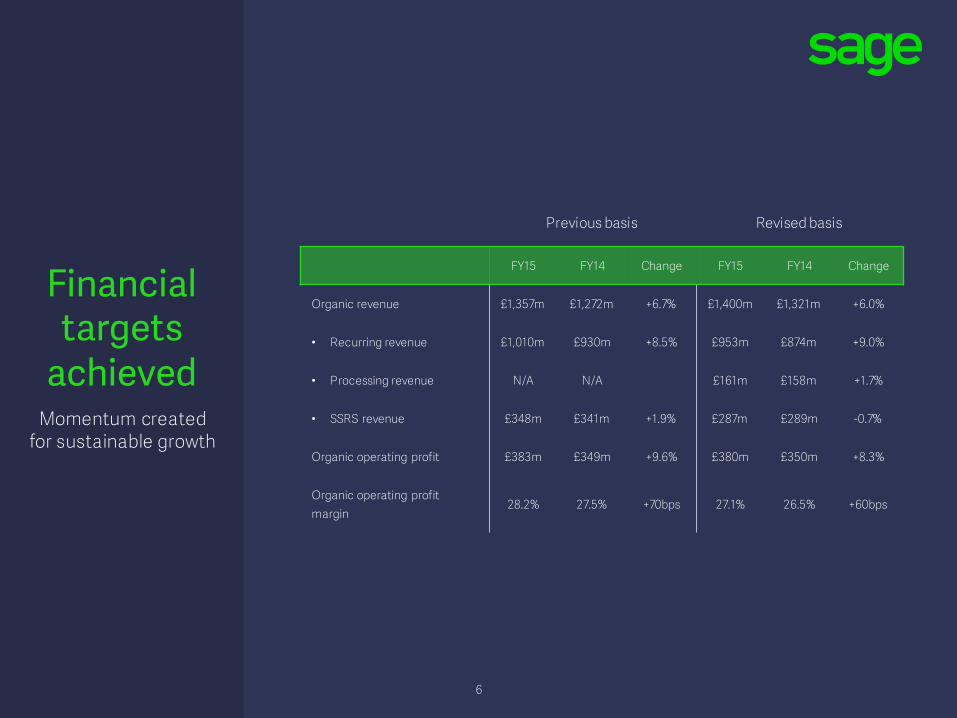
FY15 FY14 Change FY15 FY14 Change
Organic revenue £1,357m £1,272m +6.7% £1,400m £1,321m +6.0%
• Recurring revenue £1,010m £930m +8.5% £953m £874m +9.0%
• Processing revenue N/A N/A £161m £158m +1.7%
• SSRS revenue £348m £341m +1.9% £287m £289m -0.7%
Organic operating profit £383m £349m +9.6% £380m £350m +8.3%
Organic operating profit margin
28.2% 27.5% +70bps 27.1% 26.5% +60bps
Previous basis Revised basis
Financial targets
achievedMomentum created
for sustainable growth
6
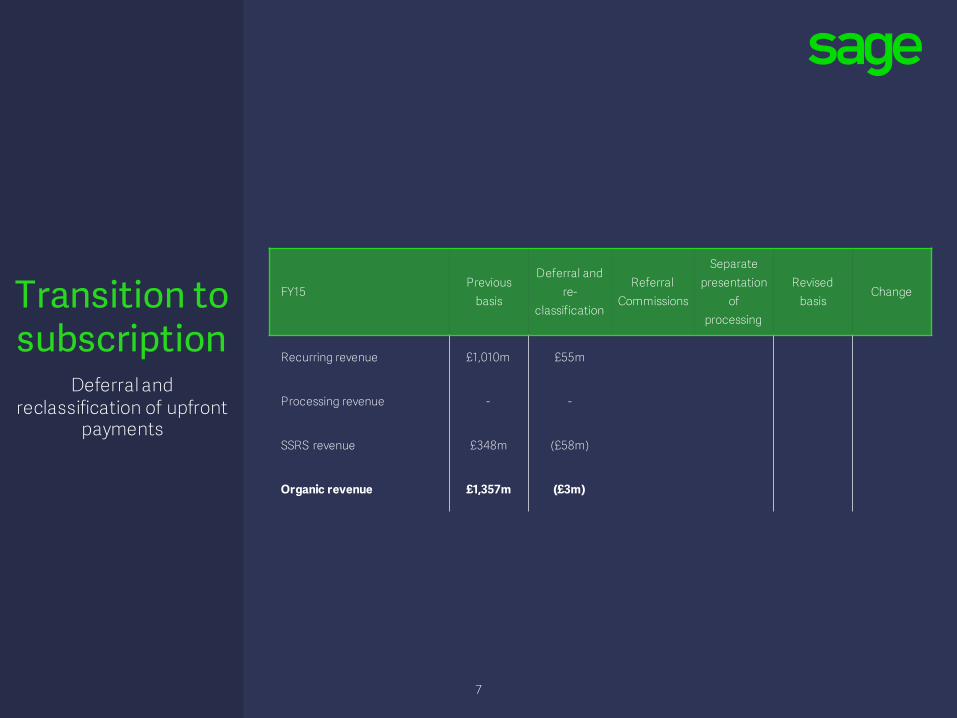
FY15Previous
basis
Deferral and re-
classification
ReferralCommissions
Separate presentation
of processing
Revised basis
Change
Recurring revenue £1,010m £55m
Processing revenue - -
SSRS revenue £348m (£58m)
Organic revenue £1,357m (£3m)
Transition to subscription
Deferral and reclassification of upfront
payments
7
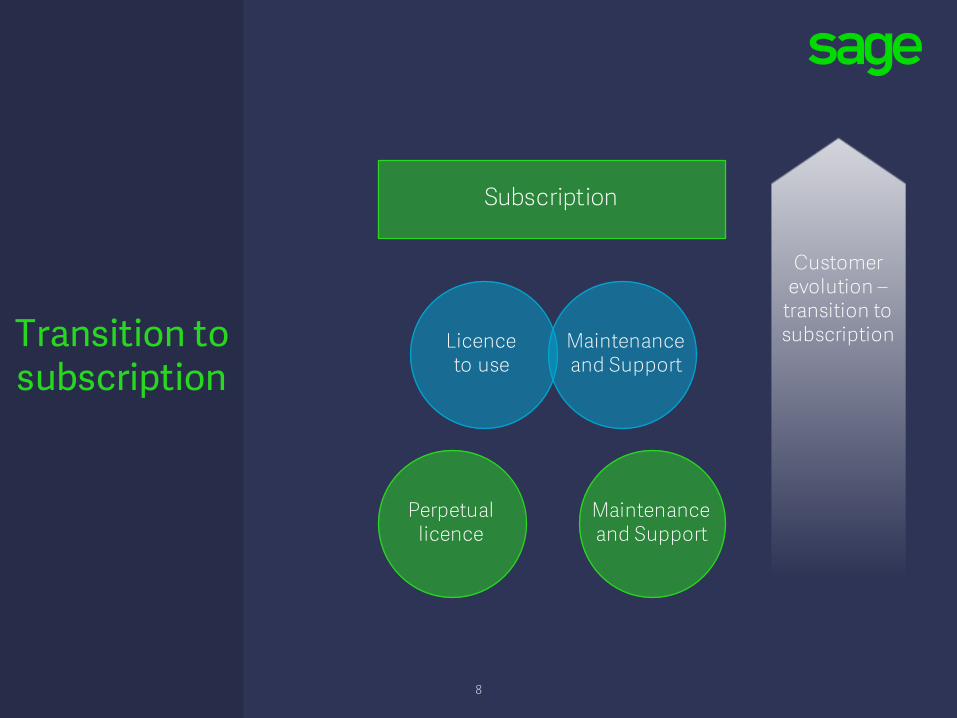
Transition to subscription
Perpetual licence
Maintenance and Support
Licenceto use
Maintenance and Support
Customer evolution –
transition to subscription
Subscription
8
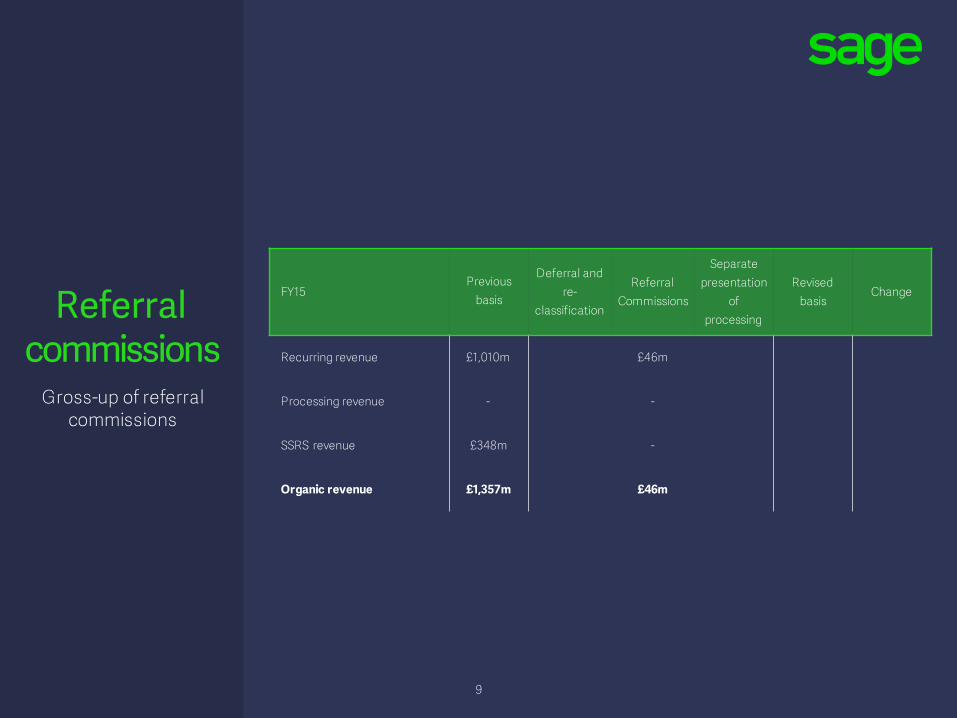
FY15Previous
basis
Deferral and re-
classification
ReferralCommissions
Separate presentation
of processing
Revised basis
Change
Recurring revenue £1,010m £46m
Processing revenue - -
SSRS revenue £348m -
Organic revenue £1,357m £46m
Referral commissions
Gross-up of referral commissions
9
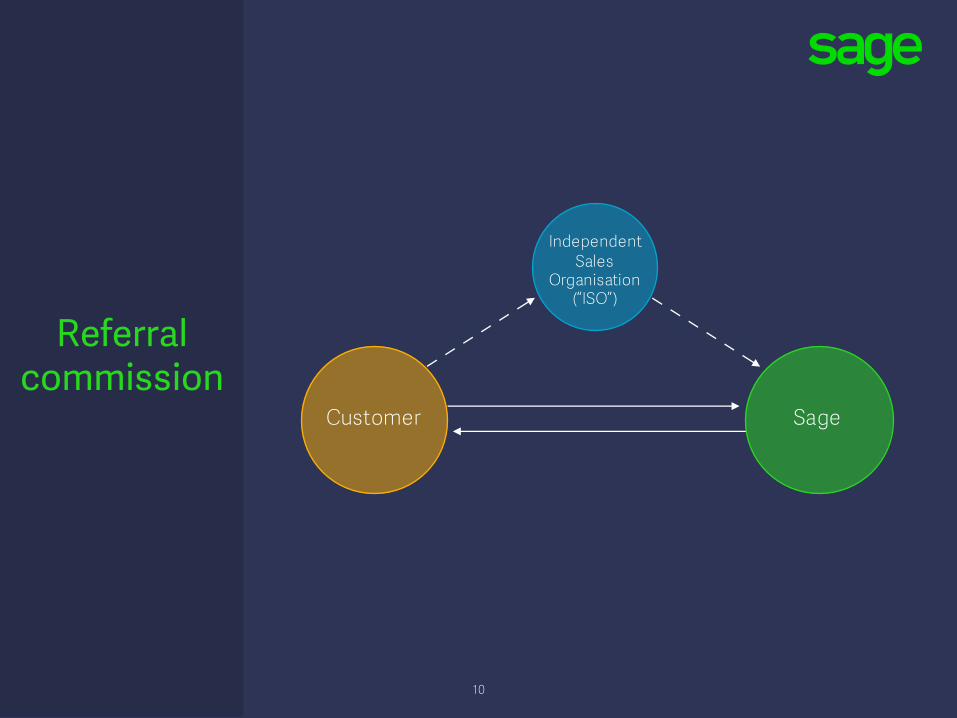
Referral commission
Customer
Independent Sales
Organisation (“ISO”)
Sage
10
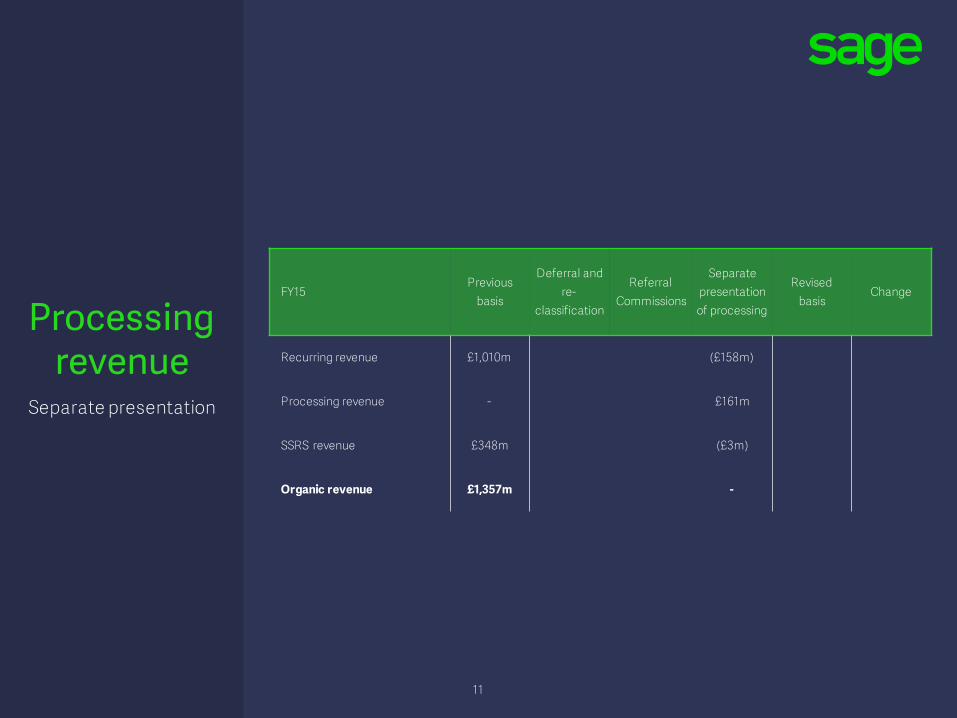
Processing revenue
Separate presentation
FY15Previous
basis
Deferral and re-
classification
ReferralCommissions
Separate presentation of processing
Revised basis
Change
Recurring revenue £1,010m (£158m)
Processing revenue - £161m
SSRS revenue £348m (£3m)
Organic revenue £1,357m -
11
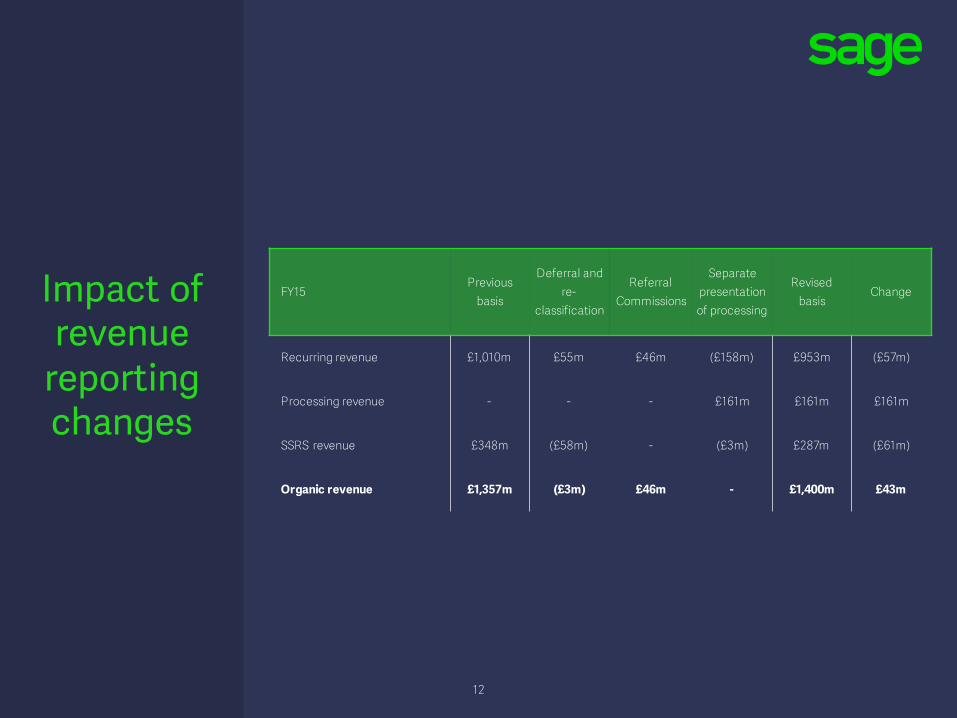
Impact of revenue
reporting changes
FY15Previous
basis
Deferral and re-
classification
ReferralCommissions
Separate presentation of processing
Revised basis
Change
Recurring revenue £1,010m £55m £46m (£158m) £953m (£57m)
Processing revenue - - - £161m £161m £161m
SSRS revenue £348m (£58m) - (£3m) £287m (£61m)
Organic revenue £1,357m (£3m) £46m - £1,400m £43m
12
FY15 FY14 Change FY15 FY14 Change
Organic revenue £1,357m £1,272m +6.7% £1,400m £1,321m +6.0%
• Recurring revenue £1,010m £930m +8.5% £953m £874m +9.0%
• Processing revenue N/A N/A £161m £158m +1.7%
• SSRS revenue £348m £341m +1.9% £287m £289m -0.7%
Organic operating profit £383m £349m +9.6% £380m £350m +8.3%
Organic operating profit margin 28.2% 27.5% +70bps 27.1% 26.5% +60bps
Previous basis Revised basis
Financial targets
achievedMomentum created
for sustainable growth
13
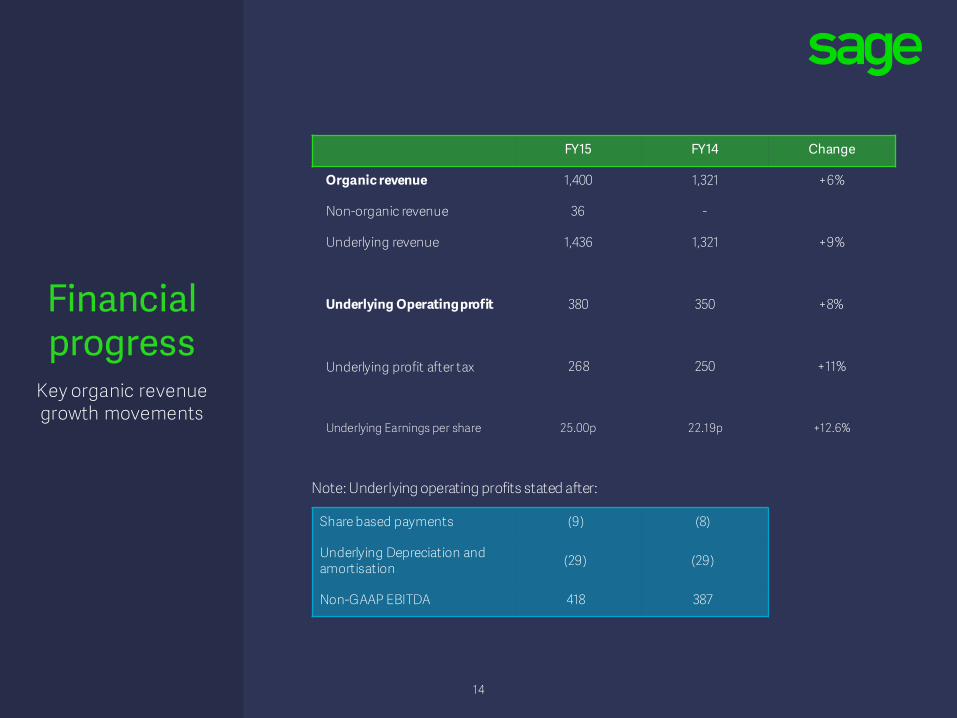
Financial progress
FY15 FY14 Change
Organic revenue 1,400 1,321 +6%
Non-organic revenue 36 -
Underlying revenue 1,436 1,321 +9%
Underlying Operating profit 380 350 +8%
Underlying profit after tax 268 250 +11%
Underlying Earnings per share 25.00p 22.19p +12.6%
Share based payments (9) (8)
Underlying Depreciation and amortisation (29) (29)
Non-GAAP EBITDA 418 387
Key organic revenuegrowth movements
Note: Underlying operating profits stated after:
14
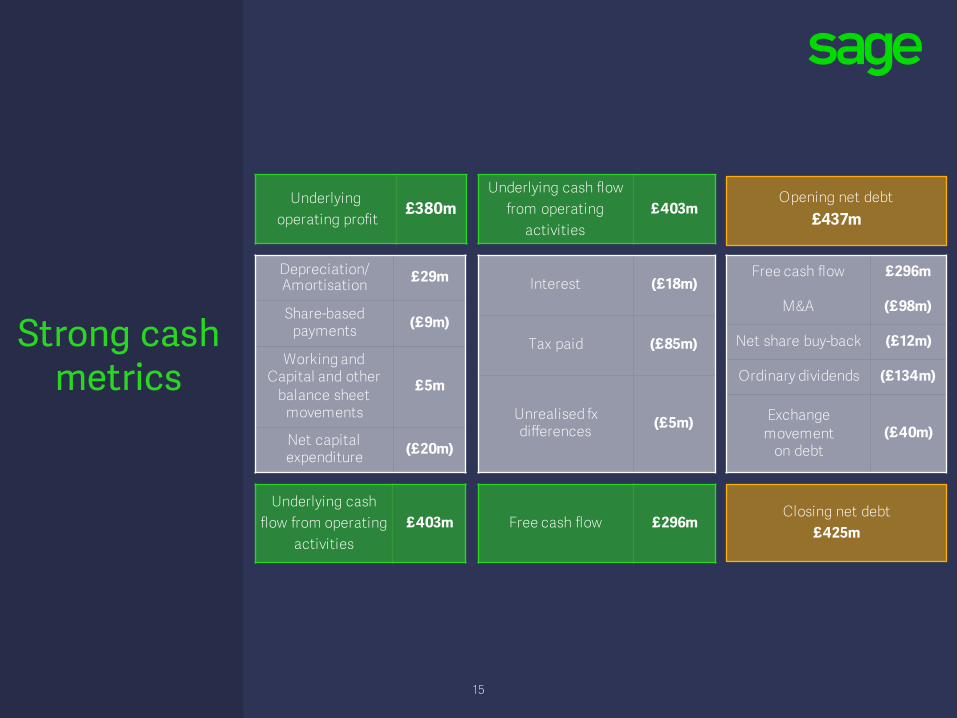
Strong cash metrics
Free cash flow £296m
M&A (£98m)
Net share buy-back (£12m)
Ordinary dividends (£134m)
Exchangemovement
on debt(£40m)
Closing net debt£425m
Opening net debt£437m
Underlyingoperating profit
£380mUnderlying cash flow
from operating activities
£403m
Free cash flow £296mUnderlying cash
flow from operating activities
£403m
Interest (£18m)
Tax paid (£85m)
Unrealised fxdifferences (£5m)
Depreciation/Amortisation £29m
Share-basedpayments (£9m)
Working and Capital and other
balance sheet movements
£5m
Net capital expenditure (£20m)
15
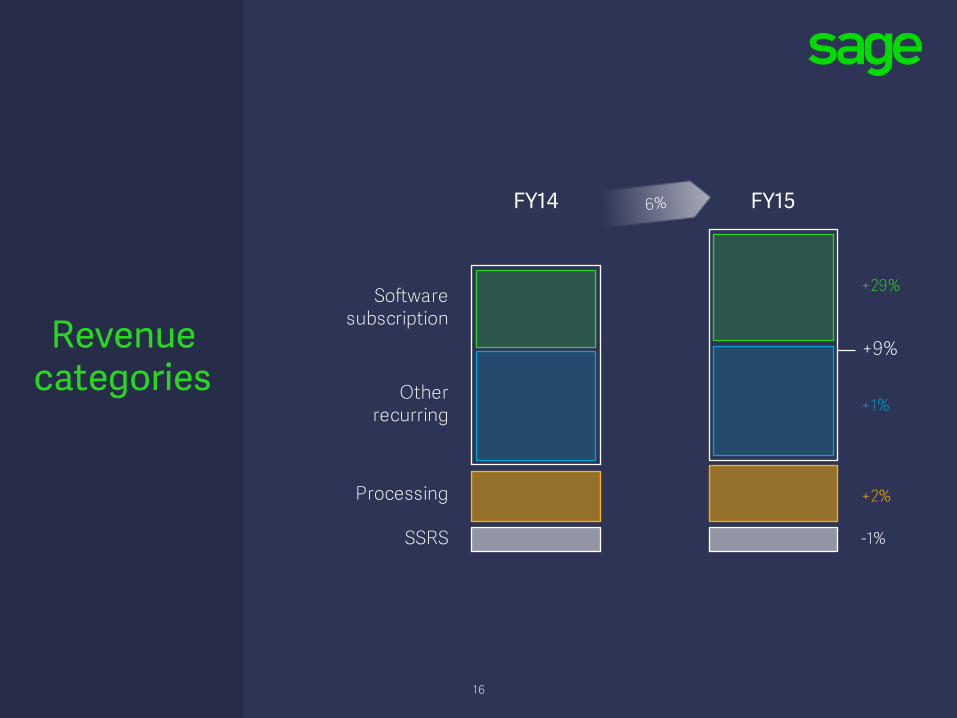
Revenue categories
+29%
+1%
+9%
+2%
-1%
FY15
Other recurring
Processing
SSRS
FY14
Softwaresubscription
16
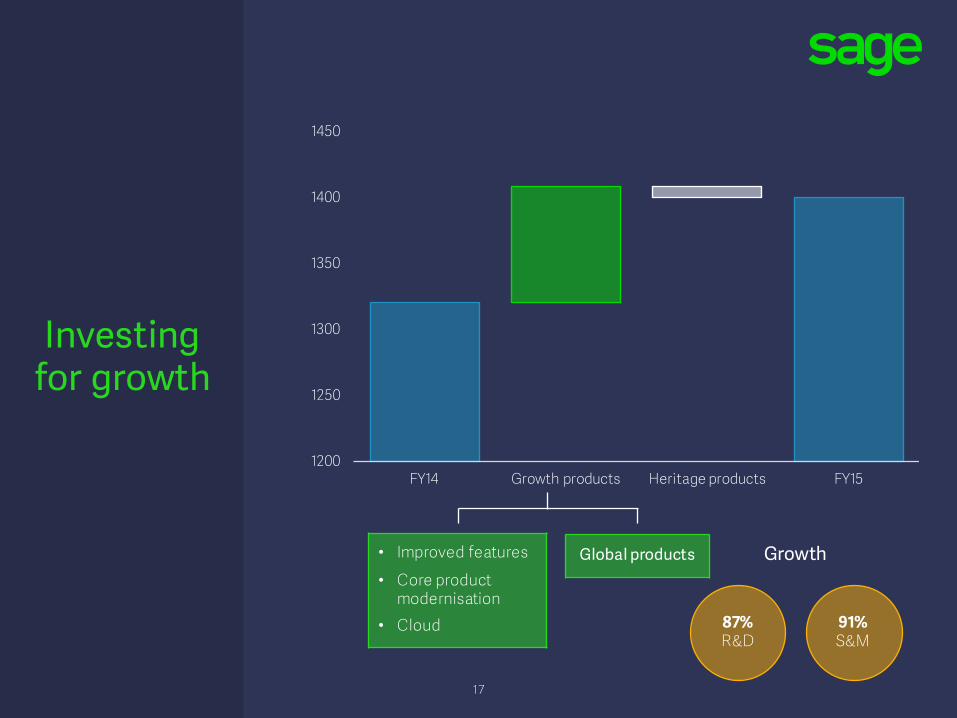
Investing for growth
• Improved features
• Core product modernisation
• Cloud
Global products
87%R&D
91%S&M
Growth
1200
1250
1300
1350
1400
1450
FY14 Growth products Heritage products FY15
17
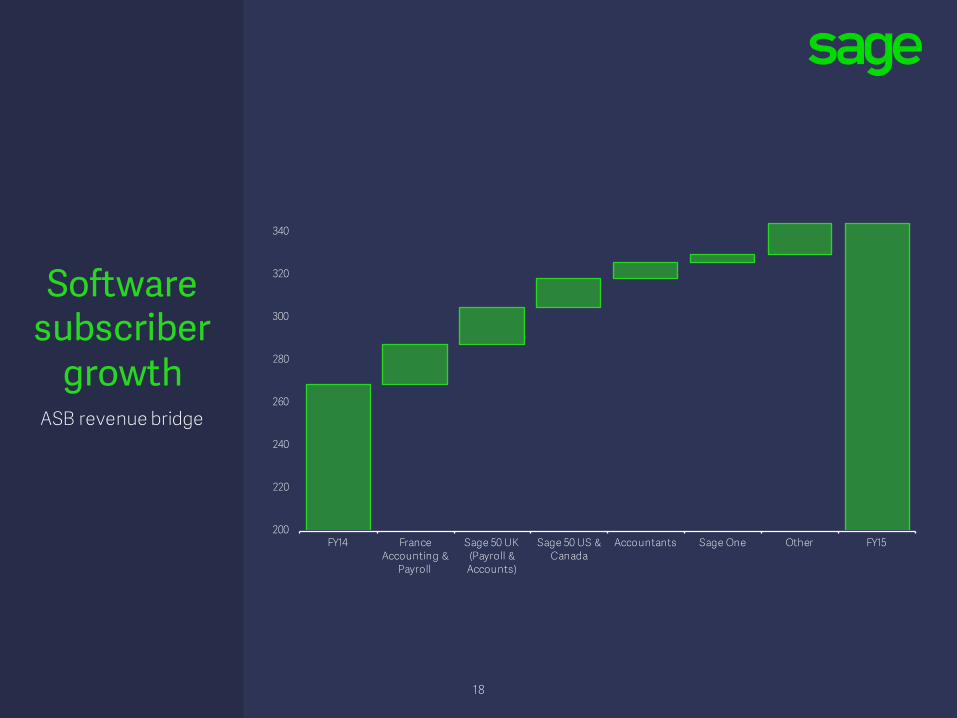
Software subscriber
growthASB revenue bridge
200
220
240
260
280
300
320
340
FY14 France Accounting &
Payroll
Sage 50 UK (Payroll &
Accounts)
Sage 50 US & Canada
Accountants Sage One Other FY15
18
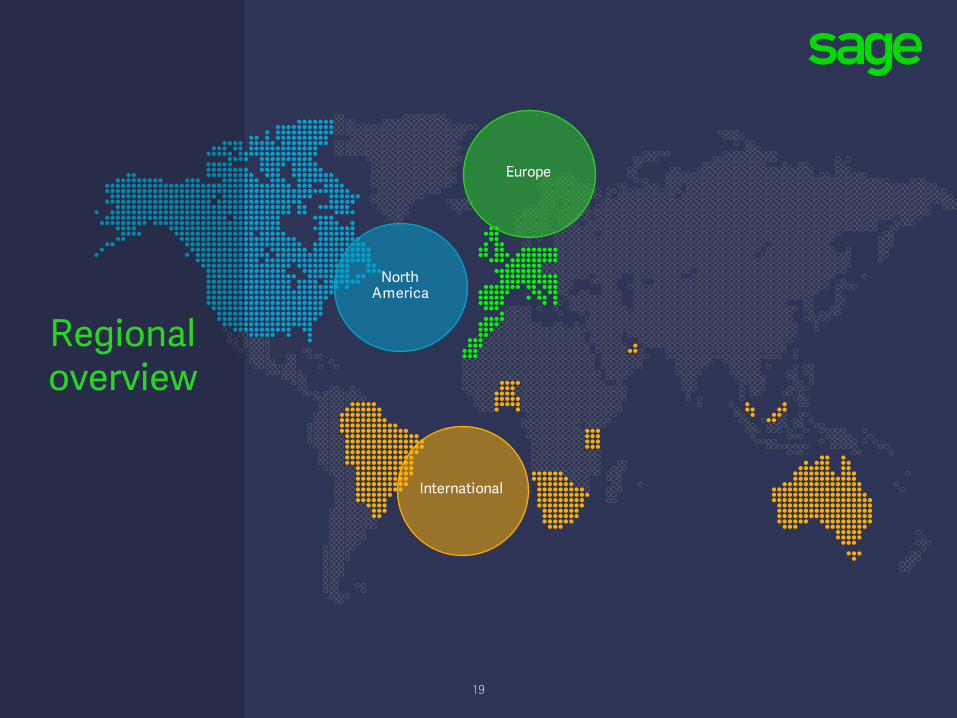
Europe
North America
International
Regional overview
19
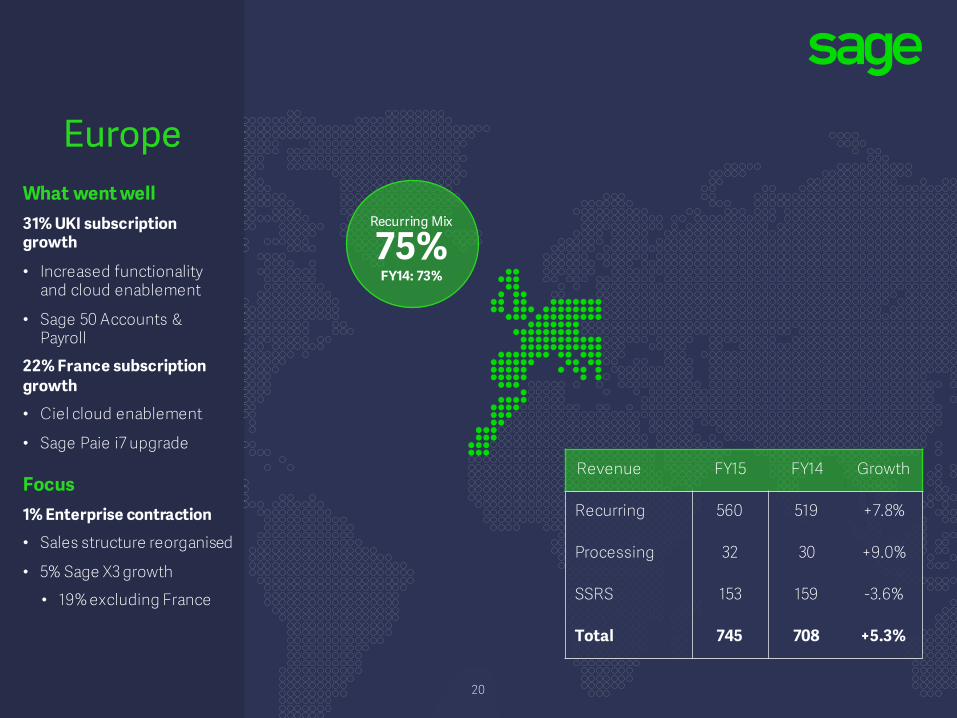
Europe
Revenue FY15 FY14 Growth
Recurring 560 519 +7.8%
Processing 32 30 +9.0%
SSRS 153 159 -3.6%
Total 745 708 +5.3%
What went well31% UKI subscription growth
• Increased functionality and cloud enablement
• Sage 50 Accounts & Payroll
22% France subscription growth
• Ciel cloud enablement
• Sage Paie i7 upgrade
Focus1% Enterprise contraction
• Sales structure reorganised
• 5% Sage X3 growth
• 19% excluding France
Recurring Mix
75%FY14: 73%
20
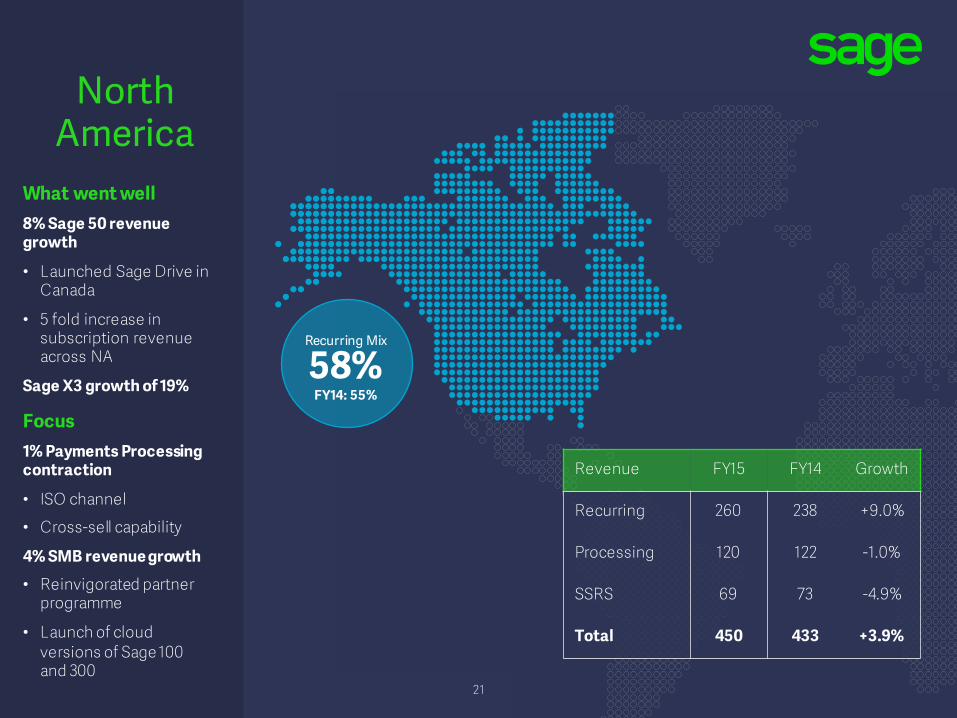
North America
What went well8% Sage 50 revenue growth
• Launched Sage Drive in Canada
• 5 fold increase in subscription revenue across NA
Sage X3 growth of 19%
Focus1% Payments Processing contraction
• ISO channel
• Cross-sell capability
4% SMB revenue growth
• Reinvigorated partner programme
• Launch of cloud versions of Sage 100 and 300
Revenue FY15 FY14 Growth
Recurring 260 238 +9.0%
Processing 120 122 -1.0%
SSRS 69 73 -4.9%
Total 450 433 +3.9%
Recurring Mix
58%FY14: 55%
21
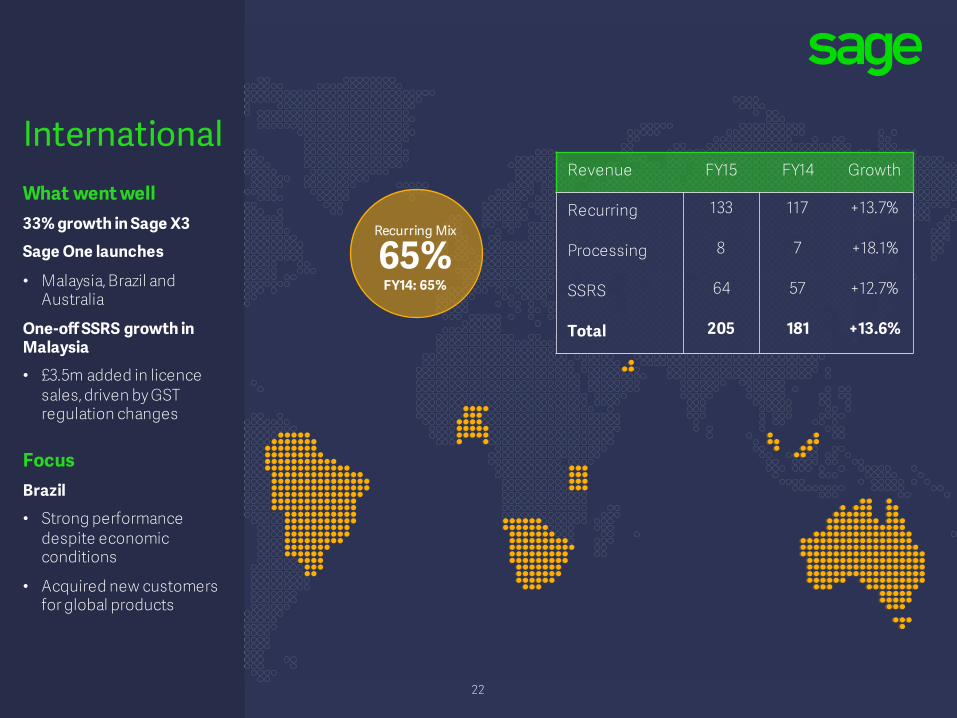
What went well33% growth in Sage X3
Sage One launches
• Malaysia, Brazil and Australia
One-off SSRS growth in Malaysia
• £3.5m added in licence sales, driven by GST regulation changes
Focus Brazil
• Strong performance despite economic conditions
• Acquired new customers for global products
InternationalRevenue FY15 FY14 Growth
Recurring 133 117 +13.7%
Processing 8 7 +18.1%
SSRS 64 57 +12.7%
Total 205 181 +13.6%
Recurring Mix
65%FY14: 65%
22
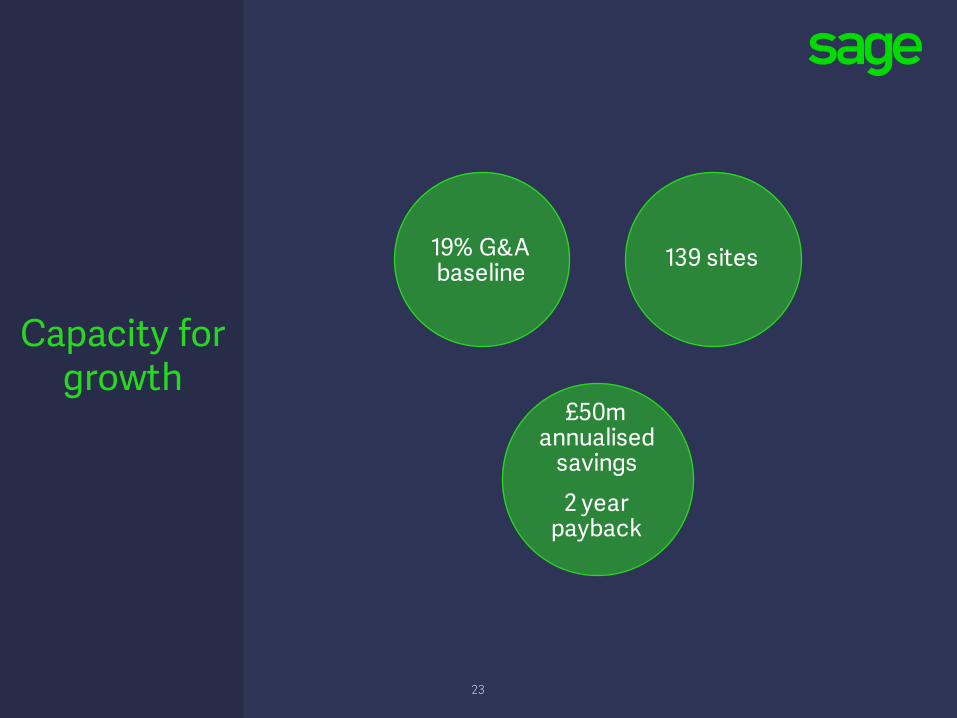
Capacity for growth
19% G&Abaseline 139 sites
£50m annualised
savings2 year
payback
23
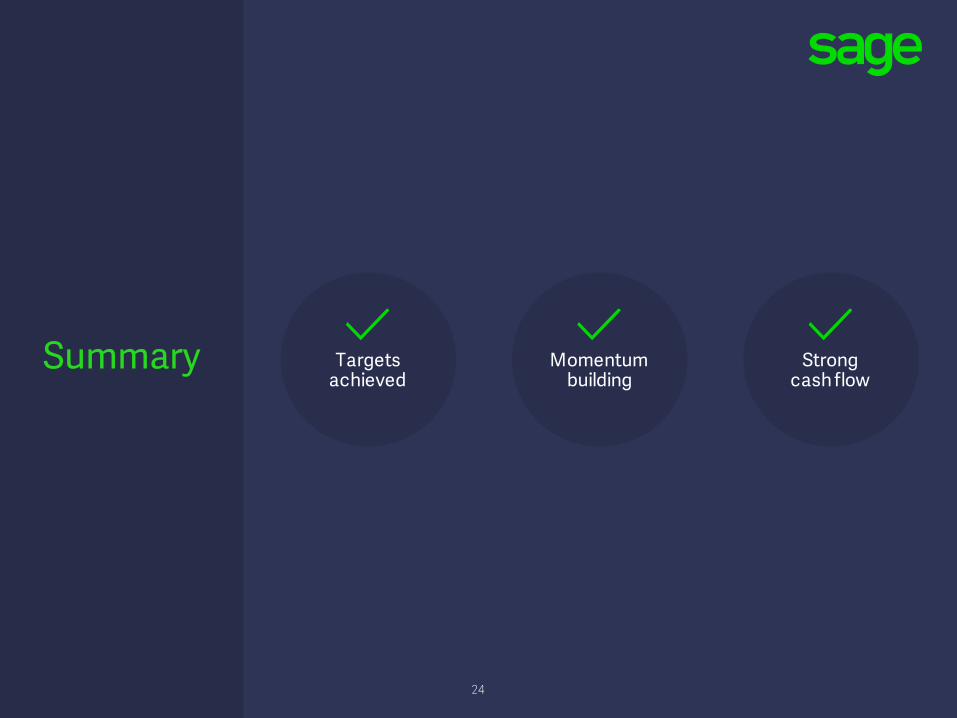
Targets achieved
Momentumbuilding
Strongcash flow
Summary
24
Stephen KellyChief Executive Officer
25
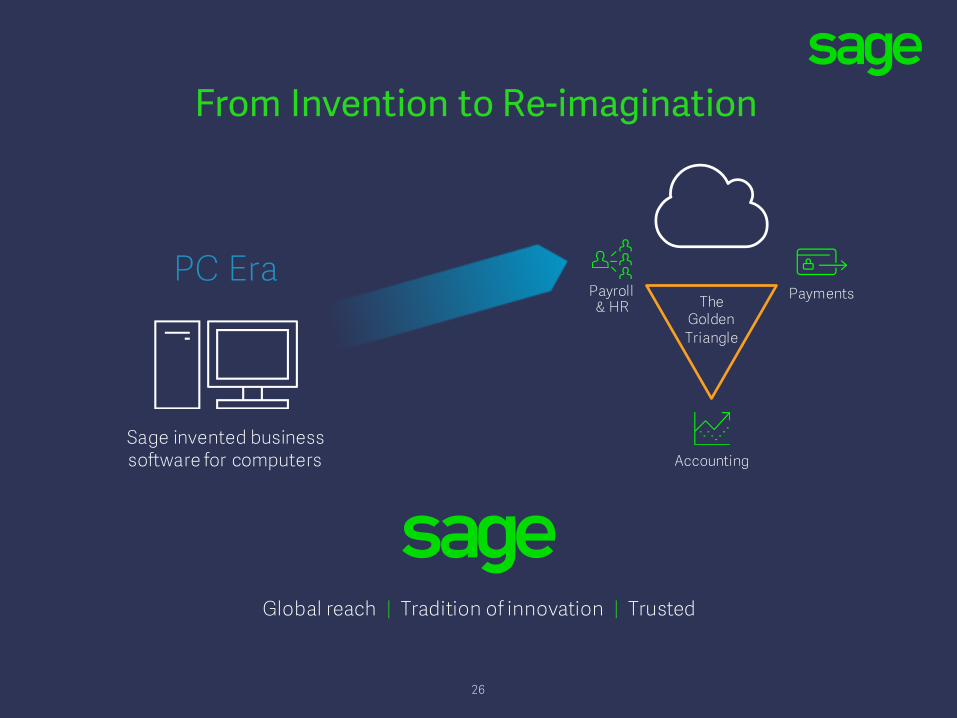
From Invention to Re-imagination
Global reach | Tradition of innovation | Trusted
PC Era
Sage invented business software for computers
TheGoldenTriangle
PaymentsPayroll& HR
Accounting
26
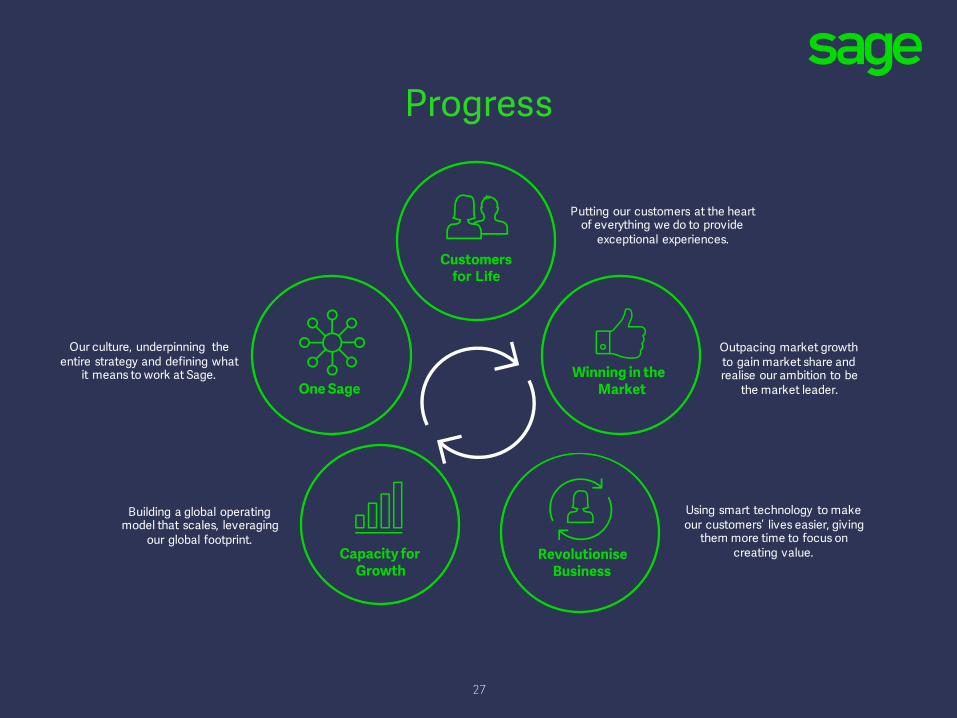
Progress
Building a global operatingmodel that scales, leveraging
our global footprint.
Putting our customers at the heartof everything we do to provide
exceptional experiences.
Using smart technology to makeour customers’ lives easier, giving
them more time to focus oncreating value.
Outpacing market growthto gain market share andrealise our ambition to be
the market leader.
Our culture, underpinning theentire strategy and defining what
it means to work at Sage.
27

Momentum building
Customers for life
• Renewal rates up to 84%• 690,000 software subscription contracts • UKI Sage Pay and Sage Accounting cross
sell growth at 160%
28
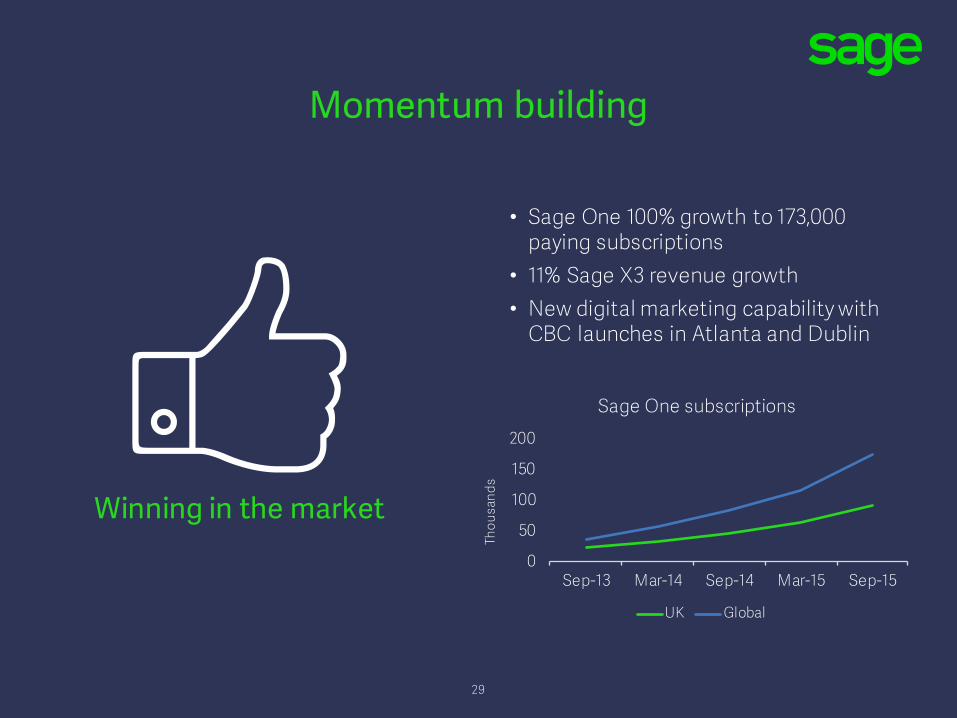
• Sage One 100% growth to 173,000 paying subscriptions
• 11% Sage X3 revenue growth • New digital marketing capability with
CBC launches in Atlanta and Dublin
0
50
100
150
200
Sep-13 Mar-14 Sep-14 Mar-15 Sep-15
Thou
sand
s
Sage One subscriptions
UK Global
Momentum building
Winning in the market
29
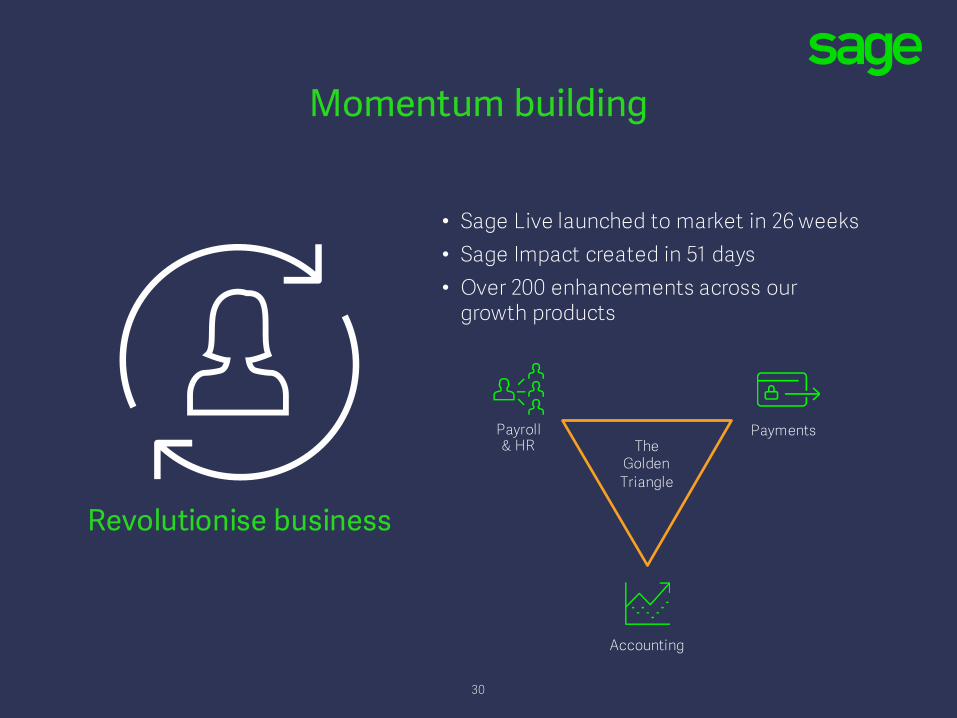
• Sage Live launched to market in 26 weeks • Sage Impact created in 51 days• Over 200 enhancements across our
growth products
Revolutionise business
TheGoldenTriangle
PaymentsPayroll& HR
Accounting
Momentum building
30
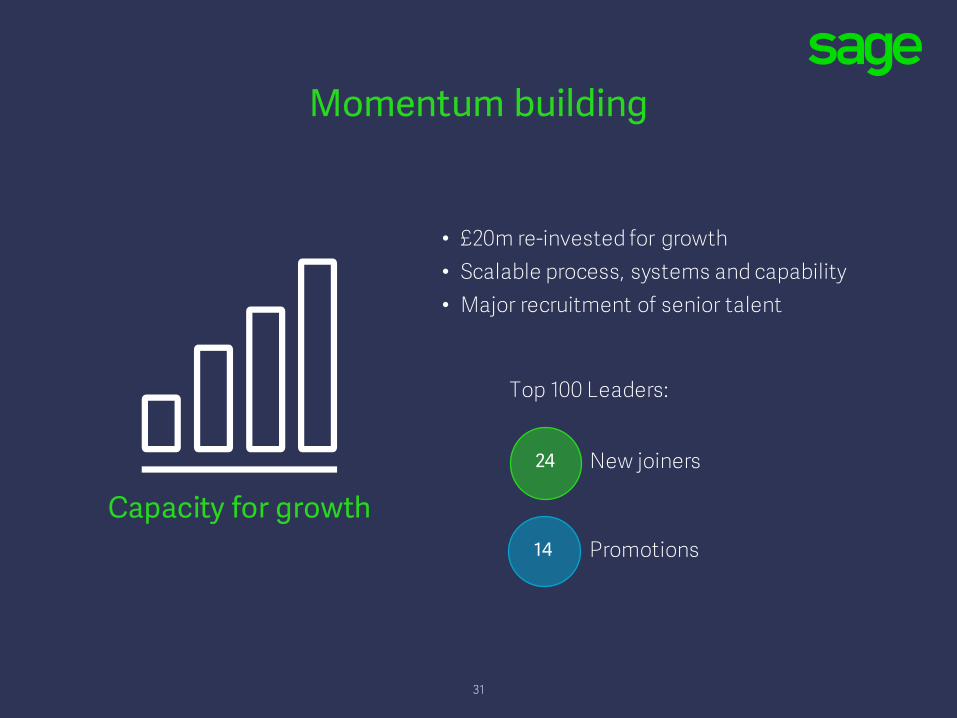
• £20m re-invested for growth• Scalable process, systems and capability• Major recruitment of senior talent
Top 100 Leaders:
24 New joiners
14 Promotions
Momentum building
Capacity for growth
31
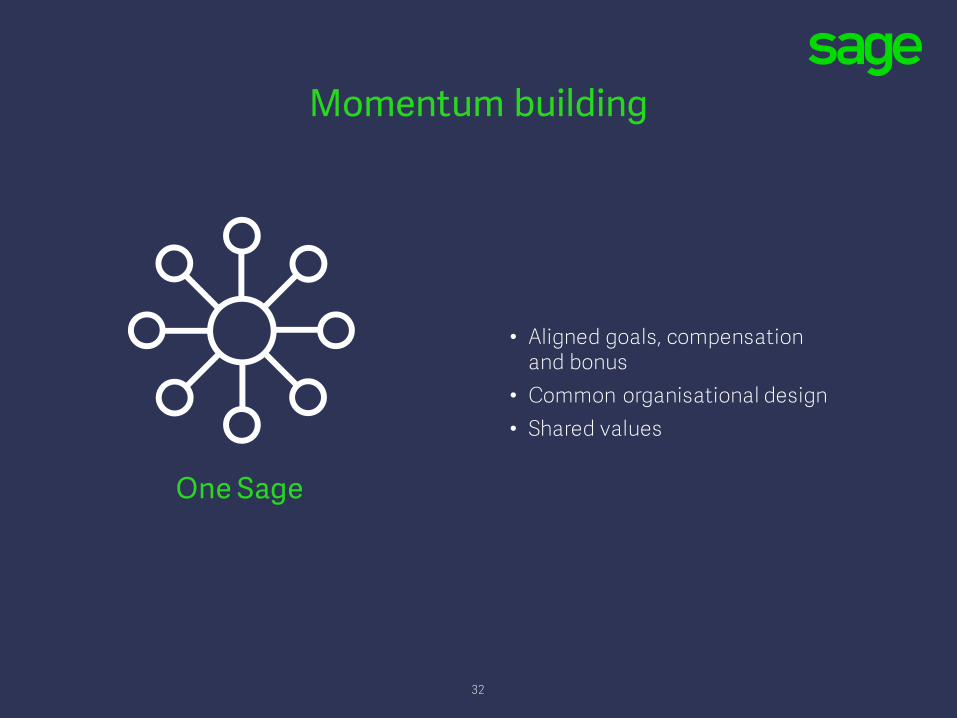
• Aligned goals, compensation and bonus
• Common organisational design • Shared values
Momentum building
One Sage
32

Progress
Building a global operatingmodel that scales, leveraging
our global footprint.
Putting our customers at the heartof everything we do to provide
exceptional experiences.
Using smart technology to makeour customers’ lives easier, giving
them more time to focus oncreating value.
Outpacing market growthto gain market share andrealise our ambition to be
the market leader.
Our culture, underpinning theentire strategy and defining what
it means to work at Sage.
33
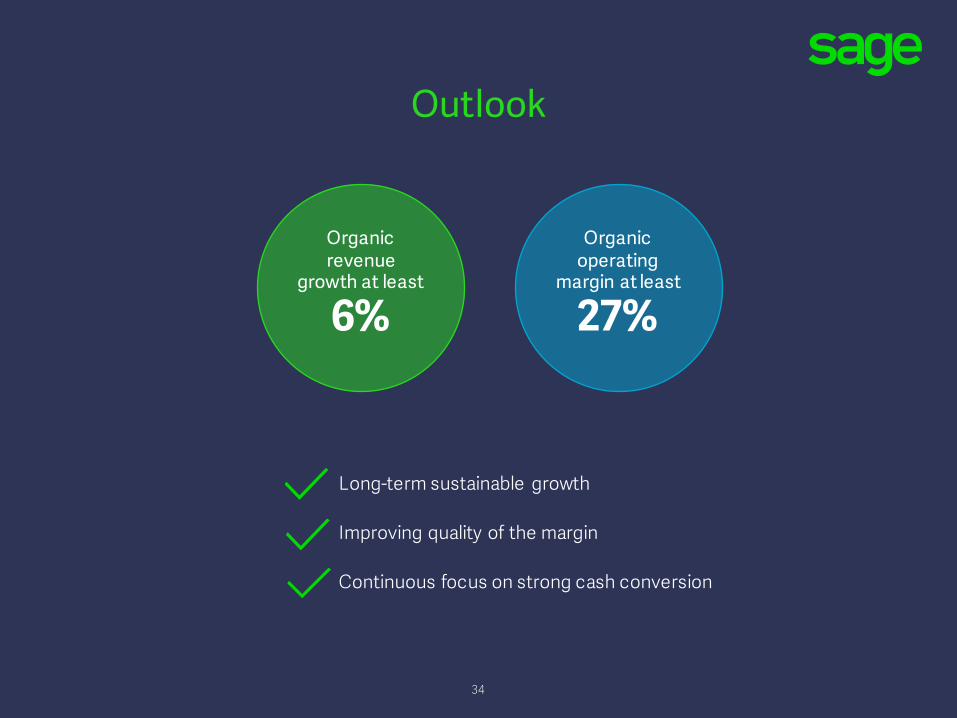
Organic operating
margin at least
27%
Organic revenue
growth at least
6%
Long-term sustainable growth
Improving quality of the margin
Continuous focus on strong cash conversion
Outlook
34

Financial targets achieved
Newchapter
Transformation underway
Momentumbuilding
Strongbusiness model
Summary
35

Q&A
36
Financial targets achieved with momentum for sustainable growth


![The Sage Group plc Acquisition of Intacct Corporation[Draft] The Sage Group plc Acquisition of Intacct Corporation Stephen Kelly, CEO Steve Hare, CFO [x] July 2017 The Sage Group Plc](https://img.pdfslide.us/doc/110x75/5e8d33fbc95aac529244a94b/the-sage-group-plc-acquisition-of-intacct-corporation-draft-the-sage-group-plc.jpg)