Embed Size (px)
Citation preview
THE REPUBLIC OF THE UNION OF MYANMAR
The 2014 Myanmar Population and Housing Census
Department of Population
Ministry of Labour, Immigration and Population
October 2017
SAGAING REGION, KATHA DISTRICTKawlin Township Report

The 2014 Myanmar Population and Housing Census
Sagaing Region, Katha District
Kawlin Township Report
Department of Population
Ministry of Labour, Immigration and Population
Office No.48
Nay Pyi Taw
Tel: +95 67 431062
www.dop.gov.mm
October 2017


Figure 1 : Map of Sagaing Region, showing the townships

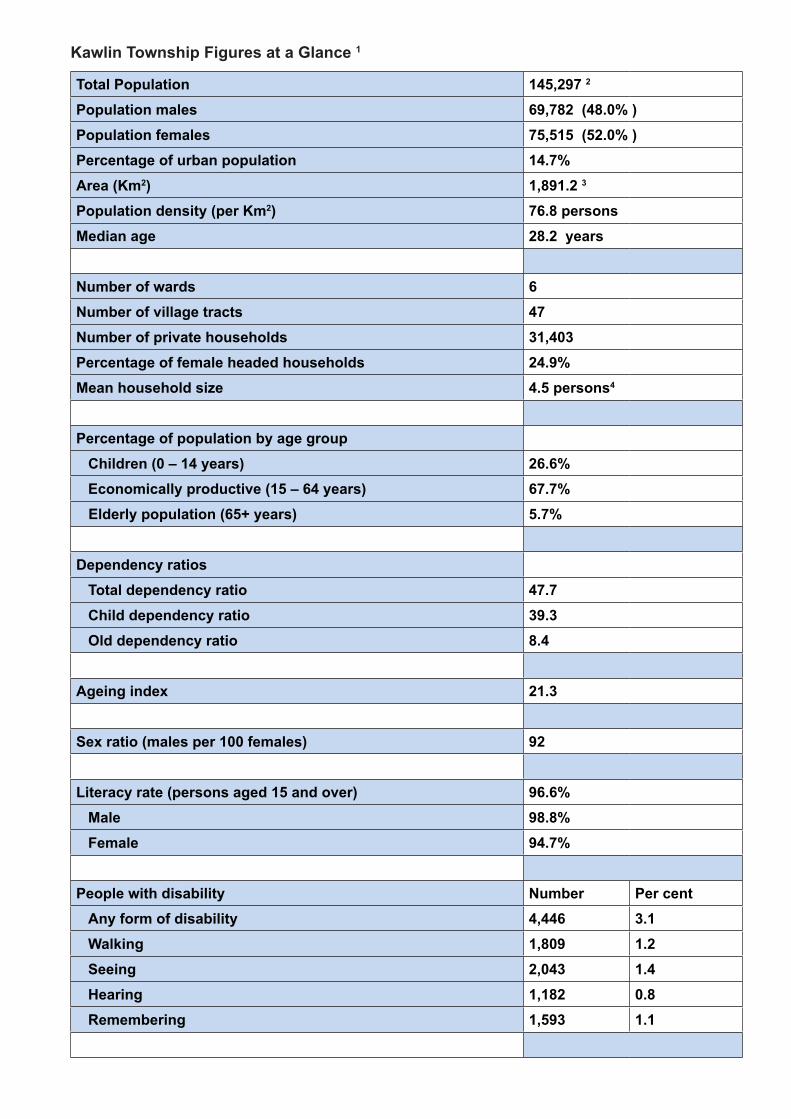
Kawlin Township Figures at a Glance 1
Total Population 145,297 2
Population males 69,782 (48.0% )Population females 75,515 (52.0% )Percentage of urban population 14.7%Area (Km2) 1,891.2 3 Population density (per Km2) 76.8 personsMedian age 28.2 years
Number of wards 6Number of village tracts 47Number of private households 31,403Percentage of female headed households 24.9%Mean household size 4.5 persons4
Percentage of population by age groupChildren (0 – 14 years) 26.6%Economically productive (15 – 64 years) 67.7%
Elderly population (65+ years) 5.7%
Dependency ratiosTotal dependency ratio 47.7Child dependency ratio 39.3Old dependency ratio 8.4
Ageing index 21.3
Sex ratio (males per 100 females) 92
Literacy rate (persons aged 15 and over) 96.6%Male 98.8%Female 94.7%
People with disability Number Per centAny form of disability 4,446 3.1Walking 1,809 1.2Seeing 2,043 1.4Hearing 1,182 0.8Remembering 1,593 1.1
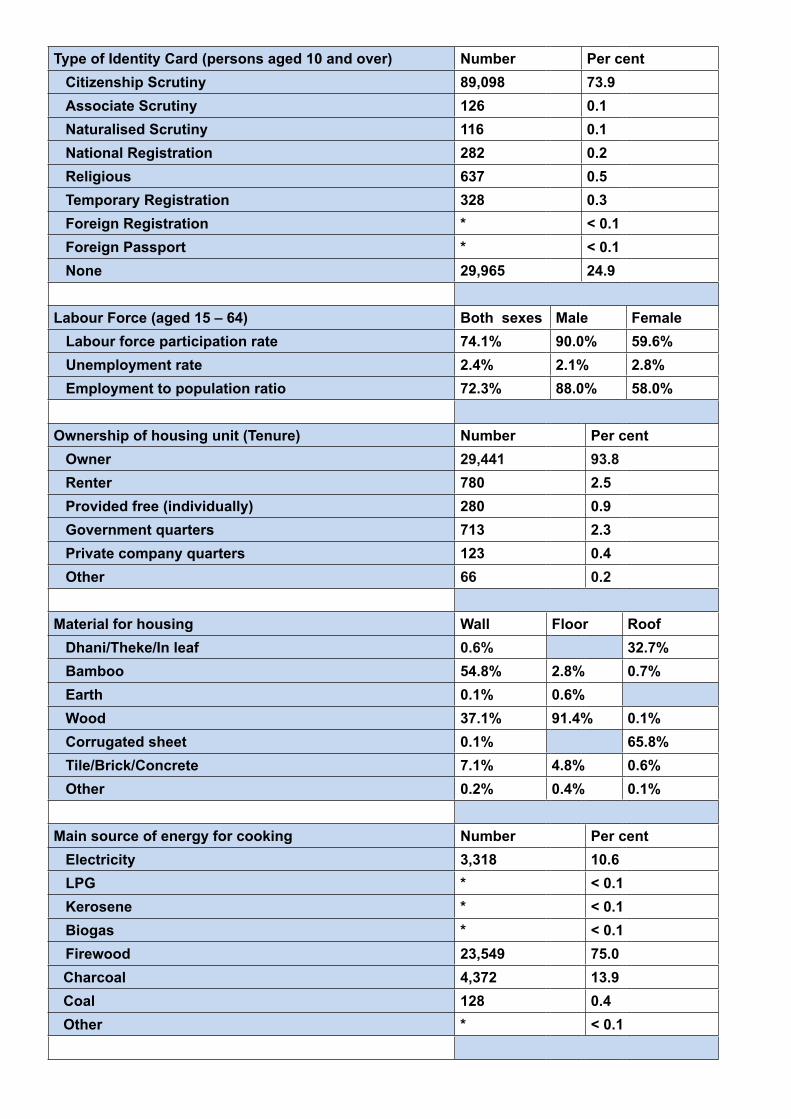
Type of Identity Card (persons aged 10 and over) Number Per centCitizenship Scrutiny 89,098 73.9Associate Scrutiny 126 0.1Naturalised Scrutiny 116 0.1National Registration 282 0.2Religious 637 0.5Temporary Registration 328 0.3Foreign Registration * < 0.1Foreign Passport * < 0.1None 29,965 24.9
Labour Force (aged 15 – 64) Both sexes Male Female Labour force participation rate 74.1% 90.0% 59.6% Unemployment rate 2.4% 2.1% 2.8% Employment to population ratio 72.3% 88.0% 58.0%
Ownership of housing unit (Tenure) Number Per centOwner 29,441 93.8Renter 780 2.5Provided free (individually) 280 0.9Government quarters 713 2.3Private company quarters 123 0.4Other 66 0.2
Material for housing Wall Floor RoofDhani/Theke/In leaf 0.6% 32.7%Bamboo 54.8% 2.8% 0.7%Earth 0.1% 0.6%Wood 37.1% 91.4% 0.1%Corrugated sheet 0.1% 65.8%Tile/Brick/Concrete 7.1% 4.8% 0.6%Other 0.2% 0.4% 0.1%
Main source of energy for cooking Number Per centElectricity 3,318 10.6LPG * < 0.1Kerosene * < 0.1Biogas * < 0.1Firewood 23,549 75.0Charcoal 4,372 13.9Coal 128 0.4Other * < 0.1

Main source of energy for lighting Number Per cent
Electricity 14,807 47.2
Kerosene 520 1.7
Candle 4,568 14.5
Battery 2,328 7.4
Generator (private) 5,089 16.2
Water mill (private) 44 0.1
Solar system/energy 3,668 11.7
Other 379 1.2
Main source of drinking water Number Per cent
Tap water/piped 247 0.8
Tube well, borehole 7,643 24.3
Protected well/spring 17,376 55.3
Bottled/purifier water 1,553 5.0
Total Improved Water Sources 26,819 85.4
Unprotected well/spring 615 2.0
Pool/pond/lake 519 1.7
River/stream/canal 991 3.2
Waterfall/rainwater 33 0.1
Other 2,426 7.6
Total Unimproved Water Sources 4,584 14.6
Main source of water for non-drinking use Number Per cent
Tap water/piped 533 1.7
Tube well, borehole 8,932 28.4
Protected well/spring 16,819 53.6
Unprotected well/spring 651 2.1
Pool/pond/lake 579 1.8
River/stream/canal 1,033 3.3
Waterfall/rainwater 29 0.1
Bottled/purifier water 22 0.1
Other 2,805 8.9
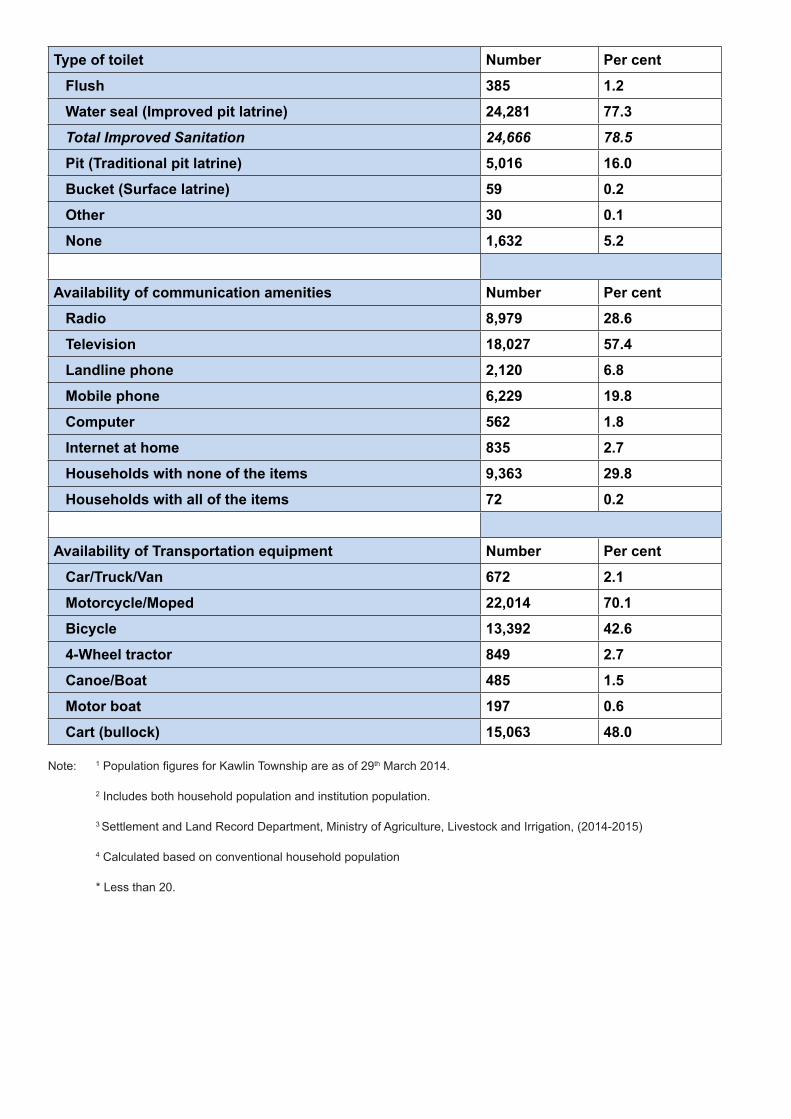
Type of toilet Number Per cent
Flush 385 1.2
Water seal (Improved pit latrine) 24,281 77.3
Total Improved Sanitation 24,666 78.5
Pit (Traditional pit latrine) 5,016 16.0
Bucket (Surface latrine) 59 0.2
Other 30 0.1
None 1,632 5.2
Availability of communication amenities Number Per cent
Radio 8,979 28.6
Television 18,027 57.4
Landline phone 2,120 6.8
Mobile phone 6,229 19.8
Computer 562 1.8
Internet at home 835 2.7
Households with none of the items 9,363 29.8
Households with all of the items 72 0.2
Availability of Transportation equipment Number Per cent
Car/Truck/Van 672 2.1
Motorcycle/Moped 22,014 70.1
Bicycle 13,392 42.6
4-Wheel tractor 849 2.7
Canoe/Boat 485 1.5
Motor boat 197 0.6
Cart (bullock) 15,063 48.0
Note: 1 Population figures for Kawlin Township are as of 29th March 2014.
2 Includes both household population and institution population.
3 Settlement and Land Record Department, Ministry of Agriculture, Livestock and Irrigation, (2014-2015)
4 Calculated based on conventional household population
* Less than 20.

1
Contents
Introduction ............................................................................................................................................... 3
Census information on Kawlin Township .................................................................................................. 5
(A) Demographic Characteristics ........................................................................................................ 7
(B) Religion ....................................................................................................................................... 12
(C) Education .................................................................................................................................... 13
(D) Economic Characteristics ........................................................................................................... 17
(E) Identity Cards .............................................................................................................................. 23
(F) Disability ..................................................................................................................................... 24
(G) Housing Conditions and Household Amenities ............................................................................ 27
Type of housing unit .................................................................................................................... 27
Type of toilet ................................................................................................................................ 28
Source of drinking water .............................................................................................................. 30
Source of lighting ........................................................................................................................ 32
Type of cooking fuel .................................................................................................................... 34
Communication and related amenities ........................................................................................ 36
Transportation items ................................................................................................................... 38
(H) Fertility and Mortality ................................................................................................................... 39
Fertility ........................................................................................................................................ 39
Childhood Mortality and Maternal Mortality ................................................................................. 41
Definitions and Concepts ........................................................................................................................ 43
List of Contributors .................................................................................................................................. 47


3
Introduction
In April 2014, the Government of the Republic of the Union of Myanmar conducted its latest census, after three decades without a Population and Housing Census. In the post-independence period, comprehensive population and housing censuses were only successfully undertaken in 1973, 1983 and most recently in April 2014.
Censuses are an important source of benchmark information on the characteristics of the population and households in every country. One unique feature of a census is its ability to provide information down to the lowest administrative level. Such information is vital for planning and evidence based decision-making at every level. Additional data uses include allocation of national resources; the review of administrative boundaries; the positioning of social infrastructures, drawing national development plans, service provision and developing social infrastructure, and for humanitarian preparedness and response.
The results of the 2014 Census have been published so far in a number of volumes. The first was the Provisional Results released in August 2014. The Census Main Results were launched in May 2015. These included The Union Report, Highlights of the Main Results, and reports of each of the 15 States and Regions. The reports on Occupation and Industry and Religion were launched in March 2016 and July 2016, respectively. All the publications are available online at http://www.dop.gov.mm/ and http://myanmar.unfpa.org/node/15104.
The current set of the 2014 Census publications comprise township and sub-township reports. Their preparation involved collaborative efforts of the Department of Population and UNFPA. This report contains selected demographic and socio-economic characteristics of Kawlin Township in Sagaing Region. The information included in this report is the situation of 2014 March 29, Census night. Township level information is very important. However, the level of confidence of township estimates is not the same as Union level information. Some of the townships have relatively small populations; the interpretation of these estimates should be made with caution. Some of the indicators, such as IMR/U5MR, were adopted only after careful analysis considering a number of factors to ensure consistency in the results. Estimates for townships with relatively small number of observations should not be taken as exact estimates of the mortality level, but rather they should be regarded as reasonable indicators for the scale of mortality risk they experience, an indication of which townships are better off and which are in a more vulnerable situation.


5
Census information on Kawlin Township


7
(A) Demographic Characteristics
Total population 145,297*
Males 69,782
Females 75,515
Sex ratio 92 males per 100 females
Percentage of urban population 14.7%
Area (Km2) 1,891.2 **
Population density (persons per Km2) 76.8 persons
Number of wards 6
Number of village tracts 47
Total Urban Rural
Population in conventional households 140,228 20,572 119,656
Number of conventional households 31,403 4,569 26,834
Mean household size 4.5 persons ***
• In Kawlin Township, there are slightly more females than males with 92 males per 100 females.
• The majority of the people in the Township live in rural areas with only (14.7%) living in urban areas.
• The population density of Kawlin Township is 77 persons per square kilometre.
• There are 4.5 persons living in each household in Kawlin Township. This is slightly more than the Union average.
Note: * Includes both household population and institution population.
** Settlement and Land Record Department, Ministry of Agriculture, Livestock and Irrigation, (2014-2015)
*** Calculated based on conventional household population

8
Table 1: Population and number of conventional households by sex by ward and village tract; Kawlin Township (Katha District, Sagaing Region)
Total Males Females
Total 31,403 145,297 69,782 75,515
Ward 4,569 21,431 9,957 11,474
1 Myauk Inn(W) 1,057 4,838 2,299 2,539
2 Yae Kyaw(W) 1,467 7,176 3,390 3,786
3 Zay Yon Bo Te(W) 576 2,771 1,260 1,511
4 Myo Ma Myo Kone(W) 497 2,346 1,055 1,291
5 Pyin Oo Lwin(W) 463 2,046 901 1,145
6 Set Yon Lel Pyin(W) 509 2,254 1,052 1,202
Village Tract 26,834 123,866 59,825 64,041
1 Lar Kar(VT) 439 2,067 998 1,069
2 Aing Gyi(VT) 953 4,268 2,051 2,217
3 Kyoet Pin(VT) 797 3,735 1,804 1,931
4 Ta Gaung Aing(VT) 268 1,114 508 606
5 Moe Hnan(VT) 481 3,010 1,557 1,453
6 Tha Yet Chin(VT) 636 3,198 1,600 1,598
7 Yin Taik(VT) 414 2,555 1,281 1,274
8 Pan Ma Ye(VT) 711 3,781 1,847 1,934
9 Taung Kyar(VT) 1,098 5,667 2,839 2,828
10 Oke Kan(VT) 875 4,233 2,038 2,195
11 Shwe Twin(VT) 246 1,196 583 613
12 Shan Ka Lone(VT) 700 3,834 1,978 1,856
13 Gway Tauk Taw(VT) 832 4,207 2,014 2,193
14 Sin Gaung(VT) 157 713 357 356
15 Yar Taung(VT) 445 1,999 971 1,028
16 Kyun Taw(VT) 469 2,181 1,096 1,085
17 Yae Kan Thar(VT) 731 3,208 1,507 1,701
18 Kyar Inn(VT) 574 2,717 1,320 1,397
19 Ka Yar Kone(VT) 356 1,710 756 954
20 Na Nwin Taw(VT) 827 3,860 1,784 2,076
Sr Ward/Village TractNo. of
Conventional households
Population
9
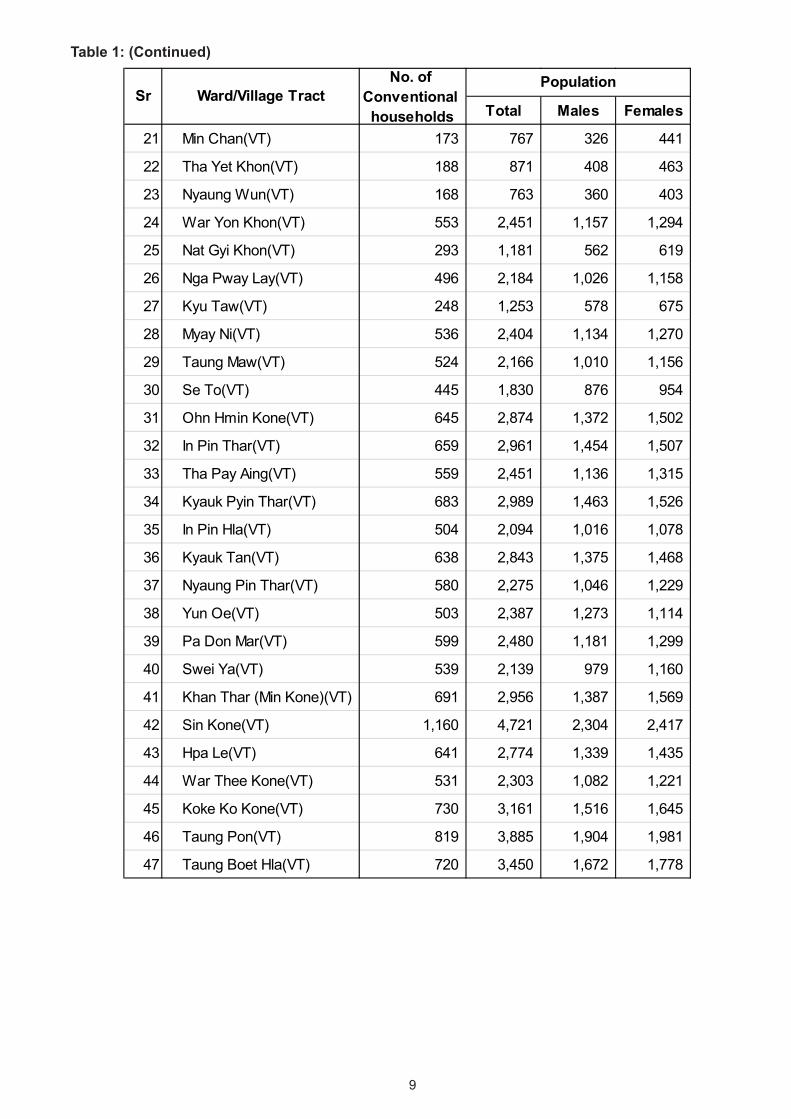
Table 1: (Continued)
Total Males Females
21 Min Chan(VT) 173 767 326 441
22 Tha Yet Khon(VT) 188 871 408 463
23 Nyaung Wun(VT) 168 763 360 403
24 War Yon Khon(VT) 553 2,451 1,157 1,294
25 Nat Gyi Khon(VT) 293 1,181 562 619
26 Nga Pway Lay(VT) 496 2,184 1,026 1,158
27 Kyu Taw(VT) 248 1,253 578 675
28 Myay Ni(VT) 536 2,404 1,134 1,270
29 Taung Maw(VT) 524 2,166 1,010 1,156
30 Se To(VT) 445 1,830 876 954
31 Ohn Hmin Kone(VT) 645 2,874 1,372 1,502
32 In Pin Thar(VT) 659 2,961 1,454 1,507
33 Tha Pay Aing(VT) 559 2,451 1,136 1,315
34 Kyauk Pyin Thar(VT) 683 2,989 1,463 1,526
35 In Pin Hla(VT) 504 2,094 1,016 1,078
36 Kyauk Tan(VT) 638 2,843 1,375 1,468
37 Nyaung Pin Thar(VT) 580 2,275 1,046 1,229
38 Yun Oe(VT) 503 2,387 1,273 1,114
39 Pa Don Mar(VT) 599 2,480 1,181 1,299
40 Swei Ya(VT) 539 2,139 979 1,160
41 Khan Thar (Min Kone)(VT) 691 2,956 1,387 1,569
42 Sin Kone(VT) 1,160 4,721 2,304 2,417
43 Hpa Le(VT) 641 2,774 1,339 1,435
44 War Thee Kone(VT) 531 2,303 1,082 1,221
45 Koke Ko Kone(VT) 730 3,161 1,516 1,645
46 Taung Pon(VT) 819 3,885 1,904 1,981
47 Taung Boet Hla(VT) 720 3,450 1,672 1,778
Sr Ward/Village TractNo. of
Conventional households
Population

10
Figure 2: Population by broad age groups, Kawlin Township
Table 2: Population by 5-year age groups, Kawlin Township
• The proportion of productive working population between 15 to 64 years of age in Kawlin Township is 67.7 per cent.
• The proportion of children aged 14 and below together with the proportion of the elderly aged 65 and over are less than the proportion of the working age group population.
• Fewer proportions of children and elderly reduce the dependency of those age groups on the working age population.
Age groups Total Males Females
Total 145,297 69,782 75,515
0 - 4 12,260 6,218 6,042
5 - 9 12,462 6,360 6,102
10 - 14 13,948 6,963 6,985
15 - 19 13,363 6,708 6,655
20 - 24 12,652 5,991 6,661
25 - 29 12,331 5,970 6,361
30 - 34 11,587 5,645 5,942
35 - 39 10,304 4,964 5,340
40 - 44 10,058 4,732 5,326
45 - 49 9,390 4,416 4,974
50 - 54 8,378 3,856 4,522
55 - 59 6,183 2,838 3,345
60 - 64 4,142 1,839 2,303
65 - 69 2,877 1,281 1,596
70 - 74 1,991 816 1,175
75 - 79 1,674 664 1,010
80 - 84 1,034 348 686
85 - 89 486 138 348
90 + 177 35 142
11
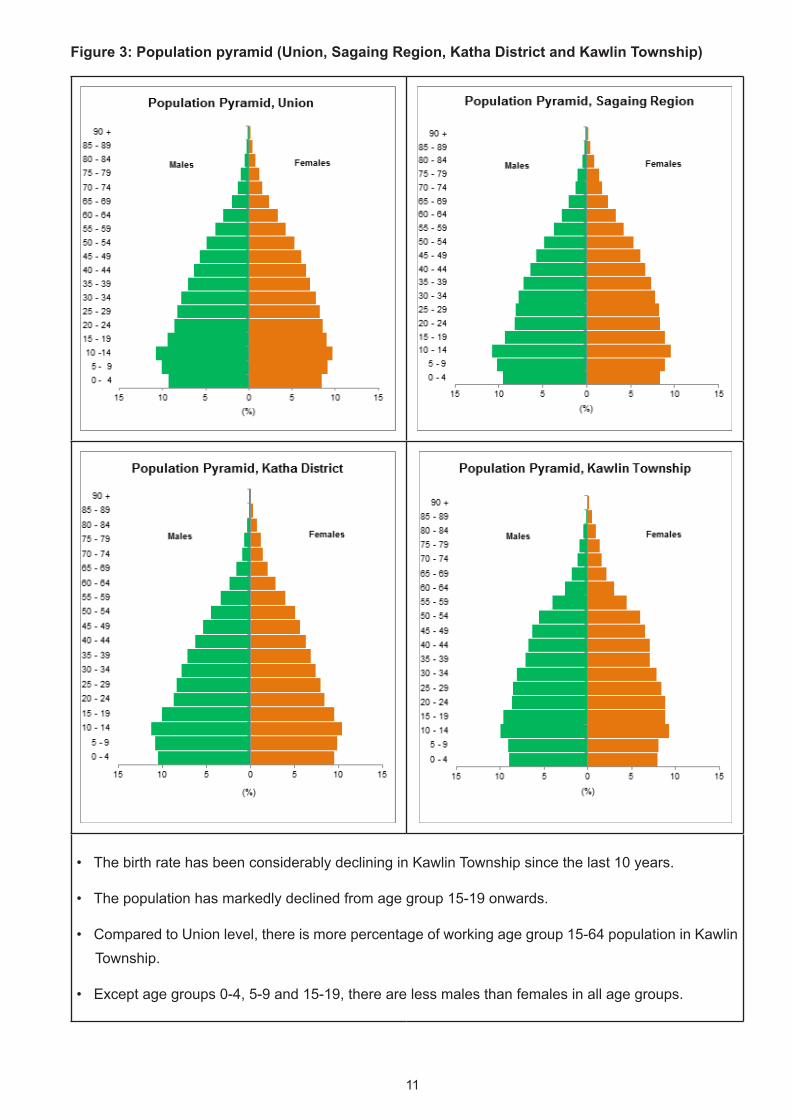
Figure 3: Population pyramid (Union, Sagaing Region, Katha District and Kawlin Township)
• The birth rate has been considerably declining in Kawlin Township since the last 10 years.
• The population has markedly declined from age group 15-19 onwards.
• Compared to Union level, there is more percentage of working age group 15-64 population in Kawlin Township.
• Except age groups 0-4, 5-9 and 15-19, there are less males than females in all age groups.

12
(B) Religion
• At the Union level, the composition of the population by religion is: 87.9% Buddhist, 6.2% Christian, 4.3% Islam, 0.5% Hindu, 0.8% Animist, 0.2% Other religion and 0.1% No religion.
• In Sagaing Region, it is 92.2% Buddhist, 6.5% Christian, 1.1% Islam, 0.1% Hindu, 0.1% Other religion, and less than 0.1% each for Animist and those with No religion respectively.
Note: * Less than 0.1 per cent.

13
(C) Education
Table 3:Population aged 5 - 29 and current school attendance by sex by age
Total Males Females Total Males Females5 2,215 1,130 1,085 924 445 479
6 2,487 1,280 1,207 2,166 1,111 1,055
7 2,495 1,253 1,242 2,261 1,130 1,131
8 2,468 1,201 1,267 2,209 1,079 1,130
9 2,615 1,352 1,263 2,371 1,222 1,149
10 2,712 1,328 1,384 2,407 1,191 1,216
11 2,506 1,208 1,298 2,143 1,040 1,103
12 2,771 1,371 1,400 2,178 1,078 1,100
13 2,761 1,333 1,428 1,849 895 954
14 2,617 1,256 1,361 1,367 646 721
15 2,613 1,296 1,317 1,018 514 504
16 2,379 1,145 1,234 716 324 392
17 2,629 1,274 1,355 632 268 364
18 2,542 1,228 1,314 482 204 278
19 2,218 1,055 1,163 290 127 163
20 2,641 1,203 1,438 229 111 118
21 2,271 1,037 1,234 131 74 57
22 2,443 1,125 1,318 90 43 47
23 2,350 1,092 1,258 73 44 29
24 2,129 925 1,204 40 21 19
25 2,551 1,168 1,383 35 16 19
26 2,248 1,074 1,174 18 12 6
27 2,357 1,143 1,214 18 10 8
28 2,404 1,122 1,282 15 9 6
29 2,147 988 1,159 11 6 5
Currently attendingAge
Total population

14
• School attendance in Kawlin Township drops after age 11 for both males and females.
• Compared to the Union, the school attendance of males and females in Kawlin Township is higher from starting age of school attendance but is lower than that of the Union after age 13 onwards.
15
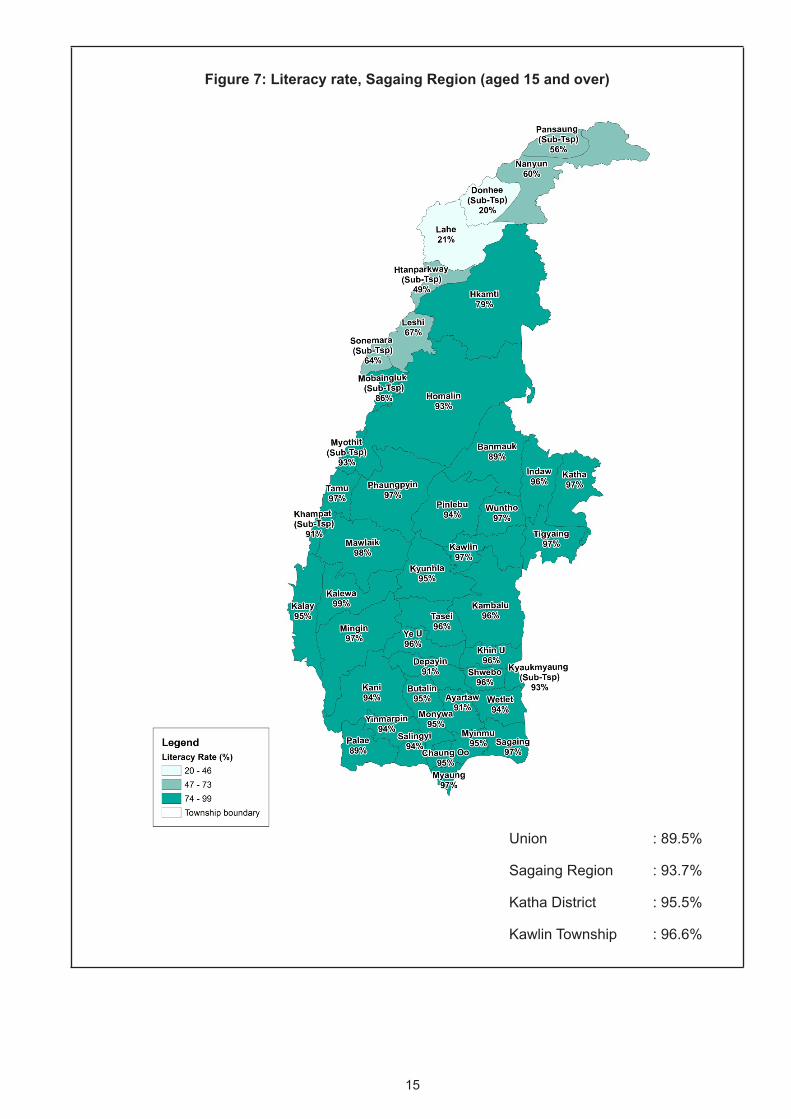
Figure 7: Literacy rate, Sagaing Region (aged 15 and over)
Union : 89.5%
Sagaing Region : 93.7%
Katha District : 95.5%
Kawlin Township : 96.6%
16
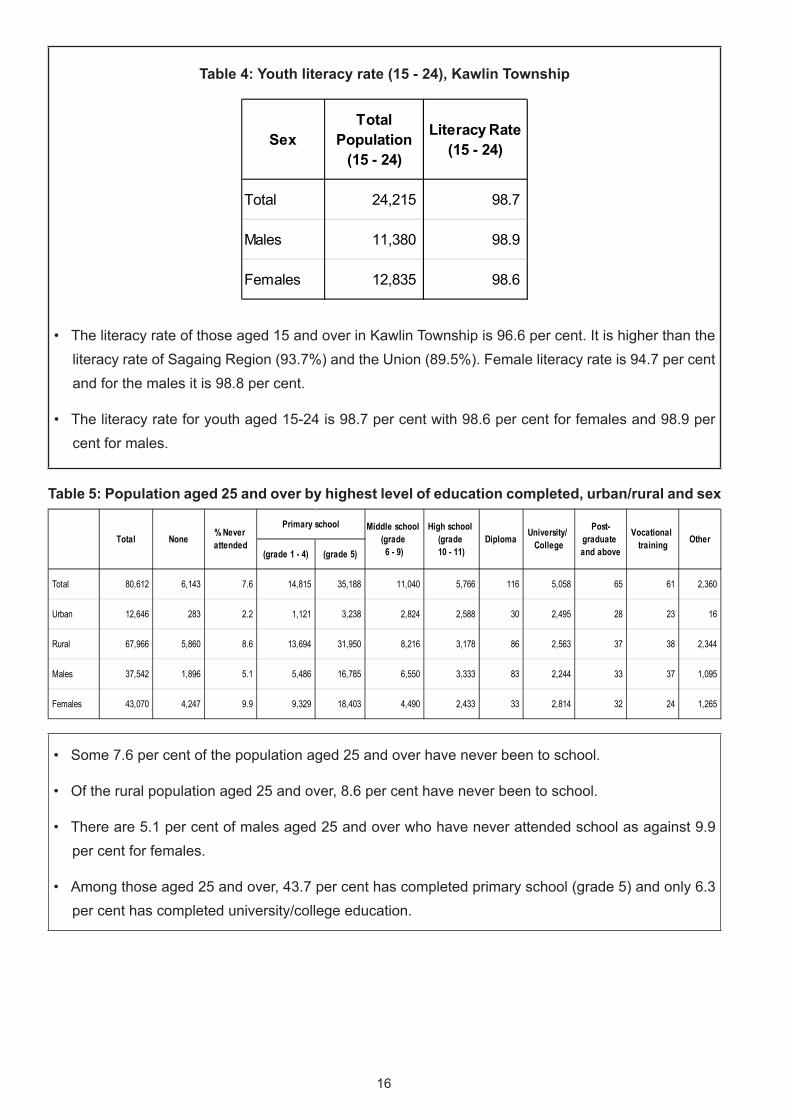
Table 4: Youth literacy rate (15 - 24), Kawlin Township
• The literacy rate of those aged 15 and over in Kawlin Township is 96.6 per cent. It is higher than the literacy rate of Sagaing Region (93.7%) and the Union (89.5%). Female literacy rate is 94.7 per cent and for the males it is 98.8 per cent.
• The literacy rate for youth aged 15-24 is 98.7 per cent with 98.6 per cent for females and 98.9 per cent for males.
Table 5: Population aged 25 and over by highest level of education completed, urban/rural and sex
• Some 7.6 per cent of the population aged 25 and over have never been to school.
• Of the rural population aged 25 and over, 8.6 per cent have never been to school.
• There are 5.1 per cent of males aged 25 and over who have never attended school as against 9.9 per cent for females.
• Among those aged 25 and over, 43.7 per cent has completed primary school (grade 5) and only 6.3 per cent has completed university/college education.
SexTotal
Population(15 - 24)
Literacy Rate(15 - 24)
Total 24,215 98.7
Males 11,380 98.9
Females 12,835 98.6
(grade 1 - 4) (grade 5)
Total 80,612 6,143 7.6 14,815 35,188 11,040 5,766 116 5,058 65 61 2,360
Urban 12,646 283 2.2 1,121 3,238 2,824 2,588 30 2,495 28 23 16
Rural 67,966 5,860 8.6 13,694 31,950 8,216 3,178 86 2,563 37 38 2,344
Males 37,542 1,896 5.1 5,486 16,785 6,550 3,333 83 2,244 33 37 1,095
Females 43,070 4,247 9.9 9,329 18,403 4,490 2,433 33 2,814 32 24 1,265
OtherTotal None % Never attended
Primary school Middle school (grade 6 - 9)
High school (grade 10 - 11)
Diploma University/ College
Post-graduate and above
Vocational training

17
(D) Economic Characteristics
Table 6: Population aged 10 and over by labour force participation rate and unemployment rate by sex and age group
Total Males Females Total Males Females
10 - 14 14.0 15.1 13.0 8.7 9.8 7.4
15 - 19 62.4 71.7 53.1 6.3 6.0 6.7
20 - 24 79.5 92.2 68.2 6.0 4.8 7.4
25 - 29 81.0 96.2 66.7 3.2 2.6 4.1
30 - 34 81.2 96.8 66.4 1.6 1.4 1.9
35 - 39 80.1 97.1 64.4 0.8 0.9 0.6
40 - 44 79.3 96.2 64.3 0.5 0.7 0.3
45 - 49 77.0 96.1 60.1 0.3 0.5 0.1
50 - 54 70.9 92.3 52.7 0.3 0.4 0.3
55 - 59 63.4 84.6 45.4 0.1 0.2 0.1
60 - 64 43.0 61.0 28.6 0.1 0.1 -
65 - 69 29.4 42.6 18.7 0.1 - 0.3
70 - 74 17.4 25.6 11.7 - - -
75 + 8.9 12.2 7.1 - - -
15 - 24 70.8 81.4 60.6 6.1 5.4 7.1
15 - 64 74.1 90.0 59.6 2.4 2.1 2.8
Age groupsLabour Force Participation Rate Unemployment Rate
18
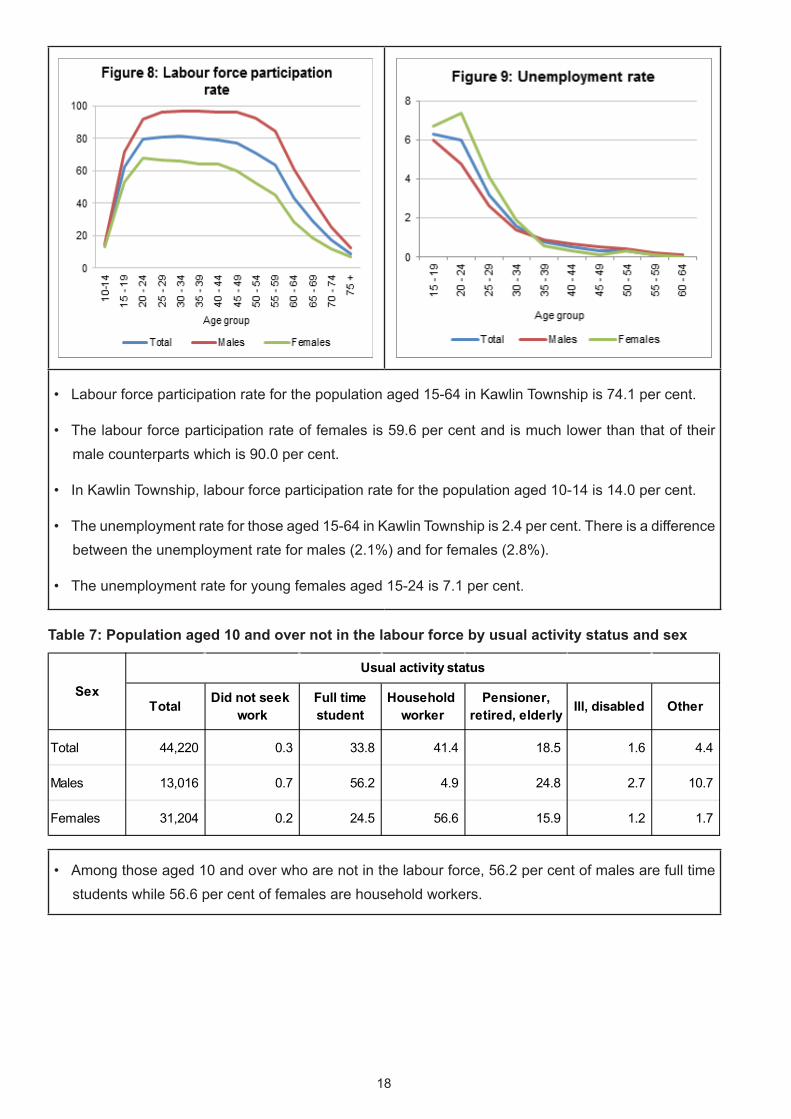
• Labour force participation rate for the population aged 15-64 in Kawlin Township is 74.1 per cent.
• The labour force participation rate of females is 59.6 per cent and is much lower than that of their male counterparts which is 90.0 per cent.
• In Kawlin Township, labour force participation rate for the population aged 10-14 is 14.0 per cent.
• The unemployment rate for those aged 15-64 in Kawlin Township is 2.4 per cent. There is a difference between the unemployment rate for males (2.1%) and for females (2.8%).
• The unemployment rate for young females aged 15-24 is 7.1 per cent.
Table 7: Population aged 10 and over not in the labour force by usual activity status and sex
• Among those aged 10 and over who are not in the labour force, 56.2 per cent of males are full time students while 56.6 per cent of females are household workers.
Total Did not seek work
Full timestudent
Household worker
Pensioner,retired, elderly Ill, disabled Other
Total 44,220 0.3 33.8 41.4 18.5 1.6 4.4
Males 13,016 0.7 56.2 4.9 24.8 2.7 10.7
Females 31,204 0.2 24.5 56.6 15.9 1.2 1.7
Sex
Usual activity status

19
Table 8: Employed persons aged 15 - 64 by occupation by sex
Total Males Females Total Males Females
Total 68,022 39,017 29,005 100.0 100.0 100.0
Managers 229 150 79 0.3 0.4 0.3
Professionals 1,312 296 1,016 1.9 0.8 3.5
Technicians and Associate Professionals 1,056 587 469 1.6 1.5 1.6
Clerical Support Workers 704 413 291 1.0 1.1 1.0
Services and Sales Workers 7,043 2,428 4,615 10.4 6.2 15.9
Skilled Agricultural, Forestry and Fishery Workers 38,203 23,825 14,378 56.2 61.1 49.6
Craft and Related Trades Workers 6,971 4,963 2,008 10.2 12.7 6.9
Plant and Machine Operators and Assemblers 1,562 1,432 130 2.3 3.7 0.4
Elementary Occupations 6,900 4,077 2,823 10.1 10.4 9.7
Others - - - - - -
Not stated 4,042 846 3,196 5.9 2.2 11.0
Employed persons Per centOccupation

20
• In Kawlin Township, 56.2 per cent of the employed persons aged 15-64 are skilled agricultural, forestry and fishery workers and is the highest proportion, followed by services and sales workers with 10.4 per cent.
• Analysis by sex shows that 61.1 per cent of males and 49.6 per cent of females are skilled agricultural, forestry and fishery workers.
• In Sagaing Region, 52.4 per cent are skilled agricultural, forestry and fishery workers and 9.1 per cent are in services and sales workers.
21
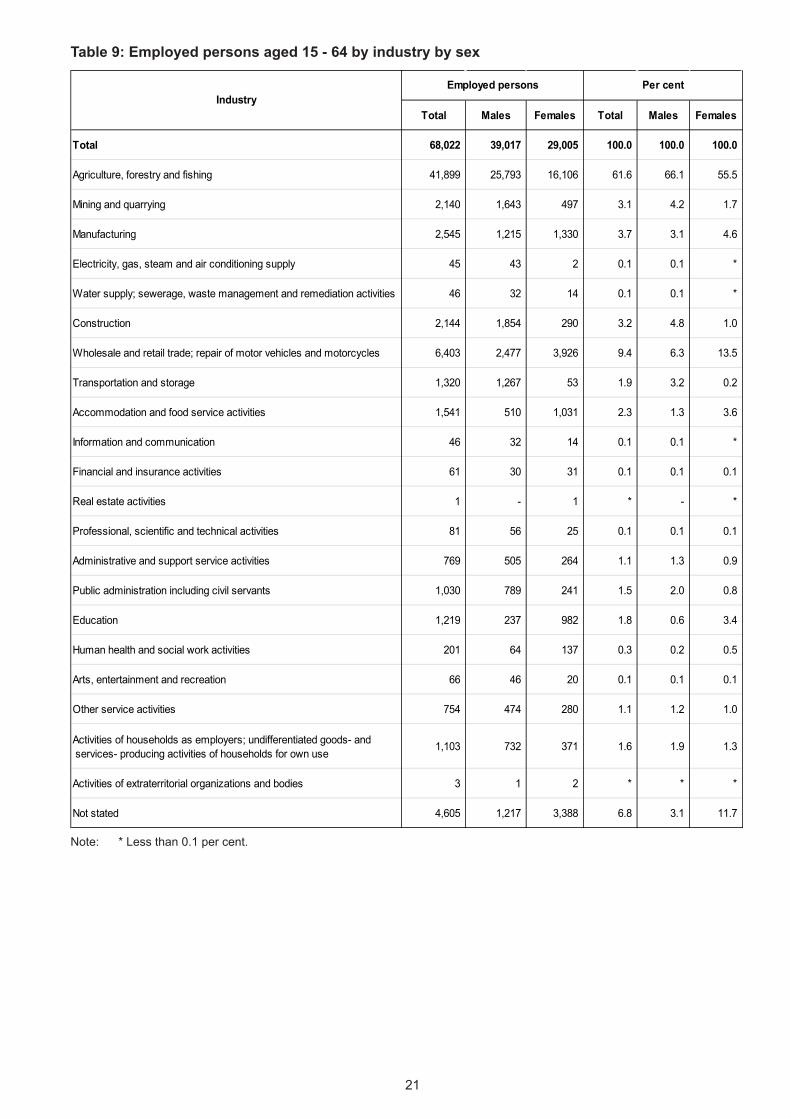
Table 9: Employed persons aged 15 - 64 by industry by sex
Note: * Less than 0.1 per cent.
Total Males Females Total Males Females
Total 68,022 39,017 29,005 100.0 100.0 100.0
Agriculture, forestry and fishing 41,899 25,793 16,106 61.6 66.1 55.5
Mining and quarrying 2,140 1,643 497 3.1 4.2 1.7
Manufacturing 2,545 1,215 1,330 3.7 3.1 4.6
Electricity, gas, steam and air conditioning supply 45 43 2 0.1 0.1 *
Water supply; sewerage, waste management and remediation activities 46 32 14 0.1 0.1 *
Construction 2,144 1,854 290 3.2 4.8 1.0
Wholesale and retail trade; repair of motor vehicles and motorcycles 6,403 2,477 3,926 9.4 6.3 13.5
Transportation and storage 1,320 1,267 53 1.9 3.2 0.2
Accommodation and food service activities 1,541 510 1,031 2.3 1.3 3.6
Information and communication 46 32 14 0.1 0.1 *
Financial and insurance activities 61 30 31 0.1 0.1 0.1
Real estate activities 1 - 1 * - *
Professional, scientific and technical activities 81 56 25 0.1 0.1 0.1
Administrative and support service activities 769 505 264 1.1 1.3 0.9
Public administration including civil servants 1,030 789 241 1.5 2.0 0.8
Education 1,219 237 982 1.8 0.6 3.4
Human health and social work activities 201 64 137 0.3 0.2 0.5
Arts, entertainment and recreation 66 46 20 0.1 0.1 0.1
Other service activities 754 474 280 1.1 1.2 1.0
Activities of households as employers; undifferentiated goods- and services- producing activities of households for own use
1,103 732 371 1.6 1.9 1.3
Activities of extraterritorial organizations and bodies 3 1 2 * * *
Not stated 4,605 1,217 3,388 6.8 3.1 11.7
IndustryEmployed persons Per cent

22
• In Kawlin Township, the proportion of employed persons working in the industry of “Agriculture, forestry and fishing” is the highest with 61.6 per cent.
• The second highest industry is “Wholesale and retail trade; repair of motor vehicles and motorcycles” at 9.4 per cent.
• There are 66.1 per cent of males and 55.5 per cent of females working in “Agriculture, forestry and fishing” industry.
• In Sagaing Region, there are 61.6 per cent of employed population working in “Agriculture, forestry and fishing” industry and 6.9 per cent in “Wholesale and retail trade; repair of motor vehicles and motorcycles” industry.

23
(E) Identity Cards
Table 10: Population aged 10 and over by type of identity card, urban/rural and sex
Note: * Less than 20 cards.
• In Kawlin Township, 73.9 per cent of the population aged 10 and over have Citizenship Scrutiny Card while 24.9 per cent have none.
• Analysis by sex shows that 23.7 per cent of males and 25.9 per cent of females do not have any type of card.
Note: * Less than 0.1 per cent.
Citizenship Scrutiny Card
Associate Scrutiny Card
Naturalised Scrutiny
Card
National Registration
Card
Religious Card
Temporary Registration
Card
Foreign Registration
Card
Foreign Passport None
Total 89,098 126 116 282 637 328 * * 29,965
Urban 15,454 98 53 33 144 81 * * 2,490
Rural 73,644 28 63 249 493 247 - * 27,475
Males 42,698 64 74 104 579 139 * * 13,534
Females 46,400 62 42 178 58 189 * * 16,431

24
(F) Disability
Table 11: Population by disability prevalence rate and type of disability by sex by age group
Total Not disabled With any of 4 disabilities
Disability prevalence
rate (%)Seeing Hearing Walking Remembering
Total 145,297 140,851 4,446 3.1 2,043 1,182 1,809 1,593
0 - 4 12,260 12,106 154 1.3 21 13 78 121
5 - 9 12,462 12,332 130 1.0 15 20 48 91
10 - 14 13,948 13,803 145 1.0 18 19 39 105
15 - 19 13,363 13,263 100 0.7 9 16 33 66
20 - 24 12,652 12,520 132 1.0 29 26 47 74
25 - 29 12,331 12,186 145 1.2 17 39 53 63
30 - 34 11,587 11,447 140 1.2 29 33 50 56
35 - 39 10,304 10,181 123 1.2 28 22 51 43
40 - 44 10,058 9,852 206 2.0 91 28 69 64
45 - 49 9,390 9,120 270 2.9 147 41 82 59
50 - 54 8,378 8,019 359 4.3 201 61 114 67
55 - 59 6,183 5,819 364 5.9 206 68 118 65
60 - 64 4,142 3,774 368 8.9 191 82 152 90
65 - 69 2,877 2,488 389 13.5 199 111 156 101
70 - 74 1,991 1,617 374 18.8 225 142 155 126
75 - 79 1,674 1,215 459 27.4 286 182 224 156
80 - 84 1,034 685 349 33.8 210 151 189 132
85 - 89 486 326 160 32.9 82 77 97 74
90 + 177 98 79 44.6 39 51 54 40
Age groups
Total Population Type of disability

25
Table 11: (Continued)
Total Not disabled With any of 4 disabilities
Disability prevalence
rate (%)Seeing Hearing Walking Remembering
Males 69,782 67,765 2,017 2.9 868 510 784 703
0 - 4 6,218 6,140 78 1.3 9 5 37 60
5 - 9 6,360 6,276 84 1.3 11 14 35 57
10 - 14 6,963 6,884 79 1.1 8 10 22 55
15 - 19 6,708 6,646 62 0.9 5 11 21 40
20 - 24 5,991 5,923 68 1.1 16 12 25 39
25 - 29 5,970 5,901 69 1.2 8 16 25 34
30 - 34 5,645 5,562 83 1.5 18 18 32 33
35 - 39 4,964 4,909 55 1.1 14 11 22 14
40 - 44 4,732 4,633 99 2.1 43 11 38 30
45 - 49 4,416 4,284 132 3.0 69 21 42 28
50 - 54 3,856 3,695 161 4.2 93 22 50 29
55 - 59 2,838 2,663 175 6.2 94 28 62 24
60 - 64 1,839 1,670 169 9.2 98 41 57 39
65 - 69 1,281 1,109 172 13.4 81 50 73 40
70 - 74 816 666 150 18.4 86 60 56 45
75 - 79 664 467 197 29.7 114 89 92 63
80 - 84 348 222 126 36.2 72 58 62 51
85 - 89 138 97 41 29.7 23 21 22 16
90 + 35 18 17 48.6 6 12 11 6
Age groups
Total Population Type of disability
26
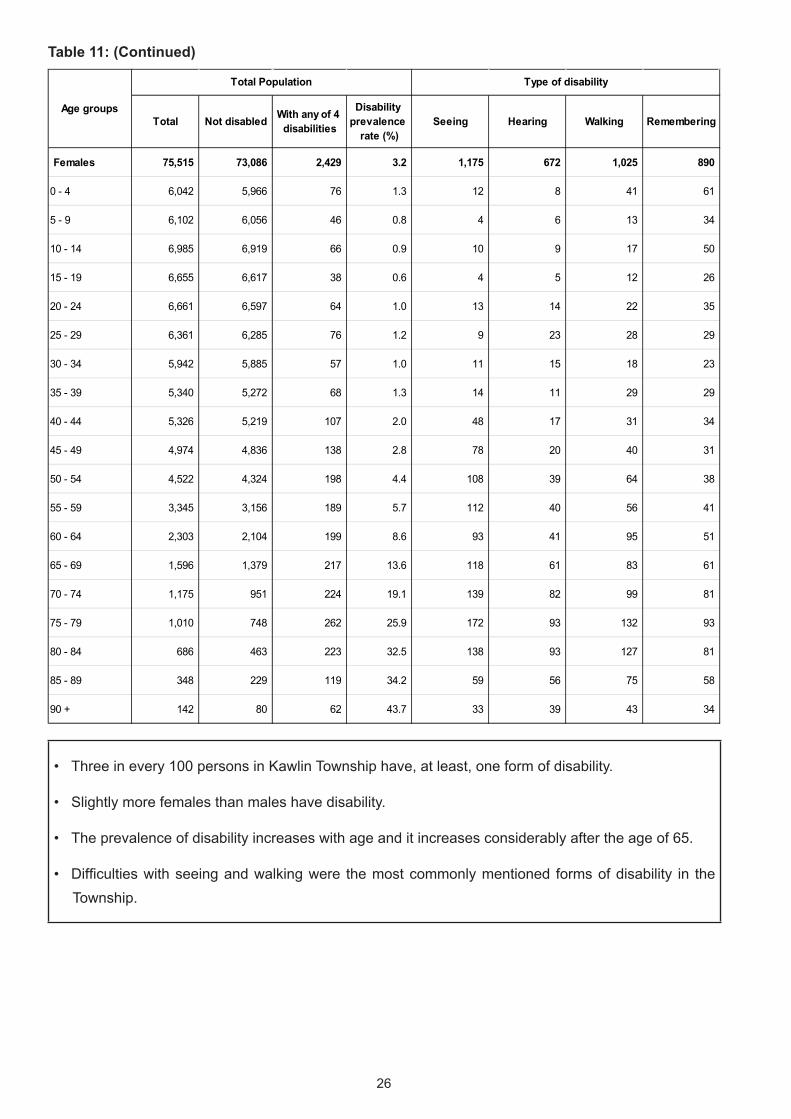
Table 11: (Continued)
• Three in every 100 persons in Kawlin Township have, at least, one form of disability.
• Slightly more females than males have disability.
• The prevalence of disability increases with age and it increases considerably after the age of 65.
• Difficulties with seeing and walking were the most commonly mentioned forms of disability in the Township.
Total Not disabled With any of 4 disabilities
Disability prevalence
rate (%)Seeing Hearing Walking Remembering
Females 75,515 73,086 2,429 3.2 1,175 672 1,025 890
0 - 4 6,042 5,966 76 1.3 12 8 41 61
5 - 9 6,102 6,056 46 0.8 4 6 13 34
10 - 14 6,985 6,919 66 0.9 10 9 17 50
15 - 19 6,655 6,617 38 0.6 4 5 12 26
20 - 24 6,661 6,597 64 1.0 13 14 22 35
25 - 29 6,361 6,285 76 1.2 9 23 28 29
30 - 34 5,942 5,885 57 1.0 11 15 18 23
35 - 39 5,340 5,272 68 1.3 14 11 29 29
40 - 44 5,326 5,219 107 2.0 48 17 31 34
45 - 49 4,974 4,836 138 2.8 78 20 40 31
50 - 54 4,522 4,324 198 4.4 108 39 64 38
55 - 59 3,345 3,156 189 5.7 112 40 56 41
60 - 64 2,303 2,104 199 8.6 93 41 95 51
65 - 69 1,596 1,379 217 13.6 118 61 83 61
70 - 74 1,175 951 224 19.1 139 82 99 81
75 - 79 1,010 748 262 25.9 172 93 132 93
80 - 84 686 463 223 32.5 138 93 127 81
85 - 89 348 229 119 34.2 59 56 75 58
90 + 142 80 62 43.7 33 39 43 34
Age groups
Total Population Type of disability

27
(G) Housing Conditions and Household Amenities
Type of housing unit
Table 12: Conventional households by type of housing unit by urban/rural
Note: * Less than 0.1 per cent.
• The majority of the households in Kawlin Township are living in wooden houses (51.9%) followed by households in bamboo houses (38.0%).
• Some 40.7 per cent of urban households and 53.8 per cent of rural households live in wooden houses.
Residence Total Apartment/ Condominium
Bungalow/ Brick house
Semi-paccahouse
Woodenhouse
Bamboo house
Hut 2 - 3 years Hut 1 year Other
Total 31,403 0.2 3.9 4.1 51.9 38.0 1.2 0.6 0.1
Urban 4,569 0.7 9.3 9.3 40.7 39.7 * 0.2 0.2
Rural 26,834 0.2 3.0 3.3 53.8 37.7 1.4 0.6 0.1

28
Type of toilet
Figure 14: Proportion of households with access to improved sanitation
Union : 74.3%
Sagaing Region : 71.6%
Katha District : 61.0%
Kawlin Township : 78.5%
29
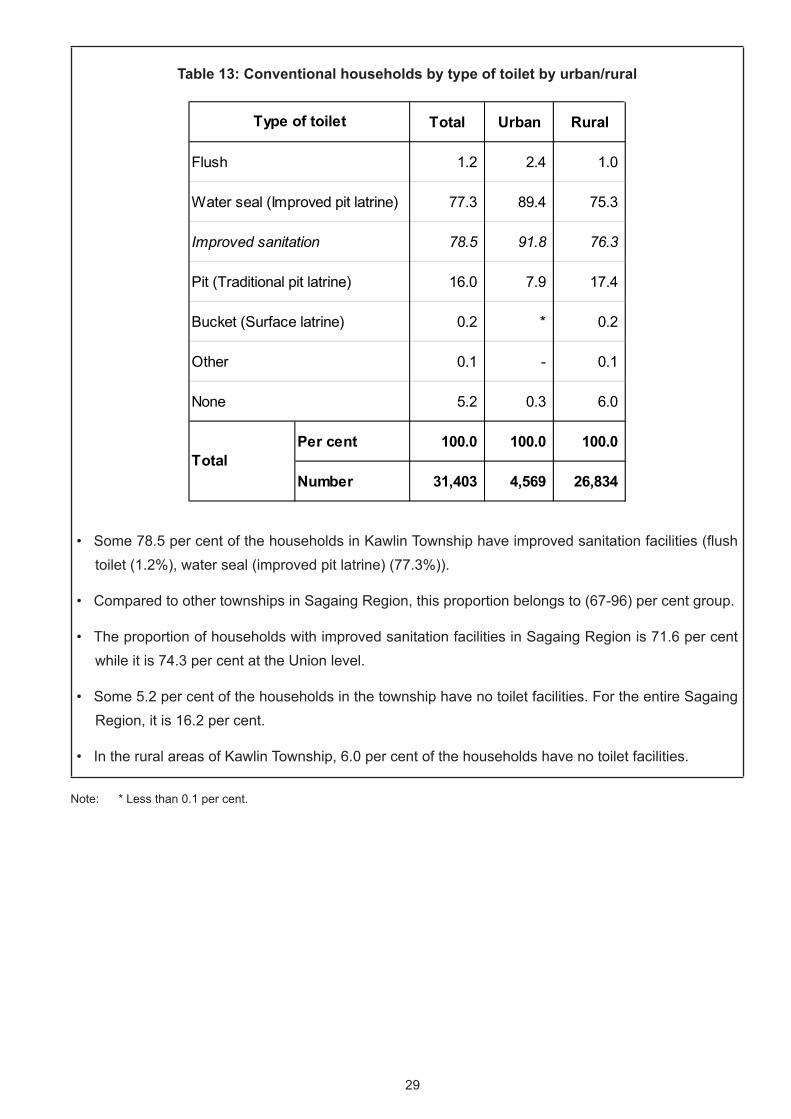
Table 13: Conventional households by type of toilet by urban/rural
• Some 78.5 per cent of the households in Kawlin Township have improved sanitation facilities (flush toilet (1.2%), water seal (improved pit latrine) (77.3%)).
• Compared to other townships in Sagaing Region, this proportion belongs to (67-96) per cent group.
• The proportion of households with improved sanitation facilities in Sagaing Region is 71.6 per cent while it is 74.3 per cent at the Union level.
• Some 5.2 per cent of the households in the township have no toilet facilities. For the entire Sagaing Region, it is 16.2 per cent.
• In the rural areas of Kawlin Township, 6.0 per cent of the households have no toilet facilities.
Note: * Less than 0.1 per cent.
Total Urban Rural
1.2 2.4 1.0
77.3 89.4 75.3
78.5 91.8 76.3
16.0 7.9 17.4
0.2 * 0.2
0.1 - 0.1
5.2 0.3 6.0
Per cent 100.0 100.0 100.0
Number 31,403 4,569 26,834
Type of toilet
Total
Flush
Water seal (Improved pit latrine)
Improved sanitation
Pit (Traditional pit latrine)
Bucket (Surface latrine)
Other
None

30
Source of drinking water
Figure 15: Proportion of households with access to improved source of drinking water
Union : 69.5%
Sagaing Region : 81.1%
Katha District : 87.0%
Kawlin Township : 85.4%
31
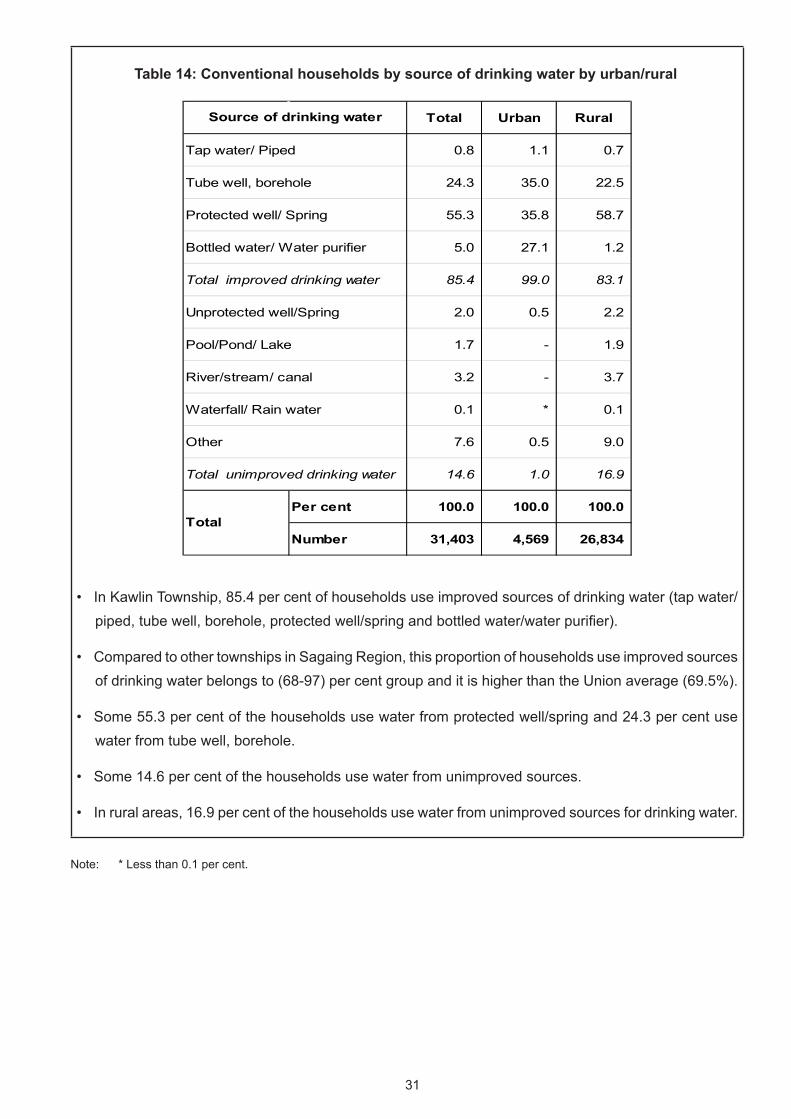
Table 14: Conventional households by source of drinking water by urban/rural
• In Kawlin Township, 85.4 per cent of households use improved sources of drinking water (tap water/piped, tube well, borehole, protected well/spring and bottled water/water purifier).
• Compared to other townships in Sagaing Region, this proportion of households use improved sources of drinking water belongs to (68-97) per cent group and it is higher than the Union average (69.5%).
• Some 55.3 per cent of the households use water from protected well/spring and 24.3 per cent use water from tube well, borehole.
• Some 14.6 per cent of the households use water from unimproved sources.
• In rural areas, 16.9 per cent of the households use water from unimproved sources for drinking water.
Note: * Less than 0.1 per cent.
Total Urban Rural
0.8 1.1 0.7
24.3 35.0 22.5
55.3 35.8 58.7
5.0 27.1 1.2
85.4 99.0 83.1
2.0 0.5 2.2
1.7 - 1.9
3.2 - 3.7
0.1 * 0.1
7.6 0.5 9.0
14.6 1.0 16.9
Per cent 100.0 100.0 100.0
Number 31,403 4,569 26,834
Total improved drinking water
Source of drinking water
Tap water/ Piped
Tube well, borehole
Protected well/ Spring
Bottled water/ Water purifier
Total
Unprotected well/Spring
Pool/Pond/ Lake
River/stream/ canal
Waterfall/ Rain water
Other
Total unimproved drinking water
32
Source of lighting
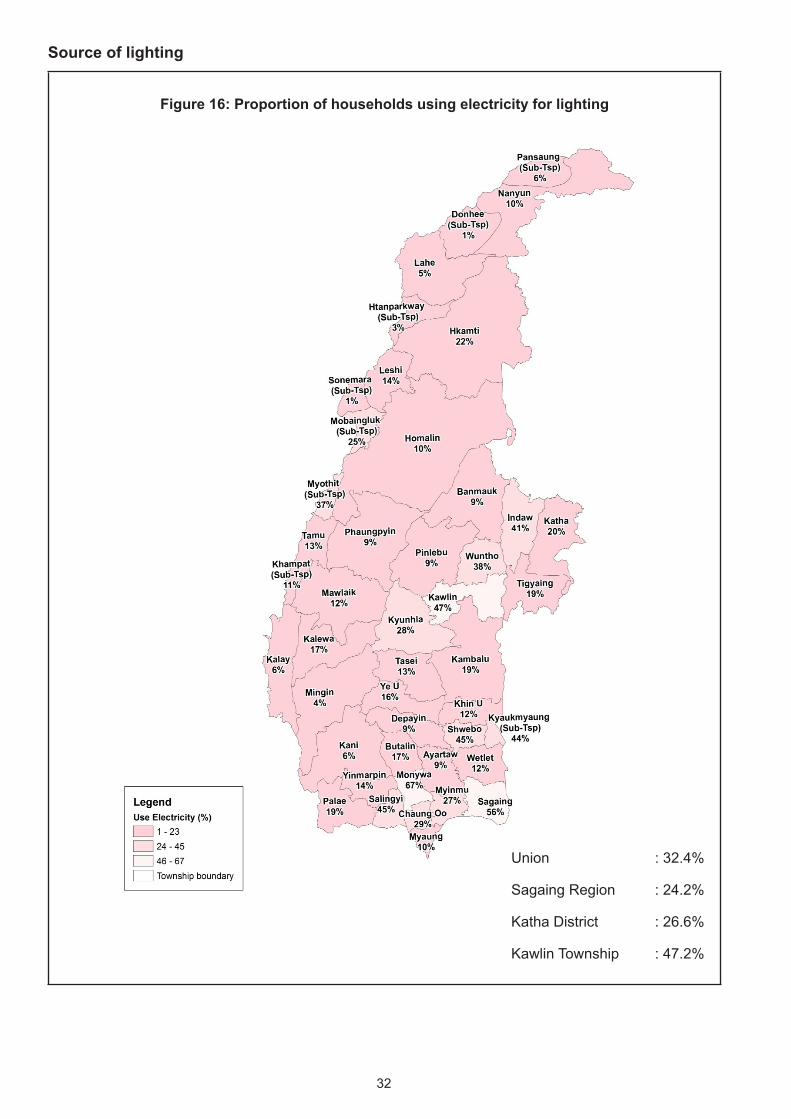
Figure 16: Proportion of households using electricity for lighting
Union : 32.4%
Sagaing Region : 24.2%
Katha District : 26.6%
Kawlin Township : 47.2%
33
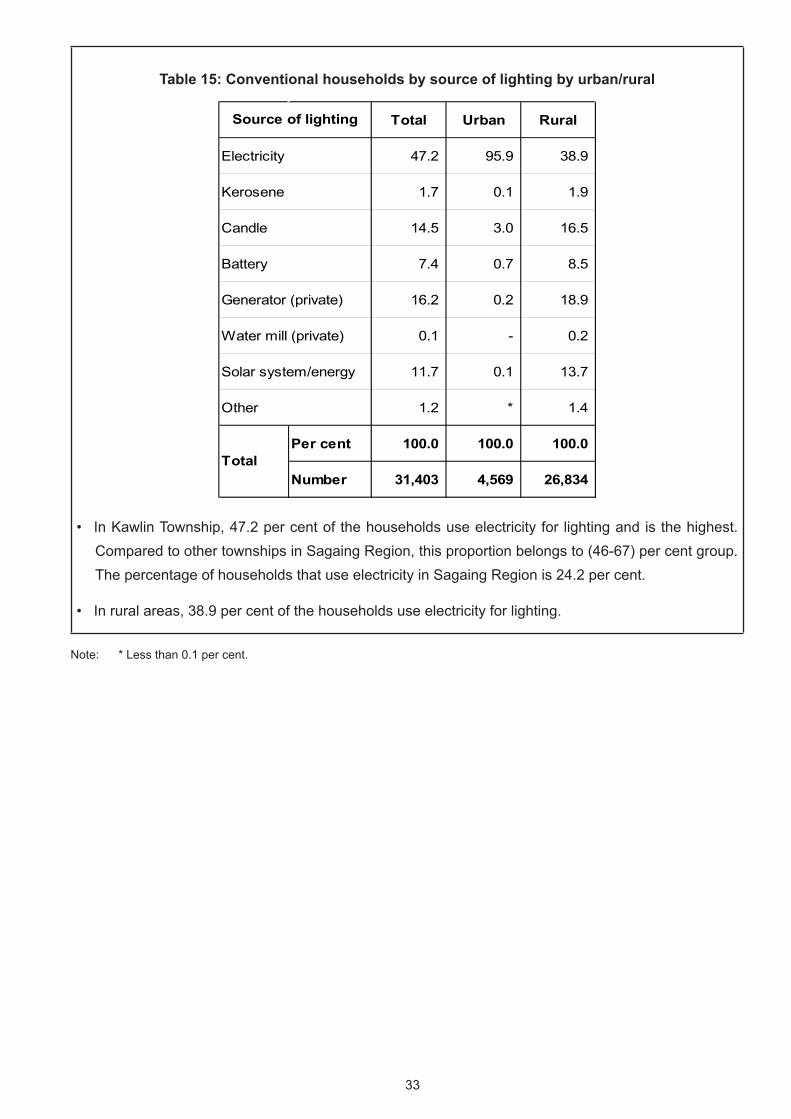
Table 15: Conventional households by source of lighting by urban/rural
• In Kawlin Township, 47.2 per cent of the households use electricity for lighting and is the highest. Compared to other townships in Sagaing Region, this proportion belongs to (46-67) per cent group. The percentage of households that use electricity in Sagaing Region is 24.2 per cent.
• In rural areas, 38.9 per cent of the households use electricity for lighting.
Note: * Less than 0.1 per cent.
Total Urban Rural
47.2 95.9 38.9
1.7 0.1 1.9
14.5 3.0 16.5
7.4 0.7 8.5
16.2 0.2 18.9
0.1 - 0.2
11.7 0.1 13.7
1.2 * 1.4
Per cent 100.0 100.0 100.0
Number 31,403 4,569 26,834
Water mill (private)
Solar system/energy
Other
Total
Source of lighting
Electricity
Kerosene
Candle
Battery
Generator (private)

34
Type of cooking fuel
Figure 17: Proportion of households using wood-related cooking fuel
Union : 81.0%
Sagaing Region : 90.2%
Katha District : 94.3%
Kawlin Township : 88.9%
35
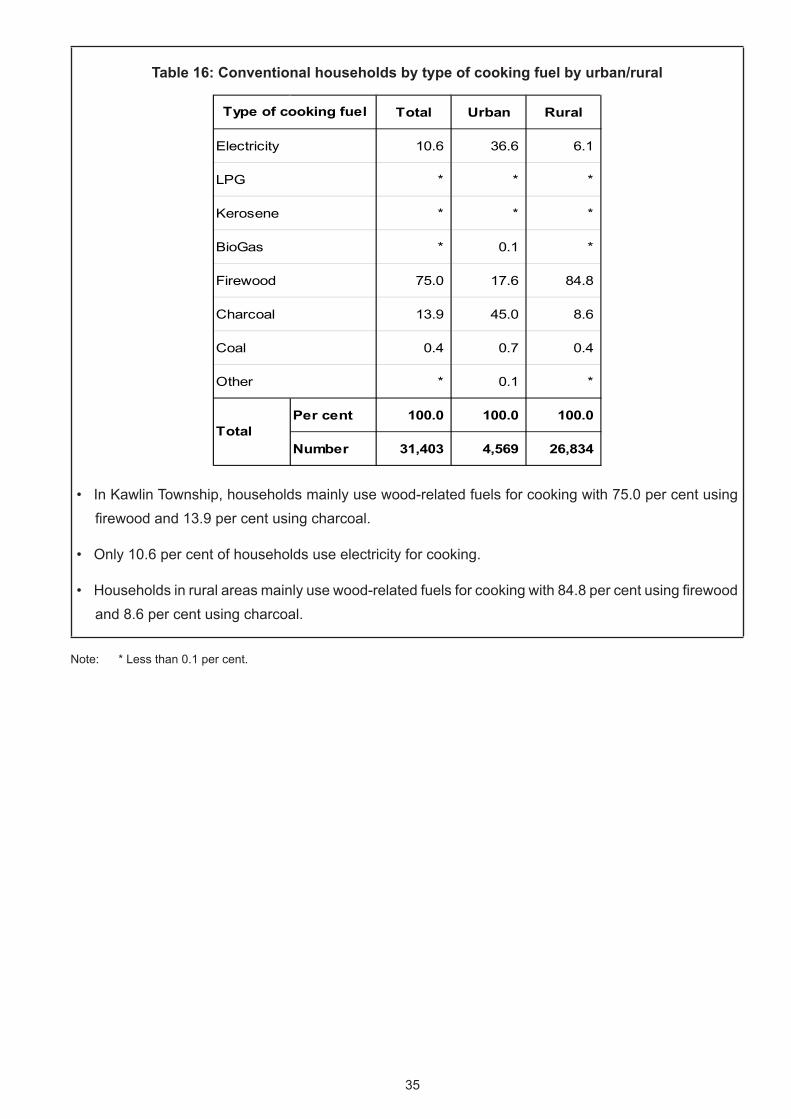
Table 16: Conventional households by type of cooking fuel by urban/rural
• In Kawlin Township, households mainly use wood-related fuels for cooking with 75.0 per cent using firewood and 13.9 per cent using charcoal.
• Only 10.6 per cent of households use electricity for cooking.
• Households in rural areas mainly use wood-related fuels for cooking with 84.8 per cent using firewood and 8.6 per cent using charcoal.
Note: * Less than 0.1 per cent.
Total Urban Rural
10.6 36.6 6.1
* * *
* * *
* 0.1 *
75.0 17.6 84.8
13.9 45.0 8.6
0.4 0.7 0.4
* 0.1 *
Per cent 100.0 100.0 100.0
Number 31,403 4,569 26,834
Charcoal
Coal
Other
Total
Type of cooking fuel
Electricity
LPG
Kerosene
BioGas
Firewood

36
Communication and related amenities
Table 17: Conventional households by availability of communication and related amenities by urban/rural
• Some 57.4 per cent of the households in Kawlin Township have access to television and is the highest among the access of communication and related amenities. In urban areas, 85.4 per cent of households have access to television, while the proportion for rural areas was 52.6 per cent and highest in each area respectively.
• In Kawlin Township, 57.4 per cent of the households have access to television and about one in three households (28.6%) reported having a radio.
Residence Conventional households Radio Television Land line
phoneMobile phone Computer Internet
at home% with none of
the items% with all of
the items
Total 31,403 28.6 57.4 6.8 19.8 1.8 2.7 29.8 0.2
Urban 4,569 14.2 85.4 16.6 60.8 5.3 9.8 10.4 0.8
Rural 26,834 31.1 52.6 5.1 12.9 1.2 1.4 33.1 0.1

37
Figure 19: Proportion of households with access to mobile phone
• Some 19.8 per cent of the households in Kawlin Township reported having mobile phones. Compared to other townships in Sagaing Region, it belongs to (18-34) per cent group.
Union : 32.9%
Sagaing Region : 21.7%
Katha District : 17.9%
Kawlin Township : 19.8%

38
Transportation items
Table 18: Conventional households by availability of transportation items by urban/rural
• In Kawlin Township, 70.1 per cent of the households have motorcycle/moped as a means of transport and it is the highest proportion, followed by 48.0 per cent of households having cart (bullock).
• Analysis by urban/rural residence, the majority of the households mainly use motorcycle/moped as a means of transport.
Region/District/Township Conventional households
Car/Truck/ Van
Motorcycle/ Moped Bicycle 4-Wheel
tractorCanoe/
Boat Motor boat Cart(bullock)
Sagaing Region 1,096,857 18,561 612,184 444,533 19,713 38,856 16,633 463,022
Urban 183,772 9,852 128,646 112,159 3,889 2,470 1,266 12,497
Rural 913,085 8,709 483,538 332,374 15,824 36,386 15,367 450,525
Katha District 167,956 2,696 107,052 53,868 3,859 11,914 4,923 90,248
Urban 20,015 720 14,286 12,180 596 407 242 1,545
Rural 147,941 1,976 92,766 41,688 3,263 11,507 4,681 88,703
Kawlin Township 31,403 672 22,014 13,392 849 485 197 15,063
Urban 4,569 187 3,492 3,096 144 2 1 87
Rural 26,834 485 18,522 10,296 705 483 196 14,976

39
(H) Fertility and Mortality
Fertility
• Age specific fertility rate is the highest at age group 25-29.
• For women aged 15-49, the total fertility rate is 2.1 children per woman and is slightly lower than the total fertility rate of 2.5 at the National level.
40
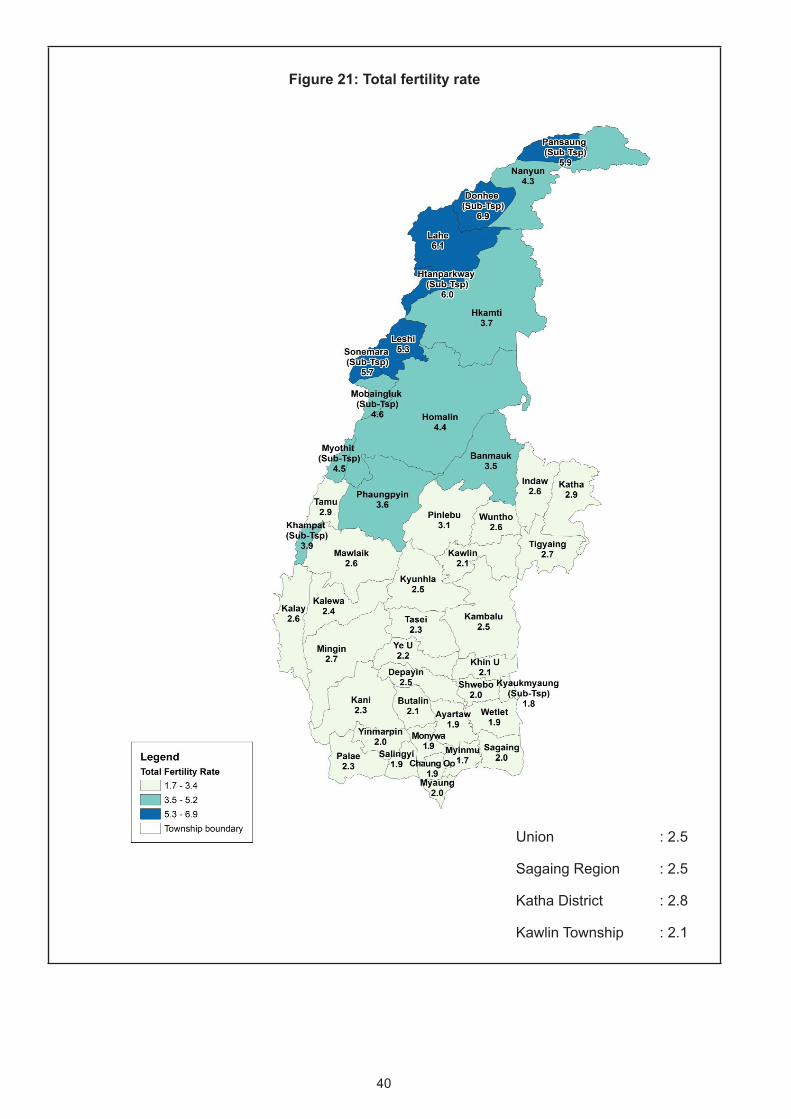
Figure 21: Total fertility rate
Union : 2.5
Sagaing Region : 2.5
Katha District : 2.8
Kawlin Township : 2.1

41
• The expectation of life at birth in Sagaing Region is 65.8 years and is higher than that of National level at 64.7 years.
• The female life expectancy at 70.4 years is higher than that of the males at 61.0 years.
Childhood Mortality and Maternal Mortality
• The Infant and Under 5 mortality rates in Katha District are higher than the Union average. The Infant mortality in Katha District is 71 deaths under age one per 1,000 live births while Under 5 mortality is 82 deaths under age 5 per 1,000 live births.
• The Infant and Under 5 mortality rates in Kawlin Township are lower than those of Sagaing Region and Katha District. The Infant mortality in Kawlin Township is 44 per 1,000 live births and Under 5 mortality is 51 per 1,000 live births.

42
• In Sagaing Region, there are 271 women dying while during pregnancy/delivery or within 42 days of termination of pregnancy for every 100,000 live births.
• The maternal mortality ratio in Sagaing Region is lower than that of the Union level.
• Compared to the average maternal mortality ratio of 140 for Southeast Asian countries, the maternal mortality ratio of 282 for Myanmar is high.
43
Definitions and Concepts
Population: The population in this report corresponds to the de-facto population of Myanmar on Census Night (see below).
Census Night: The night between the 29th and the 30th March 2014. Every person in Myanmar was enumerated where they spent the Census Night.
Rural area: Areas classified by the Department of General Administration (GAD) as village tracts. Generally these are areas with low population density and a land use which is predominantly agricultural.
Urban area: Areas classified by the GAD as wards. Generally these areas have an increased density of building structures, population and better infrastructural development.
Population Density: The population density relates to the number of persons in a given administrative area to the surface of the area, expressed in square kilometres (Km2). Areas covered by water are excluded from the calculation.
Mean Household Size: The average number of persons per household (people living in households divided by number of conventional households).
Sex ratio: The number of males for every 100 females in a population.
Dependency ratio: The total dependency ratio is the ratio of dependents (people younger than 15 years and older than 64) to the population of working-age (age 15-64). Data are shown as the proportion of dependents per 100 working-age population. Three different measures can be calculated: total dependency ratio, child dependency ratio and old age dependency ratio.
Child Dependency Ratio: is the proportion of people younger than 15 years to the working age population (15-64).
Old Dependency Ratio: is the proportion of people older than 64 years to the working age population (15-64).
Ageing Index: The number of persons aged 65 years and over per 100 people under the age of 15 years.
Median Age: The age that divides a population into two numerically equal groups; that is, half the people are younger than this age and half are older.
Education: Education is the process by which people learn through instruction and teaching. The 2014 MPHC placed an emphasis on literacy skills, school attendance and educational attainment. The other categorisations used under education were:
(a) Literacy: The ability to read and write in any language with reasonable understanding.
(b) School attendance: The attendance at any regular educational institution or systematic instruction at any level of education during the last 12 months. This included schooling at pre-primary, primary, middle, high school and tertiary institutions of higher learning. The options were: (a) Currently attending; (b) Attended previously; (c) Never attended.

44
(c) Educational Attainment: The highest grade/standard/diploma/degree completed within the most advanced level attended in the education system of the country where the education was received. It covered both public and private institutions accredited by government.
Disability: Disability is a situation where a person is at a greater risk than the general population of experiencing restrictions in performing routine activities (including activities of daily living) or participating in roles (such as work) if no supportive measures are offered. The difficulties covered in the 2014 census included:
(a) Walking difficulty (wheel chairs, crutches, limping, problems climbing steps);
(b) Seeing difficulty (low vision, blind);
(c) Hearing difficulty (partially or completely deaf);
(d) Mental/Intellectual difficulty (slow learning development making it hard to compete with their counterparts at school, other mental conditions).
Identity card: An identity card is a document used to verify aspects of a person›s personal identity. There are several types of identity cards issued by the Government of Myanmar, and national passports in the case of foreigners.
Labour Force Status: According to the type of usual economic activities during the 12 months before Census Night, all persons 10 years of age and over were classified as follows:
Labour Force: The Labour force is a general term covering “employed” and “unemployed” persons in the population.
Employed: “Employed” persons refer to those who did any work during the time of the week before the census date or worked for more than 6 months in the 12 months before the census date for pay or profit, such as a wage, salary, allowance, business profit, etc. Also included in this category were persons
45
working in family businesses, on a farm, in a store, in a private hospital etc., even though they were not paid any wages.
Unemployed: “Unemployed” persons refer to those who had no work but were able to work and actually seeking a job during the reference period, or at the time of the census enumeration.
Not in labour force: This category comprised persons who had no work and did not make any positive efforts to find a job during the 6 months before the census date or were unable to work. This included full time students, household work, elderly people, etc.
Employment Status: All employed persons were classified according to the economic activity status in the place where they worked during the last 12 months or if they worked in more than one place, where they worked most of the time. There were five employment categories:
(a) Employee (Government): those employed and working for government including in state organisation institutions.
(b) Employee (Private organisation): those employed and working for private employers or private organisations. All people in private companies, NGOs, international organisations, retail and wholesale enterprises fell under this category.
(c) Employer: persons who during the reference period worked in their own business, which also employed one or more other persons.
(d) Own account worker: self-employed persons who worked in their own business or worked in their own/family business for family gain and did not have any employees.
(e) Unpaid family worker: persons who worked in a business, farm, trade or professional enterprise operated by a member of the household/family and received no pay.
Labour force participation rate: The labour force participation rate is the ratio between the labour force and the overall size of the total population of the same age range. This is an important indicator as it portrays the proportion of the population that is economically active.
Labour force participation rate
=
Labour force (Employed + Unemployed) x 100
Total Population
Unemployment rate: The percentage of the total labour force that is unemployed but actively seeking employment and willing to work. These are people who are without work, looking for jobs and available for work.
Unemployment rate =Unemployed
x 100Labour force
(Employed + Unemployed)
46
Employtment to population ratio: A statistical ratio that measures the proportion of the country’s working-age population (ages 15 to 64) that is employed. The International Labour Organization (ILO) states that a person is considered employed if they have worked at least 1 hour in “gainful” employment in the most recent week.
Employment to population ratio
=Employed
x 100Total Population
Occupation: Occupation refers to the kind of work an employed person did in the establishment during the 12 months (reference period) before the census date. Put differently, occupation is the kind of work done during the last 12 months by the person employed, regardless of the industry of the establishment. In the 2014 Myanmar Census, field data collectors were instructed to collect a detailed description of the work being done such as accounts clerk, data entry operator (clerk), legal secretary, domestic worker, fisherman, human resource manager, etc. If an employed person was engaged in two or more jobs, the kind of work was decided by the work in which he/she was mainly engaged in, that is in terms of time. The occupational classification is based on the ISCO 2008.
Industry: Industry refers to the main activity of the establishment where an employed person usually worked during the 12 months (reference period) before the census date. In the 2014 Myanmar Census, industry was explained to the enumerators as the type of economic activity carried out at the person’s place of work. It is defined in terms of the kind of goods produced or services supplied by the enterprise in which the person works and not necessarily the specific duties or functions of the person’s job. For example, a clerical officer working in stores within a factory that makes television sets. The industry should be recorded as manufacture of electrical goods. If an employed person worked in two or more establishments, “industry” was decided by the establishment where he/she worked most. The industrial classification is based on the ISIC Revision 4.
Live Birth: A live birth is one where the infant shows one or more of the following signs of life immediately after birth: crying or similar sounds, movement of the limbs or any other parts of the body and/or any other tangible signs of life. The census was concerned only with children born alive. Also collected was information on the last live birth of ever married female respondents.
Total fertility rate (TFR): The average number of children that a woman would give birth to if all women lived to the end of their childbearing years and bore children according to the current schedule of age-specific fertility rates.
Age specific fertility rate (ASFR): The age-specific fertility rate measures the annual number of births to women of a specified age or age group per 1,000 women in that age group. Unless otherwise specified, the reference period for the age-specific fertility rates is the calendar year.

47
List of Contributors
Contributors to the Sagaing Region, Katha District, Kawlin Township Report
Name Institution RolePrepared by
Daw Myo Thandar Staff Officer, Department of Population Leader
U Thant Zin AungImmigration Assistant,
Department of Population Assistant
Daw Wint No No Htun Junior Clerk, Department of Population Assistant
Translator and Reviewer
U Aung Than UNFPA Consultant Translation and Review
Data Processing and IT Team
Daw Sandar Myint Deputy Director, Department of Population Programming and generation of tables
Daw Su Myat OoImmigration Assistant,
Department of PopulationGeneration of tables
Daw Aye Thiri Zaw Junior Clerk, Department of Population Generation of tables
Daw Lin Lin Mar Staff Officer, Department of Population Generation of maps
U Khee Reh Senior Clerk, Department of Population Generation of maps
Designer
U Naing Phyo Kyaw Staff Officer, Department of Population Graphic Designer
U Sai Maung Junior Clerk, Department of Population Graphic Designer


The Townships Reports
can be downloaded at :www.dop.gov.mm
or
http://myanmar.unfpa.org/census