Embed Size (px)
Citation preview

Safety Net Dental Clinic Finance 101 and 102……….
Ohio Oral Health Summit 2013
Mark Doherty DMD MPH
What can you expect to take away? • Some M and P! • What the critical financial data and reports
are and when you should get them • How to use that data to make informed
decisions • Some tools and strategies to incorporate
your financial goals into your practice
What Does Success Look like?
• What do we seek to accomplish in our dental program?
• What are our goals? • What are the outcomes that we seek ?
Vision
Creation of high-quality, affordable, oral health programs that document the improvement of the oral health status of the patients we treat while being financially responsible.
• Affordable • Quality Managed • Documented Outcomes • Financially Responsible
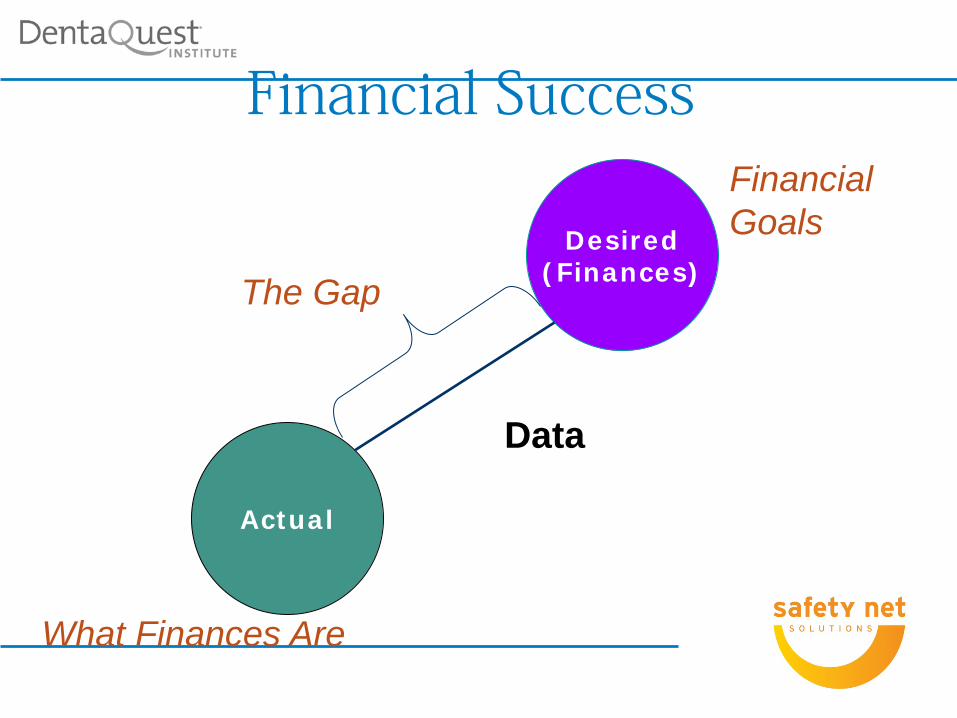
Financial Success
Actual
Desired (Finances)
What Finances Are
Financial Goals
The Gap
Data
What Does Financial Success Look Like? • Zero Variance? • Sustainability? • Viability? • Profit?
Define that Financial Success
• Clarity around the Vision Zero Variance
• Create a Plan to achieve that “success” • Establish Clarity around Goals, Roles and
Timelines
Clarity • Our Goals are_________ • My role is_________ • Your role is __________ • We need to get this done by_________
Ensuring Financial Sustainability “Community health dental programs provide high-quality clinical care to our nation’s most vulnerable residents. However, without a balance between mission focused-care and robust business practices, community health dental programs may jeopardize their own sustainability”
The Key Concepts to Managing for Sustainability
• You need good data to evaluate and measure dental’s performance
• Use this data to create a business plan for the dental department
• This business plan is a road map that shows the department how to achieve and maintain financial sustainability, maximize patient access and achieve meaningful and measurable quality outcomes
• Dental program performance evaluation should be part of a formal continuous quality improvement focus
• Dental program performance should also be regularly shared with staff to create a culture of accountability
The Business Plan
What the dental practice needs to accomplish to be financially sustainable, maximize patient access and provide meaningful quality outcomes
• Numbers and types of patients to be seen • Numbers, types and lengths of appointments • Scope of service for the practice • Staffing model
• Service delivery model • Hours of operation • Financial, productivity and quality goals to be met • Optimal payer mix • Evaluation plan
The Business Plan (cont.)
Timely and Meaningful Data
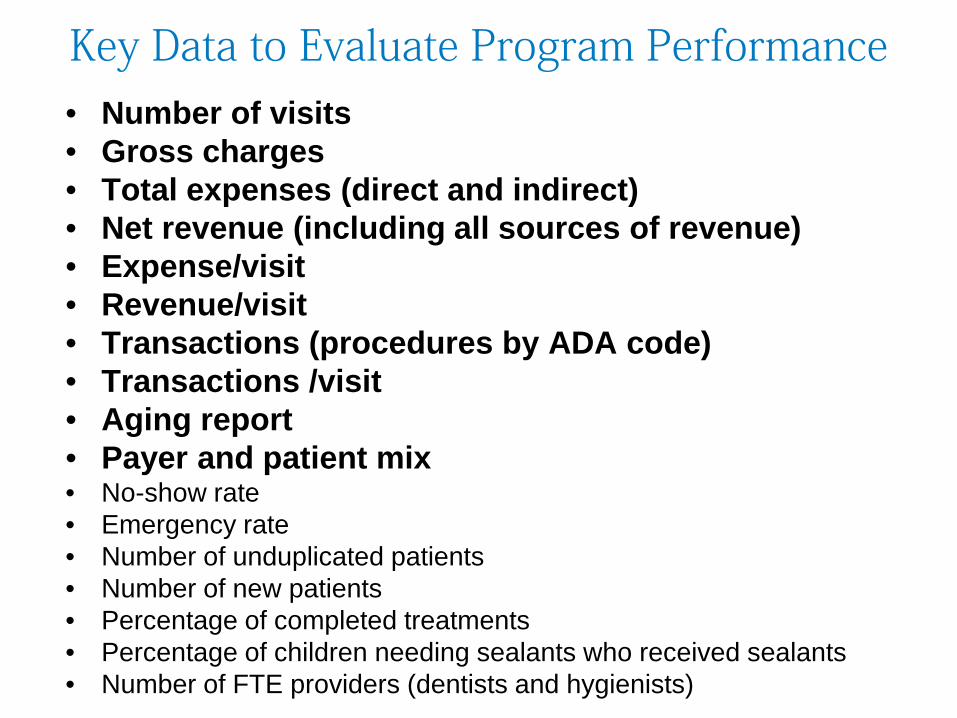
Key Data to Evaluate Program Performance • Number of visits • Gross charges • Total expenses (direct and indirect) • Net revenue (including all sources of revenue) • Expense/visit • Revenue/visit • Transactions (procedures by ADA code) • Transactions /visit • Aging report • Payer and patient mix • No-show rate • Emergency rate • Number of unduplicated patients • Number of new patients • Percentage of completed treatments • Percentage of children needing sealants who received sealants • Number of FTE providers (dentists and hygienists)

Evaluating Dental Program Performance
•Meaningful Data •Budget •Profit and Loss Statement •Variance Report •Reforecast
The Budget Slide 3 Questions
• How many of us have a budget? • How many of us help create our budget ? • How many of us use the budget?
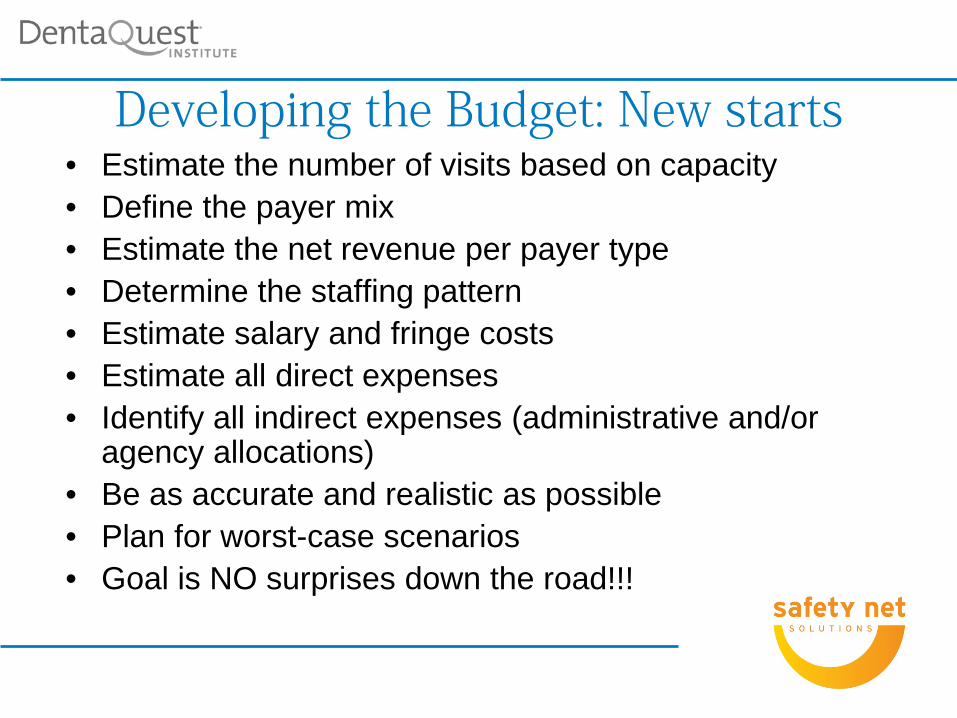
Developing the Budget: New starts • Estimate the number of visits based on capacity • Define the payer mix • Estimate the net revenue per payer type • Determine the staffing pattern • Estimate salary and fringe costs • Estimate all direct expenses • Identify all indirect expenses (administrative and/or
agency allocations) • Be as accurate and realistic as possible • Plan for worst-case scenarios • Goal is NO surprises down the road!!!
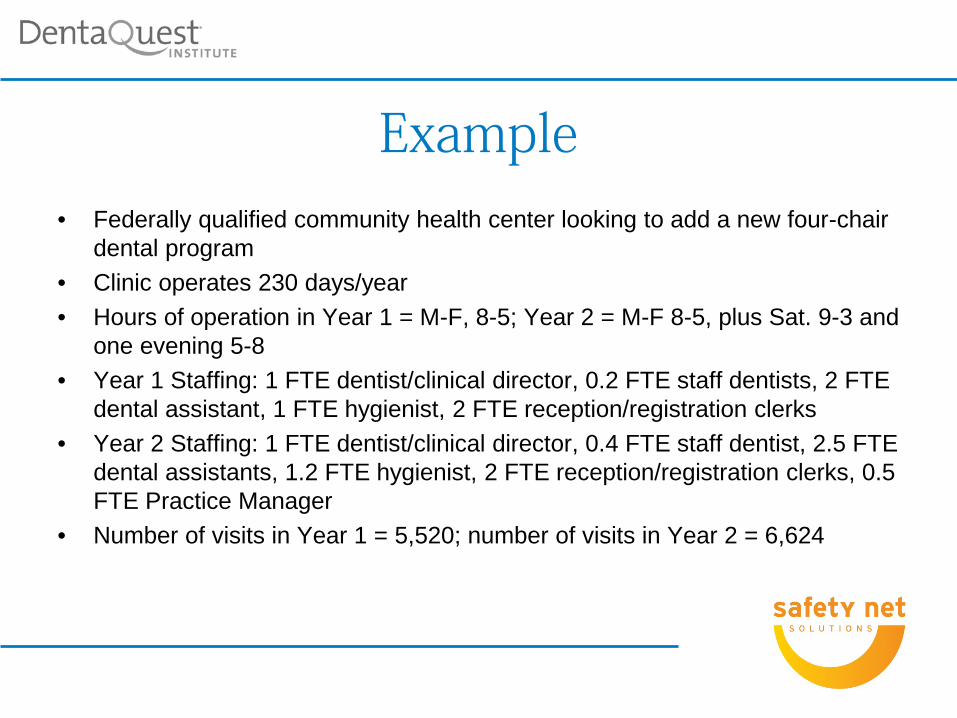
Example • Federally qualified community health center looking to add a new four-chair
dental program • Clinic operates 230 days/year • Hours of operation in Year 1 = M-F, 8-5; Year 2 = M-F 8-5, plus Sat. 9-3 and
one evening 5-8 • Year 1 Staffing: 1 FTE dentist/clinical director, 0.2 FTE staff dentists, 2 FTE
dental assistant, 1 FTE hygienist, 2 FTE reception/registration clerks • Year 2 Staffing: 1 FTE dentist/clinical director, 0.4 FTE staff dentist, 2.5 FTE
dental assistants, 1.2 FTE hygienist, 2 FTE reception/registration clerks, 0.5 FTE Practice Manager
• Number of visits in Year 1 = 5,520; number of visits in Year 2 = 6,624
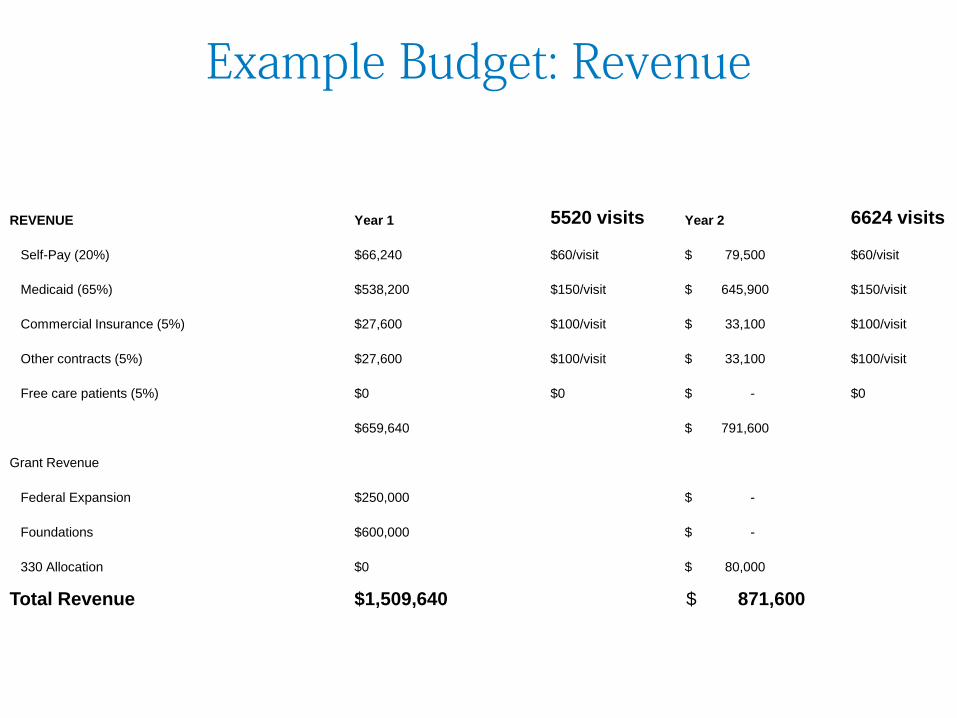
Example Budget: Revenue
REVENUE Year 1 5520 visits Year 2 6624 visits
Self-Pay (20%) $66,240 $60/visit $ 79,500 $60/visit
Medicaid (65%) $538,200 $150/visit $ 645,900 $150/visit
Commercial Insurance (5%) $27,600 $100/visit $ 33,100 $100/visit
Other contracts (5%) $27,600 $100/visit $ 33,100 $100/visit
Free care patients (5%) $0 $0 $ - $0
$659,640 $ 791,600
Grant Revenue
Federal Expansion $250,000 $ -
Foundations $600,000 $ -
330 Allocation $0 $ 80,000
Total Revenue $1,509,640 $ 871,600
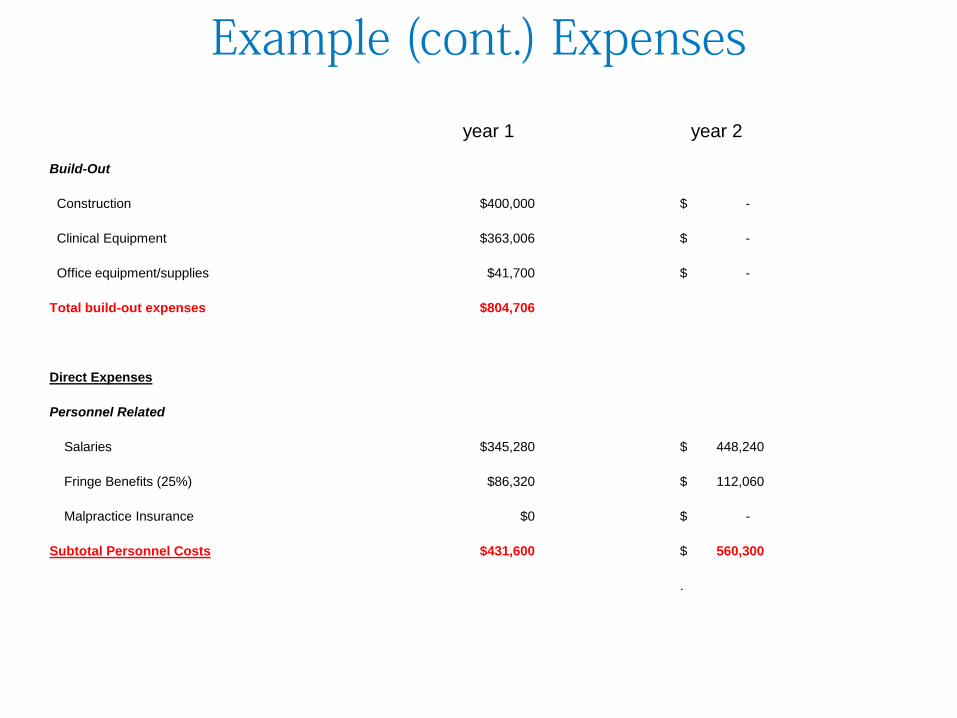
Example (cont.) Expenses
year 1 year 2
Build-Out
Construction $400,000 $ -
Clinical Equipment $363,006 $ -
Office equipment/supplies $41,700 $ -
Total build-out expenses $804,706
Direct Expenses
Personnel Related
Salaries $345,280 $ 448,240
Fringe Benefits (25%) $86,320 $ 112,060
Malpractice Insurance $0 $ -
Subtotal Personnel Costs $431,600 $ 560,300
.
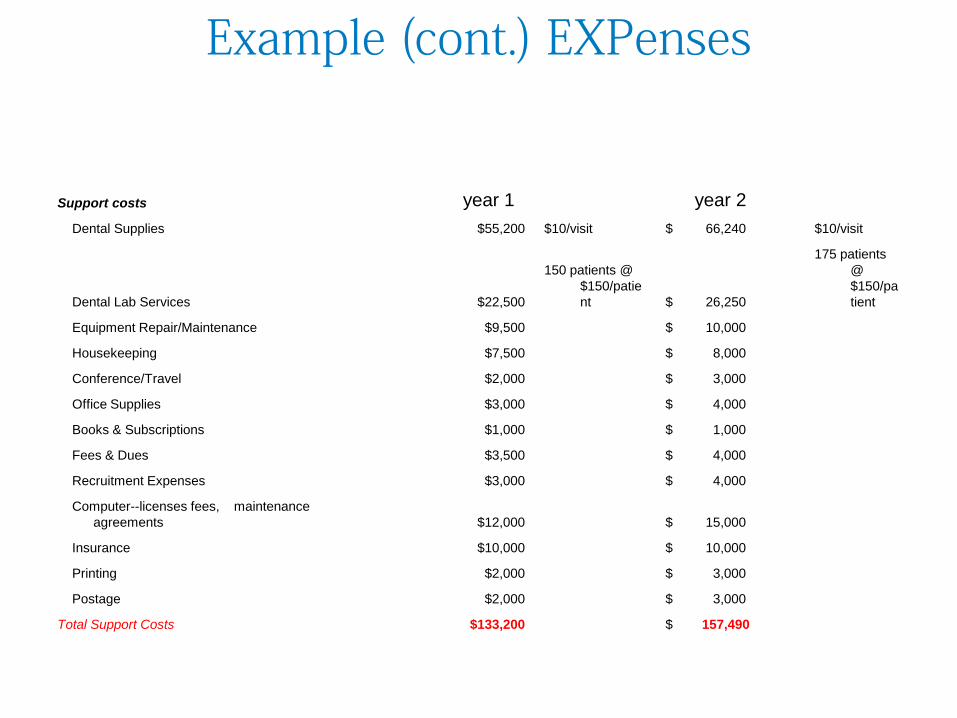
Example (cont.) EXPenses
Support costs year 1 year 2 Dental Supplies $55,200 $10/visit $ 66,240 $10/visit
Dental Lab Services $22,500
150 patients @ $150/patient $ 26,250
175 patients @ $150/patient
Equipment Repair/Maintenance $9,500 $ 10,000
Housekeeping $7,500 $ 8,000
Conference/Travel $2,000 $ 3,000
Office Supplies $3,000 $ 4,000
Books & Subscriptions $1,000 $ 1,000
Fees & Dues $3,500 $ 4,000
Recruitment Expenses $3,000 $ 4,000
Computer--licenses fees, maintenance agreements $12,000 $ 15,000
Insurance $10,000 $ 10,000
Printing $2,000 $ 3,000
Postage $2,000 $ 3,000
Total Support Costs $133,200 $ 157,490
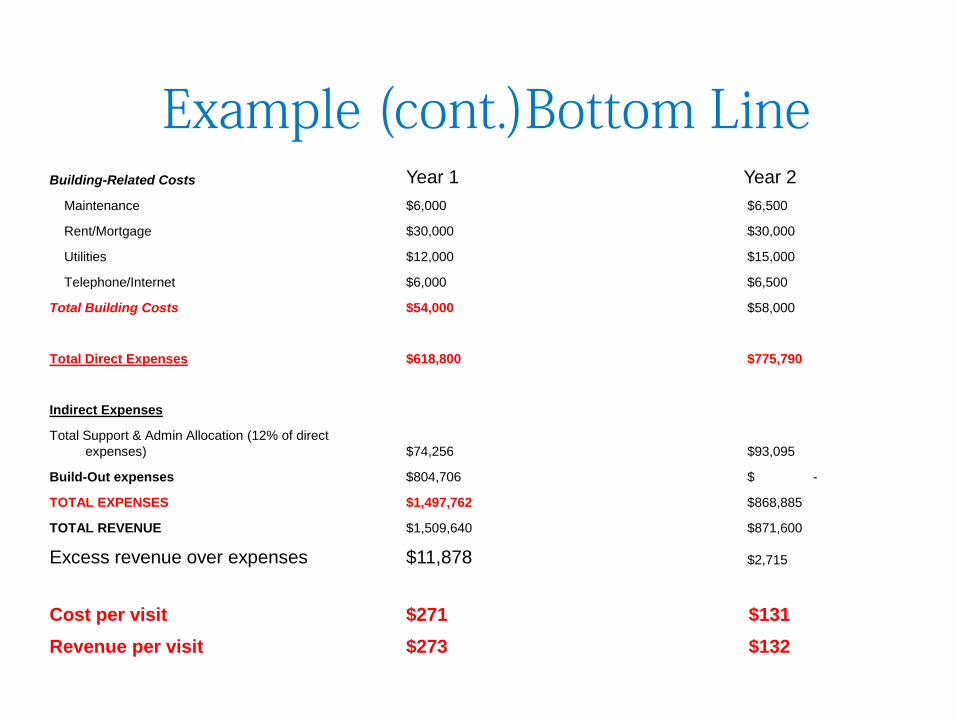
Example (cont.)Bottom Line Building-Related Costs Year 1 Year 2 Maintenance $6,000 $6,500
Rent/Mortgage $30,000 $30,000
Utilities $12,000 $15,000
Telephone/Internet $6,000 $6,500
Total Building Costs $54,000 $58,000
Total Direct Expenses $618,800 $775,790
Indirect Expenses
Total Support & Admin Allocation (12% of direct expenses) $74,256 $93,095
Build-Out expenses $804,706 $ -
TOTAL EXPENSES $1,497,762 $868,885
TOTAL REVENUE $1,509,640 $871,600
Excess revenue over expenses $11,878 $2,715
Cost per visit $271 $131 Revenue per visit $273 $132
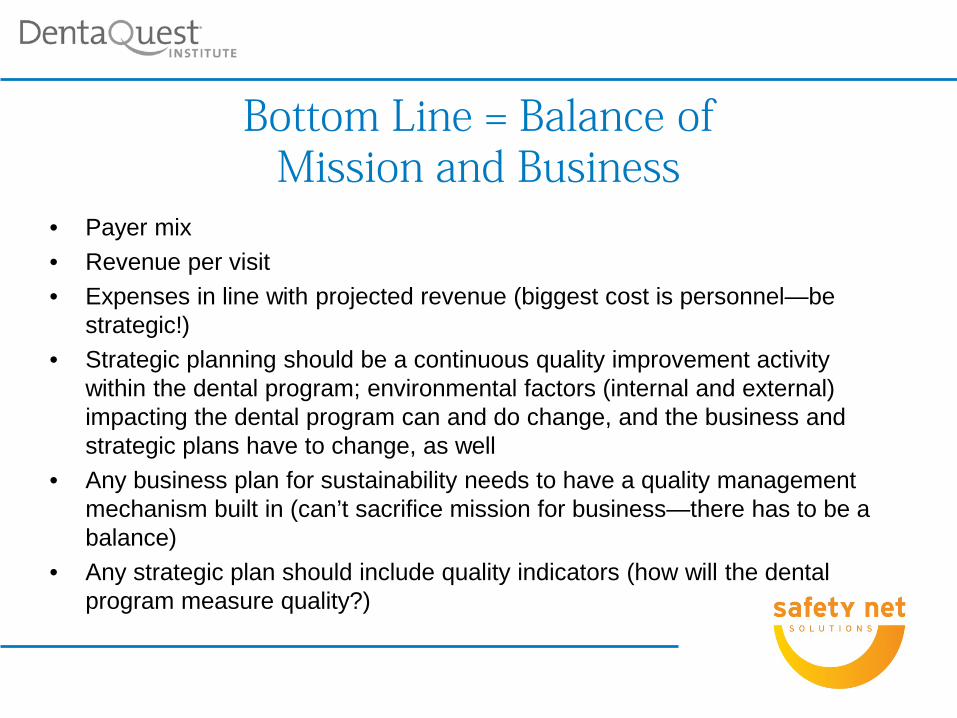
Bottom Line = Balance of Mission and Business
• Payer mix • Revenue per visit • Expenses in line with projected revenue (biggest cost is personnel—be
strategic!) • Strategic planning should be a continuous quality improvement activity
within the dental program; environmental factors (internal and external) impacting the dental program can and do change, and the business and strategic plans have to change, as well
• Any business plan for sustainability needs to have a quality management mechanism built in (can’t sacrifice mission for business—there has to be a balance)
• Any strategic plan should include quality indicators (how will the dental program measure quality?)
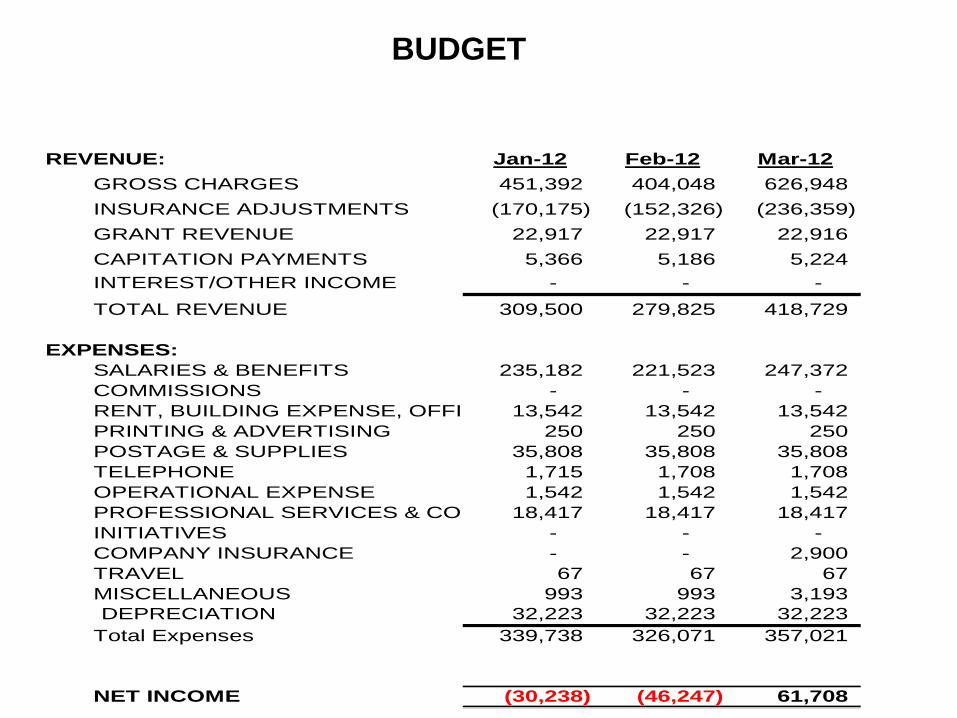
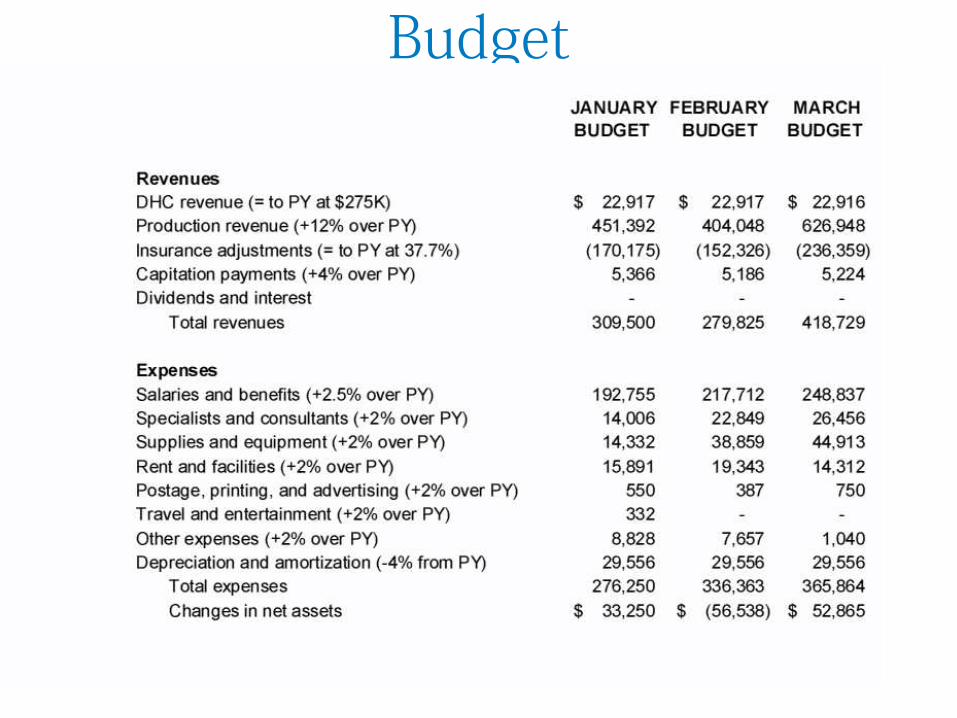
REVENUE: Jan-12 Feb-12 Mar-12GROSS CHARGES 451,392 404,048 626,948 INSURANCE ADJUSTMENTS (170,175) (152,326) (236,359) GRANT REVENUE 22,917 22,917 22,916 CAPITATION PAYMENTS 5,366 5,186 5,224 INTEREST/OTHER INCOME - - - TOTAL REVENUE 309,500 279,825 418,729
EXPENSES:SALARIES & BENEFITS 235,182 221,523 247,372 COMMISSIONS - - - RENT, BUILDING EXPENSE, OFFI 13,542 13,542 13,542 PRINTING & ADVERTISING 250 250 250 POSTAGE & SUPPLIES 35,808 35,808 35,808 TELEPHONE 1,715 1,708 1,708 OPERATIONAL EXPENSE 1,542 1,542 1,542 PROFESSIONAL SERVICES & CO 18,417 18,417 18,417 INITIATIVES - - - COMPANY INSURANCE - - 2,900 TRAVEL 67 67 67 MISCELLANEOUS 993 993 3,193 DEPRECIATION 32,223 32,223 32,223
Total Expenses 339,738 326,071 357,021
NET INCOME (30,238) (46,247) 61,708
BUDGET
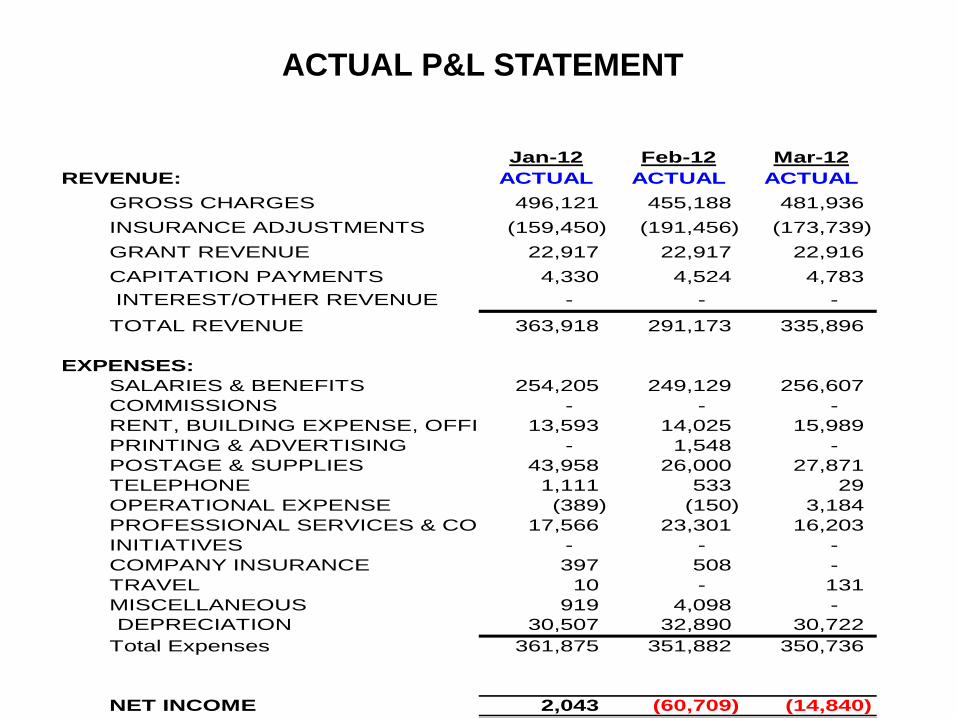
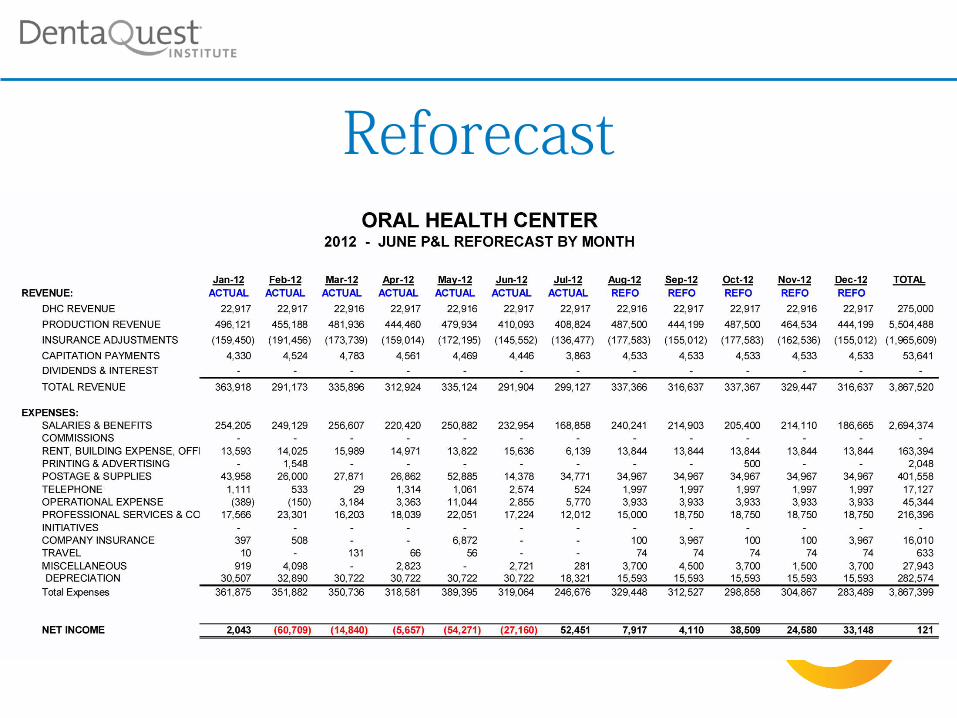
Jan-12 Feb-12 Mar-12REVENUE: ACTUAL ACTUAL ACTUAL
GROSS CHARGES 496,121 455,188 481,936 INSURANCE ADJUSTMENTS (159,450) (191,456) (173,739) GRANT REVENUE 22,917 22,917 22,916 CAPITATION PAYMENTS 4,330 4,524 4,783 INTEREST/OTHER REVENUE - - - TOTAL REVENUE 363,918 291,173 335,896
EXPENSES:SALARIES & BENEFITS 254,205 249,129 256,607 COMMISSIONS - - - RENT, BUILDING EXPENSE, OFFI 13,593 14,025 15,989 PRINTING & ADVERTISING - 1,548 - POSTAGE & SUPPLIES 43,958 26,000 27,871 TELEPHONE 1,111 533 29 OPERATIONAL EXPENSE (389) (150) 3,184 PROFESSIONAL SERVICES & CO 17,566 23,301 16,203 INITIATIVES - - - COMPANY INSURANCE 397 508 - TRAVEL 10 - 131 MISCELLANEOUS 919 4,098 - DEPRECIATION 30,507 32,890 30,722
Total Expenses 361,875 351,882 350,736
NET INCOME 2,043 (60,709) (14,840)
ACTUAL P&L STATEMENT
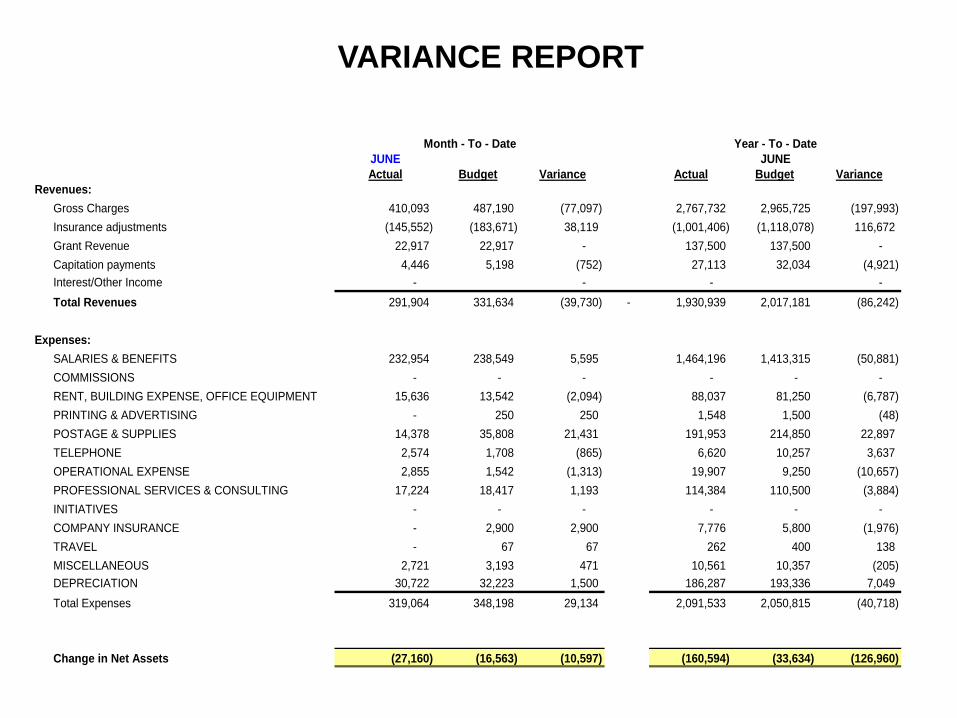
JUNEActual Budget Variance Actual Budget Variance
Revenues: Gross Charges 410,093 487,190 (77,097) 2,767,732 2,965,725 (197,993) Insurance adjustments (145,552) (183,671) 38,119 (1,001,406) (1,118,078) 116,672 Grant Revenue 22,917 22,917 - 137,500 137,500 - Capitation payments 4,446 5,198 (752) 27,113 32,034 (4,921) Interest/Other Income - - - - Total Revenues 291,904 331,634 (39,730) - 1,930,939 2,017,181 (86,242)
Expenses:SALARIES & BENEFITS 232,954 238,549 5,595 1,464,196 1,413,315 (50,881) COMMISSIONS - - - - - - RENT, BUILDING EXPENSE, OFFICE EQUIPMENT 15,636 13,542 (2,094) 88,037 81,250 (6,787) PRINTING & ADVERTISING - 250 250 1,548 1,500 (48) POSTAGE & SUPPLIES 14,378 35,808 21,431 191,953 214,850 22,897 TELEPHONE 2,574 1,708 (865) 6,620 10,257 3,637 OPERATIONAL EXPENSE 2,855 1,542 (1,313) 19,907 9,250 (10,657) PROFESSIONAL SERVICES & CONSULTING 17,224 18,417 1,193 114,384 110,500 (3,884) INITIATIVES - - - - - - COMPANY INSURANCE - 2,900 2,900 7,776 5,800 (1,976) TRAVEL - 67 67 262 400 138 MISCELLANEOUS 2,721 3,193 471 10,561 10,357 (205) DEPRECIATION 30,722 32,223 1,500 186,287 193,336 7,049 Total Expenses 319,064 348,198 29,134 2,091,533 2,050,815 (40,718)
Change in Net Assets (27,160) (16,563) (10,597) (160,594) (33,634) (126,960)
Month - To - Date Year - To - DateJUNE
VARIANCE REPORT
Reforecast
Budget
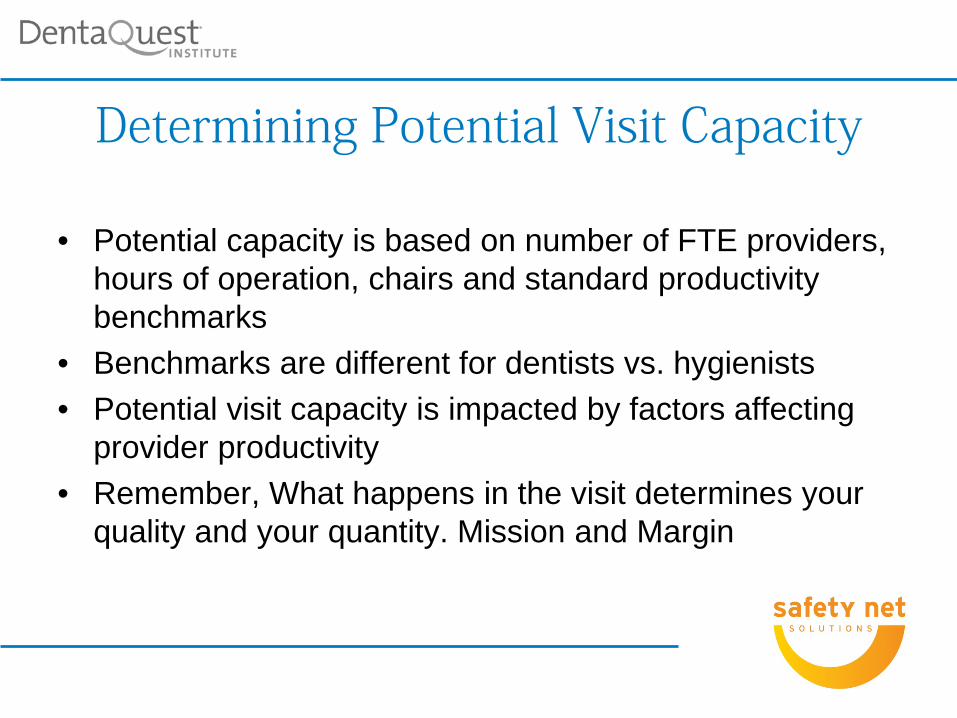
Determining Potential Visit Capacity
• Potential capacity is based on number of FTE providers, hours of operation, chairs and standard productivity benchmarks
• Benchmarks are different for dentists vs. hygienists • Potential visit capacity is impacted by factors affecting
provider productivity • Remember, What happens in the visit determines your
quality and your quantity. Mission and Margin
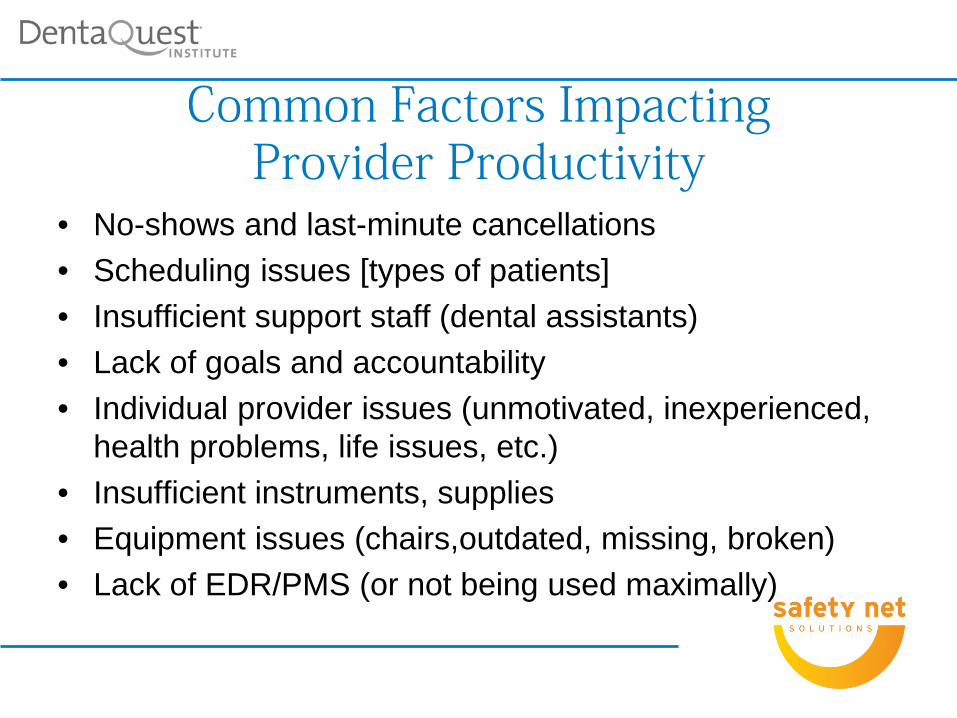
Common Factors Impacting Provider Productivity
• No-shows and last-minute cancellations • Scheduling issues [types of patients] • Insufficient support staff (dental assistants) • Lack of goals and accountability • Individual provider issues (unmotivated, inexperienced,
health problems, life issues, etc.) • Insufficient instruments, supplies • Equipment issues (chairs,outdated, missing, broken) • Lack of EDR/PMS (or not being used maximally)
Predictability • Standardization leads to predictability
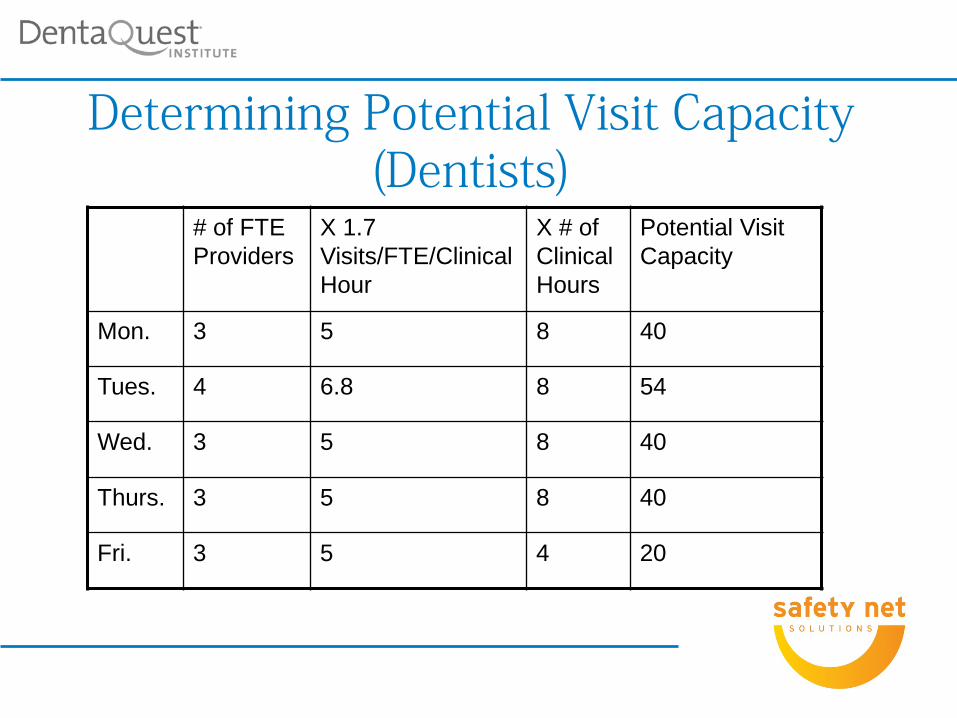
Determining Potential Visit Capacity (Dentists)
# of FTE Providers
X 1.7 Visits/FTE/Clinical Hour
X # of Clinical Hours
Potential Visit Capacity
Mon. 3 5 8 40
Tues. 4 6.8 8 54
Wed. 3 5 8 40
Thurs. 3 5 8 40
Fri. 3 5 4 20
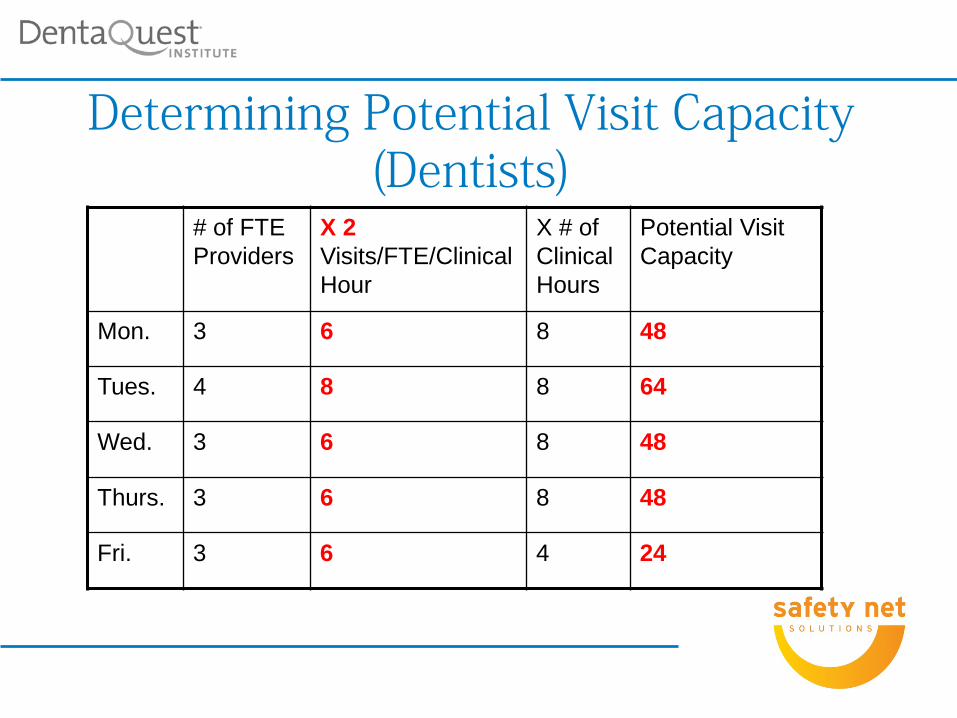
Determining Potential Visit Capacity (Dentists)
# of FTE Providers
X 2 Visits/FTE/Clinical Hour
X # of Clinical Hours
Potential Visit Capacity
Mon. 3 6 8 48
Tues. 4 8 8 64
Wed. 3 6 8 48
Thurs. 3 6 8 48
Fri. 3 6 4 24
Remember: Clarity Around • Goals • Roles • Timelines • Responsibilities
Production • Production can be measured by gross charges,
revenue and number of visits • If measured by gross charges you must know
what your collection rate is • Each provider in the dental department should
have individual production goals that tie in with the dental departments overall goals
• Each member of the staff should know what it cost to see a patient. [visits/expenses]
Setting Goals: Provider Productivity
• Use benchmarks (1.7 visits/hour for dentists, 1.25 visits/hour for hygienists, 1 visit/hour for externs and new residents)
• Benchmark x number of daily clinical time = total number of visits/day/provider (eg, 1.7 x 8 hours = 14 visits)
• Goal for procedures per visit: 2-5 (for basic dental program serving mix adults and children)
• Revenue goals need to be based on overall costs of running program
Productivity Benchmarks
• 1.7 encounters/FTE dentist/hour • 13.6 encounters/8-hour day/FTE dentist • 2,500-3,200 encounters/year/FTE dentist • 1,300-1,600 encounters/year/FTE hygienist • 8-10 encounters/8-hour day/FTE hygienist • 3-9 procedures per visit (depending on age of
patient)
Dental Procedures • Transactions are procedures with ADA codes attached to
them • Transaction reports reveal the scope of service for the
practice, as well as what is happening at the visit level • Look at number and types of procedures that are non-
Medicaid covered • Total number of procedures ÷ total number of visits =
procedures/visit (important measure of productivity and ability to complete treatment plans in a timely manner)
• Break out procedures by type (diagnostic, preventive, restorative, specialty, prosthodontics, oral surgery and emergency)
• Calculate percentage of each type to reveal scope of service
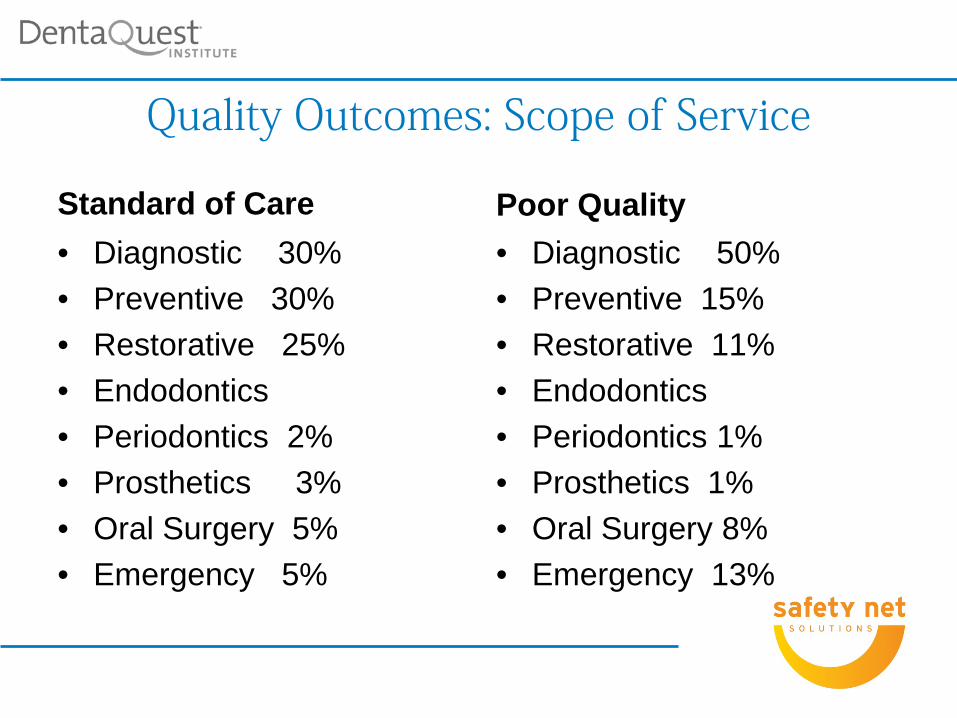
Quality Outcomes: Scope of Service
Standard of Care • Diagnostic 30% • Preventive 30% • Restorative 25% • Endodontics • Periodontics 2% • Prosthetics 3% • Oral Surgery 5% • Emergency 5%
Poor Quality • Diagnostic 50% • Preventive 15% • Restorative 11% • Endodontics • Periodontics 1% • Prosthetics 1% • Oral Surgery 8% • Emergency 13%
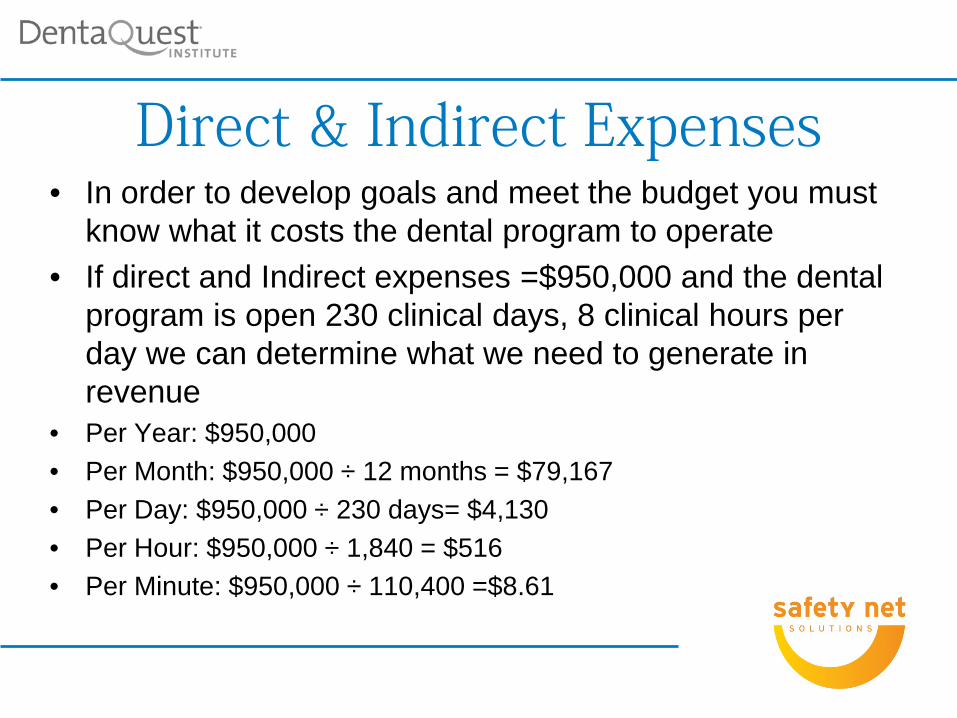
Direct & Indirect Expenses • In order to develop goals and meet the budget you must
know what it costs the dental program to operate • If direct and Indirect expenses =$950,000 and the dental
program is open 230 clinical days, 8 clinical hours per day we can determine what we need to generate in revenue
• Per Year: $950,000 • Per Month: $950,000 ÷ 12 months = $79,167 • Per Day: $950,000 ÷ 230 days= $4,130 • Per Hour: $950,000 ÷ 1,840 = $516 • Per Minute: $950,000 ÷ 110,400 =$8.61
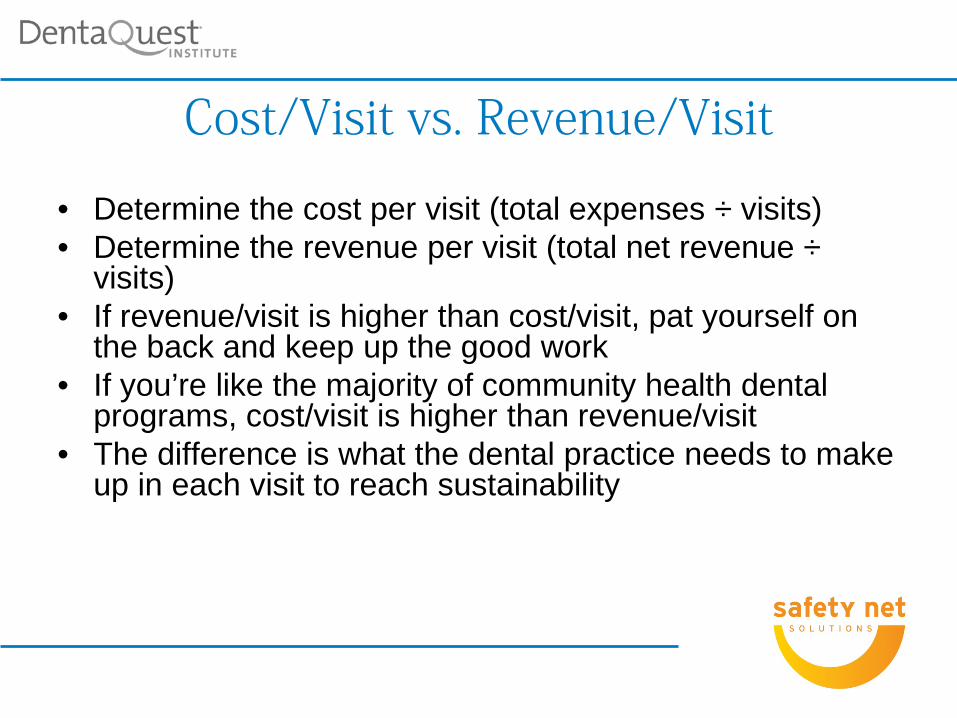
Cost/Visit vs. Revenue/Visit
• Determine the cost per visit (total expenses ÷ visits) • Determine the revenue per visit (total net revenue ÷
visits) • If revenue/visit is higher than cost/visit, pat yourself on
the back and keep up the good work • If you’re like the majority of community health dental
programs, cost/visit is higher than revenue/visit • The difference is what the dental practice needs to make
up in each visit to reach sustainability
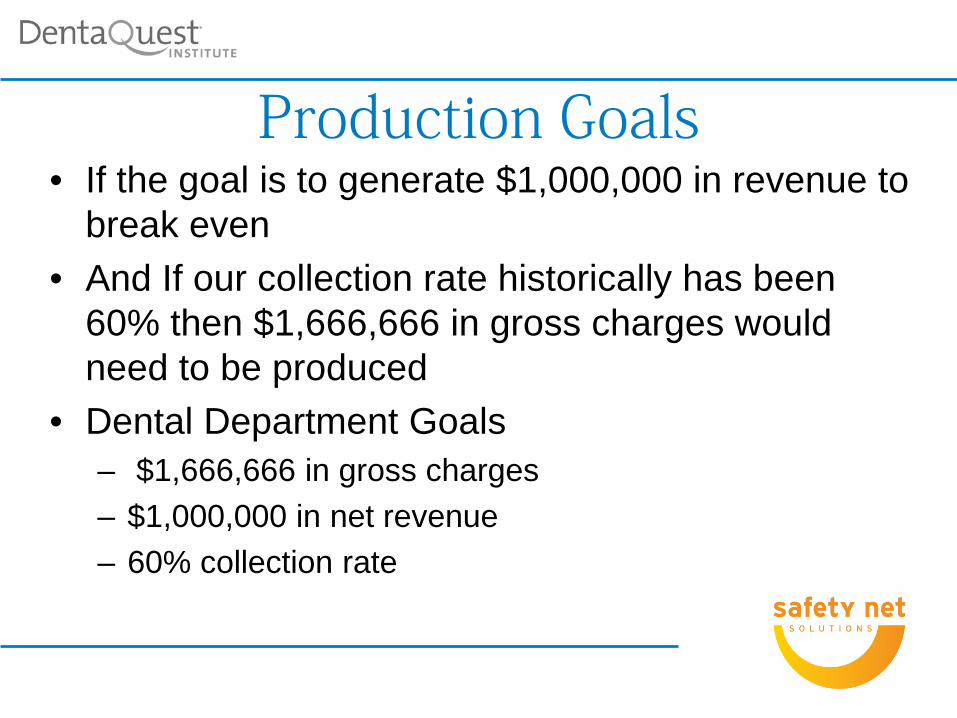
Production Goals • If the goal is to generate $1,000,000 in revenue to
break even • And If our collection rate historically has been
60% then $1,666,666 in gross charges would need to be produced
• Dental Department Goals – $1,666,666 in gross charges – $1,000,000 in net revenue – 60% collection rate
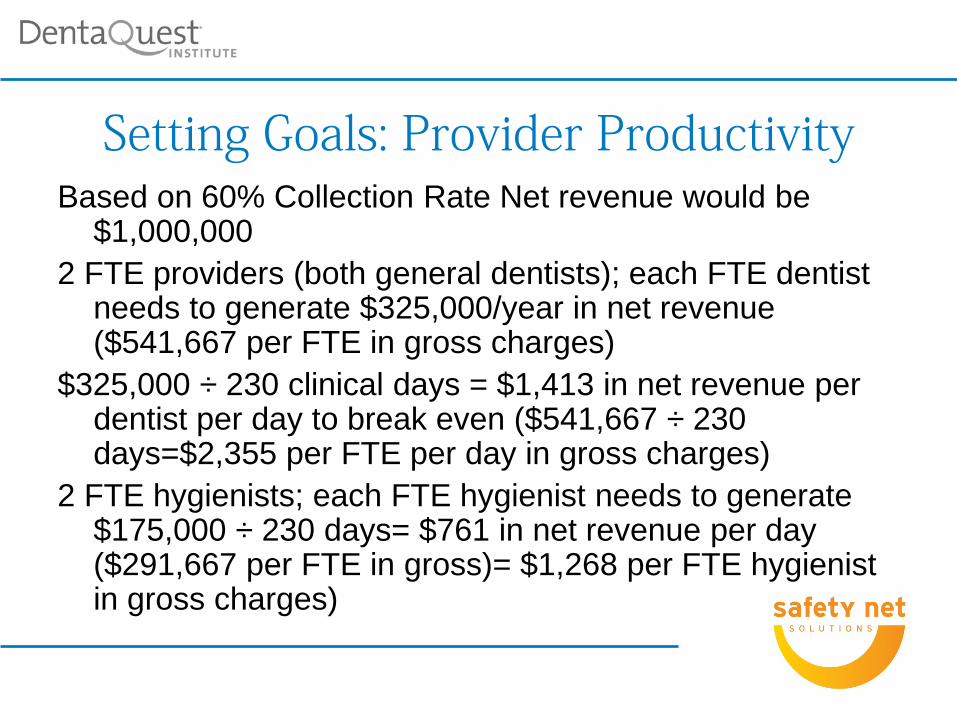
Based on 60% Collection Rate Net revenue would be $1,000,000
2 FTE providers (both general dentists); each FTE dentist needs to generate $325,000/year in net revenue ($541,667 per FTE in gross charges)
$325,000 ÷ 230 clinical days = $1,413 in net revenue per dentist per day to break even ($541,667 ÷ 230 days=$2,355 per FTE per day in gross charges)
2 FTE hygienists; each FTE hygienist needs to generate $175,000 ÷ 230 days= $761 in net revenue per day ($291,667 per FTE in gross)= $1,268 per FTE hygienist in gross charges)
Setting Goals: Provider Productivity
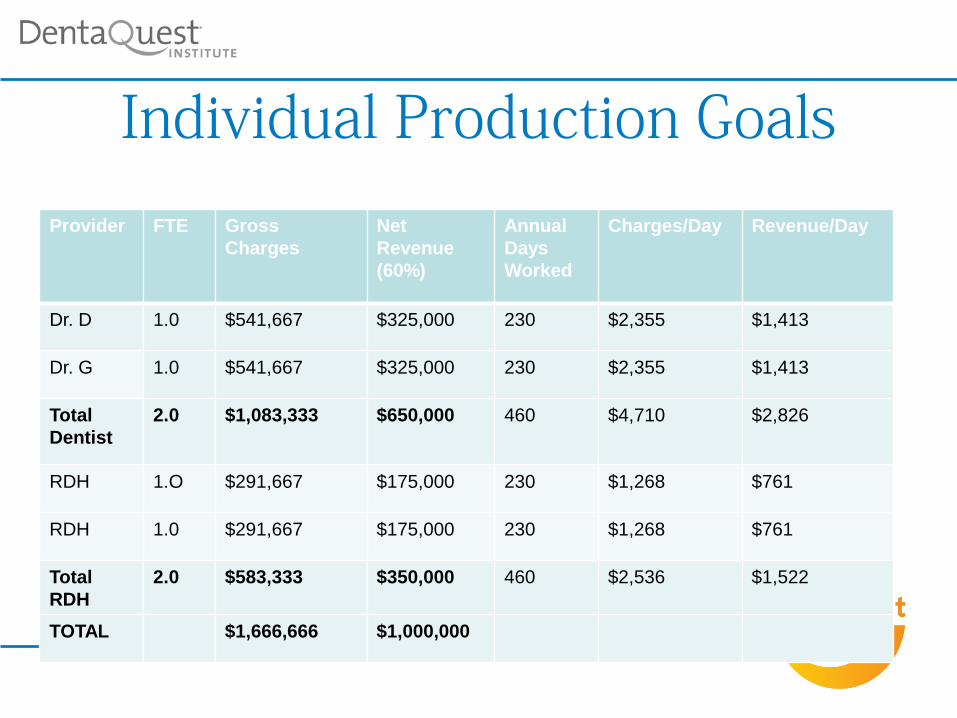
Individual Production Goals
Provider FTE Gross Charges
Net Revenue (60%)
Annual Days Worked
Charges/Day Revenue/Day
Dr. D 1.0 $541,667 $325,000 230 $2,355 $1,413
Dr. G 1.0 $541,667 $325,000 230 $2,355 $1,413
Total Dentist
2.0 $1,083,333 $650,000 460 $4,710 $2,826
RDH 1.O $291,667 $175,000 230 $1,268 $761
RDH 1.0 $291,667 $175,000 230 $1,268 $761
Total RDH
2.0 $583,333 $350,000 460 $2,536 $1,522
TOTAL $1,666,666 $1,000,000
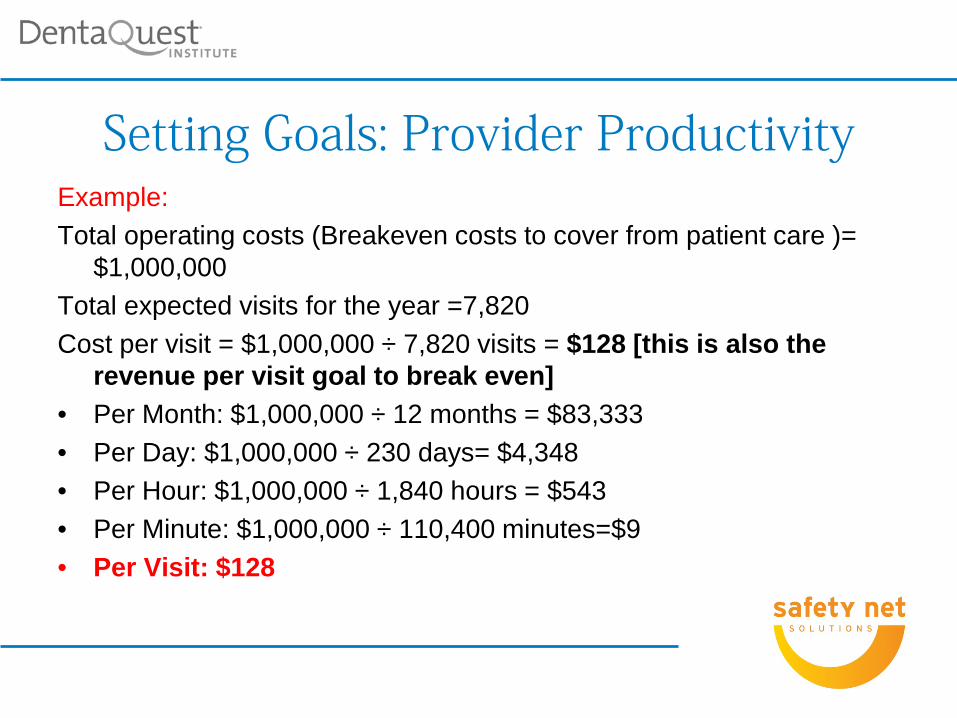
Example: Total operating costs (Breakeven costs to cover from patient care )=
$1,000,000 Total expected visits for the year =7,820 Cost per visit = $1,000,000 ÷ 7,820 visits = $128 [this is also the
revenue per visit goal to break even] • Per Month: $1,000,000 ÷ 12 months = $83,333 • Per Day: $1,000,000 ÷ 230 days= $4,348 • Per Hour: $1,000,000 ÷ 1,840 hours = $543 • Per Minute: $1,000,000 ÷ 110,400 minutes=$9 • Per Visit: $128
Setting Goals: Provider Productivity

Payer Mix • Huge impact on financial sustainability • Big challenge to manage • Determine the average revenue per visit per
payer type • Use that information to create a payer mix that
ensures financial sustainability while preserving access for all patients
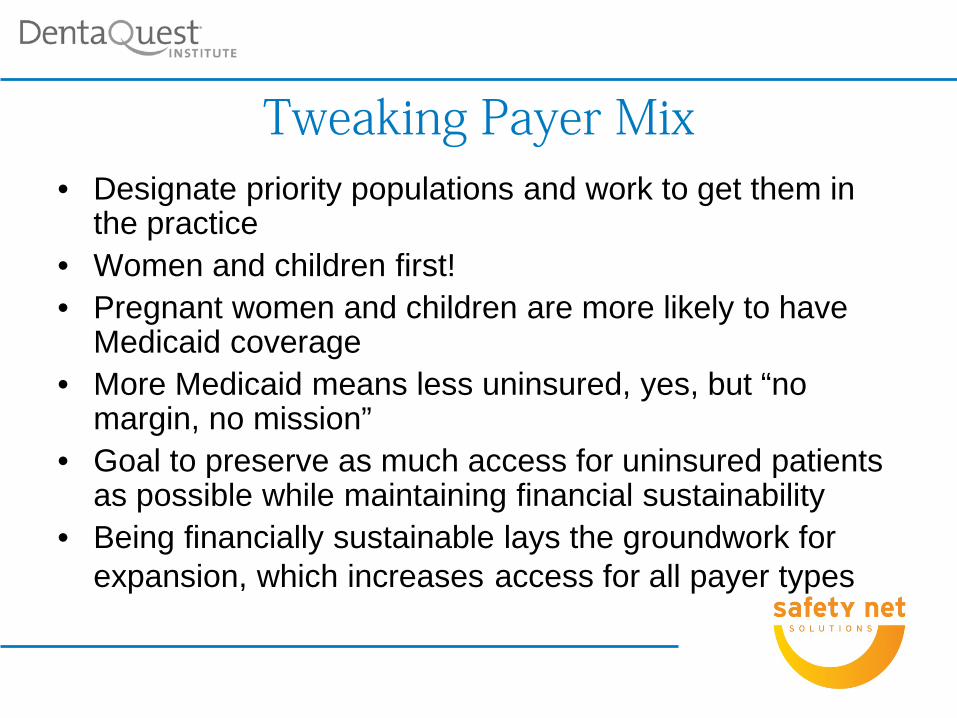
Tweaking Payer Mix • Designate priority populations and work to get them in
the practice • Women and children first! • Pregnant women and children are more likely to have
Medicaid coverage • More Medicaid means less uninsured, yes, but “no
margin, no mission” • Goal to preserve as much access for uninsured patients
as possible while maintaining financial sustainability • Being financially sustainable lays the groundwork for
expansion, which increases access for all payer types
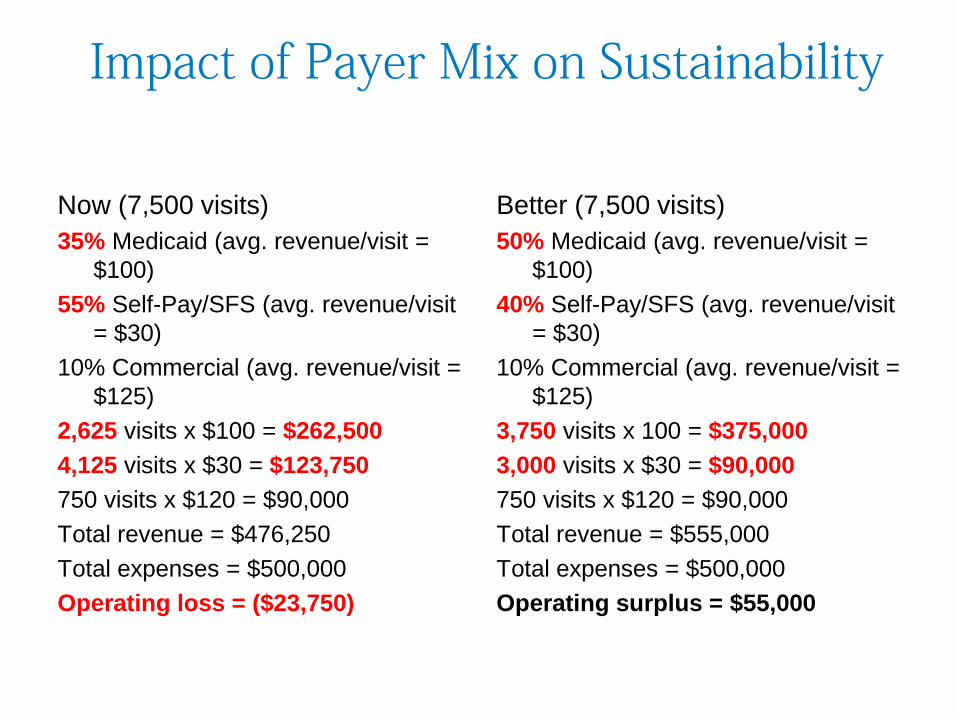
Impact of Payer Mix on Sustainability
Now (7,500 visits) 35% Medicaid (avg. revenue/visit =
$100) 55% Self-Pay/SFS (avg. revenue/visit
= $30) 10% Commercial (avg. revenue/visit =
$125) 2,625 visits x $100 = $262,500 4,125 visits x $30 = $123,750 750 visits x $120 = $90,000 Total revenue = $476,250 Total expenses = $500,000 Operating loss = ($23,750)
Better (7,500 visits) 50% Medicaid (avg. revenue/visit =
$100) 40% Self-Pay/SFS (avg. revenue/visit
= $30) 10% Commercial (avg. revenue/visit =
$125) 3,750 visits x 100 = $375,000 3,000 visits x $30 = $90,000 750 visits x $120 = $90,000 Total revenue = $555,000 Total expenses = $500,000 Operating surplus = $55,000
Our Major Strategic Tool: The Daily Schedule
• Scheduling is an art • Done properly, it supports maximum access, quality
outcomes and financial sustainability • Done improperly, all of these areas suffer • First step: create a formal policy • Second step: create a scheduling template with goals
and designated access for priority populations • Third step: make sure staff who schedule know how it
needs to be done • Final step: monitor how well things are working and
provide regular feedback to schedulers
What preserves the integrity of the scheduling system?
Designated Access
Accountability
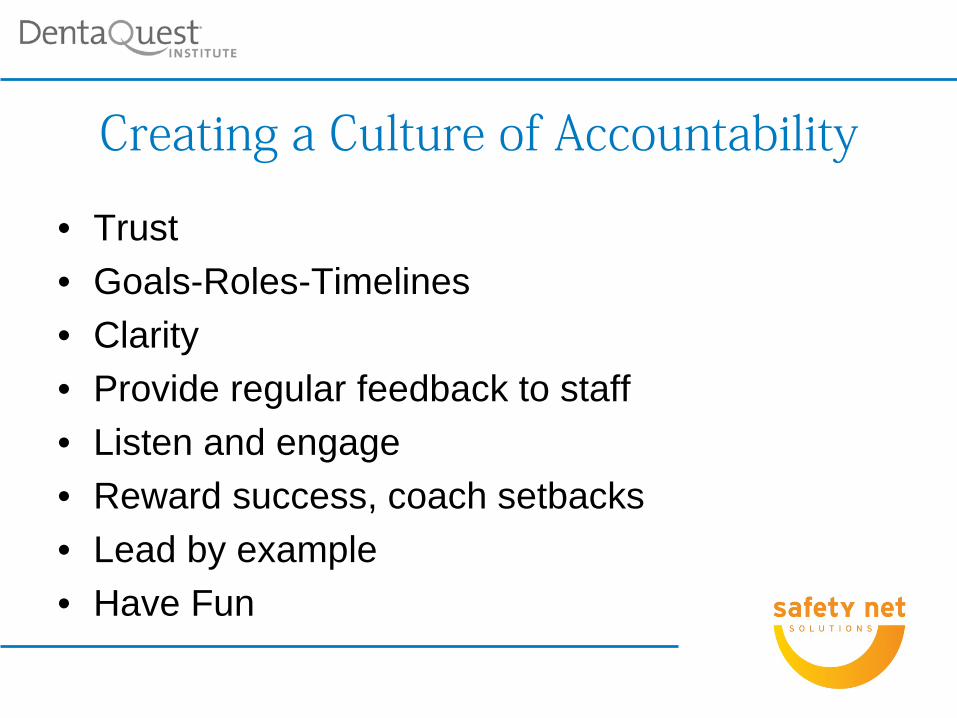
Creating a Culture of Accountability
• Trust • Goals-Roles-Timelines • Clarity • Provide regular feedback to staff • Listen and engage • Reward success, coach setbacks • Lead by example • Have Fun


Partnering to Strengthen and Preserve the Oral Health Safety Net
2400 Computer Drive, Westborough, MA 01581 Tel: 508-329-2280 Fax: 508-329-2285 www.dentaquestinstitute.org
A PROGRAM OF THE
Thanks for sharing your time , Mark