Embed Size (px)
Citation preview
Safety Leadership and Engagement: Why It’s Important and How to Do It
Dr. Wes Scott, P.E.

Safety Leadership & Engagement; Why it’s Important and How to do it
Dr. W. E. Scott

• Identify the four essential characteristics of safety excellence. • Recognize management’s role in leading and implementing a
safety management system. • Establish a business case for a safety management system. • Employ proactive, activity-based tools to involve employees. • Establish measurements that align with organizational priorities
and support continuous improvement of the safety management system.
• Implement the Journey to Safety Excellence
December 2-3, 2014
Program Goals
• Identify the four essential characteristics of safety excellence.
• Recognize management’s role in leading and implementing a safety management system.
• Establish a business case for a safety management system. • Employ proactive, activity-based tools to involve
employees. • Establish measurements that align with organizational
priorities and support continuous improvement of the safety management system.
• Implement the Journey to Safety Excellence

December 2-3, 2014
Activity – Time Spent on Safety & Health Daily:
5 minutes 30 minutes
1-3 hours 3+ hours

Costs of Injuries (2012)
December 2-3, 2014
• $730.7 billion in U.S. – $2,400 per person
• Paid… – Directly out of pocket, and – Higher prices for goods and services, and – Higher taxes

7,000 6,000 5,000 4,000 3,000
Total
December 2-3, 2014
4,547 fatal work injuries in 2012 3,783 unintentional 764 homicide and suicide
Total nearly stable from 2011 U-I up 1% from 2010
Workplace Injuries

Highway 21%
December 2-3, 2014
NonHwy Veh 6%
Pedestrian 6%
Homicide 11%
Falls-LL 11%
Struck By 9%
All Other 36%
Workplace Deaths by Event, 2012

Private Sector: • 3.1 million total OSHA-recordable cases… • 0.9 million cases with days away from work… • 106.4 million workers
State and Local Governments: • 0.8 million total OSHA-recordable cases… • 0.3 million cases with days away from work… • 18.4 million workers
December 2-3, 2014
Nonfatal Occupational Injuries and Illnesses

December 2-3, 2014
Essential Characteristics of Safety Excellence


December 2-3, 2014
Holistic Approach to Safety

Goal: Zero injuries Best practices Beyond compliance Best-in-class performance Sustainable safety culture with continuous improvement
Driving Excellence
December 2-3, 2014
Delivering a Stronger Safety Culture

Motivators for Safety & Health Performance
• Finance • Humanist • Regulatory • Public Relations • Employee/Labor Relations
December 2-3, 2014

Continuous Improvement to Zero Everyone is empowered Audit to sustainable standards and continued improvement Enhancement of reporting Implementation of Near-Miss philosophy
December 2-3, 2014
Safety is Good Business

Safety & Health Efforts
Improved employee relations Improved productivity &
reduced costs
Improved quality Enhanced public image
December 2-3, 2014
Benefits of Managing

• $37,000 can be saved for each prevented lost-time injury or illness
• $1,390,000 can be saved for each avoided occupational fatality
• 5% Margin = Increase Revenue $740,000 or $27,800,000
Financial impact
December 2-3, 2014

• Cost of injuries: • Profit margin: 1%
Costs
Profit Margin = Sales • Sales necessary to regain lost profits: $50,000
$500
The Economic Burden on Profits
December 2-3, 2014

Bottom line impact
• $37,000 saved for each prevented lost- time injury or illness
• $1,390,000 saved for each avoided occupational fatality
• Every $1 invested in safety can have a $3 - $6 return on investment
December 2-3, 2014

Bottom line impact (cont.)
• 95% of American business executives believe that workplace safety has a positive impact on a company’s financial performance
• Investors increase their returns by picking stocks with strong safety performance
December 2-3, 2014

Management Leadership and Commitment
December 2-3, 2014

Safety is a value that governs everything we do – Accept no compromises.
Leaders/Managers are accountable to drive safety throughout the company.
Regulatory agencies create rules that meet a minimum standard. Bottom line – your safety comes down to every employee raising the standard and taking ownership of safety in the workplace.
Management Leadership and Commitment
December 2-3, 2014
Top Down Board
Managers Employees
Bottom Up

December 2-3, 2014

From Compliance to Commitment
So, why don’t employees just follow the rules?
Why is commitment beyond rule compliance so important? What can we do to strengthen our safety
commitment and behaviors as we build that culture?
What is in it for us to further develop commitment to safety? How can I as a leader create an environment
where it is easy to follow rules? Culture of Commitment: Leadership at all levels Safety is a core value Remove System barriers
December 2-3, 2014

• Compliance
• Rules-based • Do things to get
something or particularly to avoid punishment
• Step outside of rules and procedures when I think it is expedient and I will not be injured.
• Safety is one priority of many
December 2-3, 2014
• Commitment
• Risk-based • Do safe behaviors
because I recognize rising exposure and because I am committed to everyone’s safety
• Exhibit Safe Behaviors when no one is watching
• Safety is a core value that drives safe behaviors
From Compliance to Commitment

Culture
Unwritten Ground rules
Share actions of Group or sub-group
Core values demonstrated by the company
Sometime culture makes the rules and not the requirements or compliance
December 2-3, 2014

Strategy Culture
December 2-3, 2014

Sustainable improvement through a systematic approach The change process from single actions to a safety culture
December 2-3, 2014

• Organization CEOs
• Managers
• Supervisors/Front-Line Leaders
• Safety & Health Staff
• Employees
Safety Management Is Everyone’s Responsibility
December 2-3, 2014

Seven Steps for Executive Action
• Communicate a vision • Integrate safety, health, & environment
into business • Define roles & responsibilities • Require accountability from all
employees • Allocate resources • Conduct assessments • Take proactive measures
December 2-3, 2014

Meaningful Employee Engagement
December 2-3, 2014

Safety leadership and employee engagement
Benefits:
Morale
Productivity
Costs
What it looks like: – Walk the talk – Investment support – Partnership – 100% Engagement
December 2-3, 2014

• Visible management commitment • Individual development and capability • Individual Engagement and influence • Constant and varied communication • Recognition, reinforcement, and reward • Appropriate employee Engagement tools
Meaningful Employee Engagement Requires…
December 2-3, 2014

U.S. engagement scores
20% Actively not engaged Source: Gallup Consulting
December 2-3, 2014
29% Engaged
51% Not engaged

• Lack of trust • A climate of fear • Lack of demonstrated commitment from top leadership • Not allowing enough time to change • No transition plan • Failure to communicate what’s happening
Barriers to Employee Engagement
December 2-3, 2014

Measuring engagement: Employee perception
December 2-3, 2014

Safety Performance Measurements
December 2-3, 2014

A process of assessing an organization’s
activities & procedures, then assigning a numerical value.
What is Measurement?
December 2-3, 2014

If You Don’t Measure It, You Can’t Improve It
The goal is not to analyze accidents after they happen, but to identify hazards and at-risk behaviors before they lead to safety incidents.
Development of leading indicators New definition of “near-miss” Higher safety improvement rate Employee self-reporting
Safety is Good Business
December 2-3, 2014

• What it looks like:
– Identifying safety indicators – leading and lagging
– Capturing and comparing incident rates
– Employee perception surveys
Benefits
Sets baseline Allows for benchmarking
Performance measurement
December 2-3, 2014

• Requires data on activities and outcomes to continuously improve
• Enables companies to: – Establish baselines – Measure improvements – Understand relationships
• Smart use of emerging technology
Performance measurement
December 2-3, 2014

Hierarchy of Safety Measures
December 2-3, 2014
Work Group/ Individual A high level of individual participation in the safety process
Facility-Department Measures Measures of both quantity and quality of proactive prevention activities and results measures
Fatality
LWDC
Corporate/Business Unit Measures (Results-Oriented)
Apply after-the-fact measures, such as those on the left, to upper management
Proactive Safety Performance Activities Measures primarily the level of participation of those proactive activities that focus on finding and fixing hazards
Proactive Safety Performance Activities
Measures both quantity & quality of those proactive activities that focus on finding and
fixing hazards
Safety Management System
9 elements of a safety management system
Near Miss
Property Damage
First Aid Case
OSHA Recordable
Business Unit-Division Measures (System-Process Oriented)
Measures of safety management system quality and effectiveness and result measures
Reactive Measures:
After-the-fact measures, such as the top five levels of this
chart.
Proactive Measures: As shown in the bottom three
levels, provide information
about the quality, effectiveness or efficiency of
activities, actions, or processes.

Communicating Safety Measurement Results
December 2-3, 2014

The Journey to Safety Excellence Continuous Improvement
December 2-3, 2014

December 2-3, 2014

• The Journey to Safety Excellence is a cycle of improvement that aims for a continual reduction of risk and has as its goal zero harm.
• It is a data-centered process that empowers organizations to fully integrate safety into the business to help achieve operational excellence.
Journey to Safety Excellence
December 2-3, 2014

• Leadership and Engagement (Culture)
• Safety Management Systems • Risk Reduction • Performance Measurement
The Four Pillars
December 2-3, 2014

Why it matters
December 2-3, 2014

December 2-3, 2014
A Safety Management System is…

Safety management systems:
What it looks like:
– Performance – Gaps – Goals – Plans – Learn Lessons
Benefits:
Management accountability
Competitive advantage Injuries
and deaths
December 2-3, 2014
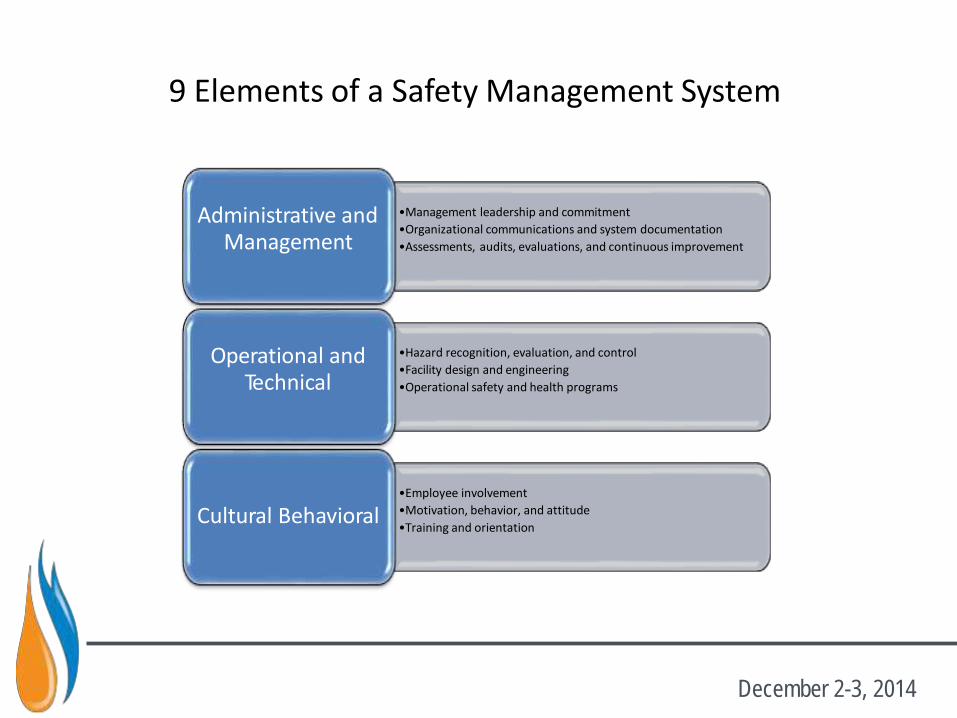
9 Elements of a Safety Management System
•Management leadership and commitment •Organizational communications and system documentation •Assessments, audits, evaluations, and continuous improvement
Administrative and Management
•Hazard recognition, evaluation, and control •Facility design and engineering •Operational safety and health programs
Operational and Technical
•Employee involvement •Motivation, behavior, and attitude •Training and orientation
Cultural Behavioral
December 2-3, 2014
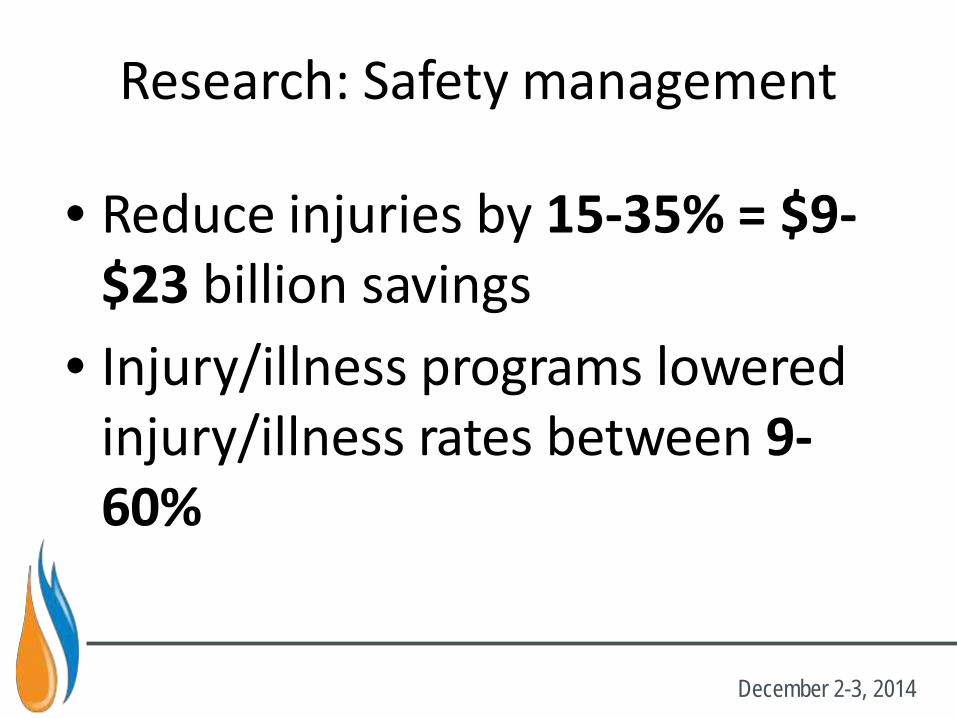
Research: Safety management
December 2-3, 2014
• Reduce injuries by 15-35% = $9- $23 billion savings
• Injury/illness programs lowered injury/illness rates between 9-60%

Research: Safety management (cont.)
• Safety management systems impact 1.Company image/reputation,
productivity and capacity to innovate 2.Injury rates 3.Financial performance (sales,
profits, financial profitability)
December 2-3, 2014
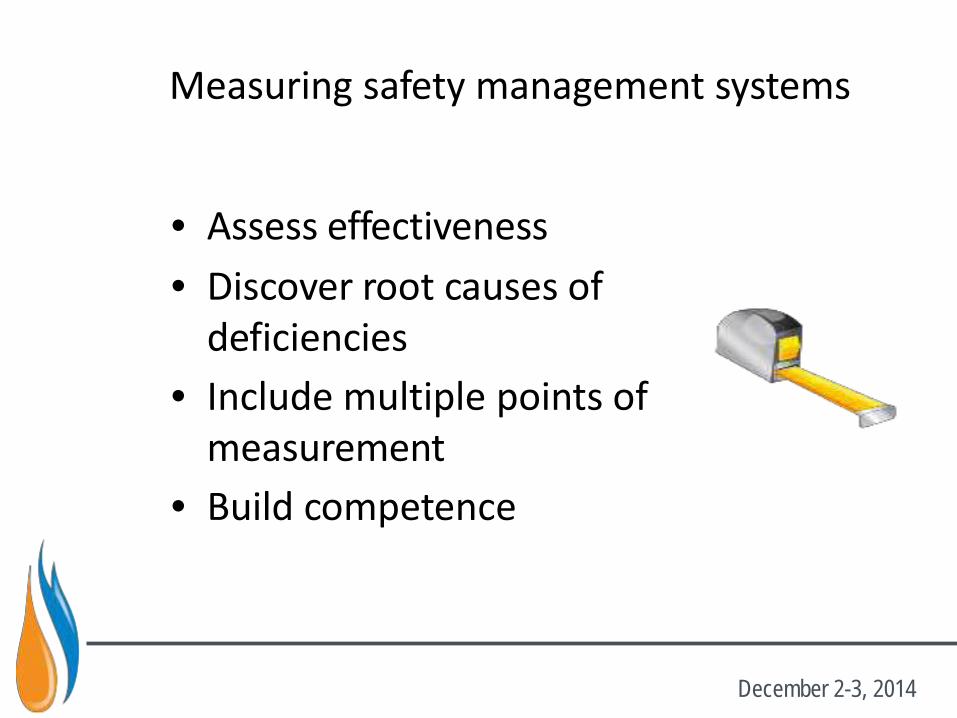
Measuring safety management systems
• Assess effectiveness • Discover root causes of
deficiencies • Include multiple points of
measurement • Build competence
December 2-3, 2014

SMS standards and guidelines
December 2-3, 2014
• NSC Journey to Safety Excellence – 9 Elements • OSHA VPP • ANSI Z10 (American) • OHSAS 18001 (International) • CSA Z1000 (Canada) • ISO 9000 (International, Quality Management System) • ISO 14000 (International, Environmental Management
System) • ISO/CD 45001 (under development – expected
10/2016)

Management and leadership
• Management – What we do
– Measure through SMS Assessments
• Leadership – How we do it
– Measure through Employee Perception Surveys
December 2-3, 2014

• Self-assessment • 69-questions • Percentile ranking against
a database of 500 companies
NSC Assessment
December 2-3, 2014

Continuous Improvement Process Model
December 2-3, 2014

December 2-3, 2014
Activity – Time Spent Daily on Safety & Health
5 minutes 30 minutes
1-3 hours 3+ hours

Questions
December 2-3, 2014