Embed Size (px)
Citation preview

1
Safety Inspection of Fruit and Vegetables Using Optical
Sensing and Imaging TechniquesHyperspectral Fluorescence Imaging System for Food Safety
Yang TaoProfessor
Update on Research Supported by JIFSAN, 2004

2
Research TeamResearch Team
PIs:– Dr. Yang Tao, P.E., Professor, Biological Res. Engineering, UMCP
Graduate Student:– Angela M. Vargas, UMCP Graduate Research Assistant. Instrumentation and
Sensing Lab, USDA/ARSCo-PIs:
– Dr. Moon Kim, Scientist, Instrumentation and Sensing Lab, USDA/ARS – Dr. Alan M. Lefcourt, Scientist, Instrumentation and Sensing Lab, USDA/ARS– Dr. Yud-Ren Chen, Research Leader, Instrumentation and Sensing Lab,
USDA/ARS BeltsvilleCollaborators:
– Dr. Yaguang Luo, Scientist, Produce Quality and Safety Lab, USDA/ARS– Dr. Robert L. Buchanan, Senior Science Advisor, FDA CFSAN– Dr. Yoonseok Song, Research Scientist, Division of Food Processing and
Packaging, Summit-Argo, IL, FDA NCFST

3
BackgroundBackgroundAnimal and human fecal matters are sources of pathogens such as Eschericia coli, Salmonella and Cryptosporidium.
Outbreaks of foodborne illness associated with consuming raw fruit and vegetable in the US have occurred more frequently in recent years (FDA, USDA)
Strawberries and cantaloupes are potential vectors of fecal contamination and foodborne illnesses.– Direct contact with soil.– Exposed to natural elements favoring pathogenic contamination.– Unsanitary condition during handling.

4
BackgroundBackground
On October 2002 the FDA banned imported cantaloupe:– unsanitary conditions in the growing and packing.– 4 outbreaks of salmonellosis, including 2 deaths
and 18 hospitalizations in 14 states. – Because of the ability of pathogens to grow on the
rind and flesh of cantaloupe, it is considered a potentially hazardous food.
On April 1997 the FDA recalled ~1.7 M lb. of imported frozen strawberries after students in 6 states were exposed to hepatitis.

5
Previous ResearchPrevious ResearchDetection of fecal contamination on apples based on hyperspectral imagery.
Multispectral laser-induced fluorescence imaging system for large biological samples.
Multispectral fluorescence imaging.
Equipment for removing apples with physical defects during sorting process in commercial settings.

6
ObjectivesObjectivesTo determine the spectral characteristics of animal feces on cantaloupes and strawberries to detect contaminated areas.
To determine the optimal wavelengths of contaminated cantaloupes and strawberries using multi-spectral imaging.
To study pattern recognition and detection algorithms.

7
Materials and MethodsMaterials and MethodsCantaloupes and strawberries from a local store were rinsed and allowed to air dry.
Fresh COW feces collected from USDA dairy were diluted with H2O to different concentrations by weight.
A pipette was used to apply a range of dilutions to samples.
Fluorescence images were taken.

8
Sample PreparationSample Preparation
10uL
20uL
1:100 1:10

9
EquipmentEquipmentHyperspectral Imaging System (HIS)Hyperspectral Imaging System (HIS)
Line-by-line scanning spectrometer.Spectral range: 425-950 nmHigh spatial resolution: SR <=1 mm2
High spectral resolution: 2 nm bandwidth112 channels, 4.5 nm interval.Dual illumination sources for fluorescence and reflectance.
BacklitCCD
Conveyer Belt
ISL-400
16 BitDigitization
VIS/NIRLight Source
CCDControllerInterface
Power Supply
SensorModule
OpticsModule
Lighting and Sample
Module
Rectilinear Fiberoptic Assembly
Short Pass Filter(< 400 nm)
Fluorescent Lamp(UV-A, 365 nm)
Reflector
C-Mount Lens
Fiberoptic Bundle
Prism/Grating/PrismAssembly
The system consists of :Light and sample module Optical module, Sensor module.
Spatialx
y
Hyperspectral Imaging systemHyperspectral Imaging system

10
ApproachApproach
λ1
λj
HyperspectralFluorescence Images
VIS/NIR HyperspectralReflectance Images
VIS/NIR Image Processing
Extraction of Contaminated Spots, Cracks, and Microbe Harborage
Fluorescence Image
processing
MultispectralImage Analysis and Transforms
Defect Curvature Image Transform
Database
Classification
λ3
λ2
λ4

11
ResultsResults
0
2
3
5
6
8
9
11
12
14
15
17
420 450 480 510 540 570 600 630 660 690 720
Wavelength (nm)
Rel
ativ
e Fl
uore
scen
ce
Control (1:10 at 40uL) (1:50 at 40uL) (1:100 at 40uL) (1:300 at 40uL)
Spectral Characteristics
Determine optimal spectral bands
Use for image processing
These images correspond to fluorescence emission maxima and minima in the natural spectral curve

12
ResultsResults
0.00.51.01.52.02.53.03.54.04.55.05.56.0
420 460 500 540 580 620 660 700 740
Thou
sand
s
Wavelength (nm)
Rel
ativ
e Fl
uore
scen
ce
Leaf Control 1 to 10 1 to 50 1 to 100
Determine several optimal spectral bands
Use for imaging processing
Spectral Characteristics These images correspond to fluorescence emission maxima and minima in the natural spectral curve
13
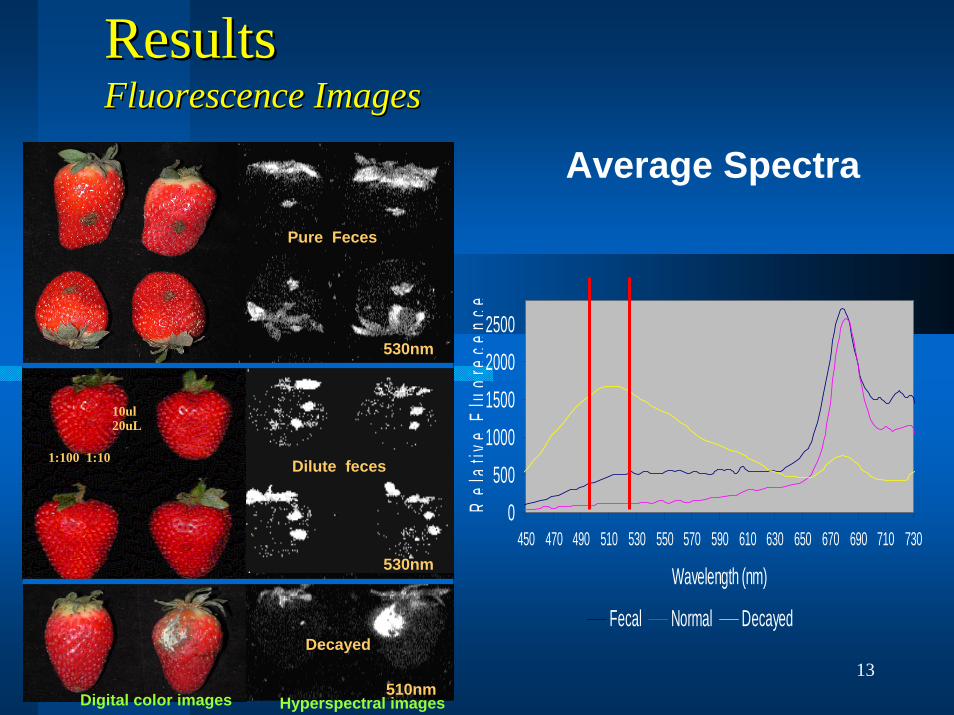
ResultsResultsFluorescence ImagesFluorescence Images
1:100 1:10
10ul20uL
Hyperspectral images
Pure Feces
Dilute feces
Decayed
Digital color images
Average Spectra
530nm
510nm
530nm
0500
1000150020002500
450 470 490 510 530 550 570 590 610 630 650 670 690 710 730
Wavelength (nm)
Rel
ativ
eFl
uore
cenc
e
Fecal Normal Decayed

14
ResultsResultsHyperspectral Imaging Processing TechniquesHyperspectral Imaging Processing Techniques
Band Ratio Band Ratio ---- 22

15
ResultsResultsHyperspectral Imaging Processing TechniquesHyperspectral Imaging Processing Techniques
Unsupervised Classification ISODATA Unsupervised Classification ISODATA ---- 3 3

16
ResultsResultsDetection Rates
Single BandDetection Rates
0 0
49
84
100
0 0
53
84
100
0 0
46
84
100
7375
91 9395
6
21
60
70
51
0
10
20
30
40
50
60
70
80
90
100
518 555 595 675 750
1 to 500 1 to 300 1 to 100 1 to 50 1 to 1063
69
78
90
69
9593
98 99
66
76
8589 90
8691
93 94
79
89
96 99
74
8991
96 98
91 9394 95
100 99 100
0 0
71
9699
0
10
20
30
40
50
60
70
80
90
100
655 / 675 595 / 655 675 / 655 655 / 595 695 / 595 655 / 518 675 / 555 555 / 655 750 / 518
1 to 500 1 to 300 1 to 100 1 to 50 1 to 10
49
68
75
83 8380
89
9496 95
56
68
7373 747879
8386 86
9
19
58
7476
79
94 939696
74
84 84 85 84
79
90 91 9191
24
34
53
35
61
0
10
20
30
40
50
60
70
80
90
100
655 / 675 595 / 655 675 / 655 655 / 595 695 / 595 655 / 518 675 / 555 555 / 655 750 / 518
1 t o 500 1 t o 300 1 t o 100 1 t o 50 1 t o 10
Unsupervised Classification “ISODATA”
Ratio Band

17
ResultsResultsHyperspectral Imaging Processing TechniquesHyperspectral Imaging Processing Techniques
Principal Component Analysis Principal Component Analysis ---- 44
-0.3-0.25
-0.2-0.15
-0.1-0.05
00.05
0.10.15
0.20.25
425
439
452
465
478
491
504
518
531
544
558
571
584
598
611
625
638
652
665
679
693
706
720
Wav
elen
gth
(nm
PC-2 PC-5 PC-6
Weighing Coefficient (Eigenvectors)

18
Apple ResearchApple Research
a) F450-40 nm FWHM b) F550-40 nm FWHM c) F670-10 nm FWHM
d) F680-22 nm FWHM e) F685-10 nm FWHM f) F700-40 nm FWHM
Steady-state fluorescence images of the shaded (top two apples) and sun-exposed (bottom two) sides of apples with cow feces contamination spots acquired by multispectralfluorescecne imaging system at F450, F550, F670, F680, F685, and F700.
Kim, et al.

19
F670/F450 F680/F450 F685/F450 F700/F450
F670/F550 F680/F550 F685/F550 F700/F550
a) Red Bands / Blue Band
b) Red Bands / Green Band Kim, et al.

20
DetectedDetected
a) F670/F450 b) F670/F550 c) F680/F450
Kim, et al.

21
Use of OnUse of On--line line Multispectral SystemMultispectral System
Machine Intelligence
Labor Intensive
MERLIN® vision system for fruit inspection

22
SummarySummary
Single band images positively show contamination, detection rates are improved using ratio images.
Unsupervised classification images can remove unwanted areas, and isolate treated areas.
PCA showed that the first six principal component (PC) images exhibited useful results for contamination detection and redundancy reduction.

23
OnOn--going Workgoing Work
Continue to develop the multispectral imaging analysis;
Classification algorithms for detection of feces and anomalies;
Statistical validations;
Journal publications.

24
InstrumentInstrumentMultispectral Fluorescence Imaging Multispectral Fluorescence Imaging System (MFIS)System (MFIS)
The MIS consists of:– Intensified-CCD (ICCD)
camera with a six position filter wheel (480 H and 640 V pixel resolution).
– 10-bit A/D frame-grabber.– UV-A fluorescent lamp
assemblies.– Four short-pass filters.
Schematic diagram of the MFIS

25
THANK YOUTHANK YOU
![Fruit, flowers and vegetables - Fresh · Fruit, flowers and vegetables. ... Fruit - fresh Vegetables - fresh Flowers, ... • Fruit juices $7m South Africa $7m [$1m]](https://img.pdfslide.us/doc/110x75/5b8990697f8b9a655f8c756f/fruit-flowers-and-vegetables-fruit-flowers-and-vegetables-fruit-fresh.jpg)