Embed Size (px)
Citation preview
1
Safety Climate Dimensions as Predictors for Risk Behavior
Janine Bosak **
Wilhelm. J. Coetsee*
Sarah-Jane Cullinane**
*Newcastle Business School/United Kingdom
**Dublin City University Business School/Ireland
Abstract
This study examines the interactive relationship between three dimensions of safety
climate (management commitment to safety, priority of safety, and pressure for
production), and their impact on risk behavior reported by employees. The sample
consisted of 623 employees from a chemical manufacturing organization in South
Africa. Hierarchical regression analyses were carried out to test the direct effects and
the interaction effect of the three safety climate dimensions on risk behavior. The
results showed that, as expected, employees’ risk behavior was negatively related to
management commitment to safety and priority of safety and positively related to
pressure for production. Moreover, as expected, the three-way interaction between
management commitment to safety, priority of safety and pressure for production was
significant. When pressure for production was high, management commitment to
safety was positively related to risk behavior, regardless of level of priority of safety
on plant. When pressure for production was low, the effect of management
commitment to safety on risk behavior was nullified under conditions of high, as
compared to low priority of safety on plant. These findings highlight the importance
of managerial commitment to safety in contexts where employees experience tensions
between production deadlines and safety procedures.
Keywords: Safety Climate; Risk behavior; Safety Performance; Chemical
Manufacturer
2
1.0 Introduction
The importance of safety climate and its relationship with occupational safety has
been established across a range of industry settings (Flin et al., 2000; Clarke, 2006;
Nahrgang et al., 2008; Christian et al., 2009). Safety climate relates to individuals’
perceptions of safety policies, procedures, practices and behaviors in the work
environment that indicate the true priority given to safety relative to other
organizational goals (e.g. Naveh et al., 2005; Neal and Griffin, 2006; Nahrgang et al.,
2008; Morrow et al., 2010). Safety climate is associated with safety practices (Zohar,
1980), compliance with safety standards (Goldenhar et al., 2003), lower occurrence of
workplace accidents (Griffin and Neal, 2000; Zohar, 2003; Clarke, 2006) and has also
been found to predict safety behavior (Hofmann and Stetzer, 1996; Cooper and
Phillips, 2004). Safety climate can therefore be considered as an important variable
for understanding safety performance and is used as a leading indicator of unsafe
work conditions (Zohar, 1980; Flin et al., 2000; Cooper and Philips, 2004; Hoffmann
and Mark, 2006). However, despite its predictive validity many authors emphasize the
need for further research which explains how specific features of safety climate are
associated with one another and consequently with safety behavior (e.g. Prussia et al.,
2003; Pousette et al., 2008; Wirth and Sigurdsson, 2008). In line with this, Zohar
(2010) argues that safety climate perceptions should move beyond an isolated focus
on safety, toward an evaluation which incorporates the relative priorities among the
various safety policies, procedures and practices and their competing domains (e.g.
productivity or efficiency).
This paper, using an adapted version of the Offshore Safety Questionnaire (OSQ)
(Mearns et al., 1997; Fleming, 2001), examines three dimensions of safety climate,
that is 1) management commitment to safety, 2) priority of safety in the workplace
and 3) pressure for production, and the relationship among them as predictors of risk
behavior reported by employees working in a chemical manufacturing organization
situated in South Africa. Risk behavior, which refers to the extent to which employees
ignore safety regulations to get the job done, carry out forbidden activities, and
perform their duties incorrectly (Rundmo and Hale, 2003), has been related to
accident involvement in previous research and is therefore an appropriate
measurement of employee’s safety behavior (e.g. Rundmo, 1995; Mearns et al., 1997;
3
Flemming, 1999). Regular non-compliance with policies, procedures and safety rules
are considered a major cause of accidents as it can make the entire system more
vulnerable to failure (Reason, 1997; Neal and Griffin, 2006; Baysari et al.,2008). In
line with recent research (e.g. Katz-Navon et al., 2005; Naveh et al., 2005), this study
examines the interplay of safety climate dimensions and therefore extends the existing
literature by 1) testing whether the observed relationship between management
commitment to safety and priority of safety is also dependent on pressure for
production and 2) examines the complex pattern of relationships among these three
safety climate dimensions in their influence on risk behavior. Understanding how
specific dimensions of safety climate may influence risk behavior will enable
organizations to balance competing organizational priorities (productivity and safety
compliance) and thereby minimize unsafe behavior in the workplace.
2.0 Psychological Safety Climate
The level of conceptualization and analysis of safety climate is a continuing debate
among climate researchers; climate can be investigated at different levels of the
organization (Rousseau, 1985). Psychological safety climate, which is the focus of the
present study, reflects individual perceptions of safety policies, procedures, and
practices in the workplace (Christian et al., 2009). These non-aggregated perceptions
of the work environment (Clarke, 2009) differ from safety climate at the group or
organizational level, which represent collective perceptions of workplace safety.
Although safety climate has traditionally been conceptualized and operationalized at
the organizational level (e.g. Zohar, 1980), there is growing evidence for the
informative and predictive nature of safety climate at both workgroup and individual
level (Zohar, 2003; Neal and Griffin, 2006; Zohar and Luria, 2005). For example, a
recent meta-analysis which examines the moderating effect of level of analysis in the
safety climate-safety behavior relationship found that safety climate at both the
individual and group level had similar magnitudes in the prediction of safety
behavior, which were both slightly stronger than organizational level safety climate
(Christian et al., 2009). Evidence for the prediction of safety behavior across various
industries has also been found for psychological safety climate (Larsson et al., 2008;
Morrow et al., 2010). In the present study we focus on psychological safety climate in
order to examine the impact of varying employee interpretations regarding safety in
4
their workplace, possibly caused by idiosyncratic worldviews, perceptual biases, and
experiences (Ostroff and Bowen, 2000), on individual behavior (i.e., risk behavior).
Despite the importance of safety climate in the prediction of accidents in the
workplace the dimensionality of safety climate (Zohar and Luria, 2005) and its factor
structure (Zohar, 1980; Dedobbeleer and Beland, 1991) remains disputed. With regard
to dimensionality, some researchers argue that safety climate can be regarded as a
uni-dimensional latent variable (Neal et al., 2000) while others claim it is
multidimensional in nature (Cooper and Phillips, 2004; Zohar and Luria, 2005). With
regard to factor structure, research demonstrates the inability to reproduce factor
structures across industries (Zohar, 1980; Dedobbeleer and Beland, 1991; Brown and
Holmes, 1996), indicative of the problematic nature of measuring and
operationalizing safety climate. In addition, a number of different measures of safety
climate have been developed (e.g. Zohar 1980; Brown and Holmes, 1996; Hayes et
al., 1998; Mearns et al., 1998; Dedobbeleer and Beland, 1991; Cox and Cheyne 2000;
Shannon et al., 2001; Mearns et al., 2003). Therefore, to date no universal model
specifying the definition and conceptualization of safety climate and its underlying
key dimensions exists (Christian et al., 2009), although common themes have
emerged (e.g. Flin et al., 2000). Zohar (2010) recently encouraged researchers to
consider safety climate perceptions as targeted at system-level attributes which
include the priority of competing demands (e.g. safety and efficiency), discrepancies
between espoused and enacted safety practices, and consistencies among policies and
procedures. It is therefore necessary to address safety climate from a multi-
dimensional perspective, which permits examination of potential interactions between
its components in their impact on safety performance.
3.0 Safety Climate Dimensions and Risk Behavior: Direct Effects
Three safety climate dimensions in particular capture both competing organizational
domains and consistency between policy and practice and have been regularly
included in safety climate studies, namely, management commitment to safety,
perceptions of the priority of safety in the workplace, and pressure for production
(Mearns et al., 1998; Zohar, 2002; Cooper and Phillips, 2004). Although a number of
5
additional aspects of safety climate have been identified in the literature (e.g. safety
knowledge, safety training), these three specific dimensions were chosen based on
their frequent inclusion in safety climate studies in addition to evidence demonstrating
their importance in predicting safe behavior beyond alternative safety dimensions. For
example a number of review, field and meta-analytic studies examining a range of
safety climate dimensions have demonstrated management commitment to safety as
the strongest predictor of safety performance (e.g. Cox and Flin, 1998; Flin et al.,
2000; Christian et al., 2009; Beus et al., 2010). Priority of safety and pressure for
production, despite having received less attention than management commitment to
safety, are commonly used dimensions of safety climate which have been consistently
found to predict safety outcomes such as unsafe behavior (e.g. Morrow et al., 2010).
Furthermore Cox and Cheyne (2000), in developing a safety climate assessment tool,
found that management commitment to safety, safety priority and the work
environment (i.e. conflict between operational targets and safety) were deemed as
some of the most highly ranked dimensions of safety climate for offshore workers.
The impact of perceived managerial practices on safety performance has been widely
demonstrated in previous research (e.g. Thompson et al., 1998; Zohar, 2002), and
there is consensus that management actions are an important determinant in creating a
safe work environment (see Shannon et al., 2001 for an overview). McLain and Jarrell
(2007) have explained this effect by proposing that management commitment leads to
trust in management which in turn leads to a) a reduction in the need for employees to
divert attention to safety hazards while performing tasks, and b) greater information
sharing about safety and safe actions. Managerial behavior provides cues regarding
workplace norms and the kinds of behavior likely to be supported, valued or
rewarded, which informs employees’ perceptions of safety climate (Zohar, 2003;
Morrow et al., 2010). On a practical level it means that managers at all levels in the
organization must visibly demonstrate their commitment towards safety as well as
their support for safety in visible behaviors i.e. talk about safety, invest resources in
creating a safe work environment, involve employees in safety matters, consideration
of safety matters in job design and congruence between managerial safety talk and
managerial actions (Zohar, 1980; Hoffmann and Stetzer, 1996; Geller, 2001; Clarke
and Ward, 2006). It is important to note that safety climate, as a socially construed
6
indication of desired employee behavior, originates simultaneously from both policy
and procedural actions of senior management and supervisory actions demonstrated
by frontline or shop-floor supervisors (Zohar and Luria, 2005). The managerial level
at which commitment is examined (i.e. senior manager, supervisor) is however
ambiguous in some studies despite the large differences in their roles and perceived
influence by employees (Clarke, 1999; Flin et al., 2000). In the present study we
focus on employees’ perceptions of senior management commitment to safety as
senior managers “undoubtedly set the tone and tempo for organizational atmosphere,
establish priorities and allocate resources“ (Flin et al., 2000, p. 186) and as their
safety policies, procedures, and actions are critical in limiting supervisor discretion in
policy implementation (Zohar and Luria, 2005).
Priority of safety as the second safety climate dimension refers to the degree to which
safety is perceived as a top priority for employees (Naveh et al., 2005). A high safety
priority within an organization means that safety is considered an important issue that
must be given precedence regardless of other competing demands, such as work speed
and productivity (Flemming, 1999). A high priority of safety can potentially motivate
employees to take greater ownership of, and responsibility for, safety. This in turn, is
likely to influence employee’s tendency to behave safely. A low safety priority
denotes that safety-related policies and procedures are perceived only as rhetoric or as
pretence and then they can be inadequately followed or even ignored without
consequences (Falbruch and Wilpert, 1999). Fleming (1999) in a study of off-shore
personnel, found that 19% of the variance in subordinate self-report safety behavior
was explained by the priority of safety in the work environment and supervisory
behavior. Dedobbeleer and Beland (1991) similarly found that workforce attitudes
towards safety practices (i.e. propensity to take risks) were predicted by perceptions
of management concern for employee well-being.
Finally, the present study focuses on pressure for production as the third safety
climate dimension. As managers generally place a high demand on workplace
productivity it can often cause employees to compromise on safety (Wright, 1986;
Langford et al., 2000). Although employee perceptions of work pressure (e.g.
7
excessive workload, high work pace, time pressures, etc.) are known to be a causal
factor for both accidents and unsafe work behavior (Wright, 1986; Hoffmann and
Stetzer, 1996; Brown et al., 2002; Goldenhar et al., 2003; Seo, 2005), work pressure
has been found to have a small effect in predicting safety performance, accident and
injuries relative to other safety climate dimensions according to meta-analytic
research (Christian et al., 2009). The small effect observed for work pressure could
suggest that it is not work pressure per se that causes accidents, but the perceived
pressure to ignore safety rules. For example, although looking at employees’ attitudes
rather than perceptions, Rundmo (1998a, b) found that an attitude amongst employees
to accept rule violation is the strongest predictor of risk behavior. In the present study
we therefore define and conceptualize pressure for production as an employee’s
perception that the organization encourages him or her to work around safety
procedures in order to meet production quotas, keep up with the flow of incoming
work, or meet important deadlines (Brown et al., 2000). This definition is similar to
previously examined constructs such as work-safety tension, i.e., workers perceive
that working safely is at odds with effectively doing their jobs (Brown and Holmes,
1986; Dedobbeleer and Beland, 1991; Morrow et al., 2010), and work pressure and
safety rules (Wills et al., 2006) which were influential in predicting safety behaviors
amongst drivers, production and construction workers. These findings are consistent
with Mearns et al. (2001) who found that unsafe behavior, in a sample of off-shore oil
workers, was primarily predicted by perceived pressure for production.
To conclude, management commitment to safety, priority of safety, and pressure for
production by employees have been deemed important dimensions of safety, which
are predictive of unsafe behaviors. Based on our above review of the literature we
expect these three dimensions to have a direct effect on risk behavior. Specifically,
our Hypothesis 1 reads as follows:
Hypothesis 1: (a) Management commitment to safety and (b) Priority of safety are
negatively related to risk behavior as reported by employees. (c) Pressure for
production is positively related to risk behavior as reported by employees.
8
4.0 Safety Climate Dimensions and Risk Behavior: Interactive Effects
Although there is strong evidence to support the direct relationship between each of
the above dimensions of safety climate and safety behavior, research to date has
largely ignored the possible relationships that exist between these safety climate
dimensions in their impact on safety performance (Naveh et al., 2005; Beus et al.,
2010). Few researchers (Katz-Navon et al., 2005; Naveh et al., 2005) have recently
demonstrated the intricate relationships between safety climate dimensions in their
prediction of safety performance. For example, in their study of hospitals, Katz-
Navon and colleagues (2005) found that, when safety priority was high as opposed to
low, the influence of managerial safety practices on the number of treatment errors
was nullified. In other words, high priority of safety provided employees with
sufficient cues regarding the importance of safety within their unit to the extent that
managerial emphasis on safety had no additional influence. However in addition to
employees’ evaluation of commitment to and priority of safety by management,
climate perceptions are also guided by discrepancies between espoused and enacted
priorities of managers (Zohar, 2010). Therefore the present study proposes that in
addition to the direct relationship between the above outlined safety climate
dimensions and risk behavior, the two-way interaction between management
commitment to safety and priority of safety as found by Katz-Navon and colleagues
(2005) will only hold when employees perceive low levels of pressure for production.
In this particular context, employees receive enough cues regarding the importance of
safety within their unit and the low work pressure is not at conflict with these cues;
employees’ understanding that senior management is committed to and values safety
will have no additional influence on their safety behavior (i.e. risk behavior). In
contrast, when employees perceive high levels of pressure for production, their safety
behavior will be influenced by management commitment to safety, regardless of the
level of priority of safety on plant. Specifically, our Hypothesis 2 reads as follows:
Hypothesis 2: Management commitment to safety will be less strongly associated
with risk behavior under conditions of high, as compared to low priority of safety on
plant, but only when pressure for production is low rather than high.

9
The added value of this study above and beyond previous research (e.g. Katz-Navon
et al., 2005; Naveh et al., 2005) is twofold: First, we focus on employee perceptions
of senior management rather than supervisor commitment to safety in testing the
proposed safety climate-safety behavior relationships as senior managers play a
critical role in shaping both employee and lower management behaviors (Simard and
Marchand, 1995; Cooper, 2006). Second, rather than focusing on one moderator of
the management commitment to safety-outcome relationship only, we propose the
impact of management commitment to safety on outcomes (i.e. risk behavior) to be
contingent not only on priority of safety but also pressure for production, thereby
enabling us to provide a more complex picture of the interplay between different
safety climate dimensions. This is important from a theoretical and practical
perspective as our findings ascertain the boundary conditions under which the impact
of managerial commitment to safety on employee risk behavior is enhanced or
attenuated (for the relevance of moderating effects in climate research, see González-
Romá, et al., 2009), which in turn can inform managers about the situations in which
their actions and behaviors are particularly influential for reducing employee risk
behavior and accidents on site. To our knowledge this is the first study in the safety
climate literature to test and find a higher-order interaction between safety climate
dimensions, which deserves attention given the difficulty of finding higher-order
interactions due to lower statistical power in field research (McClelland and Judd,
1993). We also would like the reader to note that the proposed effects of safety
climate dimensions were tested in a South African chemical manufacturing
organization, a context very different from medical units in hospitals. The present
study therefore clearly addresses Katz-Navon et al.’s (2005) and Naveh et al.’s (2005)
call for future research to test the validity of their findings in other industries and to
study additional dimensions (e.g. pressure for production) which may affect the nature
of the relationships found among the dimensions.
4.0 Method
4.1 Participants and Procedure
The data used in this study were collected as part of a larger research project
to examine the effectiveness of safety management practices and procedures in
organizations. Questionnaires in English were distributed to a random sample of 1300
10
employees working at a chemical manufacturing organization in South Africa. This
resulted in a sample of 856 non-management employees, a response rate of 65.8%.
Among these employees, 623 (72.8%) operated in high-risk environments in the
chemical manufacturing organization, i.e., maintenance and production, and were
predominantly blue collar workers (for the importance of safety climate for blue
collar construction and maintenance workers, see Larsson et al., 2008, Morrow et al.,
2010). These employees who experience high-risk in their daily work environment
and who are thus eligible to answer questions pertaining to safety (e.g. pressure for
production) and risk behavior are the focus of the present study. A covering letter
accompanied all questionnaires explaining the purpose of the survey and was
distributed by the research team and personnel from SHE Department to the
employees of the organization. In addition, prior to completing the questionnaires,
employees were informed about the objectives of the investigation. Where employees
were unable to understand English, translators were used to explain concepts.
Respondents completed the questionnaires in hard copy and returned the completed
questionnaires to the research team. In terms of age, 12.2% of the respondents in
maintenance and production were between 18 and 24; 16.9% were between 25 and
29; 14.4% were between 30 and 34; 13.8% were between 35 and 39; 14.8% were
between 40 and 44; 13% between 45 and 49 and 14% were older than 50 years. 7
respondents (1.1%) did not indicate their age. As far as length of service is concerned,
45.9% of the respondents had less than five years’ service with the organization,
19.4% had between five and ten years of service, 12.7% had between eleven and
fifteen years of service and 18.5% of the respondents had indicated that they had more
than 16 years of service with the organization. Twenty-two respondents (3.5%) did
not indicate their length of service with the organization.
4.2 Measures
The research questionnaire consisted of three sections and the different sections
elicited the following information of participants: Section 1: Background information
(e.g. age, length of service, etc.), Section 2: Psychological safety climate questions
and Section 3: Risk behavior. As mentioned earlier, all dimensions of safety climate
and risk behavior were measured and analysed at the individual level as the present
11
study focuses on individual perceptions of safety climate and their role in predicting
variation in employee risk behavior.
4.2.1. Safety Climate
Employees’ perceptions of safety climate in the organization were assessed using 26
items from the Offshore Safety Questionnaire (OSQ), developed from previous
research into safety climate in offshore environments (Mearns et al., 1997; Fleming,
2001; Mearns et al., 2003). The questionnaire was chosen due to its use in previous
studies and range of measures available (Fleming, 2001). The questionnaire was
adapted for use in the manufacturing industry by omitting items that relate to the
offshore oil context. Specifically, we measured the following safety dimensions:
Management commitment to safety, status of safety on the plant, and pressure for
production. Employees responded to all items using a 5-point Likert-type scale
ranging from fully disagree (1) to fully agree (5). All three dimensions relate to
perceptions of plant-level safety whereby respondents were instructed to consider
senior management on site when questions referred to ‘managers’.
(a) Management commitment to safety. Twelve items assessed employees’
perceptions of management commitment to safetyi. Example items are “Some
safety rules/procedures are only there to protect management” and “Management
listen to safety concerns, but nothing ever gets done”. The internal consistency
reliability was .88.
(b) Priority of safety on plant. Eight items assessed employees’ perceptions of the
priority of safety on plant. Example items are “The standard of safety is very high
at my work place” and “I am allowed to stop work if I feel the job is unsafe”. The
internal consistency reliability was .87.
(c) Pressure for production. Six items assessed employees’ perceptions of pressure
for production. Example items are “Sometimes it is necessary to ignore safety
rules/procedures to keep production going” and “People in this plant are
sometimes under pressure to put production before safety”. The internal
consistency reliability was .75.
4.2.2. Risk behavior.
12
As the dependent measure, the survey included five items from the Offshore
Safety Questionnaire (OSQ) to assess the extent to which employees perceived that
they engaged in risk behavior in their work setting. These items from the OSQ were
originally adapted from Rundmo (1997, 2000). Example items are “I sometimes
ignore safety rules/procedures to get the job done” and “I use work methods that are
not allowed”. Employees responded to all items using a 5-point Likert-type scale
ranging from never (1) to very often (5). The internal consistency reliability was .80.
4.3 Measure Validation.
Confirmatory factor analyses (CFA) were carried out to investigate the
discriminant validity of our self-reported measures. The items for risk behavior,
management commitment to safety, priority of safety, and pressure for production
were specified to load on four separate latent factors, while the latent factors were
allowed to co-vary. The chi-square was statistically significant (χ2/df = 1129.97/426 =
2.65, p <.001) but the other fit indices indicate levels of fit which are commonly used
as indicating acceptable model fit (Lance et al., 2006); comparative fit index [CFI] =
.90, Tucker-Lewis Index [TLI] = .89, and root-mean-square error of approximation
[RMSEA] = .05). Factor loadings ranged from .48-.76 (risk behavior), .53-.69
(management commitment to safety), .56-.81 (priority of safety), and .48-.67
(pressure for production) and were all statistically significant, p < .05. Interfactor
correlations ranged from -.43 to -.76. In addition to affirming the fit of our proposed
four-factor model, we also tested alternative models by combining original factors to
test discriminant validity (see Campbell and Fiske, 1959). Specifically, we tested a
three-factor model in which risk behavior, priority of safety, and management
commitment to safety combined with pressure for production were specified to load
on three separate latent factors, a two-factor model in which the safety climate
dimensions and risk behavior were specified to load on two separate latent factors,
and a single latent factor model in which all self-reported measures were specified to
load on one single latent factor. Chi-square difference tests were used to compare the
alternative models. The three-factor, two-factor and single latent factor models all
demonstrated significantly worse fit (CFIs ≤ .85, TLIs ≤ .83, RMSEAs ≥ .06) than the
four-factor model of our self-reported measures. Comparisons of the four-factor
model with all the alternative models using chi-square difference tests showed that the
13
proposed four-factor model of self-reported measures fitted the data bestii, supporting
the discriminant validity of our measures.
5.0 Results
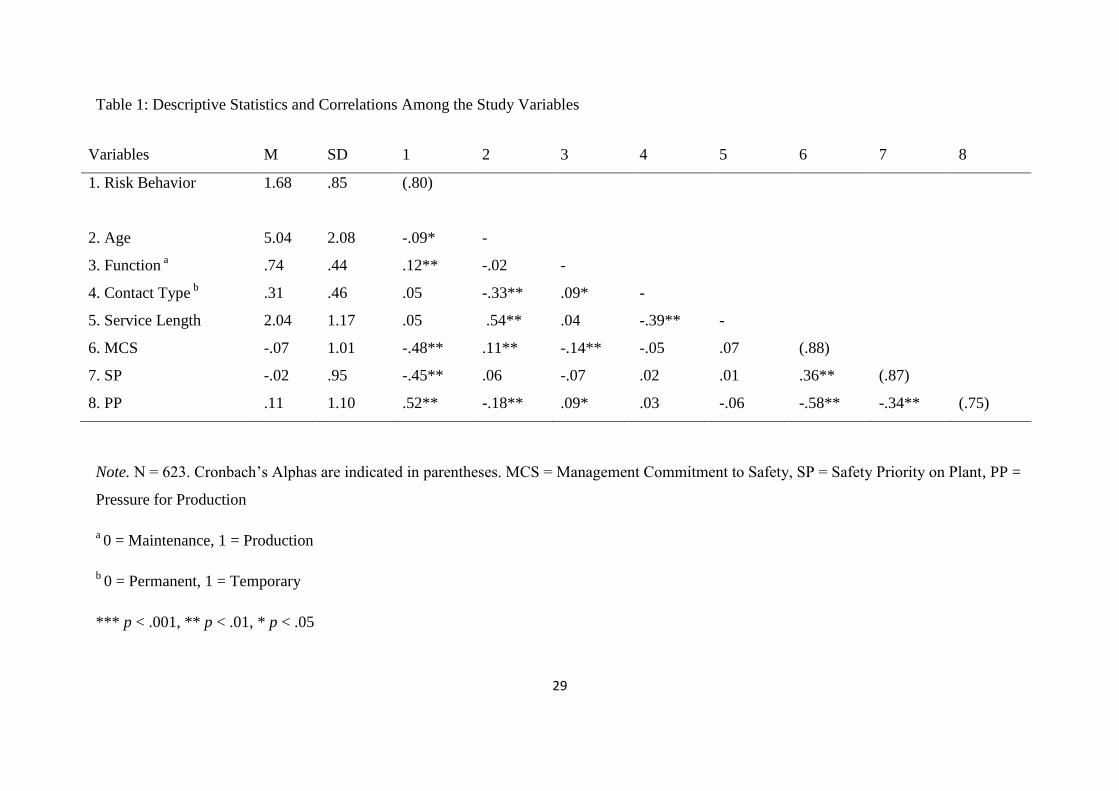
In Table 1 the means, standard deviations, internal consistencies and zero-order
correlations of all variables are displayed. We carried out hierarchical regression
analyses to test our hypotheses. The included predictor variables were centered
around their grand mean to facilitate the interpretation of main effects in models
containing interaction terms (see Aiken and West, 1991).
Insert Table 1
We entered the predictors into the regression in the following four steps: (1) Age,
function, contract type and length of service as control variables, (2) Management
commitment to safety (MCS), priority of safety on plant (SP), and pressure for
production (PP) as predictor variables, (3) the two-way interactions, and (4) the three-
way interaction.
Insert Table 2
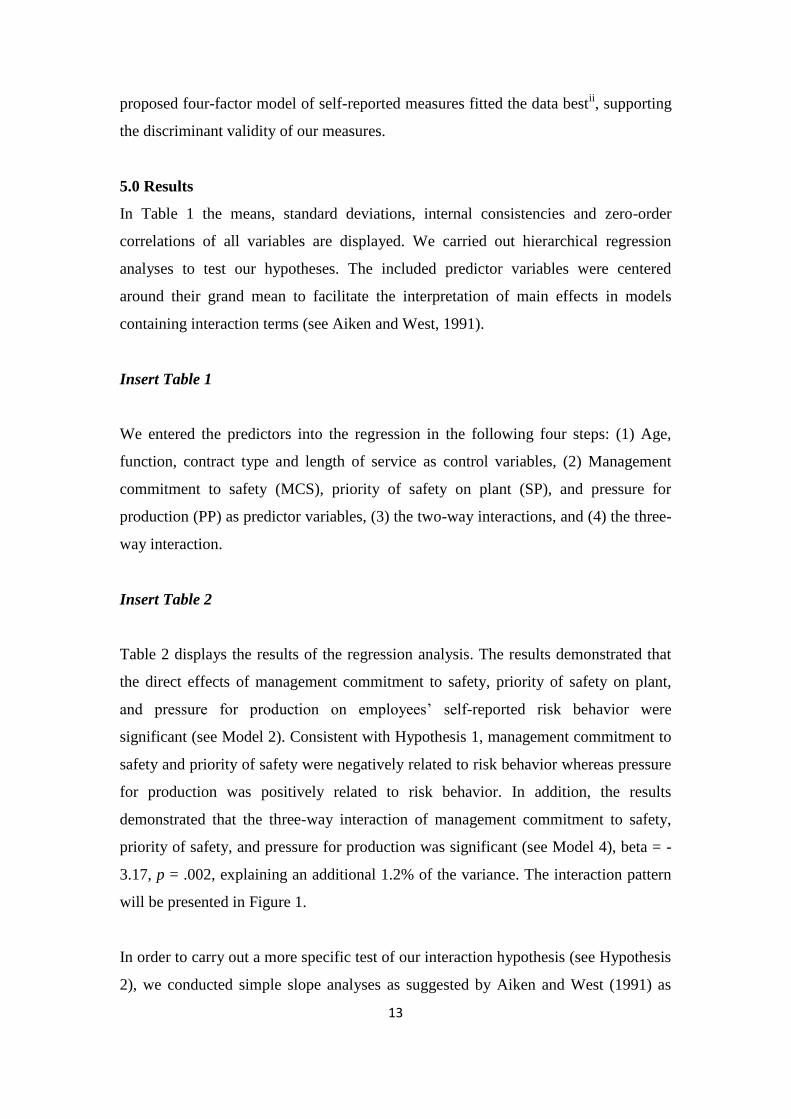
Table 2 displays the results of the regression analysis. The results demonstrated that
the direct effects of management commitment to safety, priority of safety on plant,
and pressure for production on employees’ self-reported risk behavior were
significant (see Model 2). Consistent with Hypothesis 1, management commitment to
safety and priority of safety were negatively related to risk behavior whereas pressure
for production was positively related to risk behavior. In addition, the results
demonstrated that the three-way interaction of management commitment to safety,
priority of safety, and pressure for production was significant (see Model 4), beta = -
3.17, p = .002, explaining an additional 1.2% of the variance. The interaction pattern
will be presented in Figure 1.
In order to carry out a more specific test of our interaction hypothesis (see Hypothesis
2), we conducted simple slope analyses as suggested by Aiken and West (1991) as
14
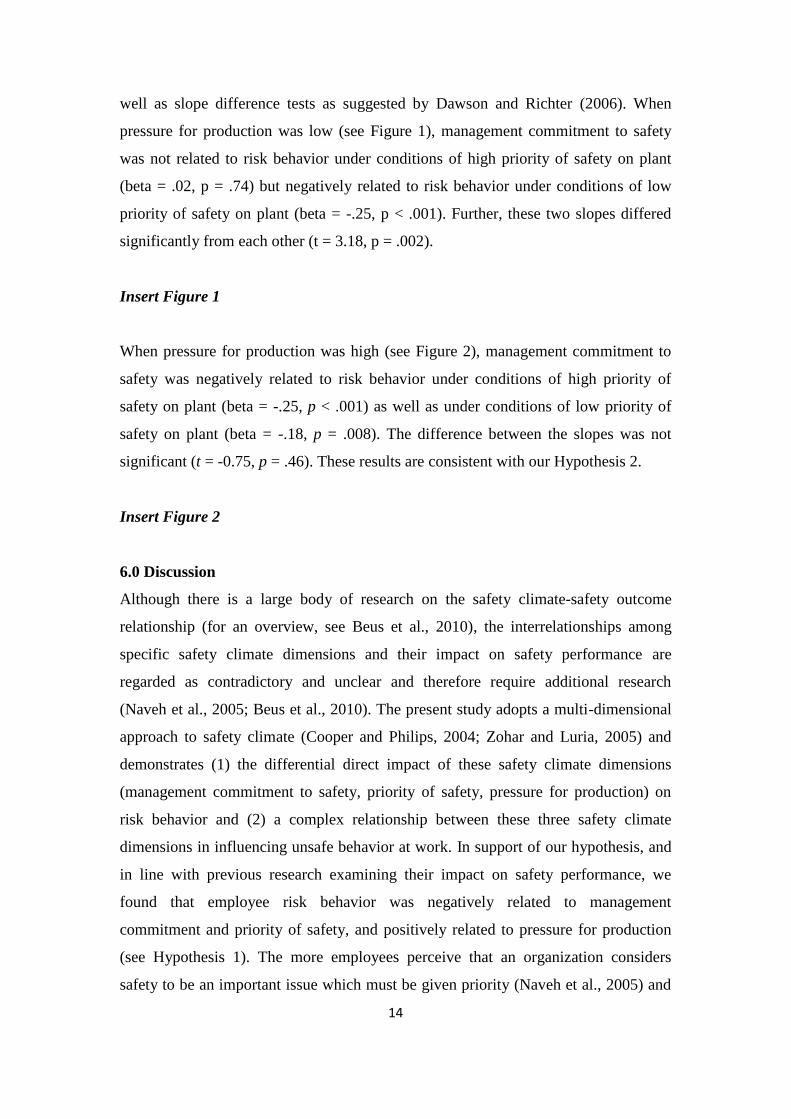
well as slope difference tests as suggested by Dawson and Richter (2006). When
pressure for production was low (see Figure 1), management commitment to safety
was not related to risk behavior under conditions of high priority of safety on plant
(beta = .02, p = .74) but negatively related to risk behavior under conditions of low
priority of safety on plant (beta = -.25, p < .001). Further, these two slopes differed
significantly from each other (t = 3.18, p = .002).
Insert Figure 1
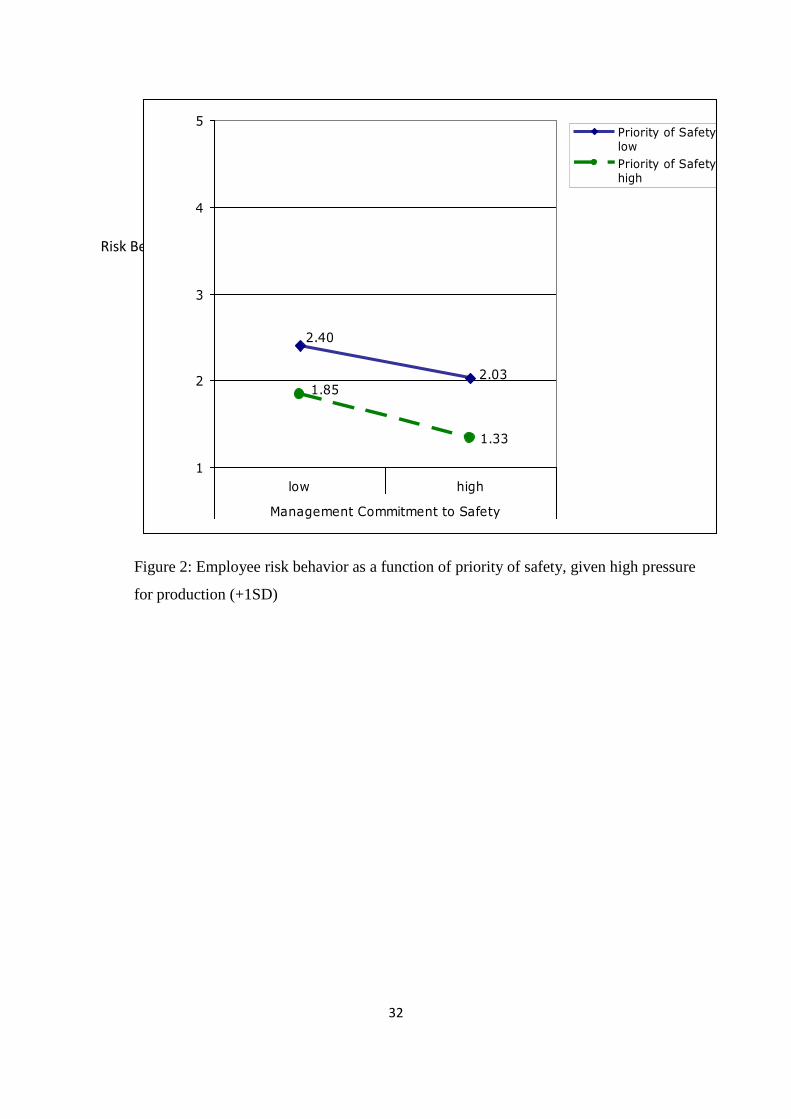
When pressure for production was high (see Figure 2), management commitment to
safety was negatively related to risk behavior under conditions of high priority of
safety on plant (beta = -.25, p < .001) as well as under conditions of low priority of
safety on plant (beta = -.18, p = .008). The difference between the slopes was not
significant (t = -0.75, p = .46). These results are consistent with our Hypothesis 2.
Insert Figure 2
6.0 Discussion
Although there is a large body of research on the safety climate-safety outcome
relationship (for an overview, see Beus et al., 2010), the interrelationships among
specific safety climate dimensions and their impact on safety performance are
regarded as contradictory and unclear and therefore require additional research
(Naveh et al., 2005; Beus et al., 2010). The present study adopts a multi-dimensional
approach to safety climate (Cooper and Philips, 2004; Zohar and Luria, 2005) and
demonstrates (1) the differential direct impact of these safety climate dimensions
(management commitment to safety, priority of safety, pressure for production) on
risk behavior and (2) a complex relationship between these three safety climate
dimensions in influencing unsafe behavior at work. In support of our hypothesis, and
in line with previous research examining their impact on safety performance, we
found that employee risk behavior was negatively related to management
commitment and priority of safety, and positively related to pressure for production
(see Hypothesis 1). The more employees perceive that an organization considers
safety to be an important issue which must be given priority (Naveh et al., 2005) and
15
that (senior) management engages in communication and actions that support safety
(Christian et al., 2009), the less they will engage in risk behavior. Managerial
behavior provides cues regarding workplace norms (Morrow et al., 2010) as well as
which kind of behavior is likely to be supported, valued or rewarded (Zohar, 2003).
Similarly when employees perceive that aspects such as safety policies, procedures
and management systems are relevant, effective and given priority over competing
demands, they are less inclined to engage in risk behavior (Fleming, 1999; Cooper,
2000). In contrast perceived tensions between meeting production deadlines and
adhering to safety procedure (i.e. pressure for production) may cause employees to
sacrifice safety and engage in risk behavior. This tension can have a direct effect on
accident risk as employees who perceive that they are under pressure to increase
production may deviate from safety rules that impede their progress or perform tasks
with less care, thereby increasing the likelihood of accidents (Clarke and Cooper,
2004).
Finally, we demonstrated that these three safety climate dimensions interacted,
supporting our assumption that the moderating effect of safety priority on the
relationship between management commitment to safety and safety outcomes as
found by Katz-Navon and colleagues (2005) depends upon the level of pressure for
production within the organization (see Hypothesis 2). In other words, similar to
Katz-Navon et al (2005) we found that when priority given to safety was high the
impact of managerial commitment to safety on employees’ risk behavior was
nullified; however, in contrast to these researchers we expected and found this effect
only for conditions where employees experienced low levels of pressure for
production. In this particular context, employees received enough cues regarding the
importance of safety within their unit and the low work pressure was not at conflict
with these cues; the understanding that management also emphasized and valued
safety had no additional influence on employees’ behavior. In contrast, under
conditions where employees experienced high levels of pressure for production,
management commitment to safety was still influential regardless of high versus low
priority of safety on plant. Therefore when conflict exists between pressure for
production and priority of safety, employees look to their managers for cues to guide
their own safety behavior. As managers have a direct bearing on the jobs and
16
allocated rewards of employees (Morrow et al., 2010), an employees’ likelihood to
engage in risk behavior is reduced when their manager is highly committed to safety
despite a high demand for workplace productivity. Overall, the results of the three-
way interaction between the three safety climate dimensions suggest that senior
management commitment to safety was influential in reducing risk behavior in
“unideal” situations (e.g. ambiguity, not enough cues regarding importance of safety,
role conflict) but not “ideal” situations.
7.0 Limitations and Future Research
There are a number of issues with the current research that deserve attention.
Foremost among them is the small effect of the three-way interaction. Although this
effect accounted for only 1.2% of the variance in employees’ risk behavior, we feel
that it is meaningful for the following reasons. Relative to experimentalists, field
researchers have lower statistical power and thus considerable difficulty detecting
theorized moderator effects due to a number of factors including nonoptimal
distributions of the component variables associated with lower residual variances of
the product term and thus lesser efficiency of the moderator parameter estimate
(McClelland and Judd, 1993). This is particularly true for higher order interactions.
Thus even though the effect size of the interaction observed in the present research is
small by conventional standards, the effect is important as the odds of detecting it
were against us. Similarly, Evans (1985) concluded even those effects explaining as
little as 1% of the total variance should be considered important. From a practical
perspective this effect deserves attention for two reasons. First, the impact of
supervisors and plant managers’ behaviors on worker safety is believed to operate in a
more direct fashion than that of the less visible and more remote senior managers
(Thompson et al., 1998), suggesting that the correlation between perceived
managerial commitment to safety and employee risk behavior is more distal for the
latter than the former group of managers. Therefore even the small effect of our three-
way interaction might indicate that (senior) management commitment to safety has an
important impact on employee risk behavior, contingent on priority of safety and
pressure for production. Second, following Cortina and Landis’s (2009) logic, such
effects may appear small if observed in a snapshot but might have significant
cumulative consequences for (un) safe employee behavior and accidents if considered
17
across a large number of situations, organizations and/or over time. Another issue that
needs to be addressed is the collection of data from the same respondents using self-
report measures, as the mono-method approach is believed to distort (typically inflate)
correlations among the key variables (e.g. Lance and Vandenberg, 2009; Lance et al.,
2010). Although it could be argued that any inflated correlations due to common
method variance are counterbalanced by the attenuating effect of measurement error
as demonstrated by Lance and colleagues (2010), it is advisable that future studies
testing the observed relationships in the present study also employ a hetero-method
approach and procedural methods of control, believed to reduce common method
variance (see Podsakoff et al., 2012). For example, archival data on accidents could
be used as a proxy for risk behavior instead of self-reported measures. Ratings of risk
behavior by co-workers and supervisors could also be used in addition to observation
of safety behavior on site. Other research, however, has shown that self-reported
unsafe behaviors and accidents are related to independent observations of the same
variables (Lusk et al., 1995). In addition, any social desirability concerns on the part
of employees are believed to suppress variance on these measures such that
employees would tend to underestimate rather than overestimate unsafe behaviors and
accidents (Hofmann and Stelzer, 1996; Probst and Estrada, 2010). Thus, social
desirability concerns among employees presumably counterbalance any possible
inflated correlations between our safety climate predictors and outcome variable, i.e.,
risk behavior, due to common method bias.
Our study is also restricted to three dimensions of safety climate (Mearns et al., 1997;
Fleming, 2001) and one measure of unsafe behavior (i.e. risk behavior). Future
research should identify and investigate other safety climate dimensions such as
safety training (Zohar, 2002), safety motivation (Griffin and Neal, 2000) and safety-
specific leadership (Conchie and Donald, 2009) and examine their impact on different
forms of safe (e.g. pro-active safety behavior), and unsafe behaviors (e.g. non-
compliance), using not only a cross-sectional but also longitudinal design. A
longitudinal assessment would provide further validation of the found relationships
and also test for causation. In addition, we advise researchers to investigate if the
results of this study hold for all types of industries (Coyle et al., 1995; Cooper and
Philips, 2004;). Finally, in contrast to Naveh et al. (2005) the present study focused on
18
employees’ perceptions of senior management rather than direct supervisor
commitment to safety. As previously mentioned, these groups have different roles,
with senior management focusing on safety policy-making and the establishment of
safety procedures to facilitate policy implementation, and supervisors executing these
procedures (Zohar and Luria, 2005). To date research that considers perceptions of
both senior managers and direct supervisors simultaneously is sparse and yields
contradictory findings regarding the impact of different management levels on
employee safety behavior (e.g. Andriessen, 1978; Simard and Marchand, 1995; Zohar
and Luria, 2005; Cooper, 2006). Building on our findings, future research could
address commitment to safety at both management levels in order to see if the found
interaction among the safety climate dimensions holds for senior and front line
managers, and investigate whether either takes precedence when pressure for
production is high or low. In other words, when employees experience work-safety
tension or role conflict, which group is the most influential safety referent to guide
employee safety behavior? In line with O’Dea and Flin (2001) we therefore
encourage researchers to disentangle the differential effects of senior management
and direct supervisors and their relative impact on safety, possibly employing a
multilevel model of climate (see Zohar and Luria, 2005) and collecting data also from
supervisors and top management.
8.0 Implications for Management
According to our findings, the three dimensions of safety climate have a direct
influence on employee risk behavior. Therefore activities which promote managerial
commitment and priority of safety, and minimise pressure for production should be
enacted and encouraged within organizations to reduce the occurrence of risk
behavior by employees. More specifically for organizations the three-way interaction
found between the three safety dimensions demonstrate that when employees
experience tension between their production deadlines and safety procedures, they are
less likely to engage in risk behavior when managerial commitment to safety is
perceived to be high. In other words, senior management commitment to safety is
particularly critical for minimizing employee risk behavior when there is perceived
pressure to ignore or even break safety rules. Therefore from a practical perspective
senior management may need to re-evaluate their role in the safety process and move
19
beyond safety policy formulation to that of a safety change agent (Buchanan &
Storey, 1997). This may be especially relevant when trying to reduce risk behavior
amongst blue collar workers who are subject to highly pressurised production quotas.
Managers' discourse may appear insincere if employees perceive that the job duties do
not allow for safe working (Morrow et al., 2010). Given the perceived differences in
status, power and prestige between management and employees, employees scrutinise
the behavior of senior management for evidence that management are not committed
towards safety, that safety is not a priority or that production targets should be met at
all costs. This may impact on their levels of motivation to work safely or their
willingness to engage in pro-active safety behavior. Zohar (2010) describes this as a
social learning process whereby employees interpret the organizational environment
by repeatedly observing (and exchanging information with) their leader (Dragoni,
2005). The extent to which employees’ scrutinize managerial actions with regard to
safety can be emphasised using managerial safety training, which emphasize the
manager’s role as a safety referent (Beus et al., 2010). As employees look to
managerial behavior in situations of productivity-safety tensions, managers should
demonstrate their commitment to safety through both communications and actions
(i.e. regularly talk about safety, investment of resources in creating safe work
environment, consideration in job design decisions, rewarding safe behavior etc.). In
addition, the findings of our research suggest that managers who intend to design
safety interventions should target all three safety climate dimensions in order to
ensure safety. As mentioned by Katz-Navon and colleagues (2005) interventions that
aim to improve only part of the three dimensions are unlikely to be as effective, since
the dimensions are interrelated and together they influence employees’ risk behavior
and should be managed as such.
In sum our findings demonstrate the direct and interactive effects of safety climate
dimensions on risk behavior which (a) broaden our understanding of safety climate as
a multi-dimensional construct and (b) highlight the importance of examining higher-
order interactions between dimensions of safety climate in predicting (un)safe
employee behavior. Specifically, our study has identified boundary conditions under
which the impact of managerial commitment to safety on employee risk behavior is
enhanced or attenuated which in turn can inform managers about the situations in
20
which their actions and behaviors are particularly influential for reducing employee
risk behavior and accidents on site.
21
References
Andriessen, J. H. T. H. 1978. Safe behavior and safety motivation. Journal of Occupational
Accidents 1, 363-376.
Aiken, L.S. & West, S.G. 1991. Multiple regression: Testing and interpreting interactions.
Newbury Park, CA: Sage.
Baysari, M. T., McIntosh, A. S. & Wilson, J. R. 2008. Understanding the human factors
contribution to railway accidents and incidents in Australia. Accident Analysis and
Prevention 40, 1750-1757.
Beus, J.M., Payne, S.C., Bergman, M.E., & Arthur, W. 2010. Safety climate and injuries: An
examination of theoretical and empirical relationships. Journal of Applied Psychology 95 (4),
713-727.
Brown, R.L., & Holmes, H. 1996. The use of a factor analytic procedure for assessing the
validity of an employee safety climate model. Accident Analysis and Prevention 18, 445-470.
Brown, K.A., Willis, P.G., & Prussia, G.E. 2000. Predicting safe employee behavior in the
steel industry: Development and test of a socio-technical model. Journal of Operations
Management 18 (4), 445-465.
Buchanan, D. & Storey, J. 1997. Role taking and role switching in organizational change. In
I. McLoughlin & M. Harris (Eds), Innovation, organizational change and technology.
London: International Thomson, pp. 127–45.
Campbell, D. T., & Fiske, D. W. 1959. Convergent and discriminant validation by the
multitrait-multimethod matrix. Psychological Bulletin 56, 81-105.
Christian, M.S., Bradley, J.C., Wallace, J.C., & Burke, M.J. 2009. Workplace safety: A meta-
analysis of the roles of person and situation factors. Journal of Applied Psychology 94, 1103-
1127.
22
Clark, S. 2006. The relationship between safety climate and safety performance: A meta-
analytic review. Journal of Occupational Health Psychology 11 (4), 315-327.
Clarke, S. 1999. Perceptions of organizational safety: Implications for the development of
safety culture. Journal of Organizational Behavior 20, 185-198.
Clarke, S. 2009. Accidents and safety in the workplace. In: Cartwright, S., Cooper, C.L.
(Eds). The Oxford handbook of organizational well-being. Oxford University Press, Oxford,
UK, pp.31-54.
Clarke, S., & Cooper, C.L. 2004. Managing the risk of workplace stress. London: Routledge.
Clarke, S., & Ward, K. 2006. The role of leader influence tactics and safety climate in
engaging employees’ safety participation. Risk Analysis 26, 1175-1185.
Conchie, S. M., & Donald, I. J. 2009. The moderating role of safety-specific trust on the
relation between safety-specific leadership and safety citizenship behaviors. Journal of
Occupational Health Psychology 14, 137–147.
Cooper, D. 2006. The impact of management’s commitment on employee behavior: A field
study. Paper presented at the 7th Professional and Development Conference & Exhibition of
the American Society of Safety Engineers, Kingdom of Bahrain.
Cooper, M.D., & Phillips, R.A. 2004. Exploratory analysis of the safety climate and safety
behavior relationship. Journal of Safety Research 35, 497-512.
Cortina, J.M. & Landis, R.S. 2009. When small effect sizes tell a big story, and when large
effect sizes don’t. In C. E. Lance & R. J. Vandenberg (Eds.), Statistical and methodological
myths and urban legends: Doctrine, verity, and fable in the organizational and social sciences.
New York: Routledge.
23
Cox, S.J., & Cheyne, A.J.T. 2000. Assessing safety culture in offshore environments. Safety
Science 34, 111-129.
Cox, S., & Flin, R. 1998. Safety culture: philosopher's stone or man of straw? Work and
Stress 12(3), 202-216.
Coyle, I. R., Sleeman, S. D., Adams, N., 1995. Safety Climate. Journal of Safety Research 26
(4), 247-254.
Dawson, J. F., & Richter, A. W. 2006. Probing three-way interactions: The development and
application of a slope difference test. Journal of Applied Psychology 91, 917-926.
Dedobbeleer, N., & Beland, F. 1991. A safety climate measure for construction sites. Journal
of Safety Research 22, 97-103.
Evans, M.G. 1985. A Monte-Carlo study of the effects of correlated method variance in
moderated multiple regression analysis. Organizational Behavior and Human Decision
Processes 36, 305-323.
Falbruch, B., & Wilpert, B. 1999. System safety- An emerging field for I/O psychology. In
C. Cooper & I. Robertson (Eds). International review of industrial and organisational
psychology: 55-94. Chichester, UK: Wiley.
Fleming, M. 1999. Effective supervisory safety leadership behaviors in the offshore oil and
Gas industry. Suffolk. HSE Books.
Fleming, M. 2001. Safety culture maturity model. Offshore technology Report 049. HSE
Books.
Flin, R., Mearns, K., O’Connor, P., Bryden, R. 2000. Measuring safety climate: identifying
the common features. Safety Science 34, 177-192.
Geller, E.S. 2001. The psychology of safety handbook. Boca Raton, FL: CFR Press.
24
Goldenhar, L.M., Williams, L.J., & Swanson, N.G., 2003. Modelling relationships between
job stressors and injury and near-miss outcomes for construction labourers. Work Stress 17
(3), 218–240.
González-Romá, V., L. Fortes-Ferreira, L. & Peiró, J. M. 2009. Team climate, climate
strength and team performance. A longitudinal study. Journal of Occupational and
Organizational Psychology 82, 511–536.
Griffin, M. A., & Neal, A. 2000. Perceptions of safety at work: A framework for linking
safety climate to safety performance, knowledge and motivation. Journal of Occupational
Health Psychology 5 (3), 347-358.
Hayes, B.E., Peranda, J., Smecko, T. & Trask, J. 1998. Measuring perceptions of workplace
safety: Development and validation of the workplace safety scale. Journal of Safety Research
29 (3), 145-61.
Hofmann, D.A., & Mark, B., 2006. An investigation of the relationship between safety
climate and medication errors as well as other nurse and patient outcomes. Personnel
Psychology 59 (4), 847–869.
Hofmann, D. A., & Stetzer, A. 1996. A cross-level investigation of factors influencing unsafe
behaviors and accidents. Personnel Psychology 49, 307-339.
Katz-Navon, T., Naveh, E., & Stern, Z. 2005. Safety Climate in Healthcare Organizations: A
multidimensional Approach. Academy of Management Journal 48 (6), 1075 -1089.
Lance, C. E., Dawson, B., Birkelbach, D., & Hoffman, B. J. 2010. Method effects,
measurement error, and substantive conclusions. Organizational Research Methods 13, 435-
455.
25
Lance, C. E. & Vandenberg, R. J. 2009. Statistical and methodological myths and urban
legends: Doctrine, verity, and fable in organizational and social research. New York:
Routledge.
Langford, D., Rowlinson, S., & Sawacha, E. 2000. Safety behavior and safety management:
its influence on the attitudes of workers in the UK construction industry. Engineering,
Construction and Architectural Management 7 (2), 133 – 140.
Larsson, S., Pousette, A., & Torner, M. 2008. Psychological climate and safety in the
construction industry-mediated influence on safety behaviour. Safety Science 46, 405-412
Lusk, S. L., Ronis, D. L., & Baer, L., M., 1995. A comparison of multiple indicators:
Observations, supervisor report, and self-report as measures of workers’ hearing protection
use. Evaluation and the Health Professions 18, 51-63.
McClelland, G.H., & Judd, C.M. 1993. Statistical difficulties of detecting interactions and
moderator effects. Psychological Bulletin 114(2), 376-390.
McLain, D.L., & Jarrell, K.A. 2007. The perceived compatibility of safety and production
expectations in hazardous occupations. Journal of Safety Research 38 (3), 299-309
Mearns, K., Flin, R., Fleming, M., & Gordon, R. 1997. Human and organisational factors in
offshore safety. Report (OTH 543). Offshore safety Division. HSE Books, Suffolk.
Mearns, K., Flin, R., Gordon, R., & Fleming, M. 1998. Measuring safety climate on offshore
installations. Work and Stress 12 (3), 238-254.
Mearns, K., Flin, R., Gordon, R., & Fleming, M. 2001. Human and organisational factors in
offshore safety. Work and Stress 15, 144-160.
Mearns, K., Whitaker, S.M., & Flin, R. 2003. Safety climate, safety management practice and
safety performance in offshore environments. Safety Science 41, 641-680.
26
Morrow, S.L., McGonagle, A.K., Dove-Steinkamp, M.L., Walker, C.T., Marmet, M., &
Barnes-Farrell, J.L. 2010. Relationships between psychological safety climate facets and
safety behavior in the rail industry: A dominance analysis. Accident Analysis and Prevention
42, 1460-1467.
Nahrgang, J. D., Morgeson, F. P., Hofmann, D. A., 2008. Predicting safety performance: a
meta-analysis of safety and organizational constructs. In: Presented at the Annual Meeting of
the Society for Industrial and Organizational Psychology, San Francisco, April.
Naveh, E., Katz-Navon, T., & Stern, Z. 2005. Treatment errors in healthcare: A safety
climate approach. Management Science 51, 948-960.
Neal, A., & Griffin, M.A. 2006. A study of the lagged relationships among safety climate,
safety motivation, safety behavior, and accidents at the individual and group levels. Journal
of Applied Psychology 91, 946-953.
O’Dea, A. & Flin, R. 2001. Site managers and safety leadership in the offshore oil and gas
industry. Safety Science 37, 39-57.
Ostroff, C., & Bowen, D. E. 2000. Moving HR to a higher level: Human resource practices
and organizational effectiveness. In K. J. Klein & S. W. J. Kozlowski (Eds.), Multilevel
theory, research, and methods in organizations, 211–266. San Francisco: Jossey-Bass.
Podsakoff, P. M., MacKenzie, S. B., & Podsakoff, N. P. 2012. Sources of method bias in
social science research and recommendations on how to control it. Annual Review of
Psychology 63, 539-569.
Pousette, A., Larsson, S., & Torner, M. 2008. Safety climate cross-validation, strength and
prediction of safety behavior. Safety Science 46, 398-404.
Probst, T. M., & Estrada, A. X. 2010. Accident under-reporting among employees: Testing
the moderating influence of psychological safety climate and supervisor enforcement of
safety practices. Accident Analysis and Prevention 42, 1438-1444.
27
Prussia, G.E., Brown, K.A., & Willis, P.G. 2003. Mental models of safety: Do managers and
employees see eye to eye? Journal of Safety Research 34, 143-156.
Rousseau, D. M. 1985. Issues of level in organizational research: multilevel and cross-level
perspectives. Research in Organizational Behavior 7, 1– 37.
Rundmo, T. 1995. Perceived risk, safety status, and job stress among injured and noninjured
employees on offshore petroleum installations. Journal of Safety Research 26, 87-97.
Rundmo, T., 1997. Associations between risk perception and safety. Safety Science 24, 197-
209.
Rundmo, R., 1998a. Management safety attitudes and risk behaviour. Rotunde publikasjoner,
Trondheim. (ISBN 82-7892-004-4).
Rundmo, R., 1998b. Organisational factors, safety attitudes and risk behaviour (Main report
n. 97/24. Prepared for Norsk Hydro). Rotunde publikasjoner, Trondheim. (ISBN 82-7892-
003-6).
Rundmo, T., 2000. Safety climate, attitudes and risk perception in Norsk Hydro. Safety
Science 34, 47–59.
Rundmo, T., Hale, A.R., 2003. Managers’ attitudes toward safety and accident prevention.
Safety Science 41, 557–574.
Seo, D.C. 2005. An explicative model of unsafe work behavior. Safety Science 43, 187-211
Shannon, H.S., Robson, L.S., & Sale, J.E. 2001. Creating safer and healthier workplaces: role
of organizational factors and job characteristics. American Journal of Industrial Medicine 40,
319–334.
28
Simard, M. & Marchand, A. 1995). A Multilevel analysis of organizational factors related to
the taking of safety initiatives by workgroups. Safety Science 21, 113-129.
Thompson, R.C., Hilton, T.F., & Witt, L.A. 1998. Where the safety rubber meets the shop
floor: A confirmatory model of management influence on workplace safety. Journal of Safety
Research 29 (1), 15-24.
Wills, A.R., Watson, B., Biggs, H.C., 2006. Comparing safety climate factors as predictors of
work-related driving behaviour. Journal of Safety Research 37, 375–383.
Wirth, O., & Sigurdsson, S.O. 2008. When workplace safety depends on behavior change:
Topics for behavioral research. Journal of Safety Research 39, 589-598.
Wright, C. 1986. Routine deaths: Fatal accidents in the oil industry. Sociological Review 34,
265-289.
Zohar, D. 1980. Safety climate in industrial organizations: Theoretical and applied
implications. Journal of Applied Psychology 65 (1), 96-102.
Zohar, D. 2002. Modifying supervisory practices to improve subunit safety: A leadership-
based intervention model. Journal of Applied Psychology 87 (1), 156-163.
Zohar, D. 2003. The use of supervisory practices as leverage to improve safety behavior: A
cross-level intervention model. Journal of Safety Research 34 (5), 567-577.
Zohar, D. 2010. Thirty years of safety climate research: reflections and future directions.
Accident Analysis and Prevention 42, 1517-1522.
Zohar, D. & Luria, G. 2005. A multilevel model of safety climate: Cross-level relationships
between organization and group-level climates. Journal of Applied Psychology 90, 616-628.
29
Table 1: Descriptive Statistics and Correlations Among the Study Variables
Variables M SD 1 2 3 4 5 6 7 8
1. Risk Behavior 1.68 .85 (.80)
2. Age 5.04 2.08 -.09* -
3. Function a .74 .44 .12** -.02 -
4. Contact Type b
.31 .46 .05 -.33** .09* -
5. Service Length 2.04 1.17 .05 .54** .04 -.39** -
6. MCS -.07 1.01 -.48** .11** -.14** -.05 .07 (.88)
7. SP -.02 .95 -.45** .06 -.07 .02 .01 .36** (.87)
8. PP .11 1.10 .52** -.18** .09* .03 -.06 -.58** -.34** (.75)
Note. N = 623. Cronbach’s Alphas are indicated in parentheses. MCS = Management Commitment to Safety, SP = Safety Priority on Plant, PP =
Pressure for Production
a 0 = Maintenance, 1 = Production
b 0 = Permanent, 1 = Temporary
*** p < .001, ** p < .01, * p < .05
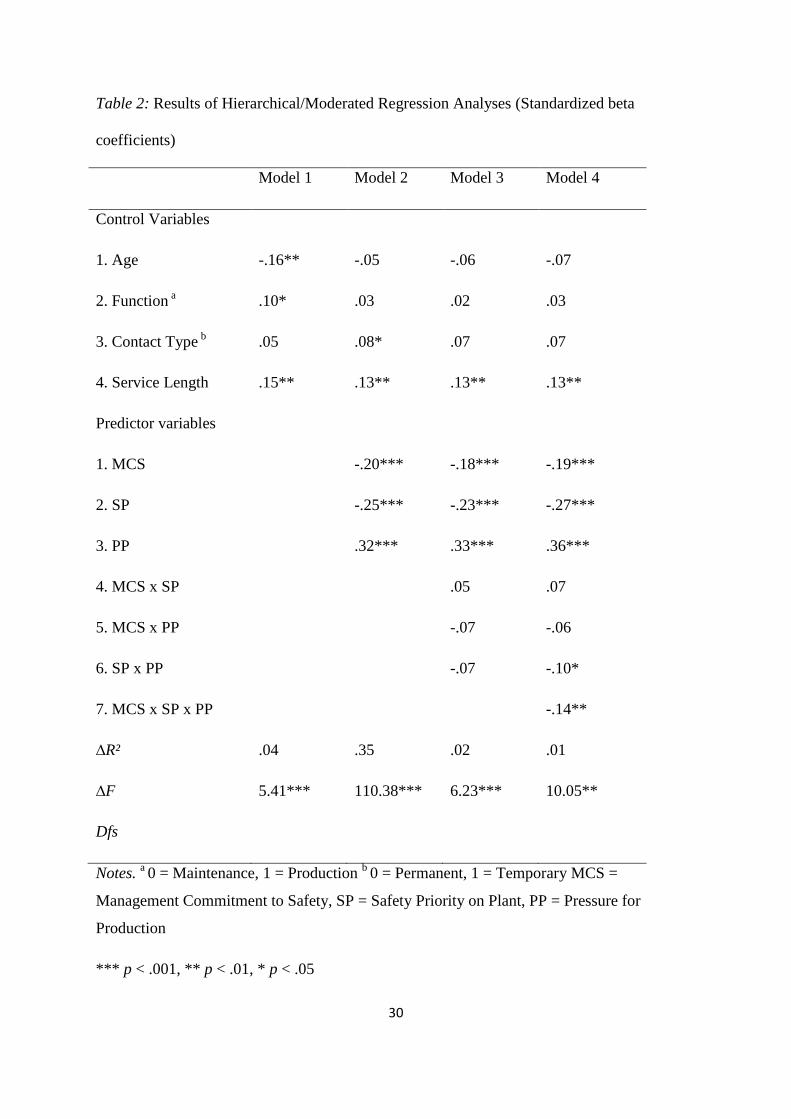
30
Table 2: Results of Hierarchical/Moderated Regression Analyses (Standardized beta
coefficients)
Model 1 Model 2 Model 3 Model 4
Control Variables
1. Age -.16** -.05 -.06 -.07
2. Function a .10* .03 .02 .03
3. Contact Type b
.05 .08* .07 .07
4. Service Length .15** .13** .13** .13**
Predictor variables
1. MCS -.20*** -.18*** -.19***
2. SP -.25*** -.23*** -.27***
3. PP .32*** .33*** .36***
4. MCS x SP .05 .07
5. MCS x PP -.07 -.06
6. SP x PP -.07 -.10*
7. MCS x SP x PP -.14**
∆R² .04 .35 .02 .01
∆F 5.41*** 110.38*** 6.23*** 10.05**
Dfs
Notes. a 0 = Maintenance, 1 = Production
b 0 = Permanent, 1 = Temporary MCS =
Management Commitment to Safety, SP = Safety Priority on Plant, PP = Pressure for
Production
*** p < .001, ** p < .01, * p < .05
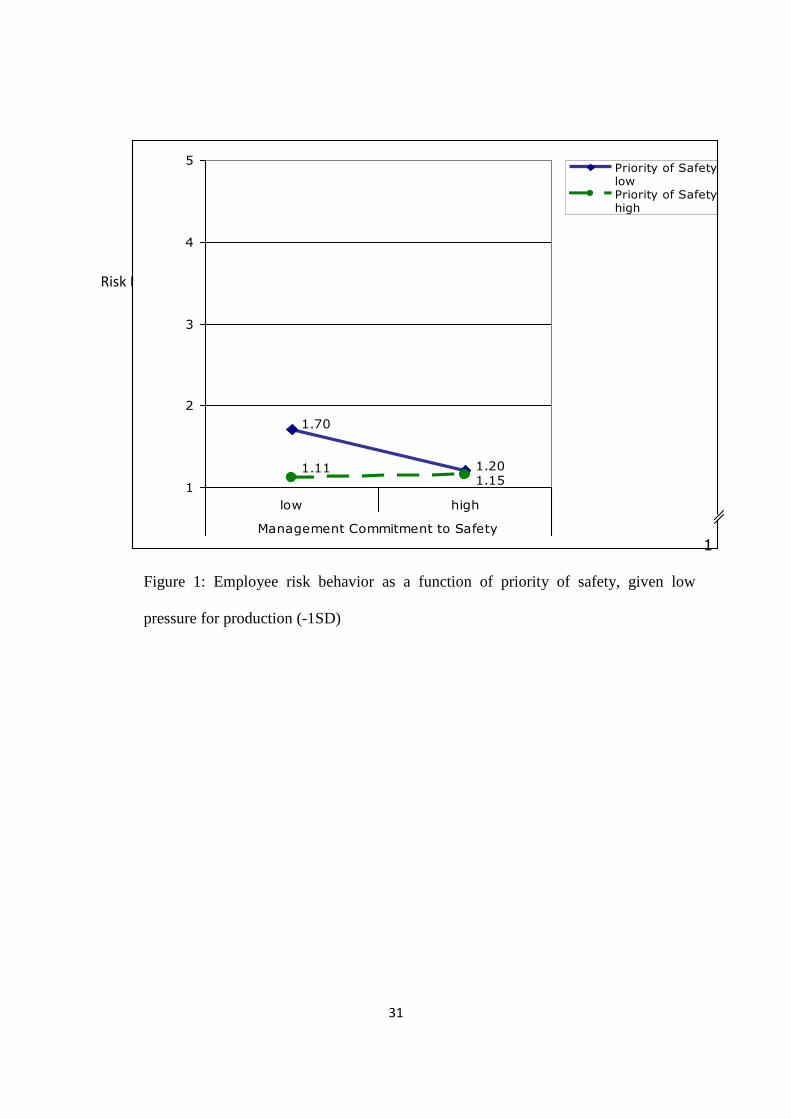
31
Figure 1: Employee risk behavior as a function of priority of safety, given low
pressure for production (-1SD)
Risk Behavior
1.70
1.201.111.15
1
2
3
4
5
low high
Management Commitment to Safety
Priority of SafetylowPriority of Safetyhigh
1
32
Figure 2: Employee risk behavior as a function of priority of safety, given high pressure
for production (+1SD)
Risk Behavior
1.33
2.40
2.031.85
1
2
3
4
5
low high
Management Commitment to Safety
Priority of Safetylow
Priority of Safetyhigh
33
i One of the twelve items indicative of management commitment to safety scale in our study
used the referent “supervisor” instead of “management”. In Mearns et al. (2003)’s study,
which employed the OSQ in order to investigate safety climate, safety practice, and safety
performance in offshore environments, the factor solution revealed this item to load onto the
factor (senior) management commitment and therefore we also decided to keep this item.
ii Results of the alternative model comparisons are available upon request from the first
author.