Embed Size (px)
Citation preview
Doctoral thesisfor the degree of doktor ingeniør
Trondheim, December 2005
Norwegian University ofScience and TechnologyFaculty of Engineering Science and TechnologyDepartment of Production and Quality Engineering
Snorre Sklet
Safety Barriers on Oil and GasPlatformsMeans to Prevent Hydrocarbon Releases
NTNUNorwegian University of Science and Technology
Doctoral thesisfor the degree of doktor ingeniør
Faculty of Engineering Science and TechnologyDepartment of Production and Quality Engineering
©Snorre Sklet
ISBN 82-471-7742-0 (printed ver.)ISBN 82-471-7741-2 (electronic ver.)ISSN 1503-8181
Doctoral Theses at NTNU, 2006:3
Printed by Tapir Uttrykk
Safety Barriers on Oil and Gas Platforms
Means to Prevent Hydrocarbon Releases
Doctoral Thesis
by
Snorre Sklet
Department of Production and Quality Engineering, The Norwegian University of Science and Technology (NTNU)

Thesis - Summary
iii
Summary
The main objective of the PhD project has been to develop concepts and methods that can be used to define, illustrate, analyse, and improve safety barriers in the operational phase of offshore oil and gas production platforms. The main contributions of this thesis are;
Clarification of the term safety barrier with respect to definitions, classification, and relevant attributes for analysis of barrier performance
Development and discussion of a representative set of hydrocarbon release scenarios
Development and testing of a new method, BORA-Release, for qualitative and quantitative risk analysis of hydrocarbon releases
Safety barriers are defined as physical and/or non-physical means planned to prevent, control, or mitigate undesired events or accidents. The means may range from a single technical unit or human actions, to a complex socio-technical system. It is useful to distinguish between barrier functions and barrier systems. Barrier functions describe the purpose of safety barriers or what the safety barriers shall do in order to prevent, control, or mitigate undesired events or accidents. Barrier systems describe how a barrier function is realized or executed. If the barrier system is functioning, the barrier function is performed. If a barrier function is performed successfully, it should have a direct and significant effect on the occurrence and/or consequences of an undesired event or accident. It is recommended to address the following attributes to characterize the performance of safety barriers; a) functionality/effectiveness, b) reliability/ availability, c) response time, d) robustness, and e) triggering event or condition. For some types of barriers, not all the attributes are relevant or necessary in order to describe the barrier performance. The presented hydrocarbon release scenarios include initiating events, barrier functions introduced to prevent hydrocarbon releases, and barrier systems realizing the barrier functions. Both technical and human/operational safety barriers are considered. The initiating events are divided into five main categories; (1) human
Thesis - Summary
iv
and operational errors, (2) technical failures, (3) process upsets, (4) external events, and (5) latent failures from design. The development of the hydrocarbon release scenarios has generated new knowledge about causal factors of hydrocarbon releases and safety barriers introduced to prevent the releases. Collectively, the release scenarios cover the most frequent initiating events and the most important safety barriers introduced to prevent hydrocarbon releases. BORA-Release is a new method for qualitative and quantitative risk analysis of the hydrocarbon release frequency on oil and gas platforms. BORA-Release combines use of barrier block diagrams/event trees, fault trees, and risk influence diagrams in order to analyse the risk of hydrocarbon release from a set of hydrocarbon release scenarios. Use of BORA-Release makes it possible to analyse the effect on the hydrocarbon release frequency of safety barriers introduced to prevent hydrocarbon releases. Further, BORA-Release may be used to analyse the effect on the barrier performance of platform specific conditions of technical, human, operational, and organisational risk influencing factors. Thus, BORA-Release may improve today’s quantitative risk analyses on two weak points; i) analysis of causal factors of the initiating event hydrocarbon release (loss of containment), and ii) analysis of the effect on the risk of human and organisational factors. The main focus of this thesis is safety barriers introduced to prevent hydrocarbon releases on offshore oil and gas production platforms. Thus, the results are primarily useful for the oil and gas industry in their effort to control and reduce the risk of hydrocarbon releases. The Norwegian oil and gas industry can use the results in their work to fulfil the requirements to safety barriers and risk analyses from the Petroleum Safety Authority. However, the concepts and methods may also be applied in other industries (e.g., the process industry) and application areas (e.g., the transport sector) in their effort to reduce the risk.
Thesis - Preface
v
Preface
This thesis documents the work carried out during my PhD study at the Norwegian University of Science and Technology (NTNU), Department of Production and Quality Engineering. The research is carried out from 2001 to 2005. The PhD study is financed by a scholarship from Vesta Forsikring and I am grateful for their financial support. I appreciate and acknowledge the support from my supervisor during the work with the thesis, Professor Marvin Rausand at Department of Production and Quality Engineering, NTNU. Finally, thanks to all the people I have collaborated with during the PhD study; colleagues at SINTEF (Stein Hauge, Helge Langseth, Trygve Steiro, and Knut Øien) and NTNU (Eirik Albrechtsen and Kjell Corneliussen), the BORA project team (Jan Erik Vinnem, UiS, Terje Aven, UiS, and Jorunn Seljelid, Safetec), people from oil companies and the authority (Rune Botnevik, Statoil, John Monsen, Hydro, Kjell Sandve, ConocoPhillips, and Odd Tjelta, PSA), and all other people who have participated in the research projects I have worked on during the PhD study.
Trondheim, December 2005
Snorre Sklet

Thesis – Table of contents
vii
Table of contents
Summary ................................................................................................................... iii
Preface ......................................................................................................................v
Table of contents ...................................................................................................... vii
PART I MAIN REPORT...........................................................................................1
1 Introduction..................................................................................................3
1.1 Background ..................................................................................................3 1.2 Objectives ....................................................................................................5 1.3 Delimitations................................................................................................5 1.4 Structure of the report ..................................................................................6
2 Research approach and principles................................................................9
2.1 Scientific approach.......................................................................................9 2.2 Research principles ......................................................................................9 2.3 Concepts.....................................................................................................11
3 Main results................................................................................................13
3.1 The concept of safety barriers ....................................................................13 3.2 Classification of safety barriers..................................................................14 3.3 Performance of safety barriers ...................................................................15 3.4 Hydrocarbon release scenarios...................................................................17 3.5 BORA-Release...........................................................................................18 3.6 Results from the case study........................................................................19 3.7 Safety barriers and methods for accident investigation .............................21 3.8 Standardized procedures for Work Permits ...............................................23
4 Conclusions, discussion, and further research ...........................................25
5 Acronyms...................................................................................................31
6 References..................................................................................................33
Thesis – Table of contents
viii
PART II PAPERS
Paper 1 Safety barriers; definition, classification and performance
Paper 2 Hydrocarbon releases on oil and gas production platforms; Release scenarios and safety barriers
Paper 3 Barrier and operational risk analysis of hydrocarbon releases (BORA-Release); Part I Method description
Paper 4 Barrier and operational risk analysis of hydrocarbon releases (BORA-Release); Part II Results from a case study
Paper 5 Comparison of some selected methods for accident investigation
Paper 6 Qualitative Analysis of Human, Technical and Operational Barrier Elements during Well Interventions
Paper 7 Standardised procedures for Work Permits and Safe Job Analysis on the Norwegian Continental Shelf
Paper 8 Challenges related to surveillance of safety functions

Thesis – Part I Main Report
PART I MAIN REPORT

Thesis – Part I Main Report
3
1 Introduction
1.1 Background
In the regulations concerning health, environment, and safety within the petroleum activities on the Norwegian Continental Shelf (NCS) issued in 2001 [1], the Petroleum Safety Authority Norway (PSA) focuses on risk-informed principles and safety barriers as important means to reduce the risk of accidents. This focus is also prevailing in international regulations as the Seveso II directive [2] and the Machinery directive [3], and in international standards [4-6]. No common definition of safety barriers has been found in the literature, even though different aspects of the concept have been discussed in the literature [7-18], required in legislations and standards, and applied in practice for several decades. Different terms with similar meanings (e.g., barrier, defence, protection layer, safety critical element, and safety function) have been used in various industries, sectors, and countries. The two theorems of communication developed by Kaplan [19]; (1) 50 % of the problems in the world result from people using the same words with different meanings, and (2) the other 50 % comes from people using different words with the same meaning, support the need for clarifying the terms in order to avoid misconceptions in communication about risk and safety barriers. Although PSA has developed requirements to safety barriers, they have not given a clear definition of the concept. Discussions have emerged on what is a safety barrier within the Norwegian offshore industry, and different views exist. A clarification of several terms as safety barrier, barrier function, barrier system, and barrier performance will make it easier for the Norwegian offshore industry to fulfil the requirements from PSA as regards safety barriers. Clear definitions will also make it easier for PSA to manage their regulations. This topic is also of interest due to the extended perspective on safety barriers that has evolved the later years as described by Hollnagel [10], who writes; “whereas the barriers used to defend a medieval castle mostly were of a physical nature, the modern principle of defence-in-depth combines different types of barriers – from protection against the release of radioactive materials to event reporting and safety policies”.
Thesis – Part I Main Report
4
In-depth investigations of major accidents, like the process accidents at Longford [20] and Piper Alpha [21], the loss of the space shuttles Challenger [22] and Colombia [23], the high-speed craft Sleipner accident [24], the railway accidents at Ladbroke Grove [25] and Åsta [26], and several major accidents in Norway the last 20 years [27], show that both technical, human, operational, as well as organisational factors influence the accident sequences. In spite of these findings, the main focus in quantitative risk analyses (QRA) is on technical safety systems and one of the weaknesses of current QRA is the “missing link” between the models applied in the analyses and human, operational, and organisational factors [28, 29]. This topic is addressed in several research projects [30-40]. However, different approaches have been applied in the various projects, and so far, no approach has been commonly applied for practical purposes. Traditional QRA of offshore oil and gas production platforms focus on consequence reducing barriers, and Kafka [41] states that the main interest is to estimate the consequences of the assumed initiating event, the harm to humans and environment, and to assess their frequencies. Normally, a system analysis of all the causes that may trigger such an initiating event will not be carried out. Further, Kafka [41] claims that the identification of the most effective safety measures to avoid initiating events is very limited. The new regulations from PSA have initiated several projects within the Norwegian oil and gas industry focusing on safety barriers and quantitative risk analysis, for example, a working group within the industry initiative Together for Safety [42] discussing the term safety barrier, a research project focusing on development of a method for barrier and operational risk analysis (the BORA project) [43], and projects initiated by PSA [44]. Based on the needs grown out of the problem areas discussed in this background section, the following problems are addressed as part of this thesis:
• What is meant by a safety barrier? • How can safety barriers be classified? • Which kinds of attributes are necessary in order to describe and analyse the
performance of safety barriers? • How are safety barriers treated in risk analysis and accident investigations? • How can we analyse the causal factors to the initiating event “Hydrocarbon
release” in existing QRA?
Thesis – Part I Main Report
5
• What types of safety barriers influence the hydrocarbon release frequency on offshore platforms?
• What kinds of risk influencing factors (RIFs) affect the performance of these safety barriers?
• How can we analyse the effect on the hydrocarbon release frequency of the safety barriers and the risk influence factors?
1.2 Objectives
The main objective of the PhD project has been to develop concepts and methods that can be used to define, illustrate, analyse, and improve safety barriers in the operational phase of offshore oil and gas production platforms. Based on this main objective, the following objectives are developed for this thesis;
• To provide definitions of the term safety barrier and related terms • To develop a framework for categorization of safety barriers • To identify, define, and describe attributes necessary to analyse the
performance of safety barriers • To develop a method for analysis of the hydrocarbon release frequency on
oil and gas platforms that can be used to analyse the effect of safety barriers introduced to prevent hydrocarbon releases
• To develop a framework for identification of risk influencing factors affecting the performance of these safety barriers
• To identify safety barriers introduced to prevent hydrocarbon releases on offshore oil and gas platforms
• To carry out a case study to test and verify the method.
1.3 Delimitations
The main focus of this thesis is the use of the barrier concept within industrial safety, and especially prevention of the realization of hazards that may lead to major accidents. Thus, occupational accidents have not been explicitly discussed. The work is limited to the accident type process accident (hydrocarbon releases, fire and explosion) that is one of the main contributors to the total risk of major
Thesis – Part I Main Report
6
accidents on oil and gas producing platforms. The work focuses on scenarios that may lead to hydrocarbon releases and safety barriers introduced to prevent such releases. Thus, consequence reducing barriers are not treated. Some results are also presented from a study of barriers preventing release of hydrocarbons during wireline operations. The aim of the work has been to ensure the safety during the operational phase of the life cycle of offshore oil and gas production platforms with special emphasis on operational safety barriers introduced to prevent hydrocarbon release. Consequently, discussions about barriers introduced to prevent latent failures from the design or construction phase are not covered in the thesis. Another delimitation is that the work concentrates on safety issues, implying that security issues as “intended actions” are not within the scope of the thesis.
1.4 Structure of the report
The present thesis is written for scientists, safety professionals, managers, and other people with knowledge about risk and risk analyses. In addition, some knowledge about the offshore oil and gas industry is beneficial. The thesis comprises two main parts; Part I Main report, and Part II Papers. Part I Main report comprises a brief presentation of the work, the main results, a discussion, and proposals for further research. The main report is a synthesis of the research papers and does not include all results or the detailed discussions of the results, but references are made to the research papers. The first chapter of the main report describes the background and the objectives of the thesis and presents some delimitations. Chapter two describes the research methodology and discusses the scientific framework for the thesis. The main results are presented in chapter three, while the results are discussed in chapter four. Part II consists of research papers already published in international journals or conferences and research papers accepted or submitted for publication in international journals:
Thesis – Part I Main Report
7
Paper 1 Sklet, S., Safety barriers; definition, classification and performance. Journal of Loss Prevention in the Process Industries (article in press, available online 20 January 2006). Paper 2 Sklet, S., Hydrocarbon releases on oil and gas production platforms; Release scenarios and safety barriers. Journal of Loss Prevention in the Process Industries (article in press, available online 18 January 2006). Paper 3 Aven, T., Sklet, S., and Vinnem, J.E., Barrier and operational risk analysis of hydrocarbon releases (BORA-Release); Part I Method description. Journal of Hazardous Materials (submitted for publication 2 December 2005). Paper 4 Sklet, S., Vinnem, J.E., and Aven, T., Barrier and operational risk analysis of hydrocarbon releases (BORA-Release); Part II Results from a case study. Journal of Hazardous Materials (submitted for publication 2 December 2005). Paper 5 Sklet, S., Comparison of some selected methods for accident investigation. Journal of Hazardous Materials (2004), 111, 1 – 3, 29-37. Paper 6 Sklet S., Steiro T., & Tjelta O., Qualitative Analysis of Human, Technical and Operational Barrier Elements during Well Interventions. ESREL 2005, Tri City, Poland. Paper 7 Botnevik, R., Berge, O., and Sklet, S., Standardised procedures for Work Permits and Safe Job Analysis on the Norwegian Continental Shelf. SPE Paper Number 86629, Society of Petroleum Engineers, 2004. Paper 8 Corneliussen, K., and Sklet, S., Challenges related to surveillance of safety functions. ESREL 2003, Maastricht. In addition, several papers not included in this thesis have been published during the PhD-study:
Thesis – Part I Main Report
8
Sklet, S., Aven, T., Hauge, S., & Vinnem, J.E., Incorporating human and organizational factors in risk analysis for offshore installations. ESREL 2005, Tri City, Poland. Sklet, S., Storulykker i Norge de siste 20 årene. Kap. 7 i Fra flis i fingeren til ragnarok. Tapir Akademisk Forlag, Trondheim, 2004. Hovden, J., Sklet, S. og Tinmannsvik, R.K., I etterpåklokskapens klarsyn: Gransking og læring av ulykker. Kap. 8 i Fra flis i fingeren til ragnarok. Tapir Akademisk Forlag, Trondheim, 2004. Sklet, S., and Hauge, S., Reflections on the Concept of safety Barriers. PSAM 7 - ESREL 2004, Berlin. Sklet, S., Onnettomuustutkinnan menetelmiä. TUKES-julkaisu 6/2004, Turvatekniikan Keskus, Helsinki. Sklet, S., Methods for accident investigation. ROSS (NTNU) 200208, Report (75 pages), Trondheim.
Thesis – Part I Main Report
9
2 Research approach and principles
2.1 Scientific approach
This thesis deals with analysis of risk in a socio-technical system like an offshore oil and gas production platform. The risk in this system is influenced by human, technical, and organizational risk influencing factors. Thus, I have chosen to be pragmatic with respect to scientific approach, and include elements from both natural science and social science dealing with human, technical, and organizational risk influencing factors in my research. The main type of research in this thesis is development of concepts and methods meant for practical applications. The purpose of the work has not been to develop new theoretical models, but rather to systematize and apply existing knowledge within new application areas. Some empirical work is carried out, primarily in the form of case studies in order to test the concepts and methods developed during the work.
2.2 Research principles
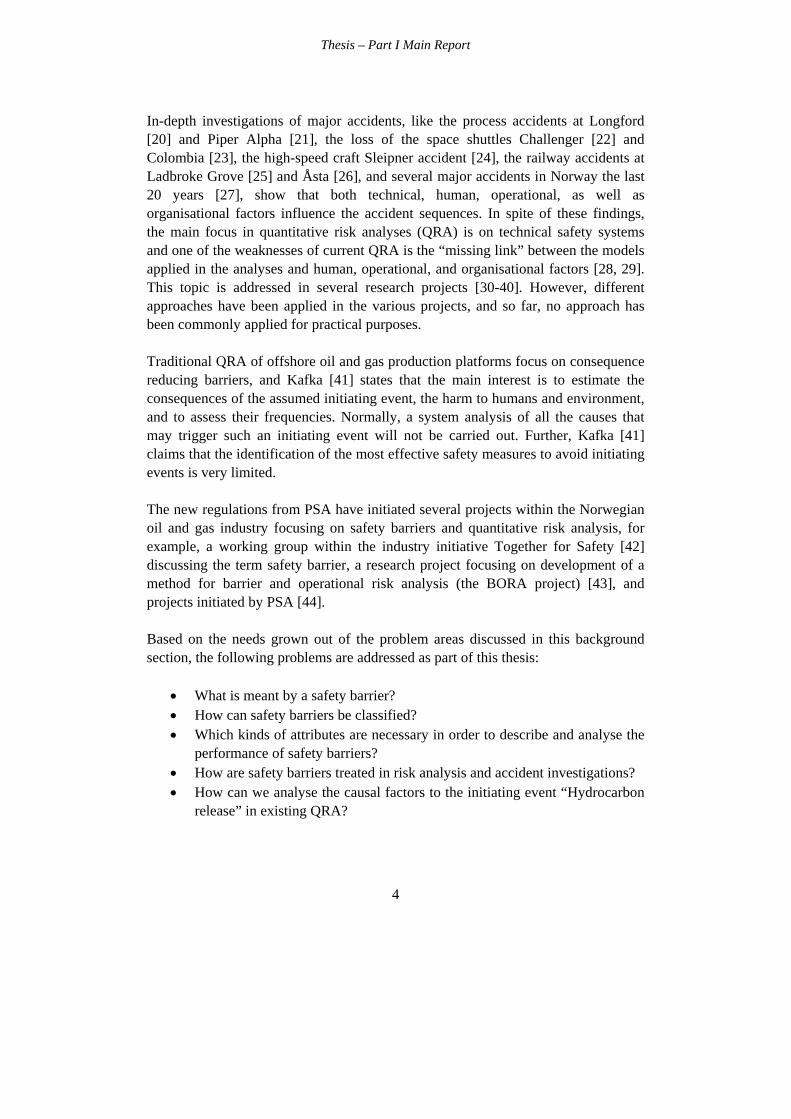
The research resulting in this thesis is not performed in a vacuum, but in cooperation with other researchers and people from the industry and the authorities. The elements of the research are illustrated in Figure 1.
Thesis – Part I Main Report
10
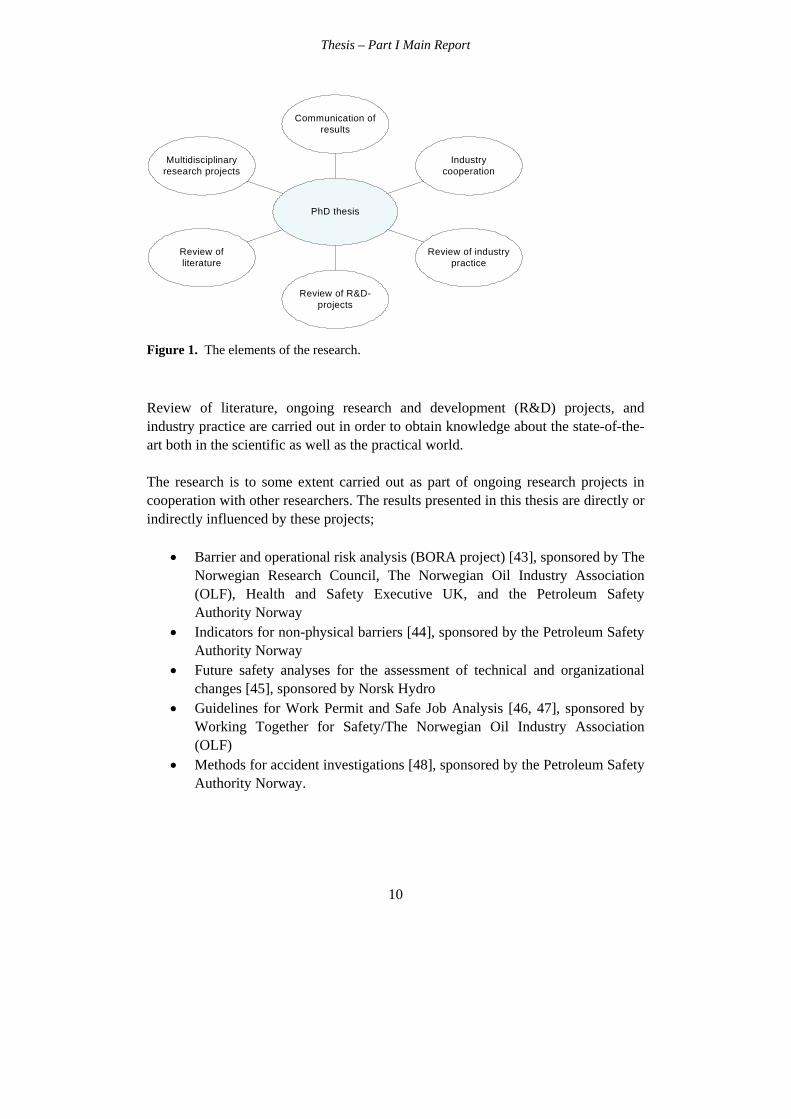
Figure 1. The elements of the research.
Review of literature, ongoing research and development (R&D) projects, and industry practice are carried out in order to obtain knowledge about the state-of-the-art both in the scientific as well as the practical world. The research is to some extent carried out as part of ongoing research projects in cooperation with other researchers. The results presented in this thesis are directly or indirectly influenced by these projects;
• Barrier and operational risk analysis (BORA project) [43], sponsored by The Norwegian Research Council, The Norwegian Oil Industry Association (OLF), Health and Safety Executive UK, and the Petroleum Safety Authority Norway
• Indicators for non-physical barriers [44], sponsored by the Petroleum Safety Authority Norway
• Future safety analyses for the assessment of technical and organizational changes [45], sponsored by Norsk Hydro
• Guidelines for Work Permit and Safe Job Analysis [46, 47], sponsored by Working Together for Safety/The Norwegian Oil Industry Association (OLF)
• Methods for accident investigations [48], sponsored by the Petroleum Safety Authority Norway.
Review of literature
Review of industry practice
Review of R&D-projects
Multidisciplinary research projects
Industry cooperation
PhD thesis
Communication of results
Thesis – Part I Main Report
11
Another important principle is the cooperation with personnel from the industry. This cooperation is ensured through involvement of industry personnel in the research projects and accomplishment of a case study as part of the BORA project. Finally, the results from the research are communicated to the academia and the industry at regular intervals. The results are communicated both orally at conferences, seminars, workshops, and project meeting, and written in papers, project memos, and reports. The purpose of the communication of the research results is two-sided; two spread the results, and to receive comments from the outside world. These principles have contributed to evaluation and quality assurance of the research at regular intervals since the input from the “outside world” has influenced the research work and thus influenced the results presented in this PhD thesis.
2.3 Concepts
Use of risk-informed principles necessitates an understanding of the word risk. Many definitions of the word exists in the literature, and several views exist, illustrated by the following history [19]; “One of the first initiatives from the Society for Risk Analysis was to establish a committee to define the word risk. The committee laboured for 4 years and than gave up, saying in its final report, that maybe it is better not to define risk and let each author define it in his own way, emphasizing that each should explain clearly what way that is”. A definition of risk adopted from Kaplan [49] is applied in this thesis. Kaplan states that the question “What is the risk?” is really three questions; “What can happen?”, “How likely is that to happen?”, and “What are the consequences?”. Risk may then be expressed as a (complete) set of triplets (Si, Li, Xi), where Si denotes scenario i, Li denotes the likelihood, and Xi the consequences. Hydrocarbon release is defined as gas or oil leaks (including condensate) from the process flow, well flow, or flexible risers with a release rate greater than 0.1 kg/s. Smaller leaks are called minor releases or diffuse discharges.

Thesis – Part I Main Report
13
3 Main results
The following subsections comprise a summary of the main results from the research. Detailed information about the results is presented in the research papers in part II of the thesis.
3.1 The concept of safety barriers
No common terminology of the concept of safety barriers exist neither in the literature nor in practice. Based on the synthesis of some common features of the term, the following definitions of the terms safety barrier, barrier function, and barrier system are proposed as basis for further discussion and analysis of safety barriers (see Paper 1 for more information).
Safety barriers are physical and/or non-physical means planned to prevent, control or mitigate undesired events or accidents.
The means may range from a single technical unit or human actions, to a complex socio-technical system. Planned implies that at least one of the purposes of the means is to reduce the risk. In line with ISO:13702 [6], prevention means reduction of the likelihood of a hazardous event, control means limiting the extent and/or duration of a hazardous event to prevent escalation, while mitigation means reduction of the effects of a hazardous event. Undesired events may, for example, be technical failures, human errors, external events, or a combination of these occurrences that may realize potential hazards, while accidents are undesired and unplanned events that lead to loss of human lives, personal injuries, environmental damage, and/or material damage.
A barrier function is a function planned to prevent, control, or mitigate undesired events or accidents.
Barrier functions describe the purpose of safety barriers or what the safety barriers shall do in order to prevent, control, or mitigate undesired events or accidents. If a barrier function is performed successfully, it should have a direct and significant effect on the occurrence and/or consequences of an undesired event or accident. A
Thesis – Part I Main Report
14
function that has at most an indirect effect is not classified as a barrier function, but as a risk influencing factor/function. A barrier function should preferably be defined by a verb and a noun, e.g., “close flow” and “stop engine”.
A barrier system is a system that has been designed and implemented to perform one or more barrier functions.
A barrier system describes how a barrier function is realized or executed. If the barrier system is functioning, the barrier function is performed. A barrier element is a component or a subsystem of a barrier system that by itself is not sufficient, to perform a barrier function. A barrier subsystem may comprise several redundant barrier elements. In this case, a specific barrier element does not need to be functioning for the system to perform the barrier function. This is the case for redundant gas detectors connected in a k-out-of-n configuration. The barrier system may consist of different types of system elements, e.g., physical and technical elements (hardware, software), operational activities executed by humans, or a combination thereof.
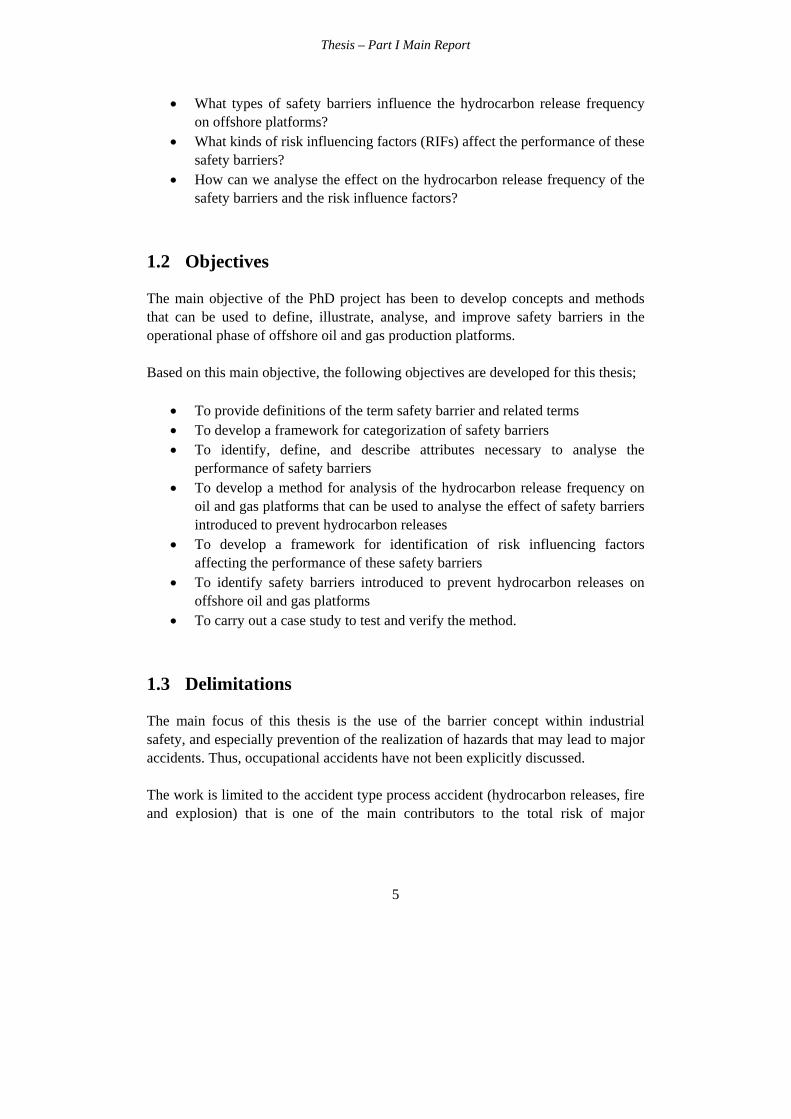
3.2 Classification of safety barriers
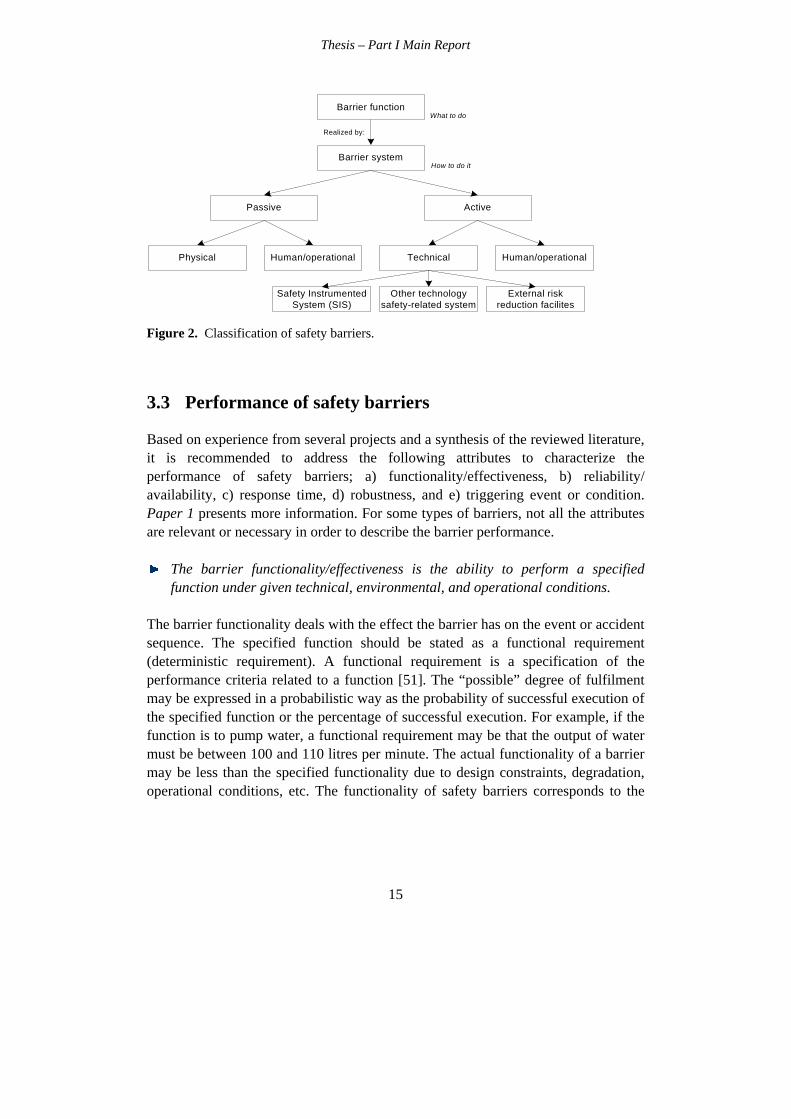
A recommended way to classify barrier systems is shown in Figure 2. However, note that active barrier systems often are based on a combination of technical and human/operational elements. Even though different words are applied, the classification in the fourth level in Figure 2 is similar to the classification suggested by Hale [50], and the classification of active, technical barriers is in accordance with IEC:61511 [5]. As regards the time aspect, some barrier systems are on-line (functioning continuously), while some are off-line (need to be activated). Further, some barriers are permanent, while some are temporary. Permanent barriers are implemented as an integrated part of the whole operational life cycle, while temporary barriers only are used in a specified time period, often during specific activities or conditions. A more detailed discussion of classification of safety barriers is presented in Paper 1.
Thesis – Part I Main Report
15
Figure 2. Classification of safety barriers.
3.3 Performance of safety barriers
Based on experience from several projects and a synthesis of the reviewed literature, it is recommended to address the following attributes to characterize the performance of safety barriers; a) functionality/effectiveness, b) reliability/ availability, c) response time, d) robustness, and e) triggering event or condition. Paper 1 presents more information. For some types of barriers, not all the attributes are relevant or necessary in order to describe the barrier performance.
The barrier functionality/effectiveness is the ability to perform a specified function under given technical, environmental, and operational conditions.
The barrier functionality deals with the effect the barrier has on the event or accident sequence. The specified function should be stated as a functional requirement (deterministic requirement). A functional requirement is a specification of the performance criteria related to a function [51]. The “possible” degree of fulfilment may be expressed in a probabilistic way as the probability of successful execution of the specified function or the percentage of successful execution. For example, if the function is to pump water, a functional requirement may be that the output of water must be between 100 and 110 litres per minute. The actual functionality of a barrier may be less than the specified functionality due to design constraints, degradation, operational conditions, etc. The functionality of safety barriers corresponds to the
Barrier function
Barrier system
ActivePassive
Human/operationalTechnicalPhysical Human/operational
Safety Instrumented System (SIS)
Other technology safety-related system
Realized by:
What to do
How to do it
External risk reduction facilites
Thesis – Part I Main Report
16
safety function requirements demanded by IEC:61511 and the effectiveness of safety barriers as described in the ARAMIS project [30].
The barrier reliability/availability is the ability to perform a function with an actual functionality and response time while needed, or on demand.
The barrier reliability/availability may be expressed as the probability of failure (on demand) to carry out a function. The reliability/availability of safety barriers corresponds to the safety integrity requirements (Safety Integrity Level (SIL)) demanded by IEC:61511 and the level of confidence as described in the ARAMIS project. Requirements to the reliability/availability may be expressed as a SIL-requirement.
The response time of a safety barrier is the time from a deviation occurs that should have activated a safety barrier, to the fulfilment of the specified barrier function.
The response time may be defined somewhat different for different types of barrier functions. This may be illustrated by the difference between an emergency shutdown system (ESD) and a deluge system. The response time for the ESD-system is the time required to close the ESD-valve such that the function stop flow is fulfilled, while the response time for a deluge system is the time to delivery of a specified amount of water (and not the time until the fire is extinguished).
Barrier robustness is the ability to resist given accident loads and function as specified during accident sequences.
This attribute is relevant for passive as well as active barrier systems, and it may be necessary to assess the robustness for several types of accident scenarios.
The triggering event or condition is the event or condition that triggers the activation of a barrier.
It is not itself part of a barrier, however, it is an important attribute in order to fully understand how a barrier may be activated. Implementation of safety barriers may also have some adverse effects like increased costs, need for maintenance, and introduction of new hazards. These adverse effects
Thesis – Part I Main Report
17
are not discussed any further in this thesis, but should be addressed as part of a total analysis of the barriers.
3.4 Hydrocarbon release scenarios
A representative set of hydrocarbon release scenarios is developed and described in Paper 2. Each release scenario is described by an initiating event (i.e., a deviation) reflecting “causal factors”, the barrier functions introduced to prevent the initiating event from developing into a release, and how the barrier functions are implemented in terms of barrier systems. The development of the set of release scenarios has generated new knowledge about causal factors of hydrocarbon releases and safety barriers introduced to prevent hydrocarbon releases. The release scenarios are divided into seven main groups where some of the groups are divided into sub-categories:
1. Release due to operational failure during normal production a. Release due mal-operation of valve(s) during manual operations. b. Release due to mal-operation of temporary hoses. c. Release due to lack of water in water locks in the drain system.
2. Release due to latent failure introduced during maintenance a. Release due to incorrect fitting of flanges or bolts during maintenance b. Release due to valve(s) in incorrect position after maintenance c. Release due to erroneous choice or installation of sealing device
3. Release during maintenance of hydrocarbon system (requiring disassembling) a. Release due to failure prior to or during disassembling of hydrocarbon
system b. Release due to break-down of the isolation system during maintenance
4. Release due to technical/physical failures a. Release due to degradation of valve sealing b. Release due to degradation of flange gasket c. Release due to loss of bolt tensioning d. Release due to degradation of welded pipes e. Release due to internal corrosion f. Release due to external corrosion g. Release due to erosion
5. Release due to process upsets
Thesis – Part I Main Report
18
a. Release due to overpressure b. Release due to overflow/overfilling
6. Release due to external events a. Falling objects b. Bumping/collision. However, these are analysed together in one
scenario. 7. Release due to design related failures
Design related failures are latent failures introduced during the design phase that cause release during normal production. This scenario is not treated any further in the thesis. Nevertheless, barriers preventing failures in the design process and barriers aimed to detect design related failures prior to start-up of production are very important in order to minimize the risk.
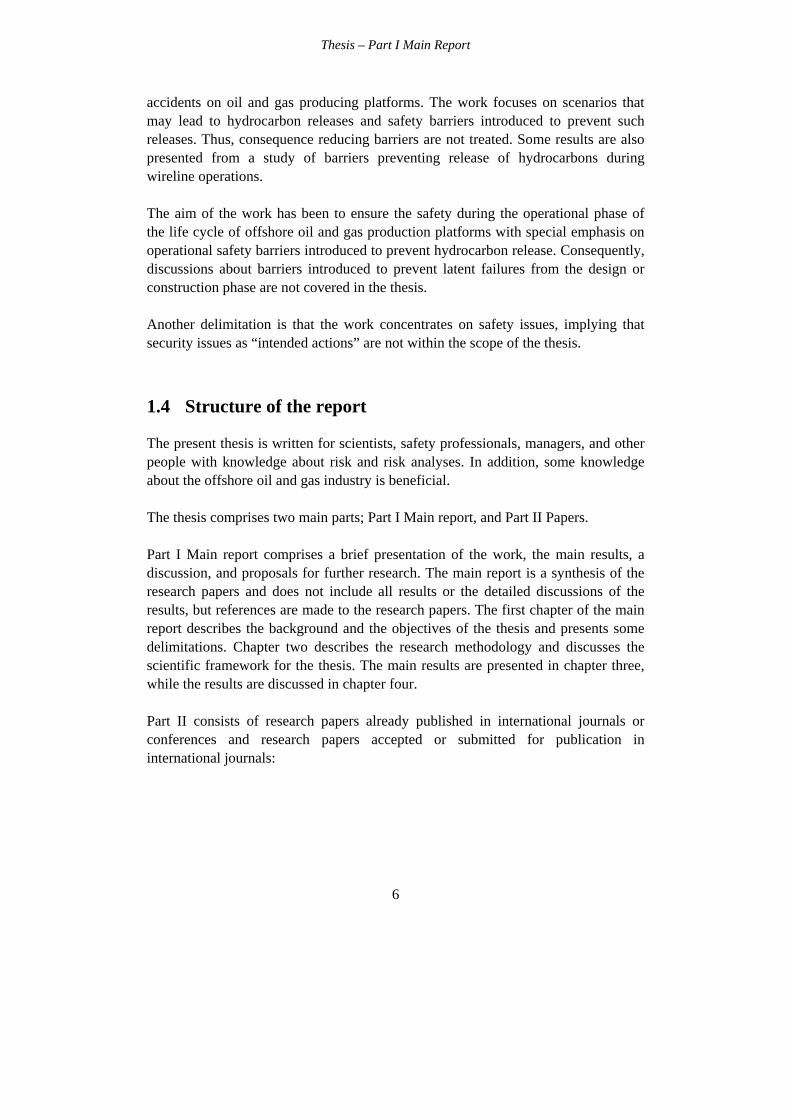
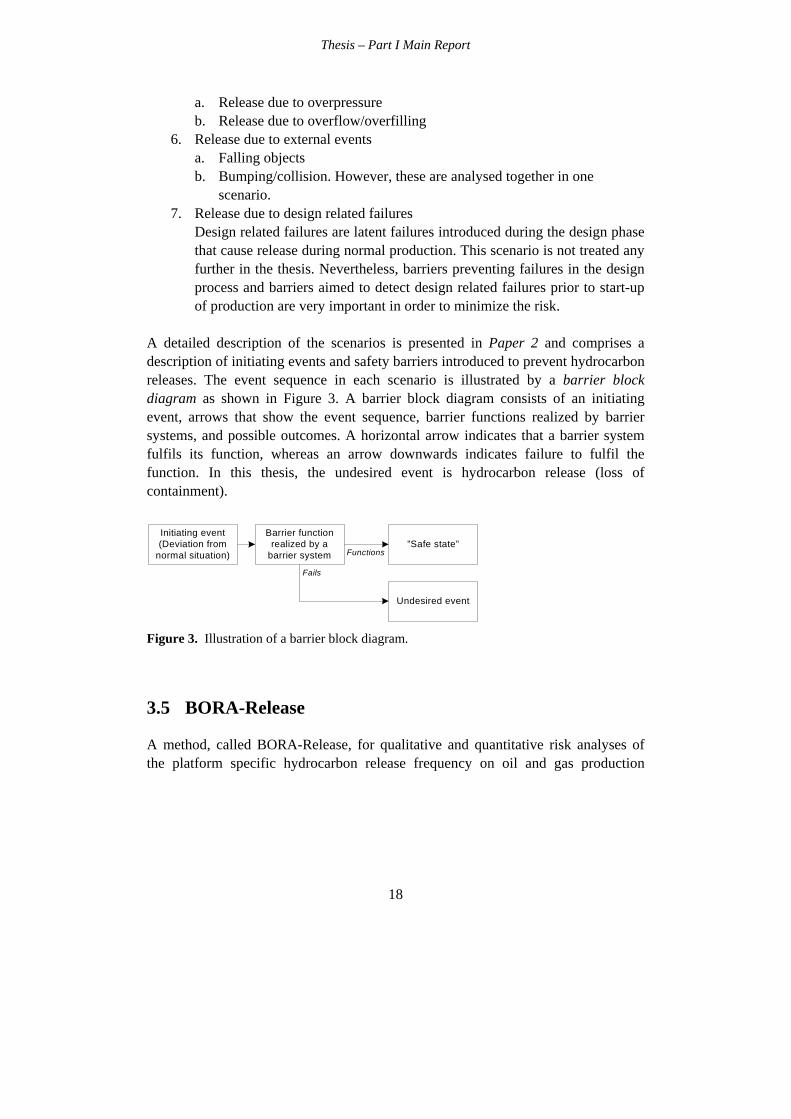
A detailed description of the scenarios is presented in Paper 2 and comprises a description of initiating events and safety barriers introduced to prevent hydrocarbon releases. The event sequence in each scenario is illustrated by a barrier block diagram as shown in Figure 3. A barrier block diagram consists of an initiating event, arrows that show the event sequence, barrier functions realized by barrier systems, and possible outcomes. A horizontal arrow indicates that a barrier system fulfils its function, whereas an arrow downwards indicates failure to fulfil the function. In this thesis, the undesired event is hydrocarbon release (loss of containment).
Figure 3. Illustration of a barrier block diagram.
3.5 BORA-Release
A method, called BORA-Release, for qualitative and quantitative risk analyses of the platform specific hydrocarbon release frequency on oil and gas production
Initiating event (Deviation from
normal situation)
Undesired event
”Safe state”Barrier function
realized by a barrier system Functions
Fails
Thesis – Part I Main Report
19
platforms is developed within the BORA project1. The method is described in Paper 3. BORA-Release makes it possible to analyse the effects on the release frequency of safety barriers introduced to prevent hydrocarbon releases, and analyse how platform specific conditions of technical, human, operational, and organisational risk influencing factors influence the barrier performance, and thus the risk. BORA-Release combines use of barrier block diagram/event trees, fault trees, and risk influence diagrams. BORA-Release comprises the following main steps:
1) Development of a basic risk model including hydrocarbon release scenarios and safety barriers (see Paper 2 for a description of the scenarios)
2) Modelling the performance of safety barriers 3) Assignment of generic input data and risk quantification based on these data 4) Development of risk influence diagrams 5) Scoring of risk influencing factors (RIFs) 6) Weighting of risk influencing factors 7) Adjustment of generic input data 8) Recalculation of the risk in order to determine the platform specific risk
Each step in BORA-Release is described in detail in Paper 3.
3.6 Results from the case study
BORA-Release was applied in a case study on a specific platform in the North Sea. The objectives of the case study were; 1) to determine the platform specific hydrocarbon release frequencies for selected systems and activities, and 2) to assess whether or not BORA-Release is suitable for analysing the effects that risk reduction measures and other changes have on the release frequencies. Three release scenarios were studied in detail;
1 The aim of the BORA project [43] is to perform a detailed and quantitative modeling of
barrier performance including barriers to prevent the occurrence of initiating events as well as barriers to reduce the consequences.
Thesis – Part I Main Report
20
A. Release due to valve(s) in wrong position after maintenance (flowline inspection)
B. Release due to incorrect fitting of flanges or bolts during maintenance (flowline inspection)
C. Release due to internal corrosion The analyses of scenario A and B were carried out strictly according to the method description, while the analysis of scenario C differed from the method description. Several workshops with operational personnel from the platform, safety specialists, and corrosion specialists from the oil company were arranged as part of the case study. Detailed results are presented in Paper 4. An important question regarding the quantitative results is whether or not the calculated release frequencies are trustworthy. The analysis is based on a number of assumptions and simplifications relating to the basic risk model, the generic input data, the risk influence diagrams, the scoring of RIFs, the weighting of RIFs, or the adjustment of the input data. The quantitative results in the case study for scenario A and B based on generic data were assessed to be reasonable compared to release statistics. This view was supported by the comments from the personnel from the actual oil company. The confidence in the results based on the revised input data was not as good due to use of data from a project called Risk Level on the Norwegian Continental Shelf (RNNS) [52] for scoring of RIFs. Since the scoring was based on few and generic questions not originally meant to be used as basis for RIF-scoring, the validity2 of the scoring was assessed to be low. The main reason for using RNNS-data to assess the status of RIFs in the case study was the demand for using existing data in order to minimize the use of resources from the industry representatives in the steering group for the BORA project. Since the revised release frequency to a high degree was influenced by the results from the RNNS-survey, the approach chosen for scoring of RIFs should be discussed in the further work. The case study demonstrated that BORA-Release may be used to analyse the effect on the hydrocarbon release frequency of safety barriers, and to study the effect on the barrier performance of platform specific conditions of technical, organizational, operational, and human risk influencing factors.
2 Validity refers to whether or not it measures what it is supposed to measure [53].
Thesis – Part I Main Report
21
3.7 Safety barriers and methods for accident investigation
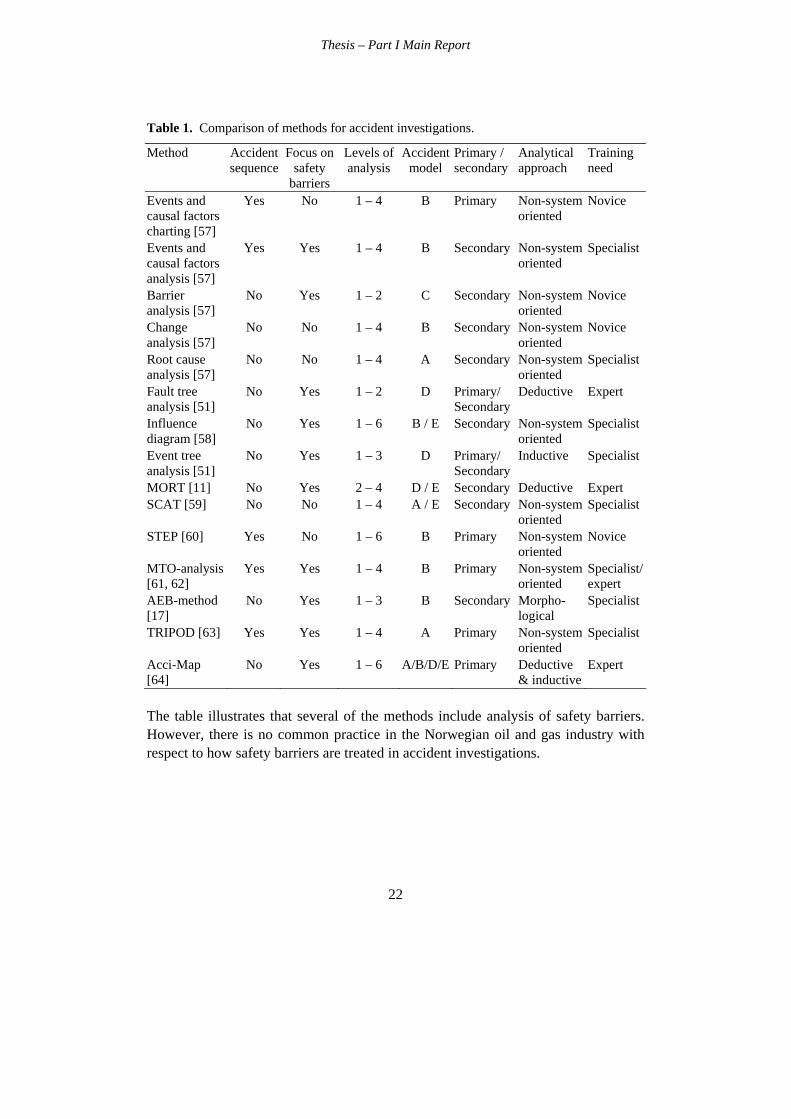
So far, the main focus has been on safety barriers in proactive risk analysis. However, analysis of the performance of safety barriers is also an element in accident investigations. Thus, a selection of methods for accident investigation is compared according to a set of characteristics. A summary of the comparison is presented in Table 1 (see Paper 5 for detailed description). The table comprises the following information. Column one contains the names of the methods. Whether or not the methods give a graphical description of the event sequence is assessed in column two. Whether or not the methods focus on safety barriers is assessed in the third column. The level of scope of the different analysis methods is assessed in column four. The levels are classified according to the socio-technical system involved in the control of safety (or hazardous processes) described by Rasmussen [54];
1. The work and technological system 2. The staff level 3. The management level 4. The company level 5. The regulators and associations level 6. The Government level
What kind of accident models that have influenced the method is assessed in column five. The following accident models are used (e.g., see [55, 56] for description of accident models);
A Causal-sequence model B Process model C Energy model D Logical tree model E SHE-management models
Whether the different methods are inductive, deductive, morphological or non-system-oriented is assessed in column six. In the next column, the different investigation methods are categorized as primary or secondary methods. Primary methods are stand-alone techniques, while secondary methods provide special input as supplement to other methods. The last column assesses the need for education and training in order to use the methods. The terms "Expert", "Specialist", and "Novice" are used.
Thesis – Part I Main Report
22
Table 1. Comparison of methods for accident investigations.
Method Accident sequence
Focus on safety
barriers
Levels of analysis
Accident model
Primary / secondary
Analytical approach
Training need
Events and causal factors charting [57]
Yes No 1 – 4 B Primary Non-system oriented
Novice
Events and causal factors analysis [57]
Yes Yes 1 – 4 B Secondary Non-system oriented
Specialist
Barrier analysis [57]
No Yes 1 – 2 C Secondary Non-system oriented
Novice
Change analysis [57]
No No 1 – 4 B Secondary Non-system oriented
Novice
Root cause analysis [57]
No No 1 – 4 A Secondary Non-system oriented
Specialist
Fault tree analysis [51]
No Yes 1 – 2 D Primary/ Secondary
Deductive Expert
Influence diagram [58]
No Yes 1 – 6 B / E Secondary Non-system oriented
Specialist
Event tree analysis [51]
No Yes 1 – 3 D Primary/ Secondary
Inductive Specialist
MORT [11] No Yes 2 – 4 D / E Secondary Deductive Expert SCAT [59] No No 1 – 4 A / E Secondary Non-system
oriented Specialist
STEP [60] Yes No 1 – 6 B Primary Non-system oriented
Novice
MTO-analysis [61, 62]
Yes Yes 1 – 4 B Primary Non-system oriented
Specialist/ expert
AEB-method [17]
No Yes 1 – 3 B Secondary Morpho-logical
Specialist
TRIPOD [63] Yes Yes 1 – 4 A Primary Non-system oriented
Specialist
Acci-Map [64]
No Yes 1 – 6 A/B/D/E Primary Deductive & inductive
Expert
The table illustrates that several of the methods include analysis of safety barriers. However, there is no common practice in the Norwegian oil and gas industry with respect to how safety barriers are treated in accident investigations.
Thesis – Part I Main Report
23
3.8 Standardized procedures for Work Permits
A result with more practical usefulness than academic usefulness, is the attendance in a project group within Together for Safety that developed standardised procedures for work permits (WP) and safe job analysis (SJA). The procedures are implemented on all oil and gas production installations in the Norwegian Continental Shelf. The WP system and the use of SJA represent essential operational safety barriers required in the daily management of work and safety on oil and gas installations. A process of dialogue and participation, involving the offshore community established the foundation for an industry wide change to improve safety and working conditions. A brief description of the standardized procedures is presented in Paper 6. The procedures are published as OLF Guidelines [46, 47]. An E-learning course3 has been developed by Mintra in order to get everyone actively involved using the new models and new forms. More than 20.000 people have been through the course.
3 See www.samarbeidforsikkerhet.no for more information.

Thesis – Part I Main Report
25
4 Conclusions, discussion, and further research
The main contributions of this thesis are;
• Clarification of the term safety barrier with respect to definitions, classification, and relevant attributes for analysis of barrier performance.
• Development and discussion of a representative set of hydrocarbon release scenarios where each scenario includes an initiating event, barrier functions introduced to prevent hydrocarbon releases, and barrier systems realizing the barrier functions.
• Development and testing of a new method, BORA-Release, for qualitative and quantitative risk analysis of hydrocarbon releases.
The clarification of terms is helpful for the Norwegian offshore industry in order to fulfil the requirements to safety barriers from the Petroleum Safety Authority Norway [1]. The development of the hydrocarbon release scenarios has generated new knowledge about causal factors of hydrocarbon releases and safety barriers introduced to prevent the releases. Collectively, the scenarios cover the most frequent initiating events and give an overview of the most important safety barriers introduced to prevent hydrocarbon releases. BORA-Release may be applied to analyse the platform specific hydrocarbon release frequency for selected systems on a specific platform. The method may be used to analyse the effects on the release frequency of safety barriers introduced to prevent hydrocarbon releases, and to study the effects on the barrier performance of platform specific conditions of technical, human, operational, and organisational risk influencing factors. Roughly assessed, the main objective of the PhD project; ”to develop concepts and methods that can be used to define, illustrate, analyse, and improve safety barriers in the operational phase of offshore oil and gas production platforms”, is fulfilled. However, there is still need for further research concerning several of the detailed objectives developed for the thesis, and each of these detailed objectives is discussed in the following.
Thesis – Part I Main Report
26
To provide definitions of the term safety barrier and related terms Definitions of the terms safety barrier, barrier function, and barrier system are provided in Paper 1. These definitions may be useful as basis for discussion and analysis of safety barriers. If the definitions are adopted by the industry, the result will be a common language and understanding of safety barriers. Today, the term safety barrier seems to be used in different ways by accident investigators, risk analysts, managers, and operational personnel. One of the main challenges in the future is to contribute to adaptation of the proposed terminology by different types of personnel.
To develop a framework for categorization of safety barriers A structure for classification of safety barriers is presented in Paper 1. Barrier systems are classified as passive or active. Passive barriers may be physical or human/operational, while active barriers may be technical or human/operational. In addition, active barriers may be based on a combination of technical and human/operational elements. However, safety barriers may be classified in several other ways. The proposed structure may not always be best suitable for the specific purpose of the classification. Thus, other lines of classification may be as useful in specific cases. Further work should be carried out to establish a common framework for assessment of the performance of the different classes of safety barriers in the proposed structure. One main challenge is to develop a framework for assessment of the performance of human/operational barriers.
To identify, define, and describe attributes necessary to analyse the performance of safety barriers
The definitions of some main attributes necessary for assessment of the performance of safety barriers presented in Paper 1 will be useful in both risk analyses and accident investigations. Use of a common set of definitions and common understanding of safety barriers makes it easier to transfer experience from accident investigations to risk analyses, and vice versa. One main challenge is to provide for and achieve use of the proposed attributes in risk analysis as well as accident investigations carried out by the industry.
Thesis – Part I Main Report
27
To develop a method for analysis of the hydrocarbon release frequency on oil and gas platforms that can be used to analyse the effect of safety barriers introduced to prevent hydrocarbon releases
BORA-Release (see Paper 3) is a method that fulfils this objective. BORA-Release is a new method for qualitative and quantitative risk analysis of the hydrocarbon release frequency on oil and gas platforms. BORA-Release combines use of barrier block diagrams/event trees, fault trees, and risk influence diagrams in order to analyse the risk of hydrocarbon releases from a set of hydrocarbon release scenarios. BORA-Release may improve today’s quantitative risk analyses on two weak points; i) analysis of causal factors of the initiating event hydrocarbon release (loss of containment), and ii) analysis of the effect on the risk of human and organisational factors. However, the method should be further tested in practical analyses. So far, BORA-Release has been applied in one case study for analysis of the platform specific hydrocarbon release frequencies for three hydrocarbon release scenarios on a specific platform. The method was used to analyse the effect on the release frequency of safety barriers introduced to prevent hydrocarbon releases, and to study the effect on the barrier performance of platform specific conditions of technical, human, operational, and organisational risk influencing factors. Additional research with respect to further development of BORA-Release should focus on the following main areas:
• To develop a suitable method for assignment of scores of the risk influencing factors affecting the barrier performance.
• To evaluate whether there is need for collection of new types of data to be used as input in the quantitative analyses since relevant offshore data are lacking for some barriers (particularly human reliability data).
• To link existing reliability analyses of technical safety systems (e.g., the process shutdown system) to the risk model (release scenarios) developed in BORA-Release.
• To apply the principles within BORA-Release to analyse the effect on the total risk of both safety barriers introduced to prevent hydrocarbon releases and consequence reducing barriers. A total risk analysis by use of the principles within BORA-Release makes it possible to analyse the effect of dependencies among different safety barriers.
Thesis – Part I Main Report
28
To develop a framework for identification of risk influencing factors (RIFs)
affecting the performance of these safety barriers A framework for identification of RIFs has been developed as part of BORA-Release (see Paper 3 page 8 for further details). The framework consists of five main groups of RIFs; characteristics of the personnel, characteristics of the tasks, characteristics of the technical system, administrative controls, and organisational factors/operational philosophy. In addition, a detailed taxonomy of RIFs is developed. Experience from the case study indicates that the main groups in the framework are adequate for identification of RIFs. However, the taxonomy is not sufficiently tested in practice, and application of the framework in analyses of more scenarios should be carried out in order to assess whether some of the RIFs may be removed, or whether it is necessary to add some new RIFs to the detailed taxonomy.
To identify safety barriers introduced to prevent hydrocarbon releases on offshore oil and gas platforms
A set of hydrocarbon release scenarios is developed and described in terms of an initiating event (i.e., a “deviation”) reflecting causal factors, barrier functions introduced to prevent the initiating events from developing into a release, and how the barrier functions are realized in terms of barrier systems (see Paper 2). Both passive physical, active technical, and active human/operational safety barriers are included in the release scenarios. Additional research should be carried out to investigate hydrocarbon releases and study the effect of the identified safety barriers on the event sequences. This research should also identify the risk influencing factors that affected the performance of the safety barriers and assess the importance of these risk influencing factors. Analysis of safety barriers in investigations of hydrocarbon releases may be input to revision of the hydrocarbon release scenarios described in Paper 2 or development of new, additional scenarios. Focus on safety barriers in accident investigations may fulfil the recommendation from Kletz [65] about avoiding the word cause in accident investigations and rather talk about what might have prevented the accident.
Thesis – Part I Main Report
29
To carry out a case study to test and verify the method. As mentioned above, BORA-Release is applied in a case study where three selected hydrocarbon release scenarios are analysed in detail. The results from the case study are presented in Paper 4. The case study provided useful input to the development of BORA-Release and demonstrated that BORA-Release may be used to analyse the effect on the release frequency of safety barriers introduced to prevent hydrocarbon releases, and to study the effect on the barrier performance of technical, human, operational, and organizational risk influencing factors. In addition, parts of the method have been applied in a study of hydrocarbon release scenarios during well interventions. The results from this study are presented in Paper 6. Further research should be carried out to apply BORA-Release to analyse the complete set of hydrocarbon release scenarios presented in Paper 2 in order to establish a total model for the risk of hydrocarbon releases on oil and gas production platforms. The total risk model may constitute the basis for analyses of; i) the importance of the different scenarios with respect to the total release frequency, ii) the effect on the release frequency of the safety barriers introduced to prevent hydrocarbon releases, and iii) the effect on the barrier performance of platform specific conditions of technical, human, operational, and organisational risk influencing factors. Another topic that should be addressed in future research is testing and surveillance of different categories of safety barriers. This topic is addressed in Paper 8. Existing strategies for testing and surveillance of safety systems focus primarily on physical and technical safety barriers. Additional research is needed in order to develop adequate strategies for testing and surveillance of the performance of human/ operational barriers. The main focus of this thesis is safety barriers introduced to prevent hydrocarbon releases on offshore oil and gas production platforms. Thus, the results are primarily useful for the oil and gas industry in their effort to control and reduce the risk of hydrocarbon releases. The Norwegian oil and gas industry can use the results in their work to fulfil the requirements to safety barriers and risk analysis from the Petroleum Safety Authority. However, the concepts and methods may also be

Thesis – Part I Main Report
30
applied in other industries (e.g., the process industry) and application areas (e.g., the transport sector) in their effort to reduce the risk.
Thesis – Part I Main Report
31
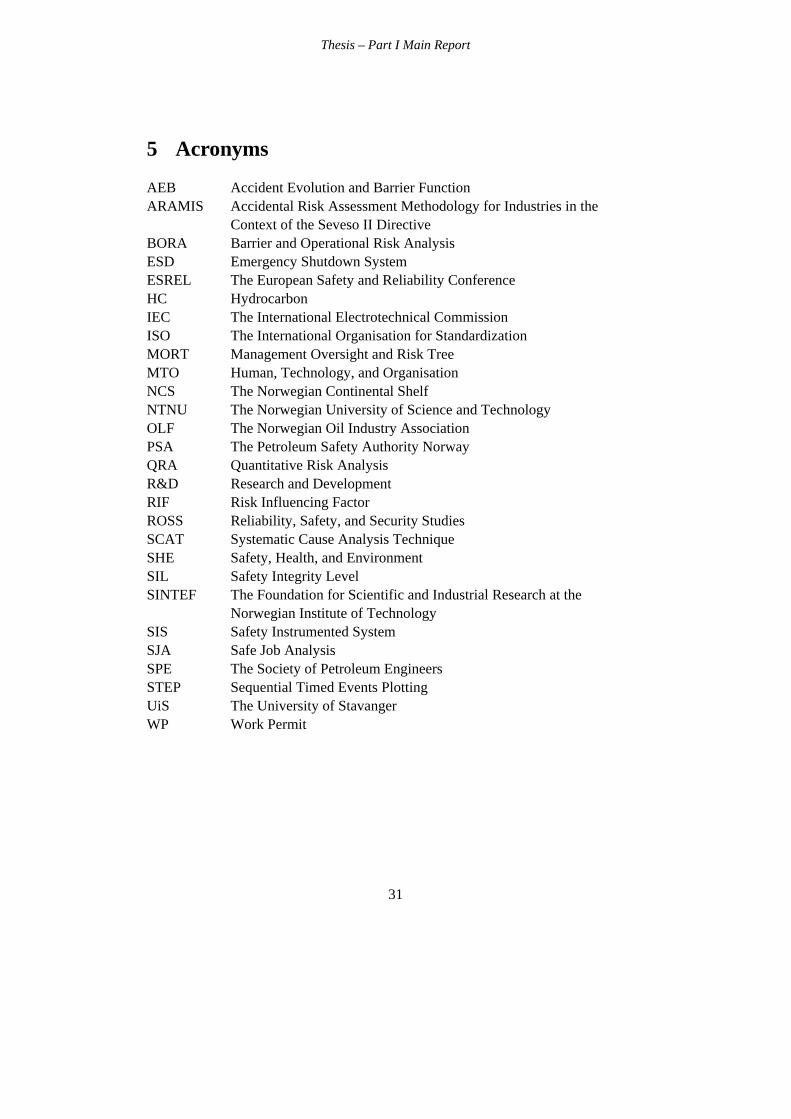
5 Acronyms
AEB Accident Evolution and Barrier Function ARAMIS Accidental Risk Assessment Methodology for Industries in the
Context of the Seveso II Directive BORA Barrier and Operational Risk Analysis ESD Emergency Shutdown System ESREL The European Safety and Reliability Conference HC Hydrocarbon IEC The International Electrotechnical Commission ISO The International Organisation for Standardization MORT Management Oversight and Risk Tree MTO Human, Technology, and Organisation NCS The Norwegian Continental Shelf NTNU The Norwegian University of Science and Technology OLF The Norwegian Oil Industry Association PSA The Petroleum Safety Authority Norway QRA Quantitative Risk Analysis R&D Research and Development RIF Risk Influencing Factor ROSS Reliability, Safety, and Security Studies SCAT Systematic Cause Analysis Technique SHE Safety, Health, and Environment SIL Safety Integrity Level SINTEF The Foundation for Scientific and Industrial Research at the
Norwegian Institute of Technology SIS Safety Instrumented System SJA Safe Job Analysis SPE The Society of Petroleum Engineers STEP Sequential Timed Events Plotting UiS The University of Stavanger WP Work Permit

Thesis – Part I Main Report
33
6 References
[1] PSA, Regulations relating to management in the petroleum activities (The Management Regulations). 3 September 2001, Petroleum Safety Authority Norway, Stavanger, 2001.
[2] EC, Council Directive 96/82/EC of 9 December 1996 on the control of major-accident hazards involving dangerous substances (Seveso II-directive), 1996.
[3] EC, Directive 98/37/EC of the European Parliament and of the Council of 22 June 1998 on the approximation of the laws of the Member States relating to machinery as amended by Directive 98/79/EC The Machinery Directive, 1998.
[4] IEC:61508, Part 1 - 7 Functional safety of electrical/electronic/programmable electronic safety-related systems, International Electrotechnical Commission, Geneva, 1998.
[5] IEC:61511, Functional safety - Safety instrumented systems for the process industry sector, International Electrotechnical Commission, Geneva, 2002.
[6] ISO:13702, Petroleum and natural gas industries - Control and mitigation of fires and explosions on offshore production installations - Requirements and guidelines, International Organization for Standardization, Geneva, 1999.
[7] CCPS, Layer of protection analysis simplified process risk assessment, Center for Chemical Process Safety of the American Institute of Chemical Engineers, New York, 2001.
[8] Duijm, N. J., Andersen, H. B., Hale, A., Goossens, L. and Hourtolou, D., Evaluating and Managing Safety Barriers in Major Hazard Plants, PSAM 7 - ESREL'04, Berlin, Germany, 2004.
[9] Harms-Ringdahl, L., Assessing safety functions - results from a case study at an industrial workplace, Safety Science. 41, 8 (2003) 701-720.
[10] Hollnagel, E., Barrier and Accident Prevention, Ashgate, Hampshire, England, 2004.
[11] Johnson, W. G., MORT safety assurance systems, Marcel Dekker, New York, 1980.
[12] Rosness, R., Ten thumbs and zero accidents? : About fault tolerance and accidents (in Norwegian), Institute for Energy Technology, Kjeller, 2005.
[13] Kecklund, L. J., Edland, A., Wedin, P. and Svenson, O., Safety barrier function analysis in a process industry: A nuclear power application, International Journal of Industrial Ergonomics. 17, 3 (1996) 275-284.
[14] Goossens, L. and Hourtolou, D., What is a barrier?, ARAMIS-working document, 2003.
[15] Sklet, S. and Hauge, S., Reflections on the Concept of Safety Barriers, PSAM7 - ESREL 2004, Berlin, 2004.
Thesis – Part I Main Report
34
[16] Neogy, P., Hanson, A. L., Davis, P. R. and Fenstermacher, T. E., Hazard and Barrier Analysis Guidance Document, Rev. 0, US Department of Energy (DoE), EH-33 Office of Operating Experience Analysis and Feedback, 1996.
[17] Svenson, O., The Accident Evolution and Barrier Function (AEB) Model Applied to Incident Analysis in the Processing Industries, Risk Analysis. 11, 3 (1991) 499-507.
[18] Reason, J., Managing the risks of organizational accidents, Ashgate, Aldershot, 1997.
[19] Kaplan, S., The Words or Risk Analysis, Risk Analysis. 17, 4 (1997) 407-417. [20] Hopkins, A., Lessons from Longford: the Esso gas plant explosion, CCH
Australia Ltd, Sydney, 2000. [21] Cullen, W. D., The public inquiry into the Piper Alpha disaster, Hmso,
London, 1990. [22] Vaughan, D., The Challenger launch decision : risky technology, culture, and
deviance at NASA, University of Chicago Press, Chicago, 1996. [23] CAIB, The Colombia Accident Investigation Board Report - Volume 1,
http://www.caib.us/, 2003. [24] NOU-2000:31, Hurtigbåten MS Sleipners forlis 26. november 1999, Justis- og
politidepartementet, Oslo, Norge, 2000. [25] Cullen, W. D., The Ladbroke Grove Rail Inquiry: Report, Part 1, HSE Books,
United Kingdom, 2001. [26] NOU, Åstaulykken, 4. januar 2000., Justis- og politidepartementet, Oslo,
Norge, 2000. [27] Sklet, S., Storulykker i Norge de siste 20 årene, In Lydersen, S. (eds), Fra flis i
fingeren til ragnarok, Tapir Akademisk Forlag, Trondheim, 2004. [28] Øien, K., A Focused Literature Review of Organizational Factors' Effect on
Risk. Paper II in the Doctoral thesis Risk Control of Offshore Installations, NTNU, Trondheim, Norway, 2001.
[29] Vinnem, J. E., Aven, T., Hundseid, H., Vassmyr, K. A., Vollen, F. and Øien, K., Risk assessments for offshore installations in the operational phase, ESREL 2003, Maastricht, The Netherlands, 2003.
[30] Andersen, H., Casal, J., Dandrieux, A., Debray, B., De Dianous, V., Duijm, N. J., Delvosalle, C., Fievez, C., Goossens, L., Gowland, R. T., Hale, A. J., Hourtolou, D., Mazzarotta, B., Pipart, A., Planas, E., Prats, F., Salvi, O. and Tixier, J., ARAMIS - User Guide, EC Contract number EVG1-CT-2001-00036, 2004.
[31] Bellamy, L. J., Papazoglou, I. A., Hale, A. R., Aneziris, O. N., Ale, B. J. M., Morris, M. I. and Oh, J. I. H., I-RISK - Development of an Integrated Technical and Management Risk Control and Monitoring Methodology for Managing and Quantifying On-Site and Off-Site Risks. Main Report. Contract No: ENVA-CT96-0243, 1999.
Thesis – Part I Main Report
35
[32] Davoudian, K., Wu, J.-S. and Apostolakis, G. E., Incorporating organisational factors into risk assessment through the analysis of work processes, Reliability Engineering and System Safety. 45 (1994) 85-105.
[33] Davoudian, K., Wu, J.-S. and Apostolakis, G. E., The work process analysis model (WPAM-II), Reliability Engineering and System Safety. 45 (1994) 107 - 125.
[34] Embrey, D. E., Incorporating management and organisational factors into probabilistic safety assessment, Reliability Engineering and System Safety. 38, 1-2 (1992) 199 - 208.
[35] Modarres, M., Mosleh, A. and Wreathall, J. A., Framework for assessing influence of organisation on plant safety, Reliability Engineering & System Safety. 45 (1994) 157 - 171.
[36] Murphy, D. M. and Paté-Cornell, E. M., The SAM Framework: Modeling the Effects of Management Factors on Human Behavior in Risk Analysis, Risk Analysis. 16, 4 (1996).
[37] Øien, K. and Sklet, S., Organisational risk indicators Pilot study Statfjord A (In Norwegian), SINTEF-report STF38 A00421, SINTEF, Trondheim, Norway, 2000.
[38] Pitblado, R. M., Williams, J. C. and Slater, D. H., Quantitative Assessment of Process Safety Programs, Plant/Operations Progress. 9, 3 (1990).
[39] Mosleh, A. and Goldfeiz, E. B., An Approach for Assessing the Impact of Organisational Factors on Risk, Technical research report, CTRS, A. James Clark School of Engineering, University of Maryland at College Park, 1996.
[40] Øien, K., A framework for the establishment of organizational risk indicators, Reliability Engineering & System Safety. 74, 2 (2001) 147-167.
[41] Kafka, P., The process of safety management and decision making, ESREL 2005, Tri City, Poland, 2005.
[42] SfS, Barriers - out of the fog, towards increased safety (in Norwegian - Barrierer - ut av tåkehavet, mot bedre sikkerhet), Together for Safety, OLF., Stavanger, Norway, 2004.
[43] Vinnem, J. E., Aven, T., Hauge, S., Seljelid, J. and Veire, G., Integrated Barrier Analysis in Operational Risk Assessment in Offshore Petroleum Operations, PSAM7 - ESREL'04, Berlin, 2004.
[44] Sklet, S. and Steiro, T., Lekkasje i forbindelse med kabeloperasjoner; Tekniske og operasjonelle forholds betydning for lekkasjer med storulykkespotensiale, STF50 A05177, SINTEF, Trondheim, 2005.
[45] Øien, K., Hauge, S., Sklet, S. and Monsen, J., Barrier Change Analysis Method, PSAM 7 / ESREL '04, Berlin, 2004.
[46] OLF, OLF Recommended Guidelines for Common Model for Work Permits (WP), No.: 088, www.samarbeidforsikkerhet.no, 2003.
[47] OLF, OLF Recommended Guidelines for Common Model for Safe Job Analysis (SJA), No. 090, www.samarbeidforsikkerhet.no, 2003.
Thesis – Part I Main Report
36
[48] Tinmannsvik, R. K., Sklet, S. and Jersin, E., Methods for accident investigations; A survey (In Norwegian), STF38 A04422, SINTEF, Dept. of Safety and Reliability, Trondheim, 2004.
[49] Kaplan, S., Risk Assessment and Risk Management - Basic Concepts and Terminology, In Knief, R. A. (eds), Risk Management - Expanding Horizons in Nuclear Power and Other Industries, Hemisphere Publishing Corporation, USA, 1991.
[50] Hale, A., Note on barriers and delivery systems, PRISM conference, Athens, 2003.
[51] Rausand, M. and Høyland, A., System reliability theory: models, statistical methods, and applications, Wiley-Interscience, Hoboken, N.J., 2004.
[52] PSA, Trends in risk levels on the Norwegian Continental Shelf Main report Phase 4 2003 (In Norwegian; Utvikling i risikonivå norsk sokkel Hovedrapport Fase 4 2003), The Petroleum Safety Authority, Stavanger, 2004.
[53] statistics, Britannica Student Encyclopedia, Encyclopædia Britannica Online. 10. nov. 2005 <http://search.eb.com/ebi/article-208648>, 2005.
[54] Rasmussen, J., Risk management in a dynamic society: a modelling problem, Safety Science. 27, 2 - 3 (1997) 183 - 213.
[55] Kjellén, U., Prevention of accidents through experience feedback, Taylor & Francis, London, 2000.
[56] Hovden, J., Sklet, S. and Tinmannsvik, R. K., I etterpåklokskapens klarsyn: Gransking og læring av ulykker., In Lydersen, S. (eds), Fra flis i fingeren til ragnarok., Tapir Akademisk Forlag, Trondheim, 2004.
[57] DoE, Conducting Accident Investigations DOE Workbook, Revision 2, U.S. Department of Energy, Washington D.C, 1999.
[58] Paté-Cornell, E. M., Learning from the Piper Alpha accident: a post-mortem analysis of technical and organizational factors, Risk Analysis. 13, 2 (1993).
[59] CCPS, Guidelines for Investigating Chemical Porcess Incidents, Center for Chemical Process Safety of the American Institute of Chemical Engineers, New York, 1992.
[60] Hendrick, K. and Benner, L. J., Investigating Accidents with STEP, Marcel Dekker, New York, 1987.
[61] Bento, J.-P., Menneske - Teknologi - Organisasjon Veiledning for gjennomføring av MTO-analyser. Kurskompendium for Oljedirektoratet, Oversatt av Statoil,, Oljedirektoratet, Stavanger, Norway, 2001.
[62] Rollenhagen, C., MTO - an introduction; The relationship between humans, technology, and organisation (In swedish; MTO - en introduktion; Sambanden människa, teknik och organisation), Utbildningshuset, Lund, 1997.
[63] Groeneweg, J., Controlling the controllable: The management of safety, DSWO Press, Leiden, The Netherlands, 1998.
[64] Rasmussen, J. and Svedung, I., Proactive Risk Management in a Dynamic Society, Swedish Rescue Services Agency, Stockholm, 2000.
[65] Kletz, T. A., Learning from Accidents, Gulf Prof. Publishing, UK, 2001.
Thesis – Part II Papers
PART II PAPERS
Paper 1 Safety barriers: Definition, classification, and performance
Paper 2 Hydrocarbon releases on oil and gas production platforms: Release scenarios and safety barriers
Paper 3 Barrier and operational risk analysis of hydrocarbon releases (BORA-Release); Part I Method description
Paper 4 Barrier and operational risk analysis of hydrocarbon releases (BORA-Release); Part II Results from a case study
Paper 5 Comparison of some selected methods for accident investigation
Paper 6 Qualitative Analysis of Human, Technical and Operational Barrier Elements during Well Interventions
Paper 7 Standardised procedures for Work Permits and Safe Job Analysis on the Norwegian Continental Shelf
Paper 8 Challenges related to surveillance of safety functions

Thesis – Part II Papers
Paper 1
Safety barriers: Definition, classification, and performance
Snorre Sklet Journal of Loss Prevention in the Process Industries Article in press, available online 20 January 2006
ARTICLE IN PRESS
0950-4230/$ - se
doi:10.1016/j.jlp
�Tel.: +47 73
E-mail addr
Journal of Loss Prevention in the Process Industries ] (]]]]) ]]]–]]]
www.elsevier.com/locate/jlp
Safety barriers: Definition, classification, and performance
Snorre Sklet�
Department of Production and Quality Engineering, The Norwegian University of Science and Technology (NTNU), NO-7491 Trondheim, Norway
Received 18 October 2005; received in revised form 6 December 2005; accepted 6 December 2005
Abstract
In spite of the fact that the concept of safety barriers is applied in practice, discussed in the literature, and even required in legislation
and standards, no common terminology that is applicable across sectors have been developed of the concept of safety barriers. This paper
focuses on safety barriers and addresses the following aspects; definitions and understanding of what is a safety barrier, classification of
safety barriers, and attributes of importance for the performance of safety barriers. Safety barriers are physical or non-physical means
planned to prevent, control, or mitigate undesired events or accidents. Barrier systems may be classified according to several dimensions,
for example as passive or active barrier systems, and as physical, technical, or human/operational barrier systems. Several attributes are
necessary to include in order to characterize the performance of safety barriers; functionality/effectiveness, reliability/availability,
response time, robustness, and finally a description of the triggering event or condition. For some types of barriers, not all the attributes
are relevant or necessary in order to describe the barrier performance.
r 2006 Elsevier Ltd. All rights reserved.
Keywords: Safety barrier; Defence-in-depth; Barrier performance; Risk analysis
1. Introduction
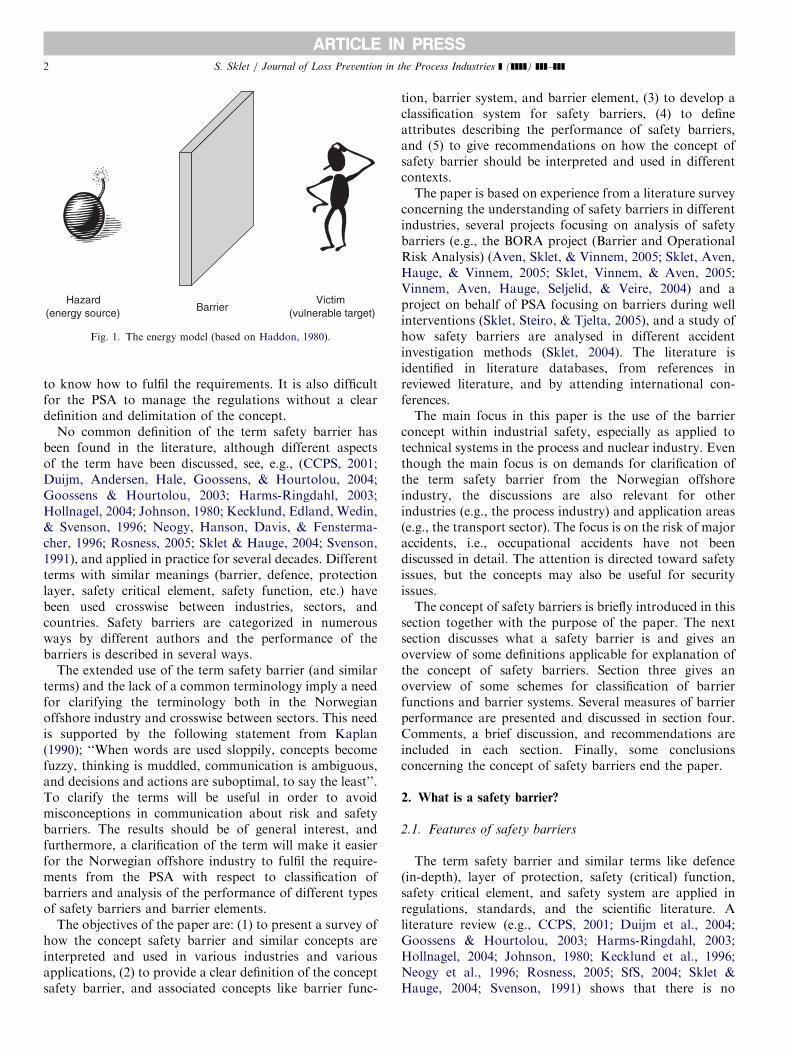
Safety barriers have been used to protect humans andproperty from enemies and natural hazards since the originof human beings. When human-induced hazards werecreated due to the industrialism, safety barriers wereimplemented to prevent accidents caused by these hazards.The concept of safety barriers is often related to anaccident model called the energy model (see Fig. 1). Gibson(1961) pioneered the development of the energy model,while Haddon (1980) developed the model further as hepresented his ten strategies for accident prevention. Safetybarriers also play an important role in the ManagementOversight & Risk Tree (MORT) concept (Johnson, 1980).
During recent years, an extended perspective on safetybarriers has evolved. This is emphasized by Hollnagel(2004) who states that ‘‘whereas the barriers used to defenda medieval castle mostly were of a physical nature, themodern principle of defence-in-depth combines differenttypes of barriers—from protection against the release of
e front matter r 2006 Elsevier Ltd. All rights reserved.
.2005.12.004
59 29 02; fax: +47 73 59 28 96.
ess: [email protected].
radioactive materials to event reporting and safetypolicies’’. This development is also supported by Flemingand Silady (2002) who states that ‘‘the definitions ofdefence-in-depth have evolved from a rather simple set ofstrategies to apply multiple lines of defence to a morecomprehensive set of cornerstones, strategies, and tactics toprotect the public health and safety’’. The concept ofdefence-in-depth was developed within the nuclear indus-try, but is also used in other high risk industries (e.g., theprocess industry where also the term multiple protectionlayers is used; CCPS, 1993).The focus on the use of risk-informed principles and
safety barriers in European regulations such as the SevesoII directive (EC, 1996) and the Machinery directive (EC,1998), national regulations as the Management regulationfrom the Petroleum Safety Authority Norway (PSA) (PSA,2001), and standards such as IEC:61508 (1998), IEC:61511(2002), and ISO:13702 (1999) demonstrates the importanceof safety barriers in order to reduce the risk of accidents.PSA has developed requirements to safety barriers, but hasnot given a clear definition of the concept. Discussionshave emerged on what is a safety barrier. Specialists do notfully agree on this issue and it is difficult for the companies
ARTICLE IN PRESS
Hazard(energy source)
Victim(vulnerable target)Barrier
Fig. 1. The energy model (based on Haddon, 1980).
S. Sklet / Journal of Loss Prevention in the Process Industries ] (]]]]) ]]]–]]]2
to know how to fulfil the requirements. It is also difficultfor the PSA to manage the regulations without a cleardefinition and delimitation of the concept.
No common definition of the term safety barrier hasbeen found in the literature, although different aspectsof the term have been discussed, see, e.g., (CCPS, 2001;Duijm, Andersen, Hale, Goossens, & Hourtolou, 2004;Goossens & Hourtolou, 2003; Harms-Ringdahl, 2003;Hollnagel, 2004; Johnson, 1980; Kecklund, Edland, Wedin,& Svenson, 1996; Neogy, Hanson, Davis, & Fensterma-cher, 1996; Rosness, 2005; Sklet & Hauge, 2004; Svenson,1991), and applied in practice for several decades. Differentterms with similar meanings (barrier, defence, protectionlayer, safety critical element, safety function, etc.) havebeen used crosswise between industries, sectors, andcountries. Safety barriers are categorized in numerousways by different authors and the performance of thebarriers is described in several ways.
The extended use of the term safety barrier (and similarterms) and the lack of a common terminology imply a needfor clarifying the terminology both in the Norwegianoffshore industry and crosswise between sectors. This needis supported by the following statement from Kaplan(1990); ‘‘When words are used sloppily, concepts becomefuzzy, thinking is muddled, communication is ambiguous,and decisions and actions are suboptimal, to say the least’’.To clarify the terms will be useful in order to avoidmisconceptions in communication about risk and safetybarriers. The results should be of general interest, andfurthermore, a clarification of the term will make it easierfor the Norwegian offshore industry to fulfil the require-ments from the PSA with respect to classification ofbarriers and analysis of the performance of different typesof safety barriers and barrier elements.
The objectives of the paper are: (1) to present a survey ofhow the concept safety barrier and similar concepts areinterpreted and used in various industries and variousapplications, (2) to provide a clear definition of the conceptsafety barrier, and associated concepts like barrier func-
tion, barrier system, and barrier element, (3) to develop aclassification system for safety barriers, (4) to defineattributes describing the performance of safety barriers,and (5) to give recommendations on how the concept ofsafety barrier should be interpreted and used in differentcontexts.The paper is based on experience from a literature survey
concerning the understanding of safety barriers in differentindustries, several projects focusing on analysis of safetybarriers (e.g., the BORA project (Barrier and OperationalRisk Analysis) (Aven, Sklet, & Vinnem, 2005; Sklet, Aven,Hauge, & Vinnem, 2005; Sklet, Vinnem, & Aven, 2005;Vinnem, Aven, Hauge, Seljelid, & Veire, 2004) and aproject on behalf of PSA focusing on barriers during wellinterventions (Sklet, Steiro, & Tjelta, 2005), and a study ofhow safety barriers are analysed in different accidentinvestigation methods (Sklet, 2004). The literature isidentified in literature databases, from references inreviewed literature, and by attending international con-ferences.The main focus in this paper is the use of the barrier
concept within industrial safety, especially as applied totechnical systems in the process and nuclear industry. Eventhough the main focus is on demands for clarification ofthe term safety barrier from the Norwegian offshoreindustry, the discussions are also relevant for otherindustries (e.g., the process industry) and application areas(e.g., the transport sector). The focus is on the risk of majoraccidents, i.e., occupational accidents have not beendiscussed in detail. The attention is directed toward safetyissues, but the concepts may also be useful for securityissues.The concept of safety barriers is briefly introduced in this
section together with the purpose of the paper. The nextsection discusses what a safety barrier is and gives anoverview of some definitions applicable for explanation ofthe concept of safety barriers. Section three gives anoverview of some schemes for classification of barrierfunctions and barrier systems. Several measures of barrierperformance are presented and discussed in section four.Comments, a brief discussion, and recommendations areincluded in each section. Finally, some conclusionsconcerning the concept of safety barriers end the paper.
2. What is a safety barrier?
2.1. Features of safety barriers
The term safety barrier and similar terms like defence(in-depth), layer of protection, safety (critical) function,safety critical element, and safety system are applied inregulations, standards, and the scientific literature. Aliterature review (e.g., CCPS, 2001; Duijm et al., 2004;Goossens & Hourtolou, 2003; Harms-Ringdahl, 2003;Hollnagel, 2004; Johnson, 1980; Kecklund et al., 1996;Neogy et al., 1996; Rosness, 2005; SfS, 2004; Sklet &Hauge, 2004; Svenson, 1991) shows that there is no
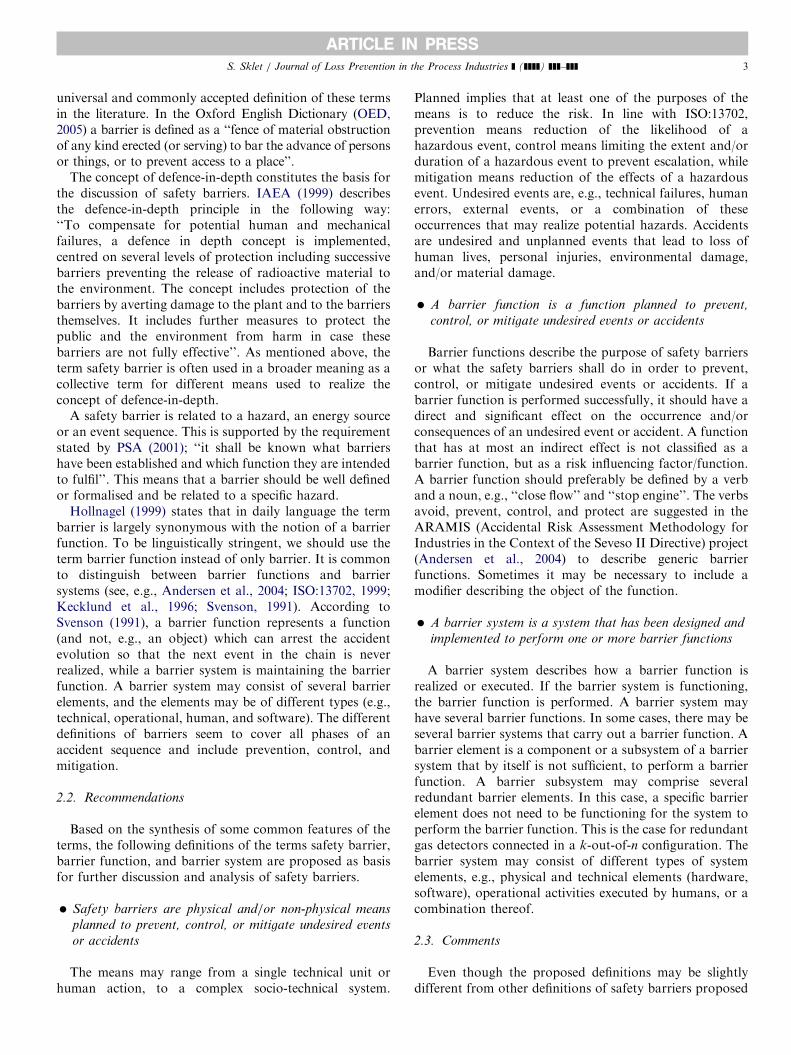
ARTICLE IN PRESSS. Sklet / Journal of Loss Prevention in the Process Industries ] (]]]]) ]]]–]]] 3
universal and commonly accepted definition of these termsin the literature. In the Oxford English Dictionary (OED,2005) a barrier is defined as a ‘‘fence of material obstructionof any kind erected (or serving) to bar the advance of personsor things, or to prevent access to a place’’.
The concept of defence-in-depth constitutes the basis forthe discussion of safety barriers. IAEA (1999) describesthe defence-in-depth principle in the following way:‘‘To compensate for potential human and mechanicalfailures, a defence in depth concept is implemented,centred on several levels of protection including successivebarriers preventing the release of radioactive material tothe environment. The concept includes protection of thebarriers by averting damage to the plant and to the barriersthemselves. It includes further measures to protect thepublic and the environment from harm in case thesebarriers are not fully effective’’. As mentioned above, theterm safety barrier is often used in a broader meaning as acollective term for different means used to realize theconcept of defence-in-depth.
A safety barrier is related to a hazard, an energy sourceor an event sequence. This is supported by the requirementstated by PSA (2001); ‘‘it shall be known what barriershave been established and which function they are intendedto fulfil’’. This means that a barrier should be well definedor formalised and be related to a specific hazard.
Hollnagel (1999) states that in daily language the termbarrier is largely synonymous with the notion of a barrierfunction. To be linguistically stringent, we should use theterm barrier function instead of only barrier. It is commonto distinguish between barrier functions and barriersystems (see, e.g., Andersen et al., 2004; ISO:13702, 1999;Kecklund et al., 1996; Svenson, 1991). According toSvenson (1991), a barrier function represents a function(and not, e.g., an object) which can arrest the accidentevolution so that the next event in the chain is neverrealized, while a barrier system is maintaining the barrierfunction. A barrier system may consist of several barrierelements, and the elements may be of different types (e.g.,technical, operational, human, and software). The differentdefinitions of barriers seem to cover all phases of anaccident sequence and include prevention, control, andmitigation.
2.2. Recommendations
Based on the synthesis of some common features of theterms, the following definitions of the terms safety barrier,barrier function, and barrier system are proposed as basisfor further discussion and analysis of safety barriers.
�
Safety barriers are physical and/or non-physical meansplanned to prevent, control, or mitigate undesired events
or accidents
The means may range from a single technical unit orhuman action, to a complex socio-technical system.
Planned implies that at least one of the purposes of themeans is to reduce the risk. In line with ISO:13702,prevention means reduction of the likelihood of ahazardous event, control means limiting the extent and/orduration of a hazardous event to prevent escalation, whilemitigation means reduction of the effects of a hazardousevent. Undesired events are, e.g., technical failures, humanerrors, external events, or a combination of theseoccurrences that may realize potential hazards. Accidentsare undesired and unplanned events that lead to loss ofhuman lives, personal injuries, environmental damage,and/or material damage.
�
A barrier function is a function planned to prevent,control, or mitigate undesired events or accidents
Barrier functions describe the purpose of safety barriersor what the safety barriers shall do in order to prevent,control, or mitigate undesired events or accidents. If abarrier function is performed successfully, it should have adirect and significant effect on the occurrence and/orconsequences of an undesired event or accident. A functionthat has at most an indirect effect is not classified as abarrier function, but as a risk influencing factor/function.A barrier function should preferably be defined by a verband a noun, e.g., ‘‘close flow’’ and ‘‘stop engine’’. The verbsavoid, prevent, control, and protect are suggested in theARAMIS (Accidental Risk Assessment Methodology forIndustries in the Context of the Seveso II Directive) project(Andersen et al., 2004) to describe generic barrierfunctions. Sometimes it may be necessary to include amodifier describing the object of the function.
�
A barrier system is a system that has been designed andimplemented to perform one or more barrier functions
A barrier system describes how a barrier function isrealized or executed. If the barrier system is functioning,the barrier function is performed. A barrier system mayhave several barrier functions. In some cases, there may beseveral barrier systems that carry out a barrier function. Abarrier element is a component or a subsystem of a barriersystem that by itself is not sufficient, to perform a barrierfunction. A barrier subsystem may comprise severalredundant barrier elements. In this case, a specific barrierelement does not need to be functioning for the system toperform the barrier function. This is the case for redundantgas detectors connected in a k-out-of-n configuration. Thebarrier system may consist of different types of systemelements, e.g., physical and technical elements (hardware,software), operational activities executed by humans, or acombination thereof.
2.3. Comments
Even though the proposed definitions may be slightlydifferent from other definitions of safety barriers proposed
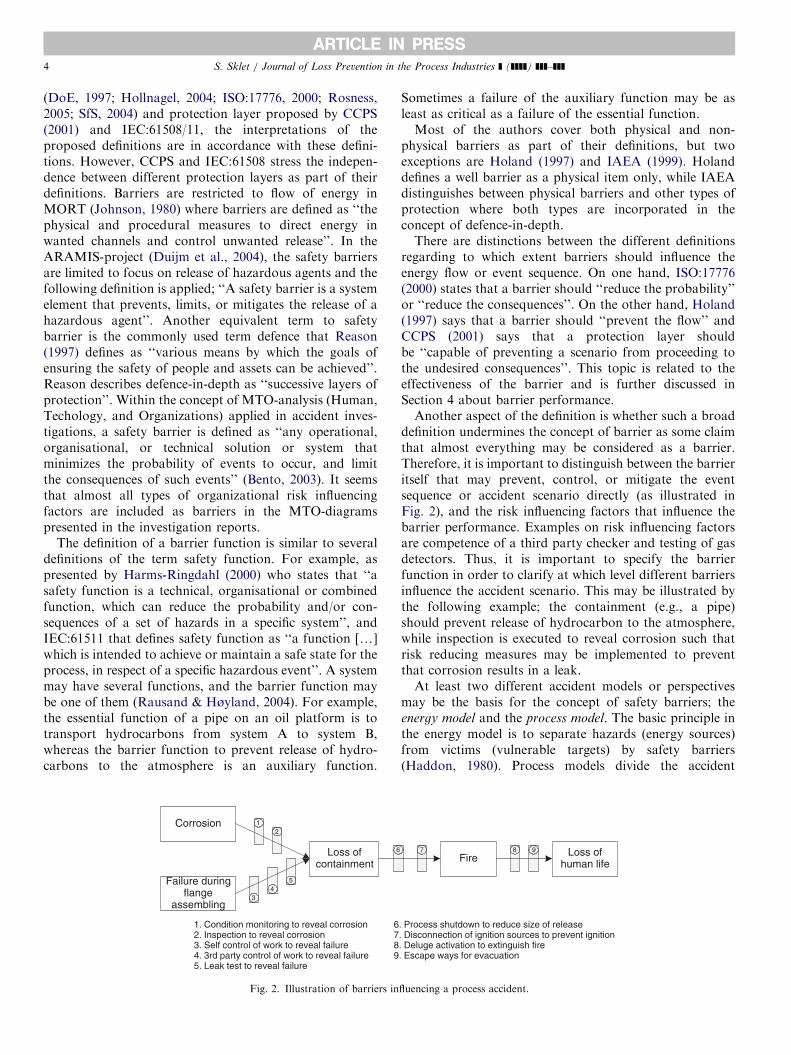
ARTICLE IN PRESSS. Sklet / Journal of Loss Prevention in the Process Industries ] (]]]]) ]]]–]]]4
(DoE, 1997; Hollnagel, 2004; ISO:17776, 2000; Rosness,2005; SfS, 2004) and protection layer proposed by CCPS(2001) and IEC:61508/11, the interpretations of theproposed definitions are in accordance with these defini-tions. However, CCPS and IEC:61508 stress the indepen-dence between different protection layers as part of theirdefinitions. Barriers are restricted to flow of energy inMORT (Johnson, 1980) where barriers are defined as ‘‘thephysical and procedural measures to direct energy inwanted channels and control unwanted release’’. In theARAMIS-project (Duijm et al., 2004), the safety barriersare limited to focus on release of hazardous agents and thefollowing definition is applied; ‘‘A safety barrier is a systemelement that prevents, limits, or mitigates the release of ahazardous agent’’. Another equivalent term to safetybarrier is the commonly used term defence that Reason(1997) defines as ‘‘various means by which the goals ofensuring the safety of people and assets can be achieved’’.Reason describes defence-in-depth as ‘‘successive layers ofprotection’’. Within the concept of MTO-analysis (Human,Techology, and Organizations) applied in accident inves-tigations, a safety barrier is defined as ‘‘any operational,organisational, or technical solution or system thatminimizes the probability of events to occur, and limitthe consequences of such events’’ (Bento, 2003). It seemsthat almost all types of organizational risk influencingfactors are included as barriers in the MTO-diagramspresented in the investigation reports.
The definition of a barrier function is similar to severaldefinitions of the term safety function. For example, aspresented by Harms-Ringdahl (2000) who states that ‘‘asafety function is a technical, organisational or combinedfunction, which can reduce the probability and/or con-sequences of a set of hazards in a specific system’’, andIEC:61511 that defines safety function as ‘‘a function [y]which is intended to achieve or maintain a safe state for theprocess, in respect of a specific hazardous event’’. A systemmay have several functions, and the barrier function maybe one of them (Rausand & Høyland, 2004). For example,the essential function of a pipe on an oil platform is totransport hydrocarbons from system A to system B,whereas the barrier function to prevent release of hydro-carbons to the atmosphere is an auxiliary function.
Corrosion
Loss ofcontainment
Failure duringflange
assembling
1
54
3
2
6
1. Condition monitoring to reveal corrosion2. Inspection to reveal corrosion3. Self control of work to reveal failure4. 3rd party control of work to reveal failure5. Leak test to reveal failure
6789
Fig. 2. Illustration of barriers in
Sometimes a failure of the auxiliary function may be asleast as critical as a failure of the essential function.Most of the authors cover both physical and non-
physical barriers as part of their definitions, but twoexceptions are Holand (1997) and IAEA (1999). Holanddefines a well barrier as a physical item only, while IAEAdistinguishes between physical barriers and other types ofprotection where both types are incorporated in theconcept of defence-in-depth.There are distinctions between the different definitions
regarding to which extent barriers should influence theenergy flow or event sequence. On one hand, ISO:17776(2000) states that a barrier should ‘‘reduce the probability’’or ‘‘reduce the consequences’’. On the other hand, Holand(1997) says that a barrier should ‘‘prevent the flow’’ andCCPS (2001) says that a protection layer shouldbe ‘‘capable of preventing a scenario from proceeding tothe undesired consequences’’. This topic is related to theeffectiveness of the barrier and is further discussed inSection 4 about barrier performance.Another aspect of the definition is whether such a broad
definition undermines the concept of barrier as some claimthat almost everything may be considered as a barrier.Therefore, it is important to distinguish between the barrieritself that may prevent, control, or mitigate the eventsequence or accident scenario directly (as illustrated inFig. 2), and the risk influencing factors that influence thebarrier performance. Examples on risk influencing factorsare competence of a third party checker and testing of gasdetectors. Thus, it is important to specify the barrierfunction in order to clarify at which level different barriersinfluence the accident scenario. This may be illustrated bythe following example; the containment (e.g., a pipe)should prevent release of hydrocarbon to the atmosphere,while inspection is executed to reveal corrosion such thatrisk reducing measures may be implemented to preventthat corrosion results in a leak.At least two different accident models or perspectives
may be the basis for the concept of safety barriers; theenergy model and the process model. The basic principle inthe energy model is to separate hazards (energy sources)from victims (vulnerable targets) by safety barriers(Haddon, 1980). Process models divide the accident
7 8 9 Loss ofhuman lifeFire
. Process shutdown to reduce size of release
. Disconnection of ignition sources to prevent ignition
. Deluge activation to extinguish fire
. Escape ways for evacuation
fluencing a process accident.
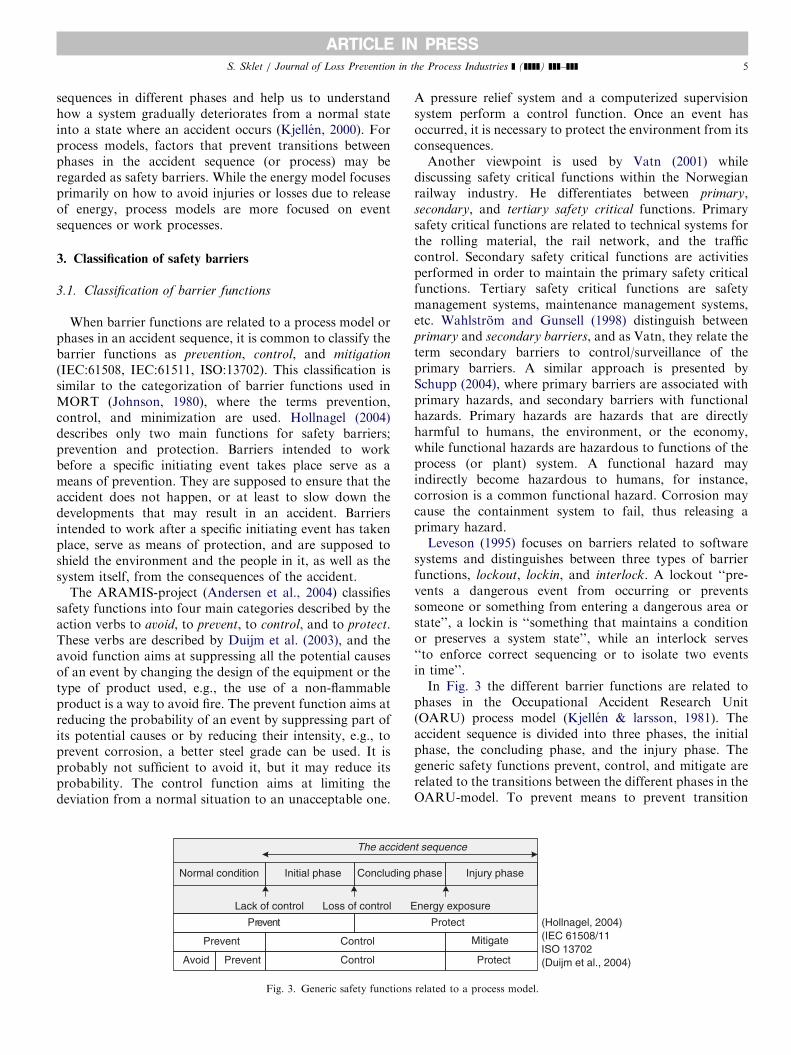
ARTICLE IN PRESSS. Sklet / Journal of Loss Prevention in the Process Industries ] (]]]]) ]]]–]]] 5
sequences in different phases and help us to understandhow a system gradually deteriorates from a normal stateinto a state where an accident occurs (Kjellen, 2000). Forprocess models, factors that prevent transitions betweenphases in the accident sequence (or process) may beregarded as safety barriers. While the energy model focusesprimarily on how to avoid injuries or losses due to releaseof energy, process models are more focused on eventsequences or work processes.
3. Classification of safety barriers
3.1. Classification of barrier functions
When barrier functions are related to a process model orphases in an accident sequence, it is common to classify thebarrier functions as prevention, control, and mitigation
(IEC:61508, IEC:61511, ISO:13702). This classification issimilar to the categorization of barrier functions used inMORT (Johnson, 1980), where the terms prevention,control, and minimization are used. Hollnagel (2004)describes only two main functions for safety barriers;prevention and protection. Barriers intended to workbefore a specific initiating event takes place serve as ameans of prevention. They are supposed to ensure that theaccident does not happen, or at least to slow down thedevelopments that may result in an accident. Barriersintended to work after a specific initiating event has takenplace, serve as means of protection, and are supposed toshield the environment and the people in it, as well as thesystem itself, from the consequences of the accident.
The ARAMIS-project (Andersen et al., 2004) classifiessafety functions into four main categories described by theaction verbs to avoid, to prevent, to control, and to protect.These verbs are described by Duijm et al. (2003), and theavoid function aims at suppressing all the potential causesof an event by changing the design of the equipment or thetype of product used, e.g., the use of a non-flammableproduct is a way to avoid fire. The prevent function aims atreducing the probability of an event by suppressing part ofits potential causes or by reducing their intensity, e.g., toprevent corrosion, a better steel grade can be used. It isprobably not sufficient to avoid it, but it may reduce itsprobability. The control function aims at limiting thedeviation from a normal situation to an unacceptable one.
Normal condition Concluding Initial phase
Lack of control ELoss of control
The acciden
Prevent Control
Prevent
Prevent ControlAvoid
Fig. 3. Generic safety functions
A pressure relief system and a computerized supervisionsystem perform a control function. Once an event hasoccurred, it is necessary to protect the environment from itsconsequences.Another viewpoint is used by Vatn (2001) while
discussing safety critical functions within the Norwegianrailway industry. He differentiates between primary,secondary, and tertiary safety critical functions. Primarysafety critical functions are related to technical systems forthe rolling material, the rail network, and the trafficcontrol. Secondary safety critical functions are activitiesperformed in order to maintain the primary safety criticalfunctions. Tertiary safety critical functions are safetymanagement systems, maintenance management systems,etc. Wahlstrom and Gunsell (1998) distinguish betweenprimary and secondary barriers, and as Vatn, they relate theterm secondary barriers to control/surveillance of theprimary barriers. A similar approach is presented bySchupp (2004), where primary barriers are associated withprimary hazards, and secondary barriers with functionalhazards. Primary hazards are hazards that are directlyharmful to humans, the environment, or the economy,while functional hazards are hazardous to functions of theprocess (or plant) system. A functional hazard mayindirectly become hazardous to humans, for instance,corrosion is a common functional hazard. Corrosion maycause the containment system to fail, thus releasing aprimary hazard.Leveson (1995) focuses on barriers related to software
systems and distinguishes between three types of barrierfunctions, lockout, lockin, and interlock. A lockout ‘‘pre-vents a dangerous event from occurring or preventssomeone or something from entering a dangerous area orstate’’, a lockin is ‘‘something that maintains a conditionor preserves a system state’’, while an interlock serves‘‘to enforce correct sequencing or to isolate two eventsin time’’.In Fig. 3 the different barrier functions are related to
phases in the Occupational Accident Research Unit(OARU) process model (Kjellen & larsson, 1981). Theaccident sequence is divided into three phases, the initialphase, the concluding phase, and the injury phase. Thegeneric safety functions prevent, control, and mitigate arerelated to the transitions between the different phases in theOARU-model. To prevent means to prevent transition
phase
nergy exposure
t sequence
Mitigate
Protect
Protect
Injury phase
(Hollnagel, 2004)
(Duijm et al., 2004)
(IEC 61508/11ISO 13702
related to a process model.
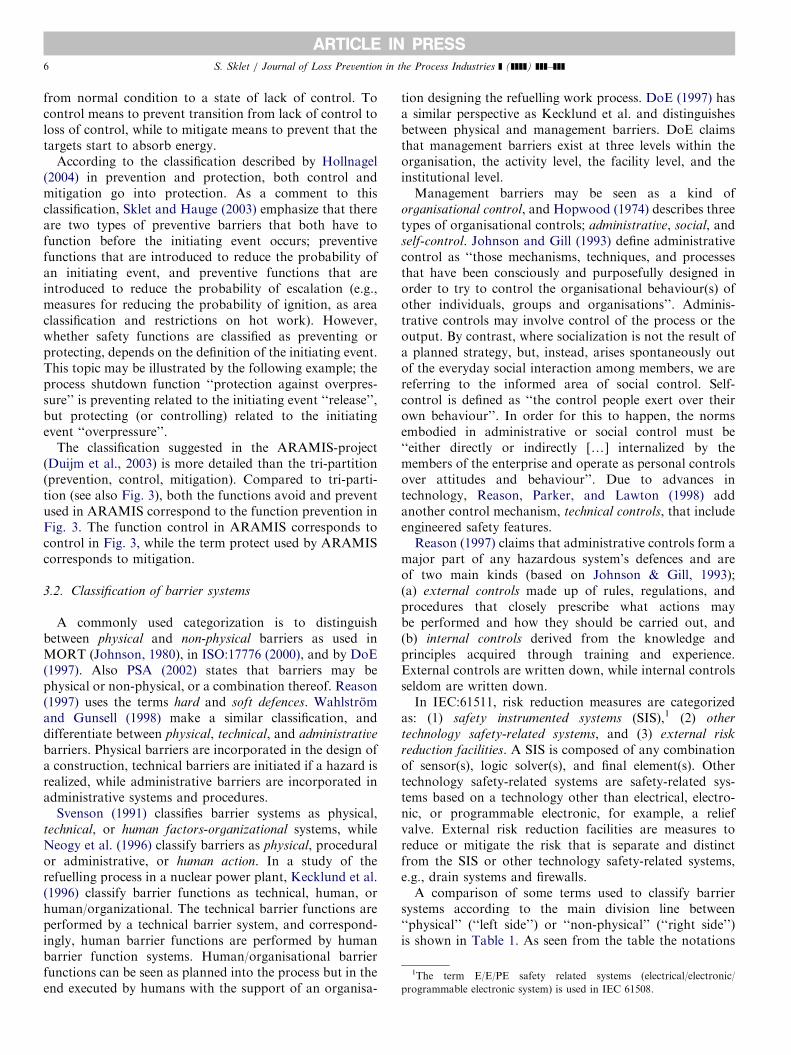
ARTICLE IN PRESS
1The term E/E/PE safety related systems (electrical/electronic/
programmable electronic system) is used in IEC 61508.
S. Sklet / Journal of Loss Prevention in the Process Industries ] (]]]]) ]]]–]]]6
from normal condition to a state of lack of control. Tocontrol means to prevent transition from lack of control toloss of control, while to mitigate means to prevent that thetargets start to absorb energy.
According to the classification described by Hollnagel(2004) in prevention and protection, both control andmitigation go into protection. As a comment to thisclassification, Sklet and Hauge (2003) emphasize that thereare two types of preventive barriers that both have tofunction before the initiating event occurs; preventivefunctions that are introduced to reduce the probability ofan initiating event, and preventive functions that areintroduced to reduce the probability of escalation (e.g.,measures for reducing the probability of ignition, as areaclassification and restrictions on hot work). However,whether safety functions are classified as preventing orprotecting, depends on the definition of the initiating event.This topic may be illustrated by the following example; theprocess shutdown function ‘‘protection against overpres-sure’’ is preventing related to the initiating event ‘‘release’’,but protecting (or controlling) related to the initiatingevent ‘‘overpressure’’.
The classification suggested in the ARAMIS-project(Duijm et al., 2003) is more detailed than the tri-partition(prevention, control, mitigation). Compared to tri-parti-tion (see also Fig. 3), both the functions avoid and preventused in ARAMIS correspond to the function prevention inFig. 3. The function control in ARAMIS corresponds tocontrol in Fig. 3, while the term protect used by ARAMIScorresponds to mitigation.
3.2. Classification of barrier systems
A commonly used categorization is to distinguishbetween physical and non-physical barriers as used inMORT (Johnson, 1980), in ISO:17776 (2000), and by DoE(1997). Also PSA (2002) states that barriers may bephysical or non-physical, or a combination thereof. Reason(1997) uses the terms hard and soft defences. Wahlstromand Gunsell (1998) make a similar classification, anddifferentiate between physical, technical, and administrative
barriers. Physical barriers are incorporated in the design ofa construction, technical barriers are initiated if a hazard isrealized, while administrative barriers are incorporated inadministrative systems and procedures.
Svenson (1991) classifies barrier systems as physical,technical, or human factors-organizational systems, whileNeogy et al. (1996) classify barriers as physical, proceduralor administrative, or human action. In a study of therefuelling process in a nuclear power plant, Kecklund et al.(1996) classify barrier functions as technical, human, orhuman/organizational. The technical barrier functions areperformed by a technical barrier system, and correspond-ingly, human barrier functions are performed by humanbarrier function systems. Human/organisational barrierfunctions can be seen as planned into the process but in theend executed by humans with the support of an organisa-
tion designing the refuelling work process. DoE (1997) hasa similar perspective as Kecklund et al. and distinguishesbetween physical and management barriers. DoE claimsthat management barriers exist at three levels within theorganisation, the activity level, the facility level, and theinstitutional level.Management barriers may be seen as a kind of
organisational control, and Hopwood (1974) describes threetypes of organisational controls; administrative, social, andself-control. Johnson and Gill (1993) define administrativecontrol as ‘‘those mechanisms, techniques, and processesthat have been consciously and purposefully designed inorder to try to control the organisational behaviour(s) ofother individuals, groups and organisations’’. Adminis-trative controls may involve control of the process or theoutput. By contrast, where socialization is not the result ofa planned strategy, but, instead, arises spontaneously outof the everyday social interaction among members, we arereferring to the informed area of social control. Self-control is defined as ‘‘the control people exert over theirown behaviour’’. In order for this to happen, the normsembodied in administrative or social control must be‘‘either directly or indirectly [y] internalized by themembers of the enterprise and operate as personal controlsover attitudes and behaviour’’. Due to advances intechnology, Reason, Parker, and Lawton (1998) addanother control mechanism, technical controls, that includeengineered safety features.Reason (1997) claims that administrative controls form a
major part of any hazardous system’s defences and areof two main kinds (based on Johnson & Gill, 1993);(a) external controls made up of rules, regulations, andprocedures that closely prescribe what actions maybe performed and how they should be carried out, and(b) internal controls derived from the knowledge andprinciples acquired through training and experience.External controls are written down, while internal controlsseldom are written down.In IEC:61511, risk reduction measures are categorized
as: (1) safety instrumented systems (SIS),1 (2) other
technology safety-related systems, and (3) external risk
reduction facilities. A SIS is composed of any combinationof sensor(s), logic solver(s), and final element(s). Othertechnology safety-related systems are safety-related sys-tems based on a technology other than electrical, electro-nic, or programmable electronic, for example, a reliefvalve. External risk reduction facilities are measures toreduce or mitigate the risk that is separate and distinctfrom the SIS or other technology safety-related systems,e.g., drain systems and firewalls.A comparison of some terms used to classify barrier
systems according to the main division line between‘‘physical’’ (‘‘left side’’) or ‘‘non-physical’’ (‘‘right side’’)is shown in Table 1. As seen from the table the notations
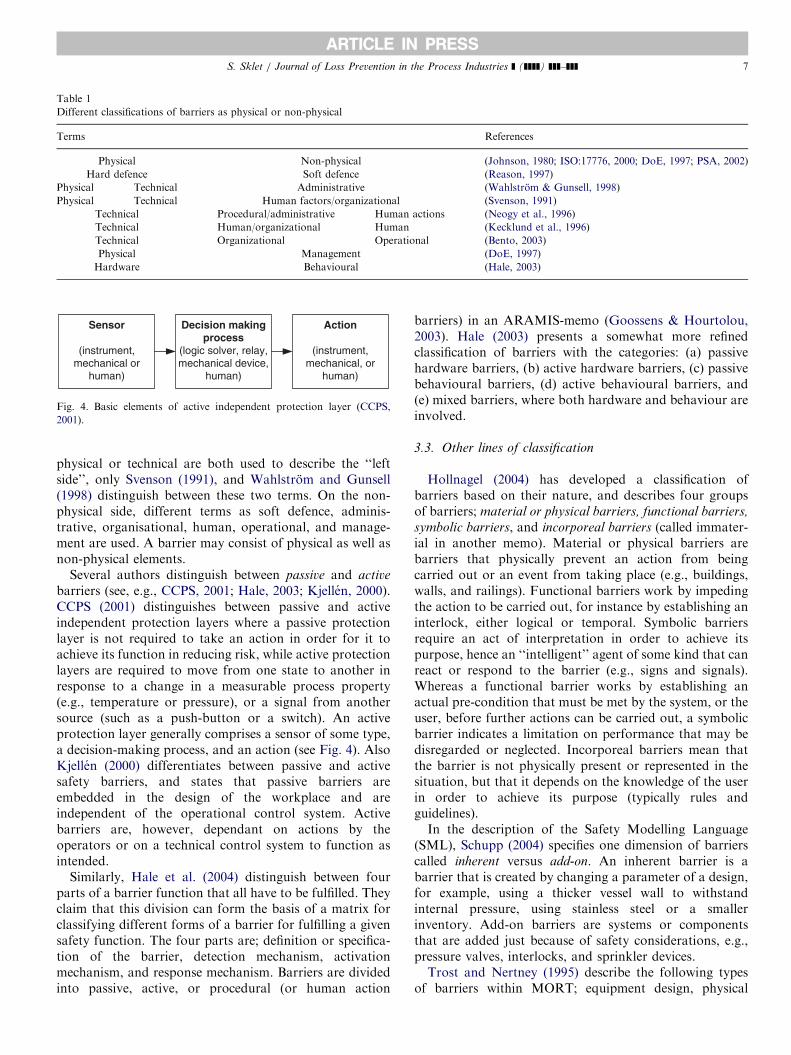
ARTICLE IN PRESS
Table 1
Different classifications of barriers as physical or non-physical
Terms References
Physical Non-physical (Johnson, 1980; ISO:17776, 2000; DoE, 1997; PSA, 2002)
Hard defence Soft defence (Reason, 1997)
Physical Technical Administrative (Wahlstrom & Gunsell, 1998)
Physical Technical Human factors/organizational (Svenson, 1991)
Technical Procedural/administrative Human actions (Neogy et al., 1996)
Technical Human/organizational Human (Kecklund et al., 1996)
Technical Organizational Operational (Bento, 2003)
Physical Management (DoE, 1997)
Hardware Behavioural (Hale, 2003)
Sensor
(instrument,mechanical or
human)
Decision makingprocess
(logic solver, relay,mechanical device,
human)
Action
(instrument,mechanical, or
human)
Fig. 4. Basic elements of active independent protection layer (CCPS,
2001).
S. Sklet / Journal of Loss Prevention in the Process Industries ] (]]]]) ]]]–]]] 7
physical or technical are both used to describe the ‘‘leftside’’, only Svenson (1991), and Wahlstrom and Gunsell(1998) distinguish between these two terms. On the non-physical side, different terms as soft defence, adminis-trative, organisational, human, operational, and manage-ment are used. A barrier may consist of physical as well asnon-physical elements.
Several authors distinguish between passive and active
barriers (see, e.g., CCPS, 2001; Hale, 2003; Kjellen, 2000).CCPS (2001) distinguishes between passive and activeindependent protection layers where a passive protectionlayer is not required to take an action in order for it toachieve its function in reducing risk, while active protectionlayers are required to move from one state to another inresponse to a change in a measurable process property(e.g., temperature or pressure), or a signal from anothersource (such as a push-button or a switch). An activeprotection layer generally comprises a sensor of some type,a decision-making process, and an action (see Fig. 4). AlsoKjellen (2000) differentiates between passive and activesafety barriers, and states that passive barriers areembedded in the design of the workplace and areindependent of the operational control system. Activebarriers are, however, dependant on actions by theoperators or on a technical control system to function asintended.
Similarly, Hale et al. (2004) distinguish between fourparts of a barrier function that all have to be fulfilled. Theyclaim that this division can form the basis of a matrix forclassifying different forms of a barrier for fulfilling a givensafety function. The four parts are; definition or specifica-tion of the barrier, detection mechanism, activationmechanism, and response mechanism. Barriers are dividedinto passive, active, or procedural (or human action
barriers) in an ARAMIS-memo (Goossens & Hourtolou,2003). Hale (2003) presents a somewhat more refinedclassification of barriers with the categories: (a) passivehardware barriers, (b) active hardware barriers, (c) passivebehavioural barriers, (d) active behavioural barriers, and(e) mixed barriers, where both hardware and behaviour areinvolved.
3.3. Other lines of classification
Hollnagel (2004) has developed a classification ofbarriers based on their nature, and describes four groupsof barriers; material or physical barriers, functional barriers,
symbolic barriers, and incorporeal barriers (called immater-ial in another memo). Material or physical barriers arebarriers that physically prevent an action from beingcarried out or an event from taking place (e.g., buildings,walls, and railings). Functional barriers work by impedingthe action to be carried out, for instance by establishing aninterlock, either logical or temporal. Symbolic barriersrequire an act of interpretation in order to achieve itspurpose, hence an ‘‘intelligent’’ agent of some kind that canreact or respond to the barrier (e.g., signs and signals).Whereas a functional barrier works by establishing anactual pre-condition that must be met by the system, or theuser, before further actions can be carried out, a symbolicbarrier indicates a limitation on performance that may bedisregarded or neglected. Incorporeal barriers mean thatthe barrier is not physically present or represented in thesituation, but that it depends on the knowledge of the userin order to achieve its purpose (typically rules andguidelines).In the description of the Safety Modelling Language
(SML), Schupp (2004) specifies one dimension of barrierscalled inherent versus add-on. An inherent barrier is abarrier that is created by changing a parameter of a design,for example, using a thicker vessel wall to withstandinternal pressure, using stainless steel or a smallerinventory. Add-on barriers are systems or componentsthat are added just because of safety considerations, e.g.,pressure valves, interlocks, and sprinkler devices.Trost and Nertney (1995) describe the following types
of barriers within MORT; equipment design, physical
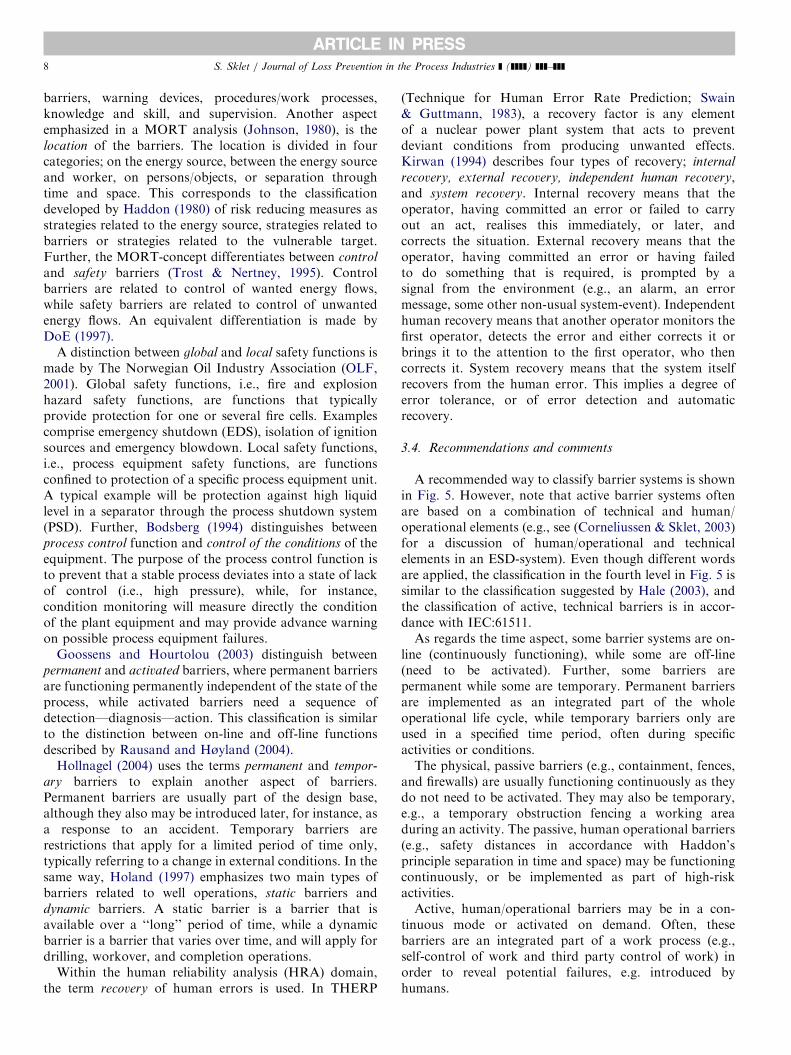
ARTICLE IN PRESSS. Sklet / Journal of Loss Prevention in the Process Industries ] (]]]]) ]]]–]]]8
barriers, warning devices, procedures/work processes,knowledge and skill, and supervision. Another aspectemphasized in a MORT analysis (Johnson, 1980), is thelocation of the barriers. The location is divided in fourcategories; on the energy source, between the energy sourceand worker, on persons/objects, or separation throughtime and space. This corresponds to the classificationdeveloped by Haddon (1980) of risk reducing measures asstrategies related to the energy source, strategies related tobarriers or strategies related to the vulnerable target.Further, the MORT-concept differentiates between control
and safety barriers (Trost & Nertney, 1995). Controlbarriers are related to control of wanted energy flows,while safety barriers are related to control of unwantedenergy flows. An equivalent differentiation is made byDoE (1997).
A distinction between global and local safety functions ismade by The Norwegian Oil Industry Association (OLF,2001). Global safety functions, i.e., fire and explosionhazard safety functions, are functions that typicallyprovide protection for one or several fire cells. Examplescomprise emergency shutdown (EDS), isolation of ignitionsources and emergency blowdown. Local safety functions,i.e., process equipment safety functions, are functionsconfined to protection of a specific process equipment unit.A typical example will be protection against high liquidlevel in a separator through the process shutdown system(PSD). Further, Bodsberg (1994) distinguishes betweenprocess control function and control of the conditions of theequipment. The purpose of the process control function isto prevent that a stable process deviates into a state of lackof control (i.e., high pressure), while, for instance,condition monitoring will measure directly the conditionof the plant equipment and may provide advance warningon possible process equipment failures.
Goossens and Hourtolou (2003) distinguish betweenpermanent and activated barriers, where permanent barriersare functioning permanently independent of the state of theprocess, while activated barriers need a sequence ofdetection—diagnosis—action. This classification is similarto the distinction between on-line and off-line functionsdescribed by Rausand and Høyland (2004).
Hollnagel (2004) uses the terms permanent and tempor-
ary barriers to explain another aspect of barriers.Permanent barriers are usually part of the design base,although they also may be introduced later, for instance, asa response to an accident. Temporary barriers arerestrictions that apply for a limited period of time only,typically referring to a change in external conditions. In thesame way, Holand (1997) emphasizes two main types ofbarriers related to well operations, static barriers anddynamic barriers. A static barrier is a barrier that isavailable over a ‘‘long’’ period of time, while a dynamicbarrier is a barrier that varies over time, and will apply fordrilling, workover, and completion operations.
Within the human reliability analysis (HRA) domain,the term recovery of human errors is used. In THERP
(Technique for Human Error Rate Prediction; Swain& Guttmann, 1983), a recovery factor is any elementof a nuclear power plant system that acts to preventdeviant conditions from producing unwanted effects.Kirwan (1994) describes four types of recovery; internal
recovery, external recovery, independent human recovery,and system recovery. Internal recovery means that theoperator, having committed an error or failed to carryout an act, realises this immediately, or later, andcorrects the situation. External recovery means that theoperator, having committed an error or having failedto do something that is required, is prompted by asignal from the environment (e.g., an alarm, an errormessage, some other non-usual system-event). Independenthuman recovery means that another operator monitors thefirst operator, detects the error and either corrects it orbrings it to the attention to the first operator, who thencorrects it. System recovery means that the system itselfrecovers from the human error. This implies a degree oferror tolerance, or of error detection and automaticrecovery.
3.4. Recommendations and comments
A recommended way to classify barrier systems is shownin Fig. 5. However, note that active barrier systems oftenare based on a combination of technical and human/operational elements (e.g., see (Corneliussen & Sklet, 2003)for a discussion of human/operational and technicalelements in an ESD-system). Even though different wordsare applied, the classification in the fourth level in Fig. 5 issimilar to the classification suggested by Hale (2003), andthe classification of active, technical barriers is in accor-dance with IEC:61511.As regards the time aspect, some barrier systems are on-
line (continuously functioning), while some are off-line(need to be activated). Further, some barriers arepermanent while some are temporary. Permanent barriersare implemented as an integrated part of the wholeoperational life cycle, while temporary barriers only areused in a specified time period, often during specificactivities or conditions.The physical, passive barriers (e.g., containment, fences,
and firewalls) are usually functioning continuously as theydo not need to be activated. They may also be temporary,e.g., a temporary obstruction fencing a working areaduring an activity. The passive, human operational barriers(e.g., safety distances in accordance with Haddon’sprinciple separation in time and space) may be functioningcontinuously, or be implemented as part of high-riskactivities.Active, human/operational barriers may be in a con-
tinuous mode or activated on demand. Often, thesebarriers are an integrated part of a work process (e.g.,self-control of work and third party control of work) inorder to reveal potential failures, e.g. introduced byhumans.
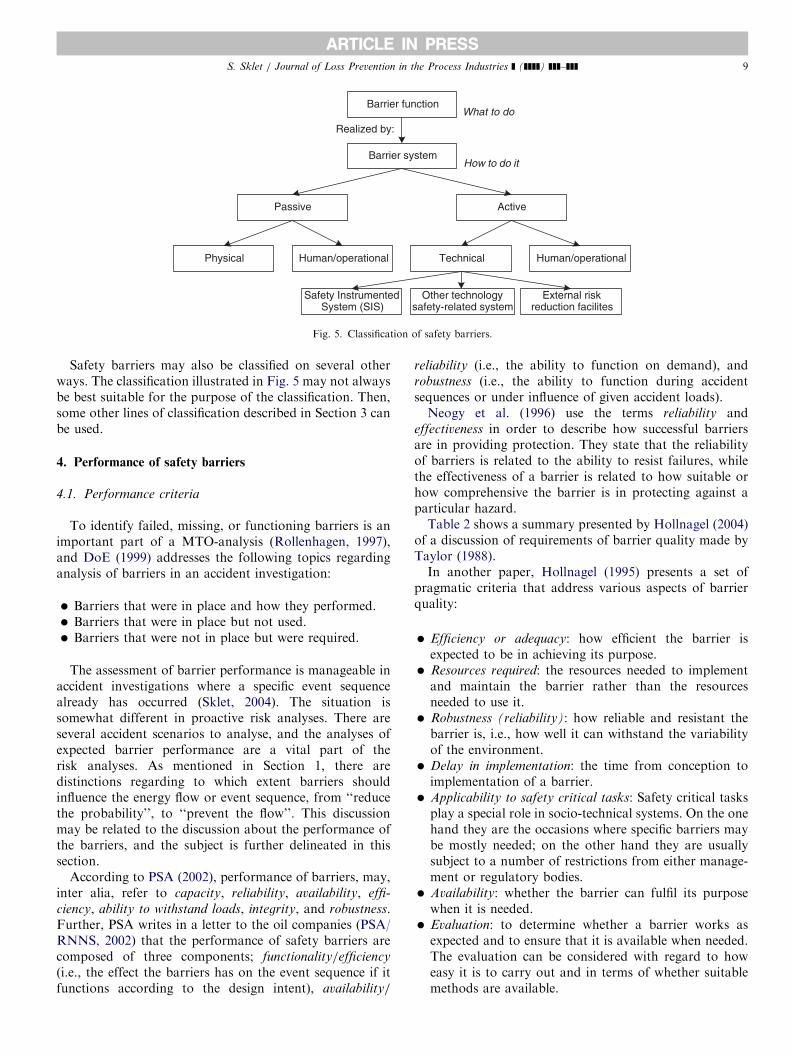
ARTICLE IN PRESS
Barrier function
Barrier system
ActivePassive
Human/operationalTechnicalPhysical Human/operational
Safety InstrumentedSystem (SIS)
Other technology safety-related system
Realized by:
What to do
How to do it
External risk reduction facilites
Fig. 5. Classification of safety barriers.
S. Sklet / Journal of Loss Prevention in the Process Industries ] (]]]]) ]]]–]]] 9
Safety barriers may also be classified on several otherways. The classification illustrated in Fig. 5 may not alwaysbe best suitable for the purpose of the classification. Then,some other lines of classification described in Section 3 canbe used.
4. Performance of safety barriers
4.1. Performance criteria
To identify failed, missing, or functioning barriers is animportant part of a MTO-analysis (Rollenhagen, 1997),and DoE (1999) addresses the following topics regardinganalysis of barriers in an accident investigation:
�
Barriers that were in place and how they performed. � Barriers that were in place but not used. � Barriers that were not in place but were required.The assessment of barrier performance is manageable inaccident investigations where a specific event sequencealready has occurred (Sklet, 2004). The situation issomewhat different in proactive risk analyses. There areseveral accident scenarios to analyse, and the analyses ofexpected barrier performance are a vital part of therisk analyses. As mentioned in Section 1, there aredistinctions regarding to which extent barriers shouldinfluence the energy flow or event sequence, from ‘‘reducethe probability’’, to ‘‘prevent the flow’’. This discussionmay be related to the discussion about the performance ofthe barriers, and the subject is further delineated in thissection.
According to PSA (2002), performance of barriers, may,inter alia, refer to capacity, reliability, availability, effi-
ciency, ability to withstand loads, integrity, and robustness.Further, PSA writes in a letter to the oil companies (PSA/RNNS, 2002) that the performance of safety barriers arecomposed of three components; functionality/efficiency
(i.e., the effect the barriers has on the event sequence if itfunctions according to the design intent), availability/
reliability (i.e., the ability to function on demand), androbustness (i.e., the ability to function during accidentsequences or under influence of given accident loads).Neogy et al. (1996) use the terms reliability and
effectiveness in order to describe how successful barriersare in providing protection. They state that the reliabilityof barriers is related to the ability to resist failures, whilethe effectiveness of a barrier is related to how suitable orhow comprehensive the barrier is in protecting against aparticular hazard.Table 2 shows a summary presented by Hollnagel (2004)
of a discussion of requirements of barrier quality made byTaylor (1988).In another paper, Hollnagel (1995) presents a set of
pragmatic criteria that address various aspects of barrierquality:
�
Efficiency or adequacy: how efficient the barrier isexpected to be in achieving its purpose. � Resources required: the resources needed to implementand maintain the barrier rather than the resourcesneeded to use it.
� Robustness (reliability): how reliable and resistant thebarrier is, i.e., how well it can withstand the variabilityof the environment.
� Delay in implementation: the time from conception toimplementation of a barrier.
� Applicability to safety critical tasks: Safety critical tasksplay a special role in socio-technical systems. On the onehand they are the occasions where specific barriers maybe mostly needed; on the other hand they are usuallysubject to a number of restrictions from either manage-ment or regulatory bodies.
� Availability: whether the barrier can fulfil its purposewhen it is needed.
� Evaluation: to determine whether a barrier works asexpected and to ensure that it is available when needed.The evaluation can be considered with regard to howeasy it is to carry out and in terms of whether suitablemethods are available.
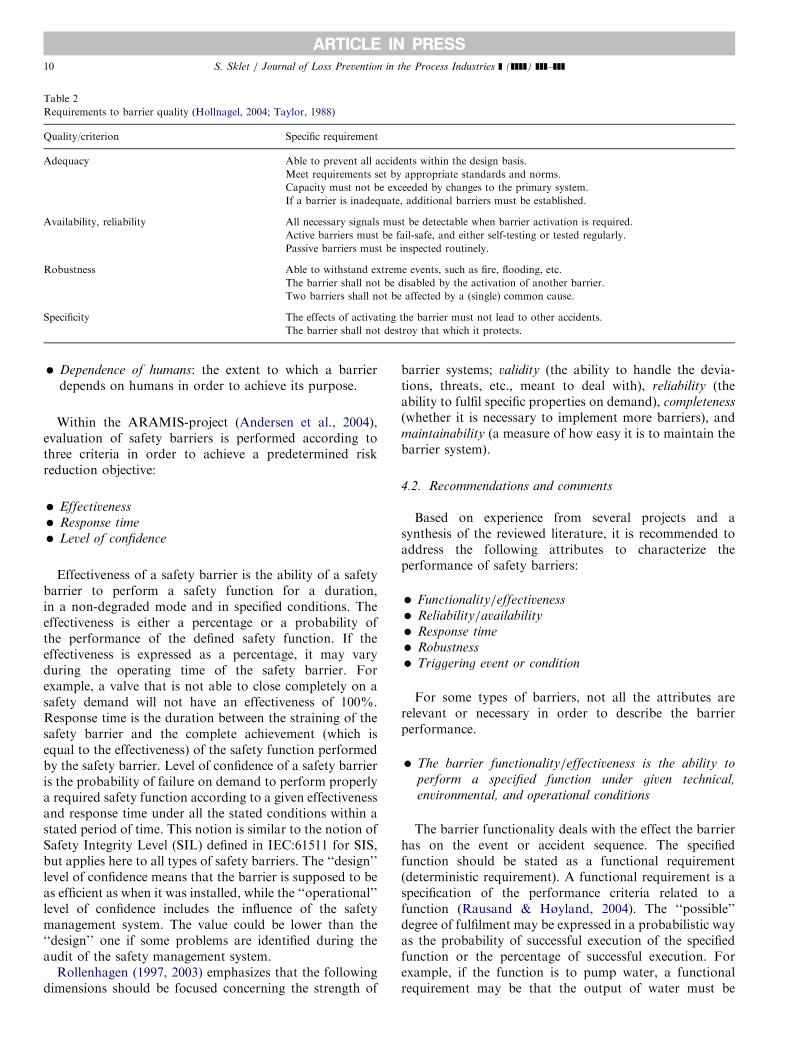
ARTICLE IN PRESS
Table 2
Requirements to barrier quality (Hollnagel, 2004; Taylor, 1988)
Quality/criterion Specific requirement
Adequacy Able to prevent all accidents within the design basis.
Meet requirements set by appropriate standards and norms.
Capacity must not be exceeded by changes to the primary system.
If a barrier is inadequate, additional barriers must be established.
Availability, reliability All necessary signals must be detectable when barrier activation is required.
Active barriers must be fail-safe, and either self-testing or tested regularly.
Passive barriers must be inspected routinely.
Robustness Able to withstand extreme events, such as fire, flooding, etc.
The barrier shall not be disabled by the activation of another barrier.
Two barriers shall not be affected by a (single) common cause.
Specificity The effects of activating the barrier must not lead to other accidents.
The barrier shall not destroy that which it protects.
S. Sklet / Journal of Loss Prevention in the Process Industries ] (]]]]) ]]]–]]]10
�
Dependence of humans: the extent to which a barrierdepends on humans in order to achieve its purpose.Within the ARAMIS-project (Andersen et al., 2004),evaluation of safety barriers is performed according tothree criteria in order to achieve a predetermined riskreduction objective:
�
Effectiveness�
Response time�
Level of confidenceEffectiveness of a safety barrier is the ability of a safetybarrier to perform a safety function for a duration,in a non-degraded mode and in specified conditions. Theeffectiveness is either a percentage or a probability ofthe performance of the defined safety function. If theeffectiveness is expressed as a percentage, it may varyduring the operating time of the safety barrier. Forexample, a valve that is not able to close completely on asafety demand will not have an effectiveness of 100%.Response time is the duration between the straining of thesafety barrier and the complete achievement (which isequal to the effectiveness) of the safety function performedby the safety barrier. Level of confidence of a safety barrieris the probability of failure on demand to perform properlya required safety function according to a given effectivenessand response time under all the stated conditions within astated period of time. This notion is similar to the notion ofSafety Integrity Level (SIL) defined in IEC:61511 for SIS,but applies here to all types of safety barriers. The ‘‘design’’level of confidence means that the barrier is supposed to beas efficient as when it was installed, while the ‘‘operational’’level of confidence includes the influence of the safetymanagement system. The value could be lower than the‘‘design’’ one if some problems are identified during theaudit of the safety management system.
Rollenhagen (1997, 2003) emphasizes that the followingdimensions should be focused concerning the strength of
barrier systems; validity (the ability to handle the devia-tions, threats, etc., meant to deal with), reliability (theability to fulfil specific properties on demand), completeness
(whether it is necessary to implement more barriers), andmaintainability (a measure of how easy it is to maintain thebarrier system).
4.2. Recommendations and comments
Based on experience from several projects and asynthesis of the reviewed literature, it is recommended toaddress the following attributes to characterize theperformance of safety barriers:
�
Functionality/effectiveness�
Reliability/availability�
Response time�
Robustness�
Triggering event or conditionFor some types of barriers, not all the attributes arerelevant or necessary in order to describe the barrierperformance.
�
The barrier functionality/effectiveness is the ability toperform a specified function under given technical,
environmental, and operational conditions
The barrier functionality deals with the effect the barrierhas on the event or accident sequence. The specifiedfunction should be stated as a functional requirement(deterministic requirement). A functional requirement is aspecification of the performance criteria related to afunction (Rausand & Høyland, 2004). The ‘‘possible’’degree of fulfilment may be expressed in a probabilistic wayas the probability of successful execution of the specifiedfunction or the percentage of successful execution. Forexample, if the function is to pump water, a functionalrequirement may be that the output of water must be
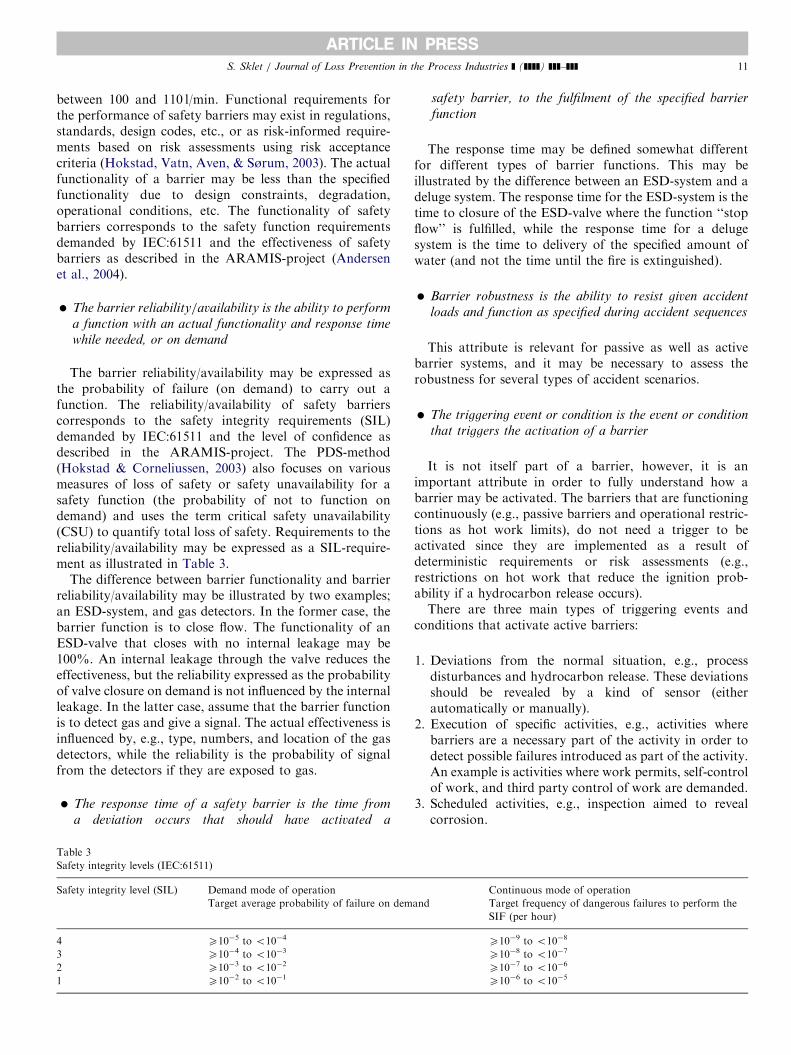
ARTICLE IN PRESSS. Sklet / Journal of Loss Prevention in the Process Industries ] (]]]]) ]]]–]]] 11
between 100 and 110 l/min. Functional requirements forthe performance of safety barriers may exist in regulations,standards, design codes, etc., or as risk-informed require-ments based on risk assessments using risk acceptancecriteria (Hokstad, Vatn, Aven, & Sørum, 2003). The actualfunctionality of a barrier may be less than the specifiedfunctionality due to design constraints, degradation,operational conditions, etc. The functionality of safetybarriers corresponds to the safety function requirementsdemanded by IEC:61511 and the effectiveness of safetybarriers as described in the ARAMIS-project (Andersenet al., 2004).
�
The barrier reliability/availability is the ability to performa function with an actual functionality and response time
while needed, or on demand
The barrier reliability/availability may be expressed asthe probability of failure (on demand) to carry out afunction. The reliability/availability of safety barrierscorresponds to the safety integrity requirements (SIL)demanded by IEC:61511 and the level of confidence asdescribed in the ARAMIS-project. The PDS-method(Hokstad & Corneliussen, 2003) also focuses on variousmeasures of loss of safety or safety unavailability for asafety function (the probability of not to function ondemand) and uses the term critical safety unavailability(CSU) to quantify total loss of safety. Requirements to thereliability/availability may be expressed as a SIL-require-ment as illustrated in Table 3.
The difference between barrier functionality and barrierreliability/availability may be illustrated by two examples;an ESD-system, and gas detectors. In the former case, thebarrier function is to close flow. The functionality of anESD-valve that closes with no internal leakage may be100%. An internal leakage through the valve reduces theeffectiveness, but the reliability expressed as the probabilityof valve closure on demand is not influenced by the internalleakage. In the latter case, assume that the barrier functionis to detect gas and give a signal. The actual effectiveness isinfluenced by, e.g., type, numbers, and location of the gasdetectors, while the reliability is the probability of signalfrom the detectors if they are exposed to gas.
�
Tab
Saf
Saf
4
3
2
1
The response time of a safety barrier is the time from
a deviation occurs that should have activated a
le 3
ety integrity levels (IEC:61511)
ety integrity level (SIL) Demand mode of operation
Target average probability of failure on dem
X10�5 to o10�4
X10�4 to o10�3
X10�3 to o10�2
X10�2 to o10�1
safety barrier, to the fulfilment of the specified barrier
function
The response time may be defined somewhat differentfor different types of barrier functions. This may beillustrated by the difference between an ESD-system and adeluge system. The response time for the ESD-system is thetime to closure of the ESD-valve where the function ‘‘stopflow’’ is fulfilled, while the response time for a delugesystem is the time to delivery of the specified amount ofwater (and not the time until the fire is extinguished).
�
Barrier robustness is the ability to resist given accidentloads and function as specified during accident sequences
This attribute is relevant for passive as well as activebarrier systems, and it may be necessary to assess therobustness for several types of accident scenarios.
�
The triggering event or condition is the event or conditionthat triggers the activation of a barrier
It is not itself part of a barrier, however, it is animportant attribute in order to fully understand how abarrier may be activated. The barriers that are functioningcontinuously (e.g., passive barriers and operational restric-tions as hot work limits), do not need a trigger to beactivated since they are implemented as a result ofdeterministic requirements or risk assessments (e.g.,restrictions on hot work that reduce the ignition prob-ability if a hydrocarbon release occurs).There are three main types of triggering events and
conditions that activate active barriers:
1.
and
Deviations from the normal situation, e.g., processdisturbances and hydrocarbon release. These deviationsshould be revealed by a kind of sensor (eitherautomatically or manually).
2.
Execution of specific activities, e.g., activities wherebarriers are a necessary part of the activity in order todetect possible failures introduced as part of the activity.An example is activities where work permits, self-controlof work, and third party control of work are demanded.3.
Scheduled activities, e.g., inspection aimed to revealcorrosion.Continuous mode of operation
Target frequency of dangerous failures to perform the
SIF (per hour)
X10�9 to o10�8
X10�8 to o10�7
X10�7 to o10�6
X10�6 to o10�5
ARTICLE IN PRESSS. Sklet / Journal of Loss Prevention in the Process Industries ] (]]]]) ]]]–]]]12
Implementation of safety barriers may have adverseeffects like increased costs, need for maintenance, and
introduction of new hazards. These adverse effects shouldbe addressed as part of a total analysis of safety barriers,but they are not further discussed in this paper. Some ofthese aspects, as loss of production regularity andmaintenance, are focused in the PDS-method (Hokstad &Corneliussen, 2003) where a measure for quantifying lossof production regularity is the spurious trip rate.5. Conclusions
The concept of safety barriers is presented and discussedin the paper. The results are based on experience fromseveral research projects focusing on safety barriers and areview of relevant literature. No common terminologyapplicable crosswise between sectors and application areashas been found, and a set of definitions is thereforeproposed in the paper.
Safety barriers are defined as physical and/or non-physical means planned to prevent, control, or mitigateundesired events or accidents. It is practical to distinguishbetween the barrier functions and the barrier systems thatrealize these functions.
Several ways for classification of safety barriers exist.Barrier functions may be classified as preventive, control-ling, or mitigating. Barrier systems may be classified inseveral dimensions, and some main dimensions are; activeversus passive, physical/technical versus human/opera-tional, continuously functioning/on-line versus activated/off-line, and permanent versus temporary.
It is recommended to address the following attributes tocharacterize the performance of safety barriers: (a)functionality/effectiveness, (b) reliability/availability, (c)response time, (d) robustness, and (e) triggering event orcondition. For some types of barriers, not all the attributesare relevant or necessary in order to describe the barrierperformance.
The paper improves the understanding of the concept ofsafety barriers. The results are valuable as a basis foridentification, description, development of requirements to,and understanding of the effect of the safety barriers withinthe field of industrial safety. The results with respect tosafety barriers in the paper will primarily be useful for theNorwegian oil industry in their effort to fulfil therequirements from PSA. However, the results may alsobe applied in other industries (e.g., the process industry)and application areas (e.g., the transport sector) in theireffort to reduce the risk.
References
Andersen, H., Casal, J., Dandrieux, A., Debray, B., De Dianous, V.,
Duijm, N. J., et al. (2004). ARAMIS—user guide. EC Contract number
EVG1-CT-2001-00036.
Aven, T., Sklet, S., & Vinnem, J. E. (2005). Barrier and operational risk
analysis of hydrocarbon releases (BORA-Release); Part I. Method
description. Journal of Hazardous Materials, submitted for publica-
tion.
Bento, J.-P. (2003). Review from an MTO-perspective of five investigation
reports from BP (Draft). Norway: Stavanger.
Bodsberg, L. (1994). Reliability quantification of control and safety
systems: the PDS-II method. Trondheim: SINTEF Safety and
Reliability.
CCPS. (1993). Guidelines for safe automation of chemical processes. New
York: Center for Chemical Process Safety of the American Institute of
Chemical Engineers.
CCPS. (2001). Layer of protection analysis simplified process risk
assessment. New York: Center for Chemical Process Safety of the
American Institute of Chemical Engineers.
Corneliussen, K., & Sklet, S. (2003). Challenges related to surveillance of
safety functions. In ESREL 2003. Maastricht, The Netherlands:
Balkema.
DoE. (1997). Implementation guide for use with DOE Order 225.1A,
accident Investigation, DOE G 225.1A-1, Rev. 1. Washington, DC: US
Department of Energy (DOE).
DoE. (1999). Conducting accident investigations DOE workbook, revision 2.
Washington, DC: US Department of Energy.
Duijm, N. J., Andersen, H. B., Hale, A., Goossens, L., & Hourtolou, D.
(2004). Evaluating and managing safety barriers in major hazard
plants. In PSAM 7—ESREL ’04, Berlin, Germany.
Duijm, N. J., Madsen, M. D., Andersen, H. B., Hale, A., Goossens, L.,
Londiche, H., et al. (2003). Assessing the effect of safety management
efficiency on industrial risk. In ESREL 2003. Maastricht: Balkema.
EC (1996). Council Directive 96/82/EC of 9 December 1996 on the control
of major-accident hazards involving dangerous substances (Seveso
II-directive).
EC (1998). Directive 98/37/EC of the European Parliament and of the
Council of 22 June 1998 on the approximation of the laws of the
Member States relating to machinery as amended by Directive 98/79/
EC (The Machinery Directive).
Fleming, K. N., & Silady, F. A. (2002). A risk informed defense-in-depth
framework for existing and advanced reactors. Reliability Engineering
& System Safety, 78(3), 205–225.
Gibson, J. (1961). The contribution of experimental psychology to the
formulation of the problem of safety. In Behavioural Approaches to
Accident Research. New York: Association for the Aid of Crippled
Children.
Goossens, L., & Hourtolou, D. (2003). What is a barrier? ARAMIS-
working document.
Haddon, W. J. (1980). The basic strategies for reducing damage from
hazards of all kinds. Hazard Prevention, September–October
(pp. 8–12).
Hale, A. (2003). Note on barriers and delivery systems. In PRISM
conference, Athens.
Hale, A., Goossens, L., Ale, B., Bellamy, L., Post, J., Oh, J., et al. (2004).
Managing safety barriers and controls at the workplace. In
PSAM 7-ESREL ’04, Berlin.
Harms-Ringdahl, L. (2000). Assessment of safety function at an industrial
workplace—A case study. In ESREL 2000. Edinburgh: Balkema.
Harms-Ringdahl, L. (2003). Assessing safety functions—Results
from a case study at an industrial workplace. Safety Science, 41(8),
701–720.
Hokstad, P., & Corneliussen, K. (2003). Reliability prediction method for
safety instrumented systems: PDS method handbook. Trondheim:
SINTEF Industrial Management Safety and Reliability.
Hokstad, P., Vatn, J., Aven, T., & Sørum, M. (2003). Use of risk
acceptance criteria in Norwegian offshore industry: dilemmas and
challenges. In ESREL 2003. Maastricht: Balkema Publishers.
Holand, P. (1997). Offshore blowouts: Causes and control. Houston, Tex:
Gulf Publ. Co.
Hollnagel, E. (1995). The art of efficient man–machine interaction:
Improving the coupling between man and machine. In J.-M. Hoc,
P. C. Cacciabue, & E. Hollnagel (Eds.), Cognition & Human–Computer
Cooperation. Hillsdale, NJ: Lawrence Erlbaum Associates Inc.
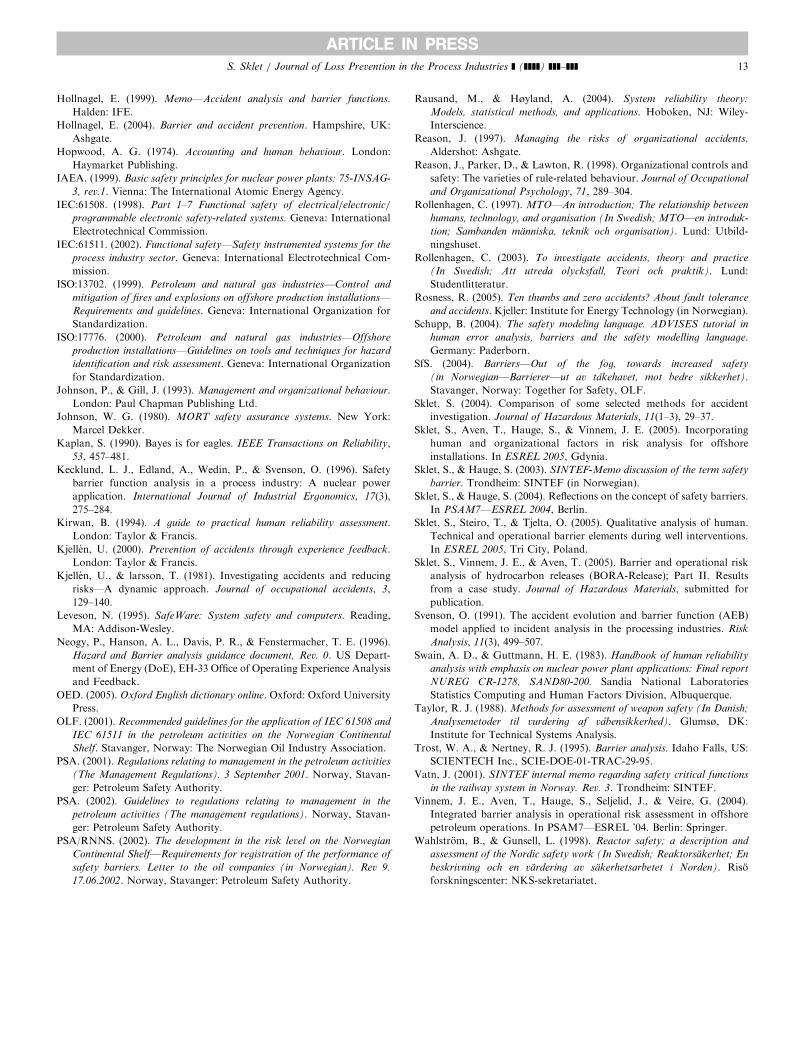
ARTICLE IN PRESSS. Sklet / Journal of Loss Prevention in the Process Industries ] (]]]]) ]]]–]]] 13
Hollnagel, E. (1999). Memo—Accident analysis and barrier functions.
Halden: IFE.
Hollnagel, E. (2004). Barrier and accident prevention. Hampshire, UK:
Ashgate.
Hopwood, A. G. (1974). Accounting and human behaviour. London:
Haymarket Publishing.
IAEA. (1999). Basic safety principles for nuclear power plants: 75-INSAG-
3, rev.1. Vienna: The International Atomic Energy Agency.
IEC:61508. (1998). Part 1–7 Functional safety of electrical/electronic/
programmable electronic safety-related systems. Geneva: International
Electrotechnical Commission.
IEC:61511. (2002). Functional safety—Safety instrumented systems for the
process industry sector. Geneva: International Electrotechnical Com-
mission.
ISO:13702. (1999). Petroleum and natural gas industries—Control and
mitigation of fires and explosions on offshore production installations—
Requirements and guidelines. Geneva: International Organization for
Standardization.
ISO:17776. (2000). Petroleum and natural gas industries—Offshore
production installations—Guidelines on tools and techniques for hazard
identification and risk assessment. Geneva: International Organization
for Standardization.
Johnson, P., & Gill, J. (1993). Management and organizational behaviour.
London: Paul Chapman Publishing Ltd.
Johnson, W. G. (1980). MORT safety assurance systems. New York:
Marcel Dekker.
Kaplan, S. (1990). Bayes is for eagles. IEEE Transactions on Reliability,
53, 457–481.
Kecklund, L. J., Edland, A., Wedin, P., & Svenson, O. (1996). Safety
barrier function analysis in a process industry: A nuclear power
application. International Journal of Industrial Ergonomics, 17(3),
275–284.
Kirwan, B. (1994). A guide to practical human reliability assessment.
London: Taylor & Francis.
Kjellen, U. (2000). Prevention of accidents through experience feedback.
London: Taylor & Francis.
Kjellen, U., & larsson, T. (1981). Investigating accidents and reducing
risks—A dynamic approach. Journal of occupational accidents, 3,
129–140.
Leveson, N. (1995). SafeWare: System safety and computers. Reading,
MA: Addison-Wesley.
Neogy, P., Hanson, A. L., Davis, P. R., & Fenstermacher, T. E. (1996).
Hazard and Barrier analysis guidance document, Rev. 0. US Depart-
ment of Energy (DoE), EH-33 Office of Operating Experience Analysis
and Feedback.
OED. (2005). Oxford English dictionary online. Oxford: Oxford University
Press.
OLF. (2001). Recommended guidelines for the application of IEC 61508 and
IEC 61511 in the petroleum activities on the Norwegian Continental
Shelf. Stavanger, Norway: The Norwegian Oil Industry Association.
PSA. (2001). Regulations relating to management in the petroleum activities
(The Management Regulations). 3 September 2001. Norway, Stavan-
ger: Petroleum Safety Authority.
PSA. (2002). Guidelines to regulations relating to management in the
petroleum activities (The management regulations). Norway, Stavan-
ger: Petroleum Safety Authority.
PSA/RNNS. (2002). The development in the risk level on the Norwegian
Continental Shelf—Requirements for registration of the performance of
safety barriers. Letter to the oil companies (in Norwegian). Rev 9.
17.06.2002. Norway, Stavanger: Petroleum Safety Authority.
Rausand, M., & Høyland, A. (2004). System reliability theory:
Models, statistical methods, and applications. Hoboken, NJ: Wiley-
Interscience.
Reason, J. (1997). Managing the risks of organizational accidents.
Aldershot: Ashgate.
Reason, J., Parker, D., & Lawton, R. (1998). Organizational controls and
safety: The varieties of rule-related behaviour. Journal of Occupational
and Organizational Psychology, 71, 289–304.
Rollenhagen, C. (1997). MTO—An introduction; The relationship between
humans, technology, and organisation (In Swedish; MTO—en introduk-
tion; Sambanden manniska, teknik och organisation). Lund: Utbild-
ningshuset.
Rollenhagen, C. (2003). To investigate accidents, theory and practice
(In Swedish; Att utreda olycksfall, Teori och praktik). Lund:
Studentlitteratur.
Rosness, R. (2005). Ten thumbs and zero accidents? About fault tolerance
and accidents. Kjeller: Institute for Energy Technology (in Norwegian).
Schupp, B. (2004). The safety modeling language. ADVISES tutorial in
human error analysis, barriers and the safety modelling language.
Germany: Paderborn.
SfS. (2004). Barriers—Out of the fog, towards increased safety
(in Norwegian—Barrierer—ut av takehavet, mot bedre sikkerhet).
Stavanger, Norway: Together for Safety, OLF.
Sklet, S. (2004). Comparison of some selected methods for accident
investigation. Journal of Hazardous Materials, 11(1–3), 29–37.
Sklet, S., Aven, T., Hauge, S., & Vinnem, J. E. (2005). Incorporating
human and organizational factors in risk analysis for offshore
installations. In ESREL 2005, Gdynia.
Sklet, S., & Hauge, S. (2003). SINTEF-Memo discussion of the term safety
barrier. Trondheim: SINTEF (in Norwegian).
Sklet, S., & Hauge, S. (2004). Reflections on the concept of safety barriers.
In PSAM7—ESREL 2004, Berlin.
Sklet, S., Steiro, T., & Tjelta, O. (2005). Qualitative analysis of human.
Technical and operational barrier elements during well interventions.
In ESREL 2005, Tri City, Poland.
Sklet, S., Vinnem, J. E., & Aven, T. (2005). Barrier and operational risk
analysis of hydrocarbon releases (BORA-Release); Part II. Results
from a case study. Journal of Hazardous Materials, submitted for
publication.
Svenson, O. (1991). The accident evolution and barrier function (AEB)
model applied to incident analysis in the processing industries. Risk
Analysis, 11(3), 499–507.
Swain, A. D., & Guttmann, H. E. (1983). Handbook of human reliability
analysis with emphasis on nuclear power plant applications: Final report
NUREG CR-1278, SAND80-200. Sandia National Laboratories
Statistics Computing and Human Factors Division, Albuquerque.
Taylor, R. J. (1988). Methods for assessment of weapon safety (In Danish;
Analysemetoder til vurdering af vabensikkerhed). Glumsø, DK:
Institute for Technical Systems Analysis.
Trost, W. A., & Nertney, R. J. (1995). Barrier analysis. Idaho Falls, US:
SCIENTECH Inc., SCIE-DOE-01-TRAC-29-95.
Vatn, J. (2001). SINTEF internal memo regarding safety critical functions
in the railway system in Norway. Rev. 3. Trondheim: SINTEF.
Vinnem, J. E., Aven, T., Hauge, S., Seljelid, J., & Veire, G. (2004).
Integrated barrier analysis in operational risk assessment in offshore
petroleum operations. In PSAM7—ESREL ’04. Berlin: Springer.
Wahlstrom, B., & Gunsell, L. (1998). Reactor safety; a description and
assessment of the Nordic safety work (In Swedish; Reaktorsakerhet; En
beskrivning och en vardering av sakerhetsarbetet i Norden). Riso
forskningscenter: NKS-sekretariatet.

Thesis – Part II Papers
Paper 2
Hydrocarbon releases on oil and gas production platforms: Release scenarios and safety barriers
Snorre Sklet Journal of Loss Prevention in the Process Industries Article in press, available online 18 January 2006

ARTICLE IN PRESS
0950-4230/$ - se
doi:10.1016/j.jlp
�Tel.: +47 73
E-mail addr
Journal of Loss Prevention in the Process Industries ] (]]]]) ]]]–]]]
www.elsevier.com/locate/jlp
Hydrocarbon releases on oil and gas production platforms:Release scenarios and safety barriers
Snorre Sklet�
Department of Production and Quality Engineering, The Norwegian University of Science and Technology (NTNU), NO-7491 Trondheim, Norway
Received 27 September 2005; received in revised form 2 December 2005; accepted 4 December 2005
Abstract
The main objective of this paper is to present and discuss a set of scenarios that may lead to hydrocarbon releases on offshore oil
and gas production platforms. Each release scenario is described by an initiating event (i.e., a deviation), the barrier functions introduced
to prevent the initiating event from developing into a release, and how the barrier functions are implemented in terms of barrier
systems. Both technical and human/operational safety barriers are considered. The initiating events are divided into five main categories:
(1) human and operational errors, (2) technical failures, (3) process upsets, (4) external events or loads, and (5) latent failures
from design. The release scenarios may be used as basis for analyses of: (a) the performance of safety barriers introduced to
prevent hydrocarbon releases on specific platforms, (b) the platform specific hydrocarbon release frequencies in future quantitative risk
analyses, (c) the effect on the total hydrocarbon release frequency of the safety barriers and risk reducing measures (or risk increasing
changes).
r 2005 Elsevier Ltd. All rights reserved.
Keywords: Hydrocarbon release; Loss of containment; Safety barrier; Risk analysis; Major accident
1. Introduction
Hydrocarbon releases are a main contributor to themajor accident risk on oil and gas production platforms(e.g., see Øien, 2001). Fig. 1 shows the total number ofhydrocarbon releases with a release rate higher than 0.1 kg/sin the process area on platforms on the NorwegianContinental Shelf in the period 1996–2004 (PSA, 2005).Until 1999, there was a declining trend, followed by someyears with fluctuations. The total number of hydrocarbonreleases has been reduced both in 2003 and 2004. Thenumber of hydrocarbon releases with rate higher than 1 kg/shas not decreased to the same degree (PSA, 2005). Thereduction from 2003 to 2004 has mainly taken place in thelowest release rate group (0.1–1kg/s). The data shows largevariations in the frequency of hydrocarbon releases on thevarious platforms, which indicates a potential for reducingthe total release frequency. Data from 2001 to 2004 shows
e front matter r 2005 Elsevier Ltd. All rights reserved.
.2005.12.003
59 29 02; fax: +47 73 59 28 96.
ess: [email protected].
that about 40% of the hydrocarbon releases occur due toerrors during manual work. About 32% occur duringnormal production, while the rest (27%) take place inconnection with spurious trips and start-up and shutdownof the process.In 2003, the operators on the Norwegian Continental
Shelf were challenged by the Petroleum Safety AuthorityNorway (PSA) to set a target for reducing the frequency ofhydrocarbon releases and to identify improvement mea-sures through a joint industry project. As a follow-up ofthis initiative, the Norwegian Oil Industry Association(OLF) initiated a project with the objective to reduce by50% the number of hydrocarbon releases with rate higherthan 0.1 kg/s by the end of 2005 (measured against theaverage in the period 2000–2002). All companies havefurther established a vision of no gas releases (OLF, 2004).The frequency of hydrocarbon releases in offshore
quantitative risk analyses (QRA) has traditionally beendetermined by the use of generic frequencies of small,medium, and large hydrocarbon releases from equipment,systems, and areas. In some cases, platform specific release
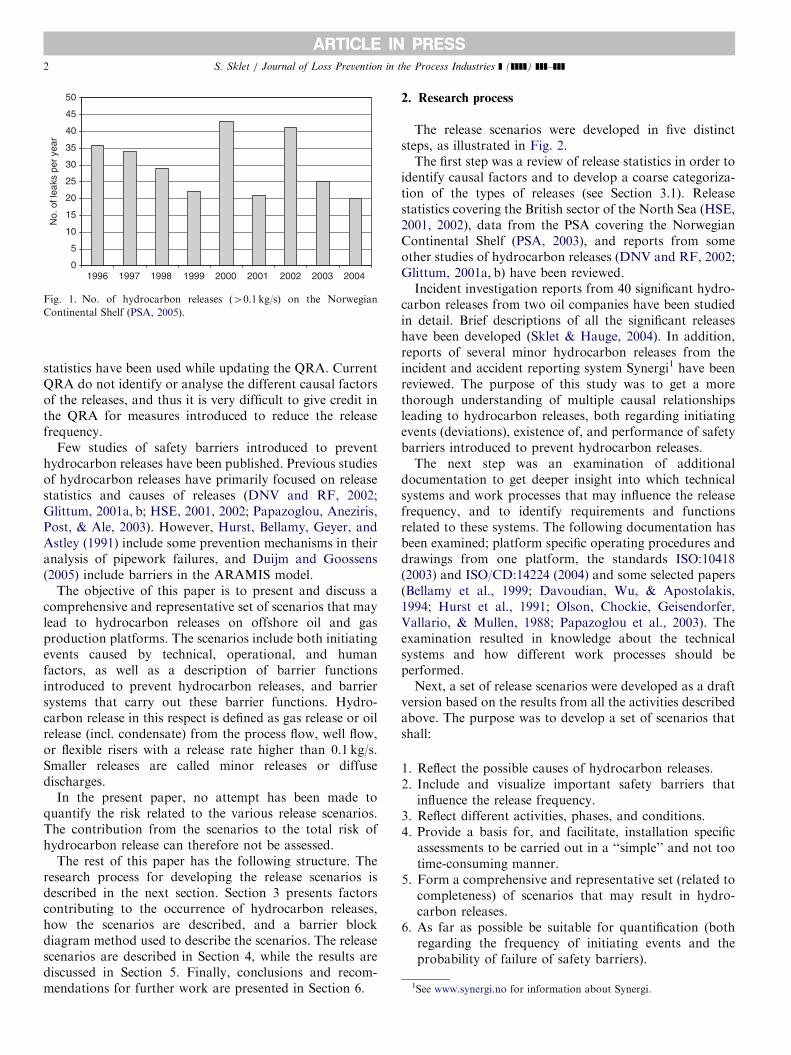
ARTICLE IN PRESS
0
5
10
15
20
25
30
35
40
45
50
1996 1997 1998 1999 2000 2001 2002 2003 2004
No.
of l
eaks
per
yea
r
Fig. 1. No. of hydrocarbon releases (40.1 kg/s) on the Norwegian
Continental Shelf (PSA, 2005).
1See www.synergi.no for information about Synergi.
S. Sklet / Journal of Loss Prevention in the Process Industries ] (]]]]) ]]]–]]]2
statistics have been used while updating the QRA. CurrentQRA do not identify or analyse the different causal factorsof the releases, and thus it is very difficult to give credit inthe QRA for measures introduced to reduce the releasefrequency.
Few studies of safety barriers introduced to preventhydrocarbon releases have been published. Previous studiesof hydrocarbon releases have primarily focused on releasestatistics and causes of releases (DNV and RF, 2002;Glittum, 2001a, b; HSE, 2001, 2002; Papazoglou, Aneziris,Post, & Ale, 2003). However, Hurst, Bellamy, Geyer, andAstley (1991) include some prevention mechanisms in theiranalysis of pipework failures, and Duijm and Goossens(2005) include barriers in the ARAMIS model.
The objective of this paper is to present and discuss acomprehensive and representative set of scenarios that maylead to hydrocarbon releases on offshore oil and gasproduction platforms. The scenarios include both initiatingevents caused by technical, operational, and humanfactors, as well as a description of barrier functionsintroduced to prevent hydrocarbon releases, and barriersystems that carry out these barrier functions. Hydro-carbon release in this respect is defined as gas release or oilrelease (incl. condensate) from the process flow, well flow,or flexible risers with a release rate higher than 0.1 kg/s.Smaller releases are called minor releases or diffusedischarges.
In the present paper, no attempt has been made toquantify the risk related to the various release scenarios.The contribution from the scenarios to the total risk ofhydrocarbon release can therefore not be assessed.
The rest of this paper has the following structure. Theresearch process for developing the release scenarios isdescribed in the next section. Section 3 presents factorscontributing to the occurrence of hydrocarbon releases,how the scenarios are described, and a barrier blockdiagram method used to describe the scenarios. The releasescenarios are described in Section 4, while the results arediscussed in Section 5. Finally, conclusions and recom-mendations for further work are presented in Section 6.
2. Research process
The release scenarios were developed in five distinctsteps, as illustrated in Fig. 2.The first step was a review of release statistics in order to
identify causal factors and to develop a coarse categoriza-tion of the types of releases (see Section 3.1). Releasestatistics covering the British sector of the North Sea (HSE,2001, 2002), data from the PSA covering the NorwegianContinental Shelf (PSA, 2003), and reports from someother studies of hydrocarbon releases (DNV and RF, 2002;Glittum, 2001a, b) have been reviewed.Incident investigation reports from 40 significant hydro-
carbon releases from two oil companies have been studiedin detail. Brief descriptions of all the significant releaseshave been developed (Sklet & Hauge, 2004). In addition,reports of several minor hydrocarbon releases from theincident and accident reporting system Synergi1 have beenreviewed. The purpose of this study was to get a morethorough understanding of multiple causal relationshipsleading to hydrocarbon releases, both regarding initiatingevents (deviations), existence of, and performance of safetybarriers introduced to prevent hydrocarbon releases.The next step was an examination of additional
documentation to get deeper insight into which technicalsystems and work processes that may influence the releasefrequency, and to identify requirements and functionsrelated to these systems. The following documentation hasbeen examined; platform specific operating procedures anddrawings from one platform, the standards ISO:10418(2003) and ISO/CD:14224 (2004) and some selected papers(Bellamy et al., 1999; Davoudian, Wu, & Apostolakis,1994; Hurst et al., 1991; Olson, Chockie, Geisendorfer,Vallario, & Mullen, 1988; Papazoglou et al., 2003). Theexamination resulted in knowledge about the technicalsystems and how different work processes should beperformed.Next, a set of release scenarios were developed as a draft
version based on the results from all the activities describedabove. The purpose was to develop a set of scenarios thatshall:
1.
Reflect the possible causes of hydrocarbon releases. 2. Include and visualize important safety barriers thatinfluence the release frequency.
3. Reflect different activities, phases, and conditions. 4. Provide a basis for, and facilitate, installation specificassessments to be carried out in a ‘‘simple’’ and not tootime-consuming manner.
5.
Form a comprehensive and representative set (related tocompleteness) of scenarios that may result in hydro-carbon releases.6.
As far as possible be suitable for quantification (bothregarding the frequency of initiating events and theprobability of failure of safety barriers).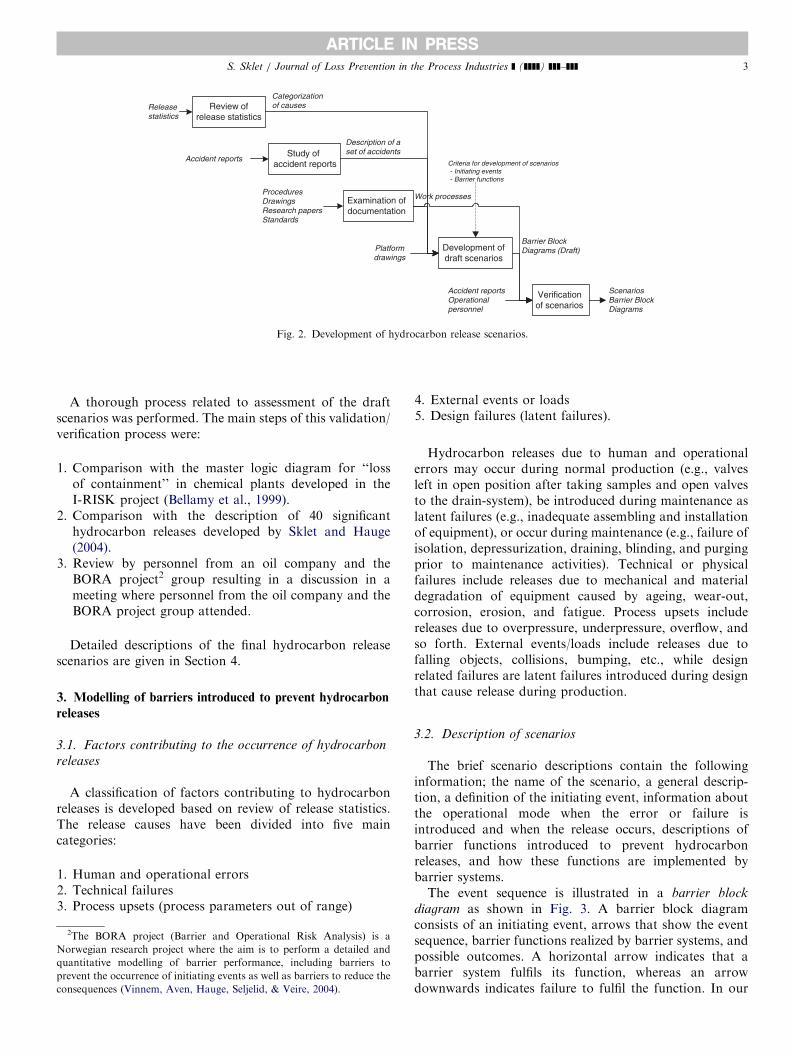
ARTICLE IN PRESS
Review ofrelease statistics
Study ofaccident reports
Examination ofdocumentation
Development ofdraft scenarios
Release statistics
Accident reports
Categorization of causes
Description of a set of accidents
Work processes
Verificationof scenarios
ProceduresDrawingsResearch papersStandards
Barrier Block Diagrams (Draft)
Accident reportsOperationalpersonnel
Platformdrawings
ScenariosBarrier Block Diagrams
Criteria for development of scenarios- Initiating events- Barrier functions
Fig. 2. Development of hydrocarbon release scenarios.
S. Sklet / Journal of Loss Prevention in the Process Industries ] (]]]]) ]]]–]]] 3
A thorough process related to assessment of the draftscenarios was performed. The main steps of this validation/
verification process were:1.
2
No
qua
pre
con
Comparison with the master logic diagram for ‘‘lossof containment’’ in chemical plants developed in theI-RISK project (Bellamy et al., 1999).
2.
Comparison with the description of 40 significanthydrocarbon releases developed by Sklet and Hauge(2004).3.
Review by personnel from an oil company and theBORA project2 group resulting in a discussion in ameeting where personnel from the oil company and theBORA project group attended.Detailed descriptions of the final hydrocarbon releasescenarios are given in Section 4.
3. Modelling of barriers introduced to prevent hydrocarbon
releases
3.1. Factors contributing to the occurrence of hydrocarbon
releases
A classification of factors contributing to hydrocarbonreleases is developed based on review of release statistics.The release causes have been divided into five maincategories:
1.
Human and operational errors 2. Technical failures 3. Process upsets (process parameters out of range)The BORA project (Barrier and Operational Risk Analysis) is a
rwegian research project where the aim is to perform a detailed and
ntitative modelling of barrier performance, including barriers to
vent the occurrence of initiating events as well as barriers to reduce the
sequences (Vinnem, Aven, Hauge, Seljelid, & Veire, 2004).
4.
External events or loads 5. Design failures (latent failures).Hydrocarbon releases due to human and operationalerrors may occur during normal production (e.g., valvesleft in open position after taking samples and open valvesto the drain-system), be introduced during maintenance aslatent failures (e.g., inadequate assembling and installationof equipment), or occur during maintenance (e.g., failure ofisolation, depressurization, draining, blinding, and purgingprior to maintenance activities). Technical or physicalfailures include releases due to mechanical and materialdegradation of equipment caused by ageing, wear-out,corrosion, erosion, and fatigue. Process upsets includereleases due to overpressure, underpressure, overflow, andso forth. External events/loads include releases due tofalling objects, collisions, bumping, etc., while designrelated failures are latent failures introduced during designthat cause release during production.
3.2. Description of scenarios
The brief scenario descriptions contain the followinginformation; the name of the scenario, a general descrip-tion, a definition of the initiating event, information aboutthe operational mode when the error or failure isintroduced and when the release occurs, descriptions ofbarrier functions introduced to prevent hydrocarbonreleases, and how these functions are implemented bybarrier systems.The event sequence is illustrated in a barrier block
diagram as shown in Fig. 3. A barrier block diagramconsists of an initiating event, arrows that show the eventsequence, barrier functions realized by barrier systems, andpossible outcomes. A horizontal arrow indicates that abarrier system fulfils its function, whereas an arrowdownwards indicates failure to fulfil the function. In our
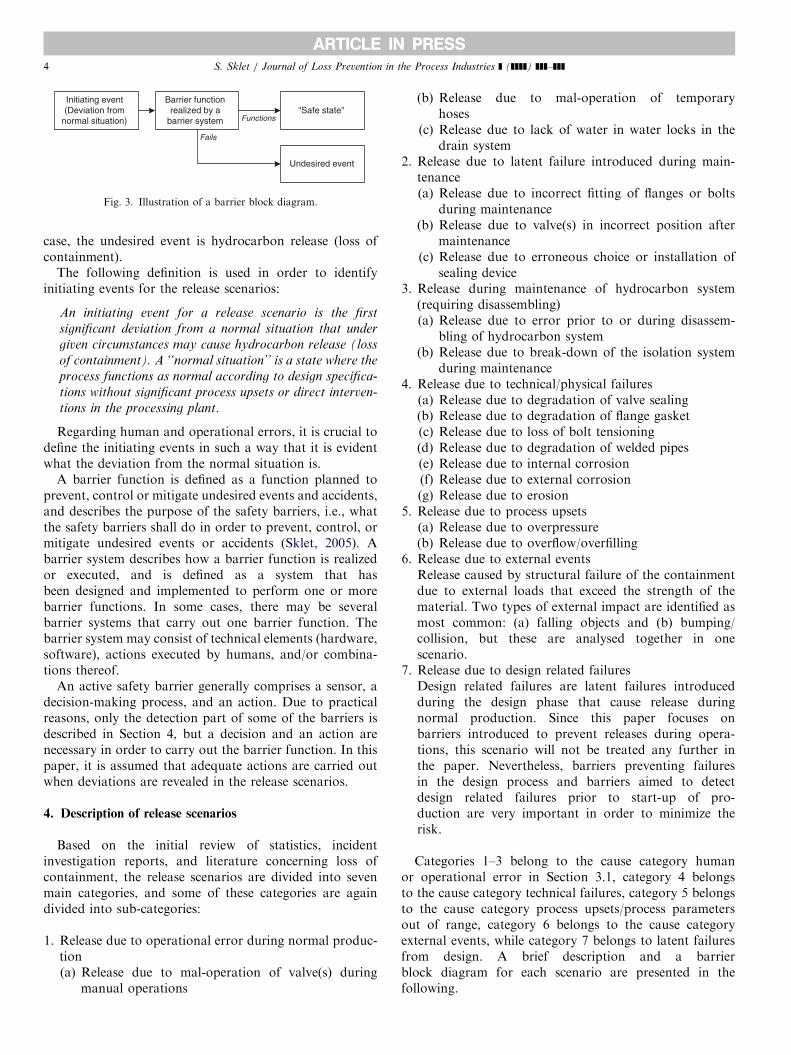
ARTICLE IN PRESS
Initiating event(Deviation from
normal situation)
Undesired event
"Safe state"Barrier function
realized by a barrier system Functions
Fails
Fig. 3. Illustration of a barrier block diagram.
S. Sklet / Journal of Loss Prevention in the Process Industries ] (]]]]) ]]]–]]]4
case, the undesired event is hydrocarbon release (loss ofcontainment).
The following definition is used in order to identifyinitiating events for the release scenarios:
An initiating event for a release scenario is the first
significant deviation from a normal situation that under
given circumstances may cause hydrocarbon release (loss
of containment). A ‘‘normal situation’’ is a state where the
process functions as normal according to design specifica-
tions without significant process upsets or direct interven-
tions in the processing plant.
Regarding human and operational errors, it is crucial todefine the initiating events in such a way that it is evidentwhat the deviation from the normal situation is.
A barrier function is defined as a function planned toprevent, control or mitigate undesired events and accidents,and describes the purpose of the safety barriers, i.e., whatthe safety barriers shall do in order to prevent, control, ormitigate undesired events or accidents (Sklet, 2005). Abarrier system describes how a barrier function is realizedor executed, and is defined as a system that hasbeen designed and implemented to perform one or morebarrier functions. In some cases, there may be severalbarrier systems that carry out one barrier function. Thebarrier system may consist of technical elements (hardware,software), actions executed by humans, and/or combina-tions thereof.
An active safety barrier generally comprises a sensor, adecision-making process, and an action. Due to practicalreasons, only the detection part of some of the barriers isdescribed in Section 4, but a decision and an action arenecessary in order to carry out the barrier function. In thispaper, it is assumed that adequate actions are carried outwhen deviations are revealed in the release scenarios.
4. Description of release scenarios
Based on the initial review of statistics, incidentinvestigation reports, and literature concerning loss ofcontainment, the release scenarios are divided into sevenmain categories, and some of these categories are againdivided into sub-categories:
1.
Release due to operational error during normal produc-tion(a) Release due to mal-operation of valve(s) duringmanual operations
(b) Release due to mal-operation of temporaryhoses
(c) Release due to lack of water in water locks in thedrain system
2.
Release due to latent failure introduced during main-tenance(a) Release due to incorrect fitting of flanges or boltsduring maintenance(b) Release due to valve(s) in incorrect position after
maintenance(c) Release due to erroneous choice or installation of
sealing device
3. Release during maintenance of hydrocarbon system(requiring disassembling)(a) Release due to error prior to or during disassem-
bling of hydrocarbon system(b) Release due to break-down of the isolation system
during maintenance
4. Release due to technical/physical failures(a) Release due to degradation of valve sealing(b) Release due to degradation of flange gasket(c) Release due to loss of bolt tensioning(d) Release due to degradation of welded pipes(e) Release due to internal corrosion(f) Release due to external corrosion(g) Release due to erosion
5.
Release due to process upsets(a) Release due to overpressure(b) Release due to overflow/overfilling6.
Release due to external eventsRelease caused by structural failure of the containmentdue to external loads that exceed the strength of thematerial. Two types of external impact are identified asmost common: (a) falling objects and (b) bumping/collision, but these are analysed together in onescenario.7.
Release due to design related failuresDesign related failures are latent failures introducedduring the design phase that cause release duringnormal production. Since this paper focuses onbarriers introduced to prevent releases during opera-tions, this scenario will not be treated any further inthe paper. Nevertheless, barriers preventing failuresin the design process and barriers aimed to detectdesign related failures prior to start-up of pro-duction are very important in order to minimize therisk.Categories 1–3 belong to the cause category humanor operational error in Section 3.1, category 4 belongsto the cause category technical failures, category 5 belongsto the cause category process upsets/process parametersout of range, category 6 belongs to the cause categoryexternal events, while category 7 belongs to latent failuresfrom design. A brief description and a barrierblock diagram for each scenario are presented in thefollowing.
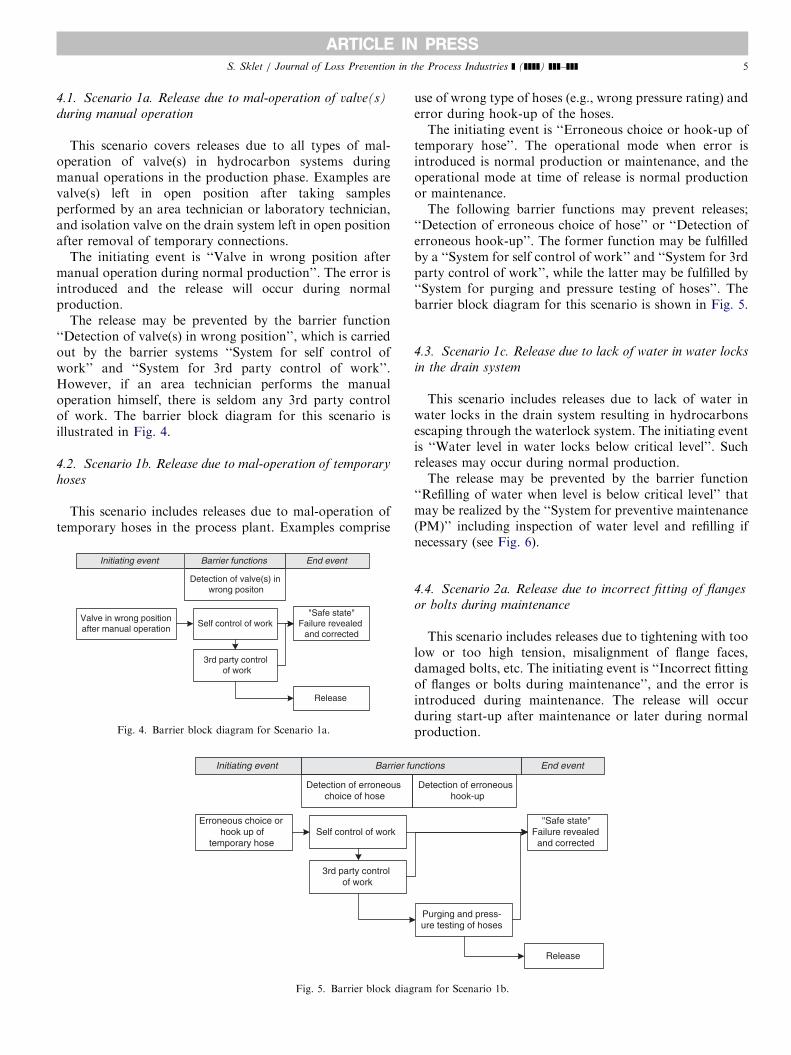
ARTICLE IN PRESSS. Sklet / Journal of Loss Prevention in the Process Industries ] (]]]]) ]]]–]]] 5
4.1. Scenario 1a. Release due to mal-operation of valve(s)
during manual operation
This scenario covers releases due to all types of mal-operation of valve(s) in hydrocarbon systems duringmanual operations in the production phase. Examples arevalve(s) left in open position after taking samplesperformed by an area technician or laboratory technician,and isolation valve on the drain system left in open positionafter removal of temporary connections.
The initiating event is ‘‘Valve in wrong position aftermanual operation during normal production’’. The error isintroduced and the release will occur during normalproduction.
The release may be prevented by the barrier function‘‘Detection of valve(s) in wrong position’’, which is carriedout by the barrier systems ‘‘System for self control ofwork’’ and ‘‘System for 3rd party control of work’’.However, if an area technician performs the manualoperation himself, there is seldom any 3rd party controlof work. The barrier block diagram for this scenario isillustrated in Fig. 4.
4.2. Scenario 1b. Release due to mal-operation of temporary
hoses
This scenario includes releases due to mal-operation oftemporary hoses in the process plant. Examples comprise
Valve in wrong position after manual operation
"Safe state"Failure revealed
and corrected
3rd party controlof work
Release
Self control of work
Barrier functions
Detection of valve(s) inwrong positon
End eventInitiating event
Fig. 4. Barrier block diagram for Scenario 1a.
Erroneous choice or hook up of
temporary hoseSelf control of work
3rd party controlof work
Barrier fu
Detection of erroneous choice of hose
Initiating event
Fig. 5. Barrier block diag
use of wrong type of hoses (e.g., wrong pressure rating) anderror during hook-up of the hoses.The initiating event is ‘‘Erroneous choice or hook-up of
temporary hose’’. The operational mode when error isintroduced is normal production or maintenance, and theoperational mode at time of release is normal productionor maintenance.The following barrier functions may prevent releases;
‘‘Detection of erroneous choice of hose’’ or ‘‘Detection oferroneous hook-up’’. The former function may be fulfilledby a ‘‘System for self control of work’’ and ‘‘System for 3rdparty control of work’’, while the latter may be fulfilled by‘‘System for purging and pressure testing of hoses’’. Thebarrier block diagram for this scenario is shown in Fig. 5.
4.3. Scenario 1c. Release due to lack of water in water locks
in the drain system
This scenario includes releases due to lack of water inwater locks in the drain system resulting in hydrocarbonsescaping through the waterlock system. The initiating eventis ‘‘Water level in water locks below critical level’’. Suchreleases may occur during normal production.The release may be prevented by the barrier function
‘‘Refilling of water when level is below critical level’’ thatmay be realized by the ‘‘System for preventive maintenance(PM)’’ including inspection of water level and refilling ifnecessary (see Fig. 6).
4.4. Scenario 2a. Release due to incorrect fitting of flanges
or bolts during maintenance
This scenario includes releases due to tightening with toolow or too high tension, misalignment of flange faces,damaged bolts, etc. The initiating event is ‘‘Incorrect fittingof flanges or bolts during maintenance’’, and the error isintroduced during maintenance. The release will occurduring start-up after maintenance or later during normalproduction.
"Safe state"Failure revealed and corrected
Release
Purging and press-ure testing of hoses
nctions End event
Detection of erroneous hook-up
ram for Scenario 1b.
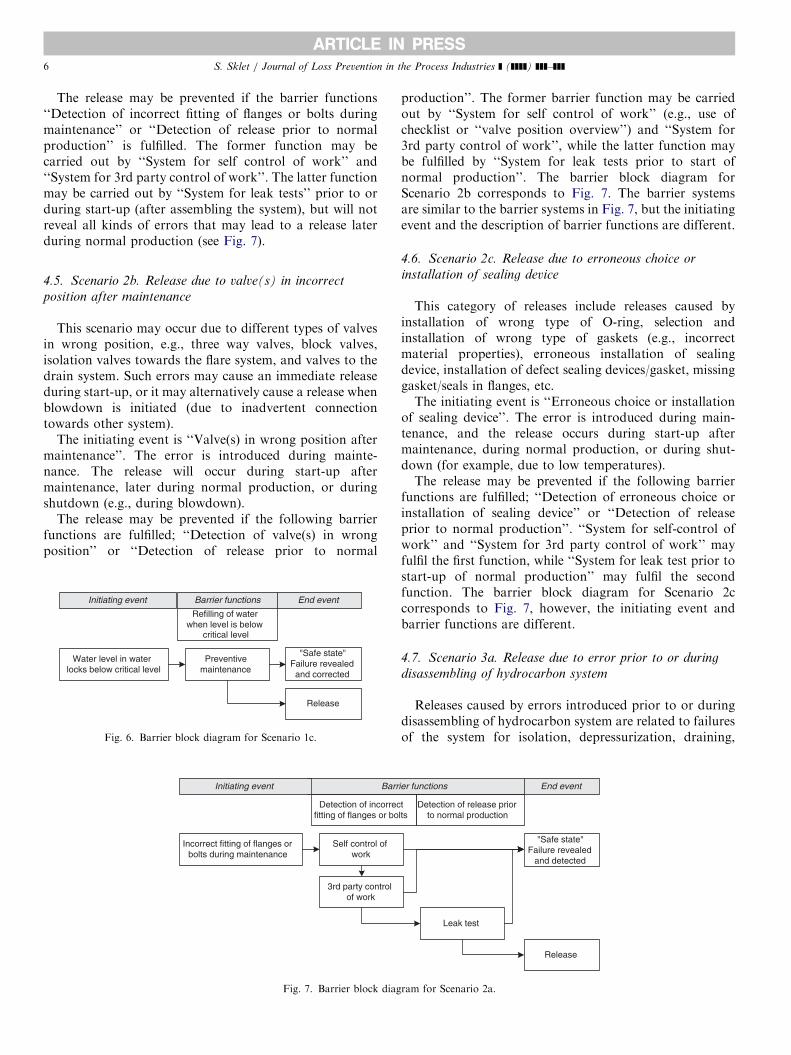
ARTICLE IN PRESSS. Sklet / Journal of Loss Prevention in the Process Industries ] (]]]]) ]]]–]]]6
The release may be prevented if the barrier functions‘‘Detection of incorrect fitting of flanges or bolts duringmaintenance’’ or ‘‘Detection of release prior to normalproduction’’ is fulfilled. The former function may becarried out by ‘‘System for self control of work’’ and‘‘System for 3rd party control of work’’. The latter functionmay be carried out by ‘‘System for leak tests’’ prior to orduring start-up (after assembling the system), but will notreveal all kinds of errors that may lead to a release laterduring normal production (see Fig. 7).
4.5. Scenario 2b. Release due to valve(s) in incorrect
position after maintenance
This scenario may occur due to different types of valvesin wrong position, e.g., three way valves, block valves,isolation valves towards the flare system, and valves to thedrain system. Such errors may cause an immediate releaseduring start-up, or it may alternatively cause a release whenblowdown is initiated (due to inadvertent connectiontowards other system).
The initiating event is ‘‘Valve(s) in wrong position aftermaintenance’’. The error is introduced during mainte-nance. The release will occur during start-up aftermaintenance, later during normal production, or duringshutdown (e.g., during blowdown).
The release may be prevented if the following barrierfunctions are fulfilled; ‘‘Detection of valve(s) in wrongposition’’ or ‘‘Detection of release prior to normal
"Safe state"Failure revealed and corrected
Release
Water level in waterlocks below critical level
Preventivemaintenance
Refilling of waterwhen level is below
critical level
Barrier functions End eventInitiating event
Fig. 6. Barrier block diagram for Scenario 1c.
Incorrect fitting of flanges orbolts during maintenance
3rd party controlof work
Self control ofwork
Barr
Detection of incorrecfitting of flanges or bo
Initiating event
Fig. 7. Barrier block diag
production’’. The former barrier function may be carriedout by ‘‘System for self control of work’’ (e.g., use ofchecklist or ‘‘valve position overview’’) and ‘‘System for3rd party control of work’’, while the latter function maybe fulfilled by ‘‘System for leak tests prior to start ofnormal production’’. The barrier block diagram forScenario 2b corresponds to Fig. 7. The barrier systemsare similar to the barrier systems in Fig. 7, but the initiatingevent and the description of barrier functions are different.
4.6. Scenario 2c. Release due to erroneous choice or
installation of sealing device
This category of releases include releases caused byinstallation of wrong type of O-ring, selection andinstallation of wrong type of gaskets (e.g., incorrectmaterial properties), erroneous installation of sealingdevice, installation of defect sealing devices/gasket, missinggasket/seals in flanges, etc.The initiating event is ‘‘Erroneous choice or installation
of sealing device’’. The error is introduced during main-tenance, and the release occurs during start-up aftermaintenance, during normal production, or during shut-down (for example, due to low temperatures).The release may be prevented if the following barrier
functions are fulfilled; ‘‘Detection of erroneous choice orinstallation of sealing device’’ or ‘‘Detection of releaseprior to normal production’’. ‘‘System for self-control ofwork’’ and ‘‘System for 3rd party control of work’’ mayfulfil the first function, while ‘‘System for leak test prior tostart-up of normal production’’ may fulfil the secondfunction. The barrier block diagram for Scenario 2ccorresponds to Fig. 7, however, the initiating event andbarrier functions are different.
4.7. Scenario 3a. Release due to error prior to or during
disassembling of hydrocarbon system
Releases caused by errors introduced prior to or duringdisassembling of hydrocarbon system are related to failuresof the system for isolation, depressurization, draining,
"Safe state"Failure revealed
and detected
Leak test
Release
ier functions
t lts
End event
Detection of release priorto normal production
ram for Scenario 2a.
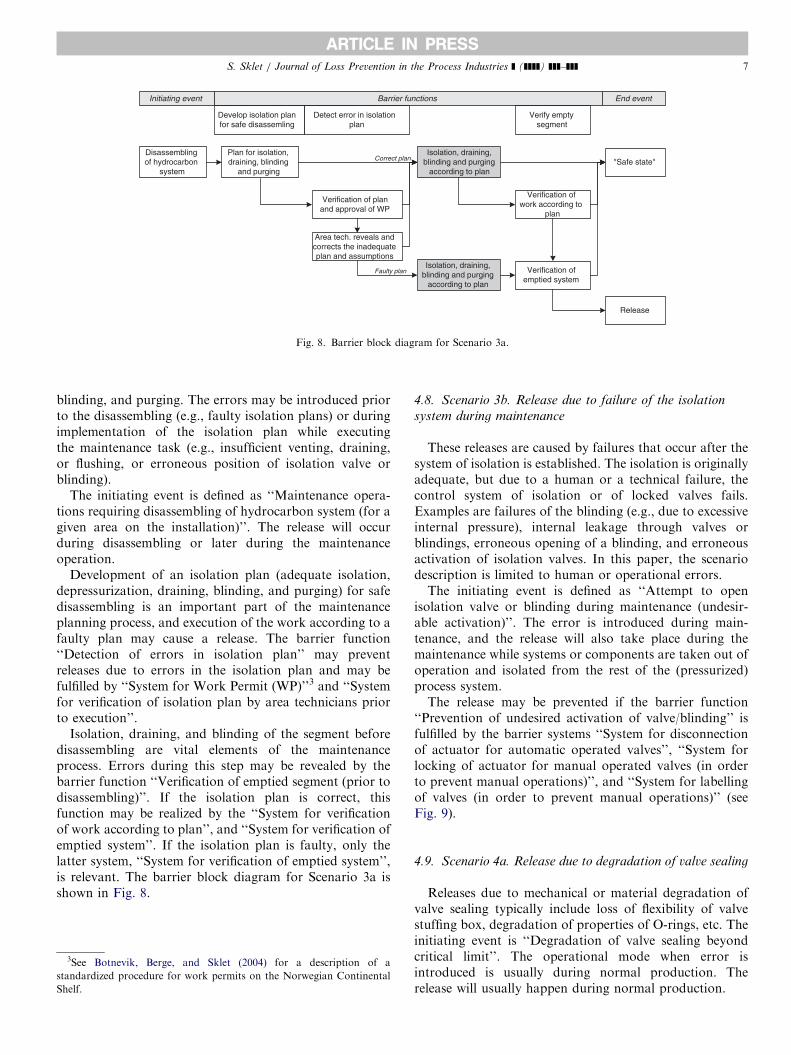
ARTICLE IN PRESS
Disassemblingof hydrocarbon
system
Isolation, draining,blinding and purging
according to plan
Verification of plan and approval of WP
Plan for isolation,draining, blinding
and purging"Safe state"
Verification ofwork according to
plan
Isolation, draining,blinding and purging
according to plan
Verification ofemptied system
Release
Area tech. reveals and corrects the inadequateplan and assumptions
Correct plan
Faulty plan
Barrier functions
Develop isolation plan for safe disassemling
End eventInitiating event
Detect error in isolation plan
Verify emptysegment
Fig. 8. Barrier block diagram for Scenario 3a.
S. Sklet / Journal of Loss Prevention in the Process Industries ] (]]]]) ]]]–]]] 7
blinding, and purging. The errors may be introduced priorto the disassembling (e.g., faulty isolation plans) or duringimplementation of the isolation plan while executingthe maintenance task (e.g., insufficient venting, draining,or flushing, or erroneous position of isolation valve orblinding).
The initiating event is defined as ‘‘Maintenance opera-tions requiring disassembling of hydrocarbon system (for agiven area on the installation)’’. The release will occurduring disassembling or later during the maintenanceoperation.
Development of an isolation plan (adequate isolation,depressurization, draining, blinding, and purging) for safedisassembling is an important part of the maintenanceplanning process, and execution of the work according to afaulty plan may cause a release. The barrier function‘‘Detection of errors in isolation plan’’ may preventreleases due to errors in the isolation plan and may befulfilled by ‘‘System for Work Permit (WP)’’3 and ‘‘Systemfor verification of isolation plan by area technicians priorto execution’’.
Isolation, draining, and blinding of the segment beforedisassembling are vital elements of the maintenanceprocess. Errors during this step may be revealed by thebarrier function ‘‘Verification of emptied segment (prior todisassembling)’’. If the isolation plan is correct, thisfunction may be realized by the ‘‘System for verificationof work according to plan’’, and ‘‘System for verification ofemptied system’’. If the isolation plan is faulty, only thelatter system, ‘‘System for verification of emptied system’’,is relevant. The barrier block diagram for Scenario 3a isshown in Fig. 8.
3See Botnevik, Berge, and Sklet (2004) for a description of a
standardized procedure for work permits on the Norwegian Continental
Shelf.
4.8. Scenario 3b. Release due to failure of the isolation
system during maintenance
These releases are caused by failures that occur after thesystem of isolation is established. The isolation is originallyadequate, but due to a human or a technical failure, thecontrol system of isolation or of locked valves fails.Examples are failures of the blinding (e.g., due to excessiveinternal pressure), internal leakage through valves orblindings, erroneous opening of a blinding, and erroneousactivation of isolation valves. In this paper, the scenariodescription is limited to human or operational errors.The initiating event is defined as ‘‘Attempt to open
isolation valve or blinding during maintenance (undesir-able activation)’’. The error is introduced during main-tenance, and the release will also take place during themaintenance while systems or components are taken out ofoperation and isolated from the rest of the (pressurized)process system.The release may be prevented if the barrier function
‘‘Prevention of undesired activation of valve/blinding’’ isfulfilled by the barrier systems ‘‘System for disconnectionof actuator for automatic operated valves’’, ‘‘System forlocking of actuator for manual operated valves (in orderto prevent manual operations)’’, and ‘‘System for labellingof valves (in order to prevent manual operations)’’ (seeFig. 9).
4.9. Scenario 4a. Release due to degradation of valve sealing
Releases due to mechanical or material degradation ofvalve sealing typically include loss of flexibility of valvestuffing box, degradation of properties of O-rings, etc. Theinitiating event is ‘‘Degradation of valve sealing beyondcritical limit’’. The operational mode when error isintroduced is usually during normal production. Therelease will usually happen during normal production.
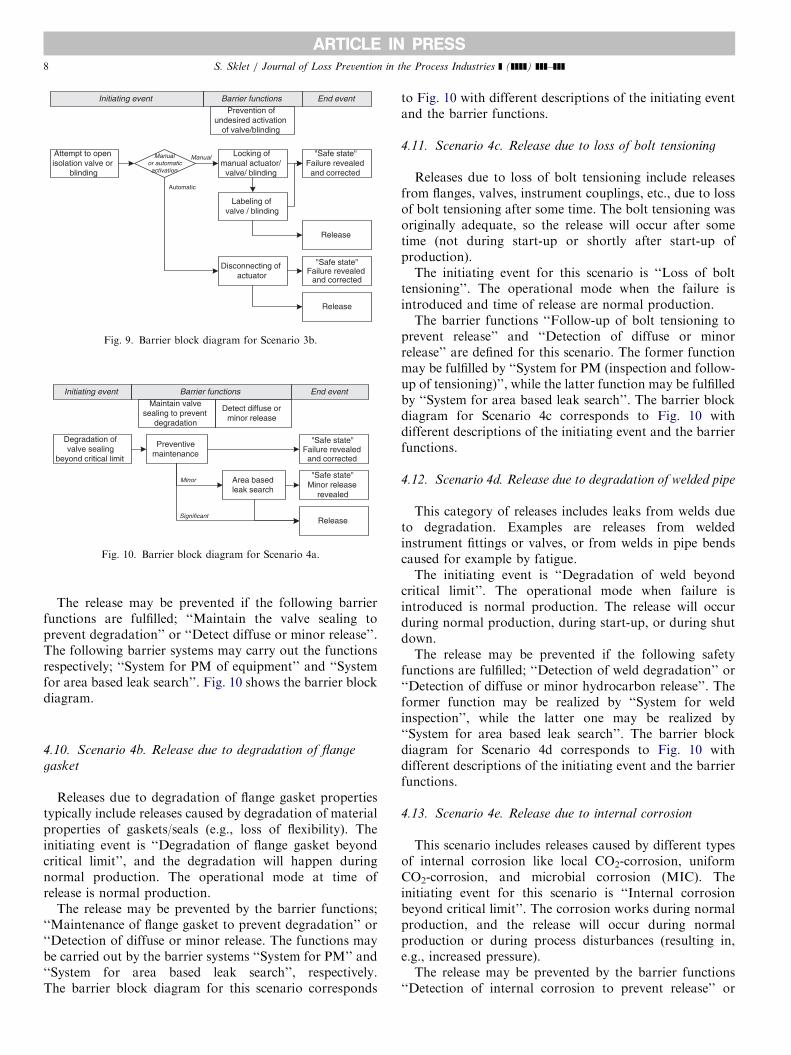
ARTICLE IN PRESS
Attempt to openisolation valve or
blinding
"Safe state"Failure revealed and corrected
Disconnecting ofactuator
Release
Labeling ofvalve / blinding
Locking ofmanual actuator/
valve/ blinding
"Safe state"Failure revealed
and corrected
Release
Automatic
ManualManual or automatic
activation
Barrier functions End eventInitiating eventPrevention of
undesired activation of valve/blinding
Fig. 9. Barrier block diagram for Scenario 3b.
Degradation ofvalve sealing
beyond critical limit
"Safe state"Failure revealed and corrected
Preventivemaintenance
Area based leak search
Release
"Safe state"Minor release
revealed
Significant
Minor
Barrier functionsMaintain valve
sealing to preventdegradation
End eventInitiating event
Detect diffuse orminor release
Fig. 10. Barrier block diagram for Scenario 4a.
S. Sklet / Journal of Loss Prevention in the Process Industries ] (]]]]) ]]]–]]]8
The release may be prevented if the following barrierfunctions are fulfilled; ‘‘Maintain the valve sealing toprevent degradation’’ or ‘‘Detect diffuse or minor release’’.The following barrier systems may carry out the functionsrespectively; ‘‘System for PM of equipment’’ and ‘‘Systemfor area based leak search’’. Fig. 10 shows the barrier blockdiagram.
4.10. Scenario 4b. Release due to degradation of flange
gasket
Releases due to degradation of flange gasket propertiestypically include releases caused by degradation of materialproperties of gaskets/seals (e.g., loss of flexibility). Theinitiating event is ‘‘Degradation of flange gasket beyondcritical limit’’, and the degradation will happen duringnormal production. The operational mode at time ofrelease is normal production.
The release may be prevented by the barrier functions;‘‘Maintenance of flange gasket to prevent degradation’’ or‘‘Detection of diffuse or minor release. The functions maybe carried out by the barrier systems ‘‘System for PM’’ and‘‘System for area based leak search’’, respectively.The barrier block diagram for this scenario corresponds
to Fig. 10 with different descriptions of the initiating eventand the barrier functions.
4.11. Scenario 4c. Release due to loss of bolt tensioning
Releases due to loss of bolt tensioning include releasesfrom flanges, valves, instrument couplings, etc., due to lossof bolt tensioning after some time. The bolt tensioning wasoriginally adequate, so the release will occur after sometime (not during start-up or shortly after start-up ofproduction).The initiating event for this scenario is ‘‘Loss of bolt
tensioning’’. The operational mode when the failure isintroduced and time of release are normal production.The barrier functions ‘‘Follow-up of bolt tensioning to
prevent release’’ and ‘‘Detection of diffuse or minorrelease’’ are defined for this scenario. The former functionmay be fulfilled by ‘‘System for PM (inspection and follow-up of tensioning)’’, while the latter function may be fulfilledby ‘‘System for area based leak search’’. The barrier blockdiagram for Scenario 4c corresponds to Fig. 10 withdifferent descriptions of the initiating event and the barrierfunctions.
4.12. Scenario 4d. Release due to degradation of welded pipe
This category of releases includes leaks from welds dueto degradation. Examples are releases from weldedinstrument fittings or valves, or from welds in pipe bendscaused for example by fatigue.The initiating event is ‘‘Degradation of weld beyond
critical limit’’. The operational mode when failure isintroduced is normal production. The release will occurduring normal production, during start-up, or during shutdown.The release may be prevented if the following safety
functions are fulfilled; ‘‘Detection of weld degradation’’ or‘‘Detection of diffuse or minor hydrocarbon release’’. Theformer function may be realized by ‘‘System for weldinspection’’, while the latter one may be realized by‘‘System for area based leak search’’. The barrier blockdiagram for Scenario 4d corresponds to Fig. 10 withdifferent descriptions of the initiating event and the barrierfunctions.
4.13. Scenario 4e. Release due to internal corrosion
This scenario includes releases caused by different typesof internal corrosion like local CO2-corrosion, uniformCO2-corrosion, and microbial corrosion (MIC). Theinitiating event for this scenario is ‘‘Internal corrosionbeyond critical limit’’. The corrosion works during normalproduction, and the release will occur during normalproduction or during process disturbances (resulting in,e.g., increased pressure).The release may be prevented by the barrier functions
‘‘Detection of internal corrosion to prevent release’’ or
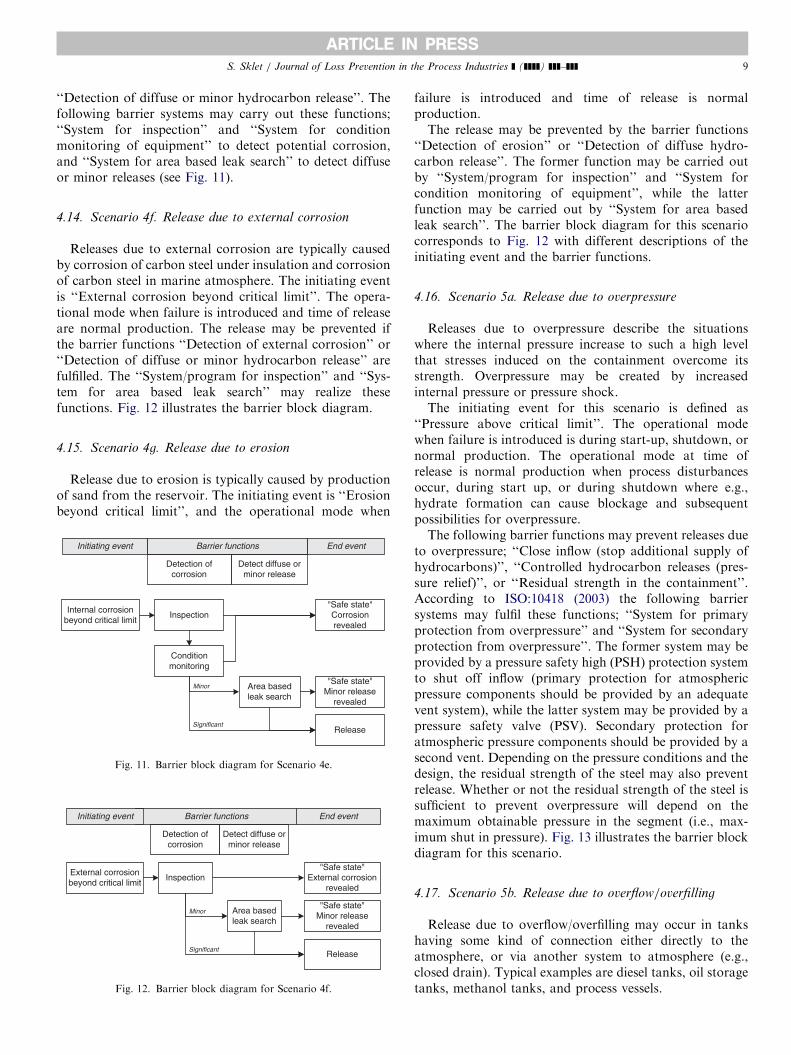
ARTICLE IN PRESSS. Sklet / Journal of Loss Prevention in the Process Industries ] (]]]]) ]]]–]]] 9
‘‘Detection of diffuse or minor hydrocarbon release’’. Thefollowing barrier systems may carry out these functions;‘‘System for inspection’’ and ‘‘System for conditionmonitoring of equipment’’ to detect potential corrosion,and ‘‘System for area based leak search’’ to detect diffuseor minor releases (see Fig. 11).
4.14. Scenario 4f. Release due to external corrosion
Releases due to external corrosion are typically causedby corrosion of carbon steel under insulation and corrosionof carbon steel in marine atmosphere. The initiating eventis ‘‘External corrosion beyond critical limit’’. The opera-tional mode when failure is introduced and time of releaseare normal production. The release may be prevented ifthe barrier functions ‘‘Detection of external corrosion’’ or‘‘Detection of diffuse or minor hydrocarbon release’’ arefulfilled. The ‘‘System/program for inspection’’ and ‘‘Sys-tem for area based leak search’’ may realize thesefunctions. Fig. 12 illustrates the barrier block diagram.
4.15. Scenario 4g. Release due to erosion
Release due to erosion is typically caused by productionof sand from the reservoir. The initiating event is ‘‘Erosionbeyond critical limit’’, and the operational mode when
Internal corrosion beyond critical limit
"Safe state"Corrosionrevealed
Inspection
Release
Conditionmonitoring
Area based leak search
"Safe state"Minor release
revealed
Significant
Minor
Barrier functions
Detection of corrosion
End eventInitiating event
Detect diffuse orminor release
Fig. 11. Barrier block diagram for Scenario 4e.
External corrosion beyond critical limit
"Safe state"External corrosion
revealedInspection
Release
Area based leak search
"Safe state"Minor release
revealed
Significant
Minor
Barrier functions
Detection ofcorrosion
End eventInitiating event
Detect diffuse orminor release
Fig. 12. Barrier block diagram for Scenario 4f.
failure is introduced and time of release is normalproduction.The release may be prevented by the barrier functions
‘‘Detection of erosion’’ or ‘‘Detection of diffuse hydro-carbon release’’. The former function may be carried outby ‘‘System/program for inspection’’ and ‘‘System forcondition monitoring of equipment’’, while the latterfunction may be carried out by ‘‘System for area basedleak search’’. The barrier block diagram for this scenariocorresponds to Fig. 12 with different descriptions of theinitiating event and the barrier functions.
4.16. Scenario 5a. Release due to overpressure
Releases due to overpressure describe the situationswhere the internal pressure increase to such a high levelthat stresses induced on the containment overcome itsstrength. Overpressure may be created by increasedinternal pressure or pressure shock.The initiating event for this scenario is defined as
‘‘Pressure above critical limit’’. The operational modewhen failure is introduced is during start-up, shutdown, ornormal production. The operational mode at time ofrelease is normal production when process disturbancesoccur, during start up, or during shutdown where e.g.,hydrate formation can cause blockage and subsequentpossibilities for overpressure.The following barrier functions may prevent releases due
to overpressure; ‘‘Close inflow (stop additional supply ofhydrocarbons)’’, ‘‘Controlled hydrocarbon releases (pres-sure relief)’’, or ‘‘Residual strength in the containment’’.According to ISO:10418 (2003) the following barriersystems may fulfil these functions; ‘‘System for primaryprotection from overpressure’’ and ‘‘System for secondaryprotection from overpressure’’. The former system may beprovided by a pressure safety high (PSH) protection systemto shut off inflow (primary protection for atmosphericpressure components should be provided by an adequatevent system), while the latter system may be provided by apressure safety valve (PSV). Secondary protection foratmospheric pressure components should be provided by asecond vent. Depending on the pressure conditions and thedesign, the residual strength of the steel may also preventrelease. Whether or not the residual strength of the steel issufficient to prevent overpressure will depend on themaximum obtainable pressure in the segment (i.e., max-imum shut in pressure). Fig. 13 illustrates the barrier blockdiagram for this scenario.
4.17. Scenario 5b. Release due to overflow/overfilling
Release due to overflow/overfilling may occur in tankshaving some kind of connection either directly to theatmosphere, or via another system to atmosphere (e.g.,closed drain). Typical examples are diesel tanks, oil storagetanks, methanol tanks, and process vessels.
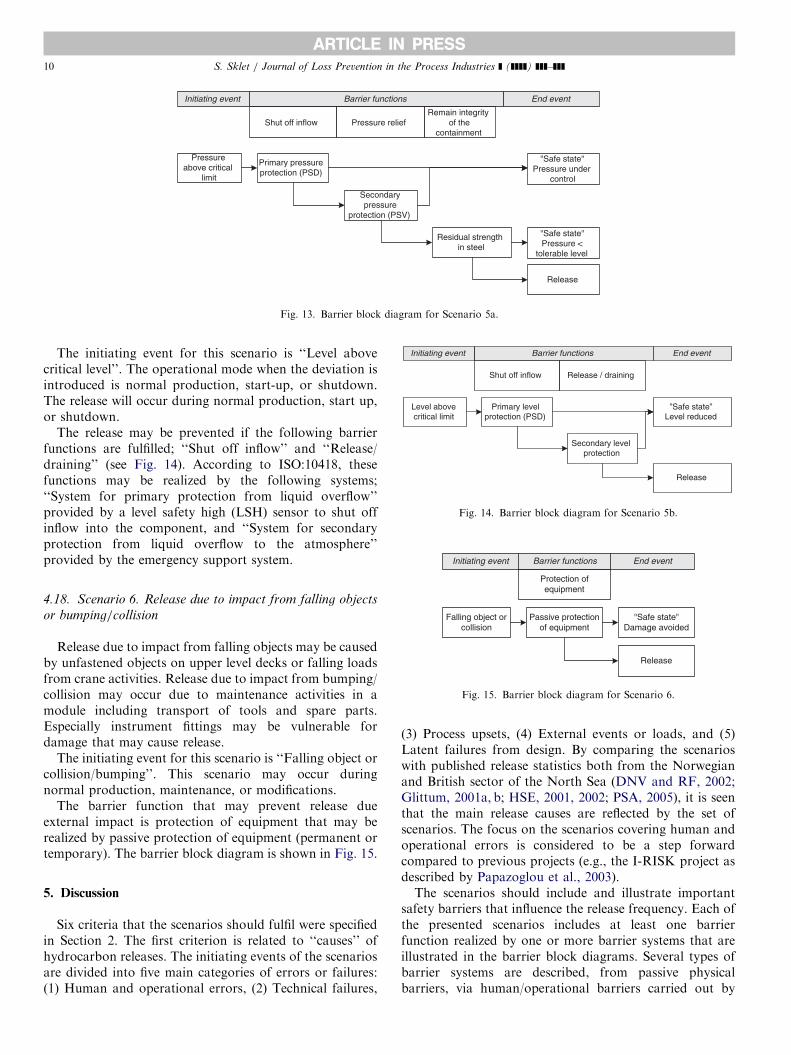
ARTICLE IN PRESS
Pressureabove critical
limit
"Safe state"Pressure under
control
Primary pressureprotection (PSD)
Secondary pressure
protection (PSV)
Release
Residual strength in steel
"Safe state"Pressure <
tolerable level
Barrier functions
Shut off inflow
End eventInitiating event
Pressure reliefRemain integrity
of the containment
Fig. 13. Barrier block diagram for Scenario 5a.
Level above critical limit
”Safe state”Level reduced
Primary level protection (PSD)
Secondary levelprotection
Release
Barrier functions
Shut off inflow
End eventInitiating event
Release / draining
Fig. 14. Barrier block diagram for Scenario 5b.
Barrier functions End eventInitiating event
S. Sklet / Journal of Loss Prevention in the Process Industries ] (]]]]) ]]]–]]]10
The initiating event for this scenario is ‘‘Level abovecritical level’’. The operational mode when the deviation isintroduced is normal production, start-up, or shutdown.The release will occur during normal production, start up,or shutdown.
The release may be prevented if the following barrierfunctions are fulfilled; ‘‘Shut off inflow’’ and ‘‘Release/draining’’ (see Fig. 14). According to ISO:10418, thesefunctions may be realized by the following systems;‘‘System for primary protection from liquid overflow’’provided by a level safety high (LSH) sensor to shut offinflow into the component, and ‘‘System for secondaryprotection from liquid overflow to the atmosphere’’provided by the emergency support system.
Falling object orcollision
"Safe state"Damage avoided
Passive protection of equipment
Release
Protection ofequipment
Fig. 15. Barrier block diagram for Scenario 6.
4.18. Scenario 6. Release due to impact from falling objects
or bumping/collision
Release due to impact from falling objects may be causedby unfastened objects on upper level decks or falling loadsfrom crane activities. Release due to impact from bumping/collision may occur due to maintenance activities in amodule including transport of tools and spare parts.Especially instrument fittings may be vulnerable fordamage that may cause release.
The initiating event for this scenario is ‘‘Falling object orcollision/bumping’’. This scenario may occur duringnormal production, maintenance, or modifications.
The barrier function that may prevent release dueexternal impact is protection of equipment that may berealized by passive protection of equipment (permanent ortemporary). The barrier block diagram is shown in Fig. 15.
5. Discussion
Six criteria that the scenarios should fulfil were specifiedin Section 2. The first criterion is related to ‘‘causes’’ ofhydrocarbon releases. The initiating events of the scenariosare divided into five main categories of errors or failures:(1) Human and operational errors, (2) Technical failures,
(3) Process upsets, (4) External events or loads, and (5)Latent failures from design. By comparing the scenarioswith published release statistics both from the Norwegianand British sector of the North Sea (DNV and RF, 2002;Glittum, 2001a, b; HSE, 2001, 2002; PSA, 2005), it is seenthat the main release causes are reflected by the set ofscenarios. The focus on the scenarios covering human andoperational errors is considered to be a step forwardcompared to previous projects (e.g., the I-RISK project asdescribed by Papazoglou et al., 2003).The scenarios should include and illustrate important
safety barriers that influence the release frequency. Each ofthe presented scenarios includes at least one barrierfunction realized by one or more barrier systems that areillustrated in the barrier block diagrams. Several types ofbarrier systems are described, from passive physicalbarriers, via human/operational barriers carried out by
ARTICLE IN PRESSS. Sklet / Journal of Loss Prevention in the Process Industries ] (]]]]) ]]]–]]] 11
personnel on the platform, to active technical barriersystems. Collectively, the scenarios give an overview of themost important safety barriers introduced to preventhydrocarbon releases. However, additional safety barriersmay be introduced to prevent the occurrence of theinitiating events in the scenarios, and these safety barriersare not discussed in this paper. Another important aspect isthe underlying assumption in several scenarios thatcorrective actions are implemented when deviations arerevealed.
The third criterion states that the scenarios should reflectdifferent activities, phases, and conditions on the platform.Failures introduced during the operational phase (i.e.,normal production, maintenance (incl. inspection), shut-down and start-up of the process, and modifications) areincluded in this study. Safety barriers related to thesephases are identified and described. Safety barriersintroduced to prevent releases due to latent failuresintroduced during design have not been analysed aspart of this study. The focus of this paper has been releasesfrom the process plant, therefore, drilling and wellintervention activities are not covered in the paper (seeSklet, Steiro, & Tjelta (2005) for a discussion of safetybarriers introduced to prevent hydrocarbon releases duringwireline operations).
Criterion four implies that the scenarios should facilitateinstallation specific considerations to be performed in a‘‘simple’’ and not too time-consuming manner. Thescenarios are as far as possible made generic, thus somesafety barriers may not exist on some platforms. Allinstallation specific conditions are not necessarily allowedfor, but the scenarios may constitute the basis for platformspecific adjustments and perhaps more detailed platformspecific analyses.
The next criterion is related to whether or not the set ofscenarios is comprehensive and representative (related tocompleteness). The complexity of oil and gas productionplatforms implies that there are a very high number ofconditions and events that may cause hydrocarbonreleases. The presented scenarios do not cover absolutelyall these causes. Nevertheless, the presented set of scenariosis considered to constitute a comprehensive and represen-tative set of release scenarios. The initiating events coverthe most frequent ‘‘causes’’ of hydrocarbon releases, andthe scenarios include the most important barrier functionsand barrier systems introduced to prevent releases due tothis ‘‘causes’’. It is difficult to quantify the completeness,but 36 out of the 40 analysed hydrocarbon release incidentsfitted into one of the scenario descriptions. There may beneed to develop more scenarios in the future in order toestablish an even more complete set of scenarios. In somecases, there may be need to develop platform specificscenarios in order to allow for platform specific conditionsnot included in these generic scenarios. To evaluate thecompleteness for specific platforms, the generic scenariosshould be compared to hazard identifications (e.g., Hazop/Hazid) carried out for each specific platform.
The last criterion states that the scenarios should besuitable for quantification (both the frequency of initiatingevents and the probability of failure of safety barriers).Barrier block diagrams are similar to event trees, andquantification of the scenarios may be carried out as forevent trees. The initiating events are defined in such a waythat quantification is possible. The quantification of theinitiating events should preferably be based on platformspecific data, but if not such data are obtainable, genericdata may be applied. Platform specific analysis of the safetybarriers must be carried out in order to analyse theperformance of the safety barriers.Safety barriers will not always function as planned or
designed. In-depth analysis of safety barrier performanceshould be carried out to analyse whether or not the safetybarriers are capable to prevent, control, or mitigatehydrocarbon releases. It is recommended to address thefollowing attributes to characterize the performance ofsafety barriers; (a) functionality/effectiveness, (b) reliabil-ity/availability, (c) response time, (d) robustness, and(e) triggering event or condition (see Sklet (2005) forfurther details). For some types of barriers, not all theattributes are relevant or necessary in order to describe thebarrier performance. These analyses may in some cases beextensive and resource demanding in order to allow forassessment of platform specific conditions.A method for qualitative and quantitative risk analysis
of platform specific hydrocarbon release frequencies (calledBORA-Release) is described in Aven, Sklet, and Vinnem(2005), and results from application of BORA-Release arepresented in Sklet, Vinnem, and Aven (2005). A fullquantitative risk analysis of the hydrocarbon releasefrequency by use of BORA-Release enables use of a risk-based approach for identification of the scenarios that arethe major contributors to the total release frequency for asystem. BORA-Release may also be used to analyse theeffect on the hydrocarbon release frequency of riskreduction measures. Other approaches may also be usedto select release scenarios for detailed analyses, rangingfrom purely qualitative assessments (expert judgement), toquantitative assessment of the damage potential and thelikelihood of occurrence (e.g., the Maximum CredibleAccident Analysis method; Khan & Abbasi, 2002).Layer or protection analysis (LOPA) is a semi-quanti-
tative tool for analysing and assessing risk applied in thechemical process industry (CCPS, 2001). All the safetybarriers presented in the barrier block diagrams inSection 4 may be defined as safeguards according to theLOPA terminology. However, not all the safety barriersmay be defined as independent protection layers. Therelease scenarios in Section 4 may be used as basis fordetailed analysis of causal factors for the initiating event‘‘loss of containment’’ applied in LOPA.Several safety barriers introduced to prevent hydrocar-
bon releases during the operational phase of the total life-cycle of oil and production platforms are presented in thispaper. These barriers are not a substitute for use of
ARTICLE IN PRESSS. Sklet / Journal of Loss Prevention in the Process Industries ] (]]]]) ]]]–]]]12
inherently safer process design features that may eliminatepossible scenarios (e.g., see CCPS, 1996), but rather asupplement to this important design principle.
6. Conclusions and further research
This paper presents a set of scenarios that may lead tohydrocarbon release. Each release scenario is described interms of an initiating event (i.e., a ‘‘deviation’’) reflectingcausal factors, the barrier functions introduced to preventthe initiating event from developing into a release, and howthe barrier functions are realized in terms of barriersystems. The development of the release scenarios hasgenerated new knowledge about causal factors of hydro-carbon release and about safety barriers introduced toprevent hydrocarbon release.
The release scenarios may be used to identify andillustrate barriers introduced to prevent hydrocarbonrelease and constitute the basis for analysis of the barrierperformance. No assessment of the importance of thedifferent scenarios with respect to the total risk ofhydrocarbon releases is presented in this paper. Aquantitative analysis of the contribution to the total releasefrequency from the different scenarios may be carried outin order to identify the most important scenarios fordifferent systems. The quantitative analyses may also beused to determine the platform specific hydrocarbonrelease frequencies as input to future QRA. By includingtechnical, operational, human, and organizational riskinfluencing factors in the analysis of barrier performancewe are able to study the effect of these factors on theplatform specific hydrocarbon release frequency.
Although qualitative analysis of the release scenarios isuseful in itself, the objective is to be able to performdetailed quantitative analysis of the scenarios. To fulfil thisobjective, there is a need for further research focusing onseveral problem areas: (a) evaluation of the scenarios inorder to assess whether or not more safety barriersintroduced to prevent hydrocarbon releases should beincluded in the release scenarios, (b) assessment of whetheror not the presented set of release scenarios is sufficientlycomplete and assess if there is need for development ofadditional scenarios, (c) analysis of the frequency of theinitiating events and the relative distribution of thedifferent scenarios, and (d) development of a method foranalysis of the effect of technical, operational, human, andorganizational risk influencing factors on the performanceof safety barriers. This last topic is studied in the BORAproject, and a method for qualitative and quantitativeanalysis of the scenarios is presented in Aven et al. (2005).
In the future, the release scenarios may constitute thebasis for analyses of the effect on the total risk ofhydrocarbon releases of the identified safety barriers, andthe effect of risk reducing measures (or risk increasingchanges) influencing the frequency of the initiating event orthe performance of safety barriers.
Acknowledgements
The author acknowledges Stein Hauge at SINTEF forassistance during the project work, and personnel fromHydro and members of BORA project group for usefulcomments during the development of the release scenarios.
References
Aven, T., Sklet, S., & Vinnem, J. E. (2005). Barrier and operational risk
analysis of hydrocarbon releases (BORA-Release); Part I. Method
description. Journal of Hazardous Materials, submitted for publica-
tion.
Bellamy, L. J., Papazoglou, I. A., Hale, A. R., Aneziris, O. N., Ale, B. J.
M., Morris, M. I. et al. (1999). I-RISK—development of an integrated
technical and management risk control and monitoring methodology for
managing and quantifying on-site and off-site risks. Main Report,
Contract No: ENVA-CT96-0243.
Botnevik, R., Berge, O., & Sklet, S. (2004). Standardised procedures for
work permits and safe job analysis on the Norwegian continental shelf.
SPE paper number 86629, Society of Petroleum Engineers.
CCPS. (1996). Inherently safer chemical processes: A life cycle approach.
New York: Center for Chemical Process Safety of the American
Institute of Chemical Engineers.
CCPS. (2001). Layer of protection analysis simplified process risk
assessment. New York: Center for Chemical Process Safety of the
American Institute of Chemical Engineers.
Davoudian, K., Wu, J.-S., & Apostolakis, G. E. (1994). Incorporating
organisational factors into risk assessment through the analysis of
work processes. Reliability Engineering and System Safety, 45, 85–105.
DNV and RF (2002). Analysis of causes of process leaks. Pre study,
The Norwegian Petroleum Directorate, Rev. no. 01, Stavanger,
Norway, Det Norske Veritas report no. DNV 2002-4019 (in
Norwegian).
Duijm, N. J., & Goossens, L. (2005). Quantifying the influence of safety
management on the reliability of safety barriers. Journal of Hazardous
Materials, in press, doi:10.1016/j.jhazmat.2005.07.014
Glittum, E. (2001a). Offshore leak frequencies. Porsgrunn, Norway: Norsk
Hydro Research Centre (in Norwegian).
Glittum, E. (2001b). Analysis of leak causes on Norsk Hydro’s platforms.
Norsk Hydro Research Centre: Porsgrunn, Norway (in Norwegian).
HSE (2001). HSE report: OSD hydrocarbon release reduction campaign,
report on the HC release incident investigation project—1/4/2000–31/
3/2001, UK.
HSE (2002). HSE offshore hydrocarbon releases statistics and analysis
2002, UK.
Hurst, N. W., Bellamy, L. J., Geyer, T. A. W., & Astley, J. A. (1991).
A classification scheme for pipework failures to include human and
sociotechnical errors and their contribution to pipework failure
frequencies. Journal of Hazardous Materials, 26(2), 159–186.
ISO/CD:14224 (2004). Petroleum, petrochemical and natural gas indus-
tries—collection and exchange of reliability and maintenance data for
equipment. Rev 2, Date: 2004-05-13, International Standardization
Organization.
ISO:10418. (2003). Petroleum and natural gas industries—offshore produc-
tion installations—basic surface process safety systems. International
Standardization Organization.
Khan, F. I., & Abbasi, S. A. (2002). A criterion for developing credible
accident scenarios for risk assessment. Journal of Loss Prevention in the
Process Industries, 15, 467–475.
OLF. (2004). Recommendations to operators to reduce hydrocarbon leaks.
Stavanger: The Norwegian Oil Industry Association.
Olson, J., Chockie, A. D., Geisendorfer, C. L., Vallario, R. W., & Mullen,
M. F. (1988). Development of programmatic performance indicators.
NUREG/CR-5241, PNL-6680, BHARC-700/88/022, US Nuclear
Regulatory Commission, Washington, DC, USA.

ARTICLE IN PRESSS. Sklet / Journal of Loss Prevention in the Process Industries ] (]]]]) ]]]–]]] 13
Papazoglou, I. A., Aneziris, O. N., Post, J. G., & Ale, B. J. M. (2003).
Technical modeling in integrated risk assessment of chemical installa-
tions. Journal of Loss Prevention in the Process Industries, 16, 575–591.
PSA. (2003). The risk level on the Norwegian Continental Shelf 2002.
Stavanger: The Petroleum Safety Authority.
PSA. (2005). Trends in risk levels—summary report Phase 5 (2004).
Stavanger: The Petroleum Safety Authority.
Sklet, S. (2005). Safety barriers; definition, classification, and perfor-
mance. Journal of Loss Prevention in the Process Industries, accepted
for publication.
Sklet, S., & Hauge, S. (2004). Safety barriers to prevent release of
hydrocarbons during production of oil and gas. Trondheim: SINTEF
Industrial Management Safety and Reliability.
Sklet, S., Steiro, T., Tjelta, O., (2005). Qualitative analysis of human,
technical and operational barrier elements during well interventions.
ESREL 2005, Tri City, Poland: Balkema.
Sklet, S., Vinnem, J. E., & Aven, T. (2005). Barrier and operational risk
analysis of hydrocarbon releases (BORA-Release); Part II. Results
from a case study. Journal of Hazardous Materials, submitted for
publication.
Vinnem, J. E., Aven, T., Hauge, S., Seljelid, J., & Veire, G.
(2004). Integrated barrier analysis in operational risk assessment
in offshore petroleum operations. PSAM7-ESREL’04. Berlin:
Springer.
Øien, K. (2001). Risk indicators as a tool for risk control. Reliability
Engineering & System Safety, 74(2), 129–145.
Thesis – Part II Papers
Paper 3
Barrier and operational risk analysis of hydrocarbon releases (BORA-Release); Part I Method description
Terje Aven, Snorre Sklet, Jan Erik Vinnem Journal of Hazardous Materials
Submitted for publication December 2005

Barrier and operational risk analysis of hydrocarbon releases (BORA-Release);
Part I Method description
Terje Aven b, Snorre Sklet a, 1, Jan Erik Vinnem b a Dept. of Production and Quality Engineering, The Norwegian University of
Science and Technology (NTNU), NO-7491 Trondheim, Norway b University of Stavanger (UiS), NO-4036 Stavanger, Norway
Abstract Investigations of major accidents show that technical, human, operational, as well as organisational factors influence the accident sequences. In spite of these facts, quantitative risk analyses of offshore oil and gas production platforms have focused on technical safety systems. This paper presents a method (called BORA-Release) for qualitative and quantitative risk analysis of the platform specific hydrocarbon release frequency. By using BORA-Release it is possible to analyse the effect of safety barriers introduced to prevent hydrocarbon releases, and how platform specific conditions of technical, human, operational, and organisational risk influencing factors influence the barrier performance. BORA-Release comprises the following main steps; 1) Development of a basic risk model including release scenarios, 2) Modelling the performance of safety barriers, 3) Assignment of generic data and risk quantification based on these data, 4) Development of risk influence diagrams, 5) Scoring of risk influencing factors, 6) Weighting of risk influencing factors, 7) Adjustment of generic input data, and 8) Recalculation of the risk in order to determine the platform specific risk related to hydrocarbon release. The various steps in BORA-Release are presented and discussed. Part II of the paper presents results from a case study where BORA-Release is applied. Keywords: Risk analysis, hydrocarbon release, loss of containment, safety barrier, organisational factors. 1 Corresponding author. Tel.: +47 73 59 29 02, Fax: +47 73 59 28 96
E-mail: [email protected]
Barrier and operational risk analysis of hydrocarbon releases (BORA-Release); Part I Method description
2
1 Introduction In-depth investigations of major accidents, like the process accidents at Longford [1] and Piper Alpha [2], the loss of the space shuttles Challenger [3] and Colombia [4], the high-speed craft Sleiper accident [5], the railway accidents at Ladbroke Grove [6] and Åsta [5], and several major accidents in Norway the last 20 years [7] show that both technical, human, operational, as well as organisational factors influence the accident sequences. In spite of these findings, the main focus in quantitative risk analyses (QRA) is on technical safety systems. As regards offshore QRA, one of the conclusions drawn by Vinnem et al [8] is that a more detailed analysis of all aspects of safety barriers is required. Several models and methods for incorporating organisational factors in QRA or probabilistic risk assessments (PRA) have been proposed. Among these are Manager [9], MACHINE (Model of Accident Causation using Hierarchical Influence NEtwork) [10], ISM (Integrated Safety Method) [11], WPAM (The Work Process Analysis Model) [12, 13], I-RISK (Integrated Risk) [14-16], the ω-factor model [17], SAM (System Action Management) [18, 19], ORIM (Organisational Risk Influence Model) [20, 21], and ARAMIS [22]. These models/methods have been developed and described in the literature the last 15 years. However, none of them are so far used as an integrated part of offshore QRA. The Petroleum Safety Authority Norway (PSA) gives several requirements to risk analysis and safety barriers in their regulations [23]: QRA shall be carried out to identify contributors to major accident risk and provide a balanced and comprehensive picture of the risk. The operator, or the one responsible for the operation of a facility, shall stipulate the strategies and principles on which the design, use, and maintenance of safety barriers shall be based, so that the barrier function is ensured throughout the lifetime of the facility. It shall be known which safety barriers that have been established, which function they are intended to fulfil, and what performance requirements have been defined with respect to the technical, operational or organisational elements that are necessary for the individual barrier to be effective. In spite of these requirements, the QRA of offshore platforms are still limited to analysis of consequence reducing barriers with no, or limited analysis of barriers introduced to reduce the probability of hydrocarbon release. Therefore, a method that may be applied to analyse safety barriers introduced to prevent hydrocarbon releases is required. The method ought to be used for qualitative and quantitative analyses of the effect on the barrier performance, and thus the risk, of plant specific conditions of technical, human, operational, as well as organisational risk

Barrier and operational risk analysis of hydrocarbon releases (BORA-Release); Part I Method description
3
influencing factors (RIFs). With this background, the BORA-project (Barrier and Operational Risk Analysis) was initiated in order to perform a detailed and quantitative modelling of barrier performance, including barriers to prevent the occurrence of initiating events (e.g., hydrocarbon release), as well as barriers to reduce the consequences [24]. The main objective of this paper is to present and discuss a new method for qualitative and quantitative analyses of the platform specific hydrocarbon release frequency, called BORA-Release. BORA-Release makes it possible to analyse the effect on the hydrocarbon release frequency of safety barriers introduced to prevent release, and how platform specific conditions of technical, human, operational, and organisational RIFs influence the barrier performance. The paper is limited to analysis of hydrocarbon release (or loss of containment). However, the principles in BORA-Release are relevant for analysis of the consequence barriers as well. The paper is organized as follows. Section 2 describes the process for development of the method. Section 3 describes BORA-Release. Section 4 discusses critical issues of the method. The discussion is divided in three parts; a discussion of the different steps in BORA-Release, a discussion of the extent of fulfilment of a set of criteria, and a discussion of application areas. Some conclusions and ideas for further work are presented in section 5. Part II presents some results from a case study where BORA-Release is applied.
2 Research approach The research process for development of BORA-Release consists of the following main steps:
1. Development of a set of criteria the method should fulfil 2. Literature review 3. Selection of modelling approach 4. Development of a preliminary (draft) version of the method 5. Application of the method in case studies 6. Revision of the method
Several criteria the BORA-Release should fulfil were developed. The criteria were developed as a result of discussions of the purpose of the analysis method. The aim was to develop a method that:
Barrier and operational risk analysis of hydrocarbon releases (BORA-Release); Part I Method description
4
1. Facilitates identification and illustration of safety barriers introduced to prevent hydrocarbon releases
2. Contributes to an understanding of which factors that influence the performance of the safety barriers, including technical, human, operational, as well as organisational factors
3. Reflects different causes of hydrocarbon releases 4. Is suitable for quantification of the frequency of initiating events and the
performance of the safety barriers 5. Allows use of available input data as far as possible, or allows collection of
input data in not a too time consuming manner 6. Allows consideration of different activities, phases, and conditions 7. Enables identification of common causes and dependencies 8. Is practically applicable regarding use of resources 9. Provides basis for “re-use” of the generic model in such a way that
installation specific considerations may be performed in a simple and not too time-consuming manner
To what extent BORA-Release fulfils these criteria are discussed in subsection 4.2. A literature review was carried out in order to identify existing methods incorporating the effect of organisational factors in QRA. Several models and methods for quantification of the influence of organisational factors on the total risk are described in the literature. Among these are Manager [9], MACHINE) (Model of Accident Causation using Hierarchical Influence NEtwork) [10], ISM (Integrated Safety Model) [11], the ω-factor model [17], WPAM (The Work Process Analysis Model) [12, 13], SAM (System Action Management) [18, 19], I-RISK (Integrated Risk) [14-16], ORIM (Organisational Risk Influence Model) [20, 21], and ARAMIS [22]. These models and methods were reviewed and compared in view of criteria 1 – 9 above. The review was partly based in the framework for evaluation of models/methods for this type of risk analyses introduced by Øien [25]. The conclusion was that none of the models/methods were directly applicable for analysis of platform specific release frequencies allowing for analysis of the effect of safety barriers introduced to prevent release, and analysis of how platform specific conditions of technical, human, operational, and organisational RIFs influence the barrier performance. However, the comparison resulted in knowledge about the existing methods used as basis for development of BORA-Release.

Barrier and operational risk analysis of hydrocarbon releases (BORA-Release); Part I Method description
5
An assessment of the suitability of some existing risk analysis methods was carried out in order to select an approach for analyses of the release scenarios. The following methods were assessed; a) the current practice in QRA, b) fault tree analysis, c) barrier block diagram (corresponds to event tree analysis), and d) an overall influence diagram. The assessment was based on a discussion of advantages and disadvantages of the different methods and an attempt to “score” the different modelling techniques according to fulfilment of the former described criteria. The assessment is shown in Table 1 where a score of 1 indicates “not suitable”, and a score of 5 indicates “very suitable”.
Table 1. Comparison of various modelling approaches.
No. Criteria Current QRA
Fault tree
Barrier block diagram
Overall Influence diagram
1 Facilitate identification and illustration of safety barriers
1 3 5 2
2 Contribute to an understanding of which factors that influence the performance of the barrier functions
1 3 4 3
3 Reflect different causes of hydrocarbon release 1 4 4 4 4 Be suitable for quantification of the frequency of
initiating events and the performance of safety barriers
5 3 3 2
5 Allow use of relevant data 5 3 3 2 6 Allow consideration of different activities,
phases, and conditions 2 3 4 2
7 Enable identification of common causes and dependencies
1 4 5 5
8 Be practically applicable regarding use of resources
5 2 3 2
9 Provides “re-use” of the generic model 1 3 5 4 Total score of modelling approach 22 28 36 26
Based on this suitability assessment and the literature review, it was concluded to apply barrier block diagrams to model the hydrocarbon release scenarios and fault tree analyses and/or risk influence diagrams to model the performance of different barrier functions (“blocks” in the barrier block diagram).
Barrier and operational risk analysis of hydrocarbon releases (BORA-Release); Part I Method description
6
Next, a preliminary version of BORA-Release was developed. This version was discussed in the BORA project group and led to some modifications. Further, the method was reviewed by the steering committee. A case study carried out in order to test BORA-Release in practice is described in part II of this paper [26]. The experience from the case study led to some adjustments of the method and this paper presents the revised version.
3 Description of BORA-Release BORA-Release consists of the following main steps:
1) Development of a basic risk model including hydrocarbon release scenarios and safety barriers
2) Modelling the performance of safety barriers 3) Assignment of generic input data and risk quantification based on these data 4) Development of risk influence diagrams 5) Scoring of risk influencing factors (RIFs) 6) Weighting of risk influencing factors 7) Adjustment of generic input data 8) Recalculation of the risk in order to determine the platform specific risk
3.1 Development of a basic risk model The first step is to develop a basic risk model that covers a representative set of hydrocarbon release scenarios. The purpose is to identify, illustrate, and describe the scenarios that may lead to hydrocarbon release on a platform. The basic risk model forms the basis for the qualitative and quantitative analyses of the risk of hydrocarbon release and the safety barriers introduced to prevent hydrocarbon release. A representative set of 20 hydrocarbon release scenarios has been developed and described [27]. Examples are “Release due to mal-operation of valve(s) during manual operations”, “Release due to incorrect fitting of flanges or bolts during maintenance”, and “Release due to internal corrosion”. The basic risk model is illustrated by barrier block diagrams as shown in Figure 1. A barrier block diagram consists of an initiating event, arrows that show the event sequence, barrier functions realized by barrier systems, and possible outcomes. A horizontal arrow indicates that a barrier system fulfils its function, whereas an arrow downwards indicates failure to fulfil the function. In our case, the undesired event is hydrocarbon release (loss of containment). A barrier block diagram corresponds to an event tree and can be used as a basis for quantitative analysis.

Barrier and operational risk analysis of hydrocarbon releases (BORA-Release); Part I Method description
7
Figure 1. Barrier block diagram – general principles.
An initiating event for a release scenario is the first significant deviation from a normal situation that under given circumstances may cause a hydrocarbon release (loss of containment). A “normal situation” is a state where the process functions as normal according to design specifications without significant process upsets or direct interventions into the processing plant. A barrier function is defined as a function planned to prevent, control or mitigate undesired events or accidents [28]. A barrier system is a system that has been designed and implemented to perform one or more barrier functions. A barrier system may consist of different types of system elements, for example, technical elements (hardware, software), operational activities executed by humans, or a combination thereof. In some cases, there may be several barrier systems that carry out one barrier function. Hydrocarbon release in this context is defined as gas or oil leaks (incl. condensate) from the process flow, well flow or flexible risers with a release rate greater than 0,1 kg/s. Smaller leaks are called minor release or diffuse discharges.
3.2 Modelling the performance of safety barriers The next step is to model the performance of safety barriers. The purpose of this modelling is to analyse the plant specific barrier performance and allow for platform specific analysis of the conditions of human, operational, organisational, and technical factors. The safety barriers are described as separate “boxes” in the barrier block diagrams. According to Sklet [28], the following attributes regarding performance of safety barriers should be allowed for in the analysis; a) the triggering event or condition, b) functionality or effectiveness, c) response time, d) reliability/availability, and e) robustness. Fault tree analysis is used for analysis of barrier performance in BORA-Release. The “generic” top event in the fault trees in BORA-Release is “Failure of a barrier
Initiating event (Deviation from
normal situation)
Undesired event
”Safe state”Barrier function
realized by a barrier system Functions
Fails
Barrier and operational risk analysis of hydrocarbon releases (BORA-Release); Part I Method description
8
system to perform the specified barrier function”. This generic top event needs to be adapted to each specific barrier in the different scenarios. The results from the qualitative fault tree analyses are a list of basic events and an overview of (minimal) cut sets. Basic events are the bottom or “leaf” events of a fault tree (e.g., component failures and human errors), while a cut set is a set of basic events whose occurrence (at the same time) ensures that the top event occurs [29]. A cut set is said to be minimal if the set cannot be reduced without loosing its status as a cut set.
3.3 Assignment of generic input data and risk quantification based on these data
In step three, the purpose is to assign data to the initiating events and the basic events in the fault trees and carry out a quantitative analysis of the risk of hydrocarbon release by use of these data (quantitative analysis of fault trees and event trees). In practice, extensive use of industry average data are necessary to be able to carry out the quantitative analysis. Several databases are available presenting industry average data like OREDA [30] for equipment reliability data, and THERP [31] and CORE-DATA [32, 33] for human reliability data (see [34] for an overview of data sources). If possible, plant specific data should be applied. Plant specific data may be found in, e.g., incident databases, log data, and maintenance databases. In some cases, neither plant specific data nor generic data may be found, and it may be necessary to use expert judgment to assign probabilities. The quantification of the risk of hydrocarbon release is carried out by use of the assigned data. The results of this calculation may to some degree reflect plant specific conditions, however, most of the data are based on generic databases.
3.4 Development of risk influence diagrams Step four is to develop risk influence diagrams. The purpose of the risk influence diagram is to incorporate the effect of the plant specific conditions as regards human, operational, organisational, and technical RIFs on the occurrences (frequencies) of the initiating events and the barrier performance. An example of a risk influence diagrams for the basic event “Failure to detect leak in the leak test” which is influenced by four RIFs is shown in Figure 2. If necessary, we have to develop one risk influence diagram for each basic event. The number of RIFs influencing each basic event is limited to six in order to reduce the total number of RIFs in the analysis.

Barrier and operational risk analysis of hydrocarbon releases (BORA-Release); Part I Method description
9
Figure 2. Example on a risk influence diagram.
Due to the complexity and variation in the types of events considered, a combined approach is preferred in order to identify RIFs; 1) a top-down approach where a generic list of RIFs is used as a basis, and 2) a bottom-up approach where the events to be assessed are chosen as a starting point. This implies that specific RIFs are identified for each initiating event and each basic event from the generic list of RIFs. The generic list may be supplemented by new RIFs when necessary. A framework for identification of RIFs has been developed. The framework consists of the following main groups of RIFs:
• Characteristics of the personnel performing the tasks • Characteristics of the task being performed • Characteristics of the technical system • Administrative control (procedures and disposable work descriptions) • Organisational factors / operational philosophy
A more detailed taxonomy of generic RIFs as shown in Table 2 has been developed. A brief explanation of each RIF is also included in the last column in the table. The proposed RIF framework and the taxonomy of generic RIFs are based on a review, comparison, and synthesis of several schemes of classification of human, technical, and organisational (MTO) factors:
• Classification of causes in methods for accident investigations, like MTO-analysis [35], and TRIPOD [36].
• Classification of organisational factors in models for analysis of the influence of organisational factors on risk, like I-RISK [14], and WPAM [12, 37].
• Classification of performing shaping factors (PSFs) in methods for human reliability analysis (HRA), like THERP [31], CREAM [38], SLIM-MAUD [39], and HRA databases CORE-DATA [40].
Failure to detect leak in the leak test
Communication Procedures for leak testMethodology Competence
Barrier and operational risk analysis of hydrocarbon releases (BORA-Release); Part I Method description
10
A draft version of the taxonomy of RIFs was applied and discussed in the case study [26] and three specific RIFs were added to the list of RIFs in Table 2 based on discussions in a workshop with platform personnel.
Table 2. Descriptions of risk influencing factors.
RIF group RIF RIF description Competence Cover aspects related to the competence, experience, system
knowledge and training of personnel Working load / stress Cover aspects related to the general working load on persons
(the sum of all tasks and activities) Fatigue Cover aspects related to fatigue of the person, e.g., due to night
shift and extensive use of overtime
Personal characteristics
Work environment Cover aspects related to the physical working environment like noise, light, vibration, use of chemical substances, etc.
Methodology Cover aspects related to the methodology used to carry out a specific task.
Task supervision Cover aspects related to supervision of specific tasks by a supervisor (e.g., by operations manager or mechanical supervisor)
Task complexity Cover aspects related to the complexity of a specific task. Time pressure Cover aspects related to the time pressure in the planning,
execution and finishing of a specific task Tools Cover aspects related to the availability and operability of
necessary tools in order to perform a task.
Task characteristics
Spares Cover aspects related to the availability of the spares needed to perform the task.
Equipment design Cover aspects related to the design of equipment and systems such as flange type (ANSI or compact), valve type, etc.
Material properties Cover aspects related to properties of the selected material with respect to corrosion, erosion. fatigue, gasket material properties, etc.
Process complexity Cover aspects related to the general complexity of the process plant as a whole
HMI (Human Machine Interface)
Cover aspects related to the human-machine interface such as ergonomic factors, labelling of equipment, position feedback from valves, alarms, etc.
Maintainability/ accessibility
Cover aspects related to the maintainability of equipment and systems like accessibility to valves and flanges, space to use necessary tools, etc.
System feedback Cover aspects related to how errors and failures are instantaneously detected, due to alarm, failure to start, etc.
Characteristics of the technical system
Technical condition Cover aspects related to the condition of the technical system

Barrier and operational risk analysis of hydrocarbon releases (BORA-Release); Part I Method description
11
RIF group RIF RIF description Procedures Cover aspects related to the quality and availability of
permanent procedures and job/task descriptions Work permit Cover aspects related to the system for work permits, like
application, review, approval, follow-up, and control
Administrative control
Disposable work descriptions
Cover aspects related to the quality and availability of disposable work descriptions like Safe Job analysis (SJA) and isolation plans
Programs Cover aspects related to the extent and quality of programs for preventive maintenance (PM), condition monitoring (CM), inspection, 3rd party control of work, use of self control/checklists, etc. One important aspect is whether PM, CM, etc., is specified
Work practice Cover aspects related to common practice during accomplishment of work activities. Factors like whether procedures and checklists are used and followed, whether shortcuts are accepted, focus on time before quality, etc.
Supervision Cover aspects related to the supervision on the platform like follow-up of activities, follow-up of plans, deadlines, etc.
Communication Cover aspects related to communication between different actors like area platform manager, supervisors, area technicians, maintenance contractors, CCR technicians, etc.
Acceptance criteria Cover aspects related to the definitions of specific acceptance criteria related to for instance condition monitoring, inspection, etc.
Simultaneous activities
Cover aspects related to amount of simultaneous activities, either planned (like maintenances and modifications) and unplanned (like shutdown)
Organisational factors / operational philosophy
Management of changes
Cover aspects related to changes and modifications
3.5 Scoring of risk influencing factors We need to assess the status of the RIFs on the platform. The aim is to assign a score to each identified RIF in the risk influence diagrams. Each RIF is given a score from A to F, where score A corresponds to the best standard in the industry, score C corresponds to industry average, and score F corresponds to worst practice in the industry (see Table 3). The six-point scale is adapted from the TTS2 project [41].
2 Technical Condition Safety [41].

Barrier and operational risk analysis of hydrocarbon releases (BORA-Release); Part I Method description
12
Table 3. Generic scheme for scoring of RIFs.
Score Explanation A Status corresponds to the best standard in industry B Status corresponds to a level better than industry average C Status corresponds to the industry average D Status corresponds to a level slightly worse than industry average E Status corresponds to a level considerably worse than industry average F Status corresponds to the worst practice in industry
Several methods for assessing organisational factors are described in the literature (e.g., see [37]). Three approaches for assignment of scores of the RIFs are described in this paper; 1) Direct assessment of the status of the RIFs, 2) Assessment of status by use of results from the TTS projects, and 3) Assessment of status by use of results from the RNNS3 project. Direct assessment of the status of the RIFs in the risk influence diagrams may be carried out in a RIF audit. Usually, a RIF audit is carried out by structured interviews of key personnel on the plant and observations of work performance. Useful aids are behavioural checklists and behaviourally anchored rating scales (BARS) [37]. In addition, surveys may be used as part of the RIF audit as supplement to the other techniques. The TTS project proposes a review method to map and monitor the technical safety level on offshore platforms and land-based facilities based on the status of safety critical elements, safety barriers, and their intended function in major accidents prevention [41]. The TTS project is based on a review technique using defined performance requirements. The condition of safety barriers is measured against best practices as well as minimum requirements. A number of examination activities are defined and used to check each performance requirement, including document reviews, interviews, visual inspections, and field tests. Performance standards are developed for 19 areas, including the containment function, and each performance standard contains a set of performance requirements divided in the four groups function, integrity, survivability, and management. A six point scoring scheme is used in the TTS project that may be directly transformed to the scores in Table 3. Finally, the assessment of the status of the RIFs may be based on results from the RNNS project [42] and accident investigations. The RNNS project includes a broad
3 Risk Level on the Norwegian Continental Shelf [42].

Barrier and operational risk analysis of hydrocarbon releases (BORA-Release); Part I Method description
13
questionnaire survey which addresses general health, environmental, and safety (HES) aspects, risk perception, and safety culture. The surveys are conducted once every second year. Data may be provided as average values for the entire industry, as well as on platform specific basis. By selecting relevant questions from the survey, these data may provide input to scoring of the RIFs for different platforms. However, the data should be further analysed to get scores of the RIFs according to the scheme in Table 3 [43]. Results from accident investigations may be used as a supplement to the results from the RNNS project in order to assess the scores of the RIFs.
3.6 Weighting of risk influencing factors Weighting of the RIFs is an assessment of the effect (or importance) the RIFs has on the frequency of occurrence of the basic events. The weights of the RIFs correspond to the relative difference in the frequency of occurrence of an event if the status of the RIF is changed from A (best standard) to F (worst practice). The weighting of the RIFs is done by expert judgment. In practice, the assessment of the weights is based on a general discussion of the importance with platform personnel and the analysts where the following principles are applied:
1. Determine the most important RIF based on general discussions 2. Give this RIF a relative weight equal to 10 3. Compare the importance of the other RIFs with the most important one, and
give them relative weights on the scale 10 – 8 – 6 – 4 – 2 4. Evaluate if the results are reasonable
The weights then need to be normalized as the sum of the weights for the RIFs influencing a basic event should be equal to 1.
3.7 Adjustment of generic input data Further, the generic input data used in the quantitative analysis is adjusted. The purpose is to assign platform specific values to the input data allowing for platform specific conditions of the RIFs. The generic input data are revised based on the risk influence diagrams through an assessment of the weights and the status of the RIFs. The following principles for adjustment are proposed: Let Prev(A) be the “installation specific” probability (or frequency) of occurrence of event A. The probability Prev(A) is determined by the following procedure;

Barrier and operational risk analysis of hydrocarbon releases (BORA-Release); Part I Method description
14
where Pave(A) denotes the industry average probability of occurrence of event A, wi denotes the weight (importance) of RIF no. i for event A, Qi is a measure of the status of RIF no. i, and n is the number of RIFs. Here,
The challenge is now to determine appropriate values for Qi and wi. To determine the Qi’s we need to associate a number to each of the status scores A - F. The proposed way to determine the Qi’s is;
• Determine Plow(A) as the lower limit for Prev(A) by expert judgment. • Determine Phigh(A) as the upper limit for Prev(A) by expert judgment. • Then put for i =1, 2, … n;
where s denotes the score or status of RIF no i. Hence, if the score s is A, and Plow(A) is 10 % of Pave(A), then Qi is equal to 0.1. If the score s is F, and Phigh(A) is ten times higher than Pave(A), then Qi is equal to 10. If the score s is C, then Qi is equal to 1. Furthermore, if all RIFs have scores equal to C, then Prev(A) = Pave(A), if all RIFs have scores equal to A, then Prev(A) = Plow(A), and if all RIFs have scores equal to F, then Prev(A) = Phigh(A). To assign values to Qi for s = B, we assume a linear relationship between Qi (A) and Qi (C), and we use sA = 1, sB = 2, sC = 3, sD = 4, sE = 5, and sF = 6. Then,
)3(/
1/
)(⎪⎩
⎪⎨
⎧
===
=FsifPPCsifAsifPP
sQ
avehigh
avelow
i
)1()()(1∑=
⋅⋅=n
iiiaverev QwAPAP
)2(11
=∑=
n
iiw

Barrier and operational risk analysis of hydrocarbon releases (BORA-Release); Part I Method description
15
To assign values to Qi for s = D and E, we assume a linear relationship between Qi (C) and Qi (F). Then,
Qi (E) is calculated as Qi (D) by use of sE instead of sD in formual (5). Figure 3 shows different values of Qi depending on different values of Plow and Phigh;
1. Plow = Pave / 10, and Phigh = 10 · Pave, 2. Plow = Pave / 5, and Phigh = 5 · Pave, 3. Plow = Pave / 3, and Phigh = 3 · Pave, 4. Plow = Pave / 5, and Phigh = 2 · Pave,
Figure 3. Different values of Qi..
3.8 Recalculation of the risk The final step of BORA-Release is to determine the platform specific risk of hydrocarbon release by applying the platform specific input data (Prev(A)) for all events in the risk model. Use of these revised input data results in an updated risk picture including analysis of the effect of the performance of the safety barriers
)4()1()(
)(AC
ave
lowAB
ave
lowi ss
PPss
PPBQ
−
−⋅−+=
)5()1()(
1)(CF
ave
highCD
i ssPP
ssDQ
−
−⋅−+=
0
1
2
3
4
5
6
7
8
9
10
1 2 3 4 5 6
Score 1 2 3 4

Barrier and operational risk analysis of hydrocarbon releases (BORA-Release); Part I Method description
16
introduced to prevent hydrocarbon release. The revised risk picture takes the platform specific conditions of technical, human, operational, and organisational RIFs into consideration.
4 Discussion The discussion is divided in three main parts. The first part contains a discussion of the different steps in BORA-Release. Part two contains a discussion to what extent the criteria presented in section 2 are fulfilled, while application areas of BORA-Release are discussed in part three.
4.1 Discussion of BORA-Release Development of a basic risk model The basic risk model developed as part of BORA-Release may be seen as an extended QRA-model compared to the current status of QRA for three reasons:
1. It facilitates a detailed modelling of loss of containment including initiating events reflecting different causal factors of hydrocarbon release and safety barriers introduced to prevent release
2. The risk model incorporates different operational barriers such as use of self control of work/checklists, 3rd party control of work, and inspection to detect corrosion
3. Event trees and fault trees are linked together in one common risk model No analysis of causal factors of hydrocarbon release is carried out in existing QRA, but the calculation of the release frequency is based on a combination of counting of process equipment and historic leak frequencies for the different equipment categories. In some cases, platform specific release statistics are used for updating of the QRA. Development of a risk model with a set of hydrocarbon release scenarios and RIFs answers the criticism formulated by e.g., Kafka [44] that the existing QRA are not suitable for analysing the effect of the most effective safety measures to avoid initiating events. Combination of barrier block diagrams/event trees and fault trees is an attractive modelling technique as barrier block diagrams makes it possible to give a clear and consistent representation and illustration of the different barrier systems that fulfil the defined barrier functions introduced to prevent hydrocarbon release. The approach enables a separate analysis of each barrier at the desired level of detail. The barrier block diagrams may be generic for several platforms, however, the

Barrier and operational risk analysis of hydrocarbon releases (BORA-Release); Part I Method description
17
detailed analysis of the different safety barriers may be platform specific. A challenge for some scenarios is to define the initiating events in such a way that they are suitable for quantitative analysis. Modelling the performance of safety barriers BORA-Release is based on a broad view on safety barriers, which means that the performance of different types of safety barriers like the process shutdown system, 3rd party control of work, and the inspection program need to be analysed. The chosen method for analysis of the performance of safety barriers is fault tree analysis. The fault trees are linked to the event trees in one common risk model. The fault tree analysis will not necessarily cover all attributes relevant for analysis of the barrier performance, and there may be need to carry out other analysis (e.g., human reliability analysis (HRA), analysis of fire and explosion loads, impairment analysis, and qualitative assessments of barrier functionality). As part of the case study, another approach was used to analyse the effectiveness of the inspection barrier (see [26] for further details). Assignment of generic input data and risk quantification based on these data Assignment of generic input data implies use of generic databases in addition to extraction of platform specific information regarding operational conditions, experience from surveillance of operational activities, and testing of technical systems. Recovery of data from internal databases or surveillance systems may require extensive manual work and often some interpretations of the recorded data may be necessary. Due to the novelty of the modelling of the containment, relevant data are lacking for some barriers. The availability of relevant human reliability data are low, as there is need for collection of data to support the analysis. Alternatively, some expert judgment sessions may be carried out in order to generate relevant data. Development of risk influence diagrams A combination of a top-down approach and a bottom-up approach is used to develop risk influence diagrams. The top-down approach by using a predetermined framework for identification of RIFs ensures that the RIFs are identified and defined in the same manner in different analysis, while the bottom-up approach ensures that unique RIFs for specific plants are identified and assessed. To reduce the total number of RIFs in the overall analysis, a maximum of six RIFs are allowed for each basic event.

Barrier and operational risk analysis of hydrocarbon releases (BORA-Release); Part I Method description
18
The framework used to identify RIFs and develop risk influence diagram consists of characteristics of the personnel, the task, the technical system, administrative control, and organisational factors/operational conditions. The framework is based on a review, comparison, and synthesis of several schemes of classification of MTO-factors. While traditional performance influence factors (PIFs) as reviewed by Kim and Jung [45] focuses on factors influencing human failure events, the RIF framework presented in subsection 3.4 also includes factors influencing hardware (system/component) failure events (e.g., material properties and program for preventive maintenance). However, the main groups in the RIF framework are similar to a model of the task context of nuclear power plants described by Kim and Jung [45]. The main difference is that we have defined an additional group called administrative control including for example procedures, as Kim and Jung [45] include as part of the task. Further, we have defined organisational factors/operational conditions as a separate group (and not as part of the environment). Experience from the case study indicates that the main groups in the framework are adequate for identification of RIFs. But the list of generic RIFs in Table 2 may be supplemented by more RIFs to cover all the basic events included in the analyses of barrier performance. This implies that the list of generic RIFs may be a “living” document that may be revised due to more experience by use of the list. Scoring of risk influencing factors A six-point score scheme is used for assignment of scores to the RIFs and the scores are related to different levels in the industry. Three anchor points are defined where score A corresponds to the best standard in the industry, score C corresponds to the industry average standard, and score F corresponds to the worst practice in the industry. The rationale behind is that industry average data reflects the industry average standard as regards status of the RIFs. The argument for the misalignment of the scores (A and B better than average, and D, E, and F worse than average) is that the existing safety level within the industry is so high that the potential for declining in the status is greater than the improvement potential. Three approaches for giving scores to the RIFs are described. The approaches may be used separately, or combined in order to assign scores. The first approach, direct assessment of the status of the RIFs by a RIF-audit is the most resource demanding approach. However, this approach may ensure a high validity4 of the assignment of
4 Validity refers to whether or not it measures what it is supposed to measure. [46]