Embed Size (px)
Citation preview

Safer care saves money: How to improve patientcare and save public money at the same time.
Methodological supplement
Greg Moran, Hugh Parsonage and Stephen Duckett
Safer care saves money: How to improve patient care and save public money at the same time. Methodological supplement
Table of contents
1 Introduction . . . . . . . . . . . . . . . . . . . . . . . . . . . . . 3
2 Data used to estimate the cost of complications . . . . . . . . . 4
3 Review of previous approaches to estimating the cost of
complications . . . . . . . . . . . . . . . . . . . . . . . . . . . . 9
4 Our approach to estimating the cost of complications . . . . . . . 12
5 Funding implications of complications . . . . . . . . . . . . . . . 29
6 Savings estimates . . . . . . . . . . . . . . . . . . . . . . . . . 30
7 Cost efficiency vs safety performance . . . . . . . . . . . . . . . 32
8 Sentinel event analysis . . . . . . . . . . . . . . . . . . . . . . . 34
9 Specialty analysis . . . . . . . . . . . . . . . . . . . . . . . . . . 45
Grattan Institute 2018 2
Safer care saves money: How to improve patient care and save public money at the same time. Methodological supplement
1 Introduction
This methodological supplement provides detailed explanation of six
pieces of the analysis in Safer care saves money :
• Our estimates of the costs of complications.
• Our comparison of the costs and funding implications of complica-
tions.
• Our estimates of the cost savings to be made from improving
safety performance.
• The relationship between hospitals’ cost efficiency and perfor-
mance.
• Our analysis of sentinel events using routine data.
• Our modelling of hospital safety performance by specialty.
The first three sections relate to the econometric analysis we undertook
to estimate the cost of complications. These sections are organised
as follows. Chapter 2 describes the data we used. Chapter 3 reviews
previous approaches to using regression analysis to estimate the
cost of complications. Chapter 4 describes our regression model and
discusses our key results.
In Chapter 5 we discuss how we compared the costs and funding
implications of complications for individual hospitals.
In Chapter 6 we describe how we estimated the cost savings to be
made from improving safety performance.
In Chapter 7 we explain how we assessed the relationship between
hospitals’ cost efficiency and performance in the area of medical
multiday cardiology admissions.
In Chapter 8 we explain how we identified sentinel events in the routine
data.
Finally, in Chapter 9 we provide an overview of the method we used to
analyse the distribution of hospital risk by specialty.
Grattan Institute 2018 3
Safer care saves money: How to improve patient care and save public money at the same time. Methodological supplement
2 Data used to estimate the cost of complications
In estimating the costs of complications, our core dataset is the
2014-15 National Hospital Cost Data Collection (NHCDC) for the
public sector. This unique dataset is the primary input to determining
the National Efficient Price (NEP) and National Efficient Cost (NEC)
for the funding of public hospital services.1 We are grateful to the
Independent Hospital Pricing Authority (IHPA) for providing this data
and their assistance during our preparation of this report. The data file
received from IHPA contained patient, episode and cost information for
5,282,843 admissions of acute and newborn care in public hospitals.
2.1 Cleaning and preparation
Our initial cleaning and preparation of the data involved the following:
• We dropped admissions that involved an operating room proce-
dure that was unrelated to the principal diagnosis, or involved
atypical or invalid information. These admissions have a Diagnosis
Related Group (DRG) prefix of ‘8’ or ‘9’, respectively.2 Our data
has the 6th, 7th and 8th versions of the Australian Refined DRG
(AR-DRG) reported. If any of the versions had an ‘8’ or ‘9’ prefix, it
was excluded. This dropped 11,946 admissions.
• We dropped admissions of newborn care (care types 7.1 and 7.2),
leaving just acute admissions (care type 1). This dropped a further
53,806 admissions.
1. See: https://www.ihpa.gov.au/what-we-do/nhcdc.
2. The DRG system is a patient classification system developed to provide a clinically
meaningful way of relating the number and type of patients treated in a hospital to
the resources required by the hospital. Each DRG represents a class of patients
with similar clinical conditions requiring similar hospital resources; AIHW (2016,
p. 5).
• We truncated to 40 columns both our diagnosis code array (down
from 100) and our procedure code array (down from 50). This
is because the algorithm we use to identify complications in
the data – the Classification of Hospital Acquired Diagnoses
Plus (CHADx+) – only reads up to the 40th column. We do not
consider this a material loss of information as there are just
1,104 admissions with more than 40 diagnosis codes, and 201
admissions with more than 40 procedure codes.
• We dropped admissions at hospitals that did not record a single
condition onset flag equal to one (COF=1) – that is, hospitals
that did not record any diagnoses as being hospital acquired. We
considered that an absence of COF=1 likely reflected a coding
issue, although that this was potentially less true for some small
hospitals which may have genuinely not had any hospital-acquired
diagnoses. This exclusion dropped 16 hospitals and a further
12,356 admissions in total.3
As we proceeded with our analysis, the following additional exclusions
were required:
• We dropped a further two admissions that were found to have
invalid diagnosis codes.
• We dropped a further 10 admissions involving a patient who was
intersex or whose sex was indeterminate, and three admissions
where sex was not stated or inadequately described. We made
3. We also examined the ratios at individual hospitals of the number of valid condition
onset flags reported (i.e. equal to 1 or 2) to the number of diagnosis codes
reported. The lowest ratio observed at a hospital was 0.97, suggesting that all
hospitals were reporting a condition onset flag for essentially every diagnosis code
they reported (although coding practices in some states or hospitals may mean
that they are more or less likely to record COF=1).
Grattan Institute 2018 4
Safer care saves money: How to improve patient care and save public money at the same time. Methodological supplement
these exclusions because we use a binary classification of sex for
computational simplicity in our regression analysis.
• We dropped a further 296 admissions that had an error DRG after
their DRG was reassigned excluding those additional diagnoses
and procedures that were identified as being complications by the
CHADx+ algorithm. Our use of this reassigned DRG variable is
explained later in this supplement.
In total, we excluded 78,419 admissions leaving 5,204,424 admissions
and 328 hospitals in our core data.
2.2 Identifying complications in our data
We used the CHADx+ version 1.4 program for SAS to identify com-
plications in our data.4 This program was provided by the Victorian
Department of Health and Human Services. We describe CHADx+ in
detail in Section 1.2.1 of the methodological supplement to our previous
report All complications should count: Using our data to make hospitals
safer.5
CHADx+ v.1.4 includes a data-cleaning algorithm that ‘turns off’ in-
stances of COF=1 for any diagnoses that could not have been acquired
during the hospital admission. Prior to application of this algorithm, 9.6
per cent of the episodes in our data had at least one diagnosis code
that had been flagged as hospital acquired. After application, this rate
fell to 9.4 per cent.
CHADx+ v.1.4 contains a number of different specifications relative
to the versions of CHADx that appear to have been used in other
analyses. It was crucial for us to investigate and understand these
differences in order to:
4. See Jackson et al. (2009) for more information about CHADx.
5. Danks and Duckett (2018).
• have comfort that we assigned CHADx+ classes to our data
correctly; and
• understand differences between our results and those published
elsewhere.
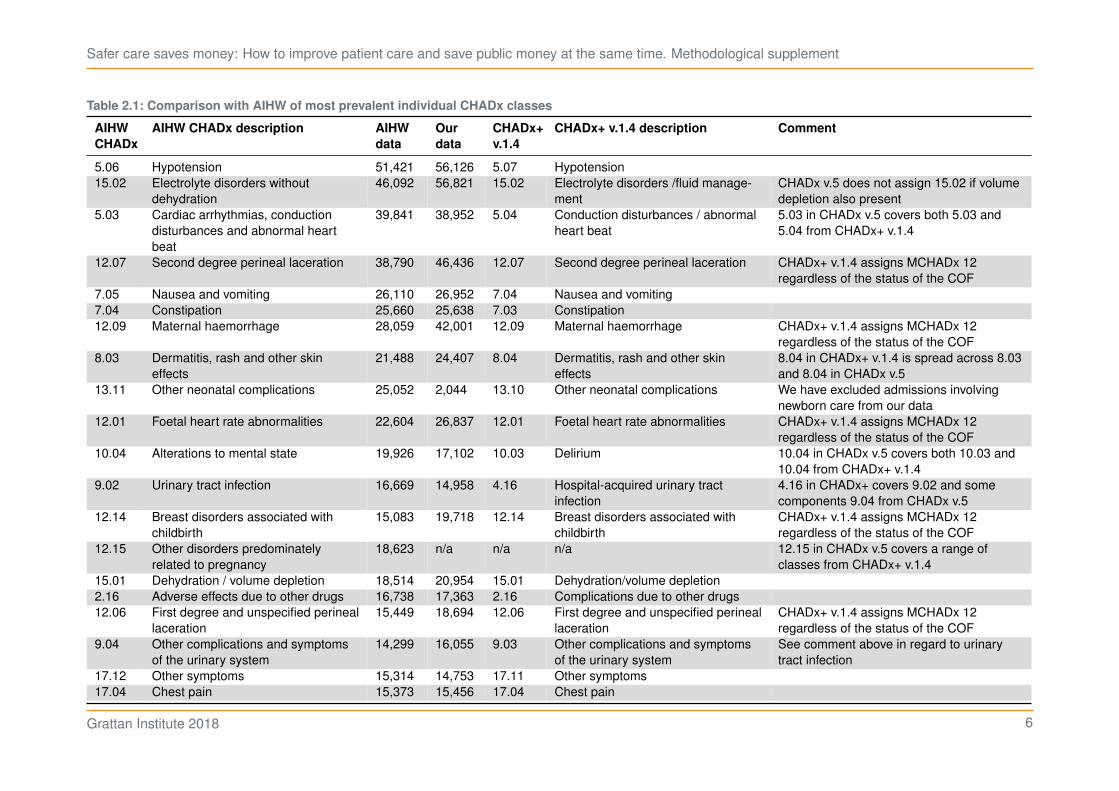
For these purposes, we primarily compared our CHADx+ assignment
against CHADx data published by the Australian Institute of Health
and Welfare (AIHW) in its 2014-15 Admitted Patient Care report (see
Table 2.1 on the following page and Table 2.2 on page 7).6 The AIHW
appears to have used CHADx version 5, as this was the version that
was on the Australian Commission on Safety and Quality in Health
Care’s (ACSQHC) website in December 2014 when AIHW reportedly
accessed it.7
6. Tables 8.5 and 8.6 of AIHW (2016).
7. According to the references list in AIHW (ibid.).
Grattan Institute 2018 5
Safer care saves money: How to improve patient care and save public money at the same time. Methodological supplement
Table 2.1: Comparison with AIHW of most prevalent individual CHADx classes
AIHW
CHADx
AIHW CHADx description AIHW
data
Our
data
CHADx+
v.1.4
CHADx+ v.1.4 description Comment
5.06 Hypotension 51,421 56,126 5.07 Hypotension
15.02 Electrolyte disorders without
dehydration
46,092 56,821 15.02 Electrolyte disorders /fluid manage-
ment
CHADx v.5 does not assign 15.02 if volume
depletion also present
5.03 Cardiac arrhythmias, conduction
disturbances and abnormal heart
beat
39,841 38,952 5.04 Conduction disturbances / abnormal
heart beat
5.03 in CHADx v.5 covers both 5.03 and
5.04 from CHADx+ v.1.4
12.07 Second degree perineal laceration 38,790 46,436 12.07 Second degree perineal laceration CHADx+ v.1.4 assigns MCHADx 12
regardless of the status of the COF
7.05 Nausea and vomiting 26,110 26,952 7.04 Nausea and vomiting
7.04 Constipation 25,660 25,638 7.03 Constipation
12.09 Maternal haemorrhage 28,059 42,001 12.09 Maternal haemorrhage CHADx+ v.1.4 assigns MCHADx 12
regardless of the status of the COF
8.03 Dermatitis, rash and other skin
effects
21,488 24,407 8.04 Dermatitis, rash and other skin
effects
8.04 in CHADx+ v.1.4 is spread across 8.03
and 8.04 in CHADx v.5
13.11 Other neonatal complications 25,052 2,044 13.10 Other neonatal complications We have excluded admissions involving
newborn care from our data
12.01 Foetal heart rate abnormalities 22,604 26,837 12.01 Foetal heart rate abnormalities CHADx+ v.1.4 assigns MCHADx 12
regardless of the status of the COF
10.04 Alterations to mental state 19,926 17,102 10.03 Delirium 10.04 in CHADx v.5 covers both 10.03 and
10.04 from CHADx+ v.1.4
9.02 Urinary tract infection 16,669 14,958 4.16 Hospital-acquired urinary tract
infection
4.16 in CHADx+ covers 9.02 and some
components 9.04 from CHADx v.5
12.14 Breast disorders associated with
childbirth
15,083 19,718 12.14 Breast disorders associated with
childbirth
CHADx+ v.1.4 assigns MCHADx 12
regardless of the status of the COF
12.15 Other disorders predominately
related to pregnancy
18,623 n/a n/a n/a 12.15 in CHADx v.5 covers a range of
classes from CHADx+ v.1.4
15.01 Dehydration / volume depletion 18,514 20,954 15.01 Dehydration/volume depletion
2.16 Adverse effects due to other drugs 16,738 17,363 2.16 Complications due to other drugs
12.06 First degree and unspecified perineal
laceration
15,449 18,694 12.06 First degree and unspecified perineal
laceration
CHADx+ v.1.4 assigns MCHADx 12
regardless of the status of the COF
9.04 Other complications and symptoms
of the urinary system
14,299 16,055 9.03 Other complications and symptoms
of the urinary system
See comment above in regard to urinary
tract infection
17.12 Other symptoms 15,314 14,753 17.11 Other symptoms
17.04 Chest pain 15,373 15,456 17.04 Chest pain
Grattan Institute 2018 6
Safer care saves money: How to improve patient care and save public money at the same time. Methodological supplement
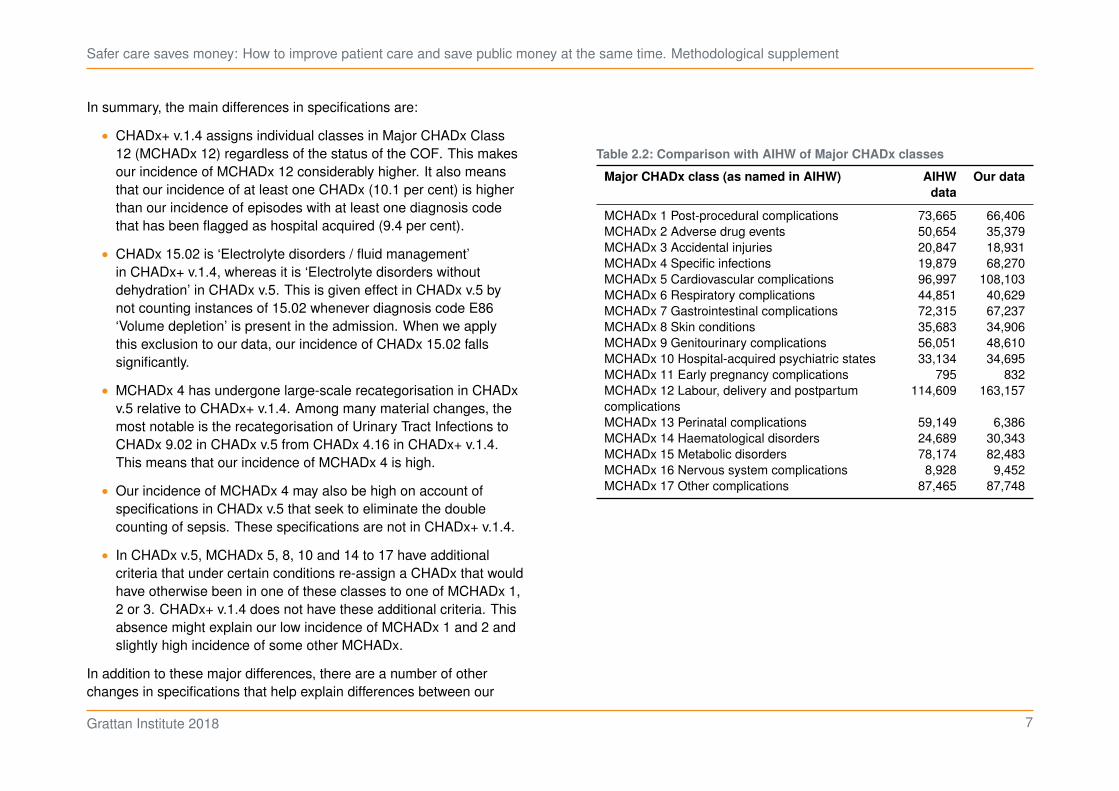
In summary, the main differences in specifications are:
• CHADx+ v.1.4 assigns individual classes in Major CHADx Class
12 (MCHADx 12) regardless of the status of the COF. This makes
our incidence of MCHADx 12 considerably higher. It also means
that our incidence of at least one CHADx (10.1 per cent) is higher
than our incidence of episodes with at least one diagnosis code
that has been flagged as hospital acquired (9.4 per cent).
• CHADx 15.02 is ‘Electrolyte disorders / fluid management’
in CHADx+ v.1.4, whereas it is ‘Electrolyte disorders without
dehydration’ in CHADx v.5. This is given effect in CHADx v.5 by
not counting instances of 15.02 whenever diagnosis code E86
‘Volume depletion’ is present in the admission. When we apply
this exclusion to our data, our incidence of CHADx 15.02 falls
significantly.
• MCHADx 4 has undergone large-scale recategorisation in CHADx
v.5 relative to CHADx+ v.1.4. Among many material changes, the
most notable is the recategorisation of Urinary Tract Infections to
CHADx 9.02 in CHADx v.5 from CHADx 4.16 in CHADx+ v.1.4.
This means that our incidence of MCHADx 4 is high.
• Our incidence of MCHADx 4 may also be high on account of
specifications in CHADx v.5 that seek to eliminate the double
counting of sepsis. These specifications are not in CHADx+ v.1.4.
• In CHADx v.5, MCHADx 5, 8, 10 and 14 to 17 have additional
criteria that under certain conditions re-assign a CHADx that would
have otherwise been in one of these classes to one of MCHADx 1,
2 or 3. CHADx+ v.1.4 does not have these additional criteria. This
absence might explain our low incidence of MCHADx 1 and 2 and
slightly high incidence of some other MCHADx.
In addition to these major differences, there are a number of other
changes in specifications that help explain differences between our
Table 2.2: Comparison with AIHW of Major CHADx classes
Major CHADx class (as named in AIHW) AIHW
data
Our data
MCHADx 1 Post-procedural complications 73,665 66,406
MCHADx 2 Adverse drug events 50,654 35,379
MCHADx 3 Accidental injuries 20,847 18,931
MCHADx 4 Specific infections 19,879 68,270
MCHADx 5 Cardiovascular complications 96,997 108,103
MCHADx 6 Respiratory complications 44,851 40,629
MCHADx 7 Gastrointestinal complications 72,315 67,237
MCHADx 8 Skin conditions 35,683 34,906
MCHADx 9 Genitourinary complications 56,051 48,610
MCHADx 10 Hospital-acquired psychiatric states 33,134 34,695
MCHADx 11 Early pregnancy complications 795 832
MCHADx 12 Labour, delivery and postpartum
complications
114,609 163,157
MCHADx 13 Perinatal complications 59,149 6,386
MCHADx 14 Haematological disorders 24,689 30,343
MCHADx 15 Metabolic disorders 78,174 82,483
MCHADx 16 Nervous system complications 8,928 9,452
MCHADx 17 Other complications 87,465 87,748
Grattan Institute 2018 7
Safer care saves money: How to improve patient care and save public money at the same time. Methodological supplement
results and those published by the AIHW. For brevity, we do not go
through these here.
Finally, we chose not to count ventilatory support (CHAPx 1.01
and 1.02) as a complication when it occurred during an emergency
admission. In many of these admissions the use of ventilatory support
would be expected and therefore not a ‘complication’. Other classes
of CHADx and CHAPx may to a lesser extent also reflect routine,
in-hospital developments. Indeed, as was pointed out to us by one
stakeholder, even in some elective admissions ventilatory support
would be anticipated. However, it was beyond the scope of our work
to parse all CHADx and CHAPx classes for this issue. Ventilatory
support in emergency admissions was singled out because it could
be easily addressed, is costly and relatively common, and to consider
it a complication could lead to significantly overstating the total cost of
complications to the hospital system.
Grattan Institute 2018 8
Safer care saves money: How to improve patient care and save public money at the same time. Methodological supplement
3 Review of previous approaches to estimating the cost of complications
Our first step in conducting our own econometric analysis of the costs
of hospital-acquired complications was to review the methods used
in the three major contributions to the literature that are particularly
relevant to the Australian setting:
• Jackson, T., Nghiem, H.S., Rowell, D., Jorm, C., & Wakefield, J.
(2011). ‘Marginal costs of hospital-acquired conditions: information
for priority-setting for patient safety programmes and research’.
Journal of Health Services Research & Policy, 16(3), 141-146.
• Jackson, T., Fong, A., Liu, M., Murray, K., Walz, L., Houston, C.,
& Dean, S. (2013, under review). Incremental costs of hospital-
acquired complications in Alberta, Canada.
• Health Policy Analysis (2013). Analysis of hospital-acquired
diagnoses and their effect on case complexity and resource use
– Final report. Australian Commission on Safety and Quality in
Health Care, Sydney.
3.1 Jackson et al. (2011)
The authors estimated incremental costs of CHADx using public
hospital data from Victoria and Queensland from 2005-06 and 2006-07,
respectively.
They identified that the cost of a hospital episode includes: the cost
of treating the primary diagnosis (i.e. the reason for admission); any
additional costs attributable to co-morbidities; and the cost of any
hospital-acquired diagnoses.
They then defined the ‘uncomplicated treatment cost’ as the portion
of each episode’s cost that is attributable to the principal diagnosis
and co-morbidities. This is calculated for each AR-DRG as the mean
cost of all episodes with no CHADx present. The ‘mean corrected
treatment cost’ is then calculated as the portion of each episode’s cost
that remains after subtracting the relevant AR-DRG’s uncomplicated
treatment cost.
The authors then regressed mean corrected treatment cost on dummy
variables representing:
• the presence of individual CHADx classes;
• whether the patient died in hospital; and
• whether the episode was sameday.
Despite the dependent variable not being normally distributed, the au-
thors considered that standard linear regression techniques (i.e. OLS)
were appropriate given their large sample size (consistent with the
findings of Lumley et al., 2002). The merit of log transformation was
considered against the merit of more-easily interpretable regression
coefficients.
The authors found coefficients on the CHADx variables that are mainly
positive and significant; and coefficients on the death and same day
dummies that are negative and significant. Overall, the regression had
an adjusted R-squared of 0.193.
Finally, the authors recognised that their estimates of incremental costs
do not reflect any non-random and potentially likely clustering of the
presence of multiple CHADx.
3.1.1 Bolbocean et al. (2012) response
In 2012, the Journal of Health Services Research & Policy published a
response by Bolbocean et al. to Jackson et al. (2011). This response
Grattan Institute 2018 9
Safer care saves money: How to improve patient care and save public money at the same time. Methodological supplement
raised a number of criticisms, most of which appear to have been
heeded in subsequent regression approaches.
The main criticisms were:
• Additional patient risk factors should have been included as control
variables in the regression model, such as age and comorbidities.
• GLS should have been used instead of OLS because the assump-
tion of independent disturbances is likely violated.
The response concluded that the costs reported by Jackson et al.
(2011) were likely overstated owing to the potential deficiencies that
Bolbocean et al. identified.
3.2 Jackson et al. (2013)
In this subsequent paper, the authors estimated incremental costs
of adapted CHADx using data from eight large hospitals in Alberta,
Canada from 2008-09.
They used a generalised linear model (GLM) with a gamma distribution
and log link relationship between total cost of the episode and 144
CHADx classes, controlling for: the mean cost of uncomplicated cases
in each Case Mix Group (equivalent to AR-DRG); sameday admissions;
and death.
In support of this approach, the authors noted:
• Inclusion of the mean cost of the uncomplicated case as a variable
in the model allows interpretation of coefficients (after antilog
transformation) as median incremental costs.
• Results of a modified Park test suggested the use of a gamma
distribution.
• GLM was chosen over OLS due to the cost data being highly
skewed (skewness of 17.8).
The authors evaluated their model using a Cox and Snell maximum
likelihood R-squared – they found a value of 0.68.
3.3 Health Policy Analysis (2013)
The authors estimated the incremental costs of hospital-acquired
complications (including CHADx) using the 2011-12 NHCDC for a
select number of Adjacent DRGs (AdjDRGs).8 The AdjDRGs of interest
were determined by the ACSQHC, which commissioned the report. The
report also looked at he effects of hospital-acquired complications on
AR-DRG assignment and length of stay.
Initial exclusions applied to the data were: hospitals not reporting the
COF; hospitals not in peer groups A1 to C2; and episodes that were not
acute care or newborn care with qualified days.
The authors estimated four models that, respectively, estimated the
incremental cost impact of the presence of: at least one hospital-
acquired diagnosis; the MCHADx classes; individual CHADx classes
from among 33 classes of interest; individual CHADx classes from
among all 145 classes (although with pregnancy and childbirth-related
classes in MCHADx 11 to 13 grouped together).
Each model used the same set of control dummies:
• Hospital – to control for differences in hospital efficiency.
• Patient Clinical Complexity Level (PCCL) – to control for within-
AdjDRG heterogeneity. Introduced as a class variable, such that
parameters are estimated for each PCCL separately.
8. An AdjDRG is a set of DRGs differentiated by their relative complexity and
resource consumption. For example, the AdjDRG E66 ‘Major Chest Trauma’
comprises the DRGs E66A, E66B and E66C which are, respectively, ‘Major
Chest Trauma’ ‘with catastrophic complications or comorbidities’, ‘with severe
or moderate complications or comorbidities’, and ‘without complications or
comorbidities’. An AdjDRG can have between one and four levels of resource
consumption.
Grattan Institute 2018 10

Safer care saves money: How to improve patient care and save public money at the same time. Methodological supplement
• Age – broken into the groups 0 to 14, 15 to 44, 70 to 84 and 85+
(such that the base case is a patient aged 45 to 69).
• Emergency admission.
• Death.
• Episodes transferred within less than two days – these episodes
often have lower costs than others in the same AdjDRG on
account of the patient likely being transferred to another care
facility where the episode of care is presumably continued.
• Sameday admission.
Each of the four models was estimated for each of the 22 AdjDRGs
of interest. Moreover, AdjDRGs were regrouped following the removal
of both hospital-acquired diagnoses and procedure codes that lead to
assignment to tracheostomy and ventilation AR-DRGs (AdjDRG A06).
The authors stated they removed the latter because of previous
research that showed that ‘many episodes with very significant
hospital-acquired conditions are likely to end up in these AR-DRGs’.9
Our interpretation of this was as follows. It would appear that, in some
of these episodes, the complications have necessitated procedures
that have in turn determined the AR-DRG assignment. If only the
complication diagnosis were removed, then AR-DRG assignment
would still reflect the procedures that might not have needed to occur.
Therefore, the relevant procedure codes also need to be removed in
order to ‘properly’ reassign the AR-DRG.
Regressions were undertaken using OLS as well as GLM with a log
link and gamma distribution (the authors noted the previous use of
this approach for skewed cost data). Models were also estimated both
including sameday admissions (with the sameday control variable
9. Health Policy Analysis (2013, p. 33).
included) and for overnight admissions only. In their reporting, the
authors focused on results for overnight admissions only.
Incremental costs were estimated by comparing predicted cost of the
uncomplicated admission (i.e. assuming no CHADx were present in
that admission) with predicted cost of the admission with the presence
of the CHADx of interest (and seemingly no other CHADx). This
difference was calculated for each episode in the dataset, then means
and medians taken.
Grattan Institute 2018 11

Safer care saves money: How to improve patient care and save public money at the same time. Methodological supplement
4 Our approach to estimating the cost of complications
We looked to build upon the work of Health Policy Analysis (2013)
and others by specifying a new regression model for estimating the
incremental costs of complications as defined by CHADx+.
There are a number of reasons why we took a new approach:
• We were interested in estimating the incremental costs of CHADx+
across a broad range of hospital admissions, not just a select
number of AdjDRGs.
• Because we were interested primarily in single estimates of
the incremental cost of individual complications across a broad
range of hospital admissions, we estimated our model(s) across
admissions from multiple DRGs while controlling for (among other
things) DRG and admission complexity within the model(s). This
is in contrast to Health Policy Analysis (ibid.), which estimated its
models for each AdjDRG of interest individually.
• We sought to better control for patient risk factors by including
additional control variables.
4.1 Model specification
We followed the basic approach set out in Health Policy Analysis
(ibid.) and elsewhere. This involved regressing the cost of a hospital
admission on variables indicating: the presence of complications;
and other characteristics of the admission or the patient that are
determinants of the admission’s cost.
More specifically, our basic model took the following form:
𝑇 = 𝛼+ 𝛽 𝛿complication +
18∑︁
𝑗=1
𝛾𝑗 𝛿comorb𝑗 +
328∑︁
𝑘=1
𝛾𝑘 𝛿hospital𝑘
+
748∑︁
ℓ=1
𝛾ℓ 𝛿DRGℓ+
𝑀∑︁
𝑚=1
𝛾𝑚 𝛿control𝑚 + 𝜀
where:
𝑇 is the total cost of a hospital admission. Note that, as explained
in Section 4.3, our main estimation approach actually uses the
natural log of total cost.
𝛿complication is a dummy variable that indicates whether there was during
the admission at least one of any complication. We also used a
second specification where this term is replaced by∑︀
175
𝑖=1𝛽𝑖𝛿𝑖,
which indicates whether there was during the admission at least
one occurrence of the 𝑖-th individual CHADx+ class (of 175 in total:
16 minor CHAPx classes and 159 minor CHADx classes).
𝛿comorb𝑗 is a dummy variable that indicates whether the 𝑗-th refined
body system category of the Multipurpose Australian Comorbidity
Scoring System (MACSS) applied to the patient (of 18 in total).10
𝛿hospital𝑘 is a dummy variable that indicates whether the admission
occurred at the 𝑘-th hospital in the sample (of 328 in total).
𝛿DRGℓis a dummy variable that indicates whether the ℓ-th DRG in the
sample applied to the episode (of 748 in total).
10. Toson et al. (2016). Our refined body system categories are explained in
Section 1.3.4 of Danks and Duckett (2018).
Grattan Institute 2018 12
Safer care saves money: How to improve patient care and save public money at the same time. Methodological supplement
𝛿control𝑚 includes dummy variables indicating whether the patient was:
• female;
• an Aboriginal and/or Torres Strait Islander;
• an emergency admission;
• aged 0 to 14;
• aged 15 to 44;
• aged 70 to 84;
• aged 85+;
• whether they died during the admission;
• whether they were transferred to another care facility within
two days; or
• whether the admission was sameday.
Each variable is discussed in more detail below.
A notable omission from the model specification is length of stay.
It’s reasonable to expect that the length of a hospital admission is a
significant determinant of the admission’s cost. However, length of
stay is likely related to our variable of interest – the presence of a
complication. It’s possible that complications lead to longer lengths of
stay, other things being equal. We want our regression to attribute the
additional cost of the longer length of stay to the complication.
4.1.1 Dependent variable – total cost
Our dependent variable is the total cost of the admission. We calcu-
lated total cost by summing all direct and overhead cost buckets. This
includes ‘ED Pro cost’, which are the costs incurred in the emergency
department by patients admitted via the emergency department.
4.1.2 Independent variables
Complications
As discussed, we identified complications in our data using CHADx+
v.1.4. We estimated two model specifications. First, we estimated the
incremental effect on cost of the presence of at least one of any com-
plication (the ‘any complication model’). This approach is consistent
with the approach in All complications should count: Using our data to
make hospitals safer, where at least one of any complication was the
dependent variable in our regression analysis of hospital performance.
Second, we estimated the incremental effects on cost of each individual
class of CHADx+ (the ‘individual complications model’). This approach
allows us to identify the individual classes of complications that are
most costly.
Comorbidities
We would expect inclusion of DRG to go a considerable way in
controlling for our expectation that sicker and more complex patients
will tend to incur more costs.
Yet we went further in controlling for the ‘sickness’ of patients by includ-
ing variables that represent the MACSS. These types of comorbidity
scoring systems are widely used to ‘risk adjust’ patient data in health
care analysis.
For simplicity, we used our refined body system categories,11 which
condense the 102 MACSS labels to 18 categories. Moreover, MACSS
are assigned after the removal of CHADx+ diagnoses and procedures,
and procedures that lead to assignment to AdjDRG A06 (tracheostomy
and/or ventilation). This was to try to ensure that our comorbidity
11. See Section 1.3.4 of Danks and Duckett (2018) for an explanation of our refined
body system categories.
Grattan Institute 2018 13
Safer care saves money: How to improve patient care and save public money at the same time. Methodological supplement
variable reflected only those comorbidities that the patient had upon
admission, and to avoid multicollinearity between this variable and the
CHADx+ variables in our model.
Hospital
We included the identity of the hospital in the regression to control for
potential differences in the efficiency and coding practices of different
hospitals.
DRG
Different types of hospital admission will of course tend to incur
different amounts of cost. Admissions that involve sicker patients or
more-complex procedures will tend to incur more costs.
DRGs identify clinically and/or procedurally similar episodes that may
be expected, other things being equal, to incur a similar costs.
The DRGs we used were assigned after the removal of CHADx+
diagnoses and procedures, and procedures that lead to assignment
to AdjDRG A06 (tracheostomy and/or ventilation). This approach was
employed by Health Policy Analysis (2013), and recognises ‘that the
presence of a [CHADx] diagnosis is the variable of interest, therefore
modelling should not control for these factors’.12
Female
Given the potential for different complexities owing to the differences
in male and female body systems, we included a dummy for whether a
patient was female.
12. Health Policy Analysis (2013, p. 39).
Aboriginal and/or Torres Strait Islander
The health disadvantage experienced on average by Indigenous
Australians is well established.13 To control for any such disadvantage
present in our data, manifest in greater ‘sickness’ or ‘complexity’ not
adequately controlled for elsewhere, we included a dummy variable that
indicates whether a patient was Aboriginal and/or Torres Strait Islander.
Those explicitly not Aboriginal and/or Torres Strait Islander and those
whose Indigenous status was not reported were grouped together.
Emergency admissions
We expected that emergency admissions might have a different cost
profile to other admissions as they likely involve less planning and
control of the care provided (at least initially). In addition, emergency
admissions may involve increased overhead costs.
Age
We included age dummies to control for the differences that we might
expect from people of different ages in ‘sickness’, complexity, and
ability to recover from illness, injury or procedures. We used the same
age brackets as Health Policy Analysis (ibid.).
Death
Whether the patient died in hospital was used as a dummy variable in
each of Jackson et al. (2011), Jackson et al. (2013) and Health Policy
Analysis (2013). We also used the variable.
We envisaged two countervailing effects that death may have on the
cost of a hospital admission.
13. AIHW (2015).
Grattan Institute 2018 14

Safer care saves money: How to improve patient care and save public money at the same time. Methodological supplement
On the one hand, death essentially truncates an episode of care,
meaning the costs of ongoing care that would otherwise have been
provided are not incurred.
On the other hand, patients that die in hospital are likely to be among
the ‘sickest’ and most complex, with the most severe complications.
In this case, we might expect patients that eventually die in hospital to
have relatively higher costs of care during their admission.
Early transfer
We considered that an admission that has been transferred to another
care facility within two days may have lower costs (all else equal)
than others in the same DRG as the episode of care is presumably
continued at the second facility.
Sameday admissions
We considered that admissions that begin and end on the same day
may be materially less complex and resource intensive than other
admissions, including those from the same DRG.
4.2 Data
4.2.1 Outliers
We considered whether outliers should be trimmed from our data. At
the high end, our cost series increases exponentially and there are no
obvious outliers to cull.
Moreover, there is valuable information in the high end of the tail that is
relevant to complications and their cost: the incidence of complications
and the relative contribution to total cost increases as you go higher –
see Table 4.1. As such, we did not trim data at the high end.
Table 4.1: Complications and cost at the high end of the data
Percentile
of cost
Admissions Incidence
of CHADx+
Share of
total cost
Share of
total cost
÷ share
of total
admissions
99.9th 5,204 86.4% 4.7% 46.7
99.5th 26,022 78.6% 11.8% 23.6
99th 52,044 73.8% 17.2% 17.2
95th 260,221 55.5% 38.8% 7.8
90th 520,442 45.7% 53.1% 5.3
Source: Grattan analysis of National Hospital Cost Data Collection.
At the low end of the data, we looked at two trimming approaches that
we considered might assist the goodness-of-fit of our regression as well
as clean the data of admissions that had an erroneously low reported
cost.14 We ran our regressions excluding admissions in the lowest one
per cent and five per cent of cost.
Neither of these trimming approaches were found to have a material
impact on our regressions. As such, and for simplicity, we did not trim
data at the low end.
Finally, none of the previous analyses reviewed reported trimming their
data before conducting regressions.
4.2.2 Descriptive statistics
Table 4.2 on the next page and Table 4.3 on the following page provide
descriptive statistics for the variables used in our regressions.
14. We envisaged that such errors might arise as a reporting or costing system
artefact. It was beyond our scope of work to research hospitals’ reporting and
costing systems in further detail.
Grattan Institute 2018 15

Safer care saves money: How to improve patient care and save public money at the same time. Methodological supplement
Table 4.2: Descriptive statistics for dependent variable – cost
Observations 5,204,424
Mean $5,104
Standard deviation $12,396
Skewness 19
1st percentile $130
25th percentile $653
50th percentile $2,010
75th percentile $5,262
99th percentile $47,169
Source: Grattan analysis of National Hospital Cost Data Collection.
Table 4.3: Descriptive statistics for independent variables
Variable Mean
At least one of any CHADx+ 0.109
Comorbidities
Infectious diseases 0.053
Neoplasms 0.095
Endocrine, metabolic or immune diseases 0.075
Diabetes 0.101
Blood diseases 0.037
Mental disorders 0.049
Drug or alcohol use 0.031
Diseases of the nervous system or sense organs 0.025
Eye disease 0.024
Diseases of the circulatory system 0.108
Diseases of the respiratory system 0.054
Diseases of the digestive system 0.086
Chronic renal disease 0.238
Diseases of the genitourinary system 0.065
Pregnancy, childbirth and puerperium 0.051
Chronic skin ulcer 0.004
Diseases of the musculoskeletal system and connective tissue 0.033
Other 0.132
Controls
Female 0.512
Indigenous status 0.070
Emergency 0.428
Age 0-14 0.077
Age 15-44 0.276
Age 70-84 0.231
Age 85+ 0.064
Death 0.006
Early transfer 0.035
Sameday 0.541
Source: Grattan analysis of National Hospital Cost Data Collection.
Grattan Institute 2018 16

Safer care saves money: How to improve patient care and save public money at the same time. Methodological supplement
4.3 Estimation approach
Following the literature, we hypothesised that a GLM with a log link
and gamma distribution was an appropriate estimation approach. As
with other analyses, our dependent variable was highly skewed (see
Table 4.2 on the previous page).
We followed Jackson et al. (2013) and used a modified Park test to
confirm our choice of distribution. We also followed the approach
suggested by Glick (2015) to perform this test in Stata.
We found that the coefficient on the log of the predicted cost when
regressed against the square of the residuals was 2.0 for both the
any complication and individual complications models. This supports
a gamma distribution.
We also estimated our model using OLS, and compare results in
Section 4.5.3 on page 25.
4.4 Estimation results
4.4.1 Complications
In the any complication model the estimated coefficient on the compli-
cation variable was 0.43 with a p-value of 0.0.
In the individual complications model, estimated coefficients on the
complication variables ranged from −0.27 to 0.92. There were 163
positive coefficients of which 150 statistically significant at the 95 per
cent confidence interval,15 and 11 negative coefficients of which five
were statistically significant.16
15. Hereafter, all references to statistical significance are with regard to the 95 per
cent confidence interval.
16. There were no instances of CHAPx 4.01 in the sample therefore the number of
coefficients reported sums to 174 rather than 175.
In Section 4.5 on page 19 we describe how we translated these
coefficient estimates into dollar estimates of the incremental costs of
complications.
The statistically significant, negative coefficient estimates were
somewhat puzzling. The affected complications were:
• CHADx 5.11 ‘Cardiogenic and other shock’
• CHADx 11.03 ‘Other complications prior to labour and delivery’
• CHADx 13.08 ‘Jaundice’ (neonatal)
• CHADx 14.03 ‘Coagulation defects’
• CHAPx 6.00 ‘Fluid management’
We have not fully investigated the reasons behind these negative
coefficients, because they are not widespread or large enough to
significantly alter our key results. Moreover, negative coefficients have
been found – including on some of the same complications – in other
studies; see Jackson et al. (2011).
Nevertheless, we suspect that the negative coefficients may reflect one
or more of the following factors:
• They represent a ‘true’ effect on cost. For instance, in regard to
CHAPx 6.00, fluid administration has been found in some studies
to reduce length of stay; see Nossaman et al. (2015).
• They represent a truncated episode effect due to death for
complications that are associated with higher rates of mortality,
namely CHADx 5.11 and 14.03.
• They are artefacts of the regression process.
Grattan Institute 2018 17
Safer care saves money: How to improve patient care and save public money at the same time. Methodological supplement
4.4.2 DRG
In the any complication model, estimated coefficients on DRG ranged
from −3.89 to 0.83. In the individual complications model, the range
was −3.17 to 0.43. Around 99 per cent of estimated coefficients were
statistically significant in both models.
4.4.3 Hospital
The estimated coefficients on hospital in both models ranged from
around −1.7 to 2.7. Around 93 per cent of coefficients were statistically
significant in both models.
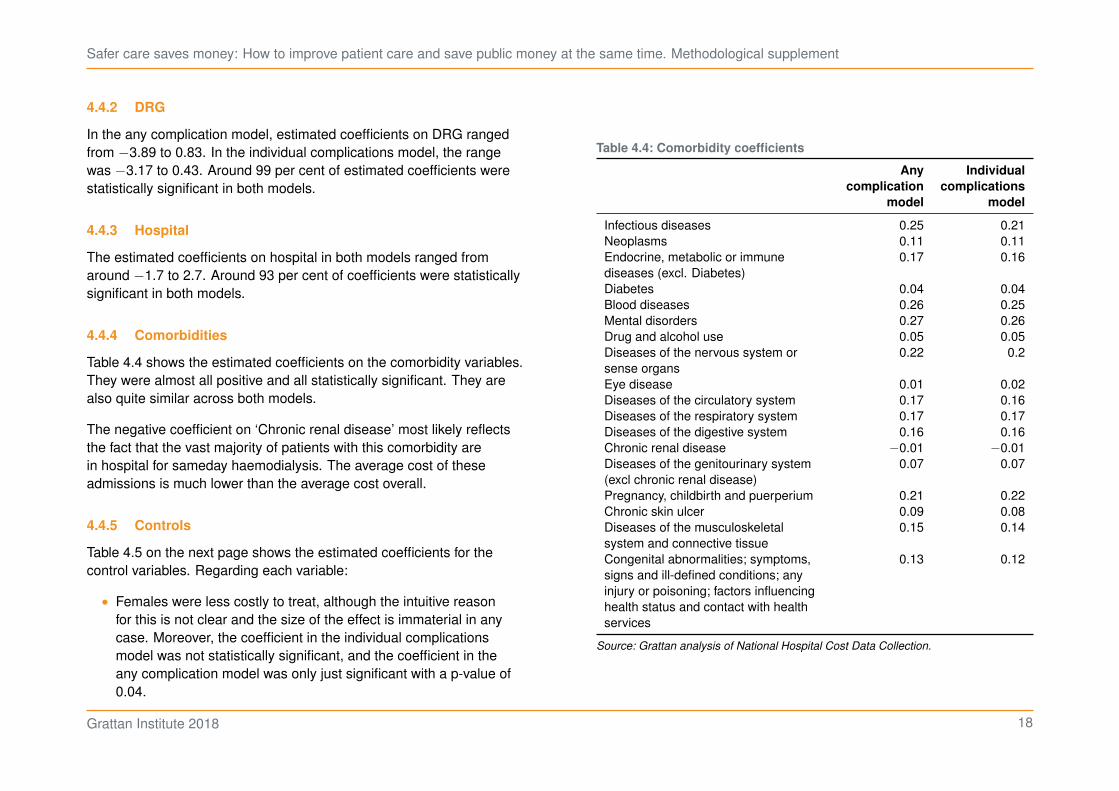
4.4.4 Comorbidities
Table 4.4 shows the estimated coefficients on the comorbidity variables.
They were almost all positive and all statistically significant. They are
also quite similar across both models.
The negative coefficient on ‘Chronic renal disease’ most likely reflects
the fact that the vast majority of patients with this comorbidity are
in hospital for sameday haemodialysis. The average cost of these
admissions is much lower than the average cost overall.
4.4.5 Controls
Table 4.5 on the next page shows the estimated coefficients for the
control variables. Regarding each variable:
• Females were less costly to treat, although the intuitive reason
for this is not clear and the size of the effect is immaterial in any
case. Moreover, the coefficient in the individual complications
model was not statistically significant, and the coefficient in the
any complication model was only just significant with a p-value of
0.04.
Table 4.4: Comorbidity coefficients
Any
complication
model
Individual
complications
model
Infectious diseases 0.25 0.21
Neoplasms 0.11 0.11
Endocrine, metabolic or immune
diseases (excl. Diabetes)
0.17 0.16
Diabetes 0.04 0.04
Blood diseases 0.26 0.25
Mental disorders 0.27 0.26
Drug and alcohol use 0.05 0.05
Diseases of the nervous system or
sense organs
0.22 0.2
Eye disease 0.01 0.02
Diseases of the circulatory system 0.17 0.16
Diseases of the respiratory system 0.17 0.17
Diseases of the digestive system 0.16 0.16
Chronic renal disease −0.01 −0.01
Diseases of the genitourinary system
(excl chronic renal disease)
0.07 0.07
Pregnancy, childbirth and puerperium 0.21 0.22
Chronic skin ulcer 0.09 0.08
Diseases of the musculoskeletal
system and connective tissue
0.15 0.14
Congenital abnormalities; symptoms,
signs and ill-defined conditions; any
injury or poisoning; factors influencing
health status and contact with health
services
0.13 0.12
Source: Grattan analysis of National Hospital Cost Data Collection.
Grattan Institute 2018 18

Safer care saves money: How to improve patient care and save public money at the same time. Methodological supplement
• People who are Aboriginal and/or Torres Strait Islander were more
costly to treat, and this accords with the health disadvantage
they experience on average. However, the size of the effect was
immaterial and not statistically significant in either model.
• Emergency admissions were more costly, and this accords with
the theory that care may be provided in a less planned and
controlled manner at least initially, and these episodes may involve
additional overhead costs. Coefficients were statistically significant
in both models.
• Coefficients on the age variables were statistically significant but
very small. The negative coefficient for people over 85 was slightly
larger, perhaps reflecting fewer complex procedures occurring for
the very elderly.
• The any complication model found that patients that die were
more costly to treat. This seems to support the ‘sicker’ and more
complex patient effect over the truncated episode effect (see
previous discussion). However, the individual complications model
found death to have a negative effect on cost. Coefficients were
statistically significant in both models. It may be the case that in
the individual complications model the regression was able to
assign to individual complications the additional cost of patients
that die rather than attributing this additional cost to the death
variable. This possibly left the coefficient on the death variable to
reflect the truncated episode effect.
4.5 Cost estimates
4.5.1 Any complication model
We estimated the incremental cost of at least one of any complication
by first creating a series equal to:
• the estimated model’s predicted cost of an admission; minus
Table 4.5: Control coefficients
Any
complication
model
Individual
complications
model
Female −0.002 −0.001
Aboriginal and/or Torres Strait Islander 0.001 0.001
Emergency 0.044 0.050
Age 0 to 14 0.009 0.005
Age 15 to 44 −0.010 −0.011
Age 70 to 84 −0.012 −0.012
Age 85+ −0.028 −0.026
Death 0.030 −0.043
Early transfer −0.260 −0.259
Sameday −0.916 −0.926
Constant 11.245 10.537
Source: Grattan analysis of National Hospital Cost Data Collection.
• the estimated model’s predicted cost of the admission assuming
that there were no complications.
Of course, if there were no complications in an admission, then the
value of the series for that admission is zero.
The average of this series, $6,004, is our estimate of the incremental
cost of at least one of any complication for acute admissions at
hospitals in the NHCDC. The total of this series, $3.4 billion, is our
estimate of the total cost of complications for these admissions.
Given the total cost of admissions in our sample is $26.6 billion, we find
that complications constitute 13 per cent of total costs. This is in line
with the estimates of 12 per cent in Health Policy Analysis (2013) and
15 per cent in Jackson et al. (2011). However, results are not directly
comparable owing to sample and methodology differences to those
analyses.
Grattan Institute 2018 19

Safer care saves money: How to improve patient care and save public money at the same time. Methodological supplement
We also find that our estimated model performs well in predicting
the total cost of admissions in sample. Over all admissions, the
model overpredicts the cost of admissions by just 0.3 per cent. Over
admissions involving complications, the model underpredicts the cost
by just 0.2 per cent.
4.5.2 Individual complications model
Our aim was to derive estimates of the incremental cost of individual
complications that were consistent with our estimate of the total cost
of complications from the any complication model ($3.4 billion). This
sub-section explains how we came to these estimates, and the issues
we needed to address in doing so.
Issues with incremental cost estimates in the individual complications
model
Our first step in estimating the incremental cost of individual com-
plications was similar to the approach described in the previous
sub-section for the any complication model. We created a series for
each complication that was equal to:
• the estimated model’s predicted cost of an admission; minus
• the estimated model’s predicted cost of an admission assuming
that the individual complication of interest was not present.
Thus we created 175 incremental cost series, one series for each
of the 175 individual complications – see Table 4.6. Each value of
these series is an estimate of the incremental cost of the relevant
complication given the other complications present in the admission.
Note that in Table 4.6 the estimates for individual admissions are
indicative only, whereas the total cost estimates in the bottom row are
actual estimates.
Table 4.6: Example of incremental cost series
Admission CHAPx
1.01
CHAPx
1.02
. . . CHADx
17.11
1 $50,000 – $4,000
2 – $5,000 –
3 – – $6,000...
5,204,424 $80,000 – –
Total $377m $188m . . . $71m $9,945m
Notes: Figures in the ‘Total’ row are actual estimates, whereas other entries in the table
are indicative only.
Source: Grattan analysis of National Hospital Cost Data Collection.
Table 4.6 shows that the sum of the total costs of individual compli-
cations is $9.9 billion. This is significantly higher than the estimate of
the total cost of complications of $3.4 billion from our any complication
model. This is for two reasons.
First, the totals of these incremental cost series are not additive. To
explain, recall that each series represents the incremental cost of the
relevant complication given the other complications present in the
admission. Now assume that there are just two complications: 𝑥 and
𝑦. If we add together the total costs of 𝑥 and 𝑦, we are calculating the
total cost of complications as:
• The incremental cost of 𝑥 given the presence of 𝑦; plus
• The incremental cost of 𝑦 given the presence of 𝑥.
This calculation of the total cost of complications is incorrect. It
essentially double counts the incremental cost impact of complications.
The correct calculation is:
Grattan Institute 2018 20
Safer care saves money: How to improve patient care and save public money at the same time. Methodological supplement
• The incremental cost of 𝑥 given no other complications (or of 𝑦
given no other complications); plus
• The incremental cost of 𝑦 given the presence of 𝑥 (or of 𝑥 given
the presence of 𝑦).
When we correctly calculate the total cost of complications from the
individual complications model, we get a figure of $5.4 billion.
This estimate of $5.4 billion remains materially higher than the estimate
of $3.4 billion. This brings us to the second reason for the difference
between the estimates of the total cost of complications between the
two models.
Before we explore this second reason, note that we can conclude that
the $5.4 billion estimate is overstated because:
• as set out in Section 4.5.1 on page 19, the any complication model
accurately predicts the cost of admissions; and
• the individual complications model overestimates the cost of
all admissions by 7 per cent, and overestimates the cost of
admissions involving complications by 16 per cent.
One reason for this overestimating is the multiplicative effect of the
coefficients on our complication variables. Given we are using a log
link, the estimated coefficient on a particular complication represents
the estimated percentage change in cost given the presence of that
complication. As more and more complications are present in an
admission, the dollar impact of a given percentage change grows
higher and higher.
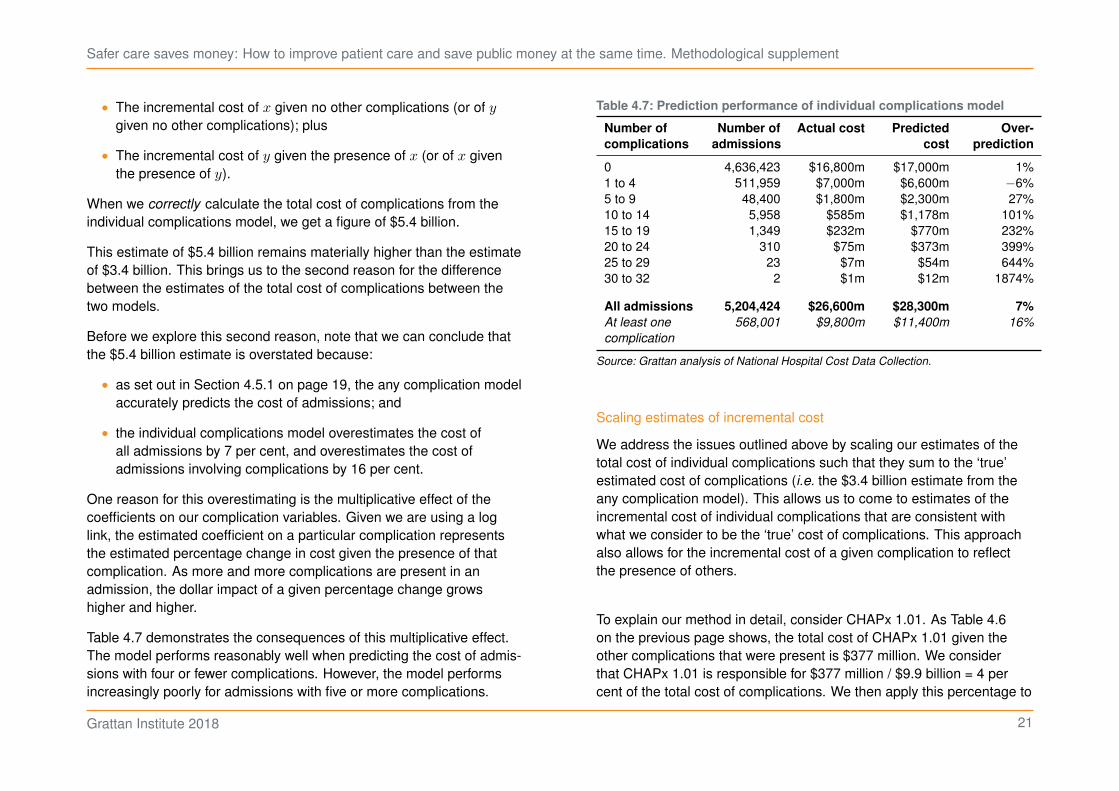
Table 4.7 demonstrates the consequences of this multiplicative effect.
The model performs reasonably well when predicting the cost of admis-
sions with four or fewer complications. However, the model performs
increasingly poorly for admissions with five or more complications.
Table 4.7: Prediction performance of individual complications model
Number of
complications
Number of
admissions
Actual cost Predicted
cost
Over-
prediction
0 4,636,423 $16,800m $17,000m 1%
1 to 4 511,959 $7,000m $6,600m −6%
5 to 9 48,400 $1,800m $2,300m 27%
10 to 14 5,958 $585m $1,178m 101%
15 to 19 1,349 $232m $770m 232%
20 to 24 310 $75m $373m 399%
25 to 29 23 $7m $54m 644%
30 to 32 2 $1m $12m 1874%
All admissions 5,204,424 $26,600m $28,300m 7%
At least one
complication
568,001 $9,800m $11,400m 16%
Source: Grattan analysis of National Hospital Cost Data Collection.
Scaling estimates of incremental cost
We address the issues outlined above by scaling our estimates of the
total cost of individual complications such that they sum to the ‘true’
estimated cost of complications (i.e. the $3.4 billion estimate from the
any complication model). This allows us to come to estimates of the
incremental cost of individual complications that are consistent with
what we consider to be the ‘true’ cost of complications. This approach
also allows for the incremental cost of a given complication to reflect
the presence of others.
To explain our method in detail, consider CHAPx 1.01. As Table 4.6
on the previous page shows, the total cost of CHAPx 1.01 given the
other complications that were present is $377 million. We consider
that CHAPx 1.01 is responsible for $377 million / $9.9 billion = 4 per
cent of the total cost of complications. We then apply this percentage to
Grattan Institute 2018 21
Safer care saves money: How to improve patient care and save public money at the same time. Methodological supplement
the ‘true’ estimated cost of complications, $3.4 billion, to yield a scaled
estimate of the total cost of CHAPx 1.01 of $129 million.
We then divided the scaled estimates of the total cost of individual
complications by their respective incidence to derive estimates of
the average incremental cost per occurrence. That is, we divided
the scaled estimate of the total cost of CHAPx 1.01 ($129 million)
by the number of times this complication occurred (4,975) to get our
estimate of the incremental cost of CHAPx 1.01 per occurrence (around
$26,000).
Comparison with previous analyses
Comparison of our estimates with those in Jackson et al. (2011) and
Health Policy Analysis (2013) is complicated by differences in the
CHADx versions and samples used. Nevertheless, we can observe
some broad similarities which serves to demonstrate both that our
results appear sensible and that the costs of certain complications have
been persistent through time.
Table 4.8 on the following page shows the 10 individual CHADx classes
that we have estimated to have the highest average incremental cost.
Note we have just listed CHADx classes because previous analyses
did not look at CHAPx. We see that all analyses have found transplant
complications, sepsis and wound disruptions to be among the most
costly complications per occurrence.
Resistance to methicillin is the only other complication that appears
among the most costly in the results of both Jackson et al. (2011) and
Health Policy Analysis (2013). This complication does not appear
among our most costly complications, most likely because in the
version of CHADx we used it is grouped with other, potentially less
costly types of infections in ‘4.07 Antibiotic resistant infections’.
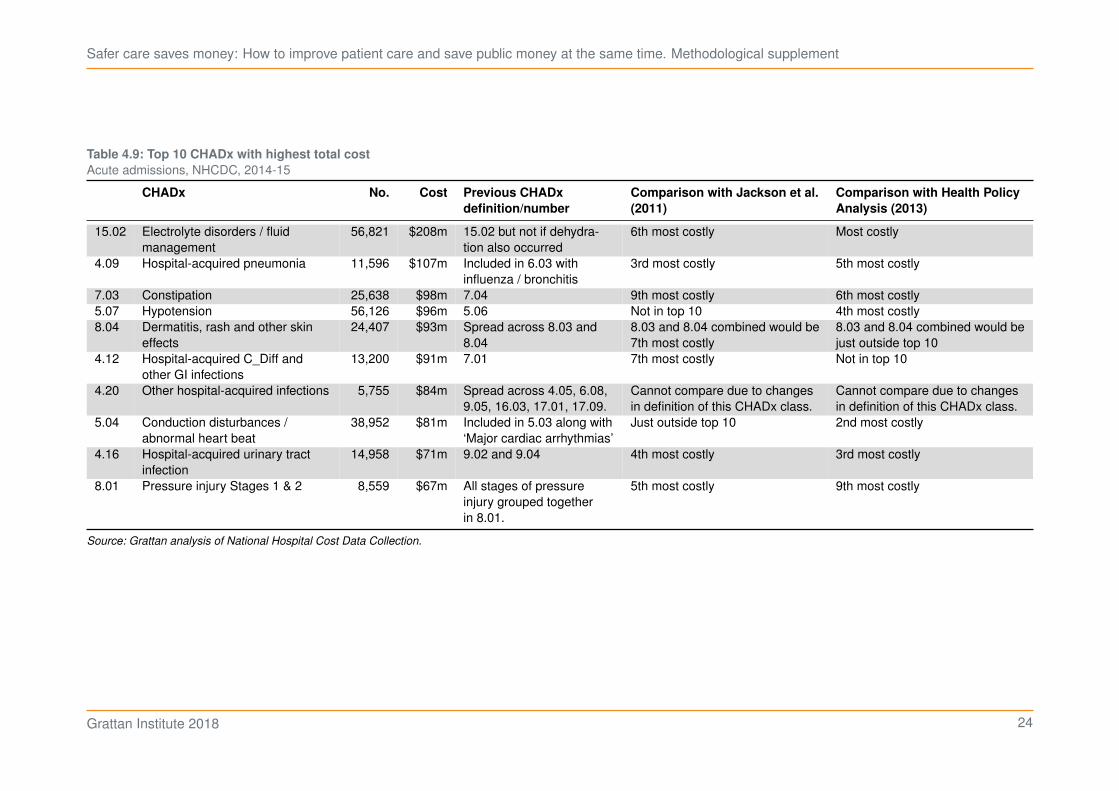
Table 4.9 on page 24 shows the 10 individual CHADx classes that we
have estimated to have the highest total cost. Dollar estimates are not
reported for Jackson et al. (2011) and Health Policy Analysis (2013)
because different sample sizes mean magnitudes cannot be compared.
Instead we are interested in relative costliness, and it can be seen that
results across the three analyses are quite consistent with the same
complications generally appearing in each analysis’s top 10.
Grattan Institute 2018 22

Safer care saves money: How to improve patient care and save public money at the same time. Methodological supplement
Table 4.8: Top 10 CHADx with highest average incremental cost
Acute admissions, NHCDC, 2014-15
CHADx No. Cost Previous CHADx
definition/number
Comparison with Jackson et al.
(2011)
Comparison with Health Policy
Analysis (2013)
1.13 Complications of
transplants
699 $26,717 1.14 Quite costly at $7,079 but not in top
10.
Finds a ‘very high cost impact’ but
estimates suppressed due to low
number of occurrences
4.19 Hospital-acquired
abscesses
395 $20,308 Spread across 6.08, 7.07,
9.04, 9.05, 14.04 and
16.03.
Cannot compare due to changes in
definition of this CHADx class.
Cannot compare due to changes in
definition of this CHADx class.
4.20 Other hospital-acquired
infections
5,755 $14,660 Spread across 4.05, 6.08,
9.05, 16.03, 17.01, 17.09.
Cannot compare due to changes in
definition of this CHADx class.
Cannot compare due to changes in
definition of this CHADx class.
4.03 Sepsis due to Staph 929 $13,578 Different types of sepsis
grouped together under
4.01.
10th most costly at $9,400. Finds a ‘very high cost impact’ but
estimates suppressed due to low
number of occurrences
4.02 Sepsis due to Strep 534 $10,694 As above. As above. As above.
8.02 Pressure injury, Stages
3 & 4
2,484 $10,238 All stages of pressure
injury grouped together
in 8.01.
Quite costly at $8,435 but not in top
10.
Somewhat costly at $5,892 but not in
top 10.
10.02 Adjustment disorders 751 $9,892 10.03 Somewhat costly at $6,167 but not in
top 10.
Not particularly costly at $3,031.
4.09 Hospital-acquired
pneumonia
11,596 $9,235 Included in 6.03 with
influenza / bronchitis
Somewhat costly at $5,496 but not in
top 10.
Somewhat costly $5,710 but not in top
10.
1.08 Disruption of wound 3,304 $9,229 1.08 9th most costly at $9,529. 2nd most costly at $12,200.
4.11 Device / implant-related
infections
6,031 $8,728 Spread across 1.01, 1.07,
1.11, 1.12, 1.13
Cannot compare due to changes in
definition of this CHADx class.
Cannot compare due to changes in
definition of this CHADx class.
Notes: Excluding complications with fewer than 100 occurrences.
Source: Grattan analysis of National Hospital Cost Data Collection.
Grattan Institute 2018 23
Safer care saves money: How to improve patient care and save public money at the same time. Methodological supplement
Table 4.9: Top 10 CHADx with highest total cost
Acute admissions, NHCDC, 2014-15
CHADx No. Cost Previous CHADx
definition/number
Comparison with Jackson et al.
(2011)
Comparison with Health Policy
Analysis (2013)
15.02 Electrolyte disorders / fluid
management
56,821 $208m 15.02 but not if dehydra-
tion also occurred
6th most costly Most costly
4.09 Hospital-acquired pneumonia 11,596 $107m Included in 6.03 with
influenza / bronchitis
3rd most costly 5th most costly
7.03 Constipation 25,638 $98m 7.04 9th most costly 6th most costly
5.07 Hypotension 56,126 $96m 5.06 Not in top 10 4th most costly
8.04 Dermatitis, rash and other skin
effects
24,407 $93m Spread across 8.03 and
8.04
8.03 and 8.04 combined would be
7th most costly
8.03 and 8.04 combined would be
just outside top 10
4.12 Hospital-acquired C_Diff and
other GI infections
13,200 $91m 7.01 7th most costly Not in top 10
4.20 Other hospital-acquired infections 5,755 $84m Spread across 4.05, 6.08,
9.05, 16.03, 17.01, 17.09.
Cannot compare due to changes
in definition of this CHADx class.
Cannot compare due to changes
in definition of this CHADx class.
5.04 Conduction disturbances /
abnormal heart beat
38,952 $81m Included in 5.03 along with
‘Major cardiac arrhythmias’
Just outside top 10 2nd most costly
4.16 Hospital-acquired urinary tract
infection
14,958 $71m 9.02 and 9.04 4th most costly 3rd most costly
8.01 Pressure injury Stages 1 & 2 8,559 $67m All stages of pressure
injury grouped together
in 8.01.
5th most costly 9th most costly
Source: Grattan analysis of National Hospital Cost Data Collection.
Grattan Institute 2018 24
Safer care saves money: How to improve patient care and save public money at the same time. Methodological supplement
4.5.3 Comparison with OLS estimation
Any complication model
Estimating our any complication model using OLS yields an estimate
of the total cost of complications of $3.2 billion. This is 7 per cent lower
than the $3.4 billion estimate using GLM with a log link and gamma
distribution. This provides comfort that our overall cost estimate is not
overly sensitive to the estimation approach used and thus supports the
reliability of the estimate.
We also find that OLS performs very well in predicting the total cost of
admissions in the sample. It predicts to within one dollar the total costs
of both all admissions and just admissions involving complications.
Individual complications model
Similar to estimates using GLM log gamma, we scaled OLS estimates
of the costs of individual complications such that they summed to the
estimate of the total cost of complications from the any complication
model estimated using OLS ($3.2 billion). This is because we also ob-
served an overestimating effect in the OLS estimation – it overpredicted
the cost of admissions involving a complication by 3 per cent.
Recall that we attributed overestimation by GLM log gamma to the
multiplicative effect of the complication coefficients. However, this effect
does not exist in the OLS estimation because we are not using a log
link – estimated coefficients represent absolute changes in cost due
to the presence of complications. Therefore, something else must be
causing the overestimation in this instance.
It is possible that complications have a marginal effect on cost that
decreases with the number of other complications present on ad-
mission. For example, a minor infection might materially increase
the cost of treating an otherwise healthy patient if it extends their
hospitalisation by a day or two. However, the incremental cost of this
Table 4.10: Top 10 CHADx+ with highest average incremental cost using
OLS estimation
OLS GLM
Description Cost Rank Cost Rank
4.19 Hospital-acquired abscesses $27,540 1 $20,308 3
1.13 Complications of transplants $26,155 2 $26,717 1
1.01* Invasive ventilatory support $23,850 3 $25,956 2
4.03 Sepsis due to Staph $20,823 4 $13,758 6
3.05 Injury due to assault $18,435 5 $8,435 16
1.14 Complications of reattach-
ment and amputations
$17,273 6 $7,880 22
3.04* Thrombectomy $15,285 7 $20,288 4
1.08 Disruption of wound $14,068 8 $9,229 12
10.06 Patient self harm $13,339 9 $7,896 21
4.02 Sepsis due to Strep $12,881 10 $10,694 8
Notes: Excluding complications with fewer than 100 occurrences. An asterisk (*)
indicates a hospital-acquired procedure (CHAPx). Instances of ventilatory support
during emergency admissions not considered complications.
Source: Grattan analysis of National Hospital Cost Data Collection.
infection might become insignificant if the patient has already had
their hospitalisation extended a number of weeks by a number of more
serious complications.
If complications do have a decreasing marginal effect, then the fixed,
absolute changes estimated by OLS will overpredict the cost of
admissions where there are multiple complications present.
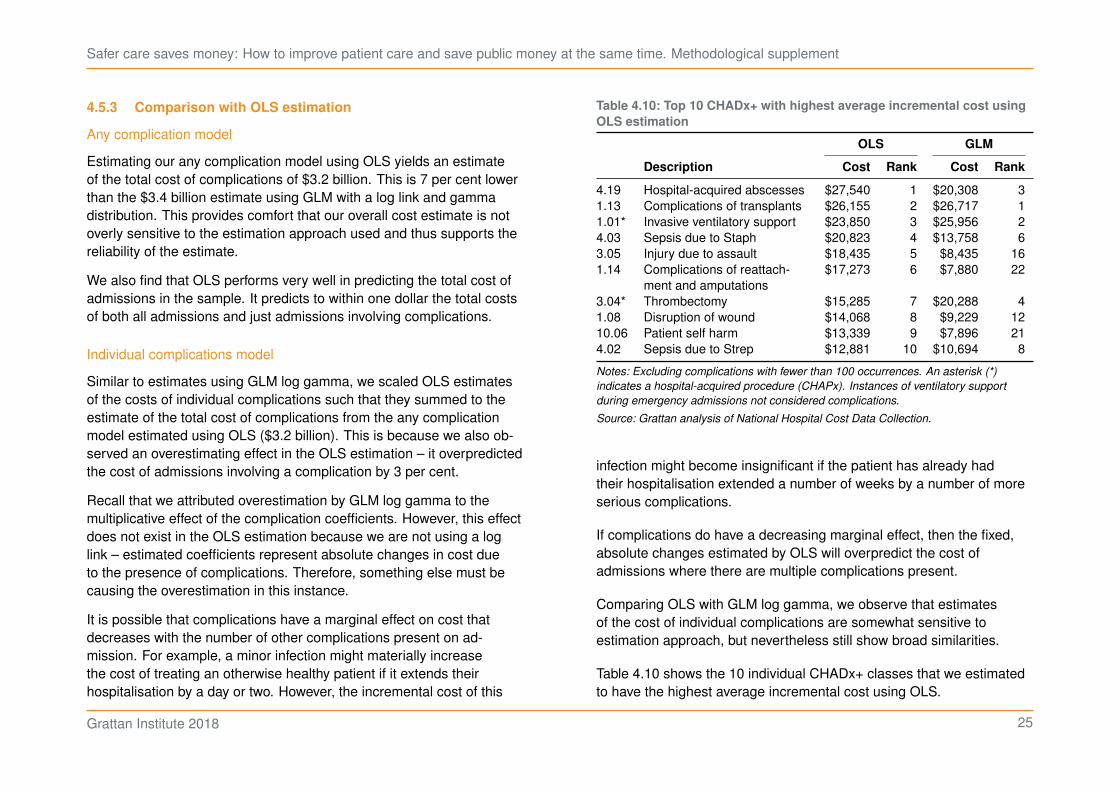
Comparing OLS with GLM log gamma, we observe that estimates
of the cost of individual complications are somewhat sensitive to
estimation approach, but nevertheless still show broad similarities.
Table 4.10 shows the 10 individual CHADx+ classes that we estimated
to have the highest average incremental cost using OLS.
Grattan Institute 2018 25
Safer care saves money: How to improve patient care and save public money at the same time. Methodological supplement
The cost estimates for transplant complications, invasive ventilatory
support and sepsis due to streptococcus are all quite similar.
The difference between estimates is somewhat larger for abscesses,
sepsis due to staphylococcus, thrombectomies and wound disruptions,
but the ordinal costliness of these complications remains similar across
the two estimation approaches.
The difference in both estimate and ordinal costliness is much larger
for injuries due to assault, reattachment/amputation complications and
patient self harm.
Overall, there is sufficient similarity to provide comfort as to the
reliability our estimates. This comparison does, however, suggest that
policymakers should be aware of potential sensitivity to estimation
approach before acting on cost estimates for certain classes of
complication.
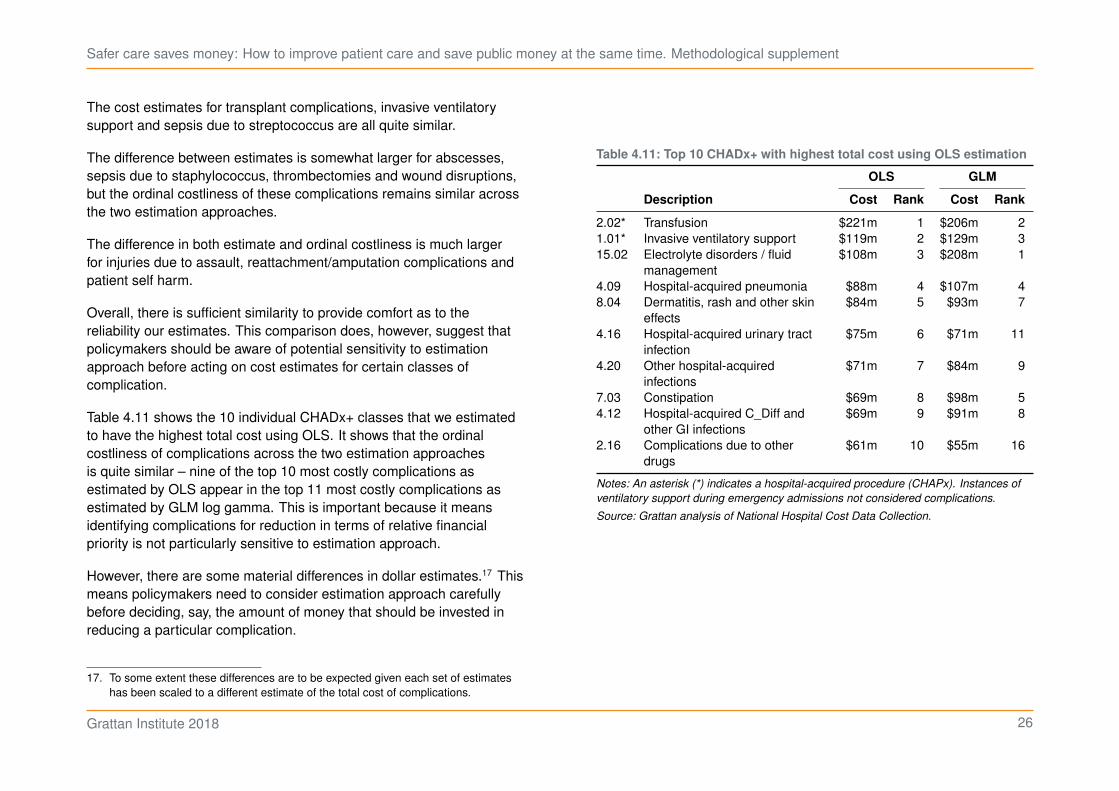
Table 4.11 shows the 10 individual CHADx+ classes that we estimated
to have the highest total cost using OLS. It shows that the ordinal
costliness of complications across the two estimation approaches
is quite similar – nine of the top 10 most costly complications as
estimated by OLS appear in the top 11 most costly complications as
estimated by GLM log gamma. This is important because it means
identifying complications for reduction in terms of relative financial
priority is not particularly sensitive to estimation approach.
However, there are some material differences in dollar estimates.17 This
means policymakers need to consider estimation approach carefully
before deciding, say, the amount of money that should be invested in
reducing a particular complication.
17. To some extent these differences are to be expected given each set of estimates
has been scaled to a different estimate of the total cost of complications.
Table 4.11: Top 10 CHADx+ with highest total cost using OLS estimation
OLS GLM
Description Cost Rank Cost Rank
2.02* Transfusion $221m 1 $206m 2
1.01* Invasive ventilatory support $119m 2 $129m 3
15.02 Electrolyte disorders / fluid
management
$108m 3 $208m 1
4.09 Hospital-acquired pneumonia $88m 4 $107m 4
8.04 Dermatitis, rash and other skin
effects
$84m 5 $93m 7
4.16 Hospital-acquired urinary tract
infection
$75m 6 $71m 11
4.20 Other hospital-acquired
infections
$71m 7 $84m 9
7.03 Constipation $69m 8 $98m 5
4.12 Hospital-acquired C_Diff and
other GI infections
$69m 9 $91m 8
2.16 Complications due to other
drugs
$61m 10 $55m 16
Notes: An asterisk (*) indicates a hospital-acquired procedure (CHAPx). Instances of
ventilatory support during emergency admissions not considered complications.
Source: Grattan analysis of National Hospital Cost Data Collection.
Grattan Institute 2018 26
Safer care saves money: How to improve patient care and save public money at the same time. Methodological supplement
4.5.4 Grossing up estimates for all hospital admissions
To this point we have described how we estimated the cost of complica-
tions using data solely from the NHCDC. However, the cost estimates
presented in Safer care saves money have been grossed up using
data from the National Hospital Morbidity Dataset (NHMD). We did this
because:
• we wished to present estimates for all (acute) hospital activity in
Australia;
• some public hospitals do not participate in the public sector
NHCDC; and
• private hospitals do not participate in the public sector NHCDC.
Our basic approach was to apply the estimates described above of the
average incremental cost of individual complications to the incidence of
individual complications observed in the NHMD. Thus the fundamental
assumptions underlying our estimates are that the average incremental
cost of a given complication is the same throughout all public hospitals
and across public and private hospitals.
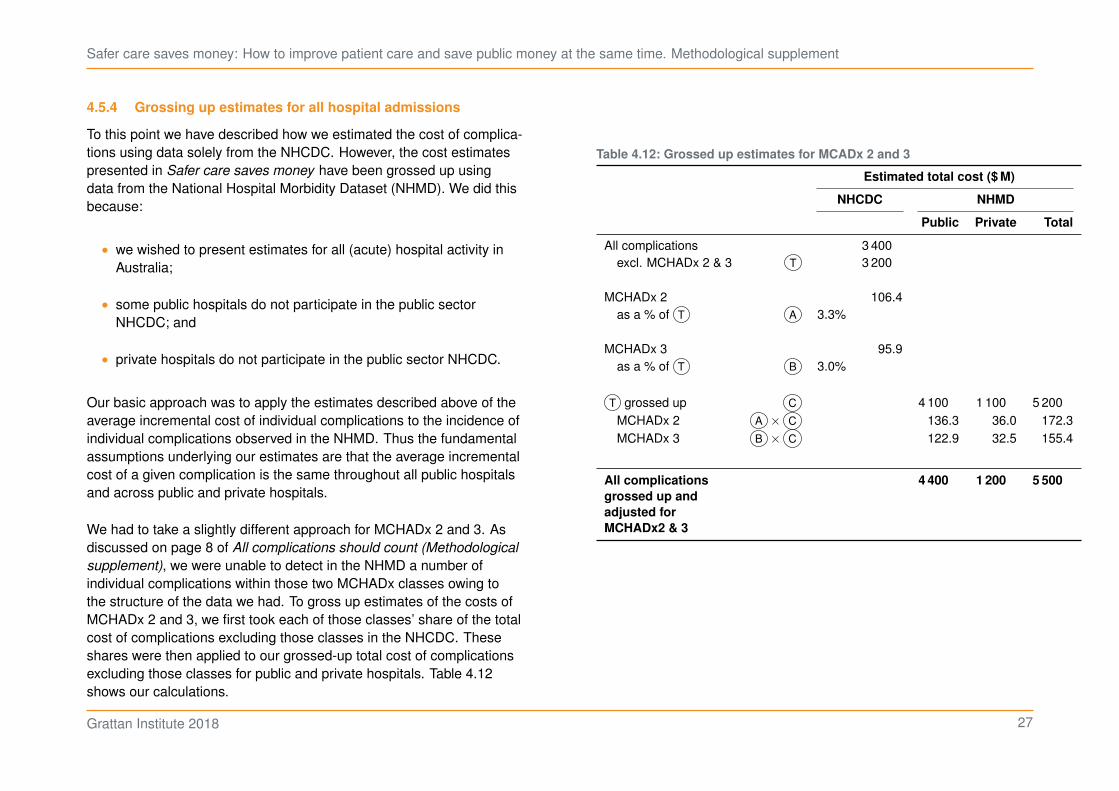
We had to take a slightly different approach for MCHADx 2 and 3. As
discussed on page 8 of All complications should count (Methodological
supplement), we were unable to detect in the NHMD a number of
individual complications within those two MCHADx classes owing to
the structure of the data we had. To gross up estimates of the costs of
MCHADx 2 and 3, we first took each of those classes’ share of the total
cost of complications excluding those classes in the NHCDC. These
shares were then applied to our grossed-up total cost of complications
excluding those classes for public and private hospitals. Table 4.12
shows our calculations.
Table 4.12: Grossed up estimates for MCADx 2 and 3
Estimated total cost ($ M)
NHCDC NHMD
Public Private Total
All complications 3 400
excl. MCHADx 2 & 3 T 3 200
MCHADx 2 106.4
as a % of T A 3.3%
MCHADx 3 95.9
as a % of T B 3.0%
T grossed up C 4 100 1 100 5 200
MCHADx 2 A × C 136.3 36.0 172.3
MCHADx 3 B × C 122.9 32.5 155.4
All complications
grossed up and
adjusted for
MCHADx2 & 3
4 400 1 200 5 500
Grattan Institute 2018 27
Safer care saves money: How to improve patient care and save public money at the same time. Methodological supplement
Comparing estimates between public and private hospitals
The incidence of complications, and therefore estimates of the costs of
complications, are not directly comparable between public and private
hospitals. Casemix differs between public and private hospitals. The
COF may also be under-reported in private hospital data, leading to
lower incidences of complications. In its hospital statistics report for
2014-15, the AIHW reported:18
For 2014–15, the COF data were provided for about 98% of public
hospital separations and 77% of private hospital separations. . . . For
New South Wales, data were not provided for 7.5% of public hospital
separations and 86% of private hospital separations.
18. AIHW (2016).
Grattan Institute 2018 28
Safer care saves money: How to improve patient care and save public money at the same time. Methodological supplement
5 Funding implications of complications
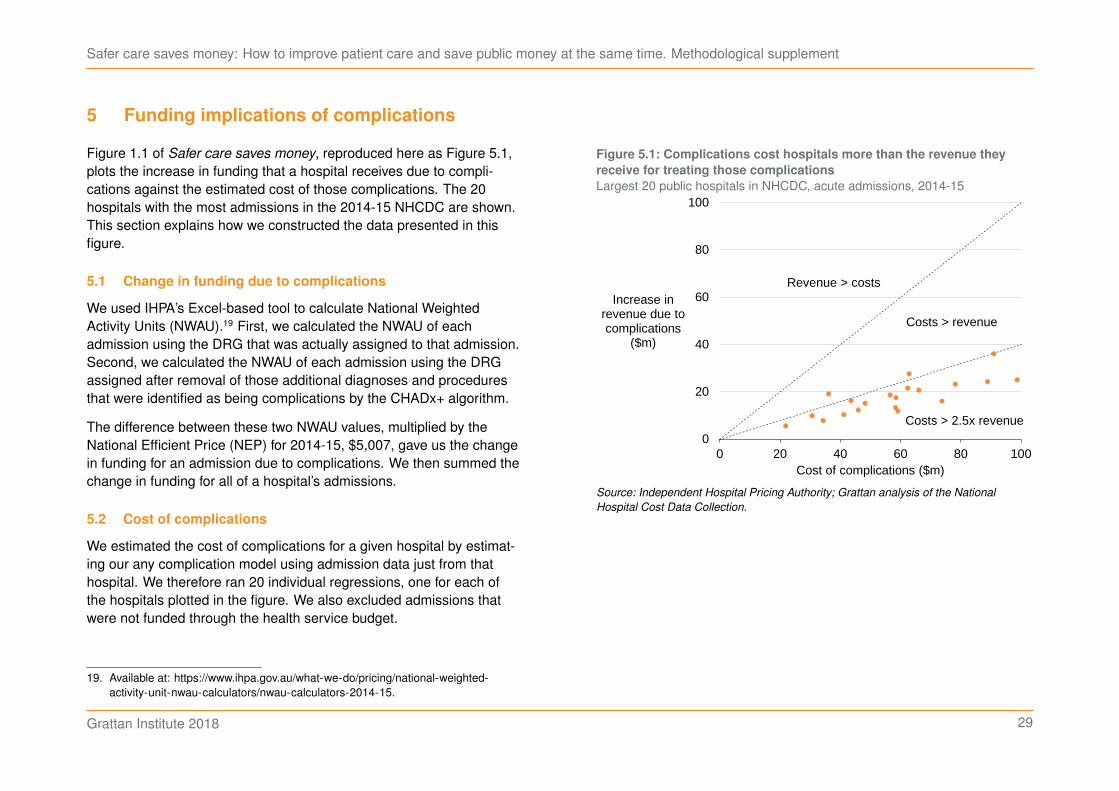
Figure 1.1 of Safer care saves money, reproduced here as Figure 5.1,
plots the increase in funding that a hospital receives due to compli-
cations against the estimated cost of those complications. The 20
hospitals with the most admissions in the 2014-15 NHCDC are shown.
This section explains how we constructed the data presented in this
figure.
5.1 Change in funding due to complications
We used IHPA’s Excel-based tool to calculate National Weighted
Activity Units (NWAU).19 First, we calculated the NWAU of each
admission using the DRG that was actually assigned to that admission.
Second, we calculated the NWAU of each admission using the DRG
assigned after removal of those additional diagnoses and procedures
that were identified as being complications by the CHADx+ algorithm.
The difference between these two NWAU values, multiplied by the
National Efficient Price (NEP) for 2014-15, $5,007, gave us the change
in funding for an admission due to complications. We then summed the
change in funding for all of a hospital’s admissions.
5.2 Cost of complications
We estimated the cost of complications for a given hospital by estimat-
ing our any complication model using admission data just from that
hospital. We therefore ran 20 individual regressions, one for each of
the hospitals plotted in the figure. We also excluded admissions that
were not funded through the health service budget.
19. Available at: https://www.ihpa.gov.au/what-we-do/pricing/national-weighted-
activity-unit-nwau-calculators/nwau-calculators-2014-15.
Figure 5.1: Complications cost hospitals more than the revenue they
receive for treating those complications
Largest 20 public hospitals in NHCDC, acute admissions, 2014-15
0
20
40
60
80
100
0 20 40 60 80 100
Increase in revenue due to complications
($m)
Cost of complications ($m)
Costs > revenue
Costs > 2.5x revenue
Revenue > costs
Source: Independent Hospital Pricing Authority; Grattan analysis of the National
Hospital Cost Data Collection.
Grattan Institute 2018 29
Safer care saves money: How to improve patient care and save public money at the same time. Methodological supplement
6 Savings estimates
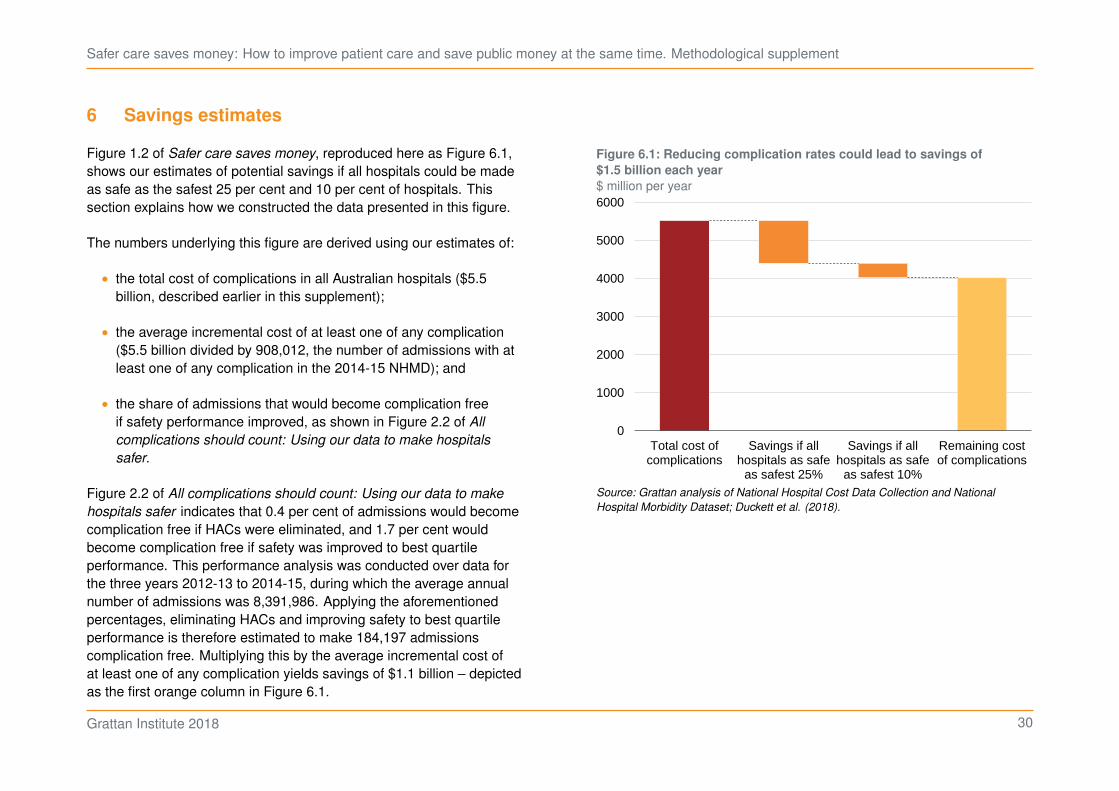
Figure 1.2 of Safer care saves money, reproduced here as Figure 6.1,
shows our estimates of potential savings if all hospitals could be made
as safe as the safest 25 per cent and 10 per cent of hospitals. This
section explains how we constructed the data presented in this figure.
The numbers underlying this figure are derived using our estimates of:
• the total cost of complications in all Australian hospitals ($5.5
billion, described earlier in this supplement);
• the average incremental cost of at least one of any complication
($5.5 billion divided by 908,012, the number of admissions with at
least one of any complication in the 2014-15 NHMD); and
• the share of admissions that would become complication free
if safety performance improved, as shown in Figure 2.2 of All
complications should count: Using our data to make hospitals
safer.
Figure 2.2 of All complications should count: Using our data to make
hospitals safer indicates that 0.4 per cent of admissions would become
complication free if HACs were eliminated, and 1.7 per cent would
become complication free if safety was improved to best quartile
performance. This performance analysis was conducted over data for
the three years 2012-13 to 2014-15, during which the average annual
number of admissions was 8,391,986. Applying the aforementioned
percentages, eliminating HACs and improving safety to best quartile
performance is therefore estimated to make 184,197 admissions
complication free. Multiplying this by the average incremental cost of
at least one of any complication yields savings of $1.1 billion – depicted
as the first orange column in Figure 6.1.
Figure 6.1: Reducing complication rates could lead to savings of
$1.5 billion each year
$ million per year
0
1000
2000
3000
4000
5000
6000
Total cost ofcomplications
Savings if allhospitals as safe
as safest 25%
Savings if allhospitals as safe
as safest 10%
Remaining costof complications
Source: Grattan analysis of National Hospital Cost Data Collection and National
Hospital Morbidity Dataset; Duckett et al. (2018).
Grattan Institute 2018 30
Safer care saves money: How to improve patient care and save public money at the same time. Methodological supplement
Figure 2.2 of All complications should count: Using our data to make
hospitals safer also indicates that a further 0.7 per cent of admissions
would become complication free if safety was improved to best
decile performance. This equates to an additional 62,357 admissions
becoming complication free and $379 million of savings – depicted as
the second orange column in Figure 6.1.
This simple methodology ignores some inconsistencies between the
data and approaches used in our cost and performance estimates,
namely:
• Our cost estimates are derived from 2014-15 data only, whereas
performance estimates are taken from across the period 2012-13
to 2014-15.
• Our cost estimates are based on a definition of complications that
excludes ventilatory support when it occurred during an emer-
gency admission, whereas the definition used in our performance
modelling made no such exclusion.
However, we derived estimates using a more complicated methodology
which attempted to address these inconsistencies and found no
significant change in our savings estimates.
Grattan Institute 2018 31
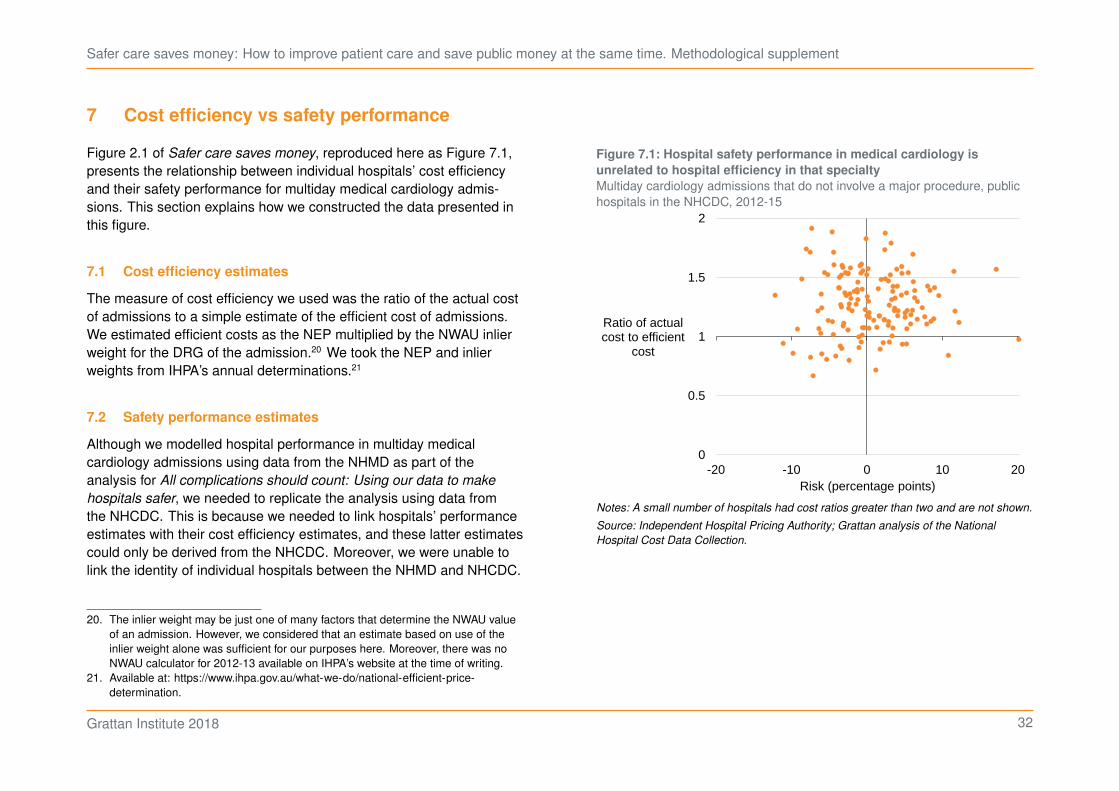
Safer care saves money: How to improve patient care and save public money at the same time. Methodological supplement
7 Cost efficiency vs safety performance
Figure 2.1 of Safer care saves money, reproduced here as Figure 7.1,
presents the relationship between individual hospitals’ cost efficiency
and their safety performance for multiday medical cardiology admis-
sions. This section explains how we constructed the data presented in
this figure.
7.1 Cost efficiency estimates
The measure of cost efficiency we used was the ratio of the actual cost
of admissions to a simple estimate of the efficient cost of admissions.
We estimated efficient costs as the NEP multiplied by the NWAU inlier
weight for the DRG of the admission.20 We took the NEP and inlier
weights from IHPA’s annual determinations.21
7.2 Safety performance estimates
Although we modelled hospital performance in multiday medical
cardiology admissions using data from the NHMD as part of the
analysis for All complications should count: Using our data to make
hospitals safer, we needed to replicate the analysis using data from
the NHCDC. This is because we needed to link hospitals’ performance
estimates with their cost efficiency estimates, and these latter estimates
could only be derived from the NHCDC. Moreover, we were unable to
link the identity of individual hospitals between the NHMD and NHCDC.
20. The inlier weight may be just one of many factors that determine the NWAU value
of an admission. However, we considered that an estimate based on use of the
inlier weight alone was sufficient for our purposes here. Moreover, there was no
NWAU calculator for 2012-13 available on IHPA’s website at the time of writing.
21. Available at: https://www.ihpa.gov.au/what-we-do/national-efficient-price-
determination.
Figure 7.1: Hospital safety performance in medical cardiology is
unrelated to hospital efficiency in that specialty
Multiday cardiology admissions that do not involve a major procedure, public
hospitals in the NHCDC, 2012-15
0
0.5
1
1.5
2
-20 -10 0 10 20
Ratio of actual cost to efficient
cost
Risk (percentage points)
Notes: A small number of hospitals had cost ratios greater than two and are not shown.
Source: Independent Hospital Pricing Authority; Grattan analysis of the National
Hospital Cost Data Collection.
Grattan Institute 2018 32

Safer care saves money: How to improve patient care and save public money at the same time. Methodological supplement
For consistency with the modelling of multiday medical cardiology in
All complications should count: Using our data to make hospitals safer,
we broadly followed the methodology set out there and applied it to the
NHCDC for the three years 2012-13 to 2014-15.22
We made just four changes to the methodology. First, we excluded
from the sample admissions at hospitals that were found to be under-
reporting the COF over the three years looked at; that is, hospitals for
which the ratio of valid COFs reported (i.e. 1 or 2) to diagnosis codes
reported was less than 0.96. This improved our cleaning of the data for
poor-quality coding.
Second, we did not exclude admissions at hospitals that were high
outliers in terms of their COF=1 rate. While this may make our results
less conservative, we observed that the high rates of COF=1 for some
hospitals were unlikely to be erroneous owing to their patient risk
profile. As such, there may not be a strong basis for excluding these
hospitals.
Third, we did not include the Socio-Economic Indexes for Areas
(SEIFA) as a risk adjustment variable because we did not have
sufficient location data in the NHCDC.
Fourth and finally, we did not include the scope variable which mea-
sures a hospital’s degree of specialisation (see Section 1.3.5 of Danks
and Duckett (2018)). This allowed scope effects to be observed as part
of variation in performance.
Our measure of safety performance is the risk of a complication that is
associated with hospital performance. As explained in Section 3.1.2
of All complications should count (Methodological supplement), we
defined ‘risk’ for a given hospital as:
22. Note that our analysis of hospital risk by specialty used a new model that builds
upon the methodology set out in All complications should count (Methodological
supplement). This new model is discussed in Chapter 9.
• the estimated probability of a complication taking into account that
hospital’s performance, averaged over all patients in the sample;
minus
• the estimated probability of a complication not taking into account
hospital performance, averaged over all patients in the sample.
Grattan Institute 2018 33

Safer care saves money: How to improve patient care and save public money at the same time. Methodological supplement
8 Sentinel event analysis
To analyse the frequency of sentinel events, we follow a similar strategy
to Jackson et al. (2009) using the cause and diagnosis codes in
Table 8.1 on the following page.
In particular, sentinel events were those admissions:
1. with a COF of 1
2. for sentinel events 2, 4, 6, 7—where the separation mode was
‘died’
3. with a complication
4. for sentinel events 2 and 7—where the CHADx indicator was 1,
and
5. for sentinel event 7—where the patient’s cause coincided with a
AR-DRG code starting with ‘O’ (i.e. a maternity patient).
Using the MASS package and the vcd packages, we tested how well
Poisson and negative binomial distributions fit the distribution of sen-
tinel events by hospital by year.23 The negative binomial had a better fit,
as the underlying distribution was highly dispersed. (Figure 8.1.)
23. Ripley (2018); Yee (2018); and Meyer et al. (2017).
Figure 8.1: A negative binomial distribution is a better fit of sentinel
events than the Poisson distribution
Number of hospitals with the given number of sentinel events per year, 2013-15
0
25
50
75
100
125
0 5 10 15
Number of sentinel events
ObservedNegative binomialPoisson
Notes: Excludes hospital-years with zero sentinel events.
Source: Grattan analysis of National Hospital Morbidity Dataset.
Grattan Institute 2018 34

Safer care saves money: How to improve patient care and save public money at the same time. Methodological supplement
Table 8.1: Sentinel events by code and description in routine administrative data
Sentinel event Cause/diagnosis code Description
SE1 Y633 Inadvertent exposure to radiation in medical care
Y635 Inappropriate temperature local application and packing
Y655 Performance of inappropriate operation
Y658 Other specified misadventures during surgical and medical care
SE2 X60 Intent self poisn anlgsc antipyr antirhm
X61 Intent selfpoison antiep sed-hyp psytrp
X62 Intent selfpoison narc psychdyslpt NEC
X63 Intent selfpoison oth aut nrv sys dr
X64 Intent selfpoison oth NOS dr biol sub
X65 Intentional selfpoisoning alcohol
X66 Intent selfpoison orgnc solv hydcarb
X670 Intent selfpoison motor vehicle exhaust
X671 Intent selfpoison LPG
X672 Intent selfpoison oth spec utility gas
X678 Intent selfpoison oth spec gas/vapours
X679 Intent selfpoison gas or vapours
X68 Intentional selfpoison pesticides
X69 Intent selfpoison oth/NOS chem nox sub
X700 Intentional self-harm by hanging
X701 Intentional self-harm by strangulation
X702 Intentional self-harm by suffocating
X710 Int selfharm drwn and submrs bath-tub
X711 Int selfharm drwn and submrs swim-pool
X712 Int selfharm drwn and submrs natural wtr
X718 Int selfharm drwn and submrs oth spec wtr
X719 Int selfharm drwn and submrs wtr
X72 Intentional selfharm by handgun disch
X741 Intentional self-harm by air rifle disch
X742 Intentional self-harm by shotgun disch
Grattan Institute 2018 35

Safer care saves money: How to improve patient care and save public money at the same time. Methodological supplement
Sentinel event Cause/diagnosis code Description
X743 Intent self-harm sm calibre rifle disch
X744 Intent self-harm by large calibre rifle
X749 Intent self-harm oth and NOS firearm disch
X75 Intent selfharm by explosive material
X76 Intent selfharm by smoke fire and flames
X77 Intent selfharm steam vapour hot obj
X780 Int selfharm by knife
X781 Int selfharm by razor blade
X782 Int selfharm by hypdrmc needle and syrge
X783 Int selfharm by glass
X788 Int selfharm by other specified sharp object
X789 Int selfharm by sharp object, unspecified
X79 Intentional selfharm by blunt object
X80 Intent selfharm jump from a high place
X810 Intentional self-harm by jumping or lying before a train
X811 Intentional self-harm by jumping or lying before a tram
X812 Intentional self-harm by jumping or lying before a motor vehicle
X818 Intentional self-harm by jumping or lying before other specified moving object
X819 Intentional self-harm by jumping or lying before unspecified moving object
X83 Intentional self harm by other specified means
X84 Intentional self-harm by unspecified means
SE3 T815 FB accidentally left in body cavity or op wound following procedure
T816 Acute reaction foreign substance accidentally left during a procedure
Y610 FB left in body during surgical operation
Y611 FB left in body during infusion or transfusion
Y612 FB left in body kidney dialysis or other perfusion
Y613 FB left in body during injection or immunisation
Y614 FB left in body during endoscopic exam
Y615 FB left in body during heart catheterisation
Y616 FB left in body during aspiration, puncture and other catheterisation
Grattan Institute 2018 36
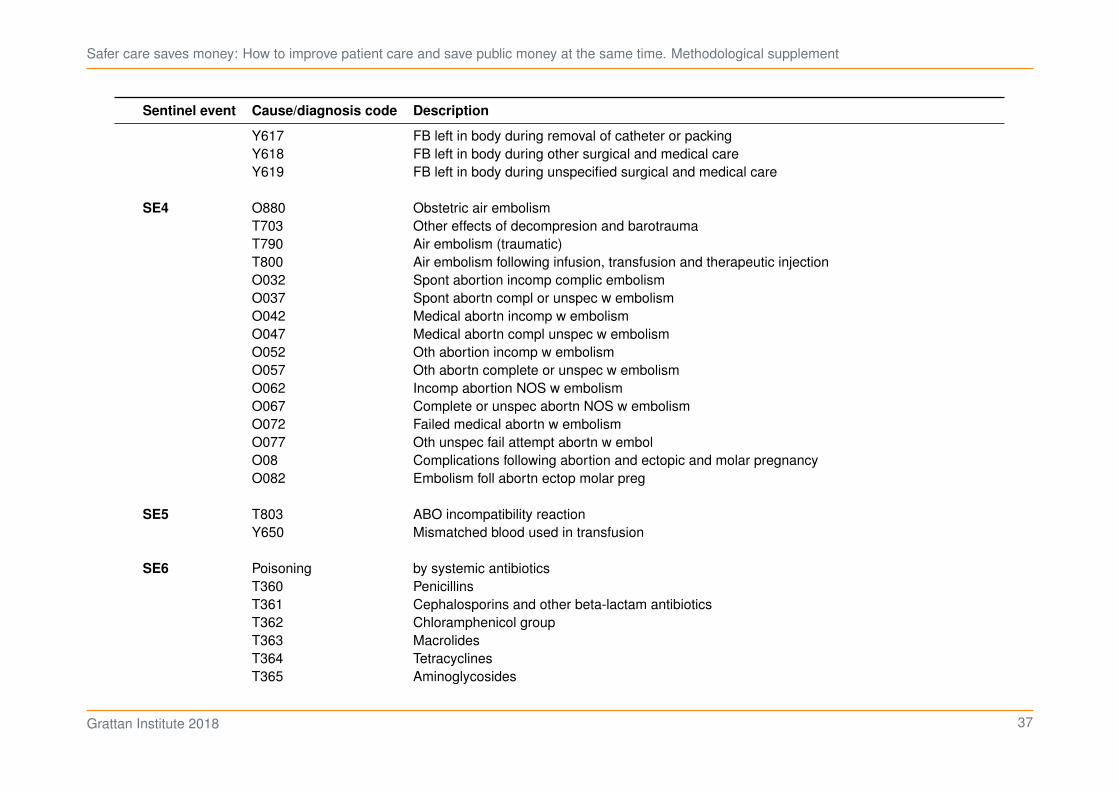
Safer care saves money: How to improve patient care and save public money at the same time. Methodological supplement
Sentinel event Cause/diagnosis code Description
Y617 FB left in body during removal of catheter or packing
Y618 FB left in body during other surgical and medical care
Y619 FB left in body during unspecified surgical and medical care
SE4 O880 Obstetric air embolism
T703 Other effects of decompresion and barotrauma
T790 Air embolism (traumatic)
T800 Air embolism following infusion, transfusion and therapeutic injection
O032 Spont abortion incomp complic embolism
O037 Spont abortn compl or unspec w embolism
O042 Medical abortn incomp w embolism
O047 Medical abortn compl unspec w embolism
O052 Oth abortion incomp w embolism
O057 Oth abortn complete or unspec w embolism
O062 Incomp abortion NOS w embolism
O067 Complete or unspec abortn NOS w embolism
O072 Failed medical abortn w embolism
O077 Oth unspec fail attempt abortn w embol
O08 Complications following abortion and ectopic and molar pregnancy
O082 Embolism foll abortn ectop molar preg
SE5 T803 ABO incompatibility reaction
Y650 Mismatched blood used in transfusion
SE6 Poisoning by systemic antibiotics
T360 Penicillins
T361 Cephalosporins and other beta-lactam antibiotics
T362 Chloramphenicol group
T363 Macrolides
T364 Tetracyclines
T365 Aminoglycosides
Grattan Institute 2018 37
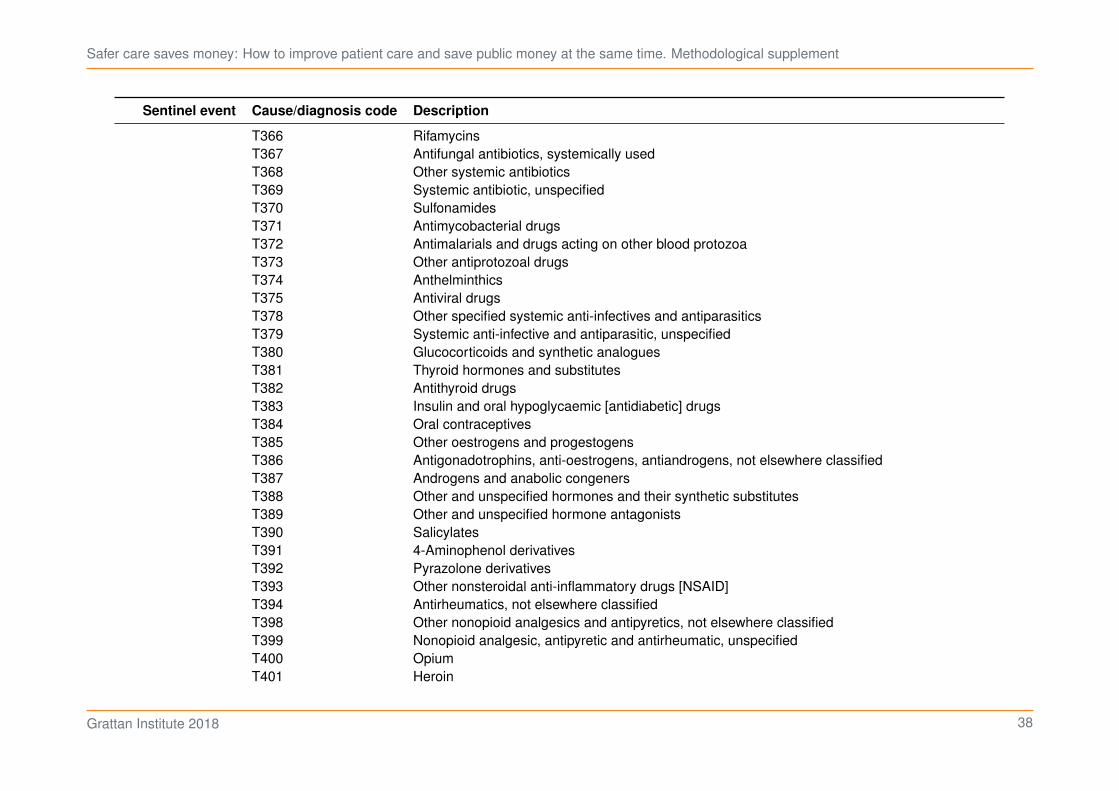
Safer care saves money: How to improve patient care and save public money at the same time. Methodological supplement
Sentinel event Cause/diagnosis code Description
T366 Rifamycins
T367 Antifungal antibiotics, systemically used
T368 Other systemic antibiotics
T369 Systemic antibiotic, unspecified
T370 Sulfonamides
T371 Antimycobacterial drugs
T372 Antimalarials and drugs acting on other blood protozoa
T373 Other antiprotozoal drugs
T374 Anthelminthics
T375 Antiviral drugs
T378 Other specified systemic anti-infectives and antiparasitics
T379 Systemic anti-infective and antiparasitic, unspecified
T380 Glucocorticoids and synthetic analogues
T381 Thyroid hormones and substitutes
T382 Antithyroid drugs
T383 Insulin and oral hypoglycaemic [antidiabetic] drugs
T384 Oral contraceptives
T385 Other oestrogens and progestogens
T386 Antigonadotrophins, anti-oestrogens, antiandrogens, not elsewhere classified
T387 Androgens and anabolic congeners
T388 Other and unspecified hormones and their synthetic substitutes
T389 Other and unspecified hormone antagonists
T390 Salicylates
T391 4-Aminophenol derivatives
T392 Pyrazolone derivatives
T393 Other nonsteroidal anti-inflammatory drugs [NSAID]
T394 Antirheumatics, not elsewhere classified
T398 Other nonopioid analgesics and antipyretics, not elsewhere classified
T399 Nonopioid analgesic, antipyretic and antirheumatic, unspecified
T400 Opium
T401 Heroin
Grattan Institute 2018 38

Safer care saves money: How to improve patient care and save public money at the same time. Methodological supplement
Sentinel event Cause/diagnosis code Description
T402 Other opioids
T403 Methadone
T404 Other synthetic narcotics
T405 Cocaine
T406 Other and unspecified narcotics
T407 Cannabis (derivatives)
T408 Lysergide [LSD]
T409 Other and unspecified psychodysleptics [hallucinogens]
T410 Inhaled anaesthetics
T411 Intravenous anaethetics
T4120 Unspecified general anaesthetic
T4121 Gamma hydroxybutyrate
T4122 Ketamine
T4129 Other specified general anaesthetic
T413 Local anaesthetics
T414 Anaesthetic unspecified
T415 Therapeutic gases
T420 Hydantoin derivatives
T421 Iminostilbenes
T422 Succinimides and oxazolidinediones
T423 Barbiturates
T424 Benzodiazepines
T425 Mixed antiepileptics, not elsewhere classified
T426 Other antiepileptic and sedative-hypnotic drugs
T427 Antiepileptic and sedative-hypnotic drugs, unspecified
T428 Antiparkinsonism drugs and other central muscle-tone depressants
T430 Tricyclic and tetracyclic antidepressants
T431 Monoamine-oxidase-inhibitor antidepressants
T432 Other and unspecified antidepressants
T433 Phenothiazine antipsychotics and neuroleptics
T434 Butyrophenone and thioxanthene neuroleptics
Grattan Institute 2018 39
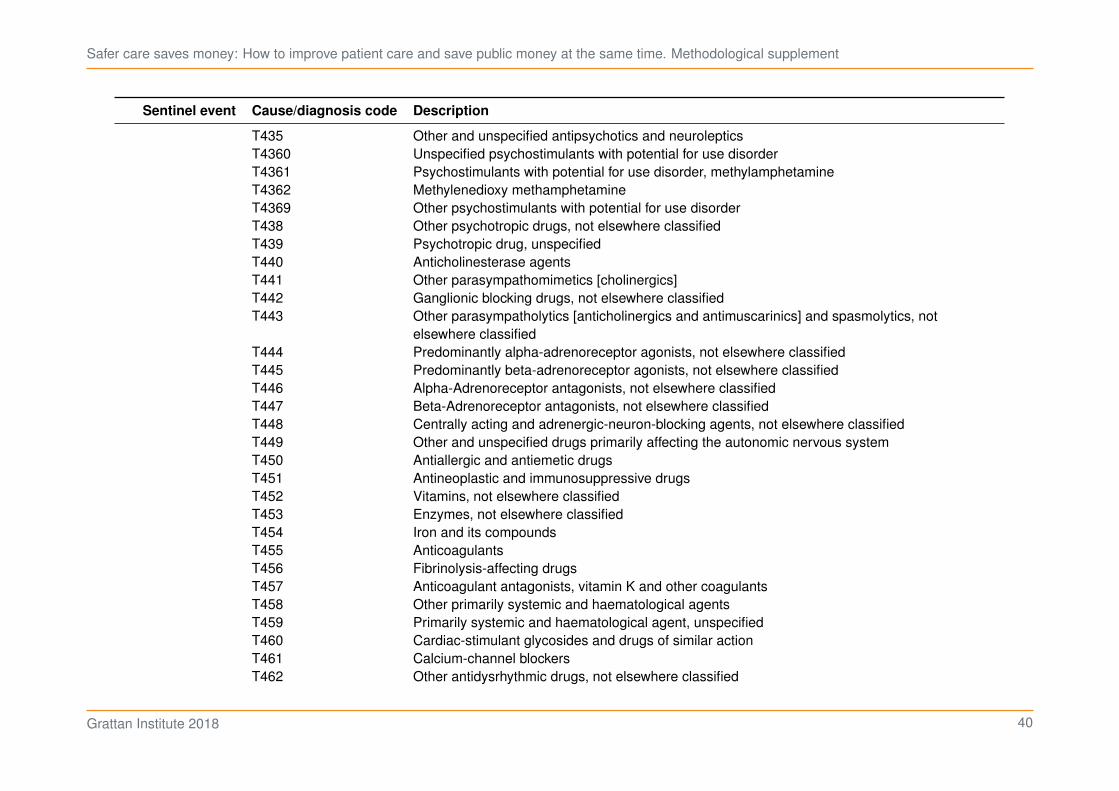
Safer care saves money: How to improve patient care and save public money at the same time. Methodological supplement
Sentinel event Cause/diagnosis code Description
T435 Other and unspecified antipsychotics and neuroleptics
T4360 Unspecified psychostimulants with potential for use disorder
T4361 Psychostimulants with potential for use disorder, methylamphetamine
T4362 Methylenedioxy methamphetamine
T4369 Other psychostimulants with potential for use disorder
T438 Other psychotropic drugs, not elsewhere classified
T439 Psychotropic drug, unspecified
T440 Anticholinesterase agents
T441 Other parasympathomimetics [cholinergics]
T442 Ganglionic blocking drugs, not elsewhere classified
T443 Other parasympatholytics [anticholinergics and antimuscarinics] and spasmolytics, not
elsewhere classified
T444 Predominantly alpha-adrenoreceptor agonists, not elsewhere classified
T445 Predominantly beta-adrenoreceptor agonists, not elsewhere classified
T446 Alpha-Adrenoreceptor antagonists, not elsewhere classified
T447 Beta-Adrenoreceptor antagonists, not elsewhere classified
T448 Centrally acting and adrenergic-neuron-blocking agents, not elsewhere classified
T449 Other and unspecified drugs primarily affecting the autonomic nervous system
T450 Antiallergic and antiemetic drugs
T451 Antineoplastic and immunosuppressive drugs
T452 Vitamins, not elsewhere classified
T453 Enzymes, not elsewhere classified
T454 Iron and its compounds
T455 Anticoagulants
T456 Fibrinolysis-affecting drugs
T457 Anticoagulant antagonists, vitamin K and other coagulants
T458 Other primarily systemic and haematological agents
T459 Primarily systemic and haematological agent, unspecified
T460 Cardiac-stimulant glycosides and drugs of similar action
T461 Calcium-channel blockers
T462 Other antidysrhythmic drugs, not elsewhere classified
Grattan Institute 2018 40

Safer care saves money: How to improve patient care and save public money at the same time. Methodological supplement
Sentinel event Cause/diagnosis code Description
T463 Coronary vasodilators, not elsewhere classified
T464 Angiotensin-converting-enzyme inhibitors
T465 Other antihypertensive drugs, not elsewhere classified
T466 Antihyperlipidaemic and antiarteriosclerotic drugs
T467 Peripheral vasodilators
T468 Antivaricose drugs, including sclerosing agents
T469 Other and unspecified agents primarily affecting the cardiovascular system
T470 Histamine H2-receptor antagonists
T471 Other antacids and anti-gastric-secretion drugs
T472 Stimulant laxatives
T473 Saline and osmotic laxatives
T474 Other laxatives
T475 Digestants
T476 Antidiarrhoeal drugs
T477 Emetics
T478 Other agents primarily affecting the gastrointestinal system
T479 Agent primarily affecting the gastrointestinal system, unspecified
T480 Oxytocic drugs
T481 Skeletal muscle relaxants [neuromuscular blocking agents]
T482 Other and unspecified agents primarily acting on muscles
T483 Antitussives
T484 Expectorants
T485 Anti-common-cold drugs
T486 Antiasthmatics, not elsewhere classified
T487 Other and unspecified agents primarily acting on the respiratory system
T490 Local antifungal, anti-infective and anti-inflammatory drugs, not elsewhere classified
T491 Antipruritics
T492 Local astringents and local detergents
T493 Emollients, demulcents and protectants
T494 Keratolytics, keratoplastics and other hair treatment drugs and preparations
T495 Ophthalmological drugs and preparations
Grattan Institute 2018 41

Safer care saves money: How to improve patient care and save public money at the same time. Methodological supplement
Sentinel event Cause/diagnosis code Description
T496 Otorhinolaryngological drugs and preparations
T497 Dental drugs, topically applied
T498 Other topical agents
T499 Topical agent, unspecified
T500 Mineralocorticoids and their antagonists
T501 Loop [high-ceiling] diuretics
T502 Carbonic-anhydrase inhibitors, benzothiadiazides and other diuretics
T503 Electrolytic, caloric and water-balance agents
T504 Drugs affecting uric acid metabolism
T505 Appetite depressants
T506 Antidotes and chelating agents, not elsewhere classified
T507 Analeptics and opioid receptor antagonists
T508 Diagnostic agents
T509 Other and unspecified drugs, medicaments and biological substances
X40 Accidental poisoning by and exposure to nonopioid analgesics, antipyretics and antirheumat-
ics
X41 Accidental poisoning by and exposure to antiepileptic, sedative-hypnotic, antiparkinsonism
and psychotropic drugs, not elsewhere classified
X42 Accidental poisoning by and exposure to narcotics and psychodysleptics [hallucinogens], not
elsewhere classified
X43 Accidental poisoning by and exposure to other drugs acting on the autonomic nervous
system
X44 Accidental poisoning by and exposure to other and unspecified drugs, medicaments and
biological substances
X478 Accidental poisoning by and exposure to other specified gas and vapours
X479 Accidental poisoning by and exposure to unspecified gas and vapours
Y630 Excessive amount blood or other fluid in transfusion/infusion
Y631 Incorrect dilution fluid during infusion
Y632 Overdose radiation given during therapy
Y634 Failure in dosage in electroshock or insulin-shock therapy
Y636 Nonadministration drug, medicament or biological substance
Grattan Institute 2018 42

Safer care saves money: How to improve patient care and save public money at the same time. Methodological supplement
Sentinel event Cause/diagnosis code Description
Y638 Fail dosage during other surgical and medical care
Y639 Fail dosage during other surgical and medical care
Y639 Fail dosage during unspecified surgical and medical care
Y651 Wrong fluid used in infusion
SE7 O95 Obstetric death of unspecified cause
O960 Death from direct obstetric cause
O961 Death from indirect obstetric cause
O969 Death from obstetric cause, unspecified
O970 Death from sequelae of direct obstetric cause
O971 Death from sequelae of indirect obstetric cause
O979 Death from sequelae of obstetric cause, unspecified
O670 Intrapartum haemorrhage with coagulation defect
O678 Other intrapartum haemorrhage
O679 Intrapartum haemorrhage unspecified
O720 Third-stage haemorrahge
O721 Other immediate postpartum haemorrhage
O722 Delayed and secondary postpartum haemorrhage
T810 Haemorrhage and haematoma complicating a procedure, not elsewhere classified
T811 Shock during or resulting from a procedure, not elsewhere classified
T812 Accidental puncture and laceration during a procedure, not elsewhere classified
T813 Disruption of operation wound, not elsewhere classified
T8141 Wound infection following a procedure
T8142 Sepsis following a procedure
T817 Vascular complications following a procedure, not elsewhere classified
T818 Other complications of procedures, not elsewhere classified
T819 Unspecified complication of procedure
Y843 Shock therapy as the cause of abnormal reaction of the patient, or of later complication,
without mention of misadventure at the time of the procedure
Y844 Aspiration of fluid as the cause of abnormal reaction of the patient, or of later complication,
without mention of misadventure at the time of the procedure
Grattan Institute 2018 43
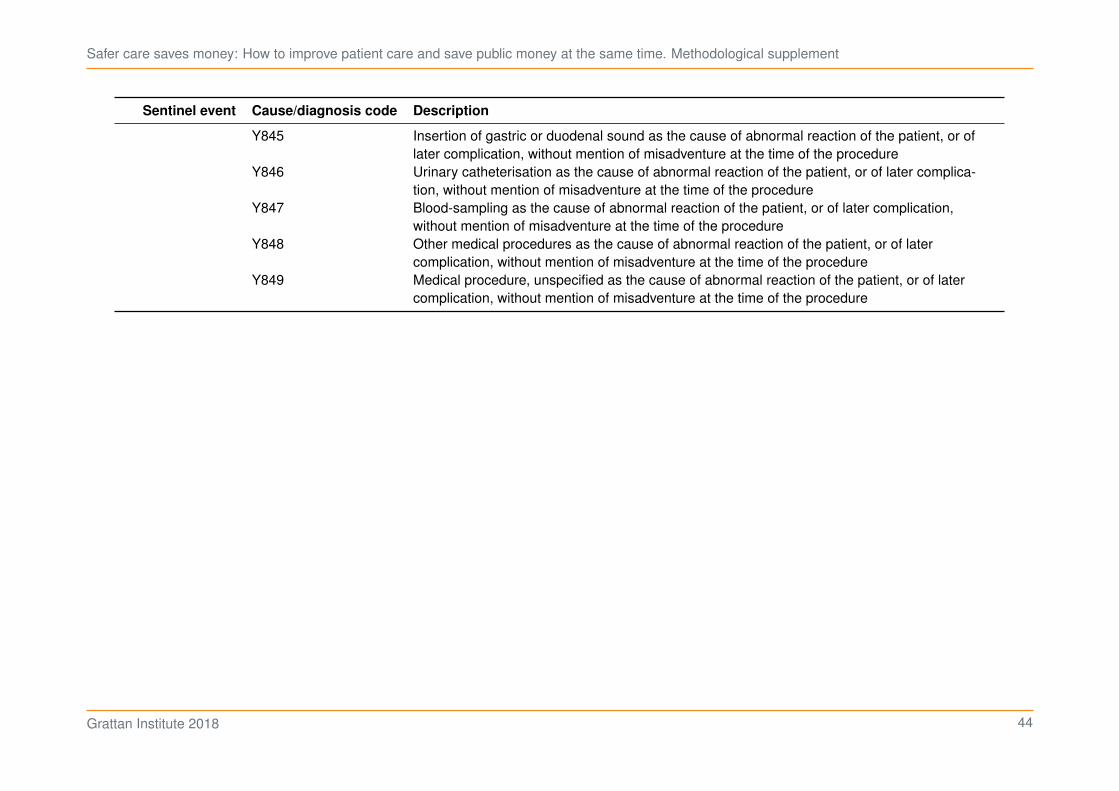
Safer care saves money: How to improve patient care and save public money at the same time. Methodological supplement
Sentinel event Cause/diagnosis code Description
Y845 Insertion of gastric or duodenal sound as the cause of abnormal reaction of the patient, or of
later complication, without mention of misadventure at the time of the procedure
Y846 Urinary catheterisation as the cause of abnormal reaction of the patient, or of later complica-
tion, without mention of misadventure at the time of the procedure
Y847 Blood-sampling as the cause of abnormal reaction of the patient, or of later complication,
without mention of misadventure at the time of the procedure
Y848 Other medical procedures as the cause of abnormal reaction of the patient, or of later
complication, without mention of misadventure at the time of the procedure
Y849 Medical procedure, unspecified as the cause of abnormal reaction of the patient, or of later
complication, without mention of misadventure at the time of the procedure
Grattan Institute 2018 44

Safer care saves money: How to improve patient care and save public money at the same time. Methodological supplement
9 Specialty analysis
To analyse the distribution of hospital risk by specialty, we used a
model that builds upon the method in All complications should count
(Methodological supplement).
The model was a gradient boosted classification tree built using
the H2O.ai tool ported to R.24 Two models were built: the first using
patient-level predictors and the second using both patient and hospital
predictors. (Table 9.1.) The difference in predictions between the two
models was the ‘risk’.
To prepare the data, we:
1. removed all admissions before July 2012 and in the last month (as
records before this date were not complete across all hospitals)
2. ignored complications arising from emergency and ventilatory
admissions
3. excluded non-obstetric sameday admissions
4. excluded any remaining chemotherapy and renal dialysis admis-
sions (as there were too few to draw conclusions about hospital
performance)
For Figure 1.4 in the main report, we calculated the average risk for
each hospital-specialty combination, then subtracted the minimum
average risk from the 10th, . . . , 90th percentiles of these averages to
plot.
24. R Core Team (2018); LeDell et al. (2018); Dowle and Srinivasan (2018);
Parsonage (2018a); Bache and Wickham (2014); Bates et al. (2018); Bates
and Maechler (2018); Klik (2018); Wickham (2017); Parsonage (2018b);
Garnier (2018a); Garnier (2018b); Parsonage et al. (2018); Slowikowski (2018);
Wickham et al. (2018); and Wright et al. (2018).
Table 9.1: Patient and hospital predictors used in the specialty analysis
Predictor Patient Patient &
Hospital
Admission mode
Urgency of admission
Number of procedures
Sex
Age
Month
AR-DRG
Resource consumption
Comorbidities (except chronic and pregnancy)
Public/private hospital
State
Hospital identifier
For Figure 1.5, the collection of averages for each specialty was plotted
against the corresponding averages for other specialties in the same
hospital. An OLS regression was then modelled and the adjusted 𝑅2
plotted for each specialty.
Grattan Institute 2018 45

Safer care saves money: How to improve patient care and save public money at the same time. Methodological supplement
Bibliography
AIHW (2015). The health and welfare of Australia’s Aboriginal and Torres
Strait Islander peoples 2015. Australian Institute of Health and
Welfare. https://www.aihw.gov.au/reports/indigenous-health-
welfare/indigenous-health-welfare-2015/contents/table-of-contents.
(2016). Admitted patient care 2014–15: Australian hospital statistics.
Australian Institute of Health and Welfare.
http://www.aihw.gov.au/publication-detail/?id=60129554702&tab=3.
Bache, S. M. and Wickham, H. (2014). magrittr: A Forward-Pipe Operator for
R. R package version 1.5.
https://CRAN.R-project.org/package=magrittr.
Bates, D. and Maechler, M. (2018). Matrix: Sparse and Dense Matrix Classes
and Methods. R package version 1.2-14.
https://CRAN.R-project.org/package=Matrix.
Bates et al. (2018). Bates, D., Maechler, M., Bolker, B. and Walker, S. lme4:
Linear Mixed-Effects Models using ’Eigen’ and S4. R package version
1.1-17. https://CRAN.R-project.org/package=lme4.
Danks, L. and Duckett, S. (2018). All complications should count: Using our
data to make hospitals safer (Methodological supplement). Grattan
Institute. https://grattan.edu.au/report/all-complications-should-count-
using-our-data-to-make-hospitals-safer/.
Dowle, M. and Srinivasan, A. (2018). data.table: Extension of ‘data.frame‘. R
package version 1.11.4.
https://CRAN.R-project.org/package=data.table.
Duckett et al. (2018). Duckett, S., Jorm, C., Danks, L. and Moran, G. All
complications should count: Using our data to make hospitals safer.
Report No. 2018-01. Grattan Institute.
https://grattan.edu.au/report/all-complications-should-count-using-
our-data-to-make-hospitals-safer/.
Garnier, S. (2018a). viridis: Default Color Maps from ’matplotlib’. R package
version 0.5.1. https://CRAN.R-project.org/package=viridis.
(2018b). viridisLite: Default Color Maps from ’matplotlib’ (Lite
Version). R package version 0.3.0.
https://CRAN.R-project.org/package=viridisLite.
Glick, H. (2015). “Identifying an Appropriate Link and Family for Generalized
Linear Models”. Presentation to the International Society for
Pharmacoeconomics and Outcomes Research 20th Annual
International Meeting.
https://web.archive.org/web/20161020104544/http://www.uphs.upenn
.edu/dgimhsr/documents/ispor15.glmworkshop.glick.2.pdf.
Health Policy Analysis (2013). Analysis of hospital-acquired diagnoses and
their effect on case complexity and resource use – Final report.
Australian Commission on Safety and Quality in Health Care, Sydney.
https://www.safetyandquality.gov.au/wp-
content/uploads/2014/06/Analysis-of-hospital-acquired-diagnoses-
and-their-effect-on-case-complexity-and-resource-use-Dec-
2013.pdf.
Jackson et al. (2009). Jackson, T., Michel, J. L., Roberts, R. F., Jorm, C. M.
and Wakefield, J. G. “A classification of hospital-acquired diagnoses
for use with routine hospital data”. Medical Journal of Australia
191.10, p. 544.
Jackson et al. (2011). Jackson, T., Nghiem, H. S., Rowell, D., Jorm, C. and
Wakefield, J. “Marginal costs of hospital-acquired conditions:
information for priority-setting for patient safety programmes and
research”. Journal of health services research & policy 16.3,
pp. 141–146.
Jackson et al. (2013). Jackson, T., Fong, A., Liu, M., Murray, K., Walz, L.,
Houston, C. and Dean, S. “Incremental costs of hospital-acquired
complications in Alberta, Canada”. Under review.
Klik, M. (2018). fst: Lightning Fast Serialization of Data Frames for R. R
package version 0.8.8. https://CRAN.R-project.org/package=fst.
Grattan Institute 2018 46
Safer care saves money: How to improve patient care and save public money at the same time. Methodological supplement
LeDell et al. (2018). LeDell, E. et al. h2o: R Interface for ’H2O’. R package
version 3.20.0.2. https://CRAN.R-project.org/package=h2o.
Meyer et al. (2017). Meyer, D., Zeileis, A. and Hornik, K. vcd: Visualizing
Categorical Data. R package version 1.4-4.
https://CRAN.R-project.org/package=vcd.
Nossaman et al. (2015). Nossaman, V. E., Richardson, W. S.,
Wooldridge, J. B. and Nossaman, B. D. “Role of intraoperative fluids
on hospital length of stay in laparoscopic bariatric surgery: a
retrospective study in 224 consecutive patients”. Surgical Endoscopy
29.10, pp. 2960–2969. ISSN: 1432-2218.
https://doi.org/10.1007/s00464-014-4029-1.
Parsonage, H. (2018a). hutils: Miscellaneous R Functions and Aliases. R
package version 1.2.0. https://github.com/hughparsonage/hutils.
(2018b). grattanCharts: Create Charts in the Style of the Grattan
Insitute, Melbourne. R package version 0.8.0.
Parsonage et al. (2018). Parsonage, H., Cameron, T., Coates, B., Katzen, M.
and Young, W. grattan: Australian Tax Policy Analysis. R package
version 1.6.1.0. https://github.com/HughParsonage/grattan.
R Core Team (2018). R: A Language and Environment for Statistical
Computing. R Foundation for Statistical Computing. Vienna, Austria.
https://www.R-project.org/.
Ripley, B. (2018). MASS: Support Functions and Datasets for Venables and
Ripley’s MASS. R package version 7.3-50.
https://CRAN.R-project.org/package=MASS.
Slowikowski, K. (2018). ggrepel: Automatically Position Non-Overlapping Text
Labels with ’ggplot2’. R package version 0.8.0.
https://CRAN.R-project.org/package=ggrepel.
Toson et al. (2016). Toson, B., Harvey, L. A. and Close, J. C. “New ICD-10
version of the Multipurpose Australian Comorbidity Scoring System
outperformed Charlson and Elixhauser comorbidities in an older
population”. Journal of clinical epidemiology 79, pp. 62–69.
Wickham, H. (2017). scales: Scale Functions for Visualization. R package
version 0.5.0. https://CRAN.R-project.org/package=scales.
Wickham et al. (2018). Wickham, H., Chang, W., Henry, L., Pedersen, T. L.,
Takahashi, K., Wilke, C. and Woo, K. ggplot2: Create Elegant Data
Visualisations Using the Grammar of Graphics. R package version
3.0.0. https://CRAN.R-project.org/package=ggplot2.
Wright et al. (2018). Wright, M. N., Wager, S. and Probst, P. ranger: A Fast
Implementation of Random Forests. R package version 0.10.1.
https://CRAN.R-project.org/package=ranger.
Yee, T. W. (2018). VGAM: Vector Generalized Linear and Additive Models. R
package version 1.0-5. https://CRAN.R-project.org/package=VGAM.
Grattan Institute 2018 47