Embed Size (px)
Citation preview
2012
Max Henkle
CVEN 5621
12/10/2012
Safe Stopping Distance at Two-Way Stop Intersections
Max Henkle Safe Stopping Distance at Two-Way Stop Intersections CVEN 5621
1
Contents Abstract ........................................................................................................................... 2
Introduction ..................................................................................................................... 2
Study Area Characteristics .......................................................................................... 3
Warrants ...................................................................................................................... 5
Sight Triangles ............................................................................................................. 6
Departure Sight Triangles ............................................................................................ 8
Methods ........................................................................................................................ 12
Study Site .................................................................................................................. 12
Intersection Sight Distance ........................................................................................ 14
Safe Stopping Distance ............................................................................................. 15
Major Street Passenger Car Stopping Time .............................................................. 15
Passenger Car Clearance Time................................................................................. 16
Bicycle Clearance Time ............................................................................................. 16
Pedestrian Clearance Time ....................................................................................... 17
Results and Discussion ................................................................................................. 18
Minor Street Passenger Car Clearance ..................................................................... 18
Minor Street Bicycle Clearance.................................................................................. 19
Minor Street Pedestrian Clearance ............................................................................ 19
Issues with Assumptions ........................................................................................... 20
Reccomendations ...................................................................................................... 21
Conclusion .................................................................................................................... 23
Bibliography .................................................................................................................. 24
Max Henkle Safe Stopping Distance at Two-Way Stop Intersections CVEN 5621
2
Abstract
According to the Uniform Vehicle Code via Figure 3B-21 of the MUTCD, a 20ft No-
Parking zone, as measured from the end parking space to the crosswalk, is required. Is
this number appropriate in all circumstances? In situations where two-way stops and
narrow streets exist, effective sight distance can be obscured by vehicles parked on the
street. Therefore, it can difficult for vehicles, bicycles, and pedestrians stopped behind
intersection thresholds with non-yielding cross-traffic to determine when the intersection
can safely be cleared. A case study was made at the intersection of 5th Avenue and
Pennsylvania Street in the City and County of Denver, CO. This is a two-way stop
controlled intersection of two narrow, local streets with on-street parking. Using
geometric lines of sight and intersection clearance time calculations outlined in the
Highway Capacity Manual and AASHTO Green Book, sight triangles were created in
order to determine (1) at what point cross-traffic becomes visible to the user behind the
stop bar, (2) the available clearance time, and (3) whether 25mph is an acceptably safe
speed for cross-traffic. Recommendations were made regarding safe speed and
expansion of the No-Parking zones in order to enhance stopping sight distances.
Greater elaboration of the role of on-street parking on sight triangles in the Green Book
was desired.
Data on intersection width and no-parking zones was gathered principally through photo
interpretation, with supplemental field measurements. Intersection type and speed limits
were determined though data provided by the City and County of Denver GIS
department. The HCM and AASHTO Green Book was used to determine auto and
pedestrian clearance time, while bicycle clearance time was determined empirically.
Introduction
Two-way stop controlled intersections with unmarked crosswalks are commonly
encountered in residential neighborhoods. At a two-way stop controlled intersection,
traffic on the “minor” street is required to stop behind the crosswalk and yield to traffic
on the cross (“major”) street before proceeding. Yet when on-street parking is present
on narrow streets, users’ ability to recognize conflicting traffic can be impaired. The
Max Henkle Safe Stopping Distance at Two-Way Stop Intersections CVEN 5621
3
HCM and Green Book make little mention of local street design, devoting the majority of
their attention to roadways of higher volume and capacity.
It is entirely possible, however, that the design of local streets can play an important role
in the safety of the overall transportation network. In a study of 24 California cities
between 30,000 and 150,000 in population, Marshall and Garrick found that older cities
and those with higher nodal intersection density to be significantly safer than those
which incorporated later with a more curvilinear and hierarchical form (Street Network
Types and Road Safety: A Study of 24 California Cities, 2010). In comparing
intersection density, cities in the safer group experienced 40.6% fewer serious crashes
with average intersection density of 106 per square mile, versus 63 per square mile for
the less safe group. Cities in the safer group also had a significantly earlier date of
incorporation (1895 vs. 1932) and experienced 73.2% fewer non-highway fatalities.
Study Area Characteristics
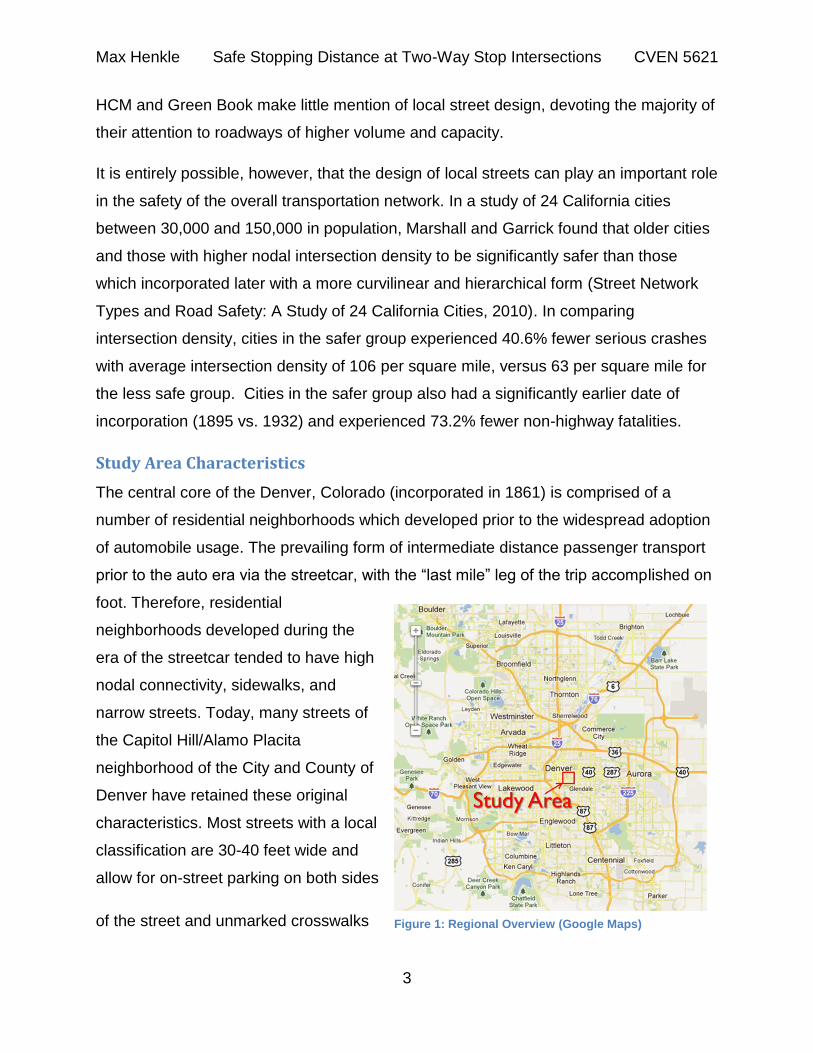
The central core of the Denver, Colorado (incorporated in 1861) is comprised of a
number of residential neighborhoods which developed prior to the widespread adoption
of automobile usage. The prevailing form of intermediate distance passenger transport
prior to the auto era via the streetcar, with the “last mile” leg of the trip accomplished on
foot. Therefore, residential
neighborhoods developed during the
era of the streetcar tended to have high
nodal connectivity, sidewalks, and
narrow streets. Today, many streets of
the Capitol Hill/Alamo Placita
neighborhood of the City and County of
Denver have retained these original
characteristics. Most streets with a local
classification are 30-40 feet wide and
allow for on-street parking on both sides
of the street and unmarked crosswalks Figure 1: Regional Overview (Google Maps)
Max Henkle Safe Stopping Distance at Two-Way Stop Intersections CVEN 5621
4
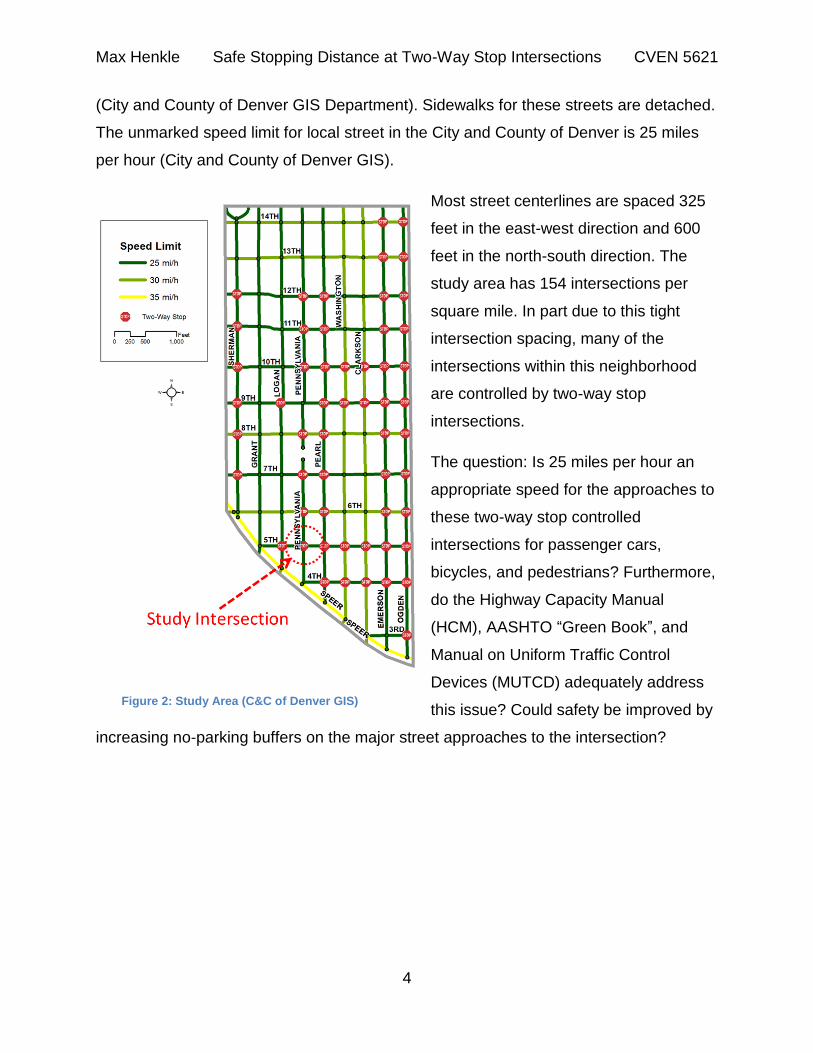
(City and County of Denver GIS Department). Sidewalks for these streets are detached.
The unmarked speed limit for local street in the City and County of Denver is 25 miles
per hour (City and County of Denver GIS).
Most street centerlines are spaced 325
feet in the east-west direction and 600
feet in the north-south direction. The
study area has 154 intersections per
square mile. In part due to this tight
intersection spacing, many of the
intersections within this neighborhood
are controlled by two-way stop
intersections.
The question: Is 25 miles per hour an
appropriate speed for the approaches to
these two-way stop controlled
intersections for passenger cars,
bicycles, and pedestrians? Furthermore,
do the Highway Capacity Manual
(HCM), AASHTO “Green Book”, and
Manual on Uniform Traffic Control
Devices (MUTCD) adequately address
this issue? Could safety be improved by
increasing no-parking buffers on the major street approaches to the intersection?
Figure 2: Study Area (C&C of Denver GIS)
Max Henkle Safe Stopping Distance at Two-Way Stop Intersections CVEN 5621
5
Warrants
Section 2B.06 of the (MUTCD) warrants the following conditions for the placement of
two-way stop controlled intersections:
The use of STOP signs on the minor-street approaches should be considered if engineering judgment indicates that a stop is always required because of one or more of the following conditions:
A. The vehicular traffic volumes on the through street or highway exceed 6,000 vehicles per day;
B. A restricted view exists that requires road users to stop in order to adequately observe conflicting traffic (emphasis added) on the through street or highway; and/or
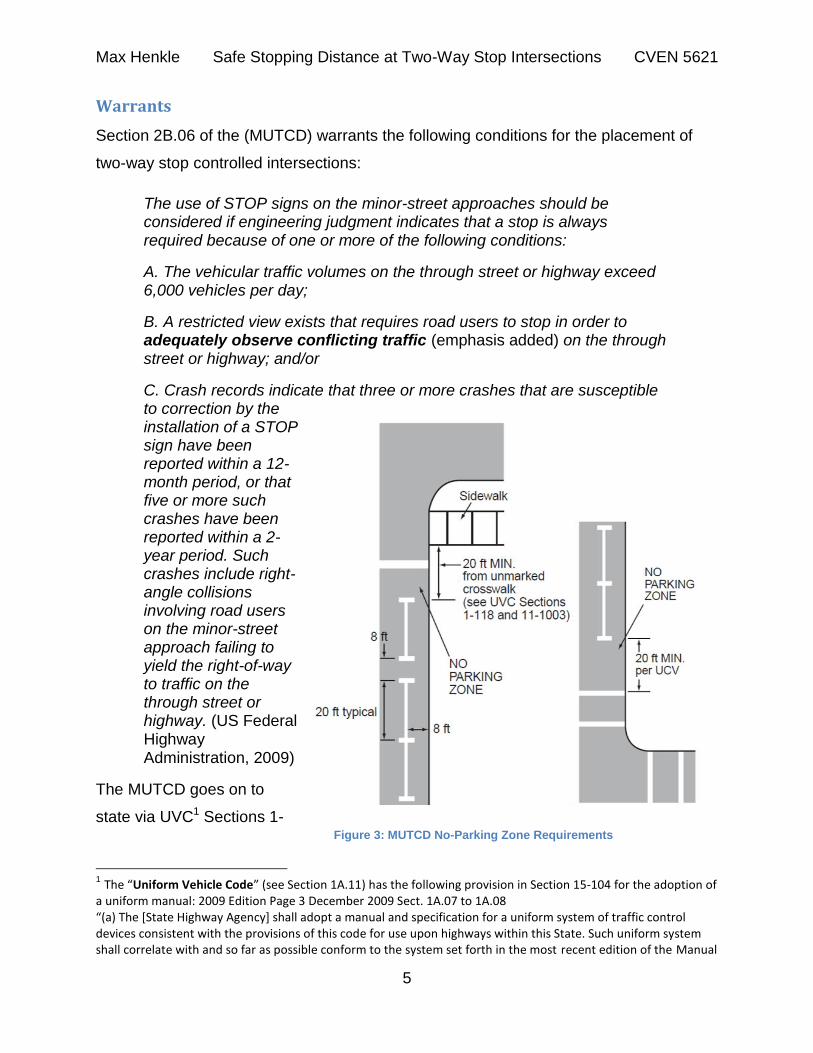
C. Crash records indicate that three or more crashes that are susceptible to correction by the installation of a STOP sign have been reported within a 12-month period, or that five or more such crashes have been reported within a 2-year period. Such crashes include right-angle collisions involving road users on the minor-street approach failing to yield the right-of-way to traffic on the through street or highway. (US Federal Highway Administration, 2009)
The MUTCD goes on to
state via UVC1 Sections 1-
1 The “Uniform Vehicle Code” (see Section 1A.11) has the following provision in Section 15-104 for the adoption of
a uniform manual: 2009 Edition Page 3 December 2009 Sect. 1A.07 to 1A.08 “(a) The [State Highway Agency] shall adopt a manual and specification for a uniform system of traffic control devices consistent with the provisions of this code for use upon highways within this State. Such uniform system shall correlate with and so far as possible conform to the system set forth in the most recent edition of the Manual
Figure 3: MUTCD No-Parking Zone Requirements
Max Henkle Safe Stopping Distance at Two-Way Stop Intersections CVEN 5621
6
118 and 11-1003 that a 20 foot buffer needs to be employed between the threshold of
an unmarked crosswalk on the first and last on-street parking spaces, presumably in
order to improve the ability to observe conflicting traffic.
Sight Triangles
The AASHTO Green Book defines a sight triangle as “Specified areas along intersection
approach legs and across their included corners [that] should be clear of obstructions
that might block the driver’s view of potentially conflicting vehicles (p.652)”. According to
AASHTO, the dimensions of sight triangles are determined by observed driver behavior
and documented by space time profiles and speed choices of drivers on intersection
approaches. The Green Book differentiates between approach sight triangles (used in
determining whether some form of intersection control is warranted) and departure sight
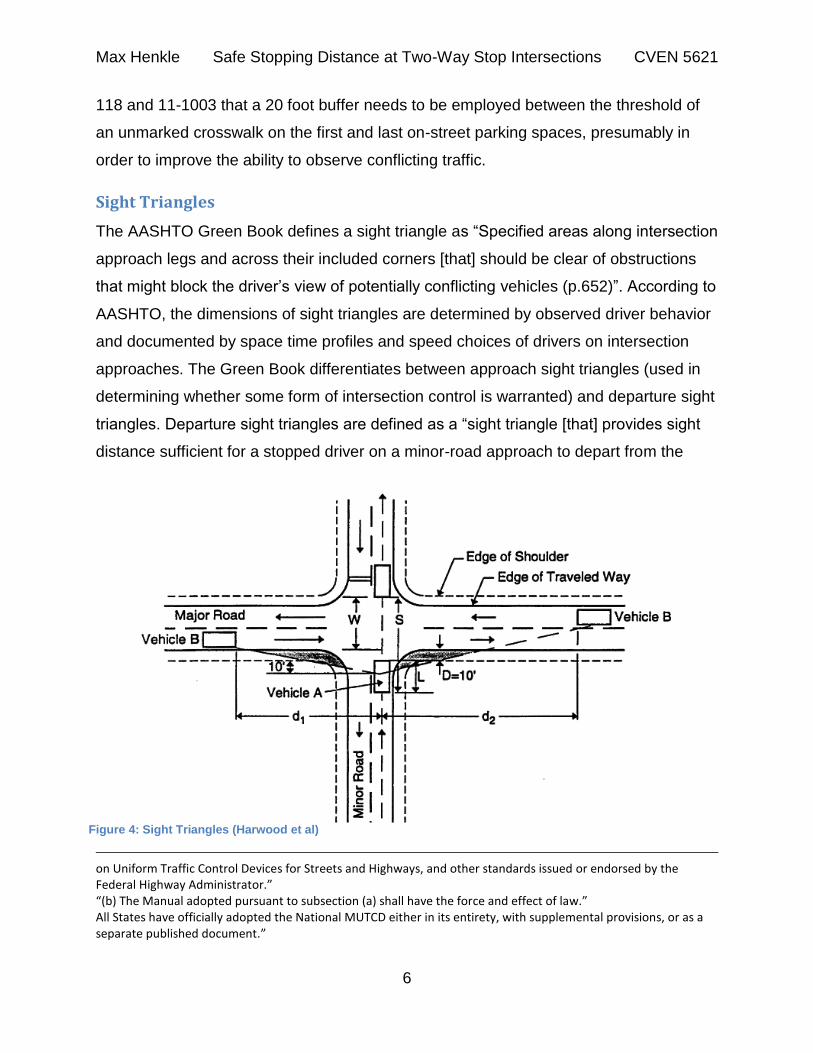
triangles. Departure sight triangles are defined as a “sight triangle [that] provides sight
distance sufficient for a stopped driver on a minor-road approach to depart from the
on Uniform Traffic Control Devices for Streets and Highways, and other standards issued or endorsed by the Federal Highway Administrator.” “(b) The Manual adopted pursuant to subsection (a) shall have the force and effect of law.” All States have officially adopted the National MUTCD either in its entirety, with supplemental provisions, or as a separate published document.”
Figure 4: Sight Triangles (Harwood et al)
Max Henkle Safe Stopping Distance at Two-Way Stop Intersections CVEN 5621
7
intersection and enter or cross the major road. The Green Book states that “departure
sight triangles should be provided in each quadrant of each intersection approach
controlled by a stop or yield sign (p. 653)”.
Harwood et al, using video detection, recommended 7.5s of travel time at the design
speed of the major road (Design policies for sight distance at stop-controlled
intersections based on gap acceptance, 1999). Left turns were determined to require
the greatest gap acceptance time.
AASHTO recommends this sight triangles be calculated considering both the horizontal
and vertical dimension of the obstruction, and at a drivers’ eye height and object seen
height of 3.5 ft. above the roadway surface. The object height is based on a vehicle
height of 4.35, representing the 15th percentile height of passenger cars as they existed
in 2004.
The Green Book outline recommended sight triangles based on intersection control
type. For two-way stop controlled intersections, Case B applies, with three subcases
representing the three possible movements of the user on the minor approach. These
distances may be adjusted for grade using Exhibit 9-53 of the Green Book, though for
grades between -3.0% and +3.0% the grade remains static.
What is clear from Figure 4 is that if the distance of an actual site triangle’s major street
leg (in this case d1 and d2) is less than the minimum distance required for the driver on
the major to recognize and obstacle and come to a complete stop, collisions are more
likely to occur.
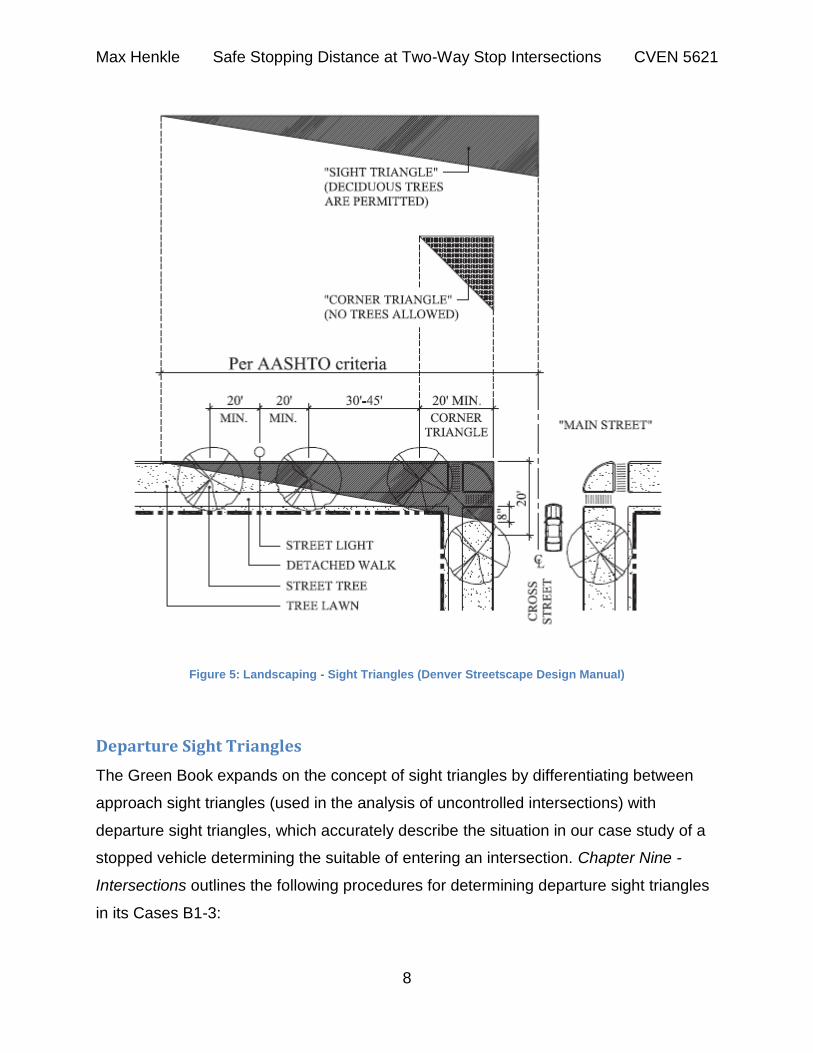
The Denver Streetscape Design Manual is very prescriptive on the role of vegetation on
sightlines (including a 20 foot minimum corner triangle clear zone outlined by
AASSHTO); however, its realm is limited to obstructions lying within the curb line. On-
street parking is not referenced (City and County of Denver, 1993)
Max Henkle Safe Stopping Distance at Two-Way Stop Intersections CVEN 5621
8
Figure 5: Landscaping - Sight Triangles (Denver Streetscape Design Manual)
Departure Sight Triangles
The Green Book expands on the concept of sight triangles by differentiating between
approach sight triangles (used in the analysis of uncontrolled intersections) with
departure sight triangles, which accurately describe the situation in our case study of a
stopped vehicle determining the suitable of entering an intersection. Chapter Nine -
Intersections outlines the following procedures for determining departure sight triangles
in its Cases B1-3:
Max Henkle Safe Stopping Distance at Two-Way Stop Intersections CVEN 5621
9
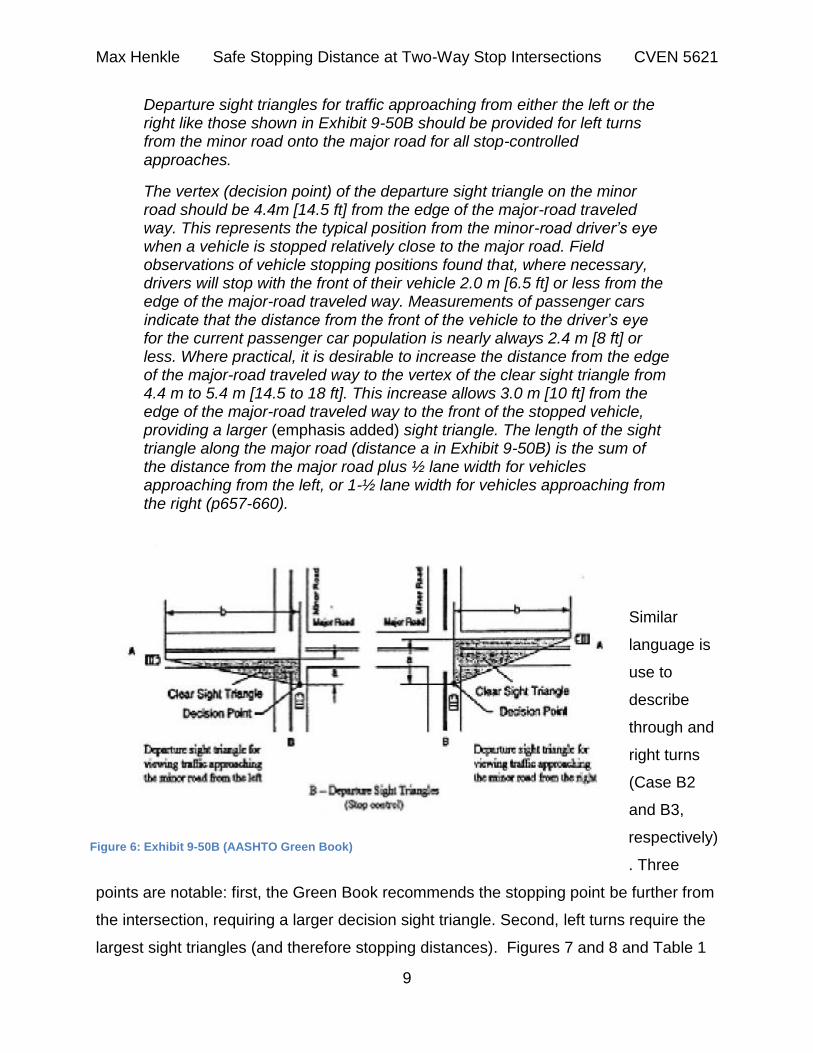
Departure sight triangles for traffic approaching from either the left or the right like those shown in Exhibit 9-50B should be provided for left turns from the minor road onto the major road for all stop-controlled approaches.
The vertex (decision point) of the departure sight triangle on the minor road should be 4.4m [14.5 ft] from the edge of the major-road traveled way. This represents the typical position from the minor-road driver’s eye when a vehicle is stopped relatively close to the major road. Field observations of vehicle stopping positions found that, where necessary, drivers will stop with the front of their vehicle 2.0 m [6.5 ft] or less from the edge of the major-road traveled way. Measurements of passenger cars indicate that the distance from the front of the vehicle to the driver’s eye for the current passenger car population is nearly always 2.4 m [8 ft] or less. Where practical, it is desirable to increase the distance from the edge of the major-road traveled way to the vertex of the clear sight triangle from 4.4 m to 5.4 m [14.5 to 18 ft]. This increase allows 3.0 m [10 ft] from the edge of the major-road traveled way to the front of the stopped vehicle, providing a larger (emphasis added) sight triangle. The length of the sight triangle along the major road (distance a in Exhibit 9-50B) is the sum of the distance from the major road plus ½ lane width for vehicles approaching from the left, or 1-½ lane width for vehicles approaching from the right (p657-660).
Similar
language is
use to
describe
through and
right turns
(Case B2
and B3,
respectively)
. Three
points are notable: first, the Green Book recommends the stopping point be further from
the intersection, requiring a larger decision sight triangle. Second, left turns require the
largest sight triangles (and therefore stopping distances). Figures 7 and 8 and Table 1
Figure 6: Exhibit 9-50B (AASHTO Green Book)
Max Henkle Safe Stopping Distance at Two-Way Stop Intersections CVEN 5621
10
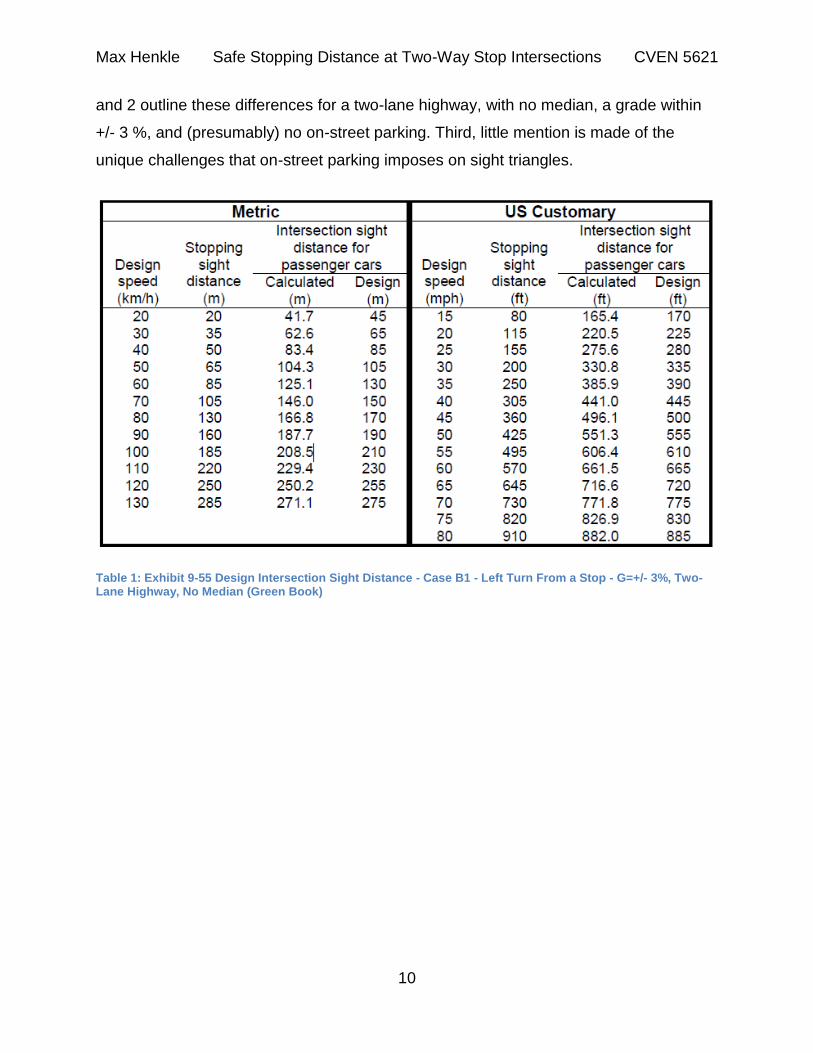
and 2 outline these differences for a two-lane highway, with no median, a grade within
+/- 3 %, and (presumably) no on-street parking. Third, little mention is made of the
unique challenges that on-street parking imposes on sight triangles.
Table 1: Exhibit 9-55 Design Intersection Sight Distance - Case B1 - Left Turn From a Stop - G=+/- 3%, Two-Lane Highway, No Median (Green Book)
Max Henkle Safe Stopping Distance at Two-Way Stop Intersections CVEN 5621
11
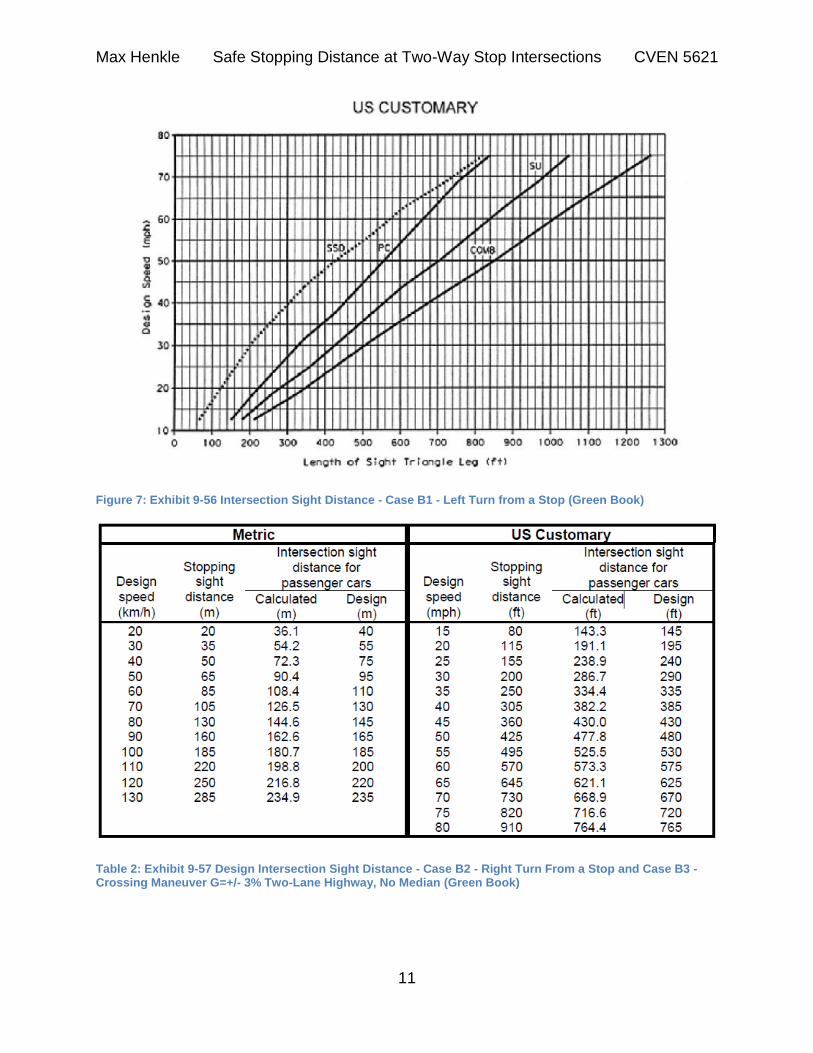
Figure 7: Exhibit 9-56 Intersection Sight Distance - Case B1 - Left Turn from a Stop (Green Book)
Table 2: Exhibit 9-57 Design Intersection Sight Distance - Case B2 - Right Turn From a Stop and Case B3 - Crossing Maneuver G=+/- 3% Two-Lane Highway, No Median (Green Book)
Max Henkle Safe Stopping Distance at Two-Way Stop Intersections CVEN 5621
12
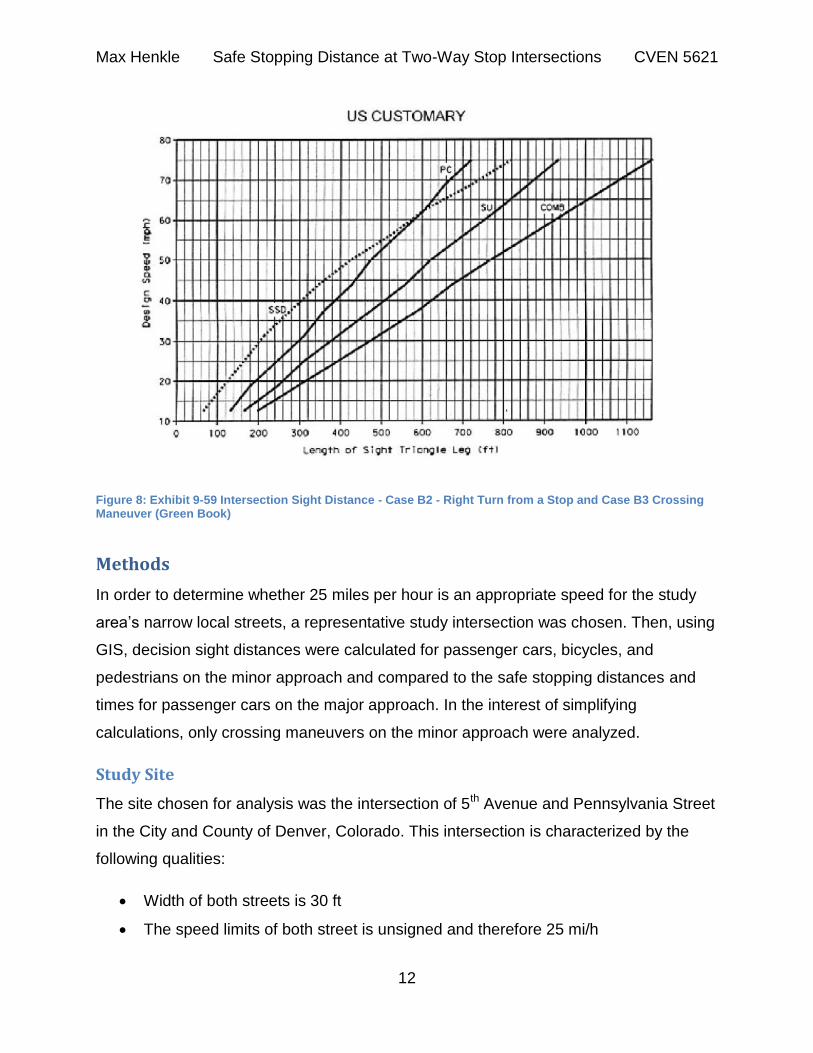
Figure 8: Exhibit 9-59 Intersection Sight Distance - Case B2 - Right Turn from a Stop and Case B3 Crossing Maneuver (Green Book)
Methods
In order to determine whether 25 miles per hour is an appropriate speed for the study
area’s narrow local streets, a representative study intersection was chosen. Then, using
GIS, decision sight distances were calculated for passenger cars, bicycles, and
pedestrians on the minor approach and compared to the safe stopping distances and
times for passenger cars on the major approach. In the interest of simplifying
calculations, only crossing maneuvers on the minor approach were analyzed.
Study Site
The site chosen for analysis was the intersection of 5th Avenue and Pennsylvania Street
in the City and County of Denver, Colorado. This intersection is characterized by the
following qualities:
Width of both streets is 30 ft
The speed limits of both street is unsigned and therefore 25 mi/h
Max Henkle Safe Stopping Distance at Two-Way Stop Intersections CVEN 5621
13
On-street parking exists on both sides of both streets
Pennsylvania is stop-controlled (minor street)
5th Ave is not stop-controlled (major street)
No-Parking zone distances from unmarked crosswalks vary
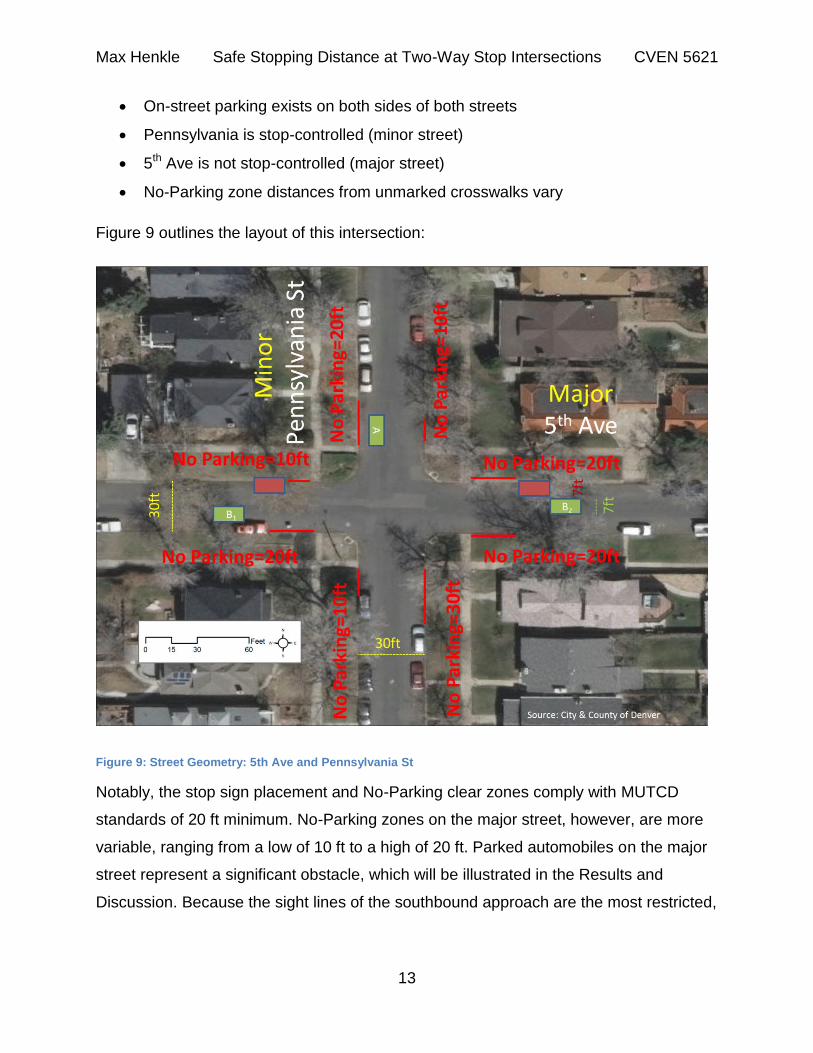
Figure 9 outlines the layout of this intersection:
Figure 9: Street Geometry: 5th Ave and Pennsylvania St
Notably, the stop sign placement and No-Parking clear zones comply with MUTCD
standards of 20 ft minimum. No-Parking zones on the major street, however, are more
variable, ranging from a low of 10 ft to a high of 20 ft. Parked automobiles on the major
street represent a significant obstacle, which will be illustrated in the Results and
Discussion. Because the sight lines of the southbound approach are the most restricted,
Max Henkle Safe Stopping Distance at Two-Way Stop Intersections CVEN 5621
14
only sight triangles viewed from the southbound approach are used in the following
calculations.
Intersection Sight Distance
On pages 650-651, the Green Book states,
Sight distance is provided at intersections to allow the drivers to perceive the presence of potentially conflicting vehicles. This should occur in sufficient time for motorists to stop or adjust their speed, as appropriate, to avoid colliding in the intersection. The methods needed for determining sight distance are the same for determining stopping sight distance, but incorporate modified assumptions. Based on observed driver behavior at intersections….Sight Distance is also provided at intersections to allow the drivers of stopped vehicles a sufficient view of the intersecting highway to decide when to enter the intersecting highway or when to cross it. If the available sight distance for an entering roadway is at least (emphasis added) equal to the stopping sight distance for the major road, the drivers have sufficient sight distance to anticipate and avoid collisions.
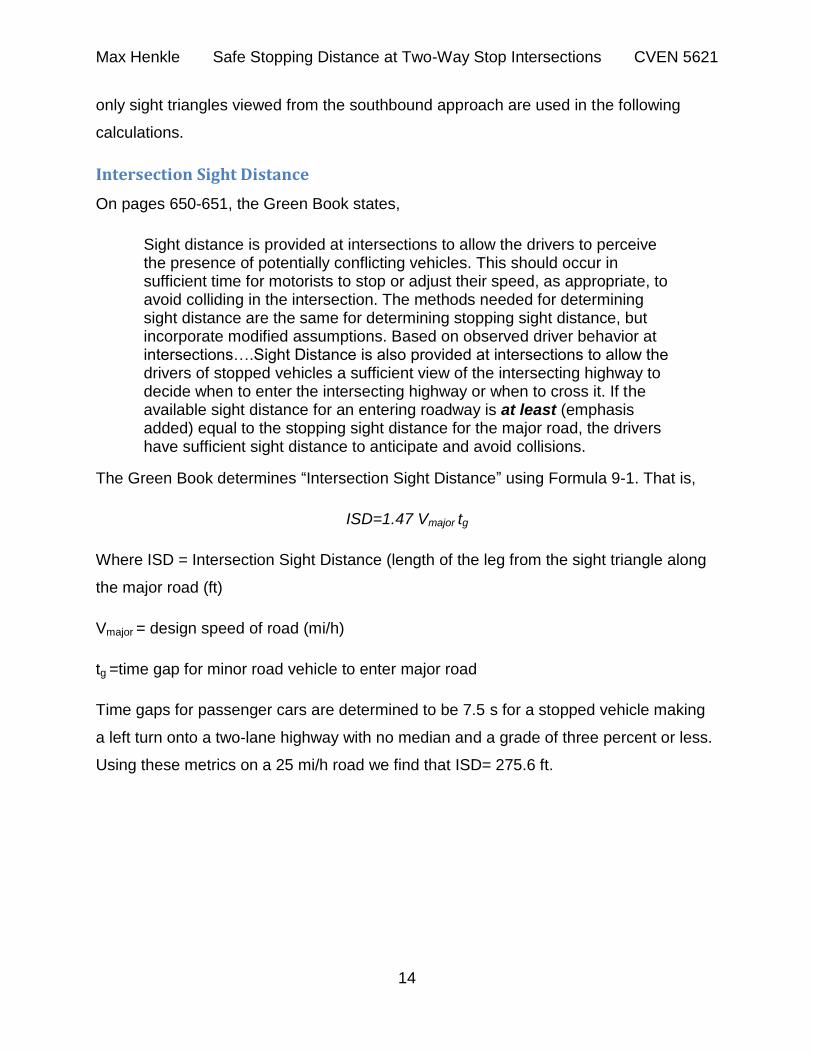
The Green Book determines “Intersection Sight Distance” using Formula 9-1. That is,
ISD=1.47 Vmajor tg
Where ISD = Intersection Sight Distance (length of the leg from the sight triangle along
the major road (ft)
Vmajor = design speed of road (mi/h)
tg =time gap for minor road vehicle to enter major road
Time gaps for passenger cars are determined to be 7.5 s for a stopped vehicle making
a left turn onto a two-lane highway with no median and a grade of three percent or less.
Using these metrics on a 25 mi/h road we find that ISD= 275.6 ft.
Max Henkle Safe Stopping Distance at Two-Way Stop Intersections CVEN 5621
15
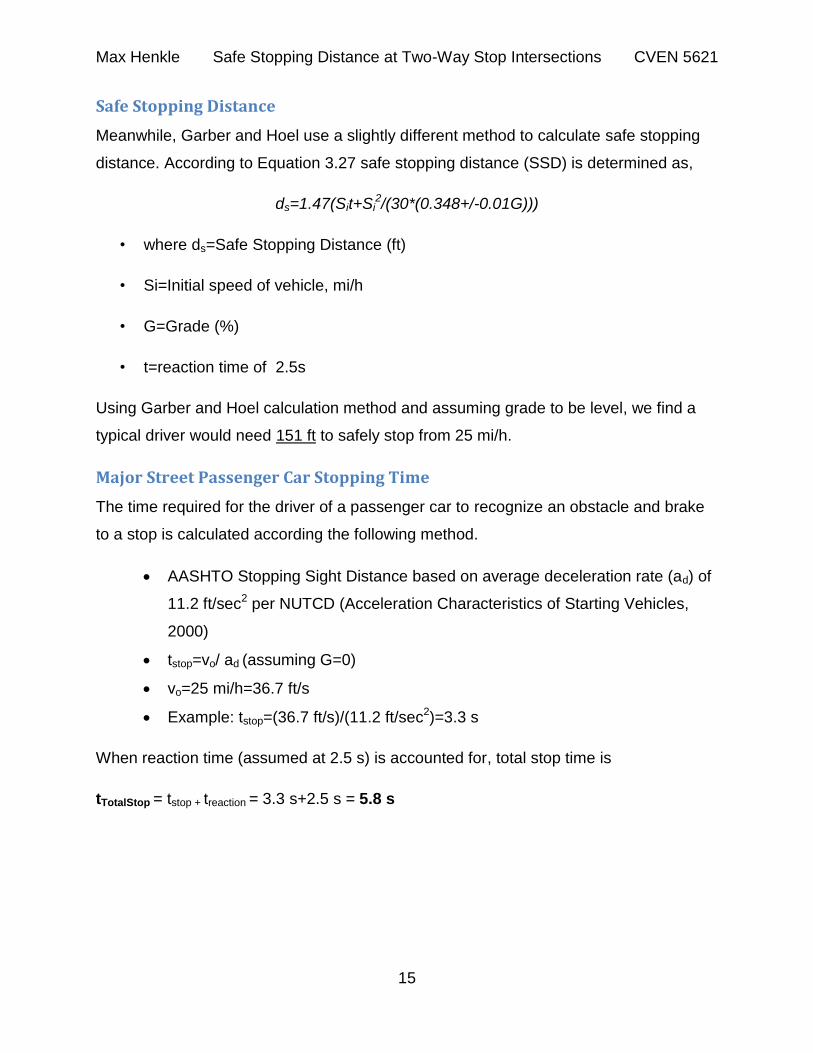
Safe Stopping Distance
Meanwhile, Garber and Hoel use a slightly different method to calculate safe stopping
distance. According to Equation 3.27 safe stopping distance (SSD) is determined as,
ds=1.47(Sit+Si2/(30*(0.348+/-0.01G)))
• where ds=Safe Stopping Distance (ft)
• Si=Initial speed of vehicle, mi/h
• G=Grade (%)
• t=reaction time of 2.5s
Using Garber and Hoel calculation method and assuming grade to be level, we find a
typical driver would need 151 ft to safely stop from 25 mi/h.
Major Street Passenger Car Stopping Time
The time required for the driver of a passenger car to recognize an obstacle and brake
to a stop is calculated according the following method.
AASHTO Stopping Sight Distance based on average deceleration rate (ad) of
11.2 ft/sec2 per NUTCD (Acceleration Characteristics of Starting Vehicles,
2000)
tstop=vo/ ad (assuming G=0)
vo=25 mi/h=36.7 ft/s
Example: tstop=(36.7 ft/s)/(11.2 ft/sec2)=3.3 s
When reaction time (assumed at 2.5 s) is accounted for, total stop time is
tTotalStop = tstop + treaction = 3.3 s+2.5 s = 5.8 s
Max Henkle Safe Stopping Distance at Two-Way Stop Intersections CVEN 5621
16
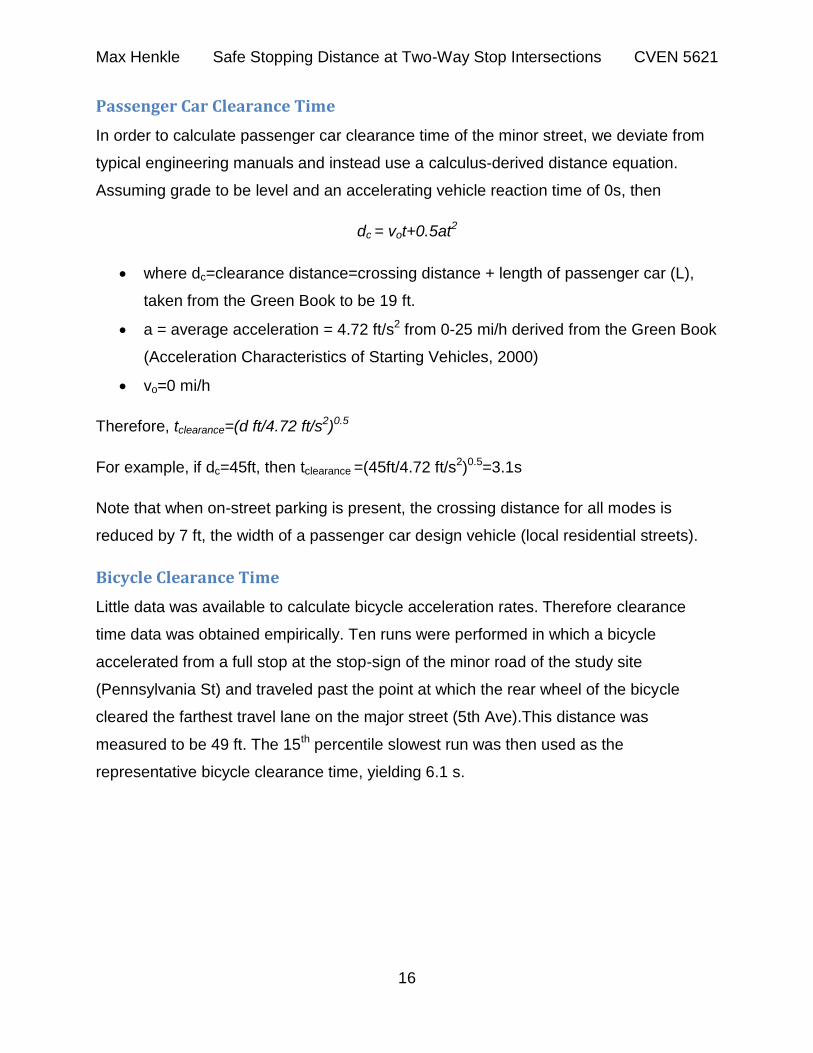
Passenger Car Clearance Time
In order to calculate passenger car clearance time of the minor street, we deviate from
typical engineering manuals and instead use a calculus-derived distance equation.
Assuming grade to be level and an accelerating vehicle reaction time of 0s, then
dc = vot+0.5at2
where dc=clearance distance=crossing distance + length of passenger car (L),
taken from the Green Book to be 19 ft.
a = average acceleration = 4.72 ft/s2 from 0-25 mi/h derived from the Green Book
(Acceleration Characteristics of Starting Vehicles, 2000)
vo=0 mi/h
Therefore, tclearance=(d ft/4.72 ft/s2)0.5
For example, if dc=45ft, then tclearance =(45ft/4.72 ft/s2)0.5=3.1s
Note that when on-street parking is present, the crossing distance for all modes is
reduced by 7 ft, the width of a passenger car design vehicle (local residential streets).
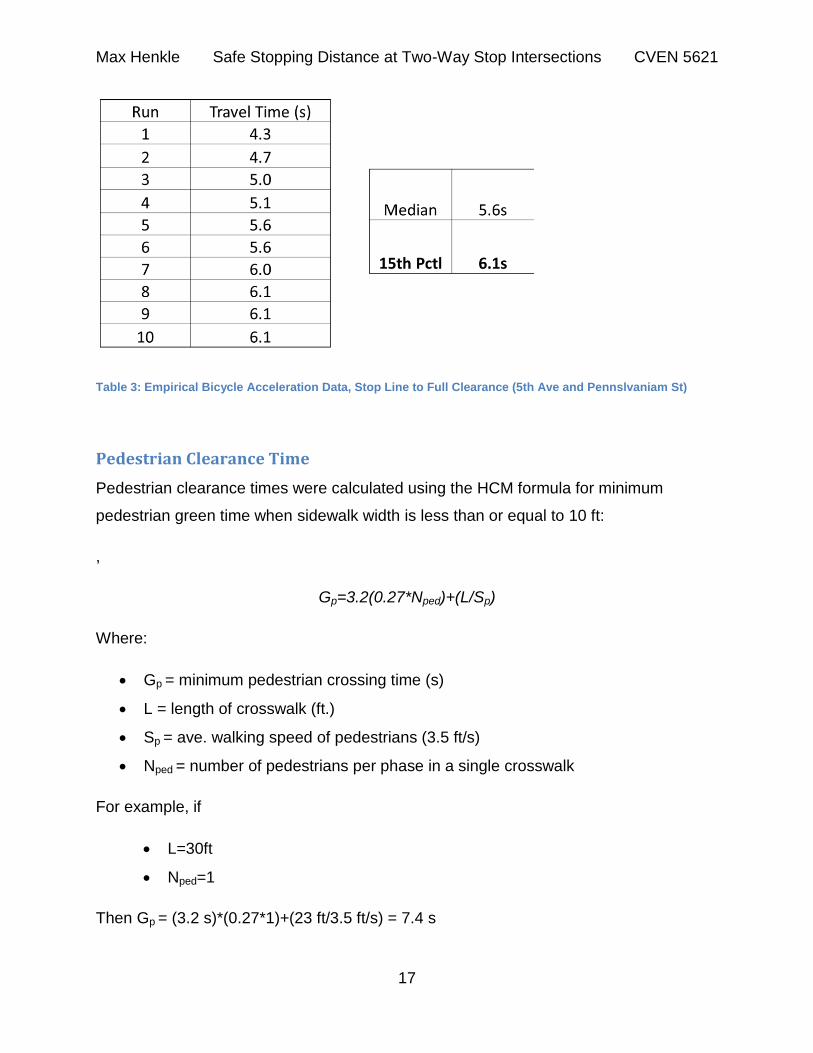
Bicycle Clearance Time
Little data was available to calculate bicycle acceleration rates. Therefore clearance
time data was obtained empirically. Ten runs were performed in which a bicycle
accelerated from a full stop at the stop-sign of the minor road of the study site
(Pennsylvania St) and traveled past the point at which the rear wheel of the bicycle
cleared the farthest travel lane on the major street (5th Ave).This distance was
measured to be 49 ft. The 15th percentile slowest run was then used as the
representative bicycle clearance time, yielding 6.1 s.
Max Henkle Safe Stopping Distance at Two-Way Stop Intersections CVEN 5621
17
Table 3: Empirical Bicycle Acceleration Data, Stop Line to Full Clearance (5th Ave and Pennslvaniam St)
Pedestrian Clearance Time
Pedestrian clearance times were calculated using the HCM formula for minimum
pedestrian green time when sidewalk width is less than or equal to 10 ft:
,
Gp=3.2(0.27*Nped)+(L/Sp)
Where:
Gp = minimum pedestrian crossing time (s)
L = length of crosswalk (ft.)
Sp = ave. walking speed of pedestrians (3.5 ft/s)
Nped = number of pedestrians per phase in a single crosswalk
For example, if
L=30ft
Nped=1
Then Gp = (3.2 s)*(0.27*1)+(23 ft/3.5 ft/s) = 7.4 s
Max Henkle Safe Stopping Distance at Two-Way Stop Intersections CVEN 5621
18
Results and Discussion
Based on the previously outlined methods, clearance and safe stopping times were
obtained for the representative intersection of 5th Ave and Pennsylvania St.
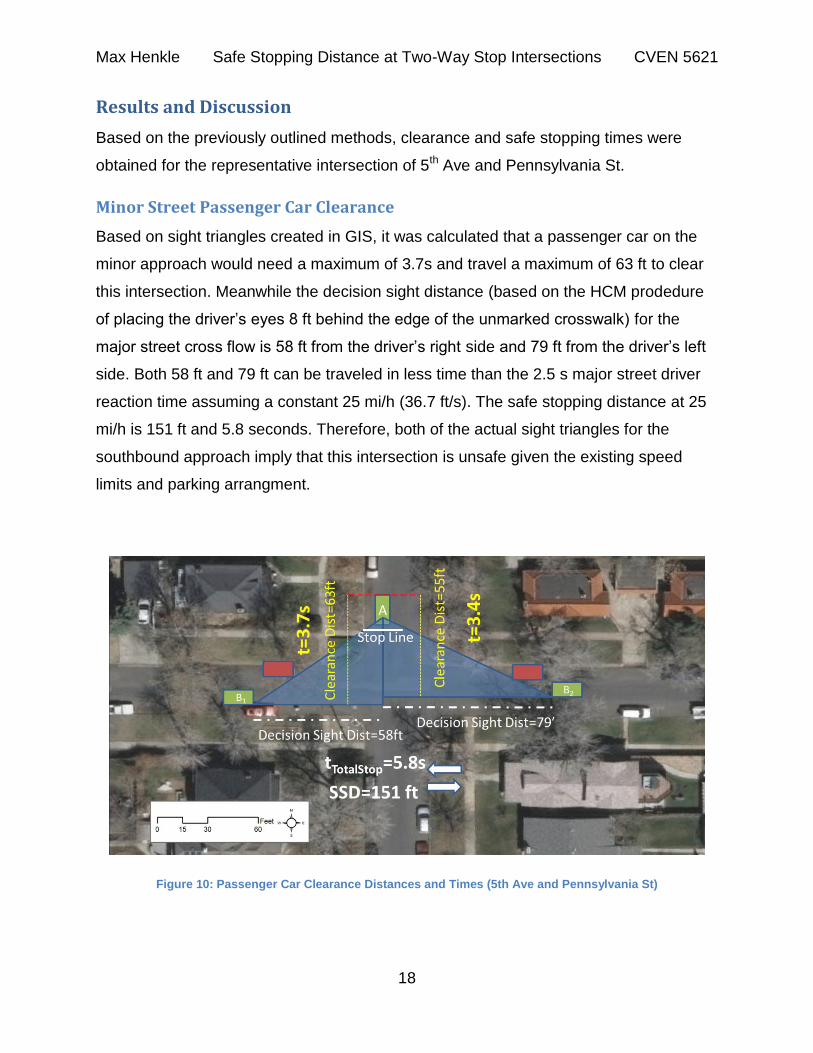
Minor Street Passenger Car Clearance
Based on sight triangles created in GIS, it was calculated that a passenger car on the
minor approach would need a maximum of 3.7s and travel a maximum of 63 ft to clear
this intersection. Meanwhile the decision sight distance (based on the HCM prodedure
of placing the driver’s eyes 8 ft behind the edge of the unmarked crosswalk) for the
major street cross flow is 58 ft from the driver’s right side and 79 ft from the driver’s left
side. Both 58 ft and 79 ft can be traveled in less time than the 2.5 s major street driver
reaction time assuming a constant 25 mi/h (36.7 ft/s). The safe stopping distance at 25
mi/h is 151 ft and 5.8 seconds. Therefore, both of the actual sight triangles for the
southbound approach imply that this intersection is unsafe given the existing speed
limits and parking arrangment.
Figure 10: Passenger Car Clearance Distances and Times (5th Ave and Pennsylvania St)
Max Henkle Safe Stopping Distance at Two-Way Stop Intersections CVEN 5621
19
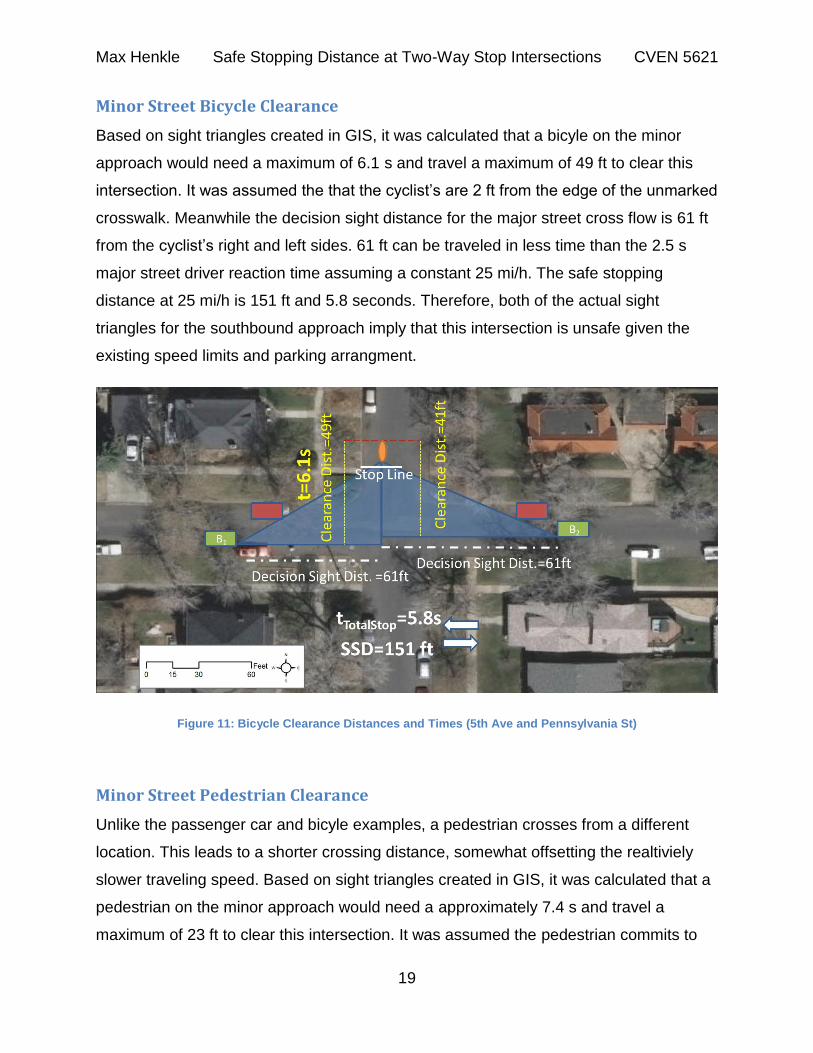
Minor Street Bicycle Clearance
Based on sight triangles created in GIS, it was calculated that a bicyle on the minor
approach would need a maximum of 6.1 s and travel a maximum of 49 ft to clear this
intersection. It was assumed the that the cyclist’s are 2 ft from the edge of the unmarked
crosswalk. Meanwhile the decision sight distance for the major street cross flow is 61 ft
from the cyclist’s right and left sides. 61 ft can be traveled in less time than the 2.5 s
major street driver reaction time assuming a constant 25 mi/h. The safe stopping
distance at 25 mi/h is 151 ft and 5.8 seconds. Therefore, both of the actual sight
triangles for the southbound approach imply that this intersection is unsafe given the
existing speed limits and parking arrangment.
Figure 11: Bicycle Clearance Distances and Times (5th Ave and Pennsylvania St)
Minor Street Pedestrian Clearance
Unlike the passenger car and bicyle examples, a pedestrian crosses from a different
location. This leads to a shorter crossing distance, somewhat offsetting the realtiviely
slower traveling speed. Based on sight triangles created in GIS, it was calculated that a
pedestrian on the minor approach would need a approximately 7.4 s and travel a
maximum of 23 ft to clear this intersection. It was assumed the pedestrian commits to
Max Henkle Safe Stopping Distance at Two-Way Stop Intersections CVEN 5621
20
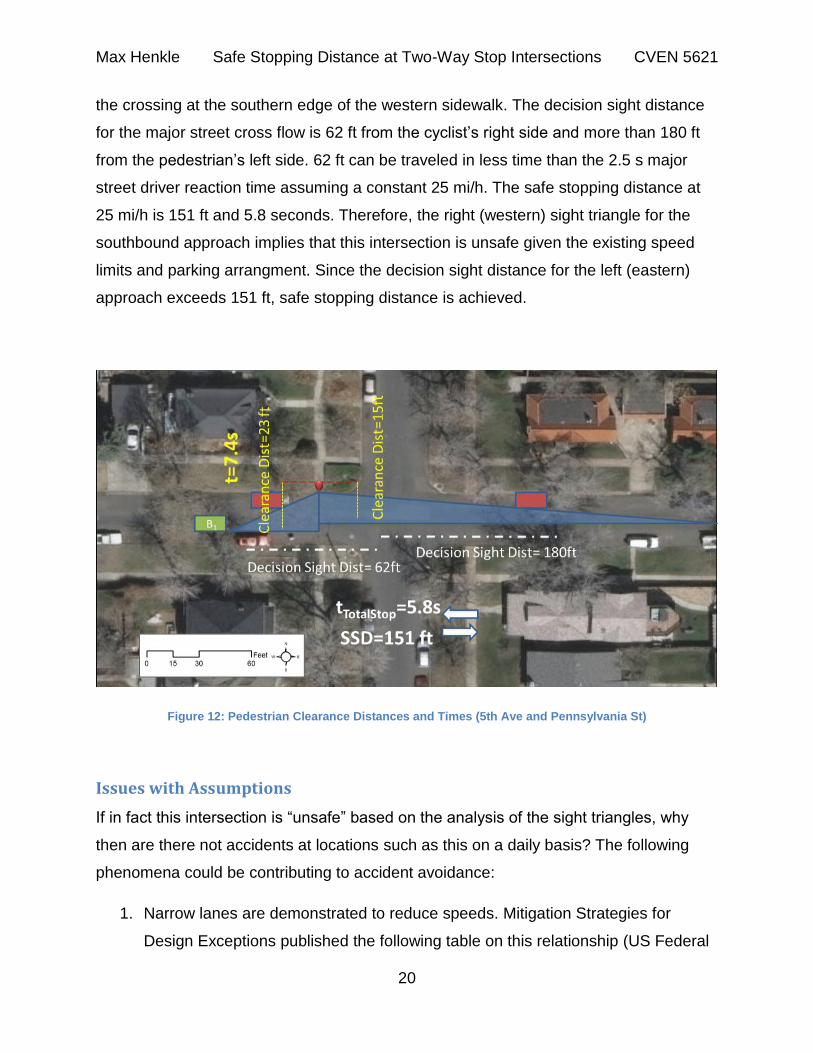
the crossing at the southern edge of the western sidewalk. The decision sight distance
for the major street cross flow is 62 ft from the cyclist’s right side and more than 180 ft
from the pedestrian’s left side. 62 ft can be traveled in less time than the 2.5 s major
street driver reaction time assuming a constant 25 mi/h. The safe stopping distance at
25 mi/h is 151 ft and 5.8 seconds. Therefore, the right (western) sight triangle for the
southbound approach implies that this intersection is unsafe given the existing speed
limits and parking arrangment. Since the decision sight distance for the left (eastern)
approach exceeds 151 ft, safe stopping distance is achieved.
Figure 12: Pedestrian Clearance Distances and Times (5th Ave and Pennsylvania St)
Issues with Assumptions
If in fact this intersection is “unsafe” based on the analysis of the sight triangles, why
then are there not accidents at locations such as this on a daily basis? The following
phenomena could be contributing to accident avoidance:
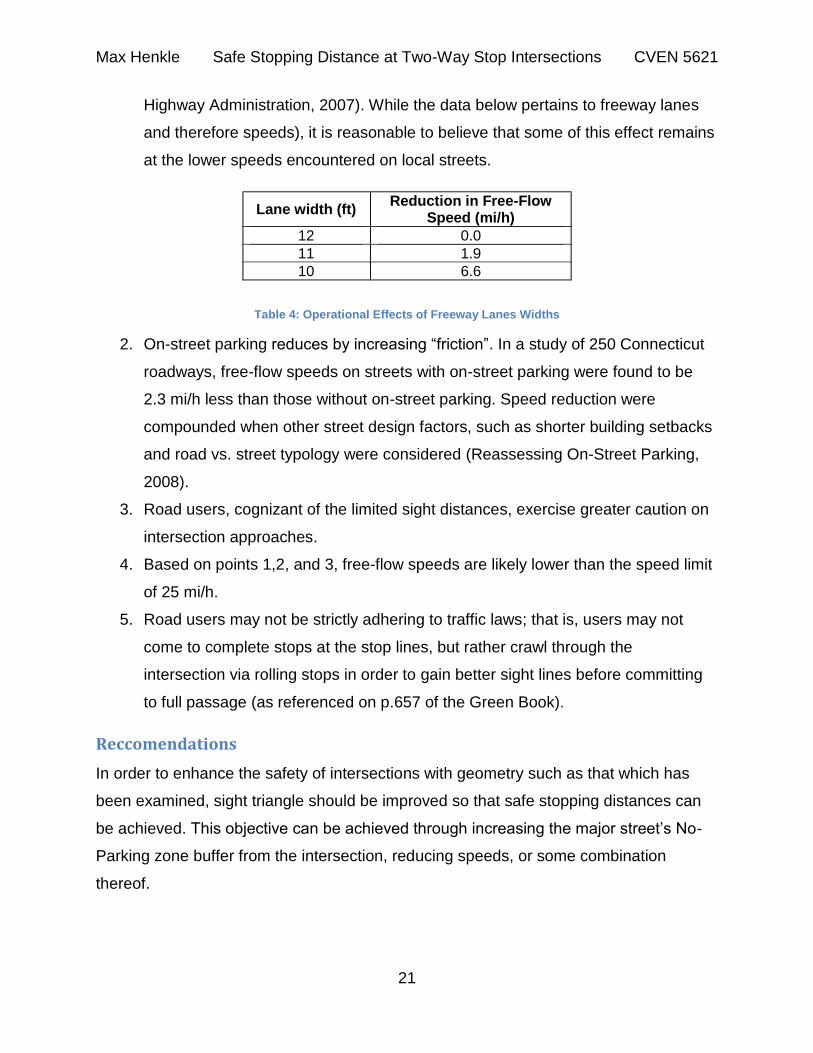
1. Narrow lanes are demonstrated to reduce speeds. Mitigation Strategies for
Design Exceptions published the following table on this relationship (US Federal
Max Henkle Safe Stopping Distance at Two-Way Stop Intersections CVEN 5621
21
Highway Administration, 2007). While the data below pertains to freeway lanes
and therefore speeds), it is reasonable to believe that some of this effect remains
at the lower speeds encountered on local streets.
Lane width (ft) Reduction in Free-Flow
Speed (mi/h)
12 0.0
11 1.9
10 6.6
Table 4: Operational Effects of Freeway Lanes Widths
2. On-street parking reduces by increasing “friction”. In a study of 250 Connecticut
roadways, free-flow speeds on streets with on-street parking were found to be
2.3 mi/h less than those without on-street parking. Speed reduction were
compounded when other street design factors, such as shorter building setbacks
and road vs. street typology were considered (Reassessing On-Street Parking,
2008).
3. Road users, cognizant of the limited sight distances, exercise greater caution on
intersection approaches.
4. Based on points 1,2, and 3, free-flow speeds are likely lower than the speed limit
of 25 mi/h.
5. Road users may not be strictly adhering to traffic laws; that is, users may not
come to complete stops at the stop lines, but rather crawl through the
intersection via rolling stops in order to gain better sight lines before committing
to full passage (as referenced on p.657 of the Green Book).
Reccomendations
In order to enhance the safety of intersections with geometry such as that which has
been examined, sight triangle should be improved so that safe stopping distances can
be achieved. This objective can be achieved through increasing the major street’s No-
Parking zone buffer from the intersection, reducing speeds, or some combination
thereof.
Max Henkle Safe Stopping Distance at Two-Way Stop Intersections CVEN 5621
22
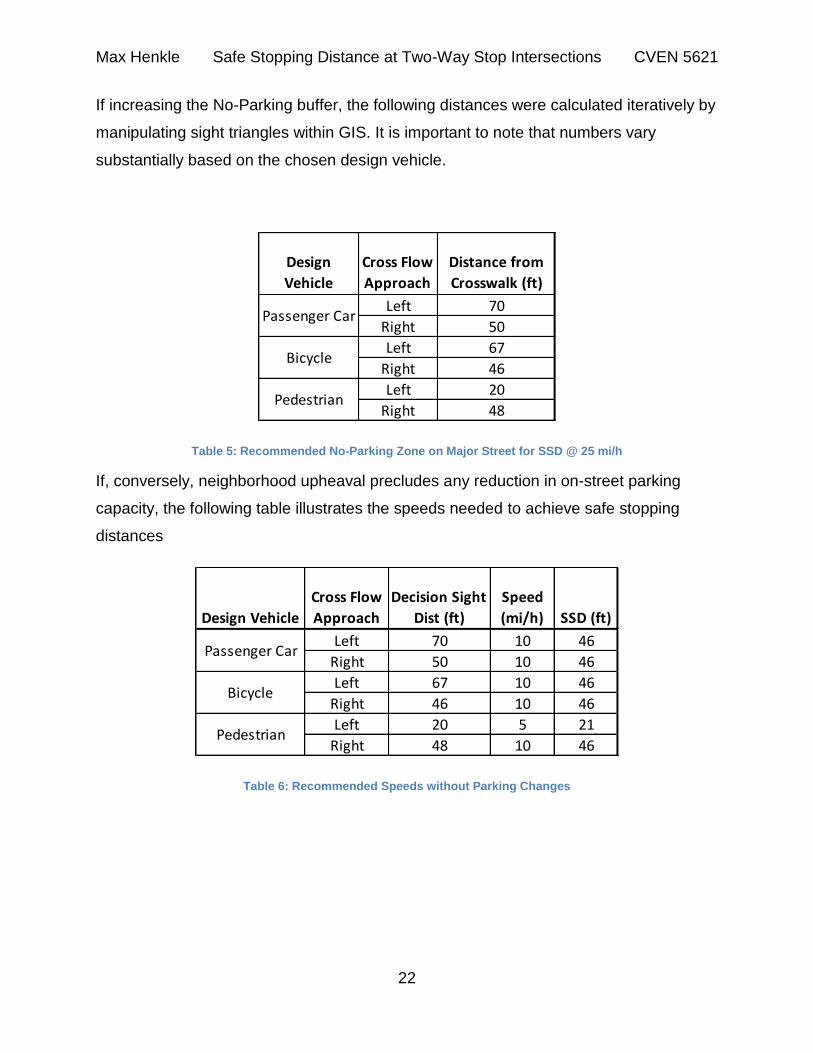
If increasing the No-Parking buffer, the following distances were calculated iteratively by
manipulating sight triangles within GIS. It is important to note that numbers vary
substantially based on the chosen design vehicle.
Table 5: Recommended No-Parking Zone on Major Street for SSD @ 25 mi/h
If, conversely, neighborhood upheaval precludes any reduction in on-street parking
capacity, the following table illustrates the speeds needed to achieve safe stopping
distances
Table 6: Recommended Speeds without Parking Changes
Design
Vehicle
Cross Flow
Approach
Distance from
Crosswalk (ft)
Left 70
Right 50
Left 67
Right 46
Left 20
Right 48
Passenger Car
Bicycle
Pedestrian
Design Vehicle
Cross Flow
Approach
Decision Sight
Dist (ft)
Speed
(mi/h) SSD (ft)
Left 70 10 46
Right 50 10 46
Left 67 10 46
Right 46 10 46
Left 20 5 21
Right 48 10 46
Passenger Car
Bicycle
Pedestrian
Max Henkle Safe Stopping Distance at Two-Way Stop Intersections CVEN 5621
23
Conclusion
While older street networks demonstrate better overall safety characteristics, the
geometric characteristics of narrow, local streets with on-street parking still represent
safety challenges. In a case study of the intersection of 5th Ave and Pennsylvania St,
existing sight triangles were shown to provide inadequate safe stopping distances for
passenger cars, cyclists, and pedestrians. Increases in the distances of No-Parking
zones from intersections and reductions in speed limits to 10 mi/h were recommended
in order to provide adequate stopping distances. Furthermore, it may be advisable to
update the MUTCD in order to reflect the importance of No-Parking zones on major
street intersection approaches in addition to the existing minor approaches. The Green
Book and MUTCD in particular would benefit from a lengthier discussion of the impacts
of on-street parking on signage and street geometry.
Max Henkle Safe Stopping Distance at Two-Way Stop Intersections CVEN 5621
24
Bibliography
AASHTO. 2004. Geometric Design of Highways and Streets ("Green Book"). s.l. :
American Association of State Highway and Transportation Officials, 2004.
Acceleration Characteristics of Starting Vehicles. Long, Gary. 2000. 2000.
Transportation Research Board. pp. Paper No. 00-0980.
City and County of Denver. 1993. Streetscape Design Manual. 1993.
Design policies for sight distance at stop-controlled intersections based on gap
acceptance. Harwood, Douglas W., Mason, John M. and Brydia, Robert E. 1999.
s.l. : Transportation Research Part, 1999, Transportation Research, p. Part A 33 (1999)
199±216.
Garber, Nicholas J. and Hoel, Lester A. 2009. Traffic and Highway Engineering.
Toronto : Cengage Learning, 2009.
Reassessing On-Street Parking. Marshall, Wesley E., Garrick, Norman W. and
Hansen, Gilbert. 2008. 2008, Transportation Research Record: Journal of the
Transportation Research Board, p. No. 2046.
Street Network Types and Road Safety: A Study of 24 California Cities. Marshall,
Wesley E. and Garrick, Norman W. 2010. 2010, Urban Design International, pp. 133–
147.
Transportation Research Board. 2000. Highway Capacity Manual. 2000.
US Federal Highway Administration. 2009. Manual on Uniform Traffic Control
Devices for Street and Highways. 2009.
—. 2007. Mitigation Strategies for Design Exceptions. [Online] July 2007.
safety.fhwa.dot.gov.