Embed Size (px)
Citation preview
Safe Routes to SchoolPutting Traffic Safety First
How Safe Routes to School Initiatives Protect Children Walking
and Bicycling
December 2009
2
AcknowledgmentsThis report was authored by Kristin Gavin, research fellow, with assistance from Margo Pedroso, deputy director, and Deb Hubsmith, director, for the Safe Routes to School National Partnership. A special thanks goes to the representatives of the local communities featured in the report for their time and expertise: Tina Panza, Sonoma County Bicycle Coalition; Anamarie Garces del Marcilla, WalkSafe™; Jeff Miller, Alliance for Biking and Walking; Allison Vogt, Bicycle Coalition of Maine; Earl Newman, City of Springfield Department of Public Works; and Greg Raisman and Gabriel Graff, Portland Bureau of Transportation.
The Safe Routes to School National Partnership is a fast-growing network of more than 400 organizations, agencies, schools and professional groups working to set goals, share best practices, secure funding and inform agencies that implement Safe Routes to School programs. The Safe Routes to School National Partnership’s mission is to serve a diverse national community of organizations that advocates for and promotes the practice of safe bicycling and walking to and from schools throughout the United States. The Partnership is hosted by Bikes Belong Foundation, a 501 (c)(3) non-profit, which is a sister organization to the Bikes Belong Coalition.
For more information ~
www.saferoutespartnership.org
Table of ContentsIntroduction ........................................................................ 3
Traffic Safety Risks and Concerns ...................................... 3
Traffic Safety Solutions....................................................... 4
Safety in Action: Community Profiles ............................... 7
Santa Rosa, California ...................................................8
Miami-Dade County, Florida ...................................... 10
State of Maine ...............................................................12
Springfield, Missouri ....................................................14
Portland, Oregon ..........................................................16
Conclusion ........................................................................ 18
3
IntroductionFrom 1969 to 2001, the percentage of students walking and bicycling to school declined dramatically from 41 percent to 13 percent. At the same time, the percentage of children being driven or driving themselves to school nearly tripled, from 20 percent to 55 percent.1 These changes in the trip to school mode have had a significant impact on traffic congestion and safety, as well as on children’s health and the school environment.
As a result, a large majority of children in the United States no longer get much-needed physical activity during their trips to or from school, adding to the rise in childhood obesity rates. Over the past four decades, childhood obesity rates have increased dramatically for all age groups, and now nearly one in three young people in the United States—a total of 23 million children and teenagers2—are either obese or overweight.3 These young people are at increased risk for a range of costly health issues including heart disease, high blood pressure, and diabetes. In the United States in the year 2008, the estimated health care costs of obesity among adults and children was as high as $147 billion, representing 9.1 percent of annual medical costs.4
Meanwhile, family vehicles congregate around schools during arrival and dismissal times, causing traffic congestion and emitting pollutants and greenhouse gases. Higher volumes of cars near schools also create greater traffic safety concerns for the children who do still walk and bicycle. Fortunately, the $612 million federal Safe Routes to School program created by Congress in 2005 through the federal transportation bill is helping provide schools and communities with the resources to make it safer for more children to walk and bicycle to and from school.
The American Academy of Pediatrics (AAP) recognizes the links between pedestrian safety and children’s health and safety. In August 2009, AAP issued a policy statement on pedestrian safety that recommends a range of community- and school-based strategies to minimize a child’s exposure to traffic, particularly high-speed, high-volume traffic. 5 Two of the ten recommendations in the policy statement directly support Safe Routes to School and increased funding for the program.
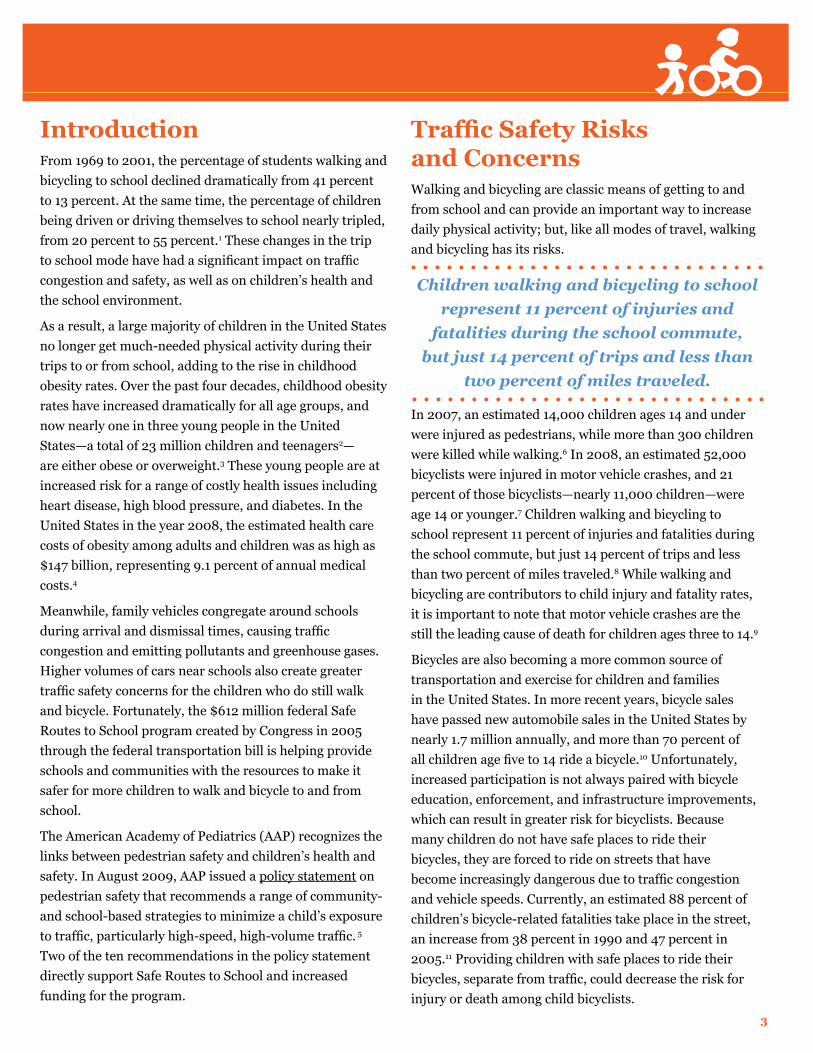
Traffic Safety Risks and Concerns Walking and bicycling are classic means of getting to and from school and can provide an important way to increase daily physical activity; but, like all modes of travel, walking and bicycling has its risks.
In 2007, an estimated 14,000 children ages 14 and under were injured as pedestrians, while more than 300 children were killed while walking.6 In 2008, an estimated 52,000 bicyclists were injured in motor vehicle crashes, and 21 percent of those bicyclists—nearly 11,000 children—were age 14 or younger.7 Children walking and bicycling to school represent 11 percent of injuries and fatalities during the school commute, but just 14 percent of trips and less than two percent of miles traveled.8 While walking and bicycling are contributors to child injury and fatality rates, it is important to note that motor vehicle crashes are the still the leading cause of death for children ages three to 14.9
Bicycles are also becoming a more common source of transportation and exercise for children and families in the United States. In more recent years, bicycle sales have passed new automobile sales in the United States by nearly 1.7 million annually, and more than 70 percent of all children age five to 14 ride a bicycle.10 Unfortunately, increased participation is not always paired with bicycle education, enforcement, and infrastructure improvements, which can result in greater risk for bicyclists. Because many children do not have safe places to ride their bicycles, they are forced to ride on streets that have become increasingly dangerous due to traffic congestion and vehicle speeds. Currently, an estimated 88 percent of children’s bicycle-related fatalities take place in the street, an increase from 38 percent in 1990 and 47 percent in 2005.11 Providing children with safe places to ride their bicycles, separate from traffic, could decrease the risk for injury or death among child bicyclists.
Children walking and bicycling to school represent 11 percent of injuries and
fatalities during the school commute, but just 14 percent of trips and less than
two percent of miles traveled.
4
These bicycle and pedestrian injury and fatality statistics are researchers’ best attempts to capture safety trends, but they are estimates at best. Local and state-level injury and fatality reports are the most common way to collect injury and fatality rates. However, there is no universal system of identification and reporting, which leads to discrepancies in data collected and reported. As a result, many researchers think that bicycle and pedestrian injury rates are underreported by up to 20 percent.12 These data collection issues create challenges nationally in evaluating bicycle and pedestrian safety, and locally in identifying areas in need of safety improvements.
Bicycle and pedestrian injury and fatality rates do have an impact on parents’ perceptions of the safety of bicycling and walking to school. When surveyed, parents report a variety of traffic dangers that discourage them from allowing their children to walk or bicycle to school. Parents express concerns about a range of perceived safety hazards: the amount of traffic on roads (71.3 percent), the speed of traffic (69.8 percent), inadequate or missing sidewalks (48.6 percent), and poor quality or missing crosswalks (39 percent).13
Traffic Safety SolutionsSafe Routes to School is a federal program created by the 2005 federal Safe, Accountable, Flexible, Efficient Transportation Equity Act: A Legacy for Users (SAFETEA-LU). The program focuses on making it safer for more children to walk and bicycle to school.
Federal Safe Routes to School funding, totaling $612 million from fiscal years 2005 to 2009, is administered by each State’s Department of Transportation (DOT) and awarded to local communities and schools. Local Safe Routes to School programs are built on collaborative partnerships among many stakeholders that include educators, parents, students, elected officials, engineers, city planners, business and community leaders, health
officials, and bicycle and pedestrian advocates. The most successful Safe Routes to School programs incorporate the “five Es”—evaluation, education, encouragement, engineering, and enforcement.
The federal legislation stipulates that a total of 70 to 90 percent of each state’s Safe Routes to School funding must be used on infrastructure improvements (or engineering) located within two miles of a school that will improve safety for children walking and bicycling. These funds allow schools and communities to retrofit roads, build or improve sidewalks, implement traffic calming and speed reduction measures, improve pedestrian and bicycle crossings, and build bicycle lanes and pathways.
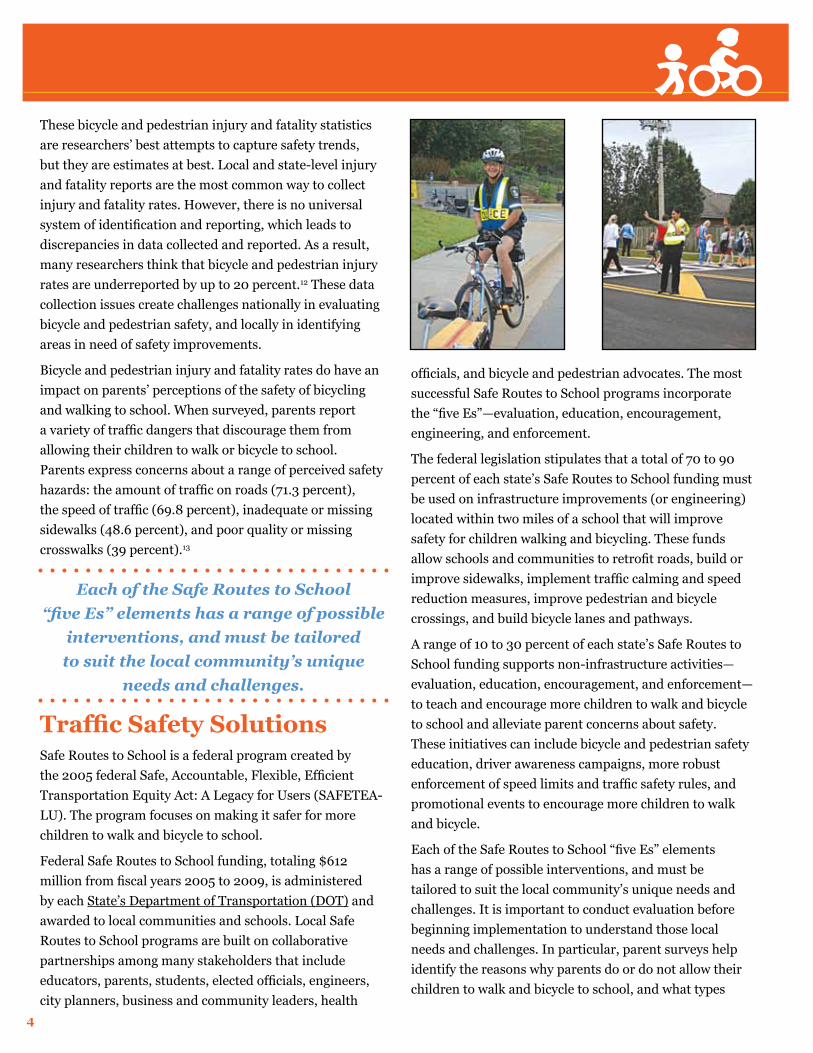
A range of 10 to 30 percent of each state’s Safe Routes to School funding supports non-infrastructure activities—evaluation, education, encouragement, and enforcement—to teach and encourage more children to walk and bicycle to school and alleviate parent concerns about safety. These initiatives can include bicycle and pedestrian safety education, driver awareness campaigns, more robust enforcement of speed limits and traffic safety rules, and promotional events to encourage more children to walk and bicycle.
Each of the Safe Routes to School “five Es” elements has a range of possible interventions, and must be tailored to suit the local community’s unique needs and challenges. It is important to conduct evaluation before beginning implementation to understand those local needs and challenges. In particular, parent surveys help identify the reasons why parents do or do not allow their children to walk and bicycle to school, and what types
Each of the Safe Routes to School “five Es” elements has a range of possible
interventions, and must be tailored to suit the local community’s unique
needs and challenges.
5
of improvements or activities would be most effective in addressing their concerns. Based on the results of initial evaluations and assessments, communities often combine multiple types of Safe Routes to School initiatives—such as installing crosswalks plus teaching children about safe street-crossing behaviors—to have the strongest positive impact on children’s safety and parent perceptions of safety. Conducting evaluation throughout the project can help assess whether the chosen Safe Routes to School interventions are having the intended effect.
Teaching Bicycle and Pedestrian Safety and Skills to Students through Encouragement and Education
Bicycle and pedestrian education is frequently used in Safe Routes to School programs to teach children safe behaviors, attitudes, and knowledge when interacting with traffic. For pedestrians, safety education has been shown to improve children’s knowledge of safety when walking and crossing the street.14 Even though children under 10 years of age have difficulty judging vehicle distance and speed, and are advised to walk and bicycle under supervision, education is a valuable tool for encouraging safe practices and habits for children.15 More comprehensive educational programs incorporate multi-day curriculum sessions on bicycle and pedestrian safety, often taught as part of the student’s physical education classes. These classroom sessions can be followed by walkabouts, which allow children to apply learned pedestrian safety skills in a real world setting and practice navigating crosswalks and intersections.
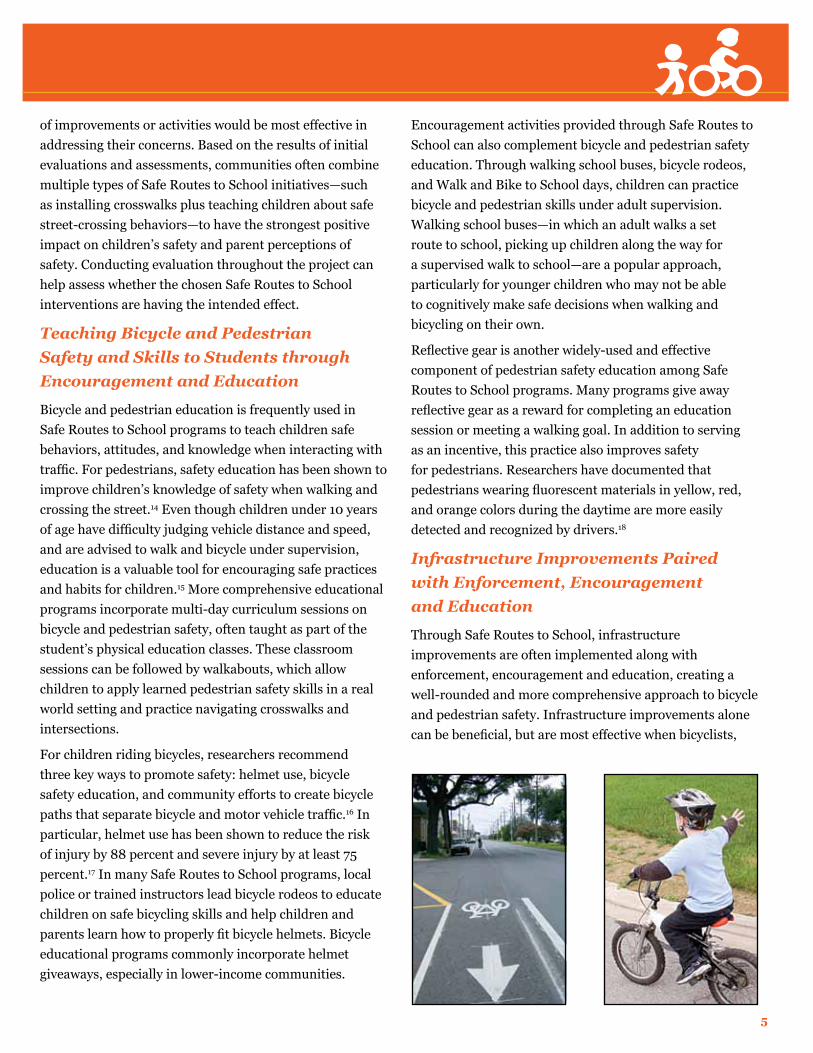
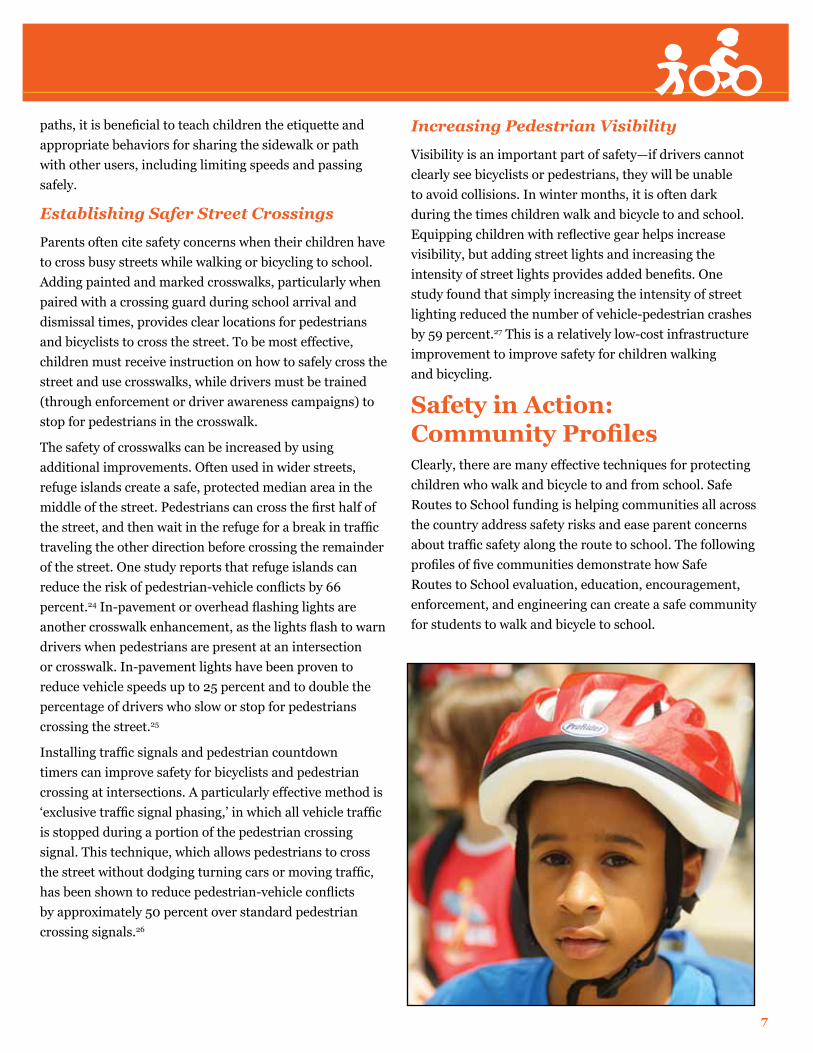
For children riding bicycles, researchers recommend three key ways to promote safety: helmet use, bicycle safety education, and community efforts to create bicycle paths that separate bicycle and motor vehicle traffic.16 In particular, helmet use has been shown to reduce the risk of injury by 88 percent and severe injury by at least 75 percent.17 In many Safe Routes to School programs, local police or trained instructors lead bicycle rodeos to educate children on safe bicycling skills and help children and parents learn how to properly fit bicycle helmets. Bicycle educational programs commonly incorporate helmet giveaways, especially in lower-income communities.
Encouragement activities provided through Safe Routes to School can also complement bicycle and pedestrian safety education. Through walking school buses, bicycle rodeos, and Walk and Bike to School days, children can practice bicycle and pedestrian skills under adult supervision. Walking school buses—in which an adult walks a set route to school, picking up children along the way for a supervised walk to school—are a popular approach, particularly for younger children who may not be able to cognitively make safe decisions when walking and bicycling on their own.
Reflective gear is another widely-used and effective component of pedestrian safety education among Safe Routes to School programs. Many programs give away reflective gear as a reward for completing an education session or meeting a walking goal. In addition to serving as an incentive, this practice also improves safety for pedestrians. Researchers have documented that pedestrians wearing fluorescent materials in yellow, red, and orange colors during the daytime are more easily detected and recognized by drivers.18
Infrastructure Improvements Paired with Enforcement, Encouragement and Education
Through Safe Routes to School, infrastructure improvements are often implemented along with enforcement, encouragement and education, creating a well-rounded and more comprehensive approach to bicycle and pedestrian safety. Infrastructure improvements alone can be beneficial, but are most effective when bicyclists,
6
pedestrians and drivers are educated about the rules of the road, and law enforcement is monitoring compliance and safety. There are numerous types of approaches that can be used, depending on the safety issues present in the community.
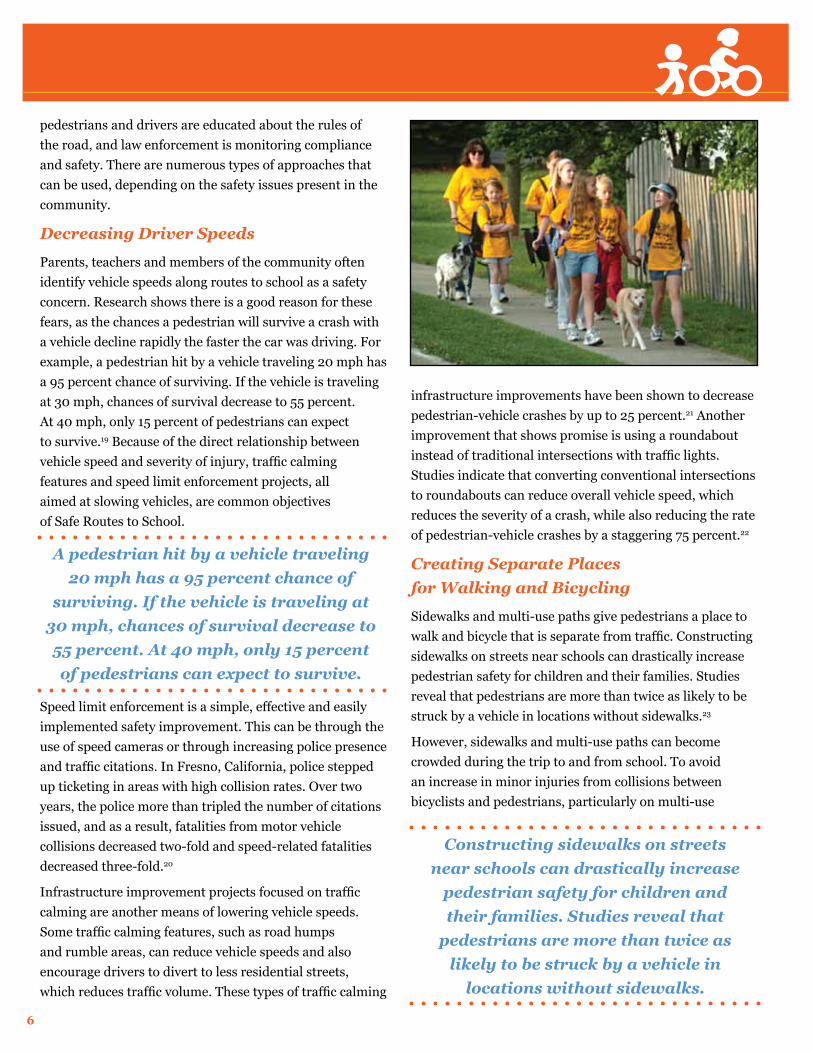
Decreasing Driver Speeds
Parents, teachers and members of the community often identify vehicle speeds along routes to school as a safety concern. Research shows there is a good reason for these fears, as the chances a pedestrian will survive a crash with a vehicle decline rapidly the faster the car was driving. For example, a pedestrian hit by a vehicle traveling 20 mph has a 95 percent chance of surviving. If the vehicle is traveling at 30 mph, chances of survival decrease to 55 percent. At 40 mph, only 15 percent of pedestrians can expect to survive.19 Because of the direct relationship between vehicle speed and severity of injury, traffic calming features and speed limit enforcement projects, all aimed at slowing vehicles, are common objectives of Safe Routes to School.
Speed limit enforcement is a simple, effective and easily implemented safety improvement. This can be through the use of speed cameras or through increasing police presence and traffic citations. In Fresno, California, police stepped up ticketing in areas with high collision rates. Over two years, the police more than tripled the number of citations issued, and as a result, fatalities from motor vehicle collisions decreased two-fold and speed-related fatalities decreased three-fold.20
Infrastructure improvement projects focused on traffic calming are another means of lowering vehicle speeds. Some traffic calming features, such as road humps and rumble areas, can reduce vehicle speeds and also encourage drivers to divert to less residential streets, which reduces traffic volume. These types of traffic calming
infrastructure improvements have been shown to decrease pedestrian-vehicle crashes by up to 25 percent.21 Another improvement that shows promise is using a roundabout instead of traditional intersections with traffic lights. Studies indicate that converting conventional intersections to roundabouts can reduce overall vehicle speed, which reduces the severity of a crash, while also reducing the rate of pedestrian-vehicle crashes by a staggering 75 percent.22
Creating Separate Places for Walking and Bicycling
Sidewalks and multi-use paths give pedestrians a place to walk and bicycle that is separate from traffic. Constructing sidewalks on streets near schools can drastically increase pedestrian safety for children and their families. Studies reveal that pedestrians are more than twice as likely to be struck by a vehicle in locations without sidewalks.23
However, sidewalks and multi-use paths can become crowded during the trip to and from school. To avoid an increase in minor injuries from collisions between bicyclists and pedestrians, particularly on multi-use
Constructing sidewalks on streets near schools can drastically increase
pedestrian safety for children and their families. Studies reveal that
pedestrians are more than twice as likely to be struck by a vehicle in
locations without sidewalks.
A pedestrian hit by a vehicle traveling 20 mph has a 95 percent chance of
surviving. If the vehicle is traveling at 30 mph, chances of survival decrease to 55 percent. At 40 mph, only 15 percent of pedestrians can expect to survive.
7
paths, it is beneficial to teach children the etiquette and appropriate behaviors for sharing the sidewalk or path with other users, including limiting speeds and passing safely.
Establishing Safer Street Crossings
Parents often cite safety concerns when their children have to cross busy streets while walking or bicycling to school. Adding painted and marked crosswalks, particularly when paired with a crossing guard during school arrival and dismissal times, provides clear locations for pedestrians and bicyclists to cross the street. To be most effective, children must receive instruction on how to safely cross the street and use crosswalks, while drivers must be trained (through enforcement or driver awareness campaigns) to stop for pedestrians in the crosswalk.
The safety of crosswalks can be increased by using additional improvements. Often used in wider streets, refuge islands create a safe, protected median area in the middle of the street. Pedestrians can cross the first half of the street, and then wait in the refuge for a break in traffic traveling the other direction before crossing the remainder of the street. One study reports that refuge islands can reduce the risk of pedestrian-vehicle conflicts by 66 percent.24 In-pavement or overhead flashing lights are another crosswalk enhancement, as the lights flash to warn drivers when pedestrians are present at an intersection or crosswalk. In-pavement lights have been proven to reduce vehicle speeds up to 25 percent and to double the percentage of drivers who slow or stop for pedestrians crossing the street.25
Installing traffic signals and pedestrian countdown timers can improve safety for bicyclists and pedestrian crossing at intersections. A particularly effective method is ‘exclusive traffic signal phasing,’ in which all vehicle traffic is stopped during a portion of the pedestrian crossing signal. This technique, which allows pedestrians to cross the street without dodging turning cars or moving traffic, has been shown to reduce pedestrian-vehicle conflicts by approximately 50 percent over standard pedestrian crossing signals.26
Increasing Pedestrian Visibility
Visibility is an important part of safety—if drivers cannot clearly see bicyclists or pedestrians, they will be unable to avoid collisions. In winter months, it is often dark during the times children walk and bicycle to and school. Equipping children with reflective gear helps increase visibility, but adding street lights and increasing the intensity of street lights provides added benefits. One study found that simply increasing the intensity of street lighting reduced the number of vehicle-pedestrian crashes by 59 percent.27 This is a relatively low-cost infrastructure improvement to improve safety for children walking and bicycling.
Safety in Action: Community ProfilesClearly, there are many effective techniques for protecting children who walk and bicycle to and from school. Safe Routes to School funding is helping communities all across the country address safety risks and ease parent concerns about traffic safety along the route to school. The following profiles of five communities demonstrate how Safe Routes to School evaluation, education, encouragement, enforcement, and engineering can create a safe community for students to walk and bicycle to school.
8
Program Description
Kawana Elementary School serves a primarily Latino population of approximately 380 students, 98 percent of whom qualify for free or reduced school lunch, in grades kindergarten through six. The school is located in Santa Rosa, California, about 60 miles north of San Francisco. More than 90 percent of students live within a two-mile radius of school, and nearly 50 percent are within a half-mile of the school. Even though the majority of students live within a reasonable distance for walking or bicycling, parents have indicated that traffic safety and crime are barriers to allowing their children to walk or bicycle to and from school.
To address these issues, Kawana Elementary School turned to Safe Routes to School and the Safe Routes to School National Partnership. The Sonoma County Bicycle Coalition and Kawana Elementary were selected to participate in the Safe Routes to School National Partnership’s Local School Project. As part of this initiative, the Safe Routes to School National Partnership provided funding and technical support to the Sonoma County Bicycle Coalition, allowing them to serve as a Safe Routes to School coordinator at Kawana Elementary.
The Sonoma County Bicycle Coalition, the Sonoma County Department of Health, the Santa Rosa Police Department, the Santa Rosa Public Works Department, parents, members of the PTA, school staff, and the school principal collaborated as a successful team to improve safety around the school. Using a well-rounded Safe Routes to School approach including education, enforcement and encouragement, plus $611,700 in federal Safe Routes to School funds that will be used to make crosswalk and sidewalk improvements in 2010, Kawana Elementary School is making noticeable progress towards improving safety and encouraging more children to walk and bicycle to school.
A Tailored Approach to Safety
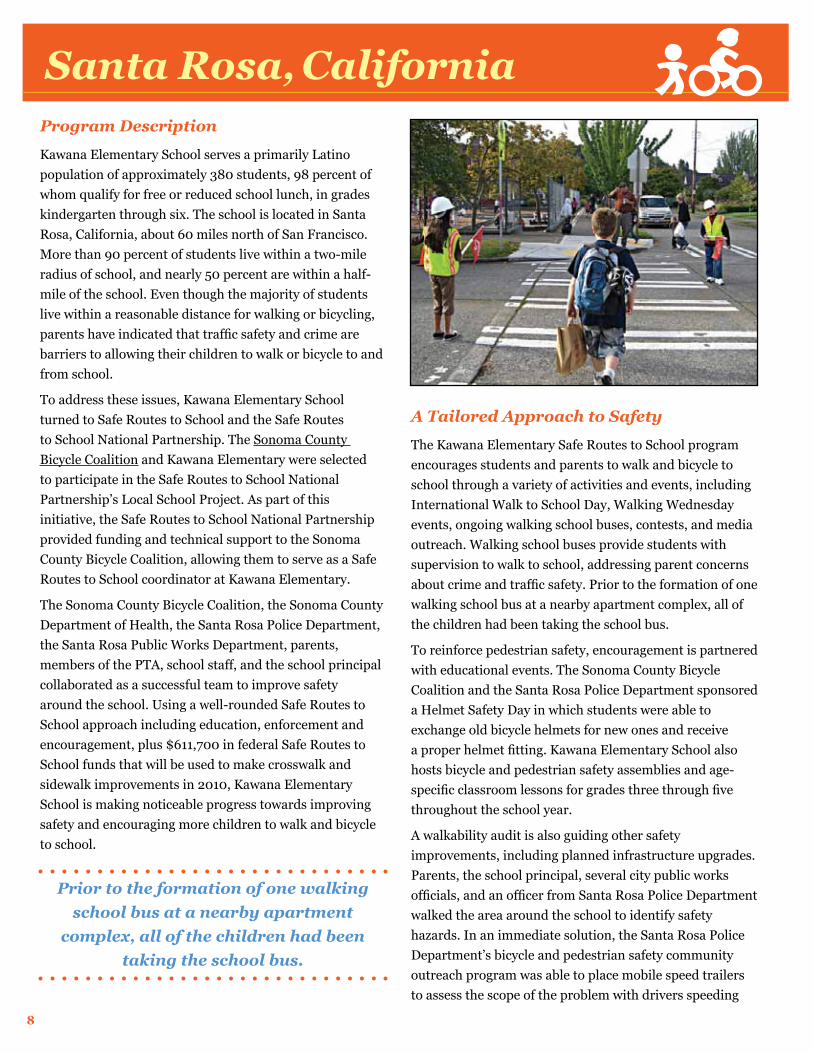
The Kawana Elementary Safe Routes to School program encourages students and parents to walk and bicycle to school through a variety of activities and events, including International Walk to School Day, Walking Wednesday events, ongoing walking school buses, contests, and media outreach. Walking school buses provide students with supervision to walk to school, addressing parent concerns about crime and traffic safety. Prior to the formation of one walking school bus at a nearby apartment complex, all of the children had been taking the school bus.
To reinforce pedestrian safety, encouragement is partnered with educational events. The Sonoma County Bicycle Coalition and the Santa Rosa Police Department sponsored a Helmet Safety Day in which students were able to exchange old bicycle helmets for new ones and receive a proper helmet fitting. Kawana Elementary School also hosts bicycle and pedestrian safety assemblies and age-specific classroom lessons for grades three through five throughout the school year.
A walkability audit is also guiding other safety improvements, including planned infrastructure upgrades. Parents, the school principal, several city public works officials, and an officer from Santa Rosa Police Department walked the area around the school to identify safety hazards. In an immediate solution, the Santa Rosa Police Department’s bicycle and pedestrian safety community outreach program was able to place mobile speed trailers to assess the scope of the problem with drivers speeding
Santa Rosa, California
Prior to the formation of one walking school bus at a nearby apartment
complex, all of the children had been taking the school bus.
9
near the school. As a result of the audit, the Safe Routes to School team developed a list of infrastructure priorities that the Santa Rosa Public Works Department used to successfully apply for a Safe Routes to School grant. In addition, overgrown grass and weeds along a pathway near the school were trimmed.
Demonstrating Results
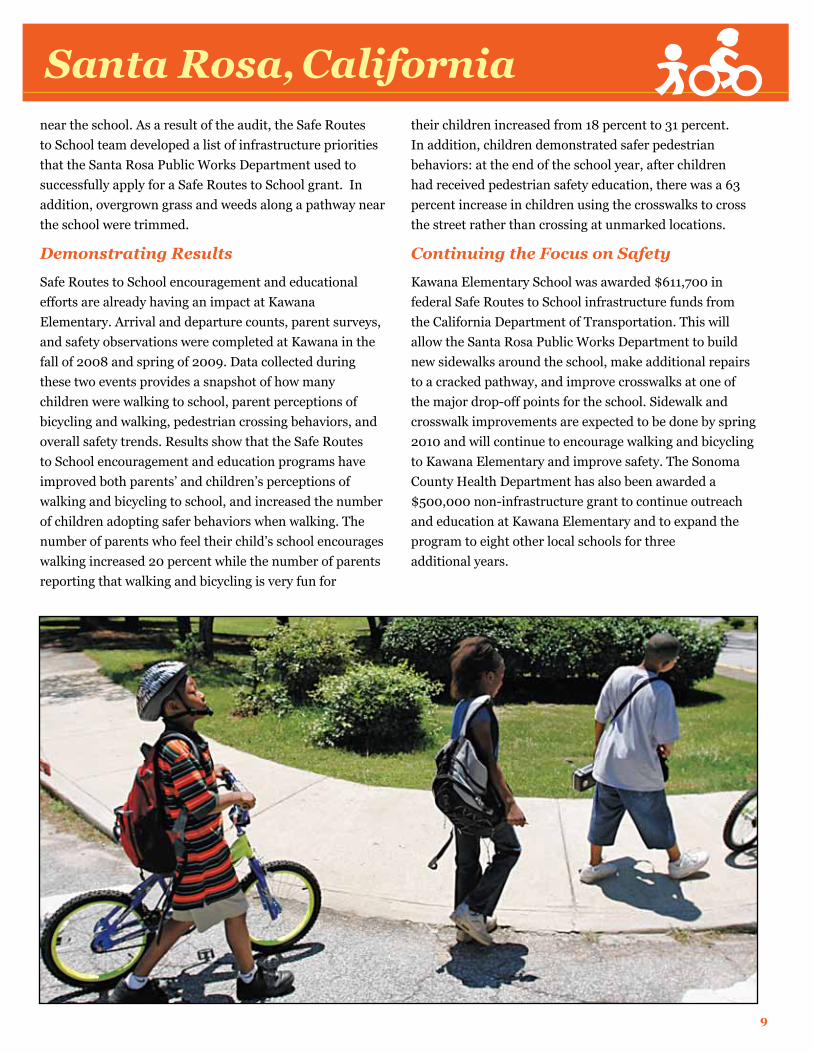
Safe Routes to School encouragement and educational efforts are already having an impact at Kawana Elementary. Arrival and departure counts, parent surveys, and safety observations were completed at Kawana in the fall of 2008 and spring of 2009. Data collected during these two events provides a snapshot of how many children were walking to school, parent perceptions of bicycling and walking, pedestrian crossing behaviors, and overall safety trends. Results show that the Safe Routes to School encouragement and education programs have improved both parents’ and children’s perceptions of walking and bicycling to school, and increased the number of children adopting safer behaviors when walking. The number of parents who feel their child’s school encourages walking increased 20 percent while the number of parents reporting that walking and bicycling is very fun for
their children increased from 18 percent to 31 percent. In addition, children demonstrated safer pedestrian behaviors: at the end of the school year, after children had received pedestrian safety education, there was a 63 percent increase in children using the crosswalks to cross the street rather than crossing at unmarked locations.
Continuing the Focus on Safety
Kawana Elementary School was awarded $611,700 in federal Safe Routes to School infrastructure funds from the California Department of Transportation. This will allow the Santa Rosa Public Works Department to build new sidewalks around the school, make additional repairs to a cracked pathway, and improve crosswalks at one of the major drop-off points for the school. Sidewalk and crosswalk improvements are expected to be done by spring 2010 and will continue to encourage walking and bicycling to Kawana Elementary and improve safety. The Sonoma County Health Department has also been awarded a $500,000 non-infrastructure grant to continue outreach and education at Kawana Elementary and to expand the program to eight other local schools for three additional years.
Santa Rosa, California
10
Program Description
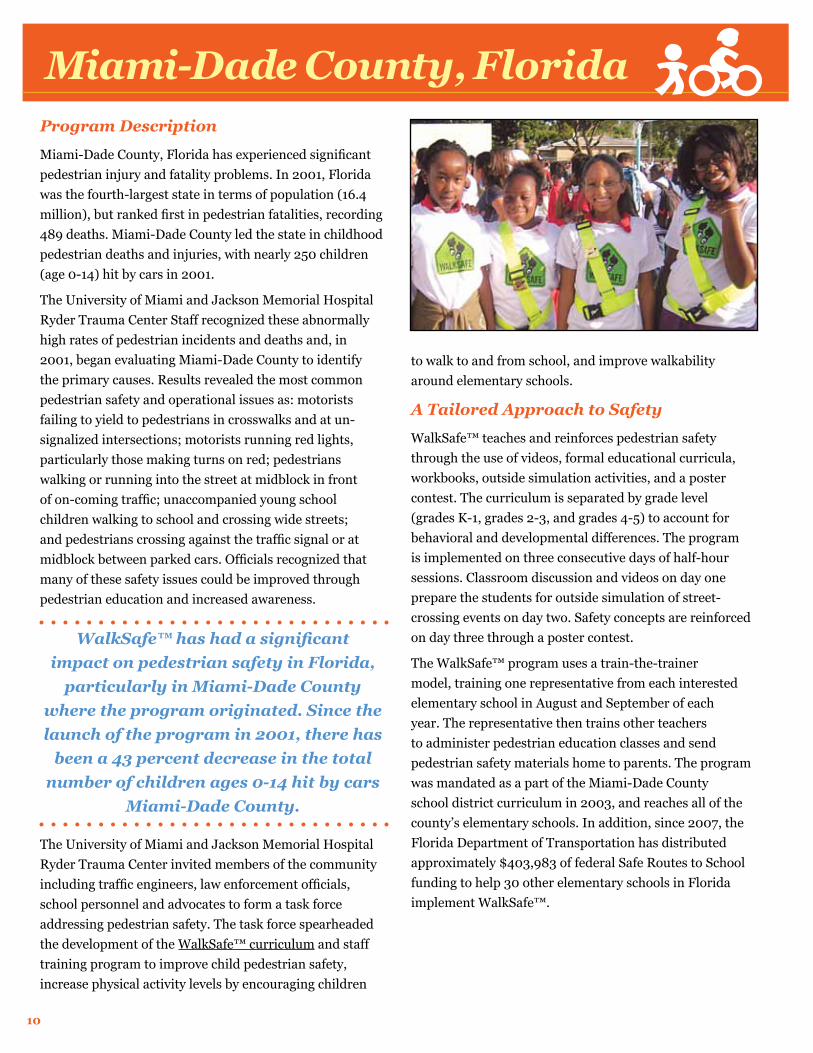
Miami-Dade County, Florida has experienced significant pedestrian injury and fatality problems. In 2001, Florida was the fourth-largest state in terms of population (16.4 million), but ranked first in pedestrian fatalities, recording 489 deaths. Miami-Dade County led the state in childhood pedestrian deaths and injuries, with nearly 250 children (age 0-14) hit by cars in 2001.
The University of Miami and Jackson Memorial Hospital Ryder Trauma Center Staff recognized these abnormally high rates of pedestrian incidents and deaths and, in 2001, began evaluating Miami-Dade County to identify the primary causes. Results revealed the most common pedestrian safety and operational issues as: motorists failing to yield to pedestrians in crosswalks and at un-signalized intersections; motorists running red lights, particularly those making turns on red; pedestrians walking or running into the street at midblock in front of on-coming traffic; unaccompanied young school children walking to school and crossing wide streets; and pedestrians crossing against the traffic signal or at midblock between parked cars. Officials recognized that many of these safety issues could be improved through pedestrian education and increased awareness.
The University of Miami and Jackson Memorial Hospital Ryder Trauma Center invited members of the community including traffic engineers, law enforcement officials, school personnel and advocates to form a task force addressing pedestrian safety. The task force spearheaded the development of the WalkSafe™ curriculum and staff training program to improve child pedestrian safety, increase physical activity levels by encouraging children
to walk to and from school, and improve walkability around elementary schools.
A Tailored Approach to Safety
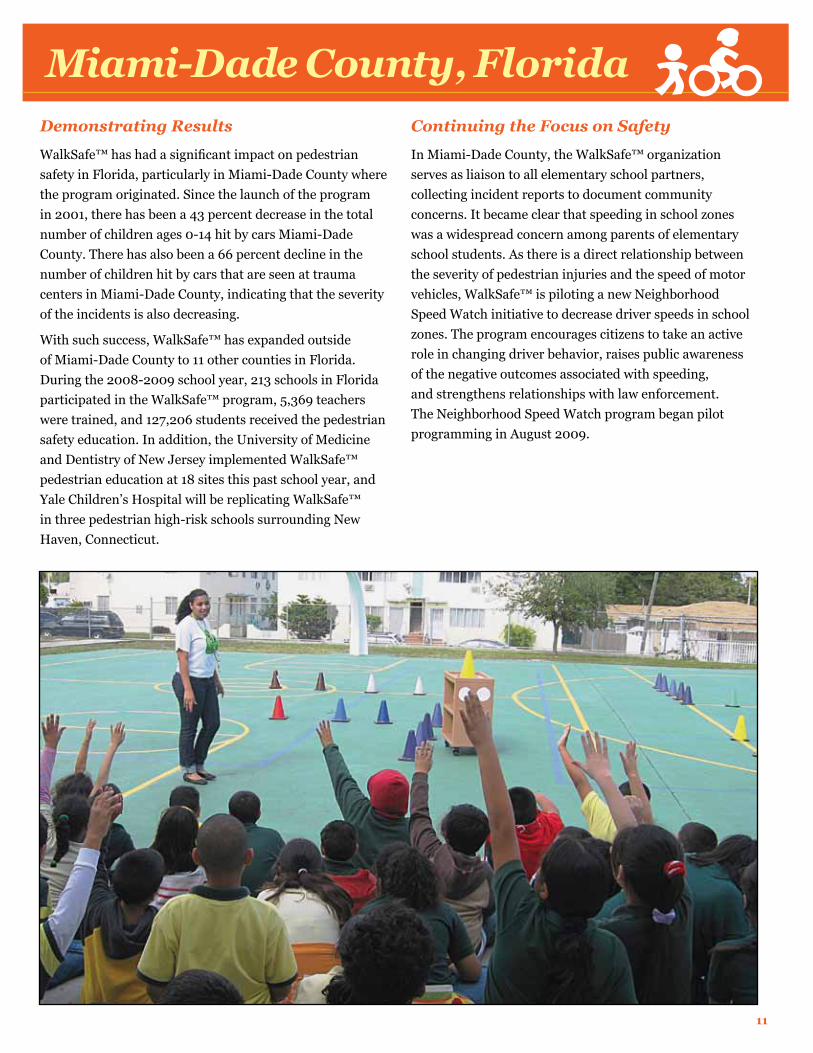
WalkSafe™ teaches and reinforces pedestrian safety through the use of videos, formal educational curricula, workbooks, outside simulation activities, and a poster contest. The curriculum is separated by grade level (grades K-1, grades 2-3, and grades 4-5) to account for behavioral and developmental differences. The program is implemented on three consecutive days of half-hour sessions. Classroom discussion and videos on day one prepare the students for outside simulation of street-crossing events on day two. Safety concepts are reinforced on day three through a poster contest.
The WalkSafe™ program uses a train-the-trainer model, training one representative from each interested elementary school in August and September of each year. The representative then trains other teachers to administer pedestrian education classes and send pedestrian safety materials home to parents. The program was mandated as a part of the Miami-Dade County school district curriculum in 2003, and reaches all of the county’s elementary schools. In addition, since 2007, the Florida Department of Transportation has distributed approximately $403,983 of federal Safe Routes to School funding to help 30 other elementary schools in Florida implement WalkSafe™.
Miami-Dade County, Florida
WalkSafe™ has had a significant impact on pedestrian safety in Florida,
particularly in Miami-Dade County where the program originated. Since the launch of the program in 2001, there has
been a 43 percent decrease in the total number of children ages 0-14 hit by cars
Miami-Dade County.
11
Demonstrating Results
WalkSafe™ has had a significant impact on pedestrian safety in Florida, particularly in Miami-Dade County where the program originated. Since the launch of the program in 2001, there has been a 43 percent decrease in the total number of children ages 0-14 hit by cars Miami-Dade County. There has also been a 66 percent decline in the number of children hit by cars that are seen at trauma centers in Miami-Dade County, indicating that the severity of the incidents is also decreasing.
With such success, WalkSafe™ has expanded outside of Miami-Dade County to 11 other counties in Florida. During the 2008-2009 school year, 213 schools in Florida participated in the WalkSafe™ program, 5,369 teachers were trained, and 127,206 students received the pedestrian safety education. In addition, the University of Medicine and Dentistry of New Jersey implemented WalkSafe™ pedestrian education at 18 sites this past school year, and Yale Children’s Hospital will be replicating WalkSafe™ in three pedestrian high-risk schools surrounding New Haven, Connecticut.
Continuing the Focus on Safety
In Miami-Dade County, the WalkSafe™ organization serves as liaison to all elementary school partners, collecting incident reports to document community concerns. It became clear that speeding in school zones was a widespread concern among parents of elementary school students. As there is a direct relationship between the severity of pedestrian injuries and the speed of motor vehicles, WalkSafe™ is piloting a new Neighborhood Speed Watch initiative to decrease driver speeds in school zones. The program encourages citizens to take an active role in changing driver behavior, raises public awareness of the negative outcomes associated with speeding, and strengthens relationships with law enforcement. The Neighborhood Speed Watch program began pilot programming in August 2009.
Miami-Dade County, Florida
12
Program Description
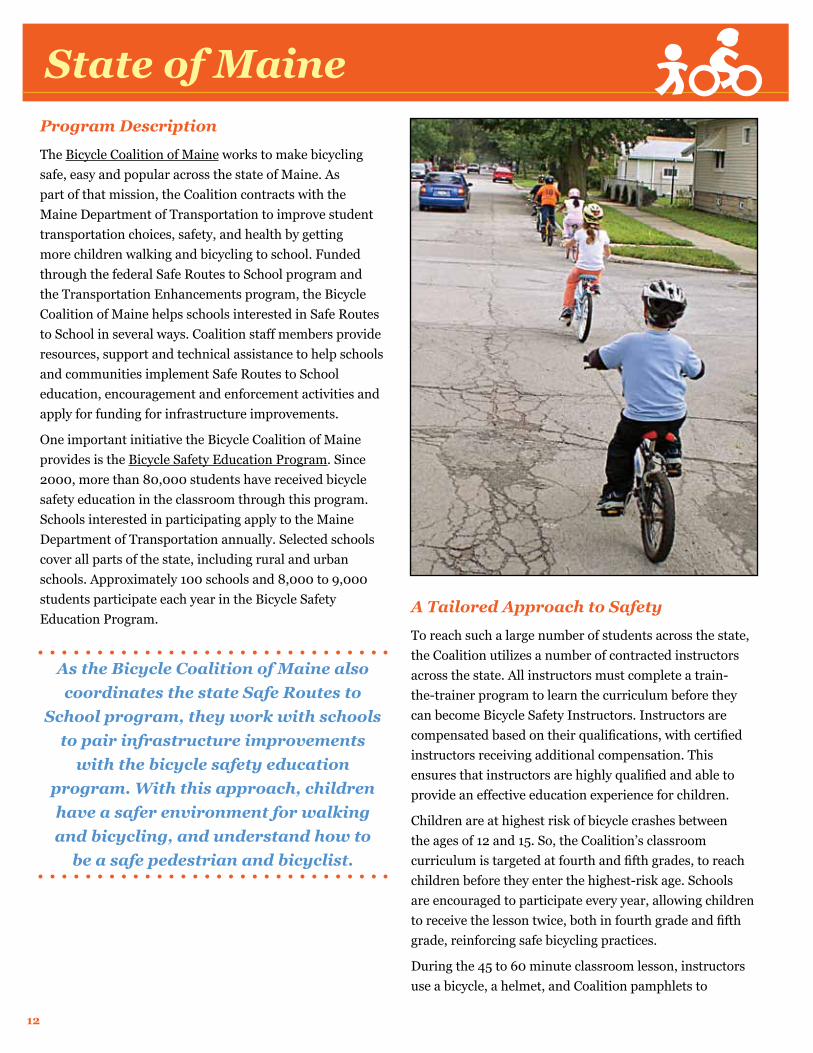
The Bicycle Coalition of Maine works to make bicycling safe, easy and popular across the state of Maine. As part of that mission, the Coalition contracts with the Maine Department of Transportation to improve student transportation choices, safety, and health by getting more children walking and bicycling to school. Funded through the federal Safe Routes to School program and the Transportation Enhancements program, the Bicycle Coalition of Maine helps schools interested in Safe Routes to School in several ways. Coalition staff members provide resources, support and technical assistance to help schools and communities implement Safe Routes to School education, encouragement and enforcement activities and apply for funding for infrastructure improvements.
One important initiative the Bicycle Coalition of Maine provides is the Bicycle Safety Education Program. Since 2000, more than 80,000 students have received bicycle safety education in the classroom through this program. Schools interested in participating apply to the Maine Department of Transportation annually. Selected schools cover all parts of the state, including rural and urban schools. Approximately 100 schools and 8,000 to 9,000 students participate each year in the Bicycle Safety Education Program.
A Tailored Approach to Safety
To reach such a large number of students across the state, the Coalition utilizes a number of contracted instructors across the state. All instructors must complete a train-the-trainer program to learn the curriculum before they can become Bicycle Safety Instructors. Instructors are compensated based on their qualifications, with certified instructors receiving additional compensation. This ensures that instructors are highly qualified and able to provide an effective education experience for children.
Children are at highest risk of bicycle crashes between the ages of 12 and 15. So, the Coalition’s classroom curriculum is targeted at fourth and fifth grades, to reach children before they enter the highest-risk age. Schools are encouraged to participate every year, allowing children to receive the lesson twice, both in fourth grade and fifth grade, reinforcing safe bicycling practices.
During the 45 to 60 minute classroom lesson, instructors use a bicycle, a helmet, and Coalition pamphlets to
State of Maine
As the Bicycle Coalition of Maine also coordinates the state Safe Routes to
School program, they work with schools to pair infrastructure improvements
with the bicycle safety education program. With this approach, children have a safer environment for walking and bicycling, and understand how to
be a safe pedestrian and bicyclist.
13
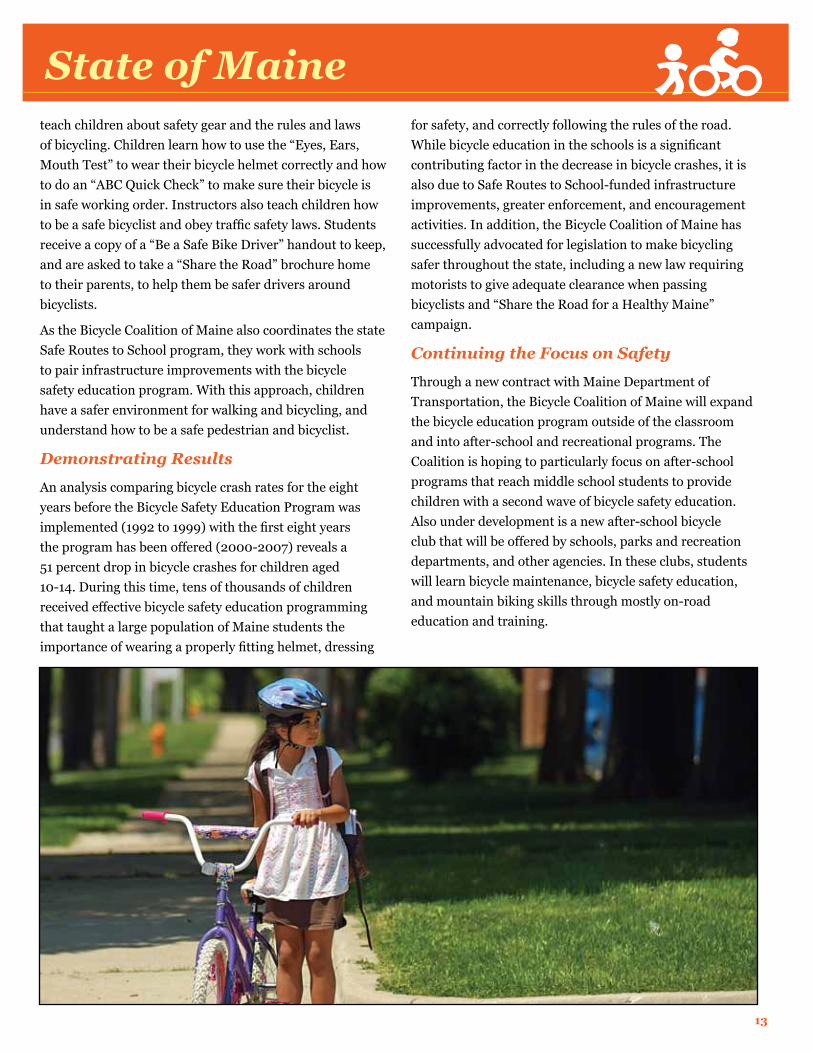
teach children about safety gear and the rules and laws of bicycling. Children learn how to use the “Eyes, Ears, Mouth Test” to wear their bicycle helmet correctly and how to do an “ABC Quick Check” to make sure their bicycle is in safe working order. Instructors also teach children how to be a safe bicyclist and obey traffic safety laws. Students receive a copy of a “Be a Safe Bike Driver” handout to keep, and are asked to take a “Share the Road” brochure home to their parents, to help them be safer drivers around bicyclists.
As the Bicycle Coalition of Maine also coordinates the state Safe Routes to School program, they work with schools to pair infrastructure improvements with the bicycle safety education program. With this approach, children have a safer environment for walking and bicycling, and understand how to be a safe pedestrian and bicyclist.
Demonstrating Results
An analysis comparing bicycle crash rates for the eight years before the Bicycle Safety Education Program was implemented (1992 to 1999) with the first eight years the program has been offered (2000-2007) reveals a 51 percent drop in bicycle crashes for children aged 10-14. During this time, tens of thousands of children received effective bicycle safety education programming that taught a large population of Maine students the importance of wearing a properly fitting helmet, dressing
for safety, and correctly following the rules of the road. While bicycle education in the schools is a significant contributing factor in the decrease in bicycle crashes, it is also due to Safe Routes to School-funded infrastructure improvements, greater enforcement, and encouragement activities. In addition, the Bicycle Coalition of Maine has successfully advocated for legislation to make bicycling safer throughout the state, including a new law requiring motorists to give adequate clearance when passing bicyclists and “Share the Road for a Healthy Maine” campaign.
Continuing the Focus on Safety
Through a new contract with Maine Department of Transportation, the Bicycle Coalition of Maine will expand the bicycle education program outside of the classroom and into after-school and recreational programs. The Coalition is hoping to particularly focus on after-school programs that reach middle school students to provide children with a second wave of bicycle safety education. Also under development is a new after-school bicycle club that will be offered by schools, parks and recreation departments, and other agencies. In these clubs, students will learn bicycle maintenance, bicycle safety education, and mountain biking skills through mostly on-road education and training.
State of Maine
14
Program Description
Springfield, located in one of the state’s fastest growing counties, is Missouri’s third-largest city with a population of approximately 154,800. As Springfield experienced rapid population growth, the city also saw an increase in annual traffic crashes, reaching a record high in 1999 with 8,390 reported traffic crashes. Since then, the Missouri Department of Transportation and the City of Springfield Traffic Engineering Division have been working to decrease traffic crashes and increase safety for pedestrians, bicyclists, and drivers. Efforts have been successful with an 11 percent decrease in the number of reported traffic crashes from 1999 to 2008, but there is still work to be done.
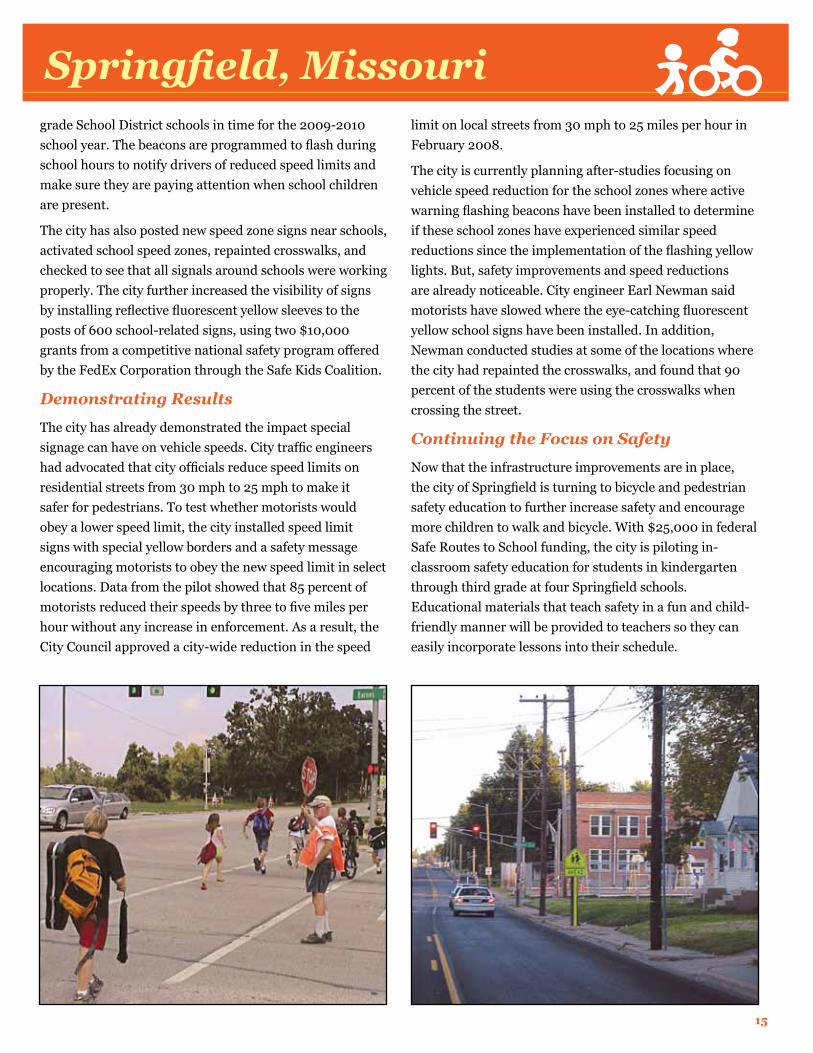
As vehicular crash trends began to decline, the city of Springfield turned its focus to improving routes for students to walk and bicycle to school. Using funds generated by a quarter-cent capital improvement sales tax, the city of Springfield has constructed more than 50 miles of school sidewalks in the past 20 years. Springfield’s goal is to provide sidewalks in a half-mile radius around all schools in the district. The district serves 36 elementary schools with approximately 11,062 students; surveys indicate that nearly 45 percent of students at some schools typically walk, bicycle or wheel to school.
In Springfield, city and school officials recognized a common safety threat: drivers disregarding school zones, which are areas in the immediate vicinity of the school that generally have special signage and reduced speed limits during school hours. By disobeying school zones, these drivers were placing children and crossing guards at risk of being struck by a fast moving vehicle. Since 2004, one student has been killed and seven others injured in crashes involving motor vehicles in school zones. The
Traffic Engineering Division has monitored many school zones and found troubling results: less than 25 percent of motorists obey the 20 mph speed limit, 60 percent of drivers are traveling up to 10 mph over the posted limit, and 15 percent of drivers are exceeding the school zone speed limit by more than 10 mph. At these faster speeds, drivers have less reaction time to avoid a pedestrian in a crosswalk, and are more likely to cause serious injuries, or even death, when striking a pedestrian.
A Tailored Approach to Safety
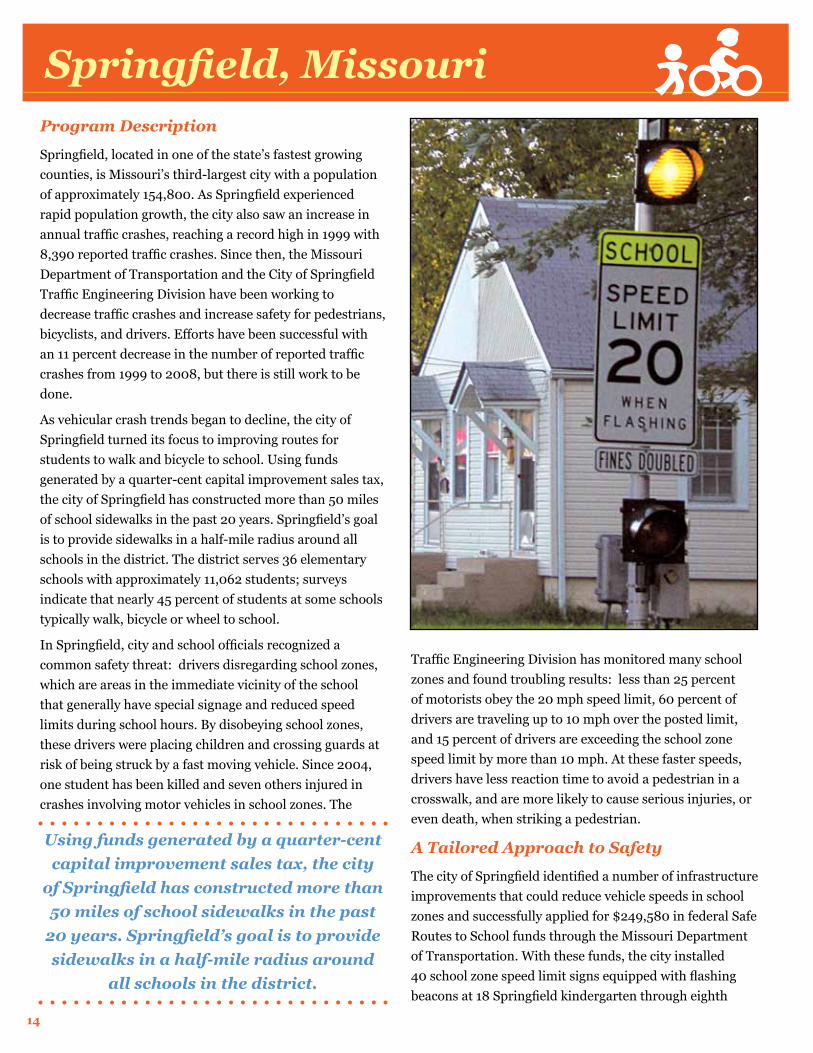
The city of Springfield identified a number of infrastructure improvements that could reduce vehicle speeds in school zones and successfully applied for $249,580 in federal Safe Routes to School funds through the Missouri Department of Transportation. With these funds, the city installed 40 school zone speed limit signs equipped with flashing beacons at 18 Springfield kindergarten through eighth
Springfield, Missouri
Using funds generated by a quarter-cent capital improvement sales tax, the city
of Springfield has constructed more than 50 miles of school sidewalks in the past
20 years. Springfield’s goal is to provide sidewalks in a half-mile radius around
all schools in the district.
15
grade School District schools in time for the 2009-2010 school year. The beacons are programmed to flash during school hours to notify drivers of reduced speed limits and make sure they are paying attention when school children are present.
The city has also posted new speed zone signs near schools, activated school speed zones, repainted crosswalks, and checked to see that all signals around schools were working properly. The city further increased the visibility of signs by installing reflective fluorescent yellow sleeves to the posts of 600 school-related signs, using two $10,000 grants from a competitive national safety program offered by the FedEx Corporation through the Safe Kids Coalition.
Demonstrating Results
The city has already demonstrated the impact special signage can have on vehicle speeds. City traffic engineers had advocated that city officials reduce speed limits on residential streets from 30 mph to 25 mph to make it safer for pedestrians. To test whether motorists would obey a lower speed limit, the city installed speed limit signs with special yellow borders and a safety message encouraging motorists to obey the new speed limit in select locations. Data from the pilot showed that 85 percent of motorists reduced their speeds by three to five miles per hour without any increase in enforcement. As a result, the City Council approved a city-wide reduction in the speed
limit on local streets from 30 mph to 25 miles per hour in February 2008.
The city is currently planning after-studies focusing on vehicle speed reduction for the school zones where active warning flashing beacons have been installed to determine if these school zones have experienced similar speed reductions since the implementation of the flashing yellow lights. But, safety improvements and speed reductions are already noticeable. City engineer Earl Newman said motorists have slowed where the eye-catching fluorescent yellow school signs have been installed. In addition, Newman conducted studies at some of the locations where the city had repainted the crosswalks, and found that 90 percent of the students were using the crosswalks when crossing the street.
Continuing the Focus on Safety
Now that the infrastructure improvements are in place, the city of Springfield is turning to bicycle and pedestrian safety education to further increase safety and encourage more children to walk and bicycle. With $25,000 in federal Safe Routes to School funding, the city is piloting in-classroom safety education for students in kindergarten through third grade at four Springfield schools. Educational materials that teach safety in a fun and child-friendly manner will be provided to teachers so they can easily incorporate lessons into their schedule.
Springfield, Missouri
16
Program Description
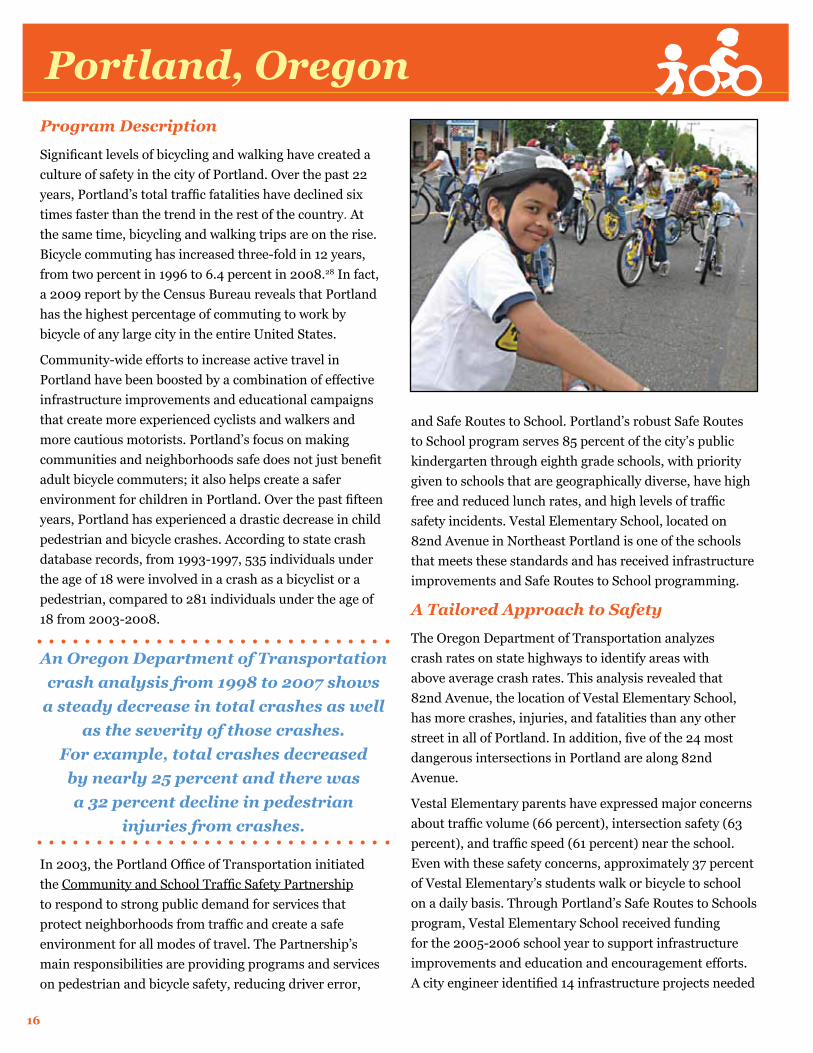
Significant levels of bicycling and walking have created a culture of safety in the city of Portland. Over the past 22 years, Portland’s total traffic fatalities have declined six times faster than the trend in the rest of the country. At the same time, bicycling and walking trips are on the rise. Bicycle commuting has increased three-fold in 12 years, from two percent in 1996 to 6.4 percent in 2008.28 In fact, a 2009 report by the Census Bureau reveals that Portland has the highest percentage of commuting to work by bicycle of any large city in the entire United States.
Community-wide efforts to increase active travel in Portland have been boosted by a combination of effective infrastructure improvements and educational campaigns that create more experienced cyclists and walkers and more cautious motorists. Portland’s focus on making communities and neighborhoods safe does not just benefit adult bicycle commuters; it also helps create a safer environment for children in Portland. Over the past fifteen years, Portland has experienced a drastic decrease in child pedestrian and bicycle crashes. According to state crash database records, from 1993-1997, 535 individuals under the age of 18 were involved in a crash as a bicyclist or a pedestrian, compared to 281 individuals under the age of 18 from 2003-2008.
In 2003, the Portland Office of Transportation initiated the Community and School Traffic Safety Partnership to respond to strong public demand for services that protect neighborhoods from traffic and create a safe environment for all modes of travel. The Partnership’s main responsibilities are providing programs and services on pedestrian and bicycle safety, reducing driver error,
and Safe Routes to School. Portland’s robust Safe Routes to School program serves 85 percent of the city’s public kindergarten through eighth grade schools, with priority given to schools that are geographically diverse, have high free and reduced lunch rates, and high levels of traffic safety incidents. Vestal Elementary School, located on 82nd Avenue in Northeast Portland is one of the schools that meets these standards and has received infrastructure improvements and Safe Routes to School programming.
A Tailored Approach to Safety
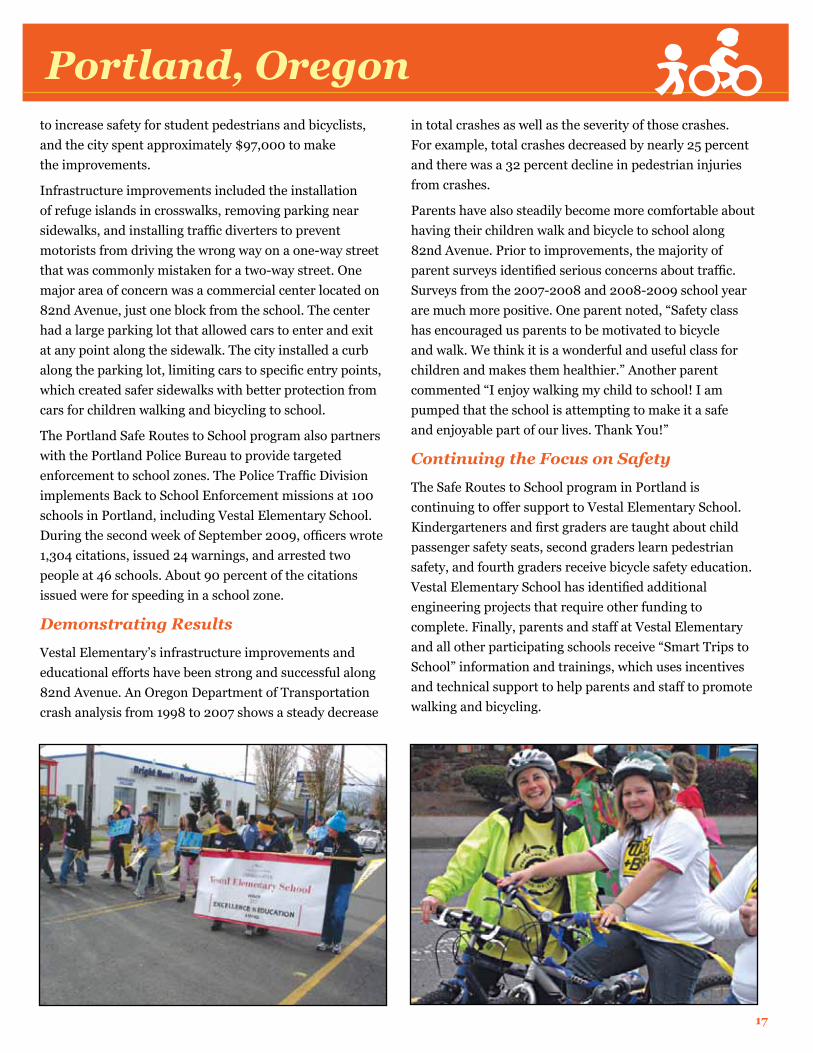
The Oregon Department of Transportation analyzes crash rates on state highways to identify areas with above average crash rates. This analysis revealed that 82nd Avenue, the location of Vestal Elementary School, has more crashes, injuries, and fatalities than any other street in all of Portland. In addition, five of the 24 most dangerous intersections in Portland are along 82nd Avenue.
Vestal Elementary parents have expressed major concerns about traffic volume (66 percent), intersection safety (63 percent), and traffic speed (61 percent) near the school. Even with these safety concerns, approximately 37 percent of Vestal Elementary’s students walk or bicycle to school on a daily basis. Through Portland’s Safe Routes to Schools program, Vestal Elementary School received funding for the 2005-2006 school year to support infrastructure improvements and education and encouragement efforts. A city engineer identified 14 infrastructure projects needed
Portland, Oregon
An Oregon Department of Transportation crash analysis from 1998 to 2007 shows
a steady decrease in total crashes as well as the severity of those crashes.
For example, total crashes decreased by nearly 25 percent and there was a 32 percent decline in pedestrian
injuries from crashes.
17
to increase safety for student pedestrians and bicyclists, and the city spent approximately $97,000 to make the improvements.
Infrastructure improvements included the installation of refuge islands in crosswalks, removing parking near sidewalks, and installing traffic diverters to prevent motorists from driving the wrong way on a one-way street that was commonly mistaken for a two-way street. One major area of concern was a commercial center located on 82nd Avenue, just one block from the school. The center had a large parking lot that allowed cars to enter and exit at any point along the sidewalk. The city installed a curb along the parking lot, limiting cars to specific entry points, which created safer sidewalks with better protection from cars for children walking and bicycling to school.
The Portland Safe Routes to School program also partners with the Portland Police Bureau to provide targeted enforcement to school zones. The Police Traffic Division implements Back to School Enforcement missions at 100 schools in Portland, including Vestal Elementary School. During the second week of September 2009, officers wrote 1,304 citations, issued 24 warnings, and arrested two people at 46 schools. About 90 percent of the citations issued were for speeding in a school zone.
Demonstrating Results
Vestal Elementary’s infrastructure improvements and educational efforts have been strong and successful along 82nd Avenue. An Oregon Department of Transportation crash analysis from 1998 to 2007 shows a steady decrease
in total crashes as well as the severity of those crashes. For example, total crashes decreased by nearly 25 percent and there was a 32 percent decline in pedestrian injuries from crashes.
Parents have also steadily become more comfortable about having their children walk and bicycle to school along 82nd Avenue. Prior to improvements, the majority of parent surveys identified serious concerns about traffic. Surveys from the 2007-2008 and 2008-2009 school year are much more positive. One parent noted, “Safety class has encouraged us parents to be motivated to bicycle and walk. We think it is a wonderful and useful class for children and makes them healthier.” Another parent commented “I enjoy walking my child to school! I am pumped that the school is attempting to make it a safe and enjoyable part of our lives. Thank You!”
Continuing the Focus on Safety
The Safe Routes to School program in Portland is continuing to offer support to Vestal Elementary School. Kindergarteners and first graders are taught about child passenger safety seats, second graders learn pedestrian safety, and fourth graders receive bicycle safety education. Vestal Elementary School has identified additional engineering projects that require other funding to complete. Finally, parents and staff at Vestal Elementary and all other participating schools receive “Smart Trips to School” information and trainings, which uses incentives and technical support to help parents and staff to promote walking and bicycling.
Portland, Oregon
18
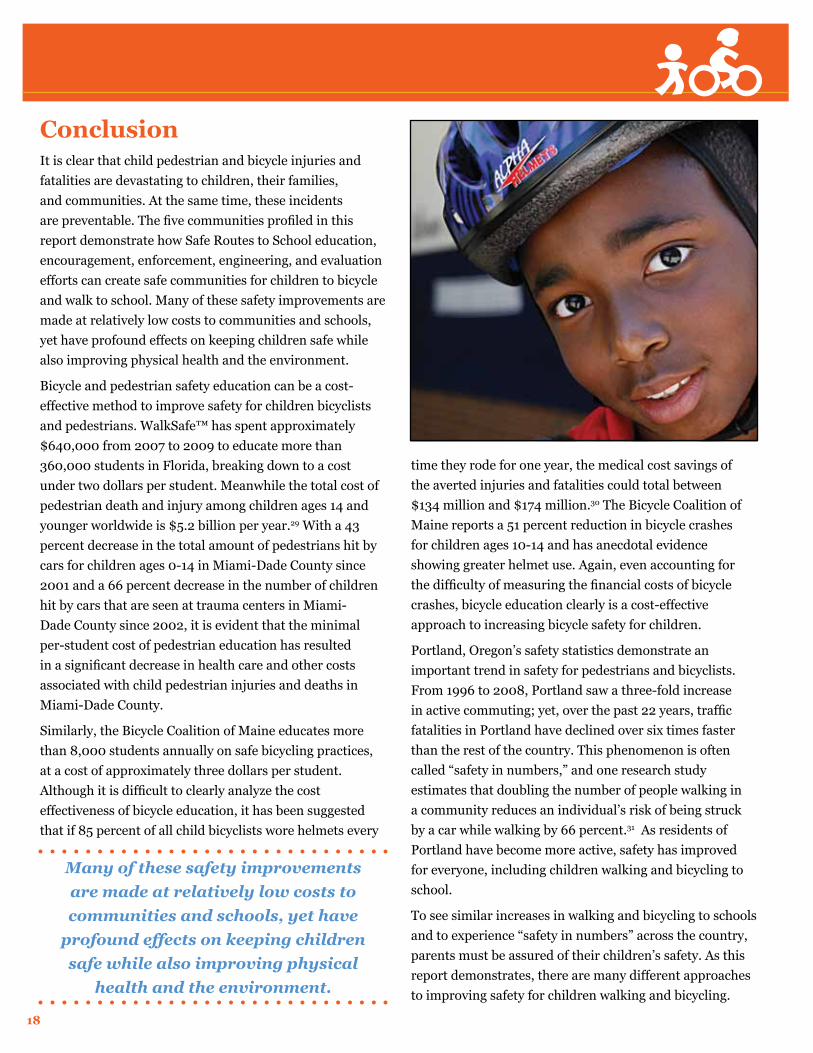
ConclusionIt is clear that child pedestrian and bicycle injuries and fatalities are devastating to children, their families, and communities. At the same time, these incidents are preventable. The five communities profiled in this report demonstrate how Safe Routes to School education, encouragement, enforcement, engineering, and evaluation efforts can create safe communities for children to bicycle and walk to school. Many of these safety improvements are made at relatively low costs to communities and schools, yet have profound effects on keeping children safe while also improving physical health and the environment.
Bicycle and pedestrian safety education can be a cost-effective method to improve safety for children bicyclists and pedestrians. WalkSafe™ has spent approximately $640,000 from 2007 to 2009 to educate more than 360,000 students in Florida, breaking down to a cost under two dollars per student. Meanwhile the total cost of pedestrian death and injury among children ages 14 and younger worldwide is $5.2 billion per year.29 With a 43 percent decrease in the total amount of pedestrians hit by cars for children ages 0-14 in Miami-Dade County since 2001 and a 66 percent decrease in the number of children hit by cars that are seen at trauma centers in Miami-Dade County since 2002, it is evident that the minimal per-student cost of pedestrian education has resulted in a significant decrease in health care and other costs associated with child pedestrian injuries and deaths in Miami-Dade County.
Similarly, the Bicycle Coalition of Maine educates more than 8,000 students annually on safe bicycling practices, at a cost of approximately three dollars per student. Although it is difficult to clearly analyze the cost effectiveness of bicycle education, it has been suggested that if 85 percent of all child bicyclists wore helmets every
time they rode for one year, the medical cost savings of the averted injuries and fatalities could total between $134 million and $174 million.30 The Bicycle Coalition of Maine reports a 51 percent reduction in bicycle crashes for children ages 10-14 and has anecdotal evidence showing greater helmet use. Again, even accounting for the difficulty of measuring the financial costs of bicycle crashes, bicycle education clearly is a cost-effective approach to increasing bicycle safety for children.
Portland, Oregon’s safety statistics demonstrate an important trend in safety for pedestrians and bicyclists. From 1996 to 2008, Portland saw a three-fold increase in active commuting; yet, over the past 22 years, traffic fatalities in Portland have declined over six times faster than the rest of the country. This phenomenon is often called “safety in numbers,” and one research study estimates that doubling the number of people walking in a community reduces an individual’s risk of being struck by a car while walking by 66 percent.31 As residents of Portland have become more active, safety has improved for everyone, including children walking and bicycling to school.
To see similar increases in walking and bicycling to schools and to experience “safety in numbers” across the country, parents must be assured of their children’s safety. As this report demonstrates, there are many different approaches to improving safety for children walking and bicycling.
Many of these safety improvements are made at relatively low costs to communities and schools, yet have
profound effects on keeping children safe while also improving physical
health and the environment.
19
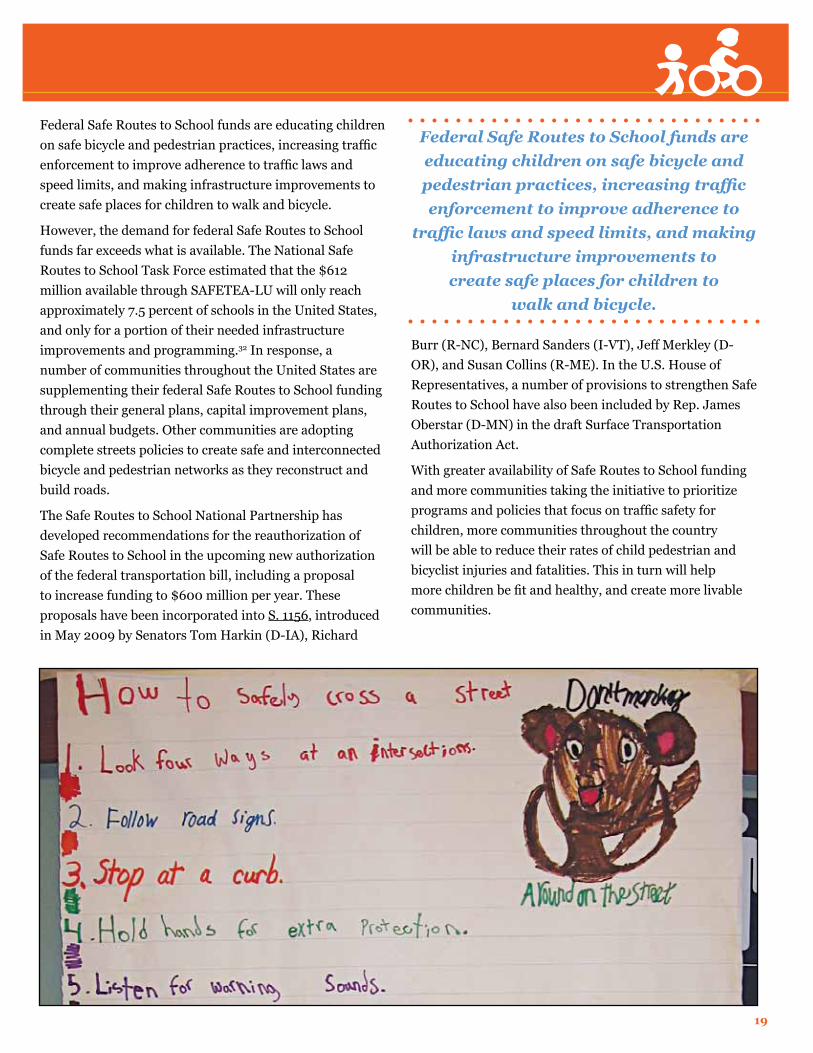
Federal Safe Routes to School funds are educating children on safe bicycle and pedestrian practices, increasing traffic enforcement to improve adherence to traffic laws and speed limits, and making infrastructure improvements to create safe places for children to walk and bicycle.
However, the demand for federal Safe Routes to School funds far exceeds what is available. The National Safe Routes to School Task Force estimated that the $612 million available through SAFETEA-LU will only reach approximately 7.5 percent of schools in the United States, and only for a portion of their needed infrastructure improvements and programming.32 In response, a number of communities throughout the United States are supplementing their federal Safe Routes to School funding through their general plans, capital improvement plans, and annual budgets. Other communities are adopting complete streets policies to create safe and interconnected bicycle and pedestrian networks as they reconstruct and build roads.
The Safe Routes to School National Partnership has developed recommendations for the reauthorization of Safe Routes to School in the upcoming new authorization of the federal transportation bill, including a proposal to increase funding to $600 million per year. These proposals have been incorporated into S. 1156, introduced in May 2009 by Senators Tom Harkin (D-IA), Richard
Burr (R-NC), Bernard Sanders (I-VT), Jeff Merkley (D-OR), and Susan Collins (R-ME). In the U.S. House of Representatives, a number of provisions to strengthen Safe Routes to School have also been included by Rep. James Oberstar (D-MN) in the draft Surface Transportation Authorization Act.
With greater availability of Safe Routes to School funding and more communities taking the initiative to prioritize programs and policies that focus on traffic safety for children, more communities throughout the country will be able to reduce their rates of child pedestrian and bicyclist injuries and fatalities. This in turn will help more children be fit and healthy, and create more livable communities.
Federal Safe Routes to School funds are educating children on safe bicycle and pedestrian practices, increasing traffic enforcement to improve adherence to
traffic laws and speed limits, and making infrastructure improvements to create safe places for children to
walk and bicycle.
20
End Notes 1 Ham, S., Martin, S., & Kohl, H. W. III. (2008). Changes in the percentages of students who walk or bike to school—United States, 1969 and 2001. Journal of Physical Activity and Health, 5 (2), 205–215. 2 Levi J, Vinter S, St. Laurent R, et al. “F as in Fat: 2008. How Obesity Policies are Failing in America.” Trust for America’s Health, August 2008.3 Ogden C, Carroll M and Flegal K. “High Body Mass Index for Age Among US Children and Adolescents, 2003–2006.” Journal of the American Medical Association, 299(20): 2401–2405, May 2008.4 Finkelstein E, Trogdon J, Cohen J and Dietz W. “Annual Medical Spending Attributable to Obesity: Payer- And Service-Specific Estimates.” Health Affairs, 2009 Sep-Oct;28(5):w822-31.5 Agran, Phyllis and Weiss, Jeffery C. “Policy Statement – Pedestrian Safety.” American Academy of Pediatrics. 124.2 (2009): 801-813.6 National Highway Traffic Safety Administration, Traffic Safety Facts 2008: Children. National Center for Statistics and Analysis. Washington, DC 20590.7 National Highway Traffic Safety Administration, Traffic Safety Facts 2008: Children. National Center for Statistics and Analysis. Washington, DC 20590. 8 Transportation Research Board. The Relative Risks of School Travel: A National Perspective and Guidance for Local Community Risk Assessment, 2002. Available at http://onlinepubs.trb.org/Onlinepubs/sr/sr269.pdf.9 National Highway Traffic Safety Administration, Traffic Safety Facts 2008: Children. National Center for Statistics and Analysis. Washington, DC 20590. 10 Mehan, Tracy, J., Gardner, Ricky, Smith, Gary A., and McKenzie, Lara B. “Bicycle Related Injuries Among Children and Adolescents in the United States.” Clinical Pediatrics. 48.2 (2009): 166-17311 Mehan, Tracy, J., Gardner, Ricky, Smith, Gary A., and McKenzie, Lara B. “Bicycle Related Injuries Among Children and Adolescents in the United States.” Clinical Pediatrics. 48.2 (2009): 166-173. 12 Weiner, Evan J. and Tepas, Joseph J. “Application of Electronic Surveillance and Global Information System Mapping to Track the Epidemiology of Pediatric Pedestrian Injury.” The Journal of Trauma: Injury, Infection, and Critical Care. 66.3 (2009): S10-S16.13 Vaughn, Amber E., Ball, Sarah C., Linnan, Laura A., Marchetti, Lauren M., Hall, William L. and Ward, Dianne S. “Promotion of Walking for Transportation: A Report From the Walk to School Day Registry.” Journal of Physical Activity and Health. 6.3 (2009): 281-288.14 Duperrex, Olivier, Roberts, Ian G., and Bunn, Frances. “Safety Education of Pedestrians for Injury Prevention.” The Cochrane Database of Systematic Reviews; The Cochrane Library. 2 (2009). 15 Safe Kids Worldwide (SKW). Pedestrian Safety. Washington (DC): SKW, 2007. 16 Mehan, Tracy, J., Gardner, Ricky, Smith, Gary A., and McKenzie, Lara B. “Bicycle Related Injuries Among Children and Adolescents in the United States.” Clinical Pediatrics. 48.2 (2009): 166-173. 17 Curnow, W.J. “The Cochrane Collaboration and bicycle helmets.” Accident Analysis & Prevention. 37.3 (2005): 569-573. 18 Zegeer, CV., Opiela, KS., and Cynecki, MJ. Effects of Pedestrian Signals and Signal Timing on Pedestrian Accidents. Transportation Res Rec. 1982:847:62-72.19 Federal Highway Administration (2002). Pedestrian Facilities Users Guide: Providing Safety and Mobility. Available at: http://drusilla.hsrc.unc.edu/cms/downloads/PedFacility_UserGuide2002.pdf20 Davis, James W., Bennink, Lynn D., Pepper, David R., Parks, Steven N., Lemaster, Deborah M., and Townsend, Richard N. “Aggressive Traffic Enforcement: A Simple and Effective Injury Prevention Program.” The Journal of Trauma, Injury, Infection, and Critical Care. 60.5 (2006): 972-977. 21 Brilon, W. and Blank, H. Extensive Traffic Calming: Results of the accident analyses in six model towns. In Proceedings of the 63rd Annual Meeting of the Institute of Transportation Engineers. Washington D.C.; Institute of Transportation Engineers. 1993:119-123.22 Schoon, C. and vanMinnen, J. The Safety of Roundabouts in the Netherlands. Traffic Engineer Control. March 1994:142-148.
23 Knoblauch, R., Tustin, BH., Smith, SA., and Pietrucha, MT. Investigation of Exposure-Based Pedestrian Accident Areas: Crosswalks, Sidewalks, Local Streets, and Major Arterials. Washington DC: US Dept of Transportation; 1987.24 Carder, P. Pedestrian Safety at Traffic Signals: A study carried out with the help of a traffic conflicts technique. Accidents Annual and Prevention. 1989:21:435-444.25 Prevedouros, PD. Evaluation of In-pavement Flashing Lights on a Six-lane Arterial Pedestrian Crossing. In: Proceeding of the 71st Annual Meeting of the Institute of Transportation Engineers. Washington DC: Institute of Transportation Engineers, 2001. 26 Zegeer, CV., Opiela, KS., and Cynecki, MJ. Effects of Pedestrian Signals and Signal Timing on Pedestrian Accidents. Transportation Res Rec. 1982:847:62-72.27 Pegrum, BV. The Application of Certain Traffic Management Techniques and Their Effect on Road Safety. In: Proceedings of the National Road Safety Symposium. Perth, Western Australia: Dept of Shipping and Transport; 1972:277-286.28 American Community Survey (ACS). Means of Transportation to work. Portland, OR: 1996-2008. available at http://www.portlandonline.com/shared/cfm/image.cfm?id=21748929 Safe Kids Worldwide (SKW). Pedestrian Safety. Washington (DC): SKW, 2007. available at http://www.walkinginfo.org/facts/facts.cfm30 Safe Kids Worldwide (SKW). Bicycle, Rollerblade, and Skateboard Injuries. Washington (DC): SKW, 2007.31 Jacobsen, Peter Lyndon. “Safety in Numbers: More Walkers and Bicyclists, Safer Walking and Bicycling.” Injury Prevention. 9.3 (2003):205-209.32 “Safe Routes to School: A Transportation Legacy. A National Strategy to Increase Safety and Physical Activity among American Youth.” National Safe Routes to School Task Force, July 2008, p. 38.
21
Photo Credits
pg. 10, courtesy of WalkSafe
pg. 11, courtesy of WalkSafe
pg. 14, courtesy of Mandy Taylor, City of Springfield (MO) Traffic Engineering Staff
pg. 15, courtesy of Mandy Taylor, City of Springfield (MO) Traffic Engineering Staff
pg. 16, courtesy of Portland Safe Routes to School
pg. 17, courtesy of Portland Safe Routes to School
pg. 19, courtesy of Portland Safe Routes to School
All other photos are provided by the Safe Routes to School National Partnership.
Design by Melanie Scheuermann, www.melcreative.com.
www.saferoutespartnership.org