Embed Size (px)
Citation preview
Comprehensive Annual Financial Report For the Fiscal Years Ended December 31, 2019 and 2018
Citrus Heights Water District Citrus Heights, California
SAFE. CLEAN. DEPENDABLE.


Citrus Heights Water District
Citrus Heights, CA
Comprehensive Annual Financial Report
Years Ended December 31, 2019 and 2018
Prepared By:
The Administrative Services Department
6230 Sylvan Road
Citrus Heights, CA 95610
www.chwd.org
Introductory Section Page
Letter of Transmittal iGovernment Finance Officers Association Award viiiOrganizational Chart ixService Area Map with Cities Served xBoard of Directors and Principal Officers xi
Financial Section Page
Independent Auditor's Report 1Management's Discussion and Analysis 4
Basic Financial Statements:
Balance Sheets 15Statements of Revenues, Expenses, and Changes in Net Position 16Statements of Cash Flows 17Notes to the Basic Financial Statements 20
Required Supplementary Information:
Schedule of the Plan's Proportionate Share of the Net Position Liability and Related Ratios as of the Measurement Date 47Schedule of Contributions 48Shcedule of Changes in Total OPEB Liability and Related Ratios 49Schedule of Contributions - Agent Multiple Employer Plan 50
CITRUS HEIGHTS WATER DISTRICTComprehensive Annual Financial ReportYears Ended December 31, 2019 and 2018
Table of Contents

Statistical Section Page
Financial Trends
Changes in Net Position and Net Position by Component 55Operating Revenue by Source 57Operating Expenses by Activity 58
Revenue Capacity
Revenue Base 60Water Rates 61Customers by Type 62Principal Customers 63
Debt Capacity
Ratios of Outstanding Debt 65Debt Coverage 66
Demographic and Economic Information
Demographic and Economic Statistics 68Principal Employers 69
Operating Information
Full-Time Employees by Department 71Operating Indicators 72
CITRUS HEIGHTS WATER DISTRICTComprehensive Annual Financial Report
Years Ended December 31, 2019 and 2018
Table of Contents (continued)

Introductory Section

i
May 7, 2020
Honorable Members of the Board of Directors: We are pleased to present the Citrus Heights Water District’s (“District”) third Comprehensive Annual Financial Report (“CAFR”) for the fiscal year ending December 31, 2019. This report was prepared by District staff in conformity with generally accepted accounting principles (“GAAP”) and audited in accordance with generally accepted auditing standards by a firm of certified public accountants. The CAFR provides an assessment of the District’s financial condition, informs readers about District services, includes information about capital improvement projects, and discusses current initiatives within the District’s Basic Financial Statements. Financial and demographic trend information is provided within the statistical section located at the end of the report. Management at the District is responsible for both the accuracy of the data presented and the completeness and fairness of the presentation, including all disclosures. As management, we assert that, to the best of our knowledge and belief, the information and data, as presented, is accurate in all material respects, and it is presented in a manner that provides a fair representation of the financial position and operations of the District. Furthermore, all disclosures that are necessary to enhance the Board’s understanding of the financial condition of the District have been included. The District’s financial statements have been audited by Maze and Associates, a firm of independent certified public accountants. The goal of the independent audit was to provide reasonable assurance that the financial statements of the District for the fiscal year ending December 31, 2019 are free of material misstatement. The independent audit involved examining, on a test basis, evidence supporting the amounts and disclosures in the financial statements; assessing the accounting principles used and significant estimates made by management; and evaluating the overall financial statement presentation. The independent auditor concluded, based upon the audit, that there was a reasonable basis for rendering an unmodified (“clean”) opinion that the District’s financial statements for the fiscal year ending December 31, 2019, were fairly presented in conformity with GAAP. The Independent Auditors’ Report is presented as the first component of the financial section of this report. Generally Accepted Accounting Principles (GAAP) require that management provide a narrative introduction, overview and analysis to accompany the financial statements in the form of the Management’s Discussion and Analysis (MD&A) Section. This letter of transmittal is designed to complement the MD&A and should be read in conjunction with it. The MD&A can be found immediately after the Independent Auditors’ Report. Overview of the Comprehensive Annual Financial Report This report is presented in three sections:
Board of Directors Raymond A. Riehle, President
Caryl F. Sheehan, Vice President David Wheaton, Director
Hilary M. Straus, General Manager/Secretary Susan K. Talwar, Director of Finance and Administrative Services/Treasurer
Alberto Preciado, Accounting Manager/Assessor/Collector

ii
• Introductory Section – includes this letter of transmittal, a list of principal officials and an organization chart.
• Financial Section – includes the Independent Auditor’s Report, Management’s Discussion and Analysis (MD&A), the basic audited financial statements, and required supplementary information (RSI).
• Statistical Section – includes information on financial trends, revenue capacity, debt capacity, demographic and economic conditions, and multi-year comparative operational data.
Profile of Citrus Heights Water District Citrus Heights Water District was established in 1920, as the Citrus Heights Irrigation District, encompassing slightly more than 4.7 square miles, and serving approximately 225 farms. The District currently serves water to a population of approximately 67,000 people within an about 12 square mile service area. Citrus Heights Water District carries out its mission with a highly-motivated and competent staff that is empowered to conduct the District’s business by placing the customers’ needs and welfare first. Each day, the District’s employees strive to carry out their work, mindful of the District’s mission, “to furnish a dependable supply of safe, quality water delivered to its customers in an efficient, responsive, and affordable manner.” Governance and Organizational Structure CHWD is a special district established by the State of California. The District is governed by a three-member Board of Directors that is elected to a four-year term by voters who reside in the District’s service area. Beginning with the 2020 election, CHWD Board elections will be “By-District,” whereby only those customers who reside in the same CHWD District that a Board Member lives in will vote for that Board position. The District was staffed in 2019 by 35 full-time equivalent employees assigned to four departments: Administrative Services, Engineering, Operations, and the General Manager’s Office. The General Manager and District General Counsel are appointed by, and report directly to, the Board of Directors. All other staff members report to the General Manager or General Manager’s designee. Water Supply In 2019, the District purchased 96.74% of its water from San Juan Water District (SJWD), and delivered it to approximately 19,900 residential and commercial service connections. Additionally, the District maintains six groundwater wells and approximately 250 miles of pipeline. CHWD has been treating and delivering groundwater to customers since 1943. Accounting and Budget Structure CHWD operates as an enterprise fund with a fiscal year that begins January 1 and ends on December 31. Generally accepted accounting principles (GAAP) require local governments to use a proprietary-type fund, such as an enterprise fund, to account for business-type
iii
activities similar to those found in the private sector. An enterprise fund is one in which the expenditures are supported by fees collected primarily through charging users in exchange for services. CHWD operations are supported entirely by fees collected from customers in exchange for providing water service and managing the groundwater basin. CHWD’s management is responsible for the establishment and maintenance of the internal control structure that ensures the assets of the District are protected from loss, theft or misuse. The internal control structure ensures that adequate accounting data is compiled to allow for the preparation of financial statements in conformity with Generally Accepted Accounting Principles (GAAP). CHWD’s internal control structure is designed to provide reasonable assurance that these objectives are met. The concept of reasonable assurance recognizes that the cost of a control should not exceed the benefits likely to be derived, and the valuation of costs and benefits requires estimates and judgments by management. CHWD’s Board annually adopts a budget prior to the new fiscal year. The budget authorizes and provides the basis for reporting and control of financial operations, accountability for CHWD’s enterprise operations, and capital projects. The budget is presented on the accrual basis of accounting, and is consistent with the presentation of CHWD’s Comprehensive Annual Financial Report. As part of the budget process, a Financial Model is updated annually to analyze revenue and expenses along with capital improvements. Also, CHWD’s Board adopted an accelerated payoff schedule to reduce the District’s unfunded actuarial liability to the following: 20 years (other post-employment benefits) and 15 years (pension) amortizations beginning in FY2018. This accelerated payoff will result in savings to the District’s customers over the previous, longer amortization. Financial Policies The CHWD financial policies include many of the District’s financial management practices that are used for operational and strategic decision making. These policies also allow the Board of Directors and community stakeholders to monitor how effectively the District is managing its financial responsibilities, as well as providing a means for holding the District fiscally accountable. These policies are reviewed annually to incorporate minor changes to existing policy, or major shifts in financial priorities at the discretion of the Board of Directors.
• Investment Policy – The Board has adopted an investment policy that conforms to state law, CHWD’s ordinances and resolutions, prudent money management, and the “prudent person” standards. The objectives of the Statement of Investment Policy are safety, liquidity, and then yield. Currently, funds are invested in various securities as authorized by CHWD’s Investment Policy, with most of the District’s funds invested in California’s Local Agency Investment Fund (LAIF).
• Reserve Policies – The District has ten Reserve accounts with supported policies to balance ongoing operations to capital improvement programs. These funds are allocated to the maintenance, repair, replacement, or improvement of water system infrastructure. Adequate reserves, along with sound financial policies, provide financial flexibility to counter unanticipated expenditures or revenue fluctuations.
iv
Audit and Financial Reporting State Law and bond covenants require CHWD to obtain an annual audit of its financial statements by an independent Certified Public Accountant. The accounting firm of Maze and Associates conducted the audit of CHWD’s financial statements. Their unmodified Independent Auditor’s Report appears in the Financial Section. This is the fifth year of a six year engagement with Maze and Associates. Risk Management CHWD participates in the Association of California Water Agencies Joint Powers Insurance Authority (ACWA/JPIA) for the purchase of workers’ compensation, liability, property, automobile, and fidelity insurance. The typical liability limits are $5 million per incident/occurrence. Economic Condition, Outlook and Major Initiatives CHWD is primarily a residential community, with some commercial enterprises within its boundaries. The District’s service area is almost built out; therefore, the District does not anticipate a significant growth in revenue based solely upon new development. The District is forecasting a slow but steady revenue increase based on 0.5% growth per year from the demand in small in-fill of housing or commercial development within District boundaries. CHWD operates as an enterprise fund, meaning the costs of providing water service and protecting groundwater resources are financed by rates and fees charged to District customers. Since the District receives no revenue from taxes, operating revenues consist primarily of water sales and bi-monthly service charges. Although water use increased slightly in 2019, District customers have decreased their water use significantly since 2013 in response to state-wide drought mandates. This drop in demand created a gap between the amount of water customers were projected to use, and the amount they actually used, and contributed to the need for a new rate study and Financial Model rebuild. The rebuild of the Financial Model was completed and used in the development of the 2020 budget. CHWD and its wholesale water supplier, San Juan Water District, continue to encounter changes in operations due to new regulations. The impact of current and future regulations, and the resulting cost impact on water supply operations, are an ongoing challenge for the District. The District anticipates a 9% rate increase from its wholesale water supplier in 2020. As of January 1, 2019, CHWD charges a uniform commodity rate of $1.07 per unit and a bi-monthly fixed charge of $78.18 for a 1-inch meter. One unit of water equals 748 gallons which means that the cost per gallon is 0.14 cents. At $725.16 per year, the cost of water service for a typical single family home using 179,520 gallons of water annually remains a good value for CHWD’s customers. The District continues to repair and replace aging infrastructure throughout its system. During 2019, the District completed 233 service replacements, as well as the testing and replacement of the District’s large water meters. The District also completed main replacements on Patten Avenue and Watson Way. Capital projects scheduled for 2020 total $6.8 million.
v
The outbreak of the novel coronavirus COVID-19 in the United States in the first quarter of 2020 has caused a nationwide disruption to all facets of the national economy. At this time, the financial impact on the District cannot be reasonably estimated. See Note 12 of the Notes to the Financial Statements for more information. Through this crisis, the District remains steadfast in its commitment to the safety and well-being of its customers. Therefore, the District temporarily suspended its collection activity for delinquent accounts, and temporarily suspended shut-offs for nonpayment. Additionally, the District remains operational to continue serving its customers, and has increased its customer outreach program to provide vital information and assure our customers that their water supply is safe, clean, and dependable. Long-Term Financial Planning Citrus Heights Water District utilizes a number of planning strategies when considering long-term financial forecasts.
• Strategic Plan – Strategic planning involves establishing a vision for the future and a clear mission statement to provide direction and define what the organization stands for and what it has pledged to accomplish. Since 2016, CHWD has held a strategic planning workshop for the Board of Directors, management, and at-large customers. The purpose of the workshop has been to review the District’s mission statement and values, and to implement the District’s mission and values through an Annual Work Program. The Work Program includes three-year goals and one-year objectives, which emphasize the District’s commitment to promoting the efficient use of water, managing CHWD’s water supply, implementing capital improvements, and optimizing organizational efficiency. The Strategic Plan and its accompanying Annual Work Program form the basis for the District’s priority-based budgeting efforts.
• Project 2030 Water Main Replacement Plan – This plan was identified during the strategic planning process as a key strategy for engaging customers in long-range water main replacement planning and funding efforts. The purpose of this plan is to inform customers about challenges and opportunities, and the current actions being undertaken to ensure water supply reliability, and prepare for the replacement of aging infrastructure.
• Capital Improvement Plan – The Strategic Plan lays the groundwork for the Capital Improvement Plan, which includes project schedules and projected costs for production and water supply facilities identified in a 1999 Facilities Master Plan. The Capital Improvement Plan is a ten year forecast and a capital reinvestment plan.
• 10-Year Financial Planning Model – The previous Financial Planning Model was prepared by NBS in consultation with District staff in June 2013, and includes short

vi
and long-range projections of the District’s revenues, operating and maintenance expenses, capital expenditures, and reserves over the next ten years. The plan is updated as changes in customer water use impact long-range financial projections and capital improvement and water supply plans evolve. Raftelis Financial Consultants were retained to work with District staff to prepare a new Financial Planning Model, which was completed and presented to the Board in 2019, and used in the development of the 2020 budget.
• Annual Budget – A key component of financial planning is the District’s budget,which is prepared, reviewed and adopted annually. Every summer, District Financestaff prepares a draft budget, based upon an analysis of the Financial PlanningModel and on revenue/expenditure submissions from CHWD’s departments. Thebudget is presented to the Board of Directors for approval prior to the beginning ofthe next fiscal year. The annual budget includes forecasts for revenues, operatingexpenditures and capital expenditures, and is formulated using a priority-basedbudgeting approach.
• Water Meter Replacement Program– As CHWD’s first generation of meters age-out, the District has taken the lead to form an 11-agency consortium to partner in thereplacement and testing of meters on an on-going basis. The goal of the newly-created Meter Replacement Program consortium is to take advantage of aneconomies of scale of over 300,000 meters to be able to reduce meter assetmanagement costs for CHWD and its consortium partners. The consortium’s initialproject is the completion of a Meter Replacement Program Study to identifyopportunities for partnership and strategies for each agency in the short and long-term to optimally manage meter replacements.
Awards and Acknowledgements Government Finance Officers Association of the United States and Canada (GFOA) awarded a Certificate of Achievement for Excellence in Financial Reporting to the Citrus Heights Water District for its comprehensive annual financial report (CAFR) for the fiscal year ended December 31, 2018. This was the second year that the District achieved this prestigious award. In order to be awarded a Certificate of Achievement, a governmental agency must publish an easily readable and efficiently organized CAFR. The report must satisfy both generally accepted accounting principles and applicable legal requirements.
A Certificate of Achievement is valid for a period of one year only. CHWD believes that this CAFR continues to meet the Certificate of Achievement Program’s requirements, and is submitting it to the GFOA to determine its eligibility for another certificate.
Preparation of this report was accomplished through the combined efforts of CHWD’s staff, most notably Accounting Manager Alberto Preciado, along with support from the various departmental directors, managers, and supervisors. CHWD staff’s dedicated efforts, professionalism, and contributions to CHWD’s CAFR is greatly appreciated. We would also

vii
like to thank the members of the Board of Directors for their continued support in planning and implementing the District’s fiscal policies.
Respectfully submitted,
Hilary M. Straus Susan K. Talwar General Manager/Secretary Director of Finance and
Administrative Services/ Treasurer
Goven1ment Finance Officers Association
Certificate of
Achievement for Excellence
in Financial Reporting
Presented to
Citrus Heights Water District
California
For its Comprehensive Annual
Financial Report
for the Fiscal Year Ended
December 31, 2018
Executive Director/CEO
viii

ORGANIZATIONAL CHART
FY 2019
ix

CITRUS HEIGHTS WATER DISTRICTService Area Map with Cities Served
x
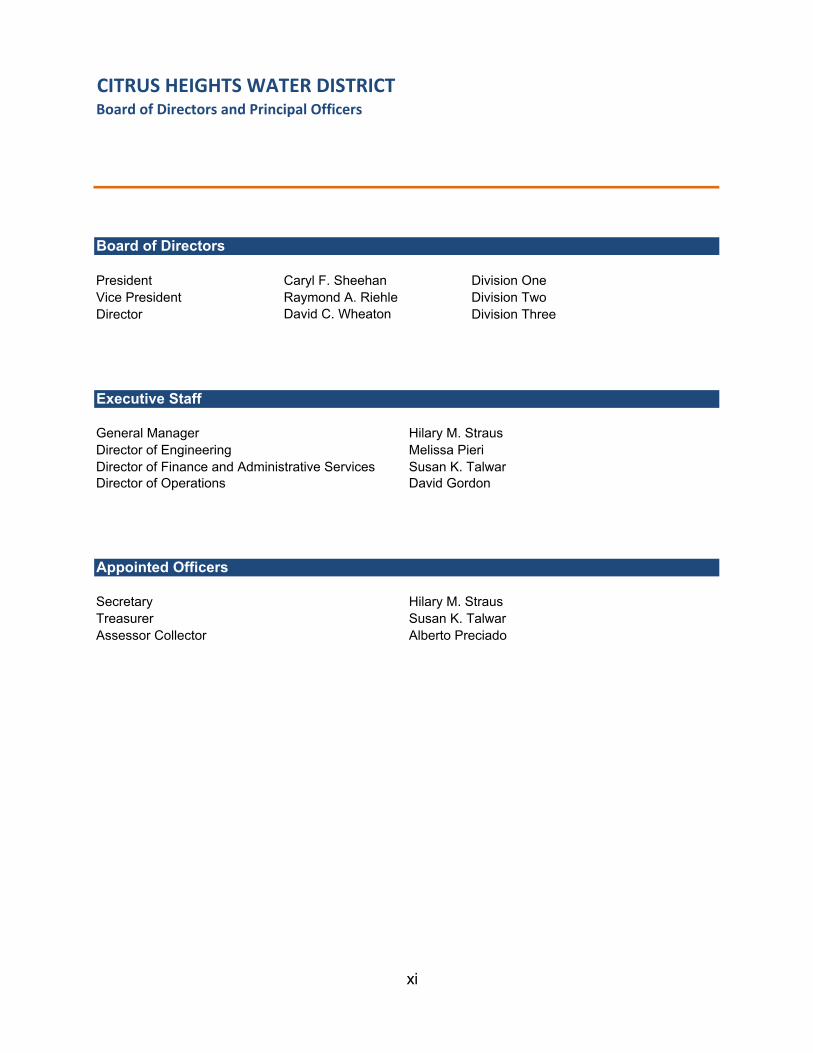
Board of Directors and Principal Officers
Board of Directors
President Caryl F. Sheehan Division OneVice President Raymond A. Riehle Division TwoDirector David C. Wheaton Division Three
Executive Staff
General Manager Hilary M. StrausDirector of Engineering Melissa PieriDirector of Finance and Administrative Services Susan K. TalwarDirector of Operations David Gordon
Appointed Officers
Secretary Hilary M. StrausTreasurer Susan K. TalwarAssessor Collector Alberto Preciado
CITRUS HEIGHTS WATER DISTRICT
xi

Financial Section

Independent Auditor’s Report

INDEPENDENT AUDITOR'S REPORT
To the Honorable Members of the Board of Directors Citrus Heights Water District Citrus Heights, California
Report on Financial Statements
We have audited the accompanying financial statements of the Citrus Heights Water District (District), California, as of and for the years ended December 31, 2019 and 2018, and the related notes to the financial statements, which collectively comprise the District’s basic financial statements as listed in the Table of Contents.
Management’s Responsibility for the Financial Statements
Management is responsible for the preparation and fair presentation of these financial statements in accordance with accounting principles generally accepted in the United States of America; this includes the design, implementation, and maintenance of internal control relevant to the preparation and fair presentation of the financial statements that are free from material misstatement, whether due to fraud or error.
Auditor’s Responsibility
Our responsibility is to express opinions on these financial statements based on our audit. We conducted our audit in accordance with auditing standards generally accepted in the United States of America. Those standards require that we plan and perform the audit to obtain reasonable assurance about whether the financial statements are free from material misstatement.
An audit involves performing procedures to obtain audit evidence about the amounts and disclosures in the financial statements. The procedures selected depend on the auditor’s judgment, including the assessment of the risks of material misstatement of the financial statements, whether due to fraud or error. In making those risk assessments, the auditor considers internal control relevant to the District’s preparation and fair presentation of the financial statements in order to design audit procedures that are appropriate in the circumstances, but not for the purpose of expressing an opinion on the effectiveness of the District’s internal control. Accordingly, we express no such opinion. An audit also includes evaluating the appropriateness of accounting policies used and the reasonableness of significant accounting estimates made by management, as well as evaluating the overall presentation of the financial statements.
We believe that the audit evidence we have obtained is sufficient and appropriate to provide a basis for our audit opinion.
Opinions
In our opinion, the financial statements referred to above present fairly, in all material respects, the respective financial positions of the District as of December 31, 2019 and 2018, and the respective changes in its financial positions and cash flows for the years then ended, in accordance with accounting principles generally accepted in the United States of America.
1

Change in Accounting Principles
Management early implemented the provisions of the Governmental Accounting Standards Board Statement 84 – Fiduciary Activities, for the year ended December 31, 2018. See Note 1A for relevant disclosures.
Management adopted the provisions of the Governmental Accounting Standards Board Statement, Statement No. 75 – Accounting and Financial Reporting for Post-employment Benefit Plans Other than Pensions, which became effective during the year ended December 31, 2018, and required a restatement to of beginning net position as discussed in Note 6 to the financial statements.
The emphasis of these matters do not constitute a modification to our opinions.
Other Matters
Required Supplementary Information
Accounting principles generally accepted in the United States of America require that Management’s Discussion and Analysis, and other required supplementary information as listed in the Table of Contents be presented to supplement the basic financial statements. Such information, although not a part of the basic financial statements, is required by the Governmental Accounting Standards Board, who considers it to be an essential part of financial reporting for placing the basic financial statements in an appropriate operational, economic or historical context. We have applied certain limited procedures to the required supplementary information in accordance with auditing standards generally accepted in the United States of America, which consisted of inquiries of management about the methods of preparing the information and comparing the information for consistency with management’s responses to our inquiries, the basic financial statements, and other knowledge we obtained during our audit of the basic financial statements. We do not express an opinion or provide any assurance on the information because the limited procedures do not provide us with sufficient evidence to express an opinion or provide any assurance.
Other Information
Our audit was conducted for the purpose of forming opinions on the financial statements that collectively comprise the District’s basic financial statements. The Introductory Section, and Statistical Section, as listed in the Table of Contents are presented for purposes of additional analysis and are not required parts of the basic financial statements.
The Introductory and Statistical Sections have not been subjected to the auditing procedures applied in the audit of the basic financial statements and, accordingly, we do not express an opinion or provide any assurance on them.
Pleasant Hill, California May 7, 2020
2

Management’s Discussion and Analysis
3

CITRUS HEIGHTS WATER DISTRICT Management’s Discussion and Analysis
For the Fiscal Year Ended December 31, 2019 and 2018
The following Management’s Discussion and Analysis (MD&A) of activities and financial performance of the Citrus Heights Water District (District) provides an introduction to the financial statements of the District for the fiscal years ended December 30, 2019 and 2018. We encourage readers to consider the information presented here in conjunction with the transmittal letter in the Introductory Section and with the accompanying basic financial statements and related notes, which follow this section.
Financial Highlights
The following items are, in the opinion of District management, among the most significant in assessing the District’s overall financial activities during 2019 and its financial position at the close of the year 2019:
The District’s assets exceeded its liabilities at the end of year 2019 by $69,953,010.About 82 percent of the District’s net position, $57,193,152, is composed of the capitalassets of the District – the water transmission and distribution system, waterproduction facilities, land, buildings, and equipment belonging to the District.Unrestricted net position totaled $12,217,198, up from $11,717,632 at the end of year2018. This increase is due primarily to an 11.9 percent rate increase levied by theBoard of Directors at the beginning of 2019. In fiscal year 2018, unrestricted netassets increased to $11,717,632, up from $10,882,932 at the end of 2017. Thisincrease was due primarily to revenue generated from a water transfer sale in 2018,and also a 3 percent rate increase levied by the Board of Directors at the beginning of2018
Capital improvement spending in year 2019 decreased by $298,288 as compared with2018. Capital improvements capitalized in 2019 amounted to $3.0 million. Capitalimprovement spending in year 2018 increased by $70,000 as compared to year 2017.Capital improvements capitalized in 2018 amounted to $4.8 million.
The District’s operating revenues for 2019 were $15,340,476. About 97 percent ofoperating revenues, $14,823,207, came from water sales to customers.
The District’s total net long-term liabilities at the end of 2019, including the 2012Revenue Refunding bonds, the 2010 Revenue Refunding Certificates of Participation,pension liability, liability for other postemployment benefits (OPEB), and compensatedabsences is $7,945,889. GASB Statement No. 68 required the recording of pensionliability amounting to $4,611,042. GASB Statement No. 75 required the recording ofOPEB liability in the amount of $1,459,582. Liabilities from Bond debt servicedecreased by $669,819 due to a reduction in principal on debt during 2019 resultingfrom debt service payments during the year.
OVERVIEW OF THE FINANCIAL STATEMENTS
This annual report consists of two parts: (1) management’s discussion and analysis; and (2) the financial statements, including the notes to financial statements and required supplementary information.
4

CITRUS HEIGHTS WATER DISTRICT Management’s Discussion and Analysis
For the Fiscal Year Ended December 31, 2019 and 2018
The financial statements provide both long-term and short-term information about the District’s overall financial status. The financial statements also include notes that explain some of the information in the financial statements and provide more detailed data. The required supplementary information, although not part of the basic financial statements, is required by the Governmental Accounting Standards Board (GASB) to provide more context regarding the financial statements from an appropriate operational, economic, or historical perspective.
The District’s financial statements are prepared in conformity with accounting principles generally accepted in the United States of America (GAAP) as applied to government units on an accrual basis. Under this basis, revenues are recognized in the period in which they are earned, expenses are recognized in the period in which they are incurred, and depreciation of assets is recognized in the Statement of Revenues, Expenses, and Changes in Net Position. All assets and liabilities associated with the operation of the District are included in the Balance Sheet.
The Balance Sheet presents the financial position of the District on a full accrual historical cost basis and provides information about the nature and amount of resources and obligations at year-end.
Balance Sheet
The following table summarizes assets, deferred outflows, liabilities, deferred inflows, and net position at December 31, 2019, 2018, and 2017:
% Increase (Decrease)
2019 2018 2017
FY19 vs
FY18
FY18 vs
FY17
Current assets $18,801,764 $17,150,069 $16,248,823 9.6% 5.6%
Capital assets, net 59,640,444 58,109,443 57,038,900 2.6% 1.9%
Total Assets 78,442,208 75,259,512 73,287,723 4.2% 2.7%
Deferred outflows 2,113,759 2,674,857 1,981,897 (21.0)% 35.0%
Current liabilities 2,295,848 1,972,121 2,031,682 16.4% (2.9)%
Non-current liabilities 7,945,889 8,468,101 8,280,325 (6.2)% 2.3%
Total Liabilities 10,241,737 10,440,222 10,312,007 (1.9)% 1.2%
Deferred Inflows 361,220 205,982 188,528 75.4% 9.3%
Net PositionNet investment in capital assets 57,193,152 55,029,058 53,350,420 3.9% 2.1%
Restricted for debt service 542,660 541,475 535,733 0.2% 1.1%
Unrestricted 12,217,199 11,717,632 10,882,932 4.3% 13.2%
Total Net Position $69,953,010 $67,288,165 $64,769,085 4.0% 3.9%
5

CITRUS HEIGHTS WATER DISTRICT Management’s Discussion and Analysis
For the Fiscal Year Ended December 31, 2019 and 2018
The total net position of the District increased from $64.8 million in 2017 to $67.3 million in 2018, and increased to $70.0 million in 2019. The District’s total assets increased by $3.2 million, or 4.2%, in 2019 compared to 2018, and $2.0 million, or 2.7%, in 2018 compared to 2017.
Deferred outflows decreased by 21.0% from $2.7 million in 2018 to $2.1 million in 2019, due to the amortization of a prior-year balance of pension deferred outflows; a 35.0% increase in deferred outflows from $2.0 million in 2017 to $2.7 million in 2018 was due to a prepayment of pension liability.
In 2019, the total liabilities decreased $198,485, or 1.9%, compared to 2018, and in 2018, increased $128,215, or 1.2%, compared to 2017.
Deferred inflows increased by $155,238, or 75.4% to $361,220 in 2019 from $205,982 in 2018 as a result of changes in actuarial assumptions affecting the calculation of the pension liability; deferred inflows increased by $17,454, or 9.3%, to $205,982 in 2019 from $188,528 in 2018 primarily as a result of changes in actuarial assumptions that affected the calculation of deferred inflows for pensions.
The increase in net position over the three-year period totals $5.2 million or 8.0% and is the result of the combination of net income and capital contributions.
6

CITRUS HEIGHTS WATER DISTRICT Management’s Discussion and Analysis
For the Fiscal Year Ended December 31, 2019 and 2018
Changes in Net Position
The following table summarizes the changes in net position for the fiscal years ended December 31, 2019, 2018, and 2017:
% Increase (Decrease)
2019 2018 2017
Operating revenues $15,340,476 $14,375,044 $14,043,049 6.7% 2.4%
Operating expenses:
Customer service, administration and general
4,371,420 3,228,919 2,543,736 35.4% 26.9%
Water purchases 3,131,903 2,878,799 2,692,482 8.8% 6.9%
Transmission and distribution 2,425,827 2,142,451 1,963,750 13.2% 9.1%
Pumping & well maintenance 683,432 717,562 145,077 (4.8)% 394.6%
Water efficiency (Conservation) 617,732 563,708 189,336 9.6% 197.7%
Depreciation & amortization 2,435,900 2,388,634 2,345,281 2.0% 1.8%
Total operating expenses 13,666,214 11,920,073 9,879,662 14.6% 20.7%
Operating income 1,674,262 2,454,971 4,163,377 (31.8)% (41.0)%
Net non-operating revenues (expenses)
92,499 302,184 898,144 (69.4)% (66.4)%
Net income before capital contributions
1,766,761 2,757,155 5,061,531 (35.9)% (45.5)%
Capital contributions:
Contributed (donated) assets 898,084 213,121 55,813 321.4% 281.8%
Grant Revenue - - - 0.0% 0.0%
Total capital contributions 898,084 213,121 55,813 321.4% 281.8%
Change in net position 2,664,845 2,970,276 5,117,344 (10.3)% (42.0)%
Net position, beginning of year, as restated
67,288,165 64,317,889 59,651,741 4.6% 7.8%
Net position, end of year $69,953,010 $67,288,165 $64,769,085 4.0% 3.9%
Net position increased $2.7 million, or 4.0 percent from the prior year; in 2018, net position increased $2.5 million, or 3.9 percent from 2017. Operating revenue that exceeded operating expenses by $1.7 million and $2.5 million for 2019 and 2018, respectively, accounts for the majority of the increase in net position, and most of these funds were expended for the construction of capital improvements or set aside for that purpose. The receipt of $898,084 in donated assets from private developer additions to the District’s water distribution system accounted for about 33.7 percent of the increase in net position.
7

CITRUS HEIGHTS WATER DISTRICT Management’s Discussion and Analysis
For the Fiscal Year Ended December 31, 2019 and 2018
Total operating revenues increased in 2019 by $965,432 or 6.7 percent from 2018, and in 2018 by $331,995 or 2.4 percent from 2017. An increase in water rates accounts for most of this increase. Water consumption by the District customers increased in 2019 compared with consumption in 2018 by 0.2%; this is as a result of a dryer winter than in the previous year. Consumption decreased in 2018 by 0.3% over 2017 due to due to increased rainfall in the winter months.
In 2019, operating expenses increased by $1.7 million, or 14.6% from 2018, primarily due to a pension expense of $0.9 million recorded for GASB 68, and an increase of $253,104 in the cost of wholesale water caused by an increase in the wholesale water rate. Operating expenses increased in 2018 by $2,040,411, or 20.7 percent from 2017, due to increases in operating costs such as the beginning of an accelerated payoff of the District’s GASB 68 pension and GASB 75 OPEB unfunded liabilities, the cost of materials and supplies used to operate and maintain the District’s water distribution system and groundwater production wells, including major maintenance to the Sunrise Well, and professional services for advanced planning for the Project 2030 Water Main Replacement study and the Meter Replacement program.
CAPITAL ASSETS AND DEBT ADMINISTRATION
Capital Assets
As of December 31, 2019, 2018 and 2017, the District’s investment in capital assets, net of related debt, was $57,193,152, $55,029,058, and $53,350,420, respectively, including: the water transmission and distribution system (underground pipelines, water services, water meters, fire hydrants, and other components), water production facilities (groundwater wells), land, buildings and both mobile and fixed equipment.
Replacement of aging pipelines and water service connections throughout the District’s system continued to represent the majority of the $3.0 million additions to the District’s capital assets in 2019, the $4.8 million additions in 2018, and the $1.7 million additions in 2017. A number of private development projects resulted in the addition of $898,084 in donated capital assets in 2019, and $213,122 in 2018.
Additional information on the District’s capital assets can be found in Note 3, Capital Assets, of the notes to the basic financial statements.
Debt Administration
The District continues to meet its debt obligations under its 2010 Refunded Certificates of Participation (COPs) and the 2012 Revenue Refunding bonds. Through scheduled debt service payments, principal on its collective debt was reduced by $644,819 during 2019, and by $619,820 during 2018. The District’s total debt from its COP and bond issuances now stands at approximately $2.4 million.
Total compensated absences (long-term liability and current portion combined), are composed of leave hours earned by employees that are payable upon termination or
8

CITRUS HEIGHTS WATER DISTRICT Management’s Discussion and Analysis
For the Fiscal Year Ended December 31, 2019 and 2018
retirement and are valued at $444,651 at the end of 2019, a decrease from the 2018 year-end amount of $463,089. This decrease was due to a change in leave policies that reduced the amount of management, vacation, and compensated time off leave balances that could be carried forward to the next year. From 2017 to 2018, compensated absences increased by $84,750. This increase was due primarily to higher rates of leave due to seniority and multiple employees becoming eligible for sick leave payouts.
The liability for other post-employment benefits (OPEB) increased by $58,314 to 1.5 million in 2019; as a result of the annual cost of these benefits exceeding the amounts paid for premiums. OPEB liability increased by $560,741 in 2018 due to the implementation of GASB 75. The District began prefunding its OPEB liability in 2018; if it hadn’t done so, the increasewould have been $1.2 million.
Additional information on the District’s debt activity can be found in Note 4, Long-Term Liabilities, of the notes to the basic financial statements.
ECONOMIC FACTORS AND FUTURE BUDGET CONSIDERATIONS
The District continued to exercise fiscal restraint in budgeting for District operations in 2020, with an overall increase of 4.8% percent compared with the 2019 Operating Budget. This budget includes:
Maintaining the current level of services and programs for District customers;
$2.0 million in Professional Services, including many Strategic Planning and SpecialProject items, including the Project 2030 Study, Water Meter Replacement Program, ASRStudy, organizational development, District policy review/updates, review of easements,annexations, website redesign and water supply agreement.
$482,187 increase in Salary and Benefits, which includes: Accelerated payoffs of theCalPERS pension Unfunded Actuarial Liability (UAL) and the OPEB UAL; 11% increasein the CalPERS employer contribution rate (due to factors such as the lowering of theassumed rate of return on CalPERS’ portfolio); 4.5%, for merit and cost of livingadjustments; and, 0.8% increase is attributable to the addition of the proposed WaterDistribution Operator position.
Designated Reserve transfers include: $1,000,000 transfer to the Water Supply Reservebased upon projected revenue in order to begin setting aside funds for the anticipatedfuture construction of new wells for the District, and $200,000 transfer to the Water MeterReplacement Reserves for accrual of funds toward Meter Replacements at the end oftheir useful life, projected to start in 2025.
A 2019 Operating Budget Summary is included at the conclusion of this Management’s Discussion and Analysis to provide an overview of the District’s operating budget.
The District plans to rebuild its financial reserves to a level that supports a higher level of capital investment from reserves. Total capital improvement expenditures budgeted for
9

CITRUS HEIGHTS WATER DISTRICT Management’s Discussion and Analysis
For the Fiscal Year Ended December 31, 2019 and 2018
FY2020 are about $5.7 million compared with $4.3 million in FY2019. This amount includes about $2.6 million in carry-over projects from prior years, and about $3.1 million in new projects for FY2020. Installation of new fire hydrants, as well as replacements and upgrades for $160,000, six water main replacement or installation projects, scheduled to start design, will be undertaken in 2020 with construction targeted for 2021, as well as six projects scheduled to start construction at a total cost of $2.1 million. Operations equipment replacements and new equipment purchases totaling $380,000 are planned for 2020.
A 2020 Capital Improvement Budget Summary is included at the conclusion of this Management’s Discussion and Analysis to provide an overview of the District’s capital improvement budget.
A significant but declining portion of the District’s budget continues to be the repayment of long-term debt financing in the form of Certificates of Participation originally issued in 2000 (refunded in 2010) and Certificates of Participation originally issued in 2003 (refunded as Revenue Refunding Bonds in 2012). The annual debt service for these two issuances is budgeted at $635,000 for FY2020.
The District’s Board of Directors levied a water rate increase designed to achieve an overall increase in water rate revenues of 3 percent for 2019. The District has implemented a detailed cost-of-service and financial plan study to determine the increase, taking into consideration the statewide water mandates, capital improvement program, and water meter reserves. The increase in revenues resulting from the FY2020 water rates will provide additional revenue to offset rising operating costs and the increasing costs of reinvestment in the District’s aging water transmission and distribution infrastructure.
The District anticipates the need to consider future annual water rate increases to fund replacement of portions of the District’s 250 miles of underground water mains, and to pay the continually-rising operating costs of the District, while maintaining financial reserves to comply with debt covenants and to provide funds for emergencies or catastrophic losses. However, water rates for years beyond FY2021 have not been adopted by the Board of Directors. District Staff worked with Raftelis Financial Consultants to create and implement a new financial plan, which was completed and presented to the Board in 2019.
10

CITRUS HEIGHTS WATER DISTRICT Management’s Discussion and Analysis
For the Fiscal Year Ended December 31, 2019 and 2018
CITRUS HEIGHTS WATER DISTRICT ADOPTED BUDGET
2017 Actual 2018 Actual2019 Adopted
Budget2019 Projected
2020 AdoptedBudget
Operating & Maintenance Budget
Operations & Maintenance 1,978,192$ 3,061,429$ 4,776,093$ 3,418,265$ 5,181,816$
Purchased Water 2,190,061$ 2,872,679$ 3,444,647$ 3,200,000$ 3,122,550$
Salary & Benefits 3,071,341$ 4,327,336$ 4,850,319$ 4,831,703$ 5,332,506$
Total Expense 7,239,594$ 10,261,444$ 13,071,059$ 11,449,967$ 13,636,872$
Contribution to Reserves Budget
Total Budgeted Contribution to Reserves 575,000$ 1,760,000$ 666,000$ 666,000$ 1,200,000$
Capital Improvement Program BudgetCapital Improvement Program Budget (Funded
through CIP Reserve) 2,090,087$ 3,419,838$ 6,204,462$ 3,613,998$ 5,746,141$
11

CITRUS HEIGHTS WATER DISTRICT Management’s Discussion and Analysis
For the Fiscal Year Ended December 31, 2019 and 2018
CITRUS HEIGHTS WATER DISTRICT ADOPTED CAPITAL PROJECTS BUDGET
Project
NumberDescription
2019
Adopted
Budget
Project
Expenses
Prior Years
2019
Projected
Expense
2020
Proposed
Expense
Adopted Project
Budget
through 2020
2020 Project
Budget
Amendment
Request
C15‐104B Document Management System 250,000 5,361 239,278 250,000 ‐
C15‐109 Blossom Hill Way 6" x 10" Interconnection w/ RV 27,777 ‐ 27,777 27,777 ‐
C15‐110 Crestmont Avenue 6" Interconnection w/ RV 24,288 24,288 24,288 ‐
C16‐134 Auburn Blvd ‐ Rusch Park to Placer County Line 10,000 609 9,391 10,000 ‐
C17‐102 Michigan Dr ‐ Sunrise to West 285,022 12,963 38,039 346,895 397,897 112,875
C17‐104 Groundwater Well Property Acquisition (# 7, 8, 9 & 10) 890,000 208,136 530,030 151,834 890,000 ‐
C18‐103 Cologne Way 220,471 267 44,461 222,341 267,069 46,598
C19‐003 Annual Fleet Improvements/Replacements 295,000 50,000 245,000 295,000 ‐
C19‐101 Robie Way 8" Main Replacement Project 26,846 26,846 314,536 341,382 314,536
C19‐104 Admiral Avenue Water Main Replacement 30,310 30,310 261,129 291,439 261,129
C19‐105 Whyte Avenue and Langley Avenue Water Main Replacement 83,235 83,235 659,420 742,655 659,420
C19‐106 Wells Avenue 8‐inch (San Juan to Wells) 22,460 22,460 22,460 ‐
C19‐107 Rowan Way 8" & 6" Water Main at Grady Drive 28,419 28,419 90,676 119,095 90,676
C19‐108 6230 Sylvan Road ‐ East Wall 250,000 5,000 45,000 50,000 (200,000)
C18‐106 Groundwater Well #7 ‐ Design & Construction ‐ ‐ ‐ ‐
Encumbered Projects Total 2,443,828 227,336 858,800 2,637,565 3,729,062 1,285,234
C20‐003 Annual Fleet and Field Operations Equipment 295,000 295,000 380,000 380,000
C20‐004 Annual Technology Hardware and Software 10,000 10,000 55,000 55,000
C20‐005 Annual Facilities Improvements 140,000 140,000 100,000 100,000
C20‐010 Annual Water Main Pipeline Replacements (small) 66,843 66,843 70,000 70,000
C20‐011 Annual Valve Replacements 148,540 80,000 100,000 100,000
C20‐012 Annual Water Service Connections 957,700 800,000 850,000 850,000
C20‐013 Annual Water Meter Replacements 129,086 129,086 100,000 100,000
C20‐014 Annual Fire Hydrants ‐ Repl, Upgrades, Infill, New 159,150 120,000 160,000 160,000
C20‐020 Annual Groundwater Well Improvements 175,000 120,000 150,000 150,000
C20‐040 Other City Partnership Opportunities 100,000 100,000 150,000 150,000
C20‐041 Other Misc Infrastructure Projects 50,000 50,000 110,000 110,000
2,231,319 ‐ 1,910,929 2,225,000 2,225,000 ‐
C20‐101 Fair Oaks Boulevard 56,439 56,439
C20‐102 Langley Avenue and Chance Drive 67,019 67,019
C20 Marsala Court 7,482 7,482
C20 Skycrest School 13,765 13,765
C20 Walnut Drive 17,133 17,133
C20 Wisconsin Drive 33,238 33,238
WS20‐1 Water Supply Project Design and Construction of Well 563,500 563,500
C20 Pre‐Architectural Study Corporation Yard/Master Plan 100,000 100,000
C20 Plans, Specifications, & Estimate for Preferred Alt ‐ Corp Yard 25,000 25,000
‐ ‐ 883,576 883,576
Totals 4,675,147 858,800 5,746,141 6,837,638 1,285,234
Summary Total Budget
Prior Years Carry‐Over Capital Project Total 2,443,828
Plus:
Prior Years Projects Amendment Approval/(Savings) 1,285,234
2020 New Annual Capital Project Total 2,225,000
2020 New Capital Project Total 883,576
2020 Capital Project Total Budget Request 4,393,810
Total CIP Budget 6,837,638$
1 Prior Year Annual Projects are inlcuded for comparison purposes only as
Annual Projects are completed on an annual basis
2020 New Annual Capital Total 1
2020 New Projects Total Budget
12

13

Basic Financial Statements
14

CITRUS HEIGHTS WATER DISTRICTBALANCE SHEETS
DECEMBER 31, 2019 AND 2018
2019 2018ASSETS
CURRENT ASSETSCash and investments (Note 2) $14,461,764 $13,050,305Restricted - cash and investments (Note 2) 542,660 541,475 Accounts receivable, net 2,701,846 2,374,296 Due from other governments 199,973 398,292 Accrued interest receivable 41,599 42,558 Inventory 341,180 284,027 Prepaid expenses and other deposits 512,742 459,116
Total current assets 18,801,764 17,150,069
NON-CURRENT ASSETSNon-depreciable capital assets (Note 3) 1,577,867 1,408,284 Depreciable capital assets, net (Note 3) 58,062,577 56,701,159
Total non-current assets 59,640,444 58,109,443
TOTAL ASSETS 78,442,208 75,259,512
Deferred amount from refunding debt 9,788 22,839 Pension related (Note 7) 1,915,695 2,529,491 OPEB related (Note 8) 188,276 122,527
2,113,759 2,674,857
TOTAL ASSETS AND DEFERRED OUTFLOWS OF RESOURCES $80,555,967 $77,934,369
LIABILITIES
CURRENT LIABILITIESAccounts payable $697,792 $568,947Retentions payable 37,883 - Accrued payroll 116,071 92,439 Accrued interest payable 46,342 52,344 Deposits payable 395,166 384,835 Compensated absences (Note 4) 367,594 263,556 Long-term debt (Note 4) 635,000 610,000
Total current liabilities 2,295,848 1,972,121
NON-CURRENT LIABILITIESCompensated absences (Note 4) 77,057 199,533 Long-term debt (Note 4) 1,798,208 2,468,027 Net pension liability (Note 7) 4,611,042 4,399,273 Net OPEB liability (Note 8) 1,459,582 1,401,268
Total non-current liabilities 7,945,889 8,468,101
TOTAL LIABILITIES 10,241,737 10,440,222
Deferred amount from refunding debt 23,872 25,197 Pension related (Note 7) 337,348 180,785
361,220 205,982
NET POSITION (Note 6)Net investment in capital assets 57,193,152 55,029,058 Restricted for debt service 542,660 541,475 Unrestricted 12,217,198 11,717,632
TOTAL NET POSITION 69,953,010 67,288,165
TOTAL LIABILITIES, DEFERRED INFLOWS OF RESOURCES AND NET POSITION $80,555,967 $77,934,369
See accompanying notes to financial statements
DEFERRED OUTFLOWS OF RESOURCES
DEFERRED INFLOWS OF RESOURCES
TOTAL DEFERRED INFLOWS OF RESOURCES
TOTAL DEFERRED OUTFLOWS OF RESOURCES
15

CITRUS HEIGHTS WATER DISTRICTSTATEMENTS OF REVENUES, EXPENSES AND CHANGES IN NET POSITION
FOR THE YEARS ENDED DECEMBER 31, 2019 AND 2018
2019 2018OPERATING REVENUES
Water sales $14,823,207 $14,119,865Connection and other fees 517,269 255,179
Total operating revenues 15,340,476 14,375,044
OPERATING EXPENSES
Customer service, administration and general 4,371,420 3,228,919 Water purchases 3,131,903 2,878,799 Transmission and distribution 2,425,827 2,142,451 Pumping and well maintenance 683,432 717,562 Conservation 617,732 563,708 Depreciation and amortization 2,435,900 2,388,634
Total operating expenses 13,666,214 11,920,073
OPERATING INCOME 1,674,262 2,454,971
NONOPERATING REVENUES (EXPENSES)
Investment income 214,962 159,437 Miscellaneous income 69,322 107,546 Groundwater transfers and sales 38,316 347,583 Interest expense (124,346) (147,540) (Loss) gain on disposal of capital assets (105,755) (164,842)
Total nonoperating revenues (expenses) 92,499 302,184
Net income (loss) before capital contributions 1,766,761 2,757,155
CAPITAL CONTRIBUTIONSCapital contributions 898,084 213,121
Total capital contributions 898,084 213,121
CHANGES IN NET POSITION 2,664,845 2,970,276
NET POSITION, BEGINNING OF YEAR, AS RESTATED (NOTE 6) 67,288,165 64,317,889
NET POSITION, END OF YEAR $69,953,010 $67,288,165
See accompanying notes to financial statements
16

CITRUS HEIGHTS WATER DISTRICTSTATEMENTS OF CASH FLOWS
FOR THE YEARS ENDED DECEMBER 31, 2019 AND 2018
2019 2018CASH FLOWS FROM OPERATING ACTIVITIES
Cash receipts from customers $15,050,809 $14,356,677Cash paid to suppliers for goods and services (7,881,654) (6,712,978)Cash paid to employees for services (2,129,372) (3,082,301)
Cash Flows from Operating Activities 5,039,783 4,561,398
CASH FLOWS FROM NONCAPITAL FINANCING ACTIVITIESReceipts from miscellaneous non operating income 69,322 107,546Receipts from groundwater transfers and sales 38,316 347,583
Cash Flows from Noncapital Financing Activities 107,638 455,129
CASH FLOWS FROM CAPITAL AND RELATED FINANCING ACTIVITIES Acquisition and construction of capital assets (3,174,572) (3,410,898)Principal payments on long-term debt (644,819) (619,820)Interest payments on long-term debt (130,348) (148,183)
Cash Flows (used for) Capital and Related Financing Activities (3,949,739) (4,178,901)
CASH FLOWS FROM INVESTING ACTIVITIESInterest earnings 214,962 159,437
Cash Flows from Investing Activities 214,962 159,437
NET CASH FLOWS 1,412,644 997,063
Cash, beginning of year 13,591,780 12,594,717
Cash, end of year $15,004,424 $13,591,780
Reconciliation of cash and cash equivalents to statement of net position:Cash and cash equivalents $14,461,764 $13,050,305Restricted - cash and cash equivalents 542,660 541,475
Total cash and cash equivalents $15,004,424 $13,591,780
(Continued)
17

CITRUS HEIGHTS WATER DISTRICTSTATEMENTS OF CASH FLOWS
FOR THE YEARS ENDED DECEMBER 31, 2019 AND 2018
RECONCILIATION OF NET INCOME FROM OPERATIONS TONET CASH PROVIDED BY OPERATING ACTIVITIES: 2019 2018
Net income from operations $1,674,262 $2,454,971
Adjustments to reconcile operating income to net cash provided by operating activities:Depreciation and amortization 2,435,900 2,388,634Change in assets and liabilities:
(Increase) decrease in assets and deferred outflows of resources: Accounts receivable (327,550) 58,246Inventory (57,153) (48,560)Prepaid expenses and other assets 145,652 86,131Deferred amount from refunding of debt 13,051 13,050
Increase (decrease) in liabilities and deferred inflows of resources:Accounts payable 128,845 (101,383)Accrued payroll 23,632 26,963Deposits payable 10,331 10,535Retentions payable 37,883 (76,613)Compensated absences (18,438) 84,750Deferred amount from refunding of debt (1,325) (1,325)Net pension liability and related deferred inflows and outflows 982,128 (321,019)Total OPEB liability and related deferred inflows and outflows (7,435) (12,982)
Net cash provided by operating activities $5,039,783 $4,561,398
SUPPLEMENTAL DISCLOSURE OF NON-CASH ACTIVITIESReceipt of contributed assets $898,084 $213,121
See accompanying notes to financial statements
18

Notes to the Basic Financial Statements
19
CITRUS HEIGHTS WATER DISTRICT NOTES TO BASIC FINANCIAL STATEMENTS For the Years Ended December 31, 2019 and 2018
NOTE 1 – REPORTING ENTITY AND SUMMARY OF SIGNIFICANT ACCOUNTING POLICIES
Reporting Entity: The District was established on October 25, 1920 as an irrigation district under Division 11 of the Act of Legislature of the State of California. The District constructs and maintains waterworks and supplies domestic water in an area of approximately 12 square miles to about 19,900 connections in Sacramento and Placer counties with an estimated population of 66,000. The District is governed by a Board of Directors consisting of three directors elected by residents of the District. The accompanying basic financial statements present the District and its component unit. The component unit discussed below is included in the District’s reporting entity because of the significance of its operational and financial relationship with the District.
The District has created the Citrus Heights Water District Financing Corporation (the Corporation) to provide assistance to the District in the issuance of debt. Although legally separate from the District, the Corporation is reported as if it were part of the primary government because it shares a common Board of Directors with the District and its sole purpose is to provide financing to the District under the debt issuance documents of the District. Debt issued by the Corporation is reflected as debt of the District in these financial statements. The Corporation has no other transactions and does not issue separate financial statements.
Basis of Presentation – Fund Accounting: The basic financial statements of the Citrus Heights Water District (District) have been prepared in conformity with generally accepted accounting principles as applied to government units. The Governmental Accounting Standards Board (GASB) is the accepted standard setting body for establishing governmental accounting and financial reporting principles. The District is accounted for as an enterprise fund and applies all applicable GASB pronouncements in its accounting and reporting. The more significant of the District’s accounting policies are described below.
The District’s resources are allocated to and accounted for in these basic financial statements as an enterprise fund type of the proprietary fund group. The enterprise fund is used to account for operations that are financed and operated in a manner similar to private business enterprises, where the intent of the governing body is that the costs (expenses, including depreciation) of providing goods or services to the general public on a continuing basis be financed or recovered primarily through user charges, or where the governing body has decided that periodic determination of revenues earned, expenses incurred, and/or net income is appropriate for capital maintenance, public policy, management control, accountability, or other policies. Net position for the enterprise fund represents the amount available for future operations.
Basis of Accounting: The accounting and financial reporting treatment applied to a fund is determined by its measurement focus. The enterprise fund type is accounted for on a flow of economic resources measurement focus. With this measurement focus, all assets, deferred outflows, liabilities, and deferred inflows associated with the operation of this fund are included on the balance sheet. Net position is segregated into amounts invested in capital assets, net of related debt, amounts restricted and amounts unrestricted. Enterprise fund type operating statements present increases (i.e., revenues) and decreases (i.e., expenses) in net total position.
The District uses the accrual basis of accounting. Under this method, revenues are recorded when earned and expenses are recorded at the time liabilities are incurred. When such funds are received they are recorded as unearned revenue until earned. Earned but unbilled water services are accrued as revenue.
Water lines are constructed by private developers and then dedicated to the District, which is then responsible for their future maintenance. These lines are recorded as capital contributions when they pass inspection by the District, and the estimated costs are capitalized as donated pipelines.
20
CITRUS HEIGHTS WATER DISTRICT NOTES TO BASIC FINANCIAL STATEMENTS For the Years Ended December 31, 2019 and 2018
NOTE 1 – REPORTING ENTITY AND SUMMARY OF SIGNIFICANT ACCOUNTING POLICIES (Continued)
Operating revenues and expenses consist of those revenues and expenses that result from the ongoing principal operations of the District. Operating revenues consist primarily of charges for services. Nonoperating revenues and expenses consist of those revenues and expenses that are related to financing and investing types of activities and result from nonexchange transactions or ancillary activities.
When both restricted and unrestricted resources are available for use, it is the District’s policy to use restricted resources first, then unrestricted resources as they are needed.
Use of Estimates: The preparation of financial statements in conformity with generally accepted accounting principles requires management to make estimates and assumptions that affect the reported amounts of assets and liabilities and disclosure of contingent assets and liabilities at the date of the financial statements and the reported amounts of revenues and expenses during the reporting period. Actual results could differ from those estimates.
Fair Value Measurements: Fair value is defined as the price that would be received to sell an asset or paid to transfer a liability in an orderly transaction between market participants at the measurement date. The District categorizes its fair value measurements within the fair value hierarchy established by generally accepted accounting principles. The fair value hierarchy categorizes the inputs to valuation techniques used to measure fair value into three levels based on the extent to which inputs used in measuring fair value are observable in the market.
Level 1 inputs are quoted prices (unadjusted) in active markets for identical assets or liabilities.
Level 2 inputs are inputs – other than quoted prices included within level 1 – that are observable for an asset or liability, either directly or indirectly.
Level 3 inputs are unobservable inputs for an asset or liability.
If the fair value of an asset or liability is measured using inputs from more than one level of the fair value hierarchy, the measurement is considered to be based on the lowest priority level input that is significant to the entire measurement.
Cash and Cash Equivalents: For purposes of the statement of cash flows, the District considers all highly liquid debt instruments purchased with a maturity of three months or less to be cash equivalents. Cash and cash equivalents held include bank deposits and restricted and unrestricted investments in money market mutual funds and LAIF.
Restricted Assets: Certain proceeds of the District’s long-term debt are classified as restricted investments on the balance sheet because their use is limited by applicable debt covenants.
Investments: Investments are stated at their fair value, which represents the quoted or stated market value. Investments that are not traded on a market, such as investments in external pools, are valued based on the stated fair value as represented by the external pool.
21

CITRUS HEIGHTS WATER DISTRICT NOTES TO BASIC FINANCIAL STATEMENTS For the Years Ended December 31, 2019 and 2018
NOTE 1 – REPORTING ENTITY AND SUMMARY OF SIGNIFICANT ACCOUNTING POLICIES (Continued)
Inventory: Inventory consists primarily of materials used in the construction and maintenance of the water distribution facilities and is valued on a first-in, first-out basis.
Prepaids: Prepaids consist primarily of insurance, maintenance agreements and other prepaid assets.
Capital Assets: Capital assets are recorded at historical cost. Donated capital assets, works for art and similar items, and capital assets received in a service concession arrangement are reported at acquisition value rather than fair value. Self-constructed assets are recorded based on the amount of direct labor, material, and certain overhead charged to the asset construction. Depreciation is calculated using the straight-line method over the following estimated useful lives:
Useful Description Life
Pipeline and infrastructure 20 - 40 yearsEquipment and machinery 5 - 10 yearsBuildings 15 - 40 yearsWell improvements 40 yearsDonated pipelines 40 yearsImprovements 40 years
Depreciation expense aggregated $2,415,482 and $2,369,215 for the years ended December 31, 2019 and 2018, respectively, and is included with depreciation and amortization expense.
Maintenance and repairs are charged to operations when incurred. It is the District’s policy to capitalize all capital assets with a cost of more than $5,000 for tangible personal property and $15,000 for infrastructure, building or improvements. Costs of assets sold or retired (and the related amounts of accumulated depreciation) are eliminated from the balance sheet in the year of sale or retirement, and the resulting gain or loss is recognized in operations.
Bond Premiums and Bond Issuance Costs: Bond premiums are deferred and amortized over the lives of the bonds. Long-term liabilities are reported net of the applicable bond premiums. Bond issuance costs are recognized as an expense in the period incurred.
Deferred Amount from Refunding Debt: The difference between the reacquisition price of refunded debt and the net carrying amount of the previously outstanding debt is deferred and reported as either a deferred outflow or deferred inflow on the balance sheet. These amounts are amortized over the shorter of the term of the old debt or the new debt.
Deferred Outflows: In addition to assets, the balance sheet reports a separate section for deferred outflows of resources. This separate financial statement element, deferred outflows of resources, represents a consumption of net position or fund balance that applies to a future period(s) and so will not be recognized as an outflow of resources (expense/expenditure) until then.
22

CITRUS HEIGHTS WATER DISTRICT NOTES TO BASIC FINANCIAL STATEMENTS For the Years Ended December 31, 2019 and 2018
NOTE 1 – REPORTING ENTITY AND SUMMARY OF SIGNIFICANT ACCOUNTING POLICIES (Continued)
Deferred Inflows: In addition to liabilities, the balance sheet reports a separate section for deferred inflows of resources. This separate financial statement element, deferred inflows of resources, represents an acquisition of net position or fund balance that applies to a future period(s) and so will not be recognized as an inflow of resources (revenue) until that time.
Compensated Absences: The District’s policy allows employees to accumulate earned but unused annual leave, management leave and compensatory time-off which will be paid to employees upon separation from service to the District. The cost of annual leave, management leave and compensatory time-off is recognized in the period earned.
Upon death while employed by the District or retirement from the District, employees are paid one-third of their accumulated sick leave time. This amount is also recognized in the period earned.
A. New Pronouncements
Management adopted the provisions of the following Governmental Accounting Standards Board (GASB) Statements, which became effective during the year ended December 31, 2019:
GASB Statement No. 84, Fiduciary Activities (GASB Statement No. 84), improves guidance regarding the identification of fiduciary activities for accounting and financial reporting purposes and how those activities should be reported. The statement establishes criteria for identifying fiduciary activities of all state and local governments. It also provides for recognition of a liability to the beneficiaries in a fiduciary fund when an event has occurred that compels the government to disburse fiduciary resources. GASB Statement No. 84 is effective for the District’s fiscal year ending December 31, 2019. The District has elected to early adopt the provisions of Statement No. 84 by retroactively restating financial statements for the year ending December 31, 2018. As a result, the previously reported Fiduciary Fund for Other Post-Employment Benefit Trust Fund is no longer reported as part of the District’s financial statements.
NOTE 2 – CASH AND INVESTMENTS
Cash and investments as of December 31 are classified in the accompanying financial statements as follows:
2019 2018Cash and investments $14,461,764 $13,050,305Restricted cash and investments 542,660 541,475
Total cash and investments $15,004,424 $13,591,780
23
CITRUS HEIGHTS WATER DISTRICT NOTES TO BASIC FINANCIAL STATEMENTS For the Years Ended December 31, 2019 and 2018
NOTE 2 – CASH AND INVESTMENTS (Continued)
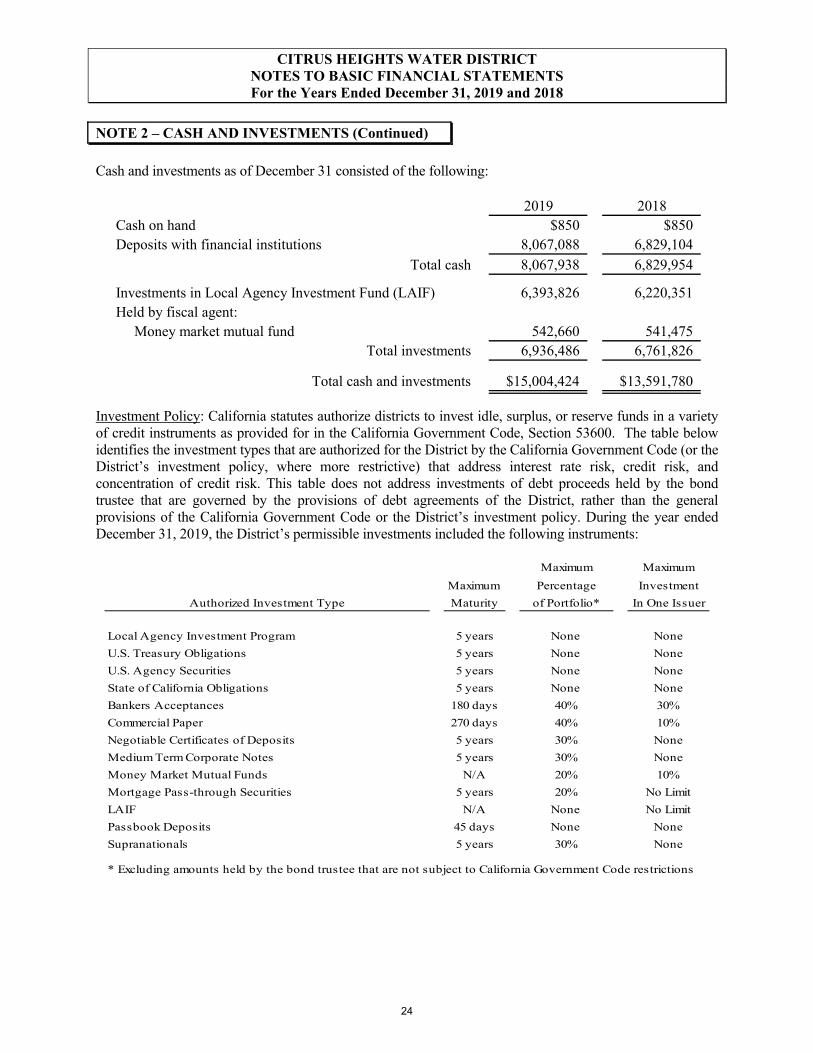
Cash and investments as of December 31 consisted of the following:
2019 2018Cash on hand $850 $850Deposits with financial institutions 8,067,088 6,829,104
Total cash 8,067,938 6,829,954
Investments in Local Agency Investment Fund (LAIF) 6,393,826 6,220,351 Held by fiscal agent: Money market mutual fund 542,660 541,475
Total investments 6,936,486 6,761,826
Total cash and investments $15,004,424 $13,591,780
Investment Policy: California statutes authorize districts to invest idle, surplus, or reserve funds in a variety of credit instruments as provided for in the California Government Code, Section 53600. The table below identifies the investment types that are authorized for the District by the California Government Code (or the District’s investment policy, where more restrictive) that address interest rate risk, credit risk, and concentration of credit risk. This table does not address investments of debt proceeds held by the bond trustee that are governed by the provisions of debt agreements of the District, rather than the general provisions of the California Government Code or the District’s investment policy. During the year ended December 31, 2019, the District’s permissible investments included the following instruments:
Maximum Maximum
Maximum Percentage Investment
Authorized Investment Type Maturity of Portfolio* In One Issuer
Local Agency Investment Program 5 years None None
U.S. Treasury Obligations 5 years None None
U.S. Agency Securities 5 years None None
State of California Obligations 5 years None None
Bankers Acceptances 180 days 40% 30%
Commercial Paper 270 days 40% 10%
Negotiable Certificates of Deposits 5 years 30% None
Medium Term Corporate Notes 5 years 30% None
Money Market Mutual Funds N/A 20% 10%
Mortgage Pass-through Securities 5 years 20% No Limit
LAIF N/A None No Limit
Passbook Deposits 45 days None None
Supranationals 5 years 30% None
* Excluding amounts held by the bond trustee that are not subject to California Government Code restrictions
24

CITRUS HEIGHTS WATER DISTRICT NOTES TO BASIC FINANCIAL STATEMENTS For the Years Ended December 31, 2019 and 2018
NOTE 2 – CASH AND INVESTMENTS (Continued)
The District complied with the provisions of the California Government Code (or the District’s investment policy, where more restrictive) pertaining to the types of investments held, the institutions in which deposits were made, and the security requirements. The District will continue to monitor compliance with applicable statutes pertaining to public deposits and investments.
Investments Authorized by Debt Agreements: Investment of debt proceeds held by the bond trustee are governed by provisions of the debt agreements, rather than the general provisions of the California Government Code or the District’s investment policy. The Certificates of Participation debt agreements contain certain provisions that address interest rate risk and credit risk, but not concentration of credit risk.
Maximum Maximum
Maximum Percentage Investment
Authorized Investment Type Maturity of Portfolio in One Issuer
Local Agency Investment Program None None None
U.S. Treasury Obligations None None None
U.S. Agency Securities None None None
Bankers Acceptances 1 year None None
Commercial Paper None None None
Negotiable Certificates of Deposits None None None
Investment Agreements None None None
Repurchase Agreements None None None
Money Market Mutual Funds N/A None None
LAIF N/A None None
Fair Value Hierarchy: The District categorizes its fair value measurements within the fair value hierarchy established by generally accepted accounting principles. The hierarchy is based on the valuation inputs used to measure fair value of the assets. Level 1 inputs are quoted prices in an active market for identical assets; Level 2 inputs are significant other observable inputs; and Level 3 inputs are significant unobservable inputs.
25

CITRUS HEIGHTS WATER DISTRICT NOTES TO BASIC FINANCIAL STATEMENTS For the Years Ended December 31, 2019 and 2018
NOTE 2 – CASH AND INVESTMENTS (Continued)
The following is a summary of the fair value hierarchy of the fair value of investments of the District as of December 31, 2019:
Level 1 Total
Investments by Fair Value Level:
Money Market Mutual Fund $542,660 $542,660
Total Investments $542,660 542,660
Investments Measured at Amortized Cost:
Money Market Mutual Fund 542,971
Cash in banks and on hand 7,524,967
Total Cash and Investments subject to Fair Value Hierarchy 8,610,598
Investments not subject to Fair Value Hierarchy
California Local Agency Investment Fund (LAIF) 6,393,826
Total Cash and Investments $15,004,424
The following is a summary of the fair value hierarchy of the fair value of investments of the District as of December 31, 2018:
Level 1 Total
Investments by Fair Value Level:
Money Market Mutual Fund $541,475 $541,475
Total Investments $541,475 541,475
Investments Measured at Amortized Cost:
Money Market Mutual Fund 535,431
Cash in banks and on hand 6,294,523
Total Cash and Investments subject to Fair Value Hierarchy 7,371,429
Investments not subject to Fair Value Hierarchy
California Local Agency Investment Fund (LAIF) 6,220,351
Total Cash and Investments $13,591,780
26

CITRUS HEIGHTS WATER DISTRICT NOTES TO BASIC FINANCIAL STATEMENTS For the Years Ended December 31, 2019 and 2018
NOTE 2 – CASH AND INVESTMENTS (Continued)
Interest Rate Risk: Interest rate risk is the risk that changes in market interest rates will adversely affect the fair value of an investment. Generally, the longer the maturity of an investment, the greater the sensitivity of its fair value to changes in market interest rates. One of the ways the District manages its exposure to interest rate risk is by purchasing a combination of shorter term and longer term investments, and by timing cash flows from maturities so that a portion of the portfolio is maturing, or coming close to maturity, evenly over time, as necessary to provide the cash flow and liquidity needed for operations. All of the District’s investments mature in 12 months or less.
Credit Risk: Generally, credit risk is the risk that an issuer of an investment will not fulfill its obligation to the holder of the investment. This is measured by the assignment of a rating by a nationally recognized statistical rating organization. Presented below is the minimum rating required by (where applicable) the California Government Code, the District’s investment policy, or debt agreements, and the actual rating as of year-end for each investment type for the year ended December 31, 2019.
Minimum Ratings asLegal of Year EndRating AAAm Not Rated Total
LAIF N/A $6,393,826 $6,393,826Held by bond trustee: Money market mutual funds AAAm $542,660 542,660
$542,660 $6,393,826 $6,936,486
The following is a summary of the minimum rating required by (where applicable) the California Government Code, the District’s investment policy, or debt agreements, and the actual rating as of year-end for each investment type for the year ended December 31, 2018.
Minimum Ratings asLegal of Year EndRating AAAm Not Rated Total
LAIF N/A $6,220,351 $6,220,351Held by bond trustee: Money market mutual funds AAAm $541,475 541,475
$541,475 $6,220,351 $6,761,826
Concentration of Credit Risk: The investment policy of the District limits the amount that can be invested in any one issuer to the lesser of the amount stipulated by the California Government Code or 5% of total investments, with the exception of U.S. Treasury obligations, U.S. Agency Securities, and LAIF. There are no investments in any one issuer (other than mutual funds and external investment pools) that represent 5% or more of total District investments.
27

CITRUS HEIGHTS WATER DISTRICT NOTES TO BASIC FINANCIAL STATEMENTS For the Years Ended December 31, 2019 and 2018
NOTE 2 – CASH AND INVESTMENTS (Continued)
Custodial Credit Risk: Custodial credit risk for deposits is the risk that, in the event of the failure of a depository financial institution, the District will not be able to recover its deposits or will not be able to recover collateral securities that are in the possession of an outside party. Under California Government Code Section 53651, depending on specific types of eligible securities, a bank must deposit eligible securities posted as collateral with its Agent having a fair value of 105% to 150% of the District’s cash on deposit. All of the District’s deposits are either insured by the Federal Depository Insurance Corporation (FDIC) or collateralized with pledged securities held in the trust department of the financial institutions in the District’s name.
Investment in LAIF: The District is a voluntary participant in the Local Agency Investment Fund (LAIF) that is regulated by California Government Code Section 16429 under the oversight of the Treasurer of the State of California. The District reports its investment in LAIF at the fair value amount provided by LAIF. The balance available for withdrawal is based on the accounting records maintained by LAIF, which are recorded on an amortized cost basis. Included in LAIF’s investment portfolio are collateralized mortgage obligations, mortgage-backed securities, other asset-backed securities, loans to certain state funds, and floating rate securities issued by federal agencies, government-sponsored enterprises, and corporations. At December 31, 2019 and 2018, respectively, these investments matured in an average of 226 and 192 days.
28

CITRUS HEIGHTS WATER DISTRICT NOTES TO BASIC FINANCIAL STATEMENTS For the Years Ended December 31, 2019 and 2018
NOTE 3 – CAPITAL ASSETS
Capital asset activity for the years ended December 31, 2019 and 2018 are as follows:
Balance BalanceDecember 31, 2018 Additions Retirements Transfers December 31, 2019
Capital assets not being depreciated:Land $955,683 $955,683Right of ways 26,080 26,080 Construction in progress 426,521 $3,180,405 ($31,538) ($2,979,284) 596,104
Total capital assets not being depreciated 1,408,284 3,180,405 (31,538) (2,979,284) 1,577,867
Capital assets being depreciated:Improvements 1,079,743 165,319 1,245,062 Pipelines and infrastructure 60,794,063 (260,814) 2,435,921 62,969,170 Equipment and machinery 3,642,871 23,380 (65,400) 270,654 3,871,505 Buildings and improvements 3,889,125 43,262 3,932,387 Well improvements 7,814,290 64,128 7,878,418 Donated pipelines 17,649,248 898,084 (38,816) 18,508,516
Total capital assets being depreciated 94,869,340 921,464 (365,030) 2,979,284 98,405,058
Less accumulated depreciation for:Improvements (41,572) (26,724) (68,296)Pipelines and infrastructure (22,013,708) (1,526,895) 171,956 (23,368,647) Equipment and machinery (2,796,118) (172,232) 53,547 (2,914,803) Buildings and improvements (952,486) (94,400) (1,046,886) Well improvements (1,800,782) (195,117) (1,995,899) Donated pipelines (10,563,515) (408,806) 24,371 (10,947,950)
Total accumulated depreciation (38,168,181) (2,424,174) 249,874 (40,342,481)
Total capital assets being depreciated, net 56,701,159 (1,502,710) (115,156) 2,979,284 58,062,577
Capital Assets, net $58,109,443 $1,677,695 ($146,694) $59,640,444
29
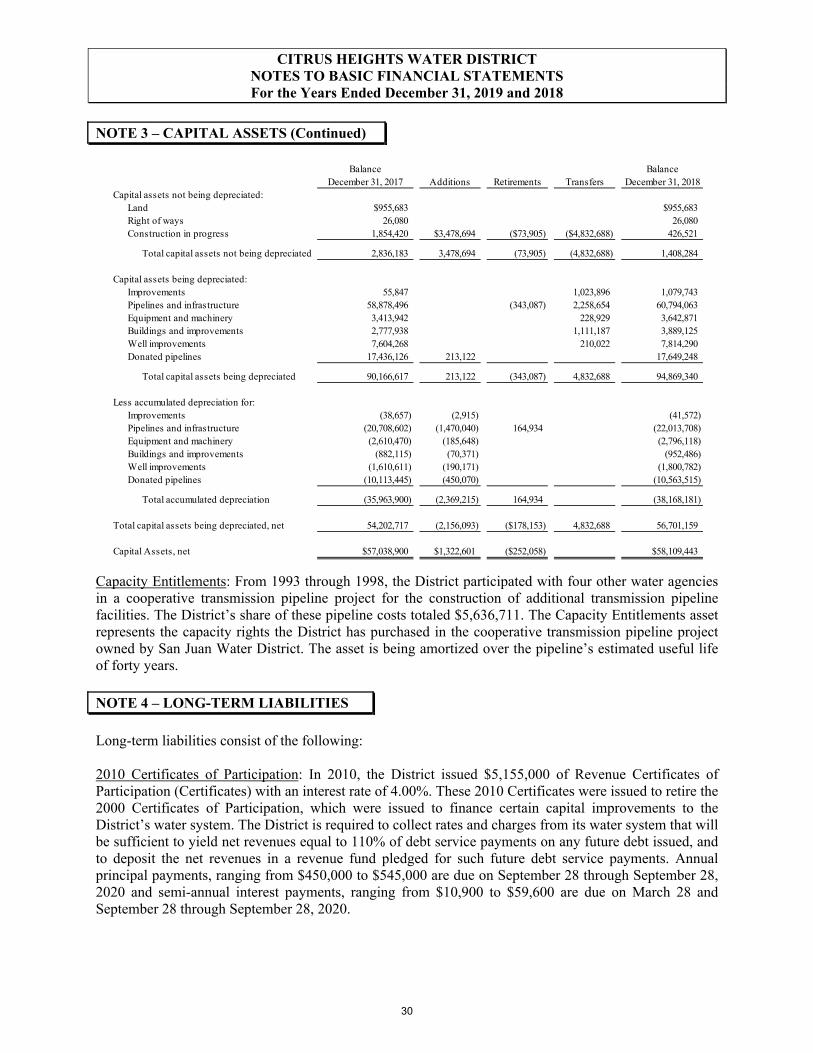
CITRUS HEIGHTS WATER DISTRICT NOTES TO BASIC FINANCIAL STATEMENTS For the Years Ended December 31, 2019 and 2018
NOTE 3 – CAPITAL ASSETS (Continued)
Balance BalanceDecember 31, 2017 Additions Retirements Transfers December 31, 2018
Capital assets not being depreciated:Land $955,683 $955,683Right of ways 26,080 26,080 Construction in progress 1,854,420 $3,478,694 ($73,905) ($4,832,688) 426,521
Total capital assets not being depreciated 2,836,183 3,478,694 (73,905) (4,832,688) 1,408,284
Capital assets being depreciated:Improvements 55,847 1,023,896 1,079,743 Pipelines and infrastructure 58,878,496 (343,087) 2,258,654 60,794,063 Equipment and machinery 3,413,942 228,929 3,642,871 Buildings and improvements 2,777,938 1,111,187 3,889,125 Well improvements 7,604,268 210,022 7,814,290 Donated pipelines 17,436,126 213,122 17,649,248
Total capital assets being depreciated 90,166,617 213,122 (343,087) 4,832,688 94,869,340
Less accumulated depreciation for:Improvements (38,657) (2,915) (41,572)Pipelines and infrastructure (20,708,602) (1,470,040) 164,934 (22,013,708) Equipment and machinery (2,610,470) (185,648) (2,796,118) Buildings and improvements (882,115) (70,371) (952,486)Well improvements (1,610,611) (190,171) (1,800,782) Donated pipelines (10,113,445) (450,070) (10,563,515)
Total accumulated depreciation (35,963,900) (2,369,215) 164,934 (38,168,181)
Total capital assets being depreciated, net 54,202,717 (2,156,093) ($178,153) 4,832,688 56,701,159
Capital Assets, net $57,038,900 $1,322,601 ($252,058) $58,109,443
Capacity Entitlements: From 1993 through 1998, the District participated with four other water agencies in a cooperative transmission pipeline project for the construction of additional transmission pipeline facilities. The District’s share of these pipeline costs totaled $5,636,711. The Capacity Entitlements asset represents the capacity rights the District has purchased in the cooperative transmission pipeline project owned by San Juan Water District. The asset is being amortized over the pipeline’s estimated useful life of forty years.
NOTE 4 – LONG-TERM LIABILITIES
Long-term liabilities consist of the following:
2010 Certificates of Participation: In 2010, the District issued $5,155,000 of Revenue Certificates of Participation (Certificates) with an interest rate of 4.00%. These 2010 Certificates were issued to retire the 2000 Certificates of Participation, which were issued to finance certain capital improvements to the District’s water system. The District is required to collect rates and charges from its water system that will be sufficient to yield net revenues equal to 110% of debt service payments on any future debt issued, and to deposit the net revenues in a revenue fund pledged for such future debt service payments. Annual principal payments, ranging from $450,000 to $545,000 are due on September 28 through September 28, 2020 and semi-annual interest payments, ranging from $10,900 to $59,600 are due on March 28 and September 28 through September 28, 2020.
30

CITRUS HEIGHTS WATER DISTRICT NOTES TO BASIC FINANCIAL STATEMENTS For the Years Ended December 31, 2019 and 2018
NOTE 4 – LONG-TERM LIABILITIES (Continued)
2012 Revenue Refunding Bonds: In April 2012, the District issued $2,275,000 of Revenue Refunding Bonds with interest rates ranging from 3.00% to 5.25%. These 2012 Revenue Refunding Bonds were issued to retire the 2003 Certificates of Participation, which were issued to finance the cost of certain capital improvements to the District’s water system. The District is required to collect rates and charges from its water system that will be sufficient to yield net revenues equal to 110% of debt service payments on any future debt issued, and to deposit the net revenues in a revenue fund pledged for such future debt service payments. Annual principal payments, ranging from $70,000 to $160,000 are due on February 1 through February 1, 2033, and semi-annual interest payments, ranging from $4,200 to $48,600 are due on February 1 and August 1, through February 1, 2033.
The activity of the District’s long-term liabilities during the years ended December 31, 2019 and 2018 was as follows:
Balance Balance Current
December 31, 2018 Additions Retirements December 31, 2019 Portion
2010 Certificates of Participation $1,070,000 ($525,000) $545,000 $545,0004%, due 9/28/20
2012 Revenue Refunding Bonds 1,790,000 (85,000) 1,705,000 90,000 3-5.25%, due 2/1/33
Less: Unamortized premiums 218,027 (34,819) 183,208
3,078,027 (644,819) 2,433,208 635,000
Net pension liability 4,399,273 $211,769 4,611,042Net OPEB liability 1,401,268 100,841 (42,527) 1,459,582Compensated absences 463,089 372,613 (391,051) 444,651 367,594
Total Long-Term Liabilities $9,341,657 $685,223 ($1,078,397) $8,948,483 $1,002,594
December 31, 2017 Balance Current
(as restated) Additions Retirements December 31, 2018 Portion
2010 Certificates of Participation $1,575,000 ($505,000) $1,070,000 $525,0004%, due 9/28/20
2012 Revenue Refunding Bonds 1,870,000 (80,000) 1,790,000 85,0003-5.25%, due 2/1/33
Less: Unamortized premiums 252,847 (34,820) 218,027
3,697,847 (619,820) 3,078,027 610,000
Net pension liability 4,155,588 $243,685 4,399,273Net OPEB liability 1,332,951 189,545 (121,228) 1,401,268Compensated absences 378,339 339,346 (254,596) 463,089 263,556
Total Long-Term Liabilities $9,564,725 $772,576 ($995,644) $9,341,657 $873,556
31

CITRUS HEIGHTS WATER DISTRICT NOTES TO BASIC FINANCIAL STATEMENTS For the Years Ended December 31, 2019 and 2018
NOTE 4 – LONG-TERM LIABILITIES (Continued)
The annual requirements to amortize the outstanding debt as of December 31, 2019 are as follows:
Fiscal Year EndingDecember 31, Principal Interest Total Principal Interest Total
2020 $545,000 $21,800 $566,800 $90,000 $83,588 $173,5882021 95,000 79,088 174,088 2022 100,000 74,338 174,338 2023 105,000 69,338 174,338
2024 110,000 64,088 174,088 2025-2029 605,000 253,200 858,200 2030-2033 600,000 8,400 608,400
Total $545,000 $21,800 $566,800 $1,705,000 $632,038 $2,337,038
2012 Revenue Refunding Bonds2010 Certificates of Participation
Pledged Revenue: The District pledged future water system revenues, net of specified expenses, to repay the 2012 Revenue Refunding Bonds in an original amount of $2,275,000. Proceeds of the Revenue Refunding Bonds were used to refund the 2003 Certificates of Participation to finance capital improvements to the District’s water system. The Revenue Refunding Bonds are payable solely from water customer net revenues, and are payable through February, 2033. Annual principal and interest payments on the Bonds are expected to require less than 80% of net revenues. Total principal and interest remaining to be paid on the Revenue Refunding Bonds was $2,409,225 and $2,580,363 at December 31, 2019 and 2018, respectively.
The District pledged future water system revenues, net of specified expenses, to repay the 2010 Certificates of Participation in the original amount of $5,155,000. Proceeds of the Certificates of Participation funded the acquisition and construction of certain facilities, as indicated above. The Certificates of Participation are payable solely from water customer net revenues and are payable through September 2020. Annual principal and interest payments on the Certificates of Participation are expected to require less than 80% of net revenues. Total principal and interest remaining to be paid on the Certificates of Participation was $566,800 and $1,134,600 at December 31, 2019 and 2018, respectively.
Total principal and interest paid on all debt payable from net revenues was $738,938 and $737,738 and the total water system net revenues were $3,817,978 and $4,958,578 for the years ended December 31, 2019 and 2018, respectively. At December 31, 2019 and 2018, the District’s net revenues were 517% and 672% of debt service payments, respectively.
Events of Default: The 2012 Revenue Refunding Bonds from direct borrowings related to business-type activities, contain events of default that declare the principal of all of the 2012 bonds then outstanding and the interest accrued thereon to be due and payable immediately as specified in the terms of the agreement if any of the following conditions occur: default on debt service payments; the failure of the District to observe or perform the conditions, covenants, or agreement terms of the debt; bankruptcy filing by the District; or if any court or competent jurisdiction shall assume custody or control of the District. There were no such events occurred during the fiscal year ending December 31, 2019.
32

CITRUS HEIGHTS WATER DISTRICT NOTES TO BASIC FINANCIAL STATEMENTS For the Years Ended December 31, 2019 and 2018
NOTE 4 – LONG-TERM LIABILITIES (Continued)
The 2010 Certificates of Participation’s bond covenants contain events of default that declare the entire principal amount of the unpaid Series 2010 Installment Payments and the accrued interest thereon to be due and payable immediately as specified in the terms of the agreement if any of the following conditions occur: default on debt service payments; the failure of the District to observe or perform the conditions, covenants, or agreement terms of the debt; bankruptcy filing by the District; or if any court or competent jurisdiction shall assume custody or control of the District. There were no such events occurred during the fiscal year ending December 31, 2019.
NOTE 5 – ARBITRAGE REBATE LIABILITY
Section 148(f) of the Internal Revenue Code requires issuers of tax-exempt state and local bonds to remit to the federal government amounts equal to (a) the excess of the actual amounts earned on all “Nonpurpose Investments” allocable to “Gross Proceeds” of an issue of municipal obligations less the amount that would have been earned if the investments bore a rate equal to the amount that would have been earned if the investments bore a rate equal to the yield on the issue, plus (b) all income attributable to the excess. Issuers must make rebate payments at least once every five years and upon final retirement or redemption of the bonds. There was no arbitrage liability at December 31, 2019 and 2018.
NOTE 6 – NET POSITION
Restrictions: Restricted net position consist of constraints placed on net asset use through external requirements imposed by creditors (such as through debt covenants), grantors, contributors, or laws and regulations of other governments or constraints by law through constitutional provisions or enabling legislation. Restricted net position at December 31, 2019 and 2018 consisted of the debt service reserve on the 2010 Certificates of Participation. The restrictions represent debt service and other reserves required by the related debt covenants.
Designations: Designations of unrestricted net position may be imposed by the Board of Directors to reflect future spending plans or concerns about the availability of future resources. Designations may be modified, amended or removed by Board action.
The designations are for the following:
Designated for rate stabilization represents the amount to be used to ensure financial and customer rate stability in responding to certain conditions.
Designated for operating reserve is maintained for operating funds collected in advance for the following year, accrued leave reserve, self-insurance reserve, unanticipated operating expenses, unanticipated economic shortfall, and unallocated funds.
Designated for depreciation reserve represents amounts set aside to replace or rehabilitate capital facilities at the end of their useful life.
Designated for capital improvement reserve represents amounts set aside for use in evaluating and constructing new capital facilities to benefit existing District customers. This reserve had a negative balance in past years due to large capital expenditures, including the meter retrofit program and well construction.
33

CITRUS HEIGHTS WATER DISTRICT NOTES TO BASIC FINANCIAL STATEMENTS For the Years Ended December 31, 2019 and 2018
NOTE 6 – NET POSITION (Continued)
Designated for fleet equipment reserve represents amounts set aside to replace fleet equipment at the end of its useful life.
Designated for employment-related benefits reserve represents amounts set aside to pay the costs of employment-related benefits for existing and retired District employees.
Designated for water meter replacement reserve represents amounts set aside for use in evaluating, designing, and replacing or rehabilitating capital facilities pertaining to water meters to benefit existing District customers.
Designated for water supply reserve represents amounts set aside for evaluating, acquiring, and constructing capital facilities related to water supply, such as groundwater production wells, aquifer storage and recovery wells, surface water projects, recycled/reclaimed water projects, and land and right-of-way acquisition.
Net Position Restatements: Management adopted the provisions of the following Governmental Accounting Standards Board (GASB) Statement No. 75, Accounting and Financial Reporting for Postemployment Benefits Other than Pensions (OPEB), which became effective during the year ended December 31, 2018. In June 2015, GASB issued Statement No. 75 and the intention of this Statement is to improve the usefulness of information for decisions made by the various users of the financial reports of governments whose employees – both active employees and inactive employees – are provided with postemployment benefits other than pensions by requiring recognition of the entire net OPEB liability and a more comprehensive measure of OPEB expense.
The implementation of the Statement required the District to make prior period adjustments. As a result, the beginning net position at January 1, 2018 of the Business-Type Activities was restated and reduced by $451,196. See Note 8.
NOTE 7 – DEFINED BENEFIT PENSION PLAN
For purposes of measuring the net pension liability and deferred outflows/inflows of resources related to pensions, and pension expense, information about the fiduciary net position of the Plans and additions to/deductions from the Plans’ fiduciary net position have been determined on the same basis as they are reported by the CalPERS Financial Office. For this purpose, benefit payments (including refunds of employee contributions) are recognized when currently due and payable in accordance with the benefit terms. Investments are reported at fair value.
A. General Information about the Pension Plans
Plan Description and Summary of Balances by Plan – All qualified permanent and probationary employees are eligible to participate in the District’s Miscellaneous (all other) Employee Pension Rate Plan. The District’s Miscellaneous Rate Plan is part of the public agency cost-sharing multiple-employer defined benefit pension plan (PERF C), which is administered by the California Public Employees’ Retirement System (CalPERS). PERF C consists of a miscellaneous pool and a safety pool (also referred to as “risk pools”), which are comprised of individual employer miscellaneous and safety rate plans, respectively. Individual employers may sponsor more than one miscellaneous and safety rate plan. The employer participates in one cost-sharing multiple-employer defined benefit pension plan regardless of the number of rate plans the employer sponsors. The District sponsors one rate plan (miscellaneous).
34

CITRUS HEIGHTS WATER DISTRICT NOTES TO BASIC FINANCIAL STATEMENTS For the Years Ended December 31, 2019 and 2018
NOTE 7 – DEFINED BENEFIT PENSION PLAN (Continued)
Benefit provisions under the Plan are established by State statute and District resolution. CalPERS issues publicly available reports that include a full description of the pension plan regarding benefit provisions, assumptions and membership information that can be found on the CalPERS website.
Below is a summary of the deferred outflows of resources, net pension liabilities, and deferred inflows of resources by Plan for the year ended December 31, 2019:
Net Pension
Liability/
Deferred Proportionate Deferred
Outflows Share of Net Inflows
of Resources Pension Liability of Resources
Miscellaneous $1,915,695 $4,611,042 ($337,348)
Benefits Provided – CalPERS provides service retirement and disability benefits, annual cost of living adjustments and death benefits to plan members, who must be public employees and beneficiaries. Benefits are based on years of credited service, equal to one year of full time employment. All members are eligible for non-duty disability benefits after 10 years of service. The death benefit is one of the following: the Basic Death Benefit, the 1957 Survivor Benefit, or the Optional Settlement 2W Death Benefit. The cost of living adjustments for each plan are applied as specified by the Public Employees’ Retirement Law. The Pension Reform Act of 2013 (PEPRA), Assembly Bill 340, is applicable to employees new to CalPERS and hired after December 31, 2012.
The Plans’ provisions and benefits in effect at December 31, 2019, are summarized as follows:
Miscellaneous Miscellaneous Miscellaneous
Tier 1 Tier 2 PEPRA
Hire date
Prior to January 1, 2013
Prior to January 1, 2013
On or after January 1, 2013
Benefit formula 2.0% @ 55 2.0% @ 55 2.0% @ 62
Benefit vesting schedule 5 years service 5 years service 5 years service
Benefit payments monthly for life monthly for life monthly for life
Retirement age 50 - 63 50 - 63 52 - 67
1.43% to 2.42% 1.43% to 2.42% 1.0% to 2.5%
Required employee contribution rates 6.9% 6.9% 6.8%
Required employer contribution rates 10.2% 9.7% 7.0%
Monthly benefits, as a % of eligible compensation
Beginning in fiscal year 2017, CalPERS collects employer contributions for the cost-sharing plan as a percentage of payroll for the normal cost portion as noted in the rates above and as a dollar amount for contributions toward the unfunded liability and side fund. The dollar amounts are billed on a monthly basis. The District’s required contribution for the unfunded liability was $361,091 in fiscal year 2019.
35

CITRUS HEIGHTS WATER DISTRICT NOTES TO BASIC FINANCIAL STATEMENTS For the Years Ended December 31, 2019 and 2018
NOTE 7 – DEFINED BENEFIT PENSION PLAN (Continued)
Contributions – Section 20814(c) of the California Public Employees’ Retirement Law requires that the employer contribution rates for all public employers be determined on an annual basis by the actuary and shall be effective on the July 1 following notice of a change in the rate. Funding contributions for the Plan are determined annually on an actuarial basis as of June 30 by CalPERS. The actuarially determined rate is the estimated amount necessary to finance the costs of benefits earned by employees during the year, with an additional amount to finance any unfunded accrued liability. The District is required to contribute the difference between the actuarially determined rate and the contribution rate of employees.
For the year ended December 31, 2019, the District’s contributions to the Plan were as follows:
Tier I Tier II PEPRA
Contributions - employer $510,975 $110,029 $42,985
Miscellaneous
B. Pension Liabilities, Pension Expenses and Deferred Outflows/Inflows of Resources Related toPensions
As of December 31, 2019 the District reported $4,611,042 in net pension liabilities for its proportionate shares of the net pension liability of the Plan.
The District’s net pension liability for the Plan is measured as the proportionate share of the net pension liability. The net pension liability of the Plan is measured as of June 30, 2019, and the total pension liability for the Plan used to calculate the net pension liability was determined by an actuarial valuation as of June 30, 2018 rolled forward to June 30, 2019 using standard update procedures. The District’s proportion of the net pension liability was based on a projection of the District’s long-term share of contributions to the pension plan relative to the projected contributions of all participating employers, actuarially determined. The District’s proportionate share of the net pension liability for the Plan as of June 30, 2018 and 2019 was as follows:
Miscellaneous
Proportion - June 30, 2018 0.11673%
Proportion - June 30, 2019 0.11515%
Change - Increase (Decrease) -0.00158%
36

CITRUS HEIGHTS WATER DISTRICT NOTES TO BASIC FINANCIAL STATEMENTS For the Years Ended December 31, 2019 and 2018
NOTE 7 – DEFINED BENEFIT PENSION PLAN (Continued)
For the year ended December 31, 2019, the District recognized pension expense of $982,128. At December 31, 2019, the District reported deferred outflows of resources and deferred inflows of resources related to pensions from the following sources:
Deferred Outflows Deferred Inflows
of Resources of Resources
Pension contributions subsequent to measurement date $530,157
Differences between actual and expected experience 320,256 ($24,813)
Changes in assumptions 219,876 (77,944)
Change in employer's proportion and differences between the employer’s contributions and the employer’s proportionate share of contributions 845,406 (153,976) Net differences between projected and actual earnings on plan investments (80,615)
Total $1,915,695 ($337,348)
The $530,157 reported as deferred outflows of resources related to contributions subsequent to the measurement date will be recognized as a reduction of the net pension liability in the year ended December 31, 2020. Other amounts reported as deferred outflows of resources and deferred inflows of resources related to pensions will be recognized as pension expense as follows:
Year Ended Annual
December 31 Amortization
2020 $821,463
2021 216,252
2022 (5,815)
2023 16,290
37

CITRUS HEIGHTS WATER DISTRICT NOTES TO BASIC FINANCIAL STATEMENTS For the Years Ended December 31, 2019 and 2018
NOTE 7 – DEFINED BENEFIT PENSION PLAN (Continued)
Sensitivity of the Proportionate Share of the Net Pension Liability to Changes in the Discount Rate – The following presents the District’s proportionate share of the net pension liability for the Plan, calculated using the discount rate for the Plan, as well as what the District’s proportionate share of the net pension liability would be if it were calculated using a discount rate that is 1-percentage point lower or 1-percentage point higher than the current rate:
1% Decrease 6.15%
Net Pension Liability $7,457,153
Current Discount Rate 7.15%
Net Pension Liability/(Asset) $4,611,042
1% Increase 8.15%
Net Pension Liability/(Asset) $2,261,778
Miscellaneous
Actuarial Assumptions – For the measurement period ended June 30, 2019, the total pension liabilities were determined by rolling forward the June 30, 2018 total pension liability. The June 30, 2018 and June 30, 2019 total pension liabilities were based on the following actuarial methods and assumptions:
Valuation Date
Measurement Date
Actuarial Cost Method
Actuarial Assumptions:
Discount Rate
Inflation
Projected Salary Increase
Investment Rate of Return
Post Retirement Benefit Increase
Mortality
(1) Net of pension plan investment and administrative expenses, including inflation.
2.50%
Miscellaneous
June 30, 2018
June 30, 2019
7.15%
Entry-Age Normal Cost Method
7.15% (1)
Contract COLA up to 2.0% until Purchasing Power Protection Allowance
Floor on Purchasing Power applies, 2.50% thereafter
Varies by Entry Age and Service
Derived using CalPers Membership Data for all Funds (2)
(2) The mortality table used was developed based on CalPERS’ specific data. The tableincludes 15 years of mortality improvements using Society of Actuaries Scale 90% of scale MP2016. For more details on this table, please refer to the CalPERS December 2017 experiencestudy report available on CalPERS' website.
38

CITRUS HEIGHTS WATER DISTRICT NOTES TO BASIC FINANCIAL STATEMENTS For the Years Ended December 31, 2019 and 2018
NOTE 7 – DEFINED BENEFIT PENSION PLAN (Continued)
All other actuarial assumptions used in the June 30, 2018 valuation were based on the results of a December 2017 actuarial experience study. Further details of the Experience Study can be found on the CalPERS website under Forms and Publications.
Change of Assumptions – GASB 68, paragraph 68 states that the long-term expected rate of return should be determined net of pension plan investment expense, but without reduction for pension plan administrative expense. The discount rate of 7.15% used for the June 30, 2019 measurement date was net of administrative expenses. The discount rate of 7.15% used for the June 30, 2018 measurement date is without reduction of pension plan administrative expense. All other assumptions for the June 30, 2018 measurement date were the same as those used for the June 30, 2019 measurement date.
Discount Rate – The discount rate used to measure the total pension liability for each Plan was 7.15%. The projection of cash flows used to determine the discount rate for each Plan assumed that contributions from all plan members in the Public Employees Retirement Fund (PERF) will be made at the current member contribution rates and that contributions from employers will be made at statutorily required rates, actuarially determined. Based on those assumptions, each Plan's fiduciary net position was projected to be available to make all projected future benefit payments of current plan members for all plans in the PERF. Therefore, the long-term expected rate of return on plan investments was applied to all periods of projected benefit payments to determine the total pension liability for each Plan.
The long-term expected rate of return on pension plan investments was determined using a building-block method in which best-estimate ranges of expected future real rates of return (expected returns, net of pension plan investment expense and inflation) are developed for each major asset class.
In determining the long-term expected rate of return, CalPERS took into account both short-term and long-term market return expectations as well as the expected pension fund cash flows. Such cash flows were developed assuming that both members and employers will make their required contributions on time and as scheduled in all future years. Using historical returns of all the funds’ asset classes, expected compound (geometric) returns were calculated over the short-term (first 10 years) and the long-term (11-60 years) using a building-block approach. Using the expected nominal returns for both short-term and long-term, the present value of benefits was calculated for each fund. The expected rate of return was set by calculating the single equivalent expected return that arrived at the same present value of benefits for cash flows as the one calculated using both short-term and long-term returns. The expected rate of return was then set equivalent to the single equivalent rate calculated above and rounded down to the nearest one quarter of one percent.
39

CITRUS HEIGHTS WATER DISTRICT NOTES TO BASIC FINANCIAL STATEMENTS For the Years Ended December 31, 2019 and 2018
NOTE 7 – DEFINED BENEFIT PENSION PLAN (Continued)
The table below reflects the long-term expected real rate of return by asset class. The rate of return was calculated using the capital market assumptions applied to determine the discount rate and asset allocation. These geometric rates of return are net of administrative expenses.
Asset Class (a)
Current Target
AllocationReal Return
Years 1 - 10(b)Real ReturnYears 11+(c)
Global Equity 50.0% 4.80% 5.98%
Global Fixed Income 28.0% 1.00% 2.62%
Inflation Sensitive 0.0% 0.77% 1.81%
Private Equity 8.0% 6.30% 7.23%
Real Estate 13.0% 3.75% 4.93%
Liquidity 1.0% 0.00% -0.92%
Total 100%
(a) In the System's CAFR, Fixed Income is included in Global Debt Securities;
Liquidity is included in Short-Term Investments; Inflation Assets are included in
both Global Equity Securities and Global Debt Securities.
Pension Plan Fiduciary Net Position – Detailed information about each pension plan’s fiduciary net position is available in the separately issued CalPERS financial reports.
NOTE 8 – POST-EMPLOYMENT HEALTH CARE BENEFITS
A. General Information about the District’s Other Post Employment Benefit (OPEB) Plan
Plan Description – The District provides post-employment healthcare benefits for certain groups of employees that retire from the District, under the Retiree Healthcare Plan (OPEB Plan), an agent multiple-employer plan administered by the District. The OPEB Plan provides benefits for all permanent, full-time employees of the District. The OPEB Plan’s assets are held in trust with the California Employers’ Retiree Benefit Trust Fund (CERBT), an agent multiple-employer Section 115 trust fund plan administered by California Public Employees’ Retirement System (CalPERS), which acts as a common investment and administrative agent for participating public employers within the State of California. Benefit provisions are established through District policy and may be amended through action of the District’s Board of Directors. In order to qualify for participation in the OPEB Plan, employees must meet three conditions: (1) completion of 20 years of service with the District; (2) retirement from the District and (3) employed with the District by January 30, 2019.
40
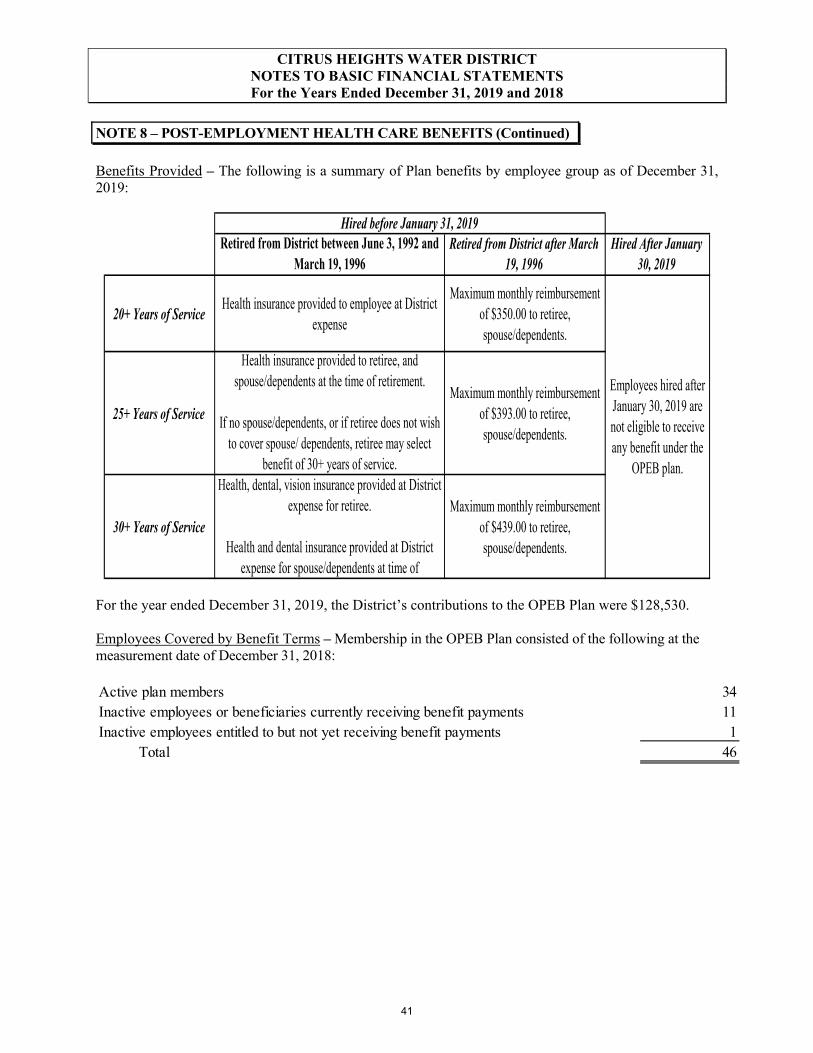
CITRUS HEIGHTS WATER DISTRICT NOTES TO BASIC FINANCIAL STATEMENTS For the Years Ended December 31, 2019 and 2018
NOTE 8 – POST-EMPLOYMENT HEALTH CARE BENEFITS (Continued)
Benefits Provided – The following is a summary of Plan benefits by employee group as of December 31, 2019:
Retired from District between June 3, 1992 and March 19, 1996
Retired from District after March 19, 1996
Hired After January 30, 2019
20+ Years of ServiceHealth insurance provided to employee at District
expense
Maximum monthly reimbursement of $350.00 to retiree, spouse/dependents.
25+ Years of Service
Health insurance provided to retiree, and spouse/dependents at the time of retirement.
If no spouse/dependents, or if retiree does not wish to cover spouse/ dependents, retiree may select
benefit of 30+ years of service.
Maximum monthly reimbursement of $393.00 to retiree, spouse/dependents.
30+ Years of Service
Health, dental, vision insurance provided at District expense for retiree.
Health and dental insurance provided at District expense for spouse/dependents at time of
Maximum monthly reimbursement of $439.00 to retiree, spouse/dependents.
Employees hired after January 30, 2019 are not eligible to receive any benefit under the
OPEB plan.
Hired before January 31, 2019
For the year ended December 31, 2019, the District’s contributions to the OPEB Plan were $128,530.
Employees Covered by Benefit Terms – Membership in the OPEB Plan consisted of the following at the measurement date of December 31, 2018:
Active plan members 34Inactive employees or beneficiaries currently receiving benefit payments 11Inactive employees entitled to but not yet receiving benefit payments 1
Total 46
41
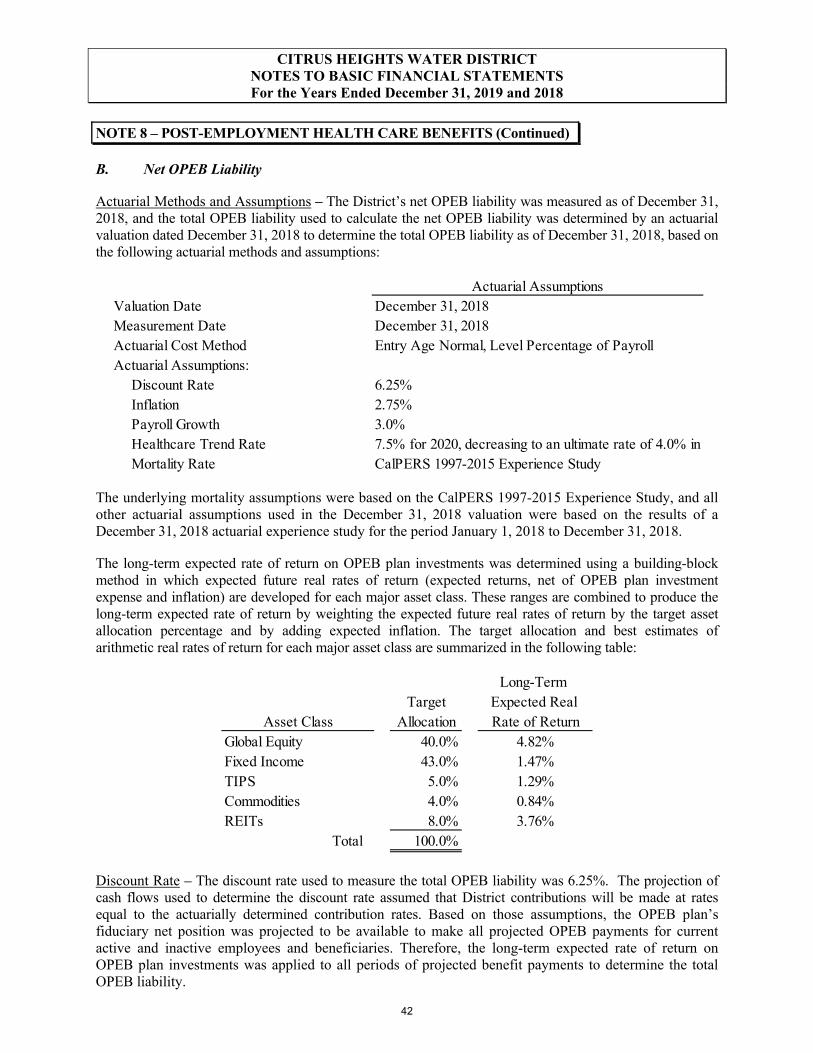
CITRUS HEIGHTS WATER DISTRICT NOTES TO BASIC FINANCIAL STATEMENTS For the Years Ended December 31, 2019 and 2018
NOTE 8 – POST-EMPLOYMENT HEALTH CARE BENEFITS (Continued)
B. Net OPEB Liability
Actuarial Methods and Assumptions – The District’s net OPEB liability was measured as of December 31, 2018, and the total OPEB liability used to calculate the net OPEB liability was determined by an actuarial valuation dated December 31, 2018 to determine the total OPEB liability as of December 31, 2018, based on the following actuarial methods and assumptions:
Actuarial AssumptionsValuation Date December 31, 2018Measurement Date December 31, 2018Actuarial Cost Method Entry Age Normal, Level Percentage of PayrollActuarial Assumptions:
Discount Rate 6.25%Inflation 2.75%Payroll Growth 3.0%Healthcare Trend Rate 7.5% for 2020, decreasing to an ultimate rate of 4.0% in Mortality Rate CalPERS 1997-2015 Experience Study
The underlying mortality assumptions were based on the CalPERS 1997-2015 Experience Study, and all other actuarial assumptions used in the December 31, 2018 valuation were based on the results of a December 31, 2018 actuarial experience study for the period January 1, 2018 to December 31, 2018.
The long-term expected rate of return on OPEB plan investments was determined using a building-block method in which expected future real rates of return (expected returns, net of OPEB plan investment expense and inflation) are developed for each major asset class. These ranges are combined to produce the long-term expected rate of return by weighting the expected future real rates of return by the target asset allocation percentage and by adding expected inflation. The target allocation and best estimates of arithmetic real rates of return for each major asset class are summarized in the following table:
Long-Term Target Expected Real
Asset Class Allocation Rate of ReturnGlobal Equity 40.0% 4.82%Fixed Income 43.0% 1.47%TIPS 5.0% 1.29%Commodities 4.0% 0.84%REITs 8.0% 3.76%
Total 100.0%
Discount Rate – The discount rate used to measure the total OPEB liability was 6.25%. The projection of cash flows used to determine the discount rate assumed that District contributions will be made at rates equal to the actuarially determined contribution rates. Based on those assumptions, the OPEB plan’s fiduciary net position was projected to be available to make all projected OPEB payments for current active and inactive employees and beneficiaries. Therefore, the long-term expected rate of return on OPEB plan investments was applied to all periods of projected benefit payments to determine the total OPEB liability.
42

CITRUS HEIGHTS WATER DISTRICT NOTES TO BASIC FINANCIAL STATEMENTS For the Years Ended December 31, 2019 and 2018
NOTE 8 – POST-EMPLOYMENT HEALTH CARE BENEFITS (Continued)
C. Changes in Net OPEB Liability
The changes in the net OPEB liability are as follows:
Total OPEB Plan Fiduciary Net OPEB Liability Net Position Liability/(Asset)
(a) (b) (a) - (b)
Balance at December 31, 2018 (12/31/17 Measurement Date) $1,401,268 $1,401,268Changes Recognized for the Measurement Period:Service Cost 26,682 26,682Interest on the total OPEB liability 87,918 87,918Changes in benefit terms - Difference between expected and actual experience 41,338 41,338Changes of assumptions 23,239 23,239Contributions from the employer* $122,527 (122,527) Net investment income (1,658) 1,658 Administrative expenses (6) 6 Benefit payments and refunds (42,527) (42,527) -
Net Changes 136,650 78,336 58,314Balance at December 31, 2019 (12/31/18 Measurement Date) $1,537,918 $78,336 $1,459,582
Increase (Decrease)
Sensitivity of the Net OPEB Liability to Changes in the Discount Rate and Healthcare Cost Trend Rates – The following presents the net OPEB liability of the District, as well as what the District’s net OPEB liability would be if it were calculated using a discount rate that is 1-percentage-point lower (5.25%) or 1-percentage-point higher (7.25%) than the current discount rate:
Discount Rate -1% Current Discount Discount Rate +1%(5.25 %) Rate (6.25%) (7.25%)
$1,727,779 $1,459,582 $1,245,564
Plan's Net OPEB Liability
The following presents the net OPEB liability of the District, as well as what the District’s net OPEB liability would be if it were calculated using healthcare cost trend rates that are 1-percentage-point lower (6.0% to 4.0%) or 1-percentage-point higher (8.0% to 6.0%) than the current healthcare cost trend rates:
Health Care Cost Health Care Cost Health Care CostTrend Rates -1% Trend Rates Trend Rates +1%
$1,449,714 $1,459,582 $1,468,921
Plan's Net OPEB Liability
43

CITRUS HEIGHTS WATER DISTRICT NOTES TO BASIC FINANCIAL STATEMENTS For the Years Ended December 31, 2019 and 2018
NOTE 8 – POST-EMPLOYMENT HEALTH CARE BENEFITS (Continued)
E. OPEB Expense and Deferred Outflows/Inflows of Resources Related to OPEB
For the year ended December 31, 2019, the District recognized OPEB expense of $121,095. At December 31, 2018, the District reported deferred outflows and inflows of resources related to OPEB from the following sources:
Deferred Outflows Deferred Inflowsof Resources of Resources
Differences between expected and actual experience $36,987Changes in assumptions 20,793Net difference between projected and actual earnings
on plan investments 1,966Employer contributions made subsequent to the
measurement date 128,530Total $188,276
$128,530 reported as deferred outflows of resources related to contributions subsequent to the measurement date will be recognized as a reduction of the OPEB liability in the year ended December 31, 2020. The District did not have any other amounts reported as deferred outflows of resources and deferred inflows of resources related to OPEB that must be recognized as future OPEB expense.
F. Payable to the OPEB Plan
At December 31, 2019, the District reported a payable of $0 for the outstanding amount of contributions to the OPEB plan required for the year ended December 31, 2019.
NOTE 9 – COMMITMENTS AND CONTINGENCIES
Various claims have been filed against the District. In the opinion of the District’s management and legal counsel, the claims will not have a material impact on the basic financial statements.
The District has capital project commitments as of December 31, 2019 and 2018 totaling $596,105 and $426,521, respectively, related to construction work.
NOTE 10 – ECONOMIC DEPENDENCY
During 2019 and 2018, the District purchased 96.74% and 90.52%, respectively, of its water supply from the San Juan Water District (SJWD). Total purchases for the year ended December 31, 2019 and 2018 was $3,131,903 and $2,878,799 , respectively. In addition, the District owns water transmission capacity entitlements through the cooperative transmission pipeline project owned and operated by SJWD.
44
CITRUS HEIGHTS WATER DISTRICT NOTES TO BASIC FINANCIAL STATEMENTS For the Years Ended December 31, 2019 and 2018
NOTE 11 – INSURANCE
The District participates in the Association of California Water Agencies Joint Powers Insurance Authority (ACWA/JPIA) a public entity risk pool of California water agencies, for general and auto liability, public officials liability, property damage, fidelity insurance and workers compensation liability. ACWA/JPIA provides insurance through the pool up to a certain level, beyond which group purchased commercial excess insurance is obtained.
The District pays an annual premium to ACWA/JPIA that includes its pro-rata share of excess insurance premiums, charges for the pooled risk, claims adjusting and legal costs, and administrative and other costs to operate the ACWA/JPIA. The District’s deductibles and maximum coverage are as follows:
Type of Coverage (Deductible) ACWA/ JPIA Deductible General and Auto Liability $5,000,000 None (Includes Public Officials Liability)Property Damage * 100,000 $2,500 - 50,000Crime 100,000 1,000Workers Compensation Liability 2,000,000 NoneEmployers Liability 2,000,000 None
* The District has additional $500,000,000 in property damage coverage via ACWA/JAPIA through the commercial insurance.
NOTE 12 – SUBSEQUENT EVENT
The COVID-19 outbreak in the United States has caused business disruption through mandated and voluntary closings of businesses. While the disruption is currently expected to be temporary, there is considerable uncertainty around the duration of the closings. However, the related financial impact on District and the duration cannot be reasonably estimated at this time.
45

Required Supplementary Information
46

CITRUS HEIGHTS WATER DISTRICT REQUIRED SUPPLEMENTAL INFORMATION For the Years Ended December 31, 2019 and 2018
6/30/2014 6/30/2015 6/30/2016 6/30/2017 6/30/2018 6/30/2019Plan's Proportion of the Net Pension Liability/Asset 0.05398% 0.12216% 0.11962% 0.11866% 0.11673% 0.11515%Plan's Proportionate Share of the Net Pension Liability/(Asset) $3,358,940 $3,351,422 $4,155,588 $4,677,711 $4,399,273 $4,611,042
Plan's Covered Payroll $2,279,406 $2,289,027 $2,270,540 $2,606,536 $2,941,557 $3,442,952
Plan's Proportionate Share of the Net Pension Liability/(Asset) as a Percentage of its Covered Payroll 147.36% 146.41% 183.02% 179.46% 149.56% 133.93%Plan's Fiduciary Net Position as a Percentage of the Total Pension Liability 77.44% 79.89% 75.87% 75.39% 77.69% 77.73%
* Fiscal year 2015 was the 1st year of implementation.** Calpers provides the information based on a June 30 fiscal year end.
Citrus Heights Water District, a Cost-Sharing Defined Pension PlanAs of fiscal year ending December 31, 2019
Schedule of the Plan's Proportionate Share of the Net Pension Liability and Related Ratios as of the Measurement Date**
Last 10 Years*
47

CITRUS HEIGHTS WATER DISTRICT REQUIRED SUPPLEMENTAL INFORMATION For the Years Ended December 31, 2019 and 2018
As of fiscal year ending December 31, 2019SCHEDULE OF CONTRIBUTIONS
Last 10 Years*
2015 2016 2017 2018 2019
Actuarially determined contribution 468,974$ 347,181$ 572,724$ 700,242$ 663,989$ Contributions in relation to the actuarially determined contributions (468,974) (347,181) (572,724) (700,242) (663,989) Contribution deficiency (excess) -$ -$ -$ -$ -$
Covered payroll 2,129,887$ 2,362,614$ 2,667,190$ 3,046,586$ 3,537,549$
Contributions as a percentage of covered-employee payroll 22.02% 14.69% 21.47% 22.98% 18.77%
* Fiscal year 2015 was the 1st year of implementation.
Citrus Heights Water District, a Cost-Sharing Defined Pension Plan
48

CITRUS HEIGHTS WATER DISTRICT REQUIRED SUPPLEMENTAL INFORMATION For the Years Ended December 31, 2019 and 2018
Measurement Date 12/31/17 12/31/18
Total OPEB LiabilityService Cost 25,905$ 26,682$ Interest 83,640 87,918Differences between expected and actual experience 41,338Changes in assumptions 23,239Changes in benefits (41,228) (42,527)Net change in total OPEB liability 68,317 136,650 Total OPEB liability - beginning 1,332,951 1,401,268 Total OPEB liability - ending (a) 1,401,268$ 1,537,918$
Total Plan Fiduciary Net PositionContributions - employer 41,228$ 122,527$ Contributions - employeeNet investment income (1,658)Benefit payments (41,228) (42,527)Administrative expenses (6)Other changesNet change in plan Fiduciary Net Position - 78,336 Plan Fiduciary Net Position - beginning - -Plan Fiduciary Net Position - ending (b) -$ 78,336$
Plan net OPEB liability (a)-(b) 1,401,268$ 1,459,582$
Covered-employee payroll 3,278,242$ 3,658,217$
Net OPEB liability as a percentage of covered-employee payroll 42.74% 39.90%
Notes to schedule:* - Fiscal year 2018 was the first year of implementation.
SCHEDULE OF CHANGES IN NET OPEB LIABILITY AND RELATED RATIOSAgent Multiple Employer Plan
Last 10 years*
49

CITRUS HEIGHTS WATER DISTRICT REQUIRED SUPPLEMENTAL INFORMATION For the Years Ended December 31, 2019 and 2018
Fiscal Year Ended December 31, 2018 2019
Actuarially determined contribution 122,000$ 130,652$ Contributions in relation tothe actuarially determined contributions 122,527 128,530
Contribution deficiency (excess) (527)$ 2,122$
Covered-employee payroll 3,278,242$ 3,658,217$
Contributions as a percentage ofcovered-employee payroll 3.74% 3.51%
Notes to Schedule
Methods and assumptions used to determine contribution rates:
Valuation Date December 31, 2016Actuarial Cost Method Entry Age Normal,
Level Percentage of Amortization Method Level percent of payAmortization Period 19-year fixed period for
2019Asset Valuation Method n/aDiscount Rate 6.25%General Inflation 2.75% annuallyMedical Trend 7.0% for 2018,
decreasing to an ultimate rate of 5.0% in 2022
Mortality CalPERS 1997-2011 experience study
Mortality Improvement Mortality projected fully generational with Scale MP-16
* - Fiscal year 2018 was the first year of implementation.
SCHEDULE OF CONTRIBUTIONSAgent Multiple Employer Plan
Last Ten Fiscal Years*
50

Statistical Section
51

Financial Trends Page
financial performance and well-being have changed over time.Changes in Net Position and Net Position by Component…………… 55Operating Revenue by Source………………………………………….. 57Operating Expenses by Activity…………………………………………. 58
Revenue Capacity Page
water revenues, the most significant source of revenue to the District.Revenue Base…………………………………………………………….. 60Revenue Rates……………………………………………………………. 61Customers by Type……………………………………………………….. 62Principal Customers………………………………………………………. 63
Debt Capacity PageThese schedules present information to help the reader assess the affordability of the District'scurrent levels of outstanding debt, and the District's ability to manage debt in the future.
Ratios of Outstanding Debt………………………………………………. 65Debt Coverage…………………………………………………………….. 66
Demographic and Economic Information PageThese schedules offer demographic and economic indicators to help the reader understand theenvironment within which the District's financial activities take place.
Demographic and Economic Statistics…………………………………. 68Principal Employers………………………………………………………. 69
Operating Information PageThese schedules contain service and infrastructure data to help the reader understand how theinformation in the District's financial report relates to the services the District provides and theactivities it performs.
Full-Time Employees by Department…………………………………… 71Operating Indicators………………………………………………………. 72
This section of the Citrus Heights Water District's (District) comprehensive annual financial reportpresents detailed information as a context for understanding what the information in the financialstatements, note disclosures, and required supplementary infirmation says about the government's overallfinancial health.
These schedules contain trend information to help the reader understand how the District's
These schedules contain information to help the reader assess the District's ability to generate
CITRUS HEIGHTS WATER DISTRICTStatistical Section
Table of Contents

Financial Trends
53

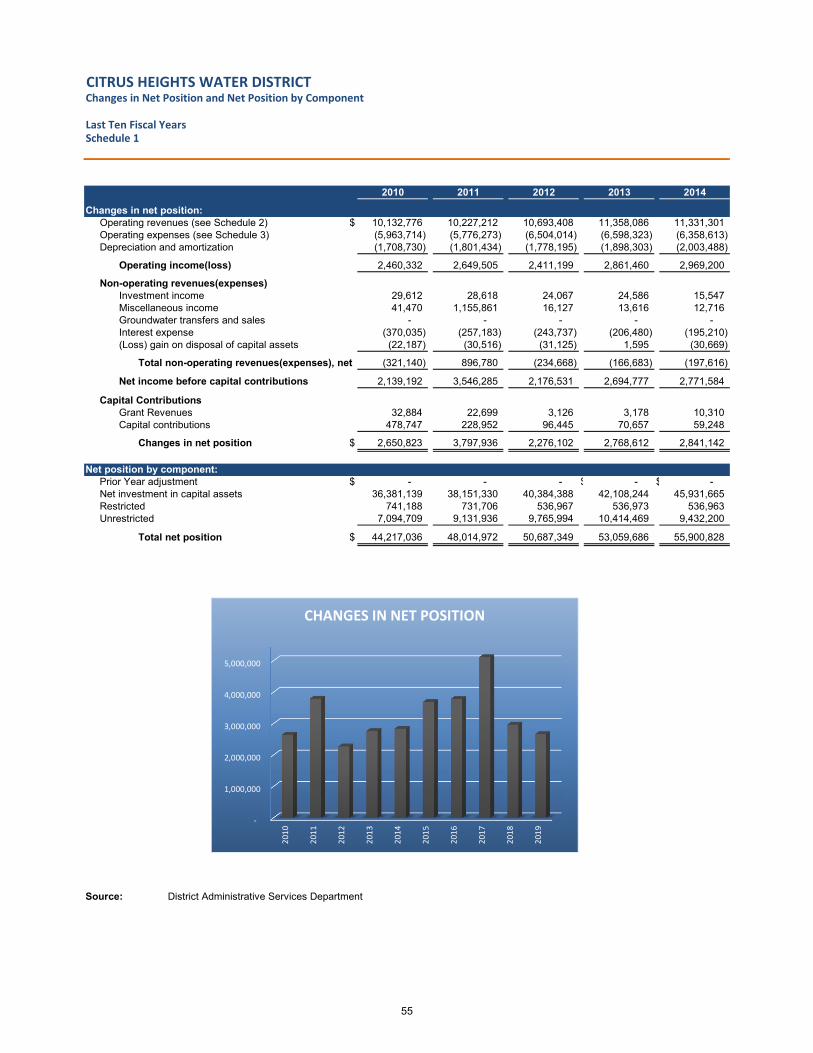
2010 2011 2012 2013 2014
Changes in net position:Operating revenues (see Schedule 2) $ 10,132,776 10,227,212 10,693,408 11,358,086 11,331,301 Operating expenses (see Schedule 3) (5,963,714) (5,776,273) (6,504,014) (6,598,323) (6,358,613) Depreciation and amortization (1,708,730) (1,801,434) (1,778,195) (1,898,303) (2,003,488)
Operating income(loss) 2,460,332 2,649,505 2,411,199 2,861,460 2,969,200
Non-operating revenues(expenses)Investment income 29,612 28,618 24,067 24,586 15,547 Miscellaneous income 41,470 1,155,861 16,127 13,616 12,716 Groundwater transfers and sales - - - - -Interest expense (370,035) (257,183) (243,737) (206,480) (195,210) (Loss) gain on disposal of capital assets (22,187) (30,516) (31,125) 1,595 (30,669)
Total non-operating revenues(expenses), net (321,140) 896,780 (234,668) (166,683) (197,616)
Net income before capital contributions 2,139,192 3,546,285 2,176,531 2,694,777 2,771,584
Capital ContributionsGrant Revenues 32,884 22,699 3,126 3,178 10,310 Capital contributions 478,747 228,952 96,445 70,657 59,248
Changes in net position $ 2,650,823 3,797,936 2,276,102 2,768,612 2,841,142
Net position by component:Prior Year adjustment $ - - - $ - $ -Net investment in capital assets 36,381,139 38,151,330 40,384,388 42,108,244 45,931,665 Restricted 741,188 731,706 536,967 536,973 536,963 Unrestricted 7,094,709 9,131,936 9,765,994 10,414,469 9,432,200
Total net position $ 44,217,036 48,014,972 50,687,349 53,059,686 55,900,828
Source: District Administrative Services Department
CITRUS HEIGHTS WATER DISTRICTChanges in Net Position and Net Position by Component
Last Ten Fiscal YearsSchedule 1
‐
1,000,000
2,000,000
3,000,000
4,000,000
5,000,000
2010
2011
2012
2013
2014
2015
2016
2017
2018
2019
CHANGES IN NET POSITION
55

2015 2016 2017 2018 2019
Changes in net position:$ 10,884,550 12,325,057 14,043,049 14,375,044 15,340,476 Operating revenues (see Schedule 2)
(6,023,057) (7,043,963) (7,534,381) (9,531,439) (11,230,314) Operating expenses (see Schedule 3)(2,098,944) (2,203,170) (2,345,281) (2,388,634) (2,435,900) Depreciation and amortization
2,762,549 3,077,924 4,163,387 2,454,971 1,674,262 Operating income(loss)
Non-operating revenues(expenses)19,093 38,313 63,531 159,437 214,962 Investment income28,606 68,203 77,074 107,546 69,322 Miscellaneous income
- - 1,058,793 347,583 38,316 Groundwater transfers and sales(173,462) (155,214) (145,911) (147,540) (124,346) Interest expense
4,834 (137,567) (155,343) (164,842) (105,755) (Loss) gain on disposal of capital assets
(120,929) (186,265) 898,144 302,184 92,499 Total non-operating revenues(expenses), net
2,641,620 2,891,659 5,061,531 2,757,155 1,766,761 Net income before capital contributions
Capital Contributions610,431 715 - - - Grant Revenues438,567 896,688 55,813 213,121 898,084 Capital contributions
$ 3,690,618 3,789,062 5,117,344 2,970,276 2,664,845 Changes in net position
Net position by component:(3,728,767) - - - - Prior Year adjustment50,895,005 51,801,433 53,350,420 55,029,058 57,193,152 Net investment in capital assets
533,350 533,796 535,733 541,475 542,660 Restricted4,434,324 7,316,512 10,882,932 11,717,632 12,217,198 Unrestricted
$ 52,133,912 59,651,741 64,769,085 67,288,165 69,953,010 Total net position
CITRUS HEIGHTS WATER DISTRICTChanges in Net Position and Net Position by Component
Last Ten Fiscal YearsSchedule 1 (Continued)
‐
10,000,000
20,000,000
30,000,000
40,000,000
50,000,000
60,000,000
70,000,000
2010
2011
2012
2013
2014
2015
2016
2017
2018
2019
NET POSITION BY COMPONENT
Net investment in capital assets Restricted Unrestricted
56

Fiscal Year Water SalesConnection and Other
Total Operating
2010 $ 9,687,869 $ 444,907 $ 10,132,7762011 9,833,125 394,087 10,227,2122012 10,285,029 408,379 10,693,4082013 10,905,197 452,889 11,358,0862014 10,171,473 1,159,828 11,331,3012015 9,953,864 930,686 10,884,5502016 11,602,622 722,435 12,325,0572017 13,448,691 594,358 14,043,0492018 14,119,865 255,179 14,375,0442019 14,823,207 517,269 15,340,476
Source: District Administrative Services Department
Operating Revenue By Source
Schedule 2Last Ten Fiscal Years
CITRUS HEIGHTS WATER DISTRICT
0
2,000,000
4,000,000
6,000,000
8,000,000
10,000,000
12,000,000
14,000,000
16,000,000
2010
2011
2012
2013
2014
2015
2016
2017
2018
2019
OPERATING REVENUE BY SOURCE
Water Sales Connection and Other Fees
57
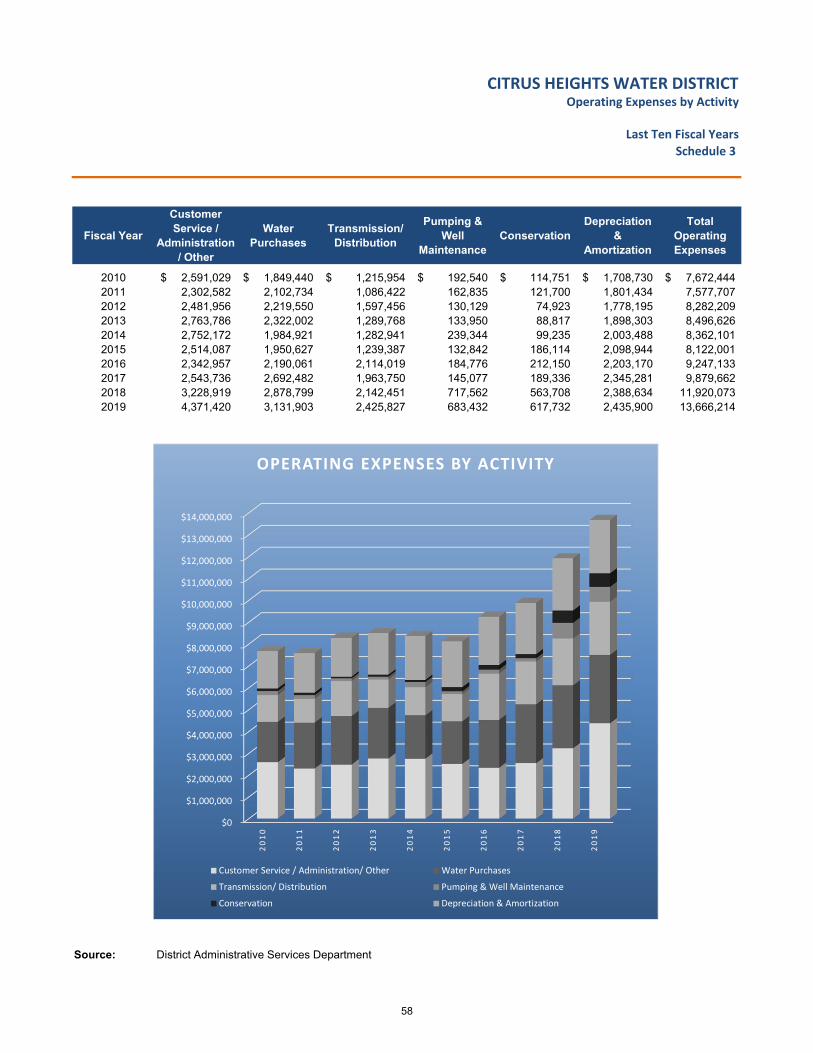
Fiscal Year
Customer Service /
Administration/ Other
Water Purchases
Transmission/ Distribution
Pumping & Well
MaintenanceConservation
Depreciation &
Amortization
Total Operating Expenses
2010 2,591,029$ 1,849,440$ 1,215,954$ 192,540$ 114,751$ 1,708,730$ 7,672,444$ 2011 2,302,582 2,102,734 1,086,422 162,835 121,700 1,801,434 7,577,707 2012 2,481,956 2,219,550 1,597,456 130,129 74,923 1,778,195 8,282,209 2013 2,763,786 2,322,002 1,289,768 133,950 88,817 1,898,303 8,496,626 2014 2,752,172 1,984,921 1,282,941 239,344 99,235 2,003,488 8,362,101 2015 2,514,087 1,950,627 1,239,387 132,842 186,114 2,098,944 8,122,001 2016 2,342,957 2,190,061 2,114,019 184,776 212,150 2,203,170 9,247,133 2017 2,543,736 2,692,482 1,963,750 145,077 189,336 2,345,281 9,879,662 2018 3,228,919 2,878,799 2,142,451 717,562 563,708 2,388,634 11,920,073 2019 4,371,420 3,131,903 2,425,827 683,432 617,732 2,435,900 13,666,214
Source: District Administrative Services Department
CITRUS HEIGHTS WATER DISTRICTOperating Expenses by Activity
Last Ten Fiscal Years
Schedule 3
$0
$1,000,000
$2,000,000
$3,000,000
$4,000,000
$5,000,000
$6,000,000
$7,000,000
$8,000,000
$9,000,000
$10,000,000
$11,000,000
$12,000,000
$13,000,000
$14,000,000
2010
2011
2012
2013
2014
2015
2016
2017
2018
2019
OPERATING EXPENSES BY ACTIVITY
Customer Service / Administration/ Other Water Purchases
Transmission/ Distribution Pumping & Well Maintenance
Conservation Depreciation & Amortization
58

Revenue Capacity
59

Fiscal Consumption Imported Produced % Water
Year (Acre Feet) (Acre Feet) (Acre Feet) Imported
2010 13,725.35 12,165.46 1,559.89 88.63%2011 13,252.18 12,289.80 962.38 92.74%2012 14,169.76 13,583.02 586.74 95.86%2013 14,881.54 14,416.21 465.33 96.87%2014 11,937.24 10,007.61 1,929.63 83.84%2015 9,973.47 9,132.60 840.87 91.57%2016 10,422.44 9,964.89 457.55 95.61%2017 11,014.52 10,909.88 104.64 99.05%2018 10,981.66 9,940.53 1,041.13 90.52%2019 11,001.23 10,642.14 359.09 96.74%
Source: District Operations Department
CITRUS HEIGHTS WATER DISTRICT
Water Supply
Revenue Base
Last Ten Fiscal YearsSchedule 4
0
2,000
4,000
6,000
8,000
10,000
12,000
14,000
16,000
2010
2011
2012
2013
2014
2015
2016
2017
2018
2019
CONSUMPTION BY SOURCE
Imported (Acre Feet) Produced (Acre Feet)
60

2010 2011 2012 2013 2014 2015 2016 2017 2018 2019
Flat Rate Accounts (Bimonthly) (1)
Single Dwelling $ 87.75 $ 89.51 $ 89.51 n/a n/a n/a n/a n/a n/a n/a Duplex Dwelling (per duplex side) 74.29 75.78 75.78 n/a n/a n/a n/a n/a n/a n/a Condominium Dwelling 74.29 75.78 75.78 n/a n/a n/a n/a n/a n/a n/a Apartments/Mobile Homes 74.29 75.78 75.78 n/a n/a n/a n/a n/a n/a n/a Irrigation Rate 112.27 117.88 117.88 n/a n/a n/a n/a n/a n/a n/a
Metered Accounts (2)
Consumption (per unit ccf)Tier 1 0.6369$ 0.6751$ 0.6751$ 0.6954$ n/a n/a n/a n/a n/a n/a Tier 2 0.7494 0.7944 0.7944 0.8182 n/a n/a n/a n/a n/a n/a Tier 3 0.8208 0.8700 0.8700 0.8961 n/a n/a n/a n/a n/a n/a Per Unit CCF (No tiers) n/a n/a n/a n/a 0.7440 0.7663$ 0.8735$ 0.9871$ 1.0167$ 1.0674$
Service Charge (bimonthly)Commercial/Domestic 3/4" $ 34.88 $ 34.88 $ 34.88 $ 35.93 $ 35.82 36.89$ 42.05$ 47.52$ 48.94$ 51.38$ Commercial/Domestic 1" 50.04 50.04 50.04 51.54 54.50 56.13 63.98 72.30 74.46 78.18 Commercial/Domestic 1-1/2" 87.29 87.29 87.29 89.91 66.95 68.95 78.60 88.82 91.48 96.05 Commercial/Domestic 2" 132.51 132.51 132.51 136.49 129.20 133.07 151.69 171.41 176.55 185.37 Commercial/Domestic 3" 236.80 236.80 236.80 243.90 203.91 210.02 239.42 270.54 278.65 292.58 Commercial/Domestic 4" 385.88 385.88 385.88 397.46 403.13 415.22 473.35 534.89 550.93 578.47 Irrigation 3/4" 17.44 17.44 17.44 17.96 35.82 36.89 42.05 47.52 48.94 51.38 Irrigation 1" 25.02 25.02 25.02 25.77 54.50 56.13 63.98 72.30 74.46 78.18 Irrigation 1-1/2" 43.64 43.64 43.64 44.95 66.95 68.95 78.60 88.82 91.48 96.05 Irrigation 2" 66.25 66.25 66.25 68.24 129.20 133.07 151.69 171.41 176.55 185.37 Irrigation 3" 118.40 118.40 118.40 121.95 203.91 210.02 239.42 270.54 278.65 292.58 Irrigation 4" 192.94 192.94 192.94 198.73 403.13 415.22 473.35 534.89 550.93 578.47
Notes: (1) The District completed the migration of Flat-Rate customers to meters in Fiscal Year 2012, and the Flat-Rate waseliminated for Fiscal Year 2013.
(2) The District abolished its tiered consumption charge beginning in 2014.
Source:District Administrative Services Department
CITRUS HEIGHTS WATER DISTRICTWater Rates
Last Ten Fiscal Years
Schedule 5
61

Fiscal Year
Single Family Residential
Multi-Family Residential
Commercial Institutional Other Total
2010 16,219 2,176 648 51 37 19,1312011 16,223 2,176 647 95 32 19,1732012 16,385 2,272 751 101 43 19,5522013 16,402 2,275 758 111 45 19,5912014 16,425 2,280 771 118 51 19,6452015 16,527 2,285 785 130 58 19,7852016 16,576 2,283 802 131 59 19,851
2017 16,615 2,284 807 132 64 19,9022018 16,627 2,284 807 132 61 19,9112019 16,645 2,286 810 132 64 19,937
Source: District Administrative Services DepartmentDistrict Water Efficiency Department
CITRUS HEIGHTS WATER DISTRICTCustomers by Type
Last Ten Fiscal YearsSchedule 6
0
5,000
10,000
15,000
20,000
2010
2011
2012
2013
2014
2015
2016
2017
2018
2019
CUSTOMERS BY TYPE
Single Family Residential Multi‐Family Residential Commercial Institutional Other
62

Customer Billed PercentageUnits (ccf's) of Total
San Juan Unified School District 106,381 2.22%JMK Investments 76,798 1.60%Sunrise Recreation Park District 74,252 1.55%JRK Investors 54,097 1.13%Mount Vernon Memorial Park 35,751 0.75%City of Citrus Heights 33,440 0.70%Conference Claimants Endowment 29,417 0.61%Wedgewood Commons Apts LLC 25,666 0.54%Salishan Apartments 23,457 0.54%Knaggs Meadows LLC 22,584 0.51%
Total Billed Units: Principal customers 481,843 10.15%
Total Billed Units 4,792,463 100.00%
Customer Billed PercentageUnits (ccf's) of Total
San Juan Unified School District 93,373 1.69%JMK Investments 82,942 1.50%Sunrise Recreation Park District 58,873 1.06%JRK Investors 52,236 0.94%Conference Claimants Endowment 40,682 0.73%Salishan Apartments 34,213 0.62%Mount Vernon Memorial Park 32,813 0.59%Pacific Capital Investments 29,237 0.53%City of Citrus Heights 27,109 0.49%Wedgewood Commons Apts LLC 26,410 0.48%
Total Billed Units: Principal customers 477,888 8.63%
Total Billed Units 5,537,562 100.00%
Source:District Administrative Services Department
2019
2010
CITRUS HEIGHTS WATER DISTRICTPrincipal Customers
Current Fiscal Year and Ten Years AgoSchedule 7
63

Debt Capacity
64

Certificates Certificates Certificates Refunding of of of Revenue Unamortized No. of Debt
Fiscal Participation Participation Participation Bonds Premiums Total Connections Per CapitaYear 2000 (1) 2003 (2) 2010 (3) 2012 (4) Debt (5) (Rounded) (5)
COP s 2000 COP s 2003 COP s 2010 Bonds 20122010 -$ 2,695,000$ 4,670,000$ -$ 261,835$ $7,626,835 19,131 $3992011 - 2,695,000 4,260,000 - 238,041 7,193,041 19,173 $3752012 - - 3,840,000 2,275,000 426,944 6,541,944 19,552 $3352013 - - 3,415,000 2,170,000 392,125 5,977,125 19,591 $3052014 - - 2,980,000 2,095,000 357,305 5,432,305 19,645 $2772015 - - 2,530,000 2,025,000 322,486 4,877,486 19,785 $2472016 - - 2,060,000 1,950,000 287,666 4,297,666 19,851 $2162017 - - 1,575,000 1,870,000 252,847 3,697,847 19,902 $1862018 - - 1,070,000 1,790,000 218,027 3,078,027 19,911 $1552019 - - 545,000 1,705,000 183,208 2,433,208 19,937 $122
Notes:(1) In October 2000, the District issued $7,900,000 of Certificates of Participation, Series 2000
to finance the cost of capital improvement projects.
(2) In December 2003, the District issued $2,915,000 of Certificates of Participation, Series 2003to finance the cost of capital improvement projects.
(3) In September 2010, the District issued $5,155,000 of Revenue Certificates of Participation, Series2010 to retire the outstanding 2000 Certificates of Participation.
(4) In April 2012, the District issued $2,275,000 of Revenue Refunding Bonds, Series 2012 to retirethe outstanding 2003 Certificates of Participation.
Source: District Administrative Services Department
CITRUS HEIGHTS WATER DISTRICTRatios of Outstanding Debt by Type
Last Ten Fiscal Years
Total
Schedule 8
‐
1,000,000
2,000,000
3,000,000
4,000,000
5,000,000
6,000,000
7,000,000
8,000,000
2010
2011
2012
2013
2014
2015
2016
2017
2018
2019
OUTSTANDING DEBT
COP's 2000 COP's 2003 COP's 2010 Bonds 2012 Unamortized Premiums
65

Principal Interest Total
2010 10,181,671$ (7,672,444)$ 2,509,227$ 560,000$ 370,035$ 930,035$ 2.702011 11,381,175 (7,577,707) 3,803,468 570,000 257,183 827,183 4.602012 10,702,477 (8,282,209) 2,420,268 420,000 243,737 663,737 3.652013 11,457,270 (8,496,626) 2,960,644 530,000 206,480 736,480 4.022014 11,388,143 (8,362,101) 3,026,042 510,000 195,210 705,210 4.292015 11,547,514 (8,122,001) 3,425,513 520,000 173,462 693,462 4.942016 13,190,694 (9,247,133) 3,943,561 545,000 155,214 700,214 5.632017 15,087,104 (9,879,662) 5,207,442 565,000 145,911 710,911 7.332018 14,824,768 (11,920,073) 2,904,695 585,000 147,540 732,540 3.972019 15,557,321 (13,666,214) 1,891,107 585,000 124,346 709,346 2.67
Source: District Administrative Services Department
Debt Service
CITRUS HEIGHTS WATER DISTRICTDebt Coverage
Last Ten Fiscal YearsSchedule 9
Fiscal Year Net RevenuesOperating Expenses
Net Available Revenues
Coverage Ratio
0.00
1.00
2.00
3.00
4.00
5.00
6.00
7.00
8.00
2010
2011
2012
2013
2014
2015
2016
2017
2018
2019
COVERAGE RATIO
66

Demographic and Economic Information
67

Fiscal Year
Total Number of Connections Population (3) Unemployment
Rate
Personal Income
(thousands
of dollars) (2)
Personal Income (Per
Capita) (2)Population
UnemploymentRate
Personal Income
(thousands
of dollars) (2)
Personal Income (Per
Capita) (2)
2010 19,131 83,365 13.2% $4,994,897 $59,916 1,422,018 12.6% $54,666,004 $38,4432011 19,173 83,903 11.7% 5,178,325 61,718 1,435,002 11.2% 57,498,308 40,0682012 19,552 84,489 10.1% 4,961,701 58,726 1,447,236 9.6% 59,775,785 41,3032013 19,591 85,123 8.3% 5,044,729 59,264 1,460,023 7.9% 61,654,690 42,2292014 19,645 85,891 6.6% 5,212,811 60,691 1,478,137 6.3% 65,486,553 44,3032015 19,785 86,759 5.7% 5,308,263 61,184 1,496,644 5.4% 70,110,138 46,8452016 19,851 87,380 5.0% 6,043,288 69,161 1,514,460 5.0% 72,878,458 48,1222017 19,902 87,931 3.8% 5,952,753 67,698 1,530,615 3.9% 76,832,120 50,1972018 19,911 87,910 3.7% 6,388,859 72,675 1,540,975 3.8% 80,969,087 52,5442019 19,937 n/a 3.2% n/a n/a 1,552,058 3.2% n/a n/a
Notes: (1) Demographic and economic statistics are provided for the City of Citrus Heights (City) and the County of Sacramento (County)because these statistics are not separatemly available for the District's service area. As the District is primarily comprised ofsome areas of the City, and unincorporated areas of the County, the District believes that data from the City and the County isrepresentative of the conditions and experience of the District.
(2) Personal income and per capita personal income is not yet available for Fiscal Year 2019.
(3) Population data for the City is not yet available for Fiscal Year 2019.
Sources: U.S. Bureau of Economic AnalysisU.S. Bureau of Labor StatisticsU.S. Census Bureau
CITRUS HEIGHTS WATER DISTRICTDemographics and Economic Statistics
Last Ten Calendar Years
Schedule 10
County of Sacramento(1)City of Citrus Heights (1)
0.0%
2.0%
4.0%
6.0%
8.0%
10.0%
12.0%
14.0%
$‐
$10,000
$20,000
$30,000
$40,000
$50,000
$60,000
$70,000
$80,000
2010
2011
2012
2013
2014
2015
2016
2017
2018
2019
UNEMPLOYMENT VS PERSONAL INCOME, CITY
Personal Income (Per Capita) (2) Unemployment Rate
0.0%
2.0%
4.0%
6.0%
8.0%
10.0%
12.0%
14.0%
$‐
$10,000
$20,000
$30,000
$40,000
$50,000
$60,000
2010
2011
2012
2013
2014
2015
2016
2017
2018
2019
UNEMPLOYMENT VS PERSONAL INCOME, COUNTY
Personal Income (Per Capita) (2) Unemployment Rate
68
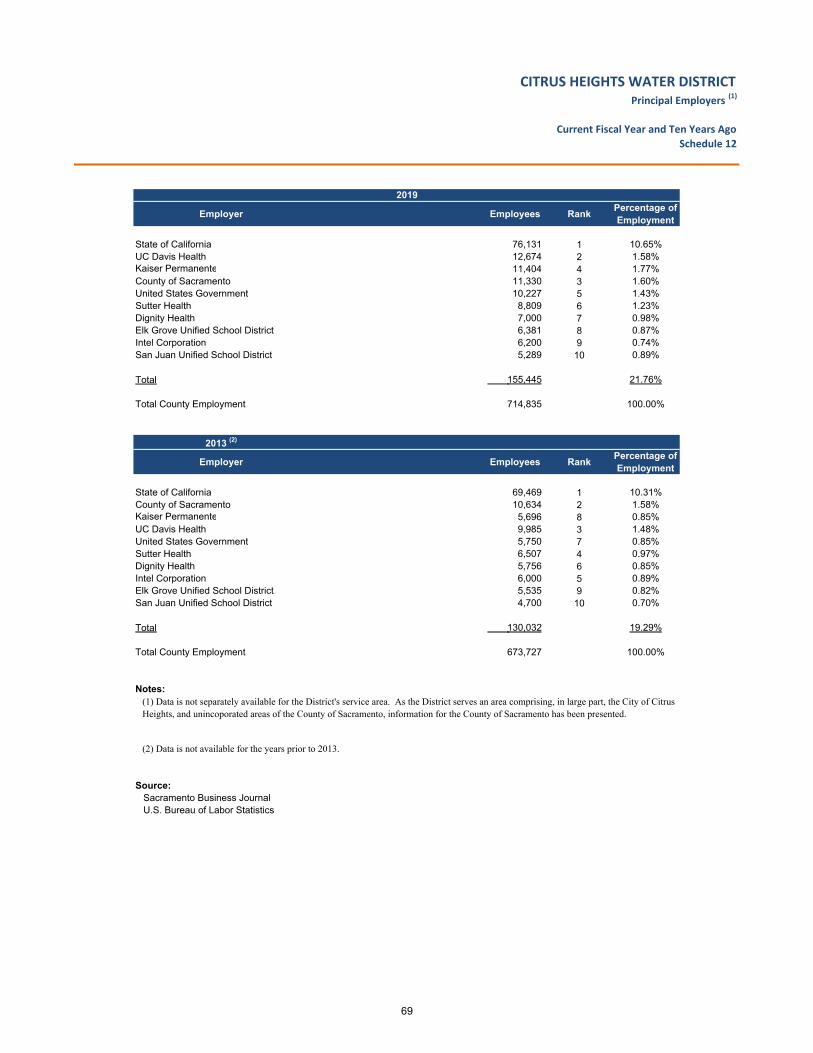
Employer Employees RankPercentage of Employment
State of California 76,131 1 10.65%UC Davis Health 12,674 2 1.58%Kaiser Permanente 11,404 4 1.77%County of Sacramento 11,330 3 1.60%United States Government 10,227 5 1.43%Sutter Health 8,809 6 1.23%Dignity Health 7,000 7 0.98%Elk Grove Unified School District 6,381 8 0.87%Intel Corporation 6,200 9 0.74%San Juan Unified School District 5,289 10 0.89%
Total 155,445 21.76%
Total County Employment 714,835 100.00%
2013 (2)
Employer Employees RankPercentage of Employment
State of California 69,469 1 10.31%County of Sacramento 10,634 2 1.58%Kaiser Permanente 5,696 8 0.85%UC Davis Health 9,985 3 1.48%United States Government 5,750 7 0.85%Sutter Health 6,507 4 0.97%Dignity Health 5,756 6 0.85%Intel Corporation 6,000 5 0.89%Elk Grove Unified School District 5,535 9 0.82%San Juan Unified School District 4,700 10 0.70%
Total 130,032 19.29%
Total County Employment 673,727 100.00%
Notes:
(2) Data is not available for the years prior to 2013.
Source: Sacramento Business Journal U.S. Bureau of Labor Statistics
(1) Data is not separately available for the District's service area. As the District serves an area comprising, in large part, the City of Citrus Heights, and unincoporated areas of the County of Sacramento, information for the County of Sacramento has been presented.
2019
CITRUS HEIGHTS WATER DISTRICTPrincipal Employers
(1)
Current Fiscal Year and Ten Years Ago
Schedule 12
69

Operating Information
70

Department 2010 2011 2012 2013 2014 2015 2016 2017 2018 2019
Administration 9 9 8 9 10 9 9 9 10 10
Engineering 3 3 4 4 4 4 4 5 5 5
Operations 15 16 17 18 16 16 16 16 16 17
Water Efficiency 2 2 2 2 2 2 2 2 3 3
Total 29 30 31 33 32 31 31 32 34 35
Source: District Administrative Services Department
CITRUS HEIGHTS WATER DISTRICTDistrict Employees by Department
Last Ten Fiscal Years
Schedule 11
0
5
10
15
20
25
30
35
2010
2011
2012
2013
2014
2015
2016
2017
2018
2019
EMPLOYEES BY DEPARTMENT
Administration Engineering Operations Water Efficiency
71
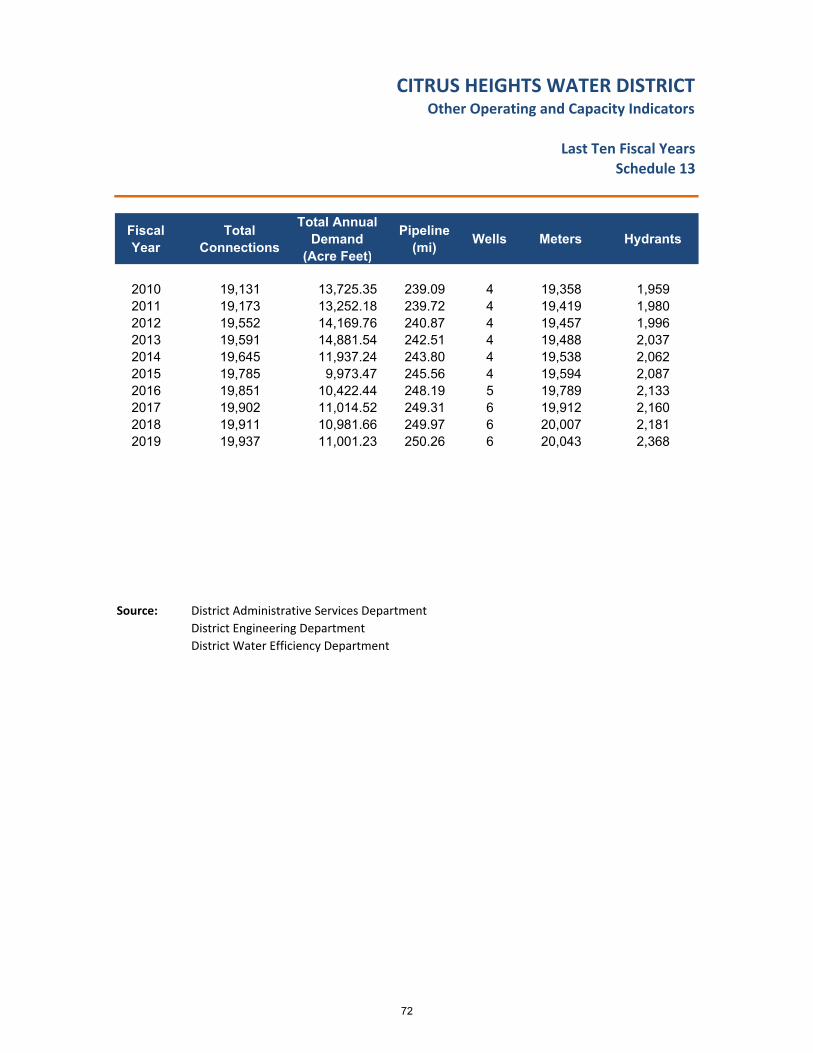
Fiscal Year
Total Connections
Total Annual Demand
(Acre Feet)
Pipeline (mi)
Wells Meters Hydrants
2010 19,131 13,725.35 239.09 4 19,358 1,9592011 19,173 13,252.18 239.72 4 19,419 1,9802012 19,552 14,169.76 240.87 4 19,457 1,9962013 19,591 14,881.54 242.51 4 19,488 2,0372014 19,645 11,937.24 243.80 4 19,538 2,0622015 19,785 9,973.47 245.56 4 19,594 2,0872016 19,851 10,422.44 248.19 5 19,789 2,1332017 19,902 11,014.52 249.31 6 19,912 2,1602018 19,911 10,981.66 249.97 6 20,007 2,1812019 19,937 11,001.23 250.26 6 20,043 2,368
Source: District Administrative Services Department
District Engineering Department
District Water Efficiency Department
CITRUS HEIGHTS WATER DISTRICTOther Operating and Capacity Indicators
Last Ten Fiscal YearsSchedule 13
72


6230 Sylvan Road
Citrus Heights, CA 95610
916.725.6873
www.chwd.org