Embed Size (px)
DESCRIPTION
This report ranks U.S. states for child safety during the summer. It includes findings and recommendations from five key areas: drowning, biking, falls, and car occupant safety, and pedestrian.
Citation preview
Safe Kids U.S. Summer Safety Ranking Report
May 2007

�
Letter from the ChairmanDear Friends:
Children are our most precious resource and our future. Parents spend every waking moment trying to keep their children safe from harm. Yet many do not realize that unintentional injuries are the leading cause of death for children 14 years of age and under. These injuries escalate in the summer, with children facing increased risks from drowning, falls, biking and other wheeled sports, being in and around motor vehicles and being pedestrians.
Since Safe Kids Worldwide’s founding in 1988, we have focused attention on the heightened summer risks to children by organizing National Safe Kids Week each May, with Johnson & Johnson’s support. The centerpiece of Safe Kids Week this year is The Safe Kids U.S. Summer Safety Ranking Report.
The goal of this study of summer unintentional death rates of children 14 and under is to assess which states have the highest and lowest numbers of children’s accidental injury deaths. We also sought to increase public awareness of the summer “trauma season” so that parents can be aware of its risks and ready to safeguard their children against them. Our report also recommends short-term and long-term measures that parents, communities and policy makers can take to keep children safe from serious disability and death.
Every child’s death is heartbreaking, no matter what the cause. But when a child dies from an unintentional injury, it is particularly tragic, because almost every single death could have been prevented.
A bike helmet can keep a skateboard fall from causing a fatal brain injury. A four-sided fence can prevent a toddler from entering the pool and drowning. A booster seat can keep a child alive during a car crash.
Our goal at Safe Kids Worldwide is to keep our precious children as safe as they can possibly be. Please join us in this most important task.
Sincerely,
Martin R. Eichelberger, M.D.Chairman, Safe Kids Worldwide
�
Table of Contents
Letter from the Chairman........................................... 2
Executive Summary ................................................... 4
Methodology ............................................................. 7
Ranking Results ........................................................ 8
Summer Risk Areas ................................................. 10
Drowning .......................................................... 11
Bike and Wheeled Sports Injuries ..................... 15
Falls .................................................................. 17
Motor Vehicle-Related Injuries ........................... 19
Pedestrian Injuries ............................................ 21
Conclusion .............................................................. 23
Call to Action ........................................................... 23

�
Executive SummarySummer is an exciting time of year for American families, often bringing vacations, barbecues, picnics and time away from work and school. Yet summer is also known as “trauma season” among public health and medical profes-sionals in the United States because unintentional deaths and serious injuries increase dramatically among children. Unfortunately, summer injuries aren’t limited to skinned knees and scraped elbows; they include paralysis, brain damage and even death.
During the summer of 2004, more than 2.4 million emer-gency room visits by children 14 and younger in the United States were due to unintentional injury,1 and 2,143 children died.2 A child’s death or injury is a personal and terrible tragedy for the family and the community. Perhaps less well-known is the economic toll unintentional injury exacts on society. In 2000, unintentional injuries and deaths of chil-dren ages 0 to 14 cost society $58 billion3 in medical bills, in lost wages of the children’s caregivers and in the future productivity of the children who died prematurely.
Since its founding in 1988, Safe Kids Worldwide has held an annual public education campaign in the United States called National Safe Kids Week. Focusing on a specific risk area each year, National Safe Kids Week is designed to educate parents, policy makers and others on the steps that are needed to keep chil-dren safe from unintentional injury, the leading cause of death and dis-ability for children.
This year’s theme is Make It A Safe Kids Summer. Thanks to Johnson & Johnson, the founding sponsor of Safe Kids Worldwide, National Safe Kids Week 2007 includes research, advocacy for public policy initia-tives, the distribution of safety devices and grassroots events through hundreds of Safe Kids coalitions across the nation.
The research for National Safe Kids Week 2007 can be found in this report, titled “Safe Kids U.S. Summer Safety Ranking Report.” The research examined the unintentional injury death rates of children ages 0 to 14 in the 50 states and the District of Columbia during the summer months and the change in those death rates over a five-year period. The Pacific Institute for Research and Evaluation conducted the research in consultation with an expert advisory com-mittee.
Ultimately, the goal of this report is to enhance public awareness of unintentional injury risks to children in the summer and the specific measures that parents, communities and policy makers can take to keep children safe from death and serious disability.
Unintentional injury remains the number 1 killer of children in the United States, with more than 2,000 chil-dren dying each summer from injuries that could have been prevented.
��
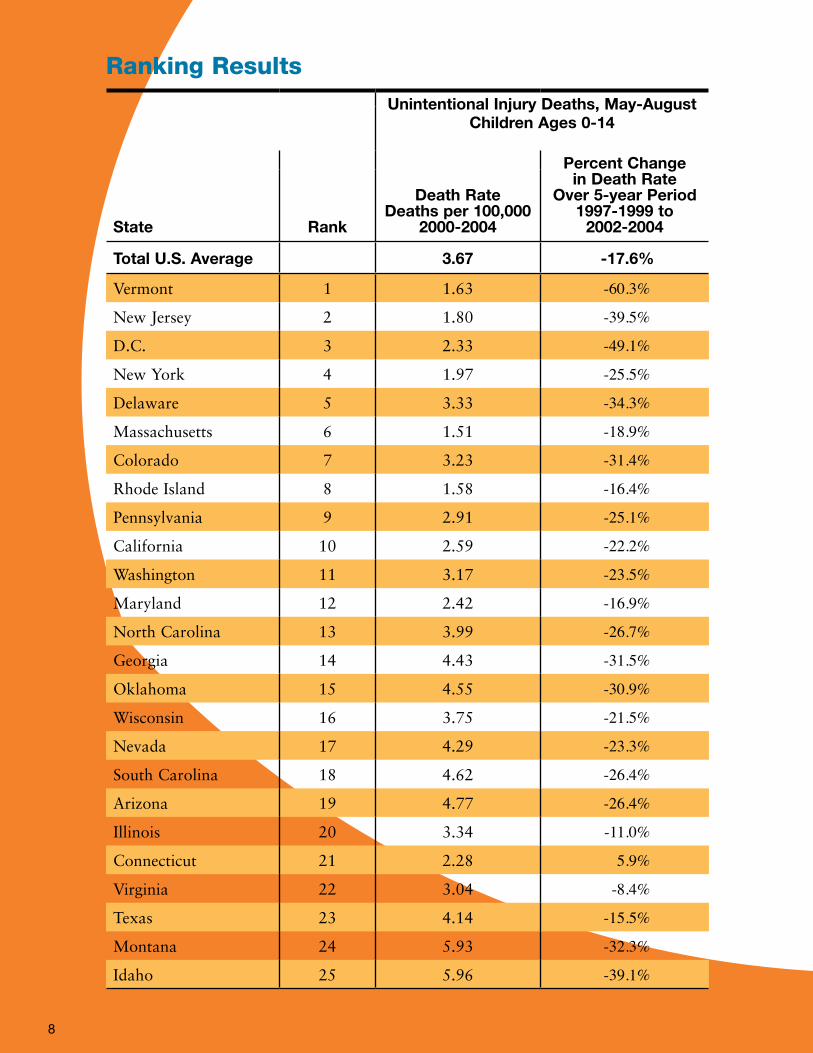
Methodology – Ranking Process Each state and the District of Columbia was given a rank-ing of 1 through 51 based on the state’s child unintentional death rate in the summer and the increase or decrease in that death rate over a five-year period, as described below.
Death Rate: A state’s average annual child unintentional injury death rate (deaths per 100,000 children ages 0 to 14) during the summer months of May through August was calculated for the years 2000 through 2004.
Percent Change in Death Rate: The percent change in the state’s unintentional death rate over five years was measured by the difference between the average annual death rate for 1997-1999 and the average annual death rate for 2002-2004.
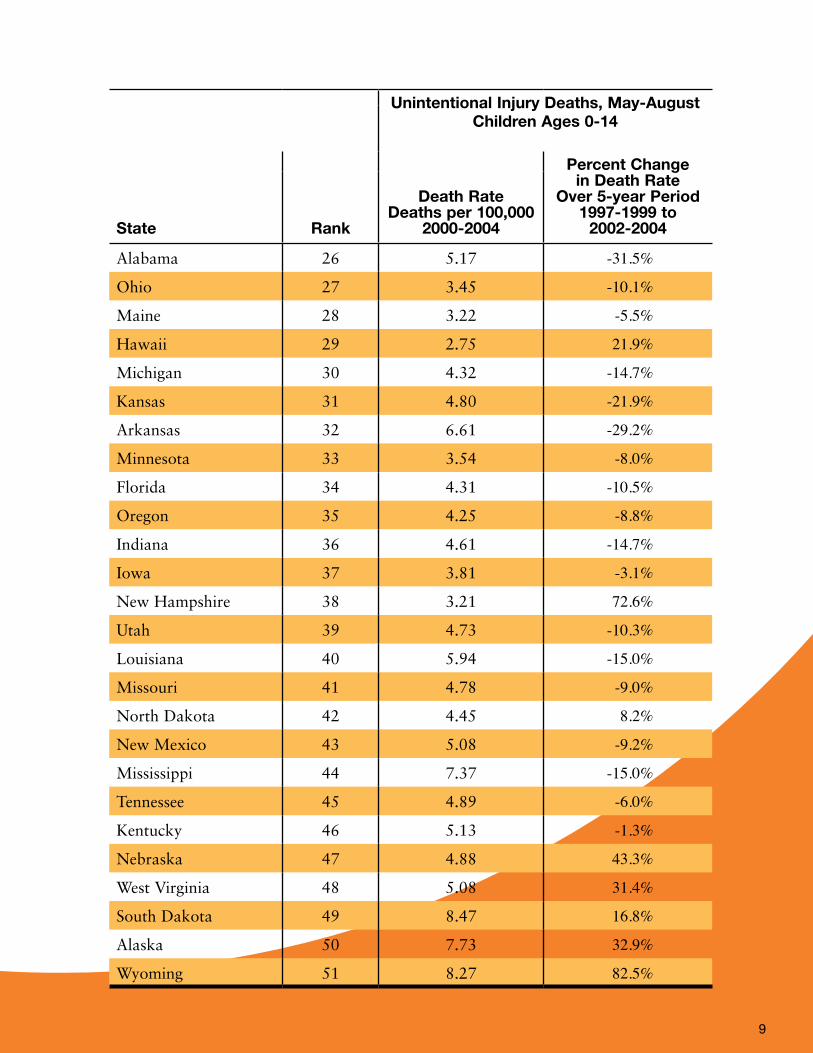
Ranking ResultsVermont ranked number 1, with a childhood unintentional injury death rate below the national average and a 60.3 percent reduction in the death rate over the relevant five-year period. The next highest-ranking states were New Jersey (#2), District of Columbia (#3), New York (#4) and Delaware (#5). Wyoming ranked last at 51, with a child-hood unintentional injury death rate above the national average and an 82.5 percent increase in that rate. The next lowest ranking states were Alaska (#50), South Dakota (#49), West Virginia (#48) and Nebraska (#47).
•
•
In addition, the average annual summertime injury death rate for the United States was 3.67 deaths per 100,000 children for 2000 to 2004. By state, the death rate during this time period ranged from a low of 1.51 per 100,000 in Massachusetts to a high of 8.47 per 100,000 in South Dakota. See page 8 for the chart of complete results.
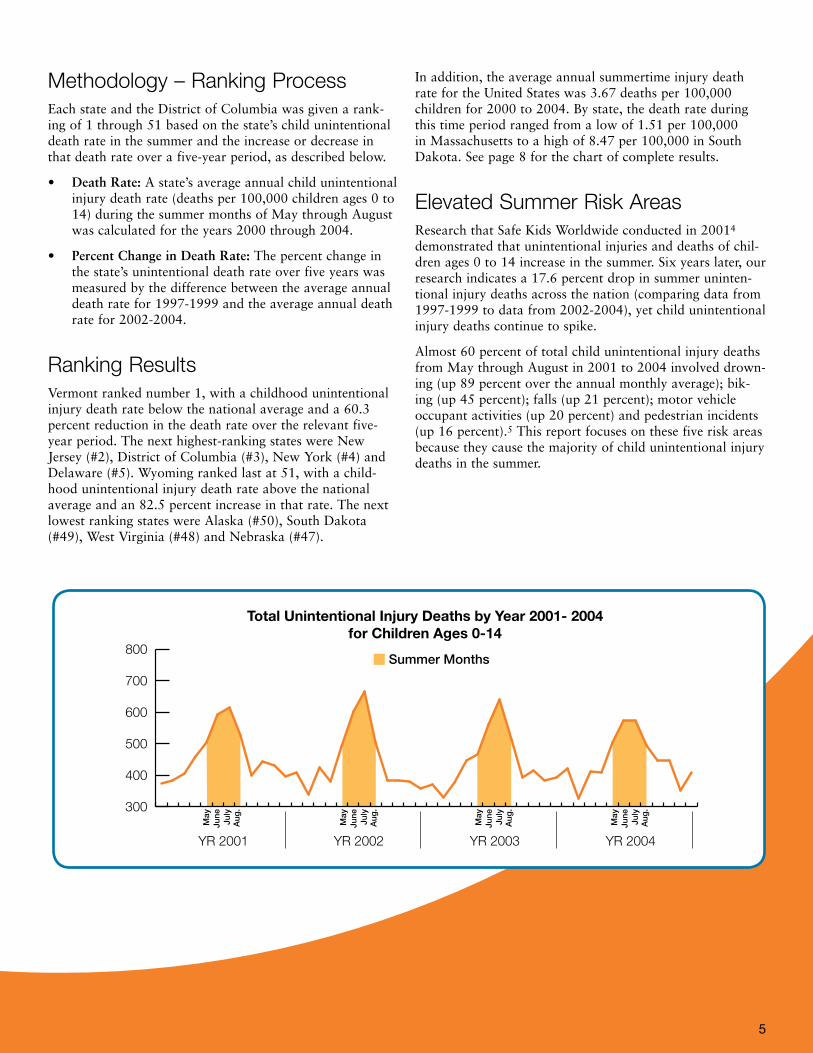
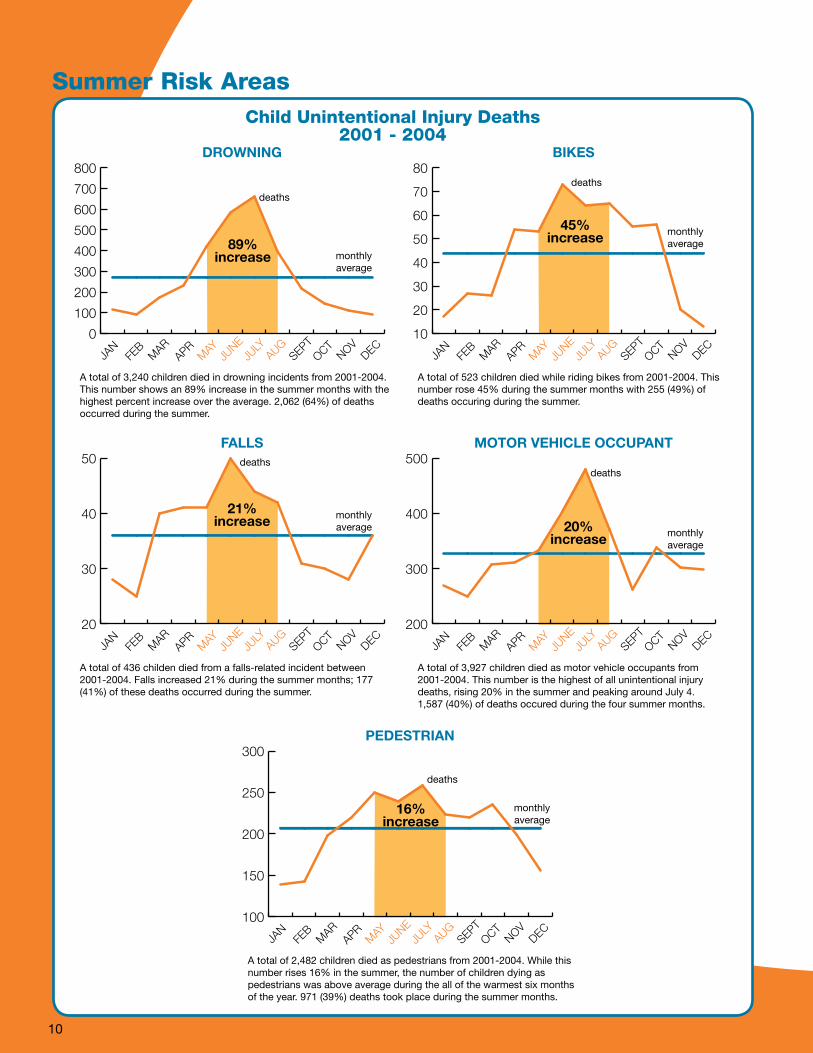
Elevated Summer Risk Areas Research that Safe Kids Worldwide conducted in 20014 demonstrated that unintentional injuries and deaths of chil-dren ages 0 to 14 increase in the summer. Six years later, our research indicates a 17.6 percent drop in summer uninten-tional injury deaths across the nation (comparing data from 1997-1999 to data from 2002-2004), yet child unintentional injury deaths continue to spike.
Almost 60 percent of total child unintentional injury deaths from May through August in 2001 to 2004 involved drown-ing (up 89 percent over the annual monthly average); bik-ing (up 45 percent); falls (up 21 percent); motor vehicle occupant activities (up 20 percent) and pedestrian incidents (up 16 percent).5 This report focuses on these five risk areas because they cause the majority of child unintentional injury deaths in the summer.
300
400
500
600
700
800
YR 2001
Summer Months
Total Unintentional Injury Deaths by Year 2001- 2004 for Children Ages 0-14
YR 2002 YR 2003 YR 2004
May
June
July
Aug
.
May
June
July
Aug
.
May
June
July
Aug
.
May
June
July
Aug
.
ConclusionUnintentional injury remains the number 1 killer of children in the United States, with more than 2,000 children dying each summer from injuries that could have been prevented.6 However, we are making progress. Factors that may have contributed to the 17.6 percent decline in the children’s summer death rate include:
Better research into the causes of child deaths from unintentional injury.
Recognition of child unintentional injury as a public health issue amenable to prevention, rather than a result of unforeseen, uncontrollable “accidents.”
Effectiveness of intervention strategies, including:
Targeted public education campaigns by national and community organizations and federal agencies.
Development, improvement and increased use of safety devices.
Enactment and enforcement of child safety laws.
Safe Kids Worldwide and its coalitions will continue to work in partnership with community organizations, law enforcement, legislators, governments, businesses, schools and parents on initiatives to improve child safety.
However, all 50 states and the District of Columbia need to work harder to implement the best practices and laws that can contribute to making children safer and to enforce them to ensure compliance. They include:
Comprehensive child passenger safety laws.
Wheeled sports helmet laws.
Requirements that playgrounds meet the Consumer Product Safety Commission’s recommended safety guidelines.
Laws mandating four-sided residential pool fencing.
But laws are only part of the multifaceted solution to pro-tect children.
Call To ActionSafe Kids Worldwide calls on this nation to place the highest priority on childhood injury prevention. Below are all our recommended Calls to Action. We must act quickly if lives are to be saved and serious injuries are to be prevented.
To reduce the number of injuries and deaths to children, Safe Kids Worldwide recommends the following steps:
•
•
•
–
–
–
•
•
•
•
Parents and Caregivers
Actively supervise your child when engaging in sum-mertime activities, such as swimming and playing on playgrounds.
Use the appropriate safety gear for your child’s activities (helmet for wheeled sports, car seat or booster seat as appropriate, life jacket for open-water swimming and boating, etc.).
Federal Government
Work with relevant industries to evaluate and improve the effectiveness of safety products and make safety devices more affordable and available to all families.
Increase funding for federal agencies charged with protecting children from unintentional injury, includ-ing the CPSC and the Centers for Disease Control and Prevention’s National Center for Injury Prevention and Control.
State Governments
Strengthen surveillance of nonfatal injuries by recom-mending that hospital admission and emergency room records in every state incorporate external cause of injury coding.
Adequately fund injury prevention units in state and local health departments to collect and analyze injury data and implement public education programs.
Fund the design and engineering of accessible walking, bicycling and play environments (e.g., streetlights, traf-fic-calming measures, playgrounds, sidewalks, paths and trails).
Evaluate the effectiveness of state and local injury prevention programs to ensure that scarce resources are dedicated to interventions with a proven ability to reduce injuries and deaths among children.
Enact and enforce stronger laws to protect children of all ages (e.g., child passenger safety laws, pool safety laws, wheeled sports helmet laws, life jacket laws).
Local Governments
Design and engineer accessible walking, bicycling and play environments (e.g., streetlights, traffic-calming measures, playgrounds, sidewalks, paths and trails).
Ensure that targeted interventions reach the people at highest risk of death and injury, who are often in lower-income communities.
Private Sector/Community Organizations
Fund, develop and implement research-based programs to educate adults and children regarding safe play, espe-cially during the summer months.
•
•
•
•
•
•
•
•
•
•
•
•
�
��
Methodology
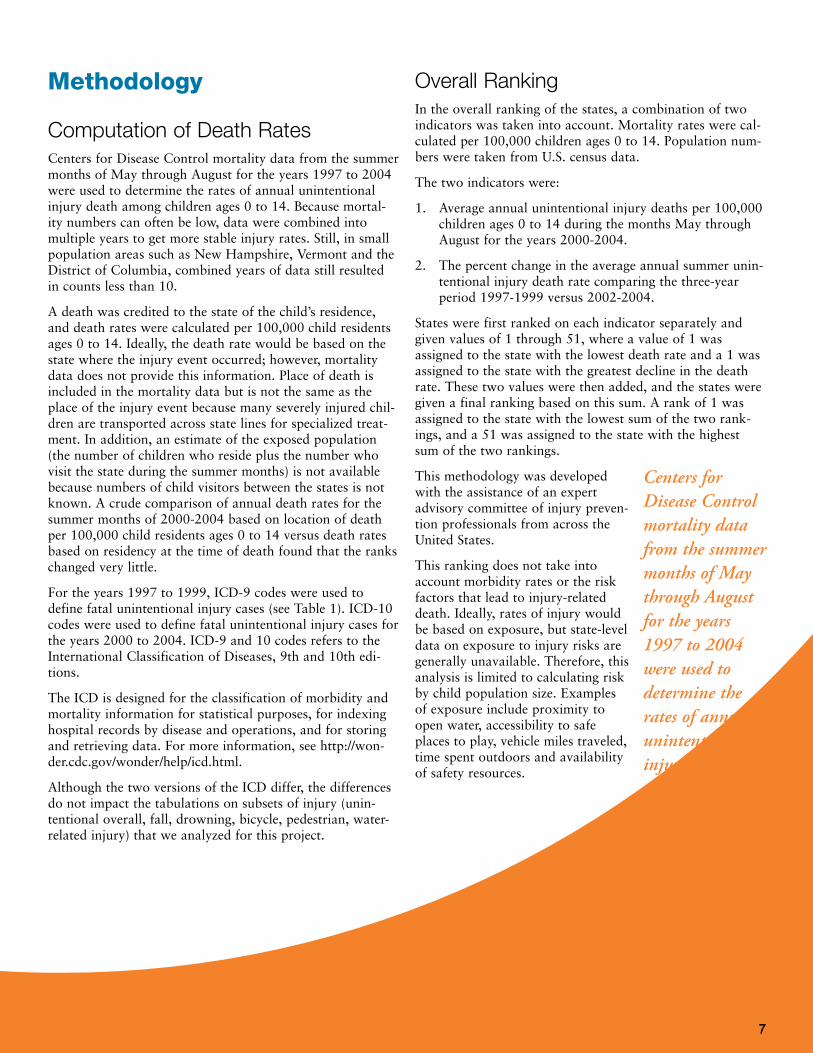
Computation of Death RatesCenters for Disease Control mortality data from the summer months of May through August for the years 1997 to 2004 were used to determine the rates of annual unintentional injury death among children ages 0 to 14. Because mortal-ity numbers can often be low, data were combined into multiple years to get more stable injury rates. Still, in small population areas such as New Hampshire, Vermont and the District of Columbia, combined years of data still resulted in counts less than 10.
A death was credited to the state of the child’s residence, and death rates were calculated per 100,000 child residents ages 0 to 14. Ideally, the death rate would be based on the state where the injury event occurred; however, mortality data does not provide this information. Place of death is included in the mortality data but is not the same as the place of the injury event because many severely injured chil-dren are transported across state lines for specialized treat-ment. In addition, an estimate of the exposed population (the number of children who reside plus the number who visit the state during the summer months) is not available because numbers of child visitors between the states is not known. A crude comparison of annual death rates for the summer months of 2000-2004 based on location of death per 100,000 child residents ages 0 to 14 versus death rates based on residency at the time of death found that the ranks changed very little.
For the years 1997 to 1999, ICD-9 codes were used to define fatal unintentional injury cases (see Table 1). ICD-10 codes were used to define fatal unintentional injury cases for the years 2000 to 2004. ICD-9 and 10 codes refers to the International Classification of Diseases, 9th and 10th edi-tions.
The ICD is designed for the classification of morbidity and mortality information for statistical purposes, for indexing hospital records by disease and operations, and for storing and retrieving data. For more information, see http://won-der.cdc.gov/wonder/help/icd.html.
Although the two versions of the ICD differ, the differences do not impact the tabulations on subsets of injury (unin-tentional overall, fall, drowning, bicycle, pedestrian, water-related injury) that we analyzed for this project.
Overall RankingIn the overall ranking of the states, a combination of two indicators was taken into account. Mortality rates were cal-culated per 100,000 children ages 0 to 14. Population num-bers were taken from U.S. census data.
The two indicators were:
Average annual unintentional injury deaths per 100,000 children ages 0 to 14 during the months May through August for the years 2000-2004.
The percent change in the average annual summer unin-tentional injury death rate comparing the three-year period 1997-1999 versus 2002-2004.
States were first ranked on each indicator separately and given values of 1 through 51, where a value of 1 was assigned to the state with the lowest death rate and a 1 was assigned to the state with the greatest decline in the death rate. These two values were then added, and the states were given a final ranking based on this sum. A rank of 1 was assigned to the state with the lowest sum of the two rank-ings, and a 51 was assigned to the state with the highest sum of the two rankings.
This methodology was developed with the assistance of an expert advisory committee of injury preven-tion professionals from across the United States.
This ranking does not take into account morbidity rates or the risk factors that lead to injury-related death. Ideally, rates of injury would be based on exposure, but state-level data on exposure to injury risks are generally unavailable. Therefore, this analysis is limited to calculating risk by child population size. Examples of exposure include proximity to open water, accessibility to safe places to play, vehicle miles traveled, time spent outdoors and availability of safety resources.
1.
2.
Centers for Disease Control mortality data from the summer months of May through August for the years 1997 to 2004 were used to determine the rates of annual unintentional injury death among children ages 0 to 14.
Unintentional Injury Deaths, May-August Children Ages 0-14
Death Rate Deaths per 100,000
2000-2004
Percent Change in Death Rate
Over 5-year Period 1997-1999 to
2002-2004State Rank
Total U.S. Average 3.67 -17.6%
Vermont 1 1.63 -60.3%
New Jersey 2 1.80 -39.5%
D.C. 3 2.33 -49.1%
New York 4 1.97 -25.5%
Delaware 5 3.33 -34.3%
Massachusetts 6 1.51 -18.9%
Colorado 7 3.23 -31.4%
Rhode Island 8 1.58 -16.4%
Pennsylvania 9 2.91 -25.1%
California 10 2.59 -22.2%
Washington 11 3.17 -23.5%
Maryland 12 2.42 -16.9%
North Carolina 13 3.99 -26.7%
Georgia 14 4.43 -31.5%
Oklahoma 15 4.55 -30.9%
Wisconsin 16 3.75 -21.5%
Nevada 17 4.29 -23.3%
South Carolina 18 4.62 -26.4%
Arizona 19 4.77 -26.4%
Illinois 20 3.34 -11.0%
Connecticut 21 2.28 5.9%
Virginia 22 3.04 -8.4%
Texas 23 4.14 -15.5%
Montana 24 5.93 -32.3%
Idaho 25 5.96 -39.1%
�
Ranking Results
�
Unintentional Injury Deaths, May-August Children Ages 0-14
Death Rate Deaths per 100,000
2000-2004
Percent Change in Death Rate
Over 5-year Period 1997-1999 to
2002-2004State Rank
Alabama 26 5.17 -31.5%
Ohio 27 3.45 -10.1%
Maine 28 3.22 -5.5%
Hawaii 29 2.75 21.9%
Michigan 30 4.32 -14.7%
Kansas 31 4.80 -21.9%
Arkansas 32 6.61 -29.2%
Minnesota 33 3.54 -8.0%
Florida 34 4.31 -10.5%
Oregon 35 4.25 -8.8%
Indiana 36 4.61 -14.7%
Iowa 37 3.81 -3.1%
New Hampshire 38 3.21 72.6%
Utah 39 4.73 -10.3%
Louisiana 40 5.94 -15.0%
Missouri 41 4.78 -9.0%
North Dakota 42 4.45 8.2%
New Mexico 43 5.08 -9.2%
Mississippi 44 7.37 -15.0%
Tennessee 45 4.89 -6.0%
Kentucky 46 5.13 -1.3%
Nebraska 47 4.88 43.3%
West Virginia 48 5.08 31.4%
South Dakota 49 8.47 16.8%
Alaska 50 7.73 32.9%
Wyoming 51 8.27 82.5%
10
0
100
200
300
400
500
600
700
800
JAN
FEB
MAR
APRM
AYJU
NEJU
LYAUG
SEPTOCT
NOVDEC
A total of 3,240 children died in drowning incidents from 2001-2004.This number shows an 89% increase in the summer months with the highest percent increase over the average. 2,062 (64%) of deathsoccurred during the summer.
DROWNING
89%increase
10
20
30
40
50
60
70
80
JAN
FEB
MAR
APRM
AYJU
NEJU
LYAUG
SEPTOCT
NOVDEC
A total of 523 children died while riding bikes from 2001-2004. This number rose 45% during the summer months with 255 (49%) of deaths occuring during the summer.
BIKES
45%increase
monthlyaverage
deaths
monthlyaverage
deaths
Child Unintentional Injury Deaths2001 - 2004
100
150
200
250
300
JAN
FEB
MAR
APRM
AYJU
NEJU
LYAUG
SEPTOCT
NOVDEC
A total of 2,482 children died as pedestrians from 2001-2004. While thisnumber rises 16% in the summer, the number of children dying aspedestrians was above average during the all of the warmest six monthsof the year. 971 (39%) deaths took place during the summer months.
PEDESTRIAN
16%increase
monthlyaverage
deaths
20
30
40
50
JAN
FEB
MAR
APRM
AYJU
NEJU
LYAUG
SEPTOCT
NOVDEC
A total of 436 childen died from a falls-related incident between2001-2004. Falls increased 21% during the summer months; 177 (41%) of these deaths occurred during the summer.
FALLS
21%increase
200
300
400
500
JAN
FEB
MAR
APRM
AYJU
NEJU
LYAUG
SEPTOCT
NOVDEC
A total of 3,927 children died as motor vehicle occupants from2001-2004. This number is the highest of all unintentional injurydeaths, rising 20% in the summer and peaking around July 4. 1,587 (40%) of deaths occured during the four summer months.
MOTOR VEHICLE OCCUPANT
20%increase
monthlyaverage
deaths
monthlyaverage
deaths
Summer Risk Areas
11
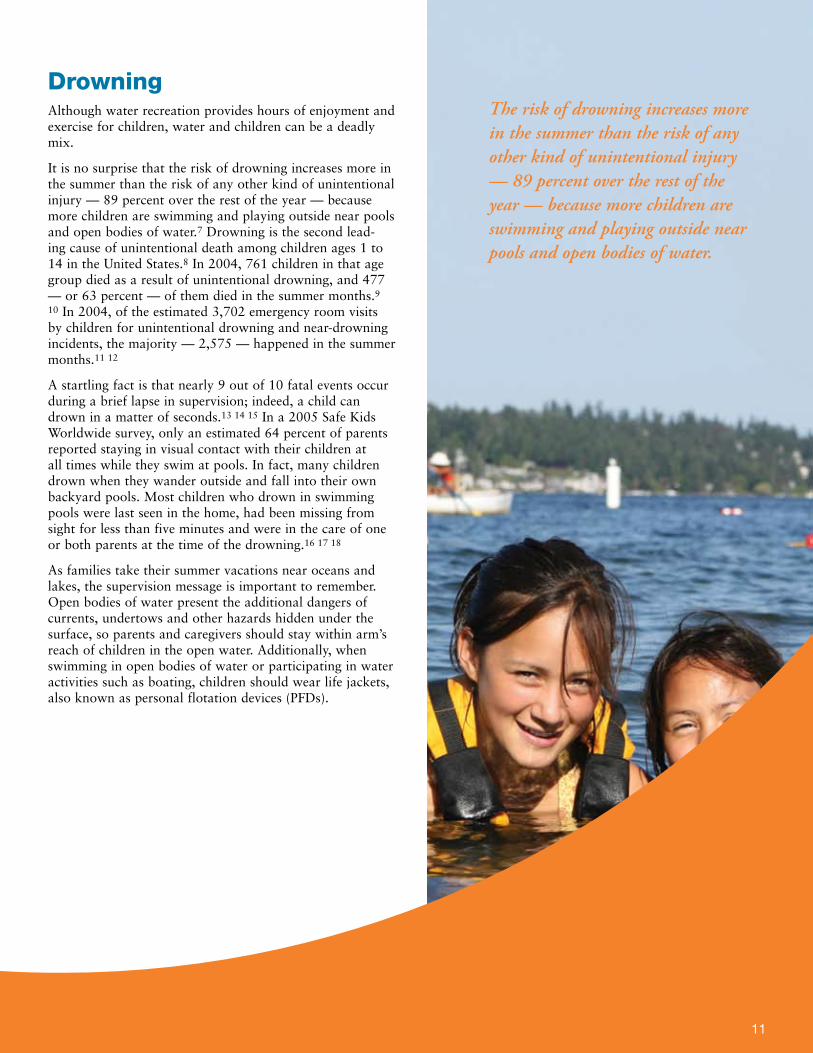
DrowningAlthough water recreation provides hours of enjoyment and exercise for children, water and children can be a deadly mix.
It is no surprise that the risk of drowning increases more in the summer than the risk of any other kind of unintentional injury — 89 percent over the rest of the year — because more children are swimming and playing outside near pools and open bodies of water.7 Drowning is the second lead-ing cause of unintentional death among children ages 1 to 14 in the United States.8 In 2004, 761 children in that age group died as a result of unintentional drowning, and 477 — or 63 percent — of them died in the summer months.9
10 In 2004, of the estimated 3,702 emergency room visits by children for unintentional drowning and near-drowning incidents, the majority — 2,575 — happened in the summer months.11 12
A startling fact is that nearly 9 out of 10 fatal events occur during a brief lapse in supervision; indeed, a child can drown in a matter of seconds.13 14 15 In a 2005 Safe Kids Worldwide survey, only an estimated 64 percent of parents reported staying in visual contact with their children at all times while they swim at pools. In fact, many children drown when they wander outside and fall into their own backyard pools. Most children who drown in swimming pools were last seen in the home, had been missing from sight for less than five minutes and were in the care of one or both parents at the time of the drowning.16 17 18
As families take their summer vacations near oceans and lakes, the supervision message is important to remember. Open bodies of water present the additional dangers of currents, undertows and other hazards hidden under the surface, so parents and caregivers should stay within arm’s reach of children in the open water. Additionally, when swimming in open bodies of water or participating in water activities such as boating, children should wear life jackets, also known as personal flotation devices (PFDs).
The risk of drowning increases more in the summer than the risk of any other kind of unintentional injury — 89 percent over the rest of the year — because more children are swimming and playing outside near pools and open bodies of water.
1�
Drowning PreventionPhysical devices can aid in reducing the drowning risk for children, but they are not the only solution. Parents and caregivers must be educated about the risks of drowning and the short amount of time it can take to lose a child.
Swimming Pools
To limit children’s unsupervised access to swimming pools and spas in neighborhood backyards, installation and prop-er use of four-sided isolation fencing should be encouraged. Installing and properly using this type of fence could prevent 50 percent to 90 percent of swimming pool drownings and near drownings of children.19 20 21 Door alarms, pool alarms and automatic pool covers, when used correctly, can add an extra layer of protection.22 23 In addition, anti-entrapment devices can protect against a child becoming entrapped on the drain of a pool or spa.
Open Water and Boats
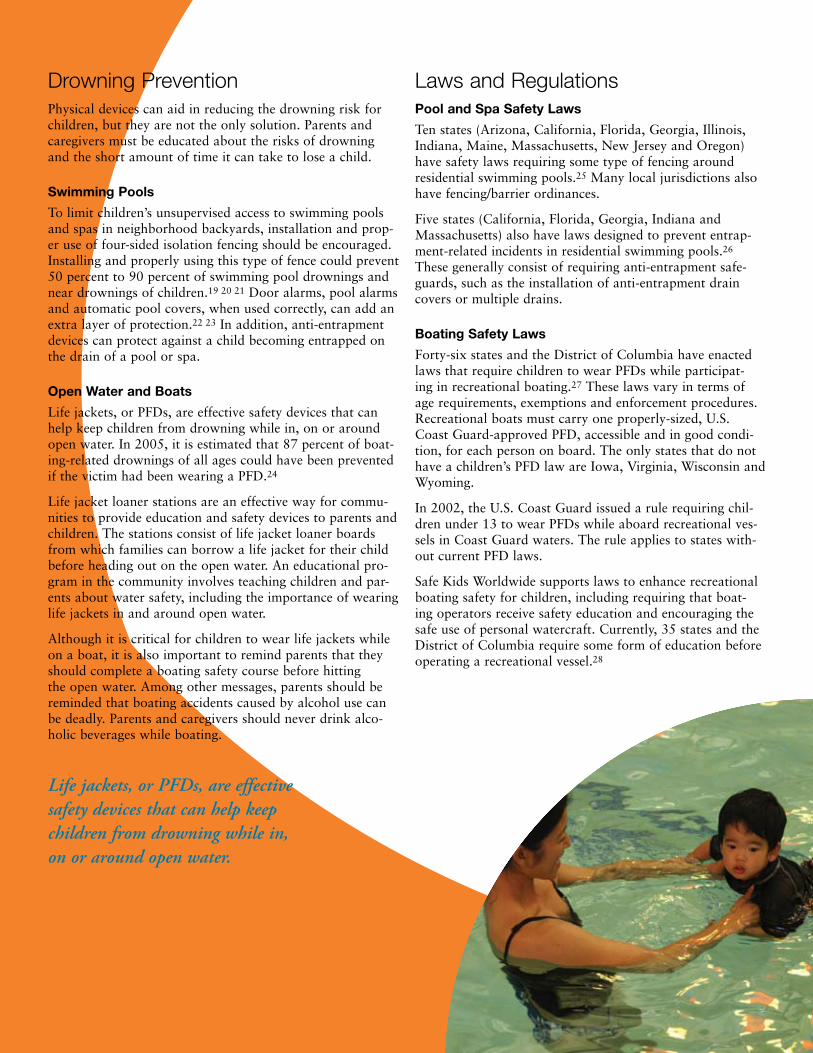
Life jackets, or PFDs, are effective safety devices that can help keep children from drowning while in, on or around open water. In 2005, it is estimated that 87 percent of boat-ing-related drownings of all ages could have been prevented if the victim had been wearing a PFD.24
Life jacket loaner stations are an effective way for commu-nities to provide education and safety devices to parents and children. The stations consist of life jacket loaner boards from which families can borrow a life jacket for their child before heading out on the open water. An educational pro-gram in the community involves teaching children and par-ents about water safety, including the importance of wearing life jackets in and around open water.
Although it is critical for children to wear life jackets while on a boat, it is also important to remind parents that they should complete a boating safety course before hitting the open water. Among other messages, parents should be reminded that boating accidents caused by alcohol use can be deadly. Parents and caregivers should never drink alco-holic beverages while boating.
Laws and Regulations Pool and Spa Safety Laws
Ten states (Arizona, California, Florida, Georgia, Illinois, Indiana, Maine, Massachusetts, New Jersey and Oregon) have safety laws requiring some type of fencing around residential swimming pools.25 Many local jurisdictions also have fencing/barrier ordinances.
Five states (California, Florida, Georgia, Indiana and Massachusetts) also have laws designed to prevent entrap-ment-related incidents in residential swimming pools.26 These generally consist of requiring anti-entrapment safe-guards, such as the installation of anti-entrapment drain covers or multiple drains.
Boating Safety Laws
Forty-six states and the District of Columbia have enacted laws that require children to wear PFDs while participat-ing in recreational boating.27 These laws vary in terms of age requirements, exemptions and enforcement procedures. Recreational boats must carry one properly-sized, U.S. Coast Guard-approved PFD, accessible and in good condi-tion, for each person on board. The only states that do not have a children’s PFD law are Iowa, Virginia, Wisconsin and Wyoming.
In 2002, the U.S. Coast Guard issued a rule requiring chil-dren under 13 to wear PFDs while aboard recreational ves-sels in Coast Guard waters. The rule applies to states with-out current PFD laws.
Safe Kids Worldwide supports laws to enhance recreational boating safety for children, including requiring that boat-ing operators receive safety education and encouraging the safe use of personal watercraft. Currently, 35 states and the District of Columbia require some form of education before operating a recreational vessel.28
Life jackets, or PFDs, are effective safety devices that can help keep children from drowning while in, on or around open water.

Those states are: Arkansas, Colorado, Connecticut, Delaware, Florida, Georgia, Illinois, Iowa, Kansas, Kentucky, Louisiana, Maryland, Michigan, Mississippi, Missouri, Nebraska, Nevada, New Hampshire, New Jersey, New Mexico, New York, North Dakota, Ohio, Oklahoma, Oregon, Pennsylvania, Rhode Island, South Dakota, Tennessee, Texas, Vermont, Virginia, Washington, West Virginia and Wisconsin.
Thirty-four states and the District of Columbia also require safety instruction at locations that rent per-sonal watercraft.29
Those states are: Alabama, Arkansas, Connecticut, Delaware, Florida, Hawaii, Idaho, Indiana, Iowa, Kentucky, Maine, Maryland, Massachusetts, Michigan, Minnesota, Mississippi, Missouri, Nevada, New Hampshire, New Jersey, New Mexico, New York, North Dakota, Ohio, Oregon, Pennsylvania, Tennessee, Texas, Utah, Vermont, Virginia, Washington, West Virginia and Wisconsin.
Kids Don’t Float
Twelve years ago, Safe Kids Homer in Alaska started Kids Don’t Float with the help of one of its members. The program combines education with a life jacket loaner pro-gram. The coalition devel-oped it in response to the state’s high rate of drown-ing for children and teen-agers, which is almost two and a half times the national average and significantly higher than that of any other state. The majority of Alaska’s drownings occur in the abundant marine waters, lakes and rivers within and surrounding the state. The Kids Don’t Float team endeavors to reduce the fatality rate and increase public awareness of child drowning issues.
To date, 1� children in Alaska have survived near-drowning incidents because of the life jacket program. Now other states are starting similar initiatives modeled after Alaska’s program.
Forty-six states and the District of Columbia have enacted laws that require children to wear PFDs while participating in recreational boating.
1�
1�
Call to Action
For Parents and Caregivers:
Actively supervise your children in and around water.
Install four-sided isolation fencing, at least four feet high, equipped with self-closing and self-latching gates, around a home pool or spa.
Make sure children wear an appropriately sized life jacket approved by the U.S. Coast Guard when on a boat, near open bodies of water, or when participating in water sports.
To avoid drain entanglement and entrapment in pools and spas, install anti-entrapment drain devices.
Begin teaching children to swim after age 4.
Teach children not to dive into water less than nine feet deep.
For Policy Makers, Injury Prevention Advocates and Community Organizations:
Educate parents, caregivers and children about safe behavior, such as always wearing a life jacket when on or near open bodies of water and installing four-sided fencing around home pools and spas.
Create and fund a multifaceted nationwide drowning awareness campaign.
Increase state and local public education efforts to address the dangers to young children from drowning in swimming pools, spas and open bodies of water.
Increase funding to establish or retain lifeguarding ser-vices at public beaches.
•
•
•
•
•
•
•
•
•
•
Provide designated swimming areas in lakes and other open bodies of water.
Enact state and local laws that require four-sided fenc-ing or barriers around all pools and spas. Pool and spa owners and operators should install four-sided fencing that complies with CPSC guidelines.
Enact state and local laws that require layers of protec-tion against entrapment: anti-entrapment drain covers, safety vacuum release systems and multiple drains in all pools and spas. Pool and spa owners and operators should install anti-entrapment devices.
Encourage states to address drowning and entrapment-related issues and to educate pool and spa users about associated risks.
Use the federal regulatory process to ensure that pool and spa environments and product features are properly engineered to prevent drowning and entrapment.
Enact state laws that require individuals on board any recreational vessel or boat on state waters to wear a Type I, II, III or V life jacket approved by the U.S. Coast Guard, in good condition and of the proper size for each person.
Enact state laws that require completion of an educa-tional course before an individual is permitted to oper-ate a boat or personal watercraft.
Enact state laws that require rental agencies to provide safety information and training to individuals renting a personal watercraft or any other recreational water ves-sel and require them to adhere to other provisions for safe boating.
Continue active enforcement of the Coast Guard’s rule requiring children under 13 to wear PFDs while aboard recreational vessels in Coast Guard waters.
•
•
•
•
•
•
•
•
•
Bicycle and Wheeled Sports InjuriesSummer weather brings children outdoors more often. That’s why it’s especially impor-tant to remind parents and children to play safely while biking or participating in wheeled sports.
Bicycles are associated with more childhood injuries than any other consumer prod-uct except automobiles,30 and bike-related injuries are especially common during the summer. Child bicycling deaths increase 45 percent above the monthly average in the summer.31 More than 70 percent of children ages 5 to 14 — or 27.7 million children — ride bicycles.32 In 2004, 132 children 14 and under died in unintentional bicycle crashes in the United States;33 67 of them died in the summer months.34
Also in 2004, 269,051 emergency room visits by children 14 and under were for bicycle-related injuries, with more than half — 144,587 — of those incidents occurring during the summer months.35 36 In general, 47 percent of those hospitalized because of a bike injury are diagnosed with a traumatic brain injury,37 the leading cause of death in bicycle crashes. The presence of a head injury is the most important predictor of bicycle-related death and permanent disability. Such injuries account for more than 60 percent of bicycle-related deaths, more than two-thirds of bicycle-related hospital admissions and about one-third of hospital emergency room visits.38 39 40 41 42
Wheeled sports such as skateboarding and skating continue to grow in popularity, and a significant rate of injury is associated with these activities. In 2004, more than 46,200 emergency room visits by chil-dren 5 to 14 years old were for injuries from inline skating and roller skating.43 In the same year, more than 43,100 emergency room visits by children 14 and under were for injuries involving non-powered scooters.44 Nearly 60,300 emergency room visits by chil-dren 5 to 14 years old were for skateboarding injuries.45
Children are 58 percent more likely to die from motor vehicle-related bicycle crashes at locations without intersections, 69 percent more likely to die from May through October and 70 percent more likely to die between the hours of 2 p.m. and 8 p.m.46
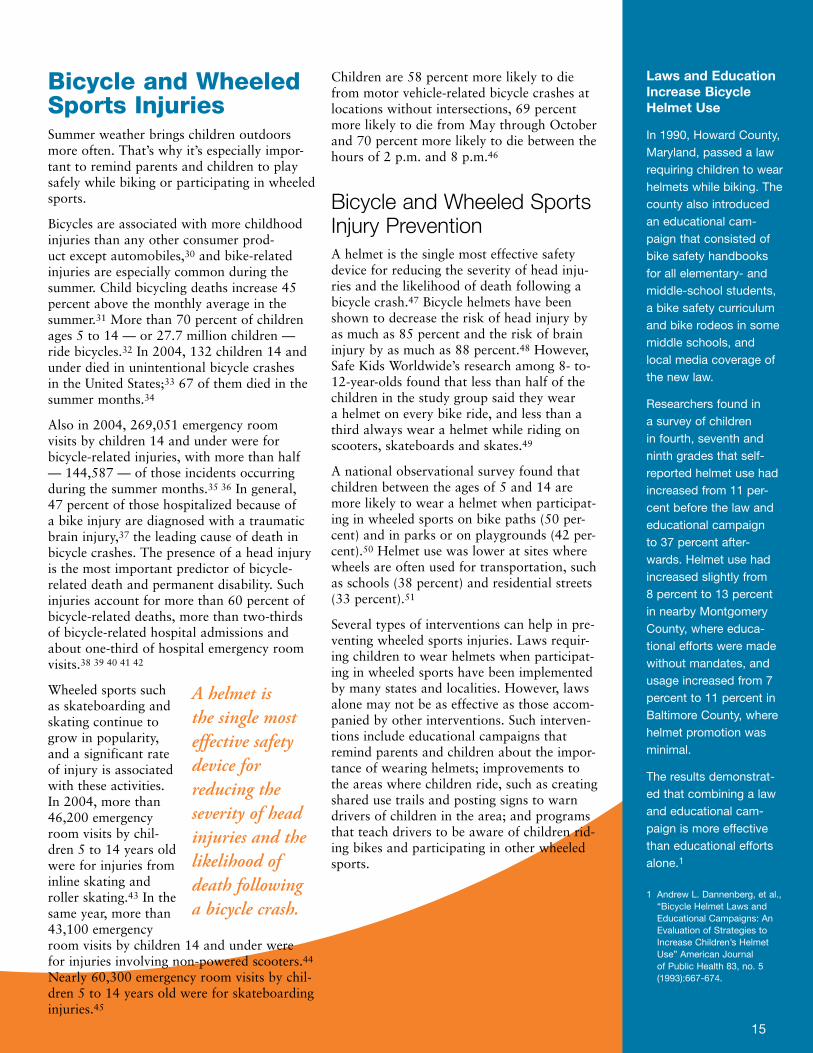
Bicycle and Wheeled Sports Injury PreventionA helmet is the single most effective safety device for reducing the severity of head inju-ries and the likelihood of death following a bicycle crash.47 Bicycle helmets have been shown to decrease the risk of head injury by as much as 85 percent and the risk of brain injury by as much as 88 percent.48 However, Safe Kids Worldwide’s research among 8- to-12-year-olds found that less than half of the children in the study group said they wear a helmet on every bike ride, and less than a third always wear a helmet while riding on scooters, skateboards and skates.49
A national observational survey found that children between the ages of 5 and 14 are more likely to wear a helmet when participat-ing in wheeled sports on bike paths (50 per-cent) and in parks or on playgrounds (42 per-cent).50 Helmet use was lower at sites where wheels are often used for transportation, such as schools (38 percent) and residential streets (33 percent).51
Several types of interventions can help in pre-venting wheeled sports injuries. Laws requir-ing children to wear helmets when participat-ing in wheeled sports have been implemented by many states and localities. However, laws alone may not be as effective as those accom-panied by other interventions. Such interven-tions include educational campaigns that remind parents and children about the impor-tance of wearing helmets; improvements to the areas where children ride, such as creating shared use trails and posting signs to warn drivers of children in the area; and programs that teach drivers to be aware of children rid-ing bikes and participating in other wheeled sports.
Laws and Education Increase Bicycle Helmet Use
In 1��0, Howard County, Maryland, passed a law requiring children to wear helmets while biking. The county also introduced an educational cam-paign that consisted of bike safety handbooks for all elementary- and middle-school students, a bike safety curriculum and bike rodeos in some middle schools, and local media coverage of the new law.
Researchers found in a survey of children in fourth, seventh and ninth grades that self-reported helmet use had increased from 11 per-cent before the law and educational campaign to �� percent after-wards. Helmet use had increased slightly from � percent to 1� percent in nearby Montgomery County, where educa-tional efforts were made without mandates, and usage increased from � percent to 11 percent in Baltimore County, where helmet promotion was minimal.
The results demonstrat-ed that combining a law and educational cam-paign is more effective than educational efforts alone.1
1 Andrew L. Dannenberg, et al., “Bicycle Helmet Laws and Educational Campaigns: An Evaluation of Strategies to Increase Children’s Helmet Use” American Journal of Public Health ��, no. � (1���):���-���.
1�
A helmet is the single most effective safety device for reducing the severity of head injuries and the likelihood of death following a bicycle crash.
1�
Laws and RegulationsTwenty-one states, the District of Columbia and at least 149 localities have enacted laws requiring bicycle helmet use in some circumstances.52 Most cover only young riders.
These states include: Alabama, California, Connecticut, Delaware, Florida, Georgia, Hawaii, Louisiana, Maine, Maryland, Massachusetts, New Hampshire, New Jersey, New Mexico, New York, North Carolina, Oregon, Pennsylvania, Rhode Island, Tennessee and West Virginia.
Some states have gone further and also required helmet use while riding scooters, inline skates and/or skateboards. Eight states (California, Maryland, Massachusetts, New Jersey, New Mexico, New York, Oregon and Rhode Island) and the District of Columbia have helmet laws that extend to one or more wheeled devices.53 The laws vary in terms of age requirements, exemptions and enforcement mechanisms.
In addition, the CPSC has established a federal safety stan-dard to ensure the quality and effectiveness of bicycle hel-mets.
Various studies have shown that laws are effective at increasing bicycle helmet use and reducing bicycle-related death and injury among children covered by the law.54 55 56
57 58 59 60 61 62 63 64 One study has shown that bicycle-related fatalities decreased by 60 percent in the five years after the passage of a state mandatory bicycle helmet law for children 13 and under.65 Police enforcement increases the effective-ness of such laws.66
Another study reported that the rate of bicycle helmet use by children 14 and under was 58 percent higher in a county with a comprehensive bicycle helmet law than in a similar county with a less comprehensive law.67
Call to Action
For Parents and Caregivers:
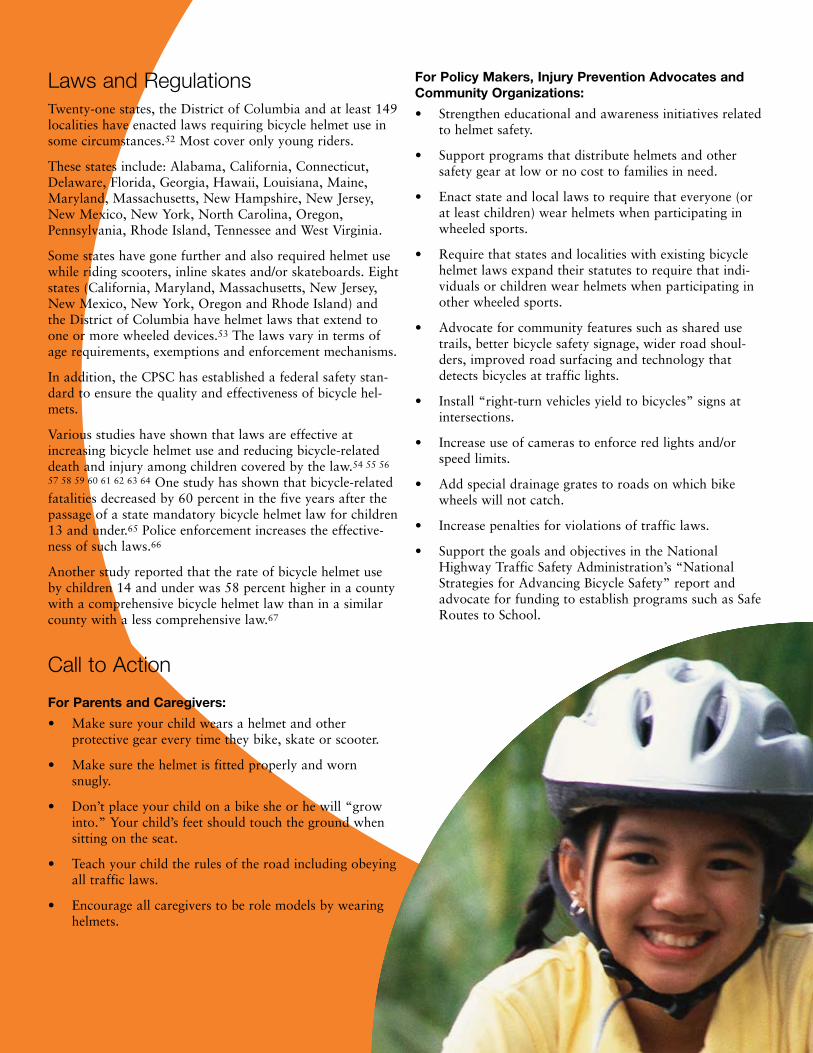
Make sure your child wears a helmet and other protective gear every time they bike, skate or scooter.
Make sure the helmet is fitted properly and worn snugly.
Don’t place your child on a bike she or he will “grow into.” Your child’s feet should touch the ground when sitting on the seat.
Teach your child the rules of the road including obeying all traffic laws.
Encourage all caregivers to be role models by wearing helmets.
•
•
•
•
•
For Policy Makers, Injury Prevention Advocates and Community Organizations:
Strengthen educational and awareness initiatives related to helmet safety.
Support programs that distribute helmets and other safety gear at low or no cost to families in need.
Enact state and local laws to require that everyone (or at least children) wear helmets when participating in wheeled sports.
Require that states and localities with existing bicycle helmet laws expand their statutes to require that indi-viduals or children wear helmets when participating in other wheeled sports.
Advocate for community features such as shared use trails, better bicycle safety signage, wider road shoul-ders, improved road surfacing and technology that detects bicycles at traffic lights.
Install “right-turn vehicles yield to bicycles” signs at intersections.
Increase use of cameras to enforce red lights and/or speed limits.
Add special drainage grates to roads on which bike wheels will not catch.
Increase penalties for violations of traffic laws.
Support the goals and objectives in the National Highway Traffic Safety Administration’s “National Strategies for Advancing Bicycle Safety” report and advocate for funding to establish programs such as Safe Routes to School.
•
•
•
•
•
•
•
•
•
•
FallsFalls are the leading cause of unintentional injury among children year-round,68 69 70 71 72 with nearly 40 percent of all nonfatal child injuries resulting from falls.73 74 Summertime is especially dangerous because the number of deaths from falls increases 21 percent,75 and window falls have consis-tently peaked during the summer months.76
In 2004, 107 children ages 14 and under died from unin-tentional falls in the United States, and 48 of them died in the summer.77 78 In 2004, more than 2.3 million emergency room visits by children 14 and under were for fall-related injuries, and more than 825,000 of those incidents occurred in the summer.79 80
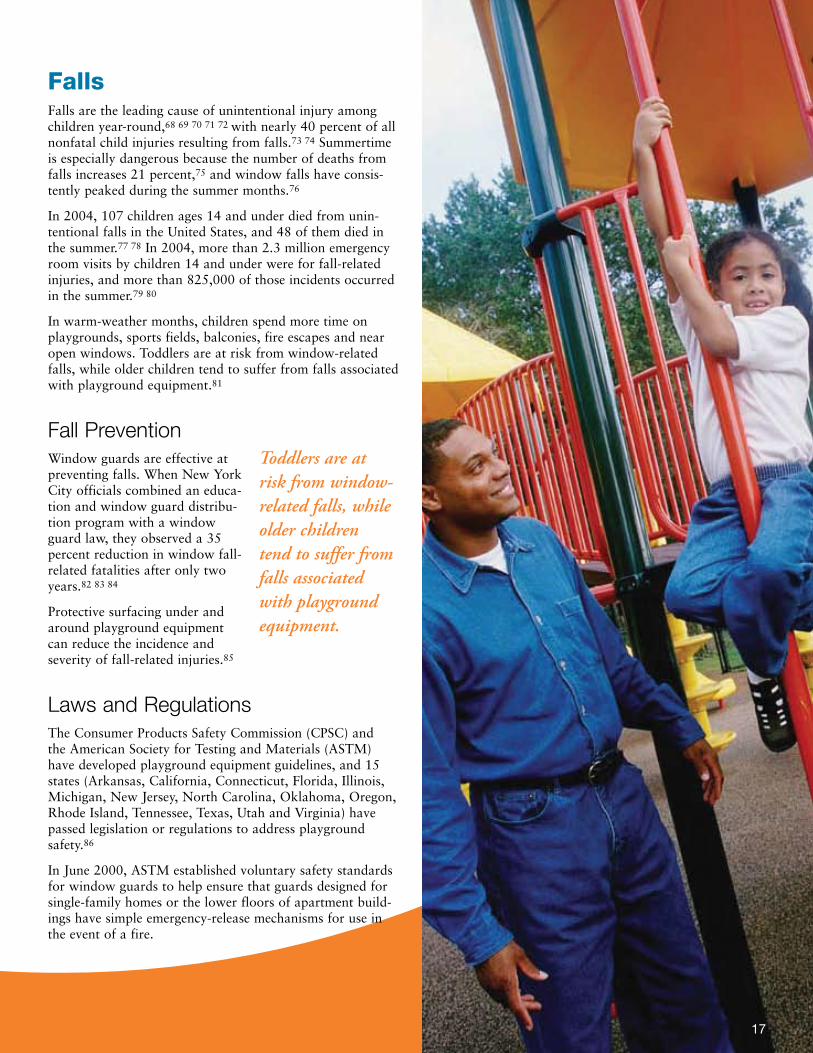
In warm-weather months, children spend more time on playgrounds, sports fields, balconies, fire escapes and near open windows. Toddlers are at risk from window-related falls, while older children tend to suffer from falls associated with playground equipment.81
Fall Prevention Window guards are effective at preventing falls. When New York City officials combined an educa-tion and window guard distribu-tion program with a window guard law, they observed a 35 percent reduction in window fall-related fatalities after only two years.82 83 84
Protective surfacing under and around playground equipment can reduce the incidence and severity of fall-related injuries.85
Laws and RegulationsThe Consumer Products Safety Commission (CPSC) and the American Society for Testing and Materials (ASTM) have developed playground equipment guidelines, and 15 states (Arkansas, California, Connecticut, Florida, Illinois, Michigan, New Jersey, North Carolina, Oklahoma, Oregon, Rhode Island, Tennessee, Texas, Utah and Virginia) have passed legislation or regulations to address playground safety.86
In June 2000, ASTM established voluntary safety standards for window guards to help ensure that guards designed for single-family homes or the lower floors of apartment build-ings have simple emergency-release mechanisms for use in the event of a fire.
Toddlers are at risk from window-related falls, while older children tend to suffer from falls associated with playground equipment.
1�

Call to Action
For Parents and Caregivers:
Keep chairs, cribs, and other furniture away from win-dows, and install window guards on all windows above the first floor.
Don’t allow children to play on balconies, roofs, or near open windows without a window guard or stop.
Actively supervise children when they play on a play-ground, and make sure they use age-appropriate equip-ment.
Look for playgrounds where the surfaces are covered at least 12 inches deep with shredded rubber, hardwood fiber mulch or fine sand, extending at least six feet in all directions around the equipment.
Make sure kids wear the right protective gear, properly fitted when practicing and playing sports.
For Policy Makers, Injury Prevention Advocates and Community Organizations:
Educate parents and caregivers about safe behavior, such as making sure children wear the right protective gear when playing sports and actively supervising children on playgrounds.
Increase the number of trained and certified playground inspectors who can educate the public about the need for safe surfacing, age-appropriate equipment and continuous maintenance.
Adopt the CPSC playground equipment guidelines as state law.
Regularly revisit the CPSC’s playground equipment guide-lines to ensure that they properly address emerging play risks from new activities and equipment.
Enact legislation that requires window guards on all win-dows above the first floor, especially in apartment build-ings.
Improve data collection and surveillance of fall risks at child care centers, schools and playgrounds.
Promote the use of stair gates, product safety straps and window guards approved by ASTM to prevent children from falling, and encourage states to adopt the organiza-tion’s standards as law.
•
•
•
•
•
•
•
•
•
•
•
•
Parents Learn Children Can’t Fly
Launched in 1���, New York’s Children Can’t Fly campaign consisted of an extensive educational initiative targeting parents about the dangers of falls and distributing free win-dow guards.1 Bolstered by a health code addition in 1��� mandating that own-ers of multiple dwellings provide window guards where children under age 10 lived, the program con-tributed to a �� percent decrease in unintentional window falls.�
1 Charlotte N. Spiegel and Francis C. Lindaman, “Children Can’t Fly: A Program to Prevent Childhood Morbidity and Mortality from Window Falls” American Journal of Public Health ��, no. 1� (1���):11��-11��.
� NL Vish, et al., “Pediatric Window Falls: Not Just a Problem for Children in High Rises” Injury Prevention 11, no. � (�00�):�00-�0�.
In 2004, more than 2.3 million emergency room visits by children 14 and under were for fall-related injuries, and more than 825,000 of those incidents occurred in the summer.
1�
window guard
Motor Vehicle-Related InjuriesSummer is a time when families take road trips, rent recre-ational or standard vehicles, and visit vacation destinations. Safety should not take a vacation, and families must build child passenger safety into their travel plans regardless of where or how they travel.
Motor vehicle crashes are the leading cause of death among children ages 3 to 14 in the United States,87 and child pas-senger fatalities increase 20 percent above the monthly average in the summer.88 In 2004, 990 child passengers ages 0 to 14 died in motor vehicle crashes, 380 of them in the summer months.89 90 In that same year, 221,196 emergency room visits by child passengers ages 0 to 14 were for traf-fic-related crashes, and 77,812 of those incidents happened in the summer months.91 92 The highest number of passen-ger fatalities among all ages typically occur on July 3 and 4 although spikes also happen around Memorial Day and Labor Day.93
Aside from crashes, there are many other dangers posed by motor vehicles. Unattended children in closed vehicles face extreme temperature increases in a short amount of time on a summer day. From 1998 to 2004, an average of 33 chil-dren died from heat stroke each year after being left unat-tended in a vehicle.94 Unattended children have placed cars in gear or fallen headfirst from partially opened windows. Unsupervised children often play in the vehicle’s trunk. Nine incidents of fatal car trunk entrapment were reported from 1987 to 1998, resulting in 19 deaths of children under 7.95 All of the incidents occurred in hot weather.96
Driveways and parking lots are especially hazardous for children at play. From 2001 to 2003, an estimated 7,475 children 14 and younger (or 2,492 per year) were treated in emergency rooms for injuries sustained after being struck while bicycling or walking in driveways, parking lots and other off-road settings.97 Fifty percent of these children were 1 to 4 years old.98 Forty-seven percent of the injuries occurred at home.99
Motor Vehicle Injury PreventionWhen used appropriately, car seats are effective safety tools. Research demonstrates that correctly installed car seats reduce fatal injury by 71 percent for infants under 1 year old and by 54 percent for toddlers ages 1 to 4.100 Booster seats reduce injury risk by 59 percent.101 Seat belts fit children who are 4'9" tall, weigh 80 to 100 pounds and are 8 to 12 years old.
However, children are not always properly secured in safety seats. Nearly one-third of children ride in the wrong restraint for their age and size,102 and an estimated 73 per-cent of car seats are not installed or used correctly.103 Car seat inspection stations and checkup events help parents and caregivers learn how to install and use car seats cor-
rectly and determine when it is safe to move older children from booster seats into seat belts.
Safety extends beyond restraint use. Issues related to vehicle backovers, trunk entrapment and children left unattended in vehicles require education efforts to increase driver awareness and reduce injuries and deaths in and around cars. For example, all drivers should walk around their vehicles before driving to make sure that there are no chil-dren or other objects around the vehicle. Drivers should also leave vehicles locked with keys out of reach of children.
Laws
Child Passenger Safety Laws
There is little dispute that car seats and seat belts, when used correctly and consistently, are extremely effective in saving lives and preventing injuries. Laws addressing child passenger safety and seat belt use have proven effective at increasing the use of restraints.
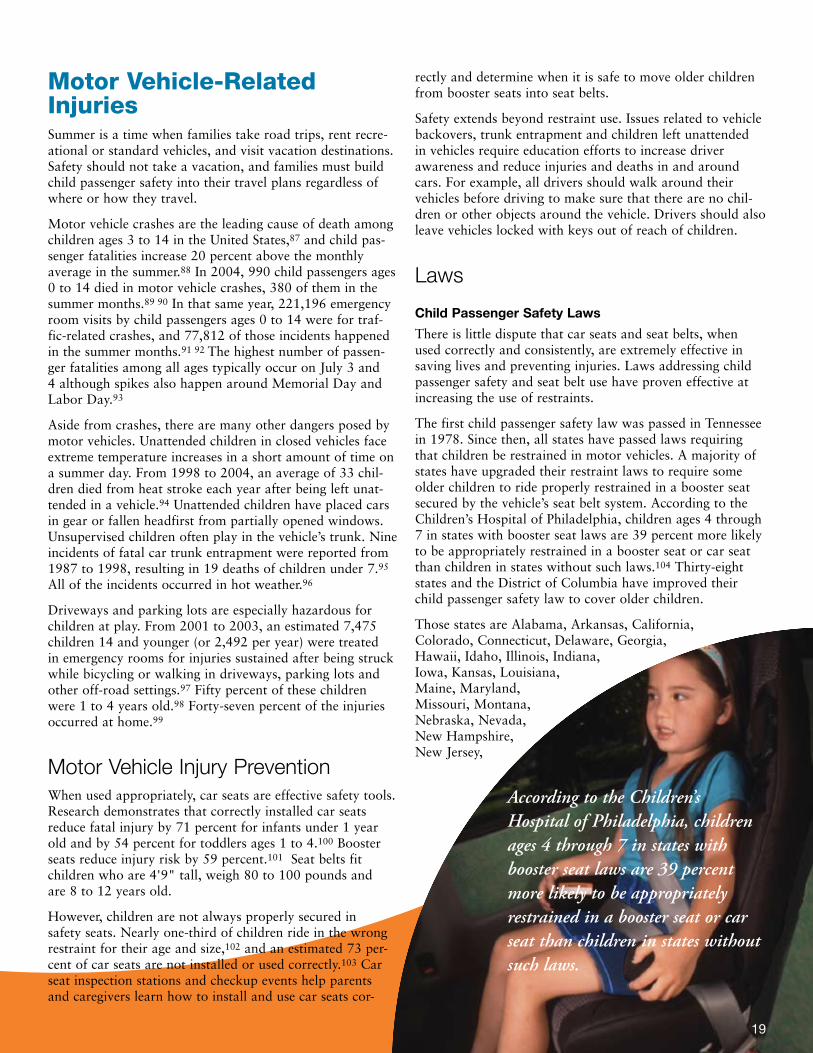
The first child passenger safety law was passed in Tennessee in 1978. Since then, all states have passed laws requiring that children be restrained in motor vehicles. A majority of states have upgraded their restraint laws to require some older children to ride properly restrained in a booster seat secured by the vehicle’s seat belt system. According to the Children’s Hospital of Philadelphia, children ages 4 through 7 in states with booster seat laws are 39 percent more likely to be appropriately restrained in a booster seat or car seat than children in states without such laws.104 Thirty-eight states and the District of Columbia have improved their child passenger safety law to cover older children.
Those states are Alabama, Arkansas, California, Colorado, Connecticut, Delaware, Georgia, Hawaii, Idaho, Illinois, Indiana, Iowa, Kansas, Louisiana, Maine, Maryland, Missouri, Montana, Nebraska, Nevada, New Hampshire, New Jersey,
According to the Children’s Hospital of Philadelphia, children ages 4 through 7 in states with booster seat laws are 39 percent more likely to be appropriately restrained in a booster seat or car seat than children in states without such laws.
1�
New Mexico, New York, North Carolina, North Dakota, Oklahoma, Oregon, Pennsylvania, Rhode Island, South Carolina, Tennessee, Vermont, Virginia, Washington, West Virginia, Wisconsin and Wyoming.
State laws are often weakened by gaps in cov-erage related to age, seating position, other exemptions and insufficient penalties. They can leave children unrestrained — or lawfully restrained and still woefully at risk.
Seat Belt Laws with Primary Enforcement
Primary enforcement of seat belt laws is one of the best ways to prevent injuries and save children’s lives. All 50 states have primary enforcement laws that enable police officers to stop and cite drivers who do not restrain infants and toddlers in vehicles without first finding another violation. However, as chil-dren age, many states reduce enforcement lev-els and child restraint requirements.
Primary enforcement has proven effective in increasing restraint use for both adults and children. In 2005, the average seat belt use rate in states with primary enforcement laws was 10 percentage points higher than in states with only a secondary enforcement law.105
Enactment of primary enforcement seat belt laws sends a critical message to the pub-lic that motor vehicle safety is paramount. Currently, seat belt use laws in only 25 states and the District of Columbia are subject to primary enforcement.106
Those states are Alabama, Alaska, California, Connecticut, Delaware, Georgia, Hawaii, Illinois, Indiana, Iowa, Kentucky, Louisiana, Maryland, Michigan, Mississippi, New Jersey, New Mexico, New York, North Carolina, Oklahoma, Oregon, South Carolina, Tennessee, Texas and Washington.
Laws Concerning Unattended Children in Vehicles
Safe Kids Worldwide strongly supports the enactment of safety laws that prohibit leaving children unattended in motor vehicles. Such laws should impose a fine or other penalty on a driver, parent or caregiver who leaves a child unattended in a motor vehicle. Like child passenger safety and seat belt laws, they represent a legislative response to a public health risk.
Fourteen states have laws that prohibit leav-ing children unattended in an automobile: California, Connecticut, Florida, Illinois,
Kentucky, Louisiana, Maryland, Missouri, Nebraska, Nevada, Pennsylvania, Rhode Island, Texas and Washington.107
However, if a state does not have a specific law prohibiting adults from leaving children unattended in motor vehicles, state and local prosecutors have the discretion to criminally charge adults under existing child endanger-ment laws.
Call to Action
For Parents and Caregivers:
Properly restrain all children ages 12 and under in a back seat on every ride.
Secure infants in rear-facing car seats as long as possible, and at least until they are 12 months old and weigh 20 pounds.
Secure children who weigh between 20 and 40 pounds in a forward-facing car seat.
Secure children over 40 pounds in a belt-positioning booster seat or other appro-priate child restraint until an adult seat belt fits correctly — at least 4' 9" tall and 80 to 100 pounds (for most children, that is between ages 8 and 12).
Walk all the way around a parked vehicle to check for children before entering a car and starting the motor. Toys and pets should not be kept near parked cars where they can attract a child into a driv-er’s blind spot.
For Policy Makers, Injury Prevention Advocates and Community Organizations:
Educate parents and caregivers about the correct selection, installation and use of car seats.
Educate parents and caregivers about how to decrease the risk of backovers, trunk entrapment and overheating in cars.
Educate adults to call 911 if they see a child unattended in a car.
Increase funding for community pro-grams, car seat checkup activities and car seat distribution programs, and include booster seat and proper seat belt use for older children.
Enact state laws that require all occu-pants of motor vehicles to be properly restrained, regardless of age or seating
•
•
•
•
•
•
•
•
•
•
Utah’s Spot The Tot Program Goes Nationwide
Utah’s Primary Children’s Medical Center, Safe Kids Utah and the Utah Department of Health created a program called Spot The Tot using data from the state’s death review team to address injuries and deaths from driveway backovers. Through its Safe Kids Buckle Up program, Safe Kids Worldwide replicated the program nationwide in �00�. The national program expanded the initiative to include messages about never leaving your child alone in a car, the dangers of trunk entrap-ment, how to conduct a Safety Belt Fit Test and General Motors’ OnStar emergency response system.
Progressive States Look for Innovative Ways to Protect Child Passengers
State Departments of Transportation from Indiana, Michigan, Missouri, Montana, Ohio, Pennsylvania, Utah, Virginia and Wyoming conducted a voluntary Occupant Protection for Children assessment to find ways to increase correct restraint use for child occupants through age 1�. Outside con-sultants conducted the safety audit to evaluate child passenger needs and recommend ways to go beyond legislative changes to make optimal use of state highway safety dollars.
�0
�1
position. Children should be required to ride properly restrained in a safety seat that is appropriate for their age and size.
Enact primary enforcement state restraint laws so a police officer can issue a citation if he or she simply observes an adult or child riding without a seat belt or a car seat.
Continue federal incentive grants programs, with appro-priate funding levels, to encourage states to pass pri-mary enforcement seat belt and booster seat laws and expand the grants to cover laws that prohibit leaving children unattended in motor vehicles.
Enact state laws that make it unlawful to leave a child unattended in a motor vehicle.
•
•
•
Pedestrian InjuriesWith children out of school and crossing streets without the help of crossing guards or adults, it is no surprise that they are at higher risk of being injured by motor vehicles in the summer months.
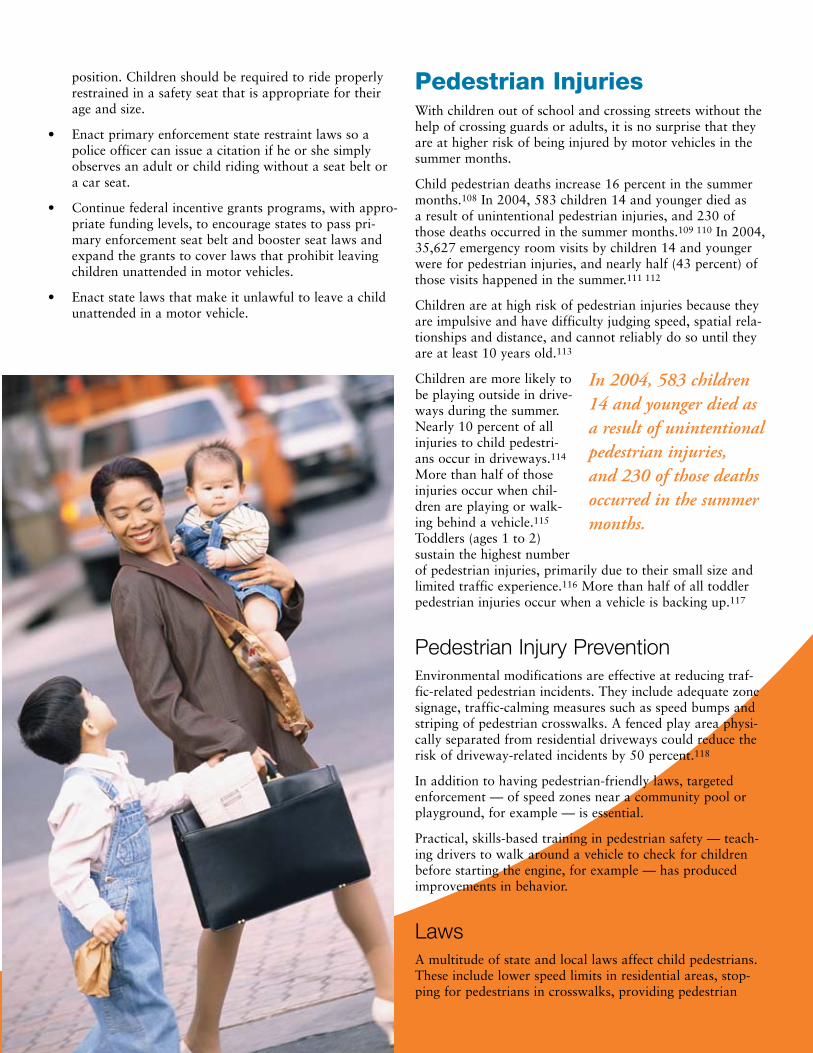
Child pedestrian deaths increase 16 percent in the summer months.108 In 2004, 583 children 14 and younger died as a result of unintentional pedestrian injuries, and 230 of those deaths occurred in the summer months.109 110 In 2004, 35,627 emergency room visits by children 14 and younger were for pedestrian injuries, and nearly half (43 percent) of those visits happened in the summer.111 112
Children are at high risk of pedestrian injuries because they are impulsive and have difficulty judging speed, spatial rela-tionships and distance, and cannot reliably do so until they are at least 10 years old.113
Children are more likely to be playing outside in drive-ways during the summer. Nearly 10 percent of all injuries to child pedestri-ans occur in driveways.114 More than half of those injuries occur when chil-dren are playing or walk-ing behind a vehicle.115 Toddlers (ages 1 to 2) sustain the highest number of pedestrian injuries, primarily due to their small size and limited traffic experience.116 More than half of all toddler pedestrian injuries occur when a vehicle is backing up.117
Pedestrian Injury Prevention Environmental modifications are effective at reducing traf-fic-related pedestrian incidents. They include adequate zone signage, traffic-calming measures such as speed bumps and striping of pedestrian crosswalks. A fenced play area physi-cally separated from residential driveways could reduce the risk of driveway-related incidents by 50 percent.118
In addition to having pedestrian-friendly laws, targeted enforcement — of speed zones near a community pool or playground, for example — is essential.
Practical, skills-based training in pedestrian safety — teach-ing drivers to walk around a vehicle to check for children before starting the engine, for example — has produced improvements in behavior.
LawsA multitude of state and local laws affect child pedestrians. These include lower speed limits in residential areas, stop-ping for pedestrians in crosswalks, providing pedestrian
In 2004, 583 children 14 and younger died as a result of unintentional pedestrian injuries, and 230 of those deaths occurred in the summer months.
walkways, prohibiting vehicles from passing school buses while loading and unloading passengers, using crossing guards and requir-ing that pedestrians cross only in designated crosswalks.
In 2005, SAFETEA-LU — the Safe, Accountable, Flexible, Efficient Transporta-tion Equity Act: A Legacy for Users — was signed into law. It includes the establishment of Safe Routes to Schools, a federally funded program designed to make it safer for chil-dren to walk or bike to school. Through this program, states can fix sidewalks, execute traffic-calming and speed-reduction measures, improve pedestrian and bicycle crossings, and conduct public education campaigns to encourage children to walk or bike to school.
Call to Action
For Parents and Caregivers:
Do not allow children under 10 to cross the street alone.
Teach children proper pedestrian behav-ior, such as crossing the street at a corner, using traffic signals or crosswalks when-ever possible.
Instruct children to look left, right and left again when crossing a street and to continue looking as they cross.
Dress children in reflective materials and instruct them to carry a flashlight in low-light situations, or in rainy or foggy weather.
Don’t let children play in driveways, streets, parking lots or unfenced yards adjacent to busy streets.
For Policy Makers, Injury Prevention Advocates and Community Organizations:
Educate parents and caregivers to teach children ages 10 and older proper pedes-trian behavior, such as crossing streets at a corner and obeying traffic signals.
Educate parents to provide physical supervision for street-crossing for chil-dren under age 10.
Establish pedestrian safety components in State Strategic Highway Safety Plans.
•
•
•
•
•
•
•
•
Ensure adequate financial support for states’ pedestrian safety programs.
Enact state and local laws that require environmental modifications such as more signage, lights, crosswalks and traffic-calming devices to slow vehicle speeds and enable safe walking.
Have the federal government continue to support Safe Routes to Schools programs by funding state efforts that encourage children to walk or bike to school.
Enact state and local laws that impose stiffer penalties and fines for those who violate traffic laws.
Increase the use of speed and/or red light cameras.
Install blinking countdown lights at traf-fic intersections.
Widen road shoulders in rural areas for biking/walking lanes.
Pass “no right turn on red” laws in local communities.
•
•
•
•
•
•
•
•
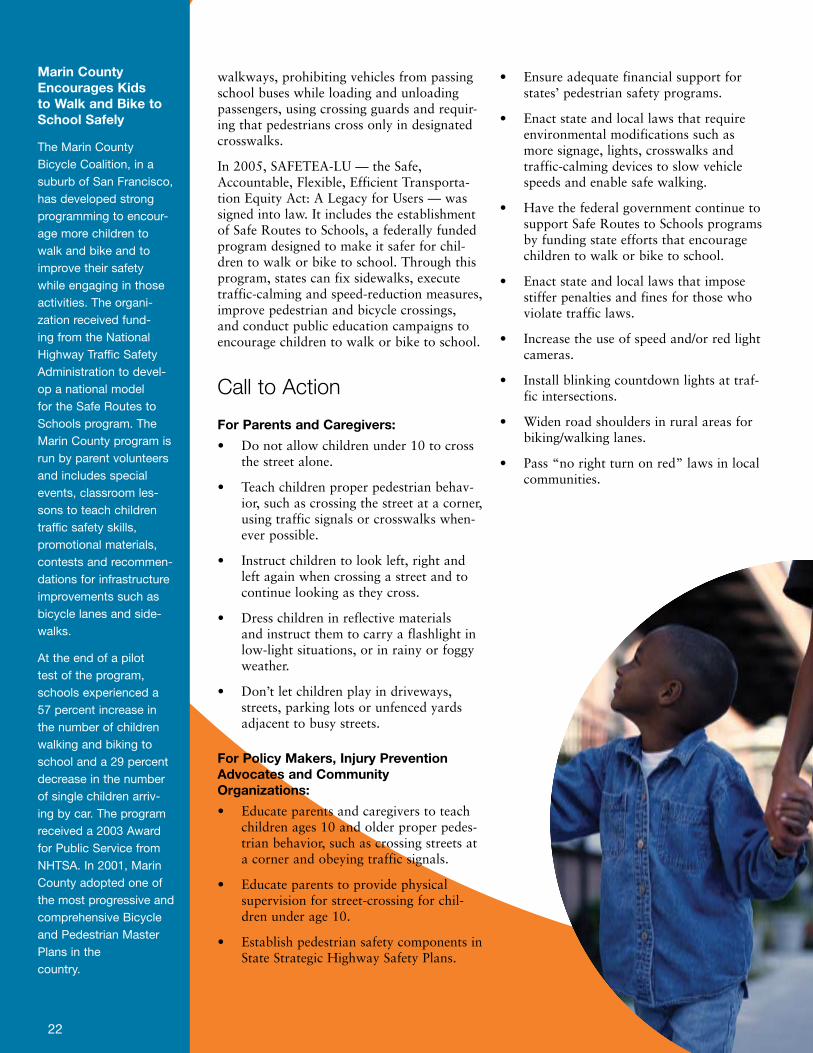
Marin County Encourages Kids to Walk and Bike to School Safely
The Marin County Bicycle Coalition, in a suburb of San Francisco, has developed strong programming to encour-age more children to walk and bike and to improve their safety while engaging in those activities. The organi-zation received fund-ing from the National Highway Traffic Safety Administration to devel-op a national model for the Safe Routes to Schools program. The Marin County program is run by parent volunteers and includes special events, classroom les-sons to teach children traffic safety skills, promotional materials, contests and recommen-dations for infrastructure improvements such as bicycle lanes and side-walks.
At the end of a pilot test of the program, schools experienced a �� percent increase in the number of children walking and biking to school and a �� percent decrease in the number of single children arriv-ing by car. The program received a �00� Award for Public Service from NHTSA. In �001, Marin County adopted one of the most progressive and comprehensive Bicycle and Pedestrian Master Plans in the country.
��
��
ConclusionUnintentional injury remains the number 1 killer of children in the United States, with more than 2,000 children dying each summer from injuries that could have been prevented. However, we are making progress. Factors that may have contributed to the 17.6 percent decline in the children’s summer death rate include:
Better research into the causes of child deaths from unintentional injury.
Recognition of child unintentional injury as a public health issue amenable to prevention, rather than a result of unforeseen, uncontrollable “accidents.”
Effectiveness of intervention strategies, including:
Targeted public education campaigns by national and community organizations and federal agencies.
Development, improvement and increased use of safety devices.
Enactment and enforcement of child safety laws.
Safe Kids Worldwide and its coalitions will continue to work in partnership with community organizations, law enforcement, legislators, governments, schools and parents on activities to improve child safety.
However, all 50 states and the District of Columbia need to work harder to implement the best practices and laws that contribute to making children safer and to enforce them to ensure compliance. They include, among other things:
Comprehensive child passenger safety laws.
Wheeled sports helmet laws.
Requirements that playgrounds meet the CPSC’s recom-mended safety guidelines.
Laws mandating four-sided residential pool fencing laws.
But laws are only part of the multifaceted solution to pro-tect children.
•
•
•
–
–
–
•
•
•
•
Call to ActionSafe Kids Worldwide calls on this nation to place the high-est priority on childhood injury prevention. Below are all our recommended Calls to Action. We must act quickly if lives are to be saved and serious childhood injuries are to be prevented.
To reduce the number of injuries and deaths to children, Safe Kids Worldwide recommends the following steps:
Parents and Caregivers
Actively supervise your child when engaging in sum-mertime activities, such as swimming and playing on playgrounds.
Use the appropriate safety gear for your child’s activities (helmet for wheeled sports, car seat or booster seat as appropriate, life jacket for open-water swimming and boating, etc.).
Federal Government
Work with the relevant industries to evaluate and improve the effectiveness of safety products and make safety devices more affordable and available to all fami-lies.
Provide incentive grants to states to implement injury prevention laws. The National Highway Traffic Safety Administration provides such grants to states that enact booster seat or primary enforcement seat belt laws, and it should continue as a means to promote state legisla-tive activity. The federal government should also offer incentive grants to address other risk areas, such as pool and spa safety.
Adequately fund the CPSC so that it can expand its efforts to protect our nation’s children and families from product-related accidents. The agency has traditionally been underfunded and needs additional support to fulfill its critical mission effectively, including recalling unsafe products, providing consumer education, conducting product testing, and enhancing its research and data-collection capabilities.
Sufficiently fund the Centers for Disease Control and Prevention’s National Center for Injury Prevention and Control, the federal government’s lead agency for injury prevention, so that it can enhance its work as the public health voice for prevention of unintentional injury.
Pass child safety legislation that has been pending for several congressional sessions, such as:
The Pool and Spa Safety Act of 2007, which, if passed, would enhance the safety of swimming pools and spas by motivating states to pass laws that incorporate layers of protection to prevent drowning and entrapment-related incidents. The
•
•
•
•
•
•
•
–
��
legislation would also fund a national drowning education program through the CPSC as well as establish a safety performance standard for anti-entrapment drain covers.
State Government
Strengthen surveillance of nonfatal injuries by recom-mending that hospital admission and emergency room records in every state incorporate external cause of injury coding.
Adequately fund injury prevention units in state and local health departments to ensure a solid infrastructure for addressing injury prevention needs, collecting and analyzing injury data, and implementing public educa-tion programs.
Fund the design and engineering of accessible walking, bicycling and play environments (e.g., streetlights, traf-fic-calming measures, playgrounds, sidewalks, paths and trails).
Evaluate the effectiveness of state and local injury prevention programs to ensure that scarce resources are dedicated to interventions with a proven ability to change behaviors and reduce injuries and deaths among children.
Pass cost-effective child safety legislation and heighten enforcement provisions of laws already on the books, including laws pertaining to:
Car seats, seat belts and leaving children unattended in motor vehicles.
Helmets for wheeled sports.
Four-sided fencing, anti-entrapment devices, safety vacuum release systems and multiple drains for pools and spas.
Life jackets and boating education.
Playground equipment safety.
Local Government
Design and engineer accessible walking, bicycling and play environments (e.g., streetlights, traffic-calming measures, playgrounds, sidewalks, paths and trails).
Ensure that targeted interventions reach the people at highest risk of death and injury, who are often in lower-income communities.
Private Sector/Community Organizations
Fund, develop and implement research-based programs to educate adults and children regarding safe play, espe-cially during the summer months.
•
•
•
•
•
–
–
–
–
–
•
•
•
��
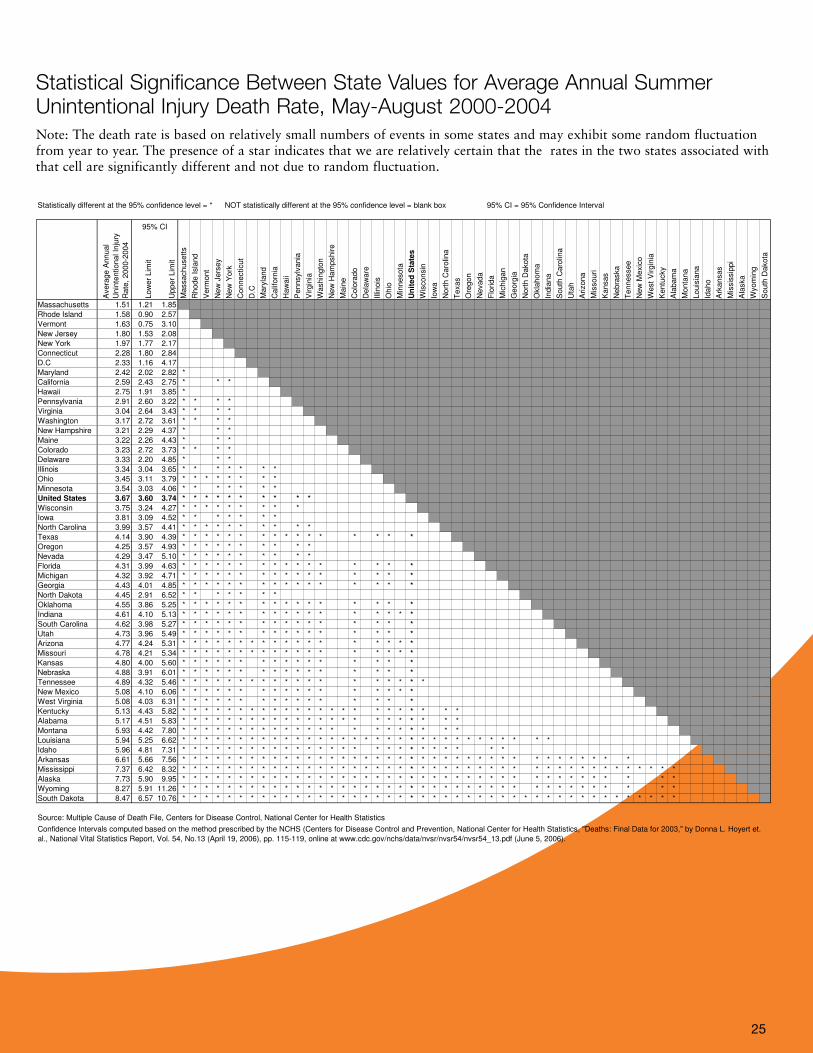
Statistical Significance Between State Values for Average Annual Summer Unintentional Injury Death Rate, May-August 2000-2004
Statistically different at the 95% confidence level = * NOT statistically different at the 95% confidence level = blank box 95% CI = 95% Confidence Interval
Avera
ge A
nnual
Unin
tentional In
jury
Rate
, 2000-2
004
Low
er
Lim
it
Upper
Lim
it
Massachusett
s
Rhode I
sla
nd
Verm
ont
New
Jers
ey
New
York
Connecticut
D.C
Mary
land
Calif
orn
ia
Haw
aii
Pennsylv
ania
Virgin
ia
Washin
gto
n
New
Ham
pshire
Main
e
Colo
rado
Dela
ware
Illin
ois
Ohio
Min
nesota
Un
ited
Sta
tes
Wis
consin
Iow
a
Nort
h C
aro
lina
Texas
Ore
gon
Nevada
Flo
rida
Mic
hig
an
Georg
ia
Nort
h D
akota
Okla
hom
a
India
na
South
Caro
lina
Uta
h
Arizona
Mis
souri
Kansas
Nebra
ska
Tennessee
New
Mexic
o
West
Virgin
ia
Kentu
cky
Ala
bam
a
Monta
na
Louis
iana
Idaho
Ark
ansas
Mis
sis
sip
pi
Ala
ska
Wyom
ing
South
Dakota
Massachusetts 1.51 1.21 1.85
Rhode Island 1.58 0.90 2.57
Vermont 1.63 0.75 3.10
New Jersey 1.80 1.53 2.08
New York 1.97 1.77 2.17
Connecticut 2.28 1.80 2.84
D.C 2.33 1.16 4.17
Maryland 2.42 2.02 2.82 *
California 2.59 2.43 2.75 * * *
Hawaii 2.75 1.91 3.85 *
Pennsylvania 2.91 2.60 3.22 * * * *
Virginia 3.04 2.64 3.43 * * * *
Washington 3.17 2.72 3.61 * * * *
New Hampshire 3.21 2.29 4.37 * * *
Maine 3.22 2.26 4.43 * * *
Colorado 3.23 2.72 3.73 * * * *
Delaware 3.33 2.20 4.85 * * *
Illinois 3.34 3.04 3.65 * * * * * * *
Ohio 3.45 3.11 3.79 * * * * * * * *
Minnesota 3.54 3.03 4.06 * * * * * * *
United States 3.67 3.60 3.74 * * * * * * * * * *
Wisconsin 3.75 3.24 4.27 * * * * * * * * *
Iowa 3.81 3.09 4.52 * * * * * * *
North Carolina 3.99 3.57 4.41 * * * * * * * * * *
Texas 4.14 3.90 4.39 * * * * * * * * * * * * * * * *
Oregon 4.25 3.57 4.93 * * * * * * * * * *
Nevada 4.29 3.47 5.10 * * * * * * * * * *
Florida 4.31 3.99 4.63 * * * * * * * * * * * * * * * *
Michigan 4.32 3.92 4.71 * * * * * * * * * * * * * * * *
Georgia 4.43 4.01 4.85 * * * * * * * * * * * * * * * *
North Dakota 4.45 2.91 6.52 * * * * * * *
Oklahoma 4.55 3.86 5.25 * * * * * * * * * * * * * * * *
Indiana 4.61 4.10 5.13 * * * * * * * * * * * * * * * * *
South Carolina 4.62 3.98 5.27 * * * * * * * * * * * * * * * *
Utah 4.73 3.96 5.49 * * * * * * * * * * * * * * * *
Arizona 4.77 4.24 5.31 * * * * * * * * * * * * * * * * * *
Missouri 4.78 4.21 5.34 * * * * * * * * * * * * * * * * * *
Kansas 4.80 4.00 5.60 * * * * * * * * * * * * * * * *
Nebraska 4.88 3.91 6.01 * * * * * * * * * * * * * * * *
Tennessee 4.89 4.32 5.46 * * * * * * * * * * * * * * * * * * *
New Mexico 5.08 4.10 6.06 * * * * * * * * * * * * * * * * *
West Virginia 5.08 4.03 6.31 * * * * * * * * * * * * * * * *
Kentucky 5.13 4.43 5.82 * * * * * * * * * * * * * * * * * * * * * * *
Alabama 5.17 4.51 5.83 * * * * * * * * * * * * * * * * * * * * * * *
Montana 5.93 4.42 7.80 * * * * * * * * * * * * * * * * * * * * * *
Louisiana 5.94 5.25 6.62 * * * * * * * * * * * * * * * * * * * * * * * * * * * * * * * *
Idaho 5.96 4.81 7.31 * * * * * * * * * * * * * * * * * * * * * * * * * *
Arkansas 6.61 5.66 7.56 * * * * * * * * * * * * * * * * * * * * * * * * * * * * * * * * * * * * * *
Mississippi 7.37 6.42 8.32 * * * * * * * * * * * * * * * * * * * * * * * * * * * * * * * * * * * * * * * * * * *
Alaska 7.73 5.90 9.95 * * * * * * * * * * * * * * * * * * * * * * * * * * * * * * * * * * * * * * * *
Wyoming 8.27 5.91 11.26 * * * * * * * * * * * * * * * * * * * * * * * * * * * * * * * * * * * * * * * *
South Dakota 8.47 6.57 10.76 * * * * * * * * * * * * * * * * * * * * * * * * * * * * * * * * * * * * * * * * * * * *
95% CI
Confidence Intervals computed based on the method prescribed by the NCHS (Centers for Disease Control and Prevention, National Center for Health Statistics, "Deaths: Final Data for 2003," by Donna L. Hoyert et.
al., National Vital Statistics Report, Vol. 54, No.13 (April 19, 2006), pp. 115-119, online at www.cdc.gov/nchs/data/nvsr/nvsr54/nvsr54_13.pdf (June 5, 2006).
Source: Multiple Cause of Death File, Centers for Disease Control, National Center for Health Statistics
Note: The death rate is based on relatively small numbers of events in some states and may exhibit some random fluctuation from year to year. The presence of a star indicates that we are relatively certain that the
rates in the two states associated with that cell are significantly different and not due to random fluctuation.
Statistical Significance Between State Values for Average Annual Summer Unintentional Injury Death Rate, May-August 2000-2004Note: The death rate is based on relatively small numbers of events in some states and may exhibit some random fluctuation from year to year. The presence of a star indicates that we are relatively certain that the rates in the two states associated with that cell are significantly different and not due to random fluctuation.

��
Statistical Significance Within (the change was significantly different from zero) and Between State Values of Percent Change in the Summer Unintentional Injury Death Rate (May- August, 2002-2004 versus 1997-1999) Note: The % change is based on relatively small numbers of events in some states and may exhibit some random fluctuation from year to year. The presence of a star indicates that we are relatively certain that the % change values for the two states associated with that cell are significantly different and not due to random fluctuation.
Statistical Significance Within (the change was significantly different from zero) and Between State Values of Percent Change in the Summer Unintentional Injury Death Rate (May- August, 2002-2004
versus 1997-1999)
Statistically different at the 95% confidence level = * NOT statistically different at the 95% confidence level = blank box 95% CI = 95% Confidence Interval
% C
hange in t
he D
eath
Rate
Low
er
Lim
it
Upper
Lim
it
% C
han
ge w
ith
in s
tate
Verm
ont
D.C
New
Jers
ey
Idaho
Dela
ware
Monta
na
Georg
ia
Ala
bam
a
Colo
rado
Okla
hom
a
Ark
ansas
Nort
h C
aro
lina
Arizona
South
Caro
lina
New
York
Pennsylv
ania
Washin
gto
n
Nevada
Calif
orn
ia
Kansas
Wis
consin
Massachusett
s
Un
ited
Sta
tes
Mary
land
Rhode I
sla
nd
Texas
Louis
iana
Mis
sis
sip
pi
Mic
hig
an
India
na
Illin
ois
Flo
rida
Uta
h
Ohio
New
Mexic
o
Mis
souri
Ore
gon
Virgin
ia
Min
nesota
Tennessee
Main
e
Iow
a
Kentu
cky
Connecticut
Nort
h D
akota
South
Dakota
Haw
aii
West
Virgin
ia
Ala
ska
Nebra
ska
New
Ham
pshire
Wyom
ing
Vermont -60% -98% -23% *
D.C -49% -105% 7%
New Jersey -40% -55% -24% *
Idaho -39% -61% -18% *
Delaware -34% -78% 9%
Montana -32% -65% 0%
Georgia -32% -43% -20% *
Alabama -32% -47% -16% *
Colorado -31% -50% -13% *
Oklahoma -31% -49% -13% *
Arkansas -29% -47% -11% *
North Carolina -27% -40% -13% *
Arizona -26% -41% -11% *
South Carolina -26% -44% -9% *
New York -25% -39% -12% *
Pennsylvania -25% -39% -12% *
Washington -23% -43% -4% *
Nevada -23% -49% 2%
California -22% -31% -14% *
Kansas -22% -46% 2%
Wisconsin -21% -40% -3% *
Massachusetts -19% -48% 10%
United States -18% -20% -15% * * * *
Maryland -17% -41% 8%
Rhode Island -16% -81% 48%
Texas -15% -25% -6% *
Louisiana -15% -32% 2%
Mississippi -15% -35% 5%
Michigan -15% -28% -1% *
Indiana -15% -31% 2%
Illinois -11% -26% 4%
Florida -11% -22% 1% * *
Utah -10% -36% 16%
Ohio -10% -26% 6%
New Mexico -9% -40% 21%
Missouri -9% -29% 11%
Oregon -9% -34% 17%
Virginia -8% -29% 13%
Minnesota -8% -32% 16%
Tennessee -6% -26% 14%
Maine -5% -63% 52%
Iowa -3% -35% 28%
Kentucky -1% -26% 23%
Connecticut 6% -38% 50%
North Dakota 8% -64% 80%
South Dakota 17% -36% 69%
Hawaii 22% -52% 96%
West Virginia 31% -21% 84% * *
Alaska 33% -34% 100%
Nebraska 43% -15% 101% * * * * * *
New Hampshire 73% -50% 195%
Wyoming 82% -28% 192%
Note: The % change is based on relatively small numbers of events in some states and may exhibit some random fluctuation from year to year. The presence of a star indicates that we are relatively certain that the %
change values for the two states associated with that cell are significantly different and not due to random fluctuation.
95% CI
Source: Multiple Cause of Death File, Centers for Disease Control, National Center for Health Statistics
Confidence Intervals computation adapted from the method prescribed by the NCHS (Centers for Disease Control and Prevention, National Center for Health Statistics, "Deaths: Final Data for 2003," by Donna L.
Hoyert et. al., National Vital Statistics Report, Vol. 54, No.13 (April 19, 2006), pp. 115-119, online at www.cdc.gov/nchs/data/nvsr/nvsr54/nvsr54_13.pdf (June 5, 2006)
��
Endnotes1 Centers for Disease Control and Prevention, Web-based Injury
Statistics Query and Reporting System, http://www.cdc.gov/ncipc/wisqars.
� National Vital Statistics System, 2004 Mortality Data (Hyattsville, MD: National Center for Health Statistics, �00�).
� Ted Miller, et al., “The Cost of Child and Adolescent Injuries and the Savings from Prevention,” in Injury Prevention for Children and Adolescents: Research, Practice and Advocacy, ed. Karen Liller, 1�-�� (Washington, DC: American Public Health Association, �00�).
� Trauma Season: A National Study of the Seasonality of Unintentional Childhood Injury, (Washington, DC: National Safe Kids Campaign, May �001).
� Calculations derived from monthly data for the years �001 to �00�, provided by the Centers for Disease Control and Prevention’s Center for Injury Prevention and Control. Data e-mailed by Lee Annest at CDC.
� National Vital Statistics System, 2004 Mortality Data (Hyattsville, MD: National Center for Health Statistics, �00�).
� Ibid.
10 �00� summer data provided by Centers for Disease Control and Prevention’s Center for Injury Prevention and Control. Data e-mailed by Lee Annest at CDC.
11 Centers for Disease Control and Prevention, Web-based Injury Statistics Query and Reporting System, http://www.cdc.gov/ncipc/wisqars.
1� �00� summer data provided by Centers for Disease Control and Prevention’s Center for Injury Prevention and Control. Data e-mailed by Lee Annest at CDC.
1� Beth-Ellen Cody, et al., Clear Danger: A National Study of Childhood Drowning and Related Attitudes and Behaviors (Washington, DC: National Safe Kids Campaign, April �00�).
1� JM Lavelle, et al., “Ten-Year Review of Pediatric Bathtub Near-Drownings: Evaluation for Child Abuse and Neglect” Annals of Emergency Medicine ��, no. � (1���):���-���.
1� News Splash for Safety: Drowning Prevention for Parents with Pools (Washington, DC: US Consumer Product Safety Commission, 1���).
1� Physician’s Resource Guide for Water Safety Education (Elk Grove Village, IL: American Academy of Pediatrics, 1���).
1� How to Plan for the Unexpected: Preventing Child Drownings pub no. ��� (Washington, DC: US Consumer Product Safety Commission, 1���).
1� GJ Wintemute, “Childhood Drowning and Near-Drowning in the United States” American Journal of Diseases of Children 1��, no. � (1��0):���-���.
1� Physician’s Resource Guide for Water Safety Education (Elk Grove Village, IL: American Academy of Pediatrics, 1���).
�0 GJ Wintemute, “Childhood Drowning and Near-Drowning in the United States” American Journal of Diseases of Children 1��, no. � (1��0):���-���.
�1 Frederick P. Rivara, David C. Grossman, and Peter Cummings, “Injury Prevention” New England Journal of Medicine ���, no. � (1���):�1�-�1�.
�� Physician’s Resource Guide for Water Safety Education (Elk Grove Village, IL: American Academy of Pediatrics, 1���).
�� Ruth A. Brenner and the Committee on Injury, Violence, and Poison Prevention, “Prevention of Drowning in Infants, Children, and Adolescents” Pediatrics 11�, no. � (�00�):��0-���.
�� U.S. Coast Guard, Boating Statistics - 2005 Commandant Publication P1����.1�, http://www.uscgboating.org/statistics/Boating_Statistics_�00�.pdf (accessed April �, �00�).
�� Research available from Safe Kids Worldwide. Data current as of �00�-�00�.
�� Ibid.
�� National Transportation Safety Board, “Enhance Recreational Boating Safety,” http://www.ntsb.gov/recs/mostwanted/rec_boat.htm.
�� Ibid.
�� Ibid.
�0 Modena Hoover Wilson, et al., Saving Children: A Guide to Injury Prevention (New York: Oxford University Press, 1��1).
�1 Calculations derived from monthly data for the years �001 to �00�, provided by the Centers for Disease Control and Prevention’s Center for Injury Prevention and Control. Data e-mailed by Lee Annest at CDC.
�� Jeffrey J. Sacks, et al., “Bicycle Helmet Use Among American Children, 1���” Injury Prevention �, no. � (1���):���-���.
�� National Vital Statistics System, 2004 Mortality Data (Hyattsville, MD: National Center for Health Statistics, �00�).
�� �00� summer data provided by the Centers for Disease Control and Prevention’s Center for Injury Prevention and Control. Data e-mailed by Lee Annest at CDC.
�� Centers for Disease Control and Prevention, Web-based Injury Statistics Query and Reporting System, http://www.cdc.gov/ncipc/wisqars.
�� �00� summer data provided by the Centers for Disease Control and Prevention’s Center for Injury Prevention and Control. Data e-mailed by Lee Annest at CDC.
�� Beth-Ellen Cody, et al., A National Study of Traumatic Brain Injury and Wheel-Related Sports (Washington, DC: National Safe Kids Campaign, May �00�).
�� Bicycle Use and Hazard Patterns in the United States (Washington, DC: US Consumer Product Safety Commission, 1���).
�� Guohua Li, et al., “Factors Related to the Presence of Head Injury in Bicycle-Related Pediatric Trauma Patients” Journal of Trauma: Injury, Infection, and Critical Care ��, no. � (1���):��1-���.
�0 Daniel M. Sosin, Jeffrey J. Sacks, and Kevin W. Webb, “Pediatric Head Injuries and Deaths from Bicycling in the United States” Pediatrics ��, no. � (1���):���-��0.
�1 Jeffrey J. Sacks, et al, “Bicycle-Associated Head Injuries and Deaths in the United States from 1��� through 1���: How Many Are Preventable?” Journal of the American Medical Association ���, no. �1 (1��1):�01�-�01�.
�� Robert D. Brewer, et al., “Injury Control Recommendations for Bicycle Helmets” Journal of School Health ��, no. � (1���):1��-1��.
�� 2004 Product Summary Report (Washington, DC: US Consumer Product Safety Commission, �00�).
�� Ibid.
�� Ibid.
�� National Highway Traffic Safety Administration, “Fatality Analysis Reporting System,” http://www-fars.nhtsa.dot.gov.
�� Bicycle Safety-Related Research Synthesis pub no. FHWA-RD-��-0�� (Washington, DC: Federal Highway Administration, 1���).
�� Robert S. Thompson, Frederick P. Rivara, and Diane C. Thompson, “A Case-Control Study of the Effectiveness of Bicycle Safety Helmets” New England Journal of Medicine ��0, no. �1 (1���):1��1-1���.
�� Beth-Ellen Cody, et al., A National Study of Traumatic Brain Injury and Wheel-Related Sports (Washington, DC: National Safe Kids Campaign, May �00�).
��
�0 Beth-Ellen Cody, AY Quraishi, and AD Mickalide, Headed for Injury: An Observational Survey of Helmet Use Among Children Ages 5 to 14 Participating in Wheeled Sports (Washington, DC: National Safe Kids Campaign, May �00�).
�1 Ibid.
�� Bicycle Helmet Safety Institute, Helmet Laws for Bicycle Riders, http://www.helmets.org/mandator.htm.
�� Ibid.
�� Michael Henderson, The Effectiveness of Bicycle Helmets: A Review (New South Wales, Australia: Motor Accidents Authority, 1���).
�� TR Cote, et al., “Bicycle Helmet Use Among Maryland Children: Effect of Legislation and Education” Pediatrics ��, no. � (1���):1�1�-1��0.
�� Philip L. Graitcer, AL Kellerman, and T Christoffel, “A Review of Educational and Legislative Strategies to Promote Bicycle Helmets” Injury Prevention 1, no. � (1���):1��-1��.
�� CN Mock, et al., “Injury Prevention Strategies to Promote Helmet Use, Decrease Severe Head Injuries at a Level 1 Trauma Center” Journal of Trauma: Injury, Infection, and Critcial Care ��, no. 1 (1���):��-��.
�� ML Macknin and SV Medendorp, “Association Between Bicycle Helmet Legislation, Bicycle Safety Education, and Use of Bicycle Helmets in Children” Pediatrics and Adolescent Medicine 1��, no. � (1���):���-���.
�� Andrew L. Dannenberg, et al., “Bicycle Helmet Laws and Educational Campaigns: An Evaluation of Strategies to Increase Children’s Helmet Use” American Journal of Public Health ��, no. � (1���):���-���.
�0 “New Jersey Bike Helmet Saves Lives” Headlines: The Newsletter of the World Health Organization Helmet Initiative �, no. 1 (1���):�. Cited in New York Times, June 1, 1���.
�1 Division of Highway Traffic Safety, News (New Jersey Department of Law and Public Safety, November �, 1���).
�� S. Shafi, et al., “Impact of Bicycle Helmet Safety Legislation on Children Admitted to a Regional Pediatric Trauma Center,” Journal of Pediatric Surgery ��, no. � (1���):�1�-��1.
�� Gregory B. Rodgers, “Effects of State Helmet Laws on Bicycle Helmet Use by Children and Adolescents” Injury Prevention � (�00�):��-��.
�� Allison K. Macpherson, et al., “Impact of Mandatory Helmet Legislation on Bicycle-Related Head Injuries in Children: A Population-Based Study” Pediatrics 110, no. � (�00�):e�0.
�� New Jersey Department of Laws and Public Safety, “New Jersey’s Bike Helmet Law Reached �-Year Mark” press release, July 1�, 1���.
�� Julie Gilchrist, et al., “Police Enforcement as Part of a Comprehensive Bicycle Helmet Program” Pediatrics 10�, no. 1 (�000):�-�.
�� DR Puder, et al., “A Comparison of the Effect of Different Bicycle Helmet Laws in � New York City Suburbs” American Journal of Public Health ��, no. 11 (1���):1���-1���.
�� D. Wesson and X. Hu, “The Real Incidence of Pediatric Trauma” Seminars in Pediatric Surgery �, no. � (1���):��-��.
�� Michael D. Kogan, Mary Overpeck, and Lois A. Fingerhut, “Medically Attended Nonfatal Injuries Among Preschool-Age Children: National Estimates” American Journal of Preventive Medicine 11, no. � (1���):��-10�.
�0 Centers for Disease Control and Prevention, “1���-�000 Nonfatal Injury Data,” Web-based Injury Statistics Query and Reporting System, http://www.cdc.gov/ncipc/wisqars.
�1 Modena Hoover Wilson, et al., Saving Children: A Guide to Injury Prevention (New York: Oxford University Press, 1��1).
�� Harold B. Weiss, et al., Child and Adolescent Emergency Department Visit Databook (Pittsburgh, PA: Allegheny University of the Health Sciences, 1���).
�� D. Wesson and X. Hu, “The Real Incidence of Pediatric Trauma” Seminars in Pediatric Surgery �, no. � (1���):��-��.
�� Michael D. Kogan, Mary Overpeck, and Lois A. Fingerhut, “Medically Attended Nonfatal Injuries Among Preschool-Age Children: National Estimates” American Journal of Preventive Medicine 11, no. � (1���):��-10�.
�� Calculations derived from monthly data for the years �001 to �00�, provided by the Centers for Disease Control and Prevention’s Center for Injury Prevention and Control. Data e-mailed by Lee Annest at CDC.
�� JC Pressley and B. Barlow, “Child and Adolescent Injury as a Result of Falls from Buildings and Structures” Injury Prevention 11 (�00�):���-���.
�� National Vital Statistics System, 2004 Mortality Data (Hyattsville, MD: National Center for Health Statistics, �00�).
�� �00� summer data provided by the Centers for Disease Control and Prevention’s Center for Injury Prevention and Control. Data e-mailed by Lee Annest at CDC.
�� Centers for Disease Control and Prevention, Web-based Injury Statistics Query and Reporting System, http://www.cdc.gov/ncipc/wisqars.
�0 �00� summer data provided by the Centers for Disease Control and Prevention’s Center for Injury Prevention and Control. Data e-mailed by Lee Annest at CDC.
�1 Modena Hoover Wilson, et al, Saving Children: A Guide to Injury Prevention (New York: Oxford University Press, 1��1).
�� Anne C. Mosenthal, et al., “Falls: Epidemiology and Strategies for Prevention” Journal of Trauma: Injury, Infection, and Critical Care ��, no. � (1���):���-���.
�� Frederick P. Rivara and David C. Grossman, “Prevention of Traumatic Deaths to Children in the United States: How Far Have We Come and Where Do We Need to Go?” Pediatrics ��, no. � (1���):��1-���.
�� Charlotte N. Spiegel and Francis C. Lindaman, “Children Can’t Fly: A Program to Prevent Childhood Morbidity and Mortality from Window Falls” American Journal of Public Health ��, no. 1� (1���):11��-11��.
�� Tips for Public Playground Safety fact sheet #��� (Washington, DC: US Consumer Product Safety Commission, 1���).
�� National Program for Playground Safety, “Standards - State Regulations,” http://www.playgroundsafety.org/standards/state.htm.
�� Traffic Safety Facts 2004 Data: Children (Washington, DC: National Highway Traffic Safety Administration, �00�).
�� Calculations derived from monthly data for the years �001 to �00�, provided by the Centers for Disease Control and Prevention’s Center for Injury Prevention and Control. Data e-mailed by Lee Annest at CDC.
�� Centers for Disease Control and Prevention, Web-based Injury Statistics Query and Reporting System, http://www.cdc.gov/ncipc/wisqars. Summer data provided by the Centers for Disease Control and Prevention’s Center for Injury Prevention and Control. Data e-mailed by Lee Annest at CDC.
�0 �00� summer data provided by the Centers for Disease Control and Prevention’s Center for Injury Prevention and Control. Data e-mailed by Lee Annest at CDC.
�1 National Vital Statistics System, 2004 Mortality Data (Hyattsville, MD: National Center for Health Statistics, �00�). �00� summer data provided by the Centers for Disease Control and Prevention’s Center for Injury Prevention and Control. Data e-mailed by Lee Annest at CDC.
�� �00� summer data provided by the Centers for Disease Control and Prevention’s Center for Injury Prevention and Control. Data e-mailed by Lee Annest at CDC.
�� Cejun Liu, Chou-Lin Chen, and Dennis Utter, Trend and Pattern Analysis of Highway Crash Fatality by Month and Day (Washington, DC: National Highway Traffic Safety Administration, March �00�).
��
�� Catherine McLaren, Jan Null, and James Quinn, “Heat Stress From Enclosed Vehicles: Moderate Ambient Temperatures Cause Significant Temperature Rise in Enclosed Vehicles,” Pediatrics 11�, no. 1 (�00�):e10�-e11�.
�� Centers for Disease Control and Prevention, “Fatal Car Trunk Entrapment Involving Children – United States, 1���-1���,” MMWR Weekly ��, no. �� (1���): 101�-10��.
�� Ibid.
�� Centers for Disease Control and Prevention, “Nonfatal Motor Vehicle-Related Backover Injuries Among Children – United States, �001-�00�,” MMWR Weekly ��, no. � (�00�):1��-1��.
�� Ibid.
�� Ibid.
100 Traffic Safety Facts 2005 Data: Children (Washington, DC: National Highway Traffic Safety Administration, �00�).
101 Partners for Child Passenger Safety, “Do Laws Make a Difference?” CPS Issue Report, March �00�.
10� Beth-Ellen Cody, et al., Child Passengers at Risk in America: A National Study of Restraint Use (Washington, DC: National Safe Kids Campaign, February �00�) (unpublished data).
10� Lawrence E. Decina and Kathy H. Lococo, “Child Restraint System Use and Misuse in Six States,” Accident Analysis and Prevention �� (�00�):���-��0.
10� Flaura K. Winston, et al., “Effect of Booster Seat Laws on Appropriate Restraint Use by Children � to � Years Old Involved in Crashes” Pediatrics and Adolescent Medicine 1�1, no. � (�00�):��0-���.
10� Traffic Safety Facts: Strengthening Seat Belt Use Laws (Washington, DC: National Highway Traffic Safety Administration, February �00�).
10� Insurance Institute for Highway Safety, “Child Restraint Laws as of March �00�,” http://www.iihs.org/laws/state_laws/restrain�.html.
10� Kids in Cars, “Legislation,” http://www.kidsincars.org/m_nav/legisla-tion.html (accessed March �00�).
10� Calculations derived from monthly data for the years �001 to �00�, provided by the Centers for Disease Control and Prevention’s Center for Injury Prevention and Control. Data e-mailed by Lee Annest at CDC.
10� National Vital Statistics System, 2004 Mortality Data (Hyattsville, MD: National Center for Health Statistics, �00�).
110 �00� summer data provided by the Centers for Disease Control and Prevention’s Center for Injury Prevention and Control. Data e-mailed by Lee Annest at CDC.
111 Centers for Disease Control and Prevention, Web-based Injury Statistics Query and Reporting System, http://www.cdc.gov/ncipc/wisqars.
11� �00� summer data provided by the Centers for Disease Control and Prevention’s Center for Injury Prevention and Control. Data e-mailed by Lee Annest at CDC.
11� M. Malek, B. Guyer, and I. Lescohier, “The Epidemiology and Prevention of Child Pedestrian Injury” Accident Analysis and Prevention ��, no. � (1��0):�01-�1�.
11� David A. Partrick, et al., “Driveway Crush Injuries in Young Children: A Highly Lethal, Devastating, and Potentially Preventable Event” Journal of Pediatric Surgery ��, no. 11 (1���):1�1�-1�1�.
11� Ibid.
11� Phyllis F. Agran, Diane G. Winn, and C. Anderson, “Epidemiology of Pediatric Pedestrian Injuries” (Panel to Prevent Pedestrian Injuries, Centers for Disease Control and Prevention and National Highway Traffic Safety Administration, Atlanta, GA, September 1���).
11� Diane G. Winn, Phyllis F. Agran, and Dawn N. Castillo, “Pedestrian Injuries to Children Younger than � Years of Age” Pediatrics ��, no. � (1��1):���-���.
11� Ian Roberts, Robyn Norton, and Rodney Jackson, “Driveway-Related Child Pedestrian Injuries: A Case-Control Study” Pediatrics ��, no. � (1���):�0�-�0�.
©2007 Safe Kids Worldwide 4/07
Safe Kids Worldwide would like to thank the members of the Safe Kids Week 2007 Summer Safety Advisory Committee for their many hours of work in helping develop the method-ology used to rank the states.
Committee Members
Barbara Alberson, MPH Chief, State & Local Injury Control Section California Department of Health Services
Michael Ballesteros, PhD Epidemiologist and Acting Team Leader, Home and Recreation Injury Prevention National Center for Injury Prevention and Control Centers for Disease Control and Prevention
Elizabeth Bennett, MPH, CHES Patient/Family Communications and Education Manager Children’s Hospital & Regional Medical Center (Seattle)
George Branyan Pedestrian Program Coordinator District of Columbia Department of Transportation
CAPT Stephanie Bryn, MPH Director, Injury and Violence Prevention Programs Health Resources and Services Administration
Theresa Covington, MPH Director National Center for Child Death Review Policy and Practice
Elaine Frank, MHS Program Director and Safe Kids New Hampshire State Coordinator Dartmouth Injury Prevention Center
Andrea Gielen, ScD, ScM Professor & Director The Johns Hopkins Center for Injury Research and Policy
Anara Guard, MLS Associate Center Director Education Development Center
Chris Hanna, MPH State Outreach Specialist, Center for Rural and Agricultural Safety Michigan Public Health Institute
Tracey Hewitt, MS, CHES Coordinator, Outreach and Advocacy The Center for Injury Research and Prevention at The Children’s Hospital of Philadelphia
John Malatak Chief, Program Operations, Office of Boating Safety U. S. Coast Guard
Bill Nesper Program Manager League of American Bicyclists
William O’Hare, PhD Senior Fellow The Annie E. Casey Foundation
Sara Rich, MPA Associate Director National Center for Child Death Review Policy and Practice
Randy Swart Director Bicycle Helmet Safety Institute
Gitanjali Taneja, PhD Senior Research Associate Westat
Donna Thompson, PhD Executive Director National Program for Playground Safety
We would also like to thank the Pacific Institute for Research and Evaluation for their work in developing and managing the research study and drafting the initial report, especially Rebecca Spicer, Ted Miller, Paul Jones, Michelle Blackston and Sue Thomas.
This research study and report was made possible by a generous grant from Johnson & Johnson.
Suggested Citation: Suzanne Morton, Rebecca Spicer, Alan Korn, Sue Thomas, Paul Jones, Safe Kids U.S. Summer Safety Ranking Report (Washington, DC: Safe Kids Worldwide, May 2007).
For more information about data sources and methods of analysis used in this report, contact:
Safe Kids Worldwide 1301 Pennsylvania Avenue, NW
Suite 1000 Washington, DC 20004
www.safekids.org
tel 202-662-0600 fax 202-393-2072