Embed Size (px)
Citation preview

SANDIA REPORTSAND2001-3344Unlimited ReleasePrinted November 2001
Safe Deactivation of Energetic Materialsand Use of By-products as Epoxy CuringAgents
Pamela Walker, Thomas Massis, Robert Patton, Maher Tadros, Steve Reber
Prepared bySandia National LaboratoriesAlbuquerque, New Mexico 87185 and Livermore, California 94550
Sandia is a multiprogram laboratory operated by Sandia Corporation,a Lockheed Martin Company, for the United States Department ofEnergy under Contract DE-AC04-94AL85000.
Approved for public release; further dissemination unlimited.
Issued by Sandia National Laboratories, operated for the United States Departmentof Energy by Sandia Corporation.
NOTICE: This report was prepared as an account of work sponsored by an agencyof the United States Government. Neither the United States Government, nor anyagency thereof, nor any of their employees, nor any of their contractors,subcontractors, or their employees, make any warranty, express or implied, orassume any legal liability or responsibility for the accuracy, completeness, orusefulness of any information, apparatus, product, or process disclosed, or representthat its use would not infringe privately owned rights. Reference herein to anyspecific commercial product, process, or service by trade name, trademark,manufacturer, or otherwise, does not necessarily constitute or imply its endorsement,recommendation, or favoring by the United States Government, any agency thereof,or any of their contractors or subcontractors. The views and opinions expressedherein do not necessarily state or reflect those of the United States Government, anyagency thereof, or any of their contractors.
Printed in the United States of America. This report has been reproduced directlyfrom the best available copy.
Available to DOE and DOE contractors fromU.S. Department of EnergyOffice of Scientific and Technical InformationP.O. Box 62Oak Ridge, TN 37831
Telephone: (865)576-8401Facsimile: (865)576-5728E-Mail: [email protected] ordering: http://www.doe.gov/bridge
Available to the public fromU.S. Department of CommerceNational Technical Information Service5285 Port Royal RdSpringfield, VA 22161
Telephone: (800)553-6847Facsimile: (703)605-6900E-Mail: [email protected] order: http://www.ntis.gov/ordering.htm
SAND2001-3344Unlimited Release
Printed November 2001
Safe Deactivation of Energetic Materials andUse of By-products asEpoxy Curing Agents
Final Report – SERDP Project CP-1079
Pamela Walker, Thomas Massis, and Robert Patton Explosive Subsystems and Materials Department
Maher TadrosAdvanced Concepts Group
Steve ReberRF Remote Sensing Department
Sandia National LaboratoriesP. O. Box 5800
Albuquerque, New Mexico 87185-1452
Abstract
Sandia National Laboratories is developing innovative alternative technology to replace openburn/open detonation (OB/OD) operations for the destruction and disposal of obsolete, excess,and off-spec energetic materials. Alternatives to OB/OD are necessary to comply withincreasingly stringent regulations. This program is developing an alternative technology todestruct energetic materials using organic amines with minimal discharge of toxic chemicals tothe environment and defining the application of the by-products for the manufacture of structuralmaterials.
2 8313/2
Contents
INTRODUCTION.........................................................................................................................................................3
1.0 LABORATORY-SCALE PROCESS ...............................................................................................................4
1.1 LIQUID BY-PRODUCTS......................................................................................................................................... 51.2 GAS ANALYSES..................................................................................................................................................... 81.3 EPOXY .................................................................................................................................................................. 12
2.0 PROCESS SCALE-UP .......................................................................................................................................17
2.1 HARDWARE ......................................................................................................................................................... 172.2 COMPUTER MODELING OF PROCESS................................................................................................................ 23
3.0 TECHNOLOGY TRANSFER..........................................................................................................................24
3.1 ECONOMICS OF DEGRADING BULK EXPLOSIVES........................................................................................... 243.2 FIRING RANGE CLEAN-UP ................................................................................................................................ 24
4.0 CONCLUSIONS ..................................................................................................................................................27
5.0 REFERENCES .....................................................................................................................................................29
6.0 APPENDIX A – IITRI REPORT....................................................................................................................30
7.0 APPENDIX B – COMMERCE BUSINESS DAILY AD...........................................................................31
8.0 APPENDIX C – CFD RESEARCH FINAL REPORT..............................................................................32
FiguresFigure 1. Weight Loss of RDX Added to “Jeffamine”.............................................................................................. 6Figure 2. DSC Curve of Comp B and “Jeffamine”................................................................................................... 7Figure 3. Ratio of Jeffamine:Explosive to Achieve Maximum N2O formation …………..…………………9Figure 4. Gas chromatogram of RDX mixed with “Jeffamine” 130°C/1hr ........................................................ 9Figure 5. Gas chromatogram of TNT mixed with "Jeffamine" 130C/1 hr ......................................................... 10Figure 6. Gases formed during the Reaction of “Jeffamine”and Comp B at 130C ......................................... 10Figure 7. Gases formed during the Reaction of TNT and "Jeffamine" ……………………….…………...11Figure 8. Epoxies made from Modified Amine Curing Agents............................................................................. 12Figure 9. Typical curve for determining Glass Transition Temperature ........................................................... 13Figure 10.Tg of Epon 828 epoxies made with “Jeffamine”/RDX by-product .................................................... 14Figure 11.Tg of Epon 828 epoxy made with “Jeffamine”/Comp B by-product.................................................. 15Figure 12. Drawing of Scale-up Reaction Vessel .................................................................................................210Figure 13. Equipment set-up for run-away reaction …...…………………………………………………. 21Figure 14. Typical Temperature profile of Safety test. ………………………………….……………… .22Figure 15. Typical Viscosity Data for By-Products.. ...........................................................................................223Figure 16 . 105mm shrapnel before and after soaking in “Jeffamine”. White material on left peieces is the
explosive................................................................................................................................................................. 26Figure 17. Kaho’olawe Island, Hawaii .................................................................................................................... 27
TablesTable 1. Estimation of Current and Forecasted Conventional Ammunition Inventories (31 March 1999) .... 4Table 2. Estimation of Current and Forecasted Tactical Missile Resource Recovery and Disposition Account
Inventories (31 March 1999)................................................................................................................................. 4Table 3. Heat Capacity Values for Virgin “Jeffamine”............................................................................................ 8Table 4. Toxicity of Epoxies in Water...................................................................................................................... 16Table 5. VISAR Data for Cured Epoxies ................................................................................................................. 17Table 6. Examples of Scale-Up Processing Parameters......................................................................................... 19

3 8313/2
Safe Deactivation of Energetic Materials and Use ofBy-products as
Epoxy Curing Agents
Introduction
The DoD has a significant number of weapons components which need destroying. TheDepartment of Defense (DoD) faces many environmental and legal issues in the demilitarizationof these obsolete and excess energetic materials and assembled munitions. The current DoDstockpile of energetic materials that needs to be destroyed is about 700,000 tons. This totalincreases at a rate of approximately 60,000 tons per year.
Organic amines were found to react with TNT, RDX and Comp B at moderate temperatures,leading to a safe breakdown of the explosive materials without detonation, deflagration, oruncontrolled cook-off. The reaction of the explosive materials with the amines resulted inevolution of gaseous products, which were collected and analyzed. The resulting liquid by-products were found to be effective curing agents for conventional epoxy resins. Epoxiesproduced by this method were found to be safe and non-detonable. Mechanical properties ofthese epoxies were measured and can be tailored to the final requirements of any epoxy use.Commercial uses for this epoxy could complete the recycle of explosives.
Excerpts from the Joint Ordnance Commanders Group FY95 report1 to Congress, summarizesthe overview of munitions demilitarization. (A more current version will be publishedSeptember 2001. This is the most recent report available at this time.) Looking to the future, theArmy Science Board emphasizes including the life-cycle of the energetics in the early stages ofdesigning and acquiring weapons. Table 1 lists the current stockpiles as of 31 March 1999. Thegeneration of energetics forecasted for the period of FY2000 – 2009 is found in Table 2. Tables1 and 2 list the amounts TNT and RDX found in the MIDAS1 (www.dac.army.mil/TD/Midas)database.
4 8313/2
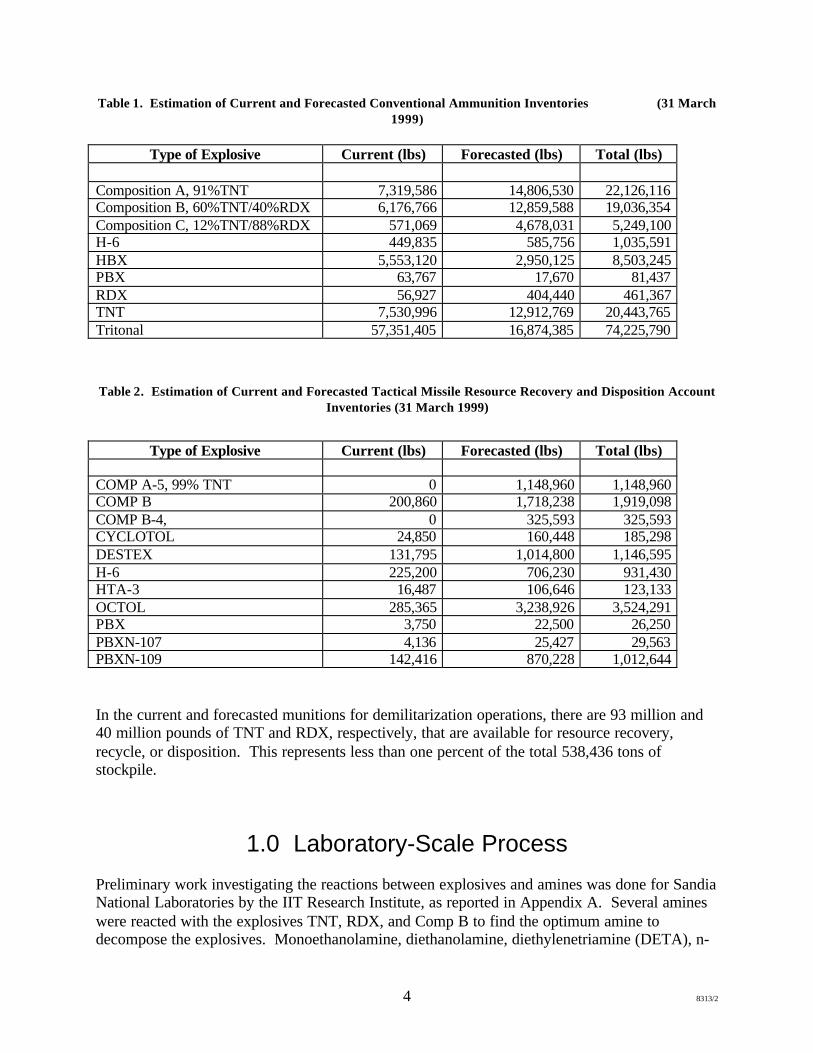
Table 1. Estimation of Current and Forecasted Conventional Ammunition Inventories (31 March1999)
Type of Explosive Current (lbs) Forecasted (lbs) Total (lbs)
Composition A, 91%TNT 7,319,586 14,806,530 22,126,116Composition B, 60%TNT/40%RDX 6,176,766 12,859,588 19,036,354Composition C, 12%TNT/88%RDX 571,069 4,678,031 5,249,100H-6 449,835 585,756 1,035,591HBX 5,553,120 2,950,125 8,503,245PBX 63,767 17,670 81,437RDX 56,927 404,440 461,367TNT 7,530,996 12,912,769 20,443,765Tritonal 57,351,405 16,874,385 74,225,790
Table 2. Estimation of Current and Forecasted Tactical Missile Resource Recovery and Disposition AccountInventories (31 March 1999)
Type of Explosive Current (lbs) Forecasted (lbs) Total (lbs)
COMP A-5, 99% TNT 0 1,148,960 1,148,960COMP B 200,860 1,718,238 1,919,098COMP B-4, 0 325,593 325,593CYCLOTOL 24,850 160,448 185,298DESTEX 131,795 1,014,800 1,146,595H-6 225,200 706,230 931,430HTA-3 16,487 106,646 123,133OCTOL 285,365 3,238,926 3,524,291PBX 3,750 22,500 26,250PBXN-107 4,136 25,427 29,563PBXN-109 142,416 870,228 1,012,644
In the current and forecasted munitions for demilitarization operations, there are 93 million and40 million pounds of TNT and RDX, respectively, that are available for resource recovery,recycle, or disposition. This represents less than one percent of the total 538,436 tons ofstockpile.
1.0 Laboratory-Scale Process
Preliminary work investigating the reactions between explosives and amines was done for SandiaNational Laboratories by the IIT Research Institute, as reported in Appendix A. Several amineswere reacted with the explosives TNT, RDX, and Comp B to find the optimum amine todecompose the explosives. Monoethanolamine, diethanolamine, diethylenetriamine (DETA), n-

5 8313/2
tributylamine, and ethylenediamine were all candidates. DETA is particularly interestingbecause it is the major constituent of DoD’s decontamination solution for chemical agents,known as DS2. Thousands of tons of DS2 stockpile need destroying because it corrodes thecontainers in which it is stored. The potential application of DETA in DS2 for demilitarizationof energetic materials, as well as chemical agents, is attractive and could substantially reduce thecost of the demilitarization. One requirement in selecting an amine was that the handling safetywas well documented. The commercial product “Jeffamine” T-403(polyoxypropylenetriamine, Huntsman Corp.), an amine curing agent used in 2-part epoxies, waschosen because it is commercial availability in large quantities, it has a low viscosity, and it has awell-documented safety record.
There are many considerations in choosing the optimum ratio of “Jeffamine” to be mixed withthe explosive. One is a desire to consume as much explosive per unit of reacting agent aspossible to destroy large quantities of surplus explosives. However, this produces a high-viscosity curing agent product, which is unworkable in the follow-on epoxy mixture. The ratioalso affects the chemistry of the reaction and the production of N2O (greenhouse) versus NO2
(noxious) gases.
Several laboratory techniques were used to characterize the reaction between “Jeffamine” andthe explosives. Laboratory-scale experiments were carried out on small quantities, 20 g or lessof explosive. Running the reaction at temperatures lower than 120oC resulted in very lowreaction rates for TNT and Comp B, and no apparent reaction with RDX. Temperatures between120oC and 130oC also resulted in long reaction times. It was found that reaction temperaturesbetween 130oC and 140oC were ideal and resulted in manageable reaction rates without concernsof uncontrolled reactions taking place at higher temperatures due to explosive cook-off. Batchreactions were done in a 500 milliliter beaker on a stir/heat plate. “Jeffamine” was heated to130°C, then approximately 20 grams of explosive were added incrementally. After the chemicalreaction, the modified “Jeffamine”, crosslinks with an epoxy resin, such as Epon 828, and formsa mechanically useful epoxy.
1.1 Liquid By-ProductsEpoxies produced by this method were found to be non-energetic as evident by thermal analysis,liquid chromatography, and burn tests. Mechanical properties of these epoxies were measuredand found to be comparable to control samples of epoxy formed from conventional resins andcuring agents.
Thermogravimetry (TGA) was used to determine the optimum temperature at which thesereactions should take place. A typical TGA curve is shown in Figure 1. In this example, TGAwas used to measure the weight loss of RDX, “Jeffamine”, and a mixture of the two as they weredynamically heated at 10°C/minute. A TA Instruments Simultaneous DTA/TGA was used forall runs. The sample size of the mixture was a nominal 12 milligrams (e.g., 2 milligrams RDX+10 milligrams “Jeffamine”).
Figure 1 shows that the weight loss of RDX alone due to decomposition begins at approximately210°C. “Jeffamine” shows a gradual weight loss starting at 160°C. When RDX is mixed with“Jeffamine,” the decomposition reaction begins at a much lower temperature, 120 - 130°C.

6 8313/2
Therefore, it was determined that 130oC was the optimum temperature to be used for alllaboratory and scale-up reactions. A 1:4 ratio of RDX:“Jeffamine” was chosen for futureexperiments. The resulting modified amine curing agent has sufficiently low viscosity to allowprocessing an epoxy with good mechanical properties. The density of the virgin “Jeffamine” is0.98 gram/cm3, and the density of the liquid “Jeffamine” after reaction with the explosive is 1.03.With this ratio, there is approximately a 13% weight loss due to the gaseous decomposition ofRDX.
Figure 1. Weight Loss of RDX Added to “Jeffamine”
Using similar TGA experiments, the approximate ratios chosen for mixing “Jeffamine” withTNT and Comp B (60% RDX, 39% TNT, 1% wax) are 9:1 and 4:1, respectively.
As explosive is added to the hot “Jeffamine,” it begins to foam due to the formation ofdecomposition gases in the viscous liquid. Surfactants were examined to determine theireffectiveness in controlling this foaming. A few drops of surfactants, such as “X-Air”, “SuperAir-Out”, or “Air Out” were added to the reaction vessel, to evaluate their ability to minimizethis excessive foaming. "Air Out" worked the best and could be used to minimize foaming infuture operations.
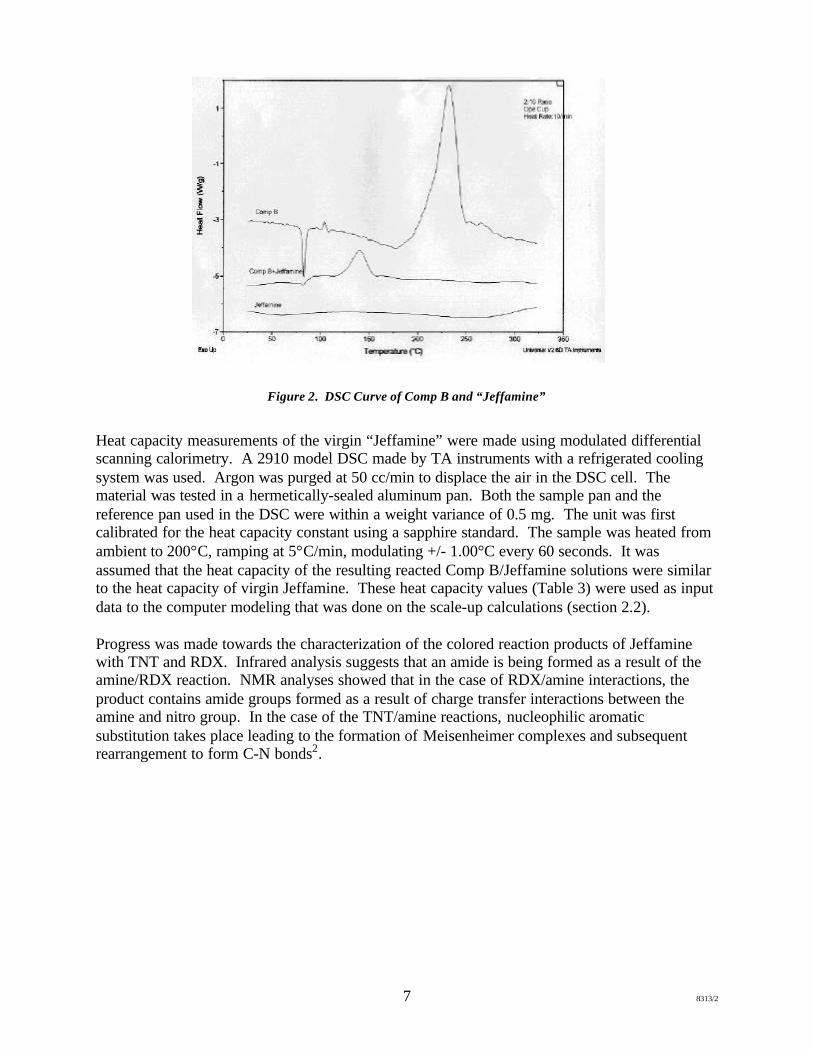
Figure 2 shows a typical differential scanning calorimetry trace with any exotherm, such as theRDX in Comp B decomposing at approximately 230°C, as a positive peak. Endothermictransitions, such as the TNT in the Comp B melting at 80°, are negative peaks. When Comp B isadded to the hot amine, as in the second trace, there is a reaction exotherm of 468 calories pergram of explosive, peaking at approximately 145°C. This value of the heat evolved during thisreaction was used to determine the cooling capacity necessary in the scaled-up reactor (section2.1).
7 8313/2
Figure 2. DSC Curve of Comp B and “Jeffamine”
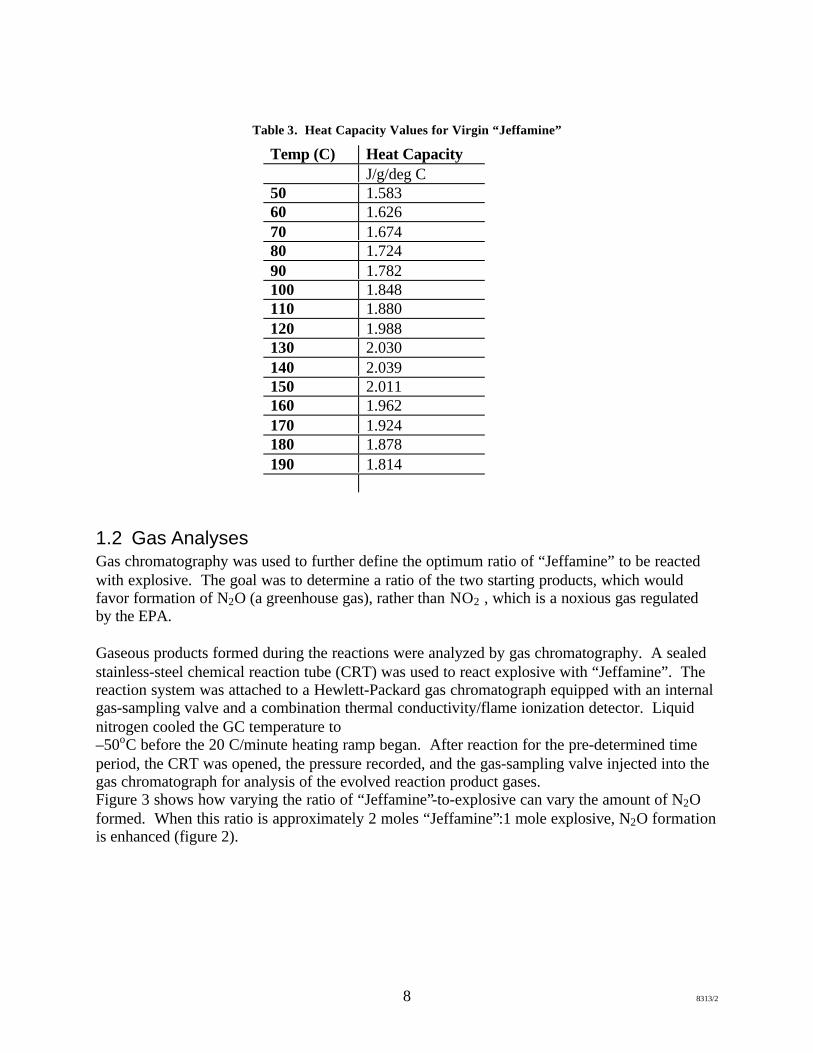
Heat capacity measurements of the virgin “Jeffamine” were made using modulated differentialscanning calorimetry. A 2910 model DSC made by TA instruments with a refrigerated coolingsystem was used. Argon was purged at 50 cc/min to displace the air in the DSC cell. Thematerial was tested in a hermetically-sealed aluminum pan. Both the sample pan and thereference pan used in the DSC were within a weight variance of 0.5 mg. The unit was firstcalibrated for the heat capacity constant using a sapphire standard. The sample was heated fromambient to 200°C, ramping at 5°C/min, modulating +/- 1.00°C every 60 seconds. It wasassumed that the heat capacity of the resulting reacted Comp B/Jeffamine solutions were similarto the heat capacity of virgin Jeffamine. These heat capacity values (Table 3) were used as inputdata to the computer modeling that was done on the scale-up calculations (section 2.2).
Progress was made towards the characterization of the colored reaction products of Jeffaminewith TNT and RDX. Infrared analysis suggests that an amide is being formed as a result of theamine/RDX reaction. NMR analyses showed that in the case of RDX/amine interactions, theproduct contains amide groups formed as a result of charge transfer interactions between theamine and nitro group. In the case of the TNT/amine reactions, nucleophilic aromaticsubstitution takes place leading to the formation of Meisenheimer complexes and subsequentrearrangement to form C-N bonds2.
8 8313/2
Table 3. Heat Capacity Values for Virgin “Jeffamine”
Temp (C) Heat CapacityJ/g/deg C
50 1.58360 1.62670 1.67480 1.72490 1.782100 1.848110 1.880120 1.988130 2.030140 2.039150 2.011160 1.962170 1.924180 1.878190 1.814
1.2 Gas AnalysesGas chromatography was used to further define the optimum ratio of “Jeffamine” to be reactedwith explosive. The goal was to determine a ratio of the two starting products, which wouldfavor formation of N2O (a greenhouse gas), rather than NO2 , which is a noxious gas regulatedby the EPA.
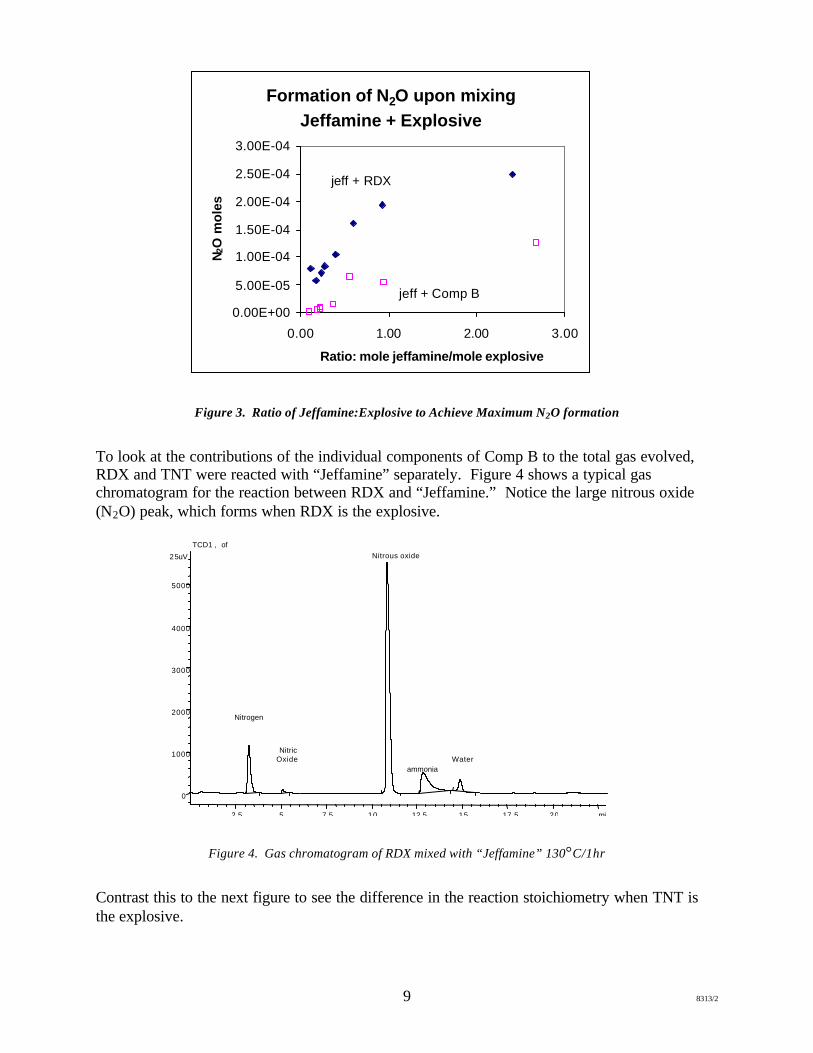
Gaseous products formed during the reactions were analyzed by gas chromatography. A sealedstainless-steel chemical reaction tube (CRT) was used to react explosive with “Jeffamine”. Thereaction system was attached to a Hewlett-Packard gas chromatograph equipped with an internalgas-sampling valve and a combination thermal conductivity/flame ionization detector. Liquidnitrogen cooled the GC temperature to–50oC before the 20 C/minute heating ramp began. After reaction for the pre-determined timeperiod, the CRT was opened, the pressure recorded, and the gas-sampling valve injected into thegas chromatograph for analysis of the evolved reaction product gases.Figure 3 shows how varying the ratio of “Jeffamine”-to-explosive can vary the amount of N2Oformed. When this ratio is approximately 2 moles “Jeffamine”:1 mole explosive, N2O formationis enhanced (figure 2).
9 8313/2
Figure 3. Ratio of Jeffamine:Explosive to Achieve Maximum N2O formation
To look at the contributions of the individual components of Comp B to the total gas evolved,RDX and TNT were reacted with “Jeffamine” separately. Figure 4 shows a typical gaschromatogram for the reaction between RDX and “Jeffamine.” Notice the large nitrous oxide(N2O) peak, which forms when RDX is the explosive.
Figure 4. Gas chromatogram of RDX mixed with “Jeffamine” 130°C/1hr
Contrast this to the next figure to see the difference in the reaction stoichiometry when TNT isthe explosive.
Formation of N2O upon mixing Jeffamine + Explosive
0.00E+00
5.00E-05
1.00E-04
1.50E-04
2.00E-04
2.50E-04
3.00E-04
0.00 1.00 2.00 3.00
Ratio: mole jeffamine/mole explosive
N2O
mo
les
jeff + RDX
jeff + Comp B
min2.5 5 7.5 10 12.5 15 17.5 20
25uV
0
1000
2000
3000
4000
5000
TCD1A
, ofTOM\TCD00201.D
Nitrogen
NitricOxide
Nitrous oxide
ammonia Water

10 8313/2
Figure 5. Gas chromatogram of TNT mixed with “Jeffamine” 130oC/1 hr
The fraction of N2O (nitrous oxide) in the evolved gases is minimal when TNT is the explosive.Based on visual observations of tests mixing TNT and “Jeffamine”, there is a considerableamount of brown gas formed, which would be NO2. This gas is not detected by gaschromatography and, therefore, was not quantitated. Using “Jeffamine” to destroy TNT does notaccomplish the goal of producing non-toxic gaseous by-products.
The amounts of six different gases formed during the reaction of "Jeffamine" with Comp B areplotted in Figure 6.
Figure 6. Gases formed during the Reaction of ”Jeffamine” and Comp B at 130C.
J e f f a m i n e + C o m p B R e a c t i o n G a s e s
0 . 0 0
1 0 0 . 0 0
2 0 0 . 0 0
3 0 0 . 0 0
4 0 0 . 0 0
5 0 0 . 0 0
6 0 0 . 0 0
7 0 0 . 0 0
8 0 0 . 0 0
9 0 0 . 0 0
1 0 0 0 . 0 0
0 1 0 2 0 3 0 4 0 5 0 6 0 7 0
T i m e ( m i n )
N 2 ( u L )
N O ( u L )
C O 2 ( u L )N 2 O ( u L )
N H 3 ( u L )
H 2 O ( u L )
11 8313/2
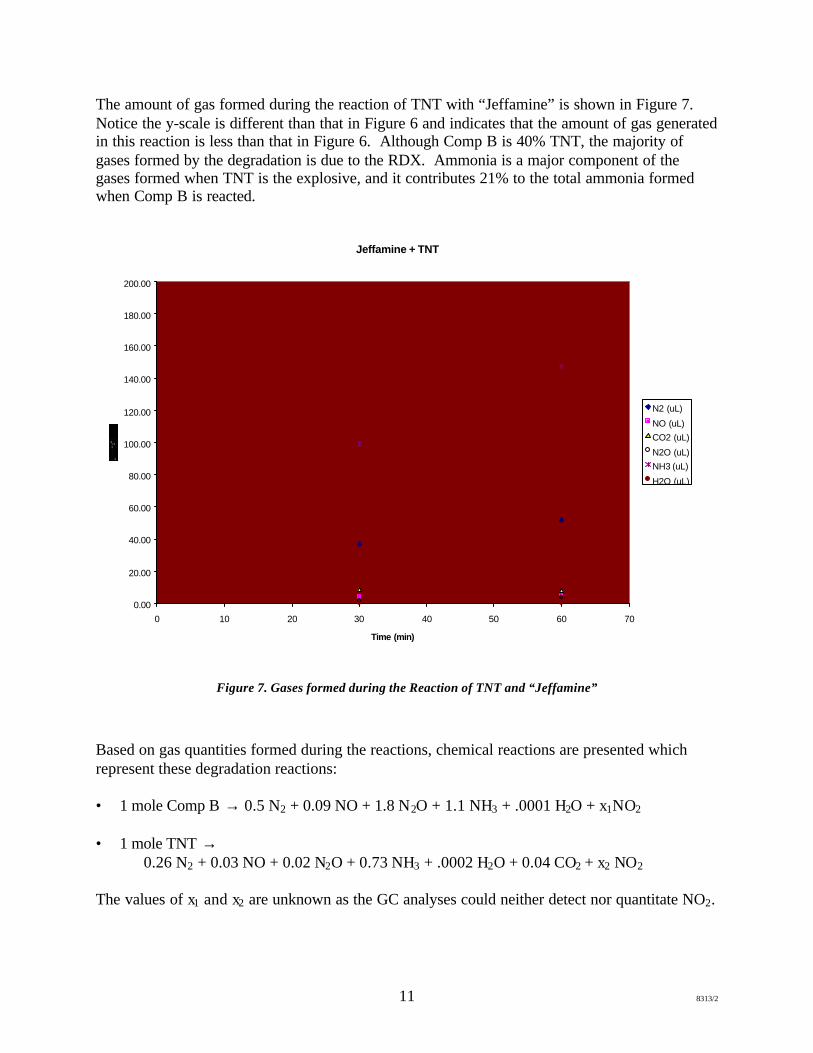
The amount of gas formed during the reaction of TNT with “Jeffamine” is shown in Figure 7.Notice the y-scale is different than that in Figure 6 and indicates that the amount of gas generatedin this reaction is less than that in Figure 6. Although Comp B is 40% TNT, the majority ofgases formed by the degradation is due to the RDX. Ammonia is a major component of thegases formed when TNT is the explosive, and it contributes 21% to the total ammonia formedwhen Comp B is reacted.
Figure 7. Gases formed during the Reaction of TNT and “Jeffamine”
Based on gas quantities formed during the reactions, chemical reactions are presented whichrepresent these degradation reactions:
• 1 mole Comp B → 0.5 N2 + 0.09 NO + 1.8 N2O + 1.1 NH3 + .0001 H2O + x1NO2
• 1 mole TNT →0.26 N2 + 0.03 NO + 0.02 N2O + 0.73 NH3 + .0002 H2O + 0.04 CO2 + x2 NO2
The values of x1 and x2 are unknown as the GC analyses could neither detect nor quantitate NO2.
Jeffamine + TNT
0.00
20.00
40.00
60.00
80.00
100.00
120.00
140.00
160.00
180.00
200.00
0 10 20 30 40 50 60 70
Time (min)
N2 (uL)
NO (uL)
CO2 (uL)
N2O (uL)
NH3 (uL)
H2O (uL)
12 8313/2
Gases evolved during the reaction of RDX with the amine in an open beaker were carefullyanalyzed for escaping RDX vapor. A solid phase microextraction (SPME) fiber(polydimethylsiloxane/divinylbenzene, PDMS/DVB, Supelco, Inc. part no. 5710-U) designed tocollect traces of explosives from air, was used. The fiber was held at various distances above thesolution for a period of 10 seconds. After the collection period, the fiber was introduced into aPCP model 111 Ion Mobility Spectrometer and quickly heated to 165°C. The intensity of anyresulting signal would be proportional to the concentration of RDX being released from thesolution. A sample of “Jeffamine” alone did not produce a signal in the IMS. The concentrationof RDX in the gases above the reaction mixture was measured at various positions. Theconcentration in all cases was less than that obtained from a sample of RDX when heated to thattemperature.
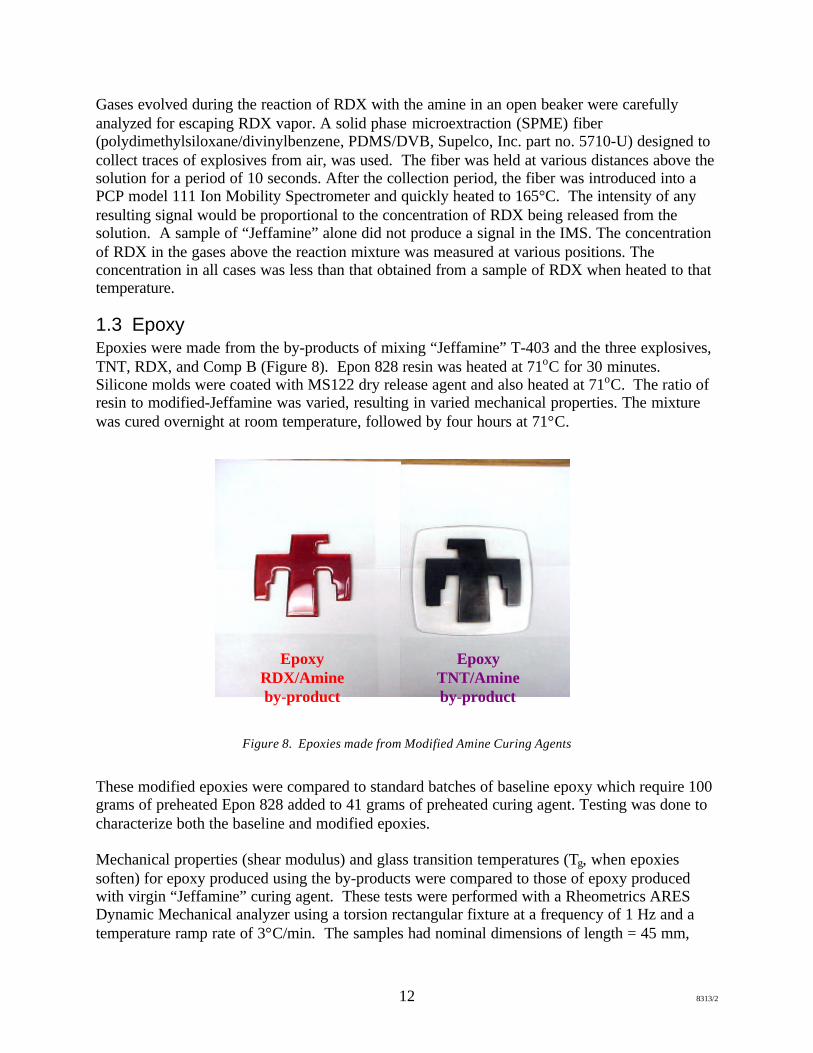
1.3 EpoxyEpoxies were made from the by-products of mixing “Jeffamine” T-403 and the three explosives,TNT, RDX, and Comp B (Figure 8). Epon 828 resin was heated at 71oC for 30 minutes.Silicone molds were coated with MS122 dry release agent and also heated at 71oC. The ratio ofresin to modified-Jeffamine was varied, resulting in varied mechanical properties. The mixturewas cured overnight at room temperature, followed by four hours at 71°C.
Figure 8. Epoxies made from Modified Amine Curing Agents
These modified epoxies were compared to standard batches of baseline epoxy which require 100grams of preheated Epon 828 added to 41 grams of preheated curing agent. Testing was done tocharacterize both the baseline and modified epoxies.
Mechanical properties (shear modulus) and glass transition temperatures (Tg, when epoxiessoften) for epoxy produced using the by-products were compared to those of epoxy producedwith virgin “Jeffamine” curing agent. These tests were performed with a Rheometrics ARESDynamic Mechanical analyzer using a torsion rectangular fixture at a frequency of 1 Hz and atemperature ramp rate of 3°C/min. The samples had nominal dimensions of length = 45 mm,
EpoxyRDX/Amineby-product
EpoxyTNT/Amineby-product
13 8313/2
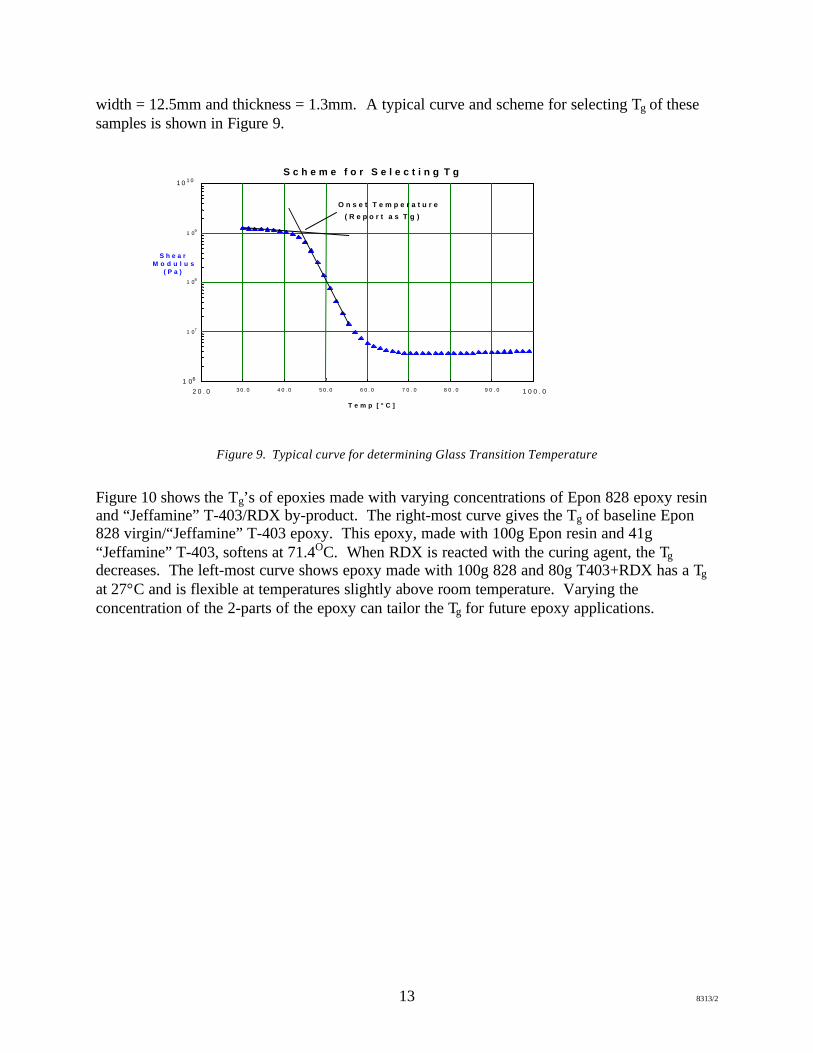
width = 12.5mm and thickness = 1.3mm. A typical curve and scheme for selecting Tg of thesesamples is shown in Figure 9.
Figure 9. Typical curve for determining Glass Transition Temperature
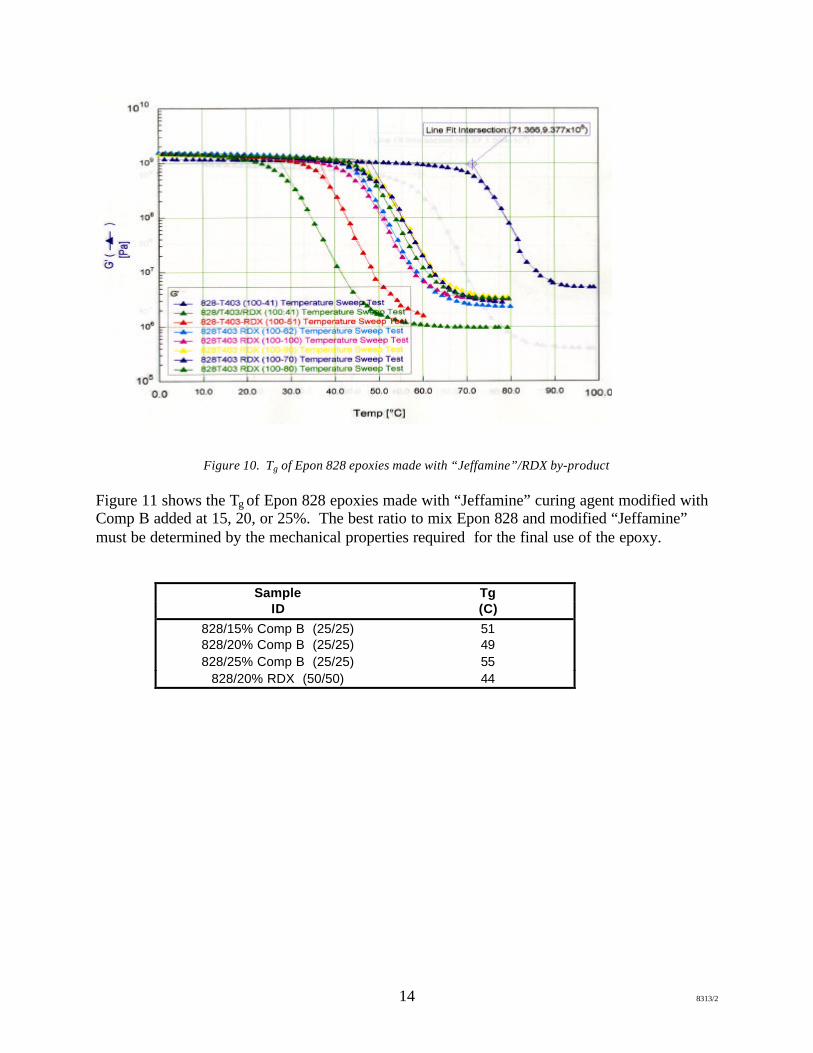
Figure 10 shows the Tg’s of epoxies made with varying concentrations of Epon 828 epoxy resinand “Jeffamine” T-403/RDX by-product. The right-most curve gives the Tg of baseline Epon828 virgin/“Jeffamine” T-403 epoxy. This epoxy, made with 100g Epon resin and 41g“Jeffamine” T-403, softens at 71.4OC. When RDX is reacted with the curing agent, the Tgdecreases. The left-most curve shows epoxy made with 100g 828 and 80g T403+RDX has a Tg
at 27°C and is flexible at temperatures slightly above room temperature. Varying theconcentration of the 2-parts of the epoxy can tailor the Tg for future epoxy applications.
2 0 . 0 3 0 . 0 4 0 . 0 5 0 . 0 6 0 . 0 7 0 . 0 8 0 . 0 9 0 . 0 1 0 0 . 01 06
1 07
1 08
1 09
1 0 1 0
T e m p [ ° C ]
S h e a rM o d u l u s
( P a )
S c h e m e f o r S e l e c t i n g T g
O n s e t T e m p e r a t u r e
( R e p o r t a s T g )
14 8313/2
Figure 10. Tg of Epon 828 epoxies made with “Jeffamine”/RDX by-product
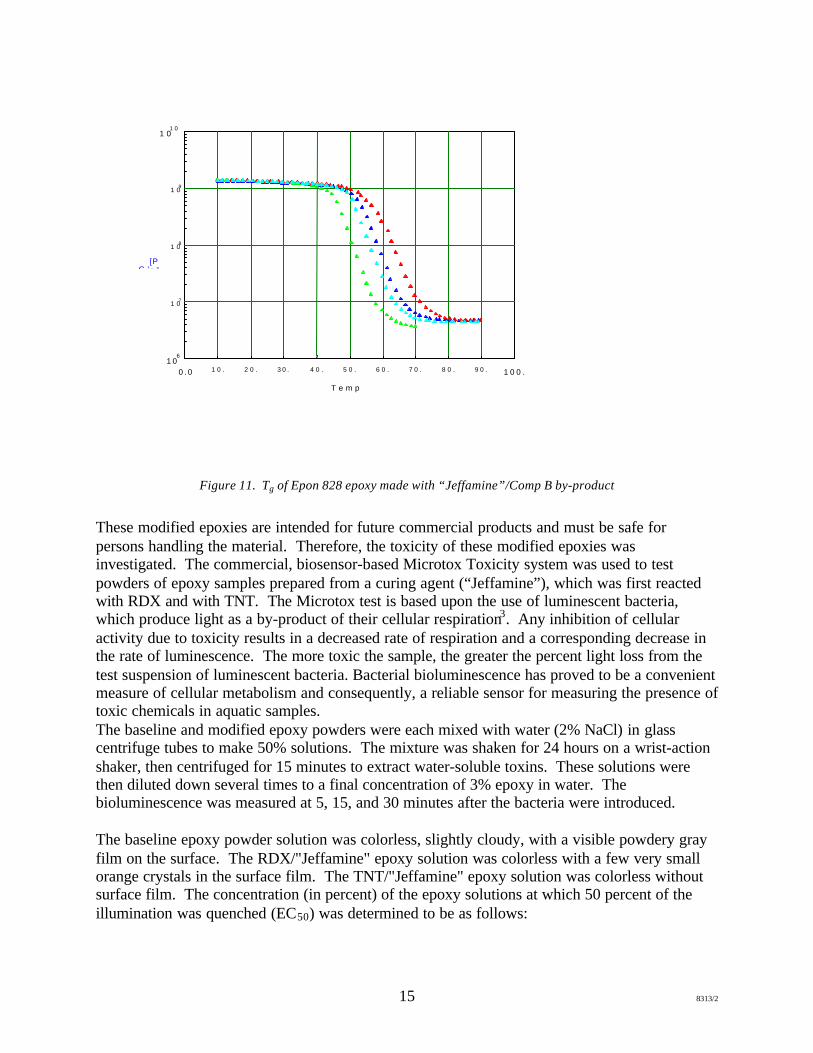
Figure 11 shows the Tg of Epon 828 epoxies made with “Jeffamine” curing agent modified withComp B added at 15, 20, or 25%. The best ratio to mix Epon 828 and modified “Jeffamine”must be determined by the mechanical properties required for the final use of the epoxy.
Sample TgID (C)
828/15% Comp B (25/25) 51828/20% Comp B (25/25) 49828/25% Comp B (25/25) 55
828/20% RDX (50/50) 44
15 8313/2
0 . 0 1 0 . 2 0 . 3 0 . 4 0 . 5 0 . 6 0 . 7 0 . 8 0 . 9 0 . 1 0 0 .0
1 06
1 07
1 08
1 09
1 01 0
T e m p[ ° C ]
G '[Pa ]
Figure 11. Tg of Epon 828 epoxy made with “Jeffamine”/Comp B by-product
These modified epoxies are intended for future commercial products and must be safe forpersons handling the material. Therefore, the toxicity of these modified epoxies wasinvestigated. The commercial, biosensor-based Microtox Toxicity system was used to testpowders of epoxy samples prepared from a curing agent (“Jeffamine”), which was first reactedwith RDX and with TNT. The Microtox test is based upon the use of luminescent bacteria,which produce light as a by-product of their cellular respiration3. Any inhibition of cellularactivity due to toxicity results in a decreased rate of respiration and a corresponding decrease inthe rate of luminescence. The more toxic the sample, the greater the percent light loss from thetest suspension of luminescent bacteria. Bacterial bioluminescence has proved to be a convenientmeasure of cellular metabolism and consequently, a reliable sensor for measuring the presence oftoxic chemicals in aquatic samples.The baseline and modified epoxy powders were each mixed with water (2% NaCl) in glasscentrifuge tubes to make 50% solutions. The mixture was shaken for 24 hours on a wrist-actionshaker, then centrifuged for 15 minutes to extract water-soluble toxins. These solutions werethen diluted down several times to a final concentration of 3% epoxy in water. Thebioluminescence was measured at 5, 15, and 30 minutes after the bacteria were introduced.
The baseline epoxy powder solution was colorless, slightly cloudy, with a visible powdery grayfilm on the surface. The RDX/"Jeffamine" epoxy solution was colorless with a few very smallorange crystals in the surface film. The TNT/"Jeffamine" epoxy solution was colorless withoutsurface film. The concentration (in percent) of the epoxy solutions at which 50 percent of theillumination was quenched (EC50) was determined to be as follows:

16 8313/2
Table 4. Toxicity of Epoxies in Water
Sample 5 minute EC50 15 min EC50 30 minute EC50
baseline epoxy 13.5% 7.5% 4.9%RDX epoxy 34.9% 16.4% 16.2%TNT epoxy 35.3% 29.4% 23.7%
Baseline epoxy is toxic at a concentration of 13.5%. As the water extracts more chemicals fromthe epoxy over time, the solution is more toxic at 30 minutes, with a concentration of just 4.9%causing 50% of the bacteria to die. The RDX and TNT epoxies are actually less toxic than thebaseline epoxy. Environmental criteria were established for TNT and RDX effluents with theallowable limits in aqueous discharge of 60 ppb and 200 ppb for TNT and RDX, respectively4.The “Jeffamine” epoxy toxicity results in Table II indicate that they less toxic by orders ofmagnitude, because these solutions do not become toxic until they are at the percent (%) level,rather than at the ppb level.
Flammability and shock testing of epoxy produced using the by-products indicated no explosiveor flammability hazards. Velocity Interferometer System for Any Reflector (VISAR) tests weredone to determine if the epoxies could be detonated. The VISAR has become the acceptedstandard for measuring particle velocities of shock loaded materials. Diffused light from thetarget containing Doppler-shift information is collected by a lens, split in half, with half of thesignal being sent through a reference leg and half sent through a delay leg. A delay is causedbetween the two legs, and the beams are then recombined at the main beam-splitter whereinterference is developed. The target velocity information is contained in the motion of theinterference fringes in each of the beams.
Epoxies made from modified “Jeffamine” were tested by shocking them with a PETN-boosteddetonator to provide sufficient power to achieve a detonation in the epoxy, should sufficientexplosive material still exist.
Three epoxies were tested:Virgin “Jeffamine” T403 only and 838 epoxy (control)20% by weight TNT in the “Jeffamine” T403 and 828 epoxy mix20% by weight RDX in the “Jeffamine” T403 and 828 epoxy mix.

17 8313/2
Table 5. VISAR Data for Cured Epoxies
Test Type Unit Length(cm)
Function time(microsec)
Initial peak velocity(m/sec)
Baseline epoxy 70 32 22Baseline epoxy 70 28 35Baseline epoxy 70 30 3020% by wt TNT 80 47 <1020% by wt TNT 83 38 <1020% by wt TNT 88 40 <2020% by wt RDX 74 35 1020% by wt RDX 80 40 1520% by wt RDX 72 33 10
A detonation is determined by an initial peak velocity of 1000 m/sec or greater. The peakvelocity and signature of the velocity data conclusively prove that none of the epoxy/explosivematerial detonated.
2.0 Process Scale-Up
A small scale-up operation was completed at Sandia National Laboratories to consume onekilogram of explosive. The waste explosive chosen for the scale-up operation was from theMcAlester Army Ammunition Plant meltdown facility. The Comp B explosive is from shellssuch as 8-inch World War II battleship rounds and 105mm artillery projectiles. The shells areinverted and placed in heated and pressurized vats that melt the explosive5. The beige-coloredliquid flows onto a chilled conveyor belt where it cools, hardens, then drops into cardboardboxes placed at the end of the belt. The explosive is now ready for reuse, recycle, or disposal.Fifty pounds each of melt-out TNT and Comp B were received from McAlester AAP for use inthis study. These chunks are an appropriate size for a direct feedstock into the scale-up reactor.
The engineering parameters critical for scale up were evaluated. The gases evolved when the“Jeffamine” reacts with the explosive were characterized (section 1.2) to consider scrubbingthese emissions in the final design. Gas chromatography analyses done on these gases showammonia to be a relatively large component (10 – 20%), as is NO2 when TNT is reacted, andboth would be an air emissions concern in a large operation. Due to the small quantitiesinvolved in our studies, local Environmental Protection Agency requirements waived anyscrubbing. However, upon future scale-up processes, the local requirements in that area wouldhave to be consulted to ensure compliance.
2.1 HardwareThe reaction rate kinetics were determined to size the reactor. Thermogravimetric analyses wereused to determine the weight loss due to gas formation. Samples of “Jeffamine” mixed withComp B were heated at four different heating ramps (2.5, 5, 10, and 20 oC/min). The kineticssoftware on the TA Instruments TGA determined the activation energy, and preexponential

18 8313/2
factor, and a reaction time of 5 minutes. As decomposing the explosive in hot “Jeffamine” isquite fast, a vessel to accomplish this can be small. A 13 gallon aluminum vessel was fabricatedand delivered to contain the reacting solution and foaming.
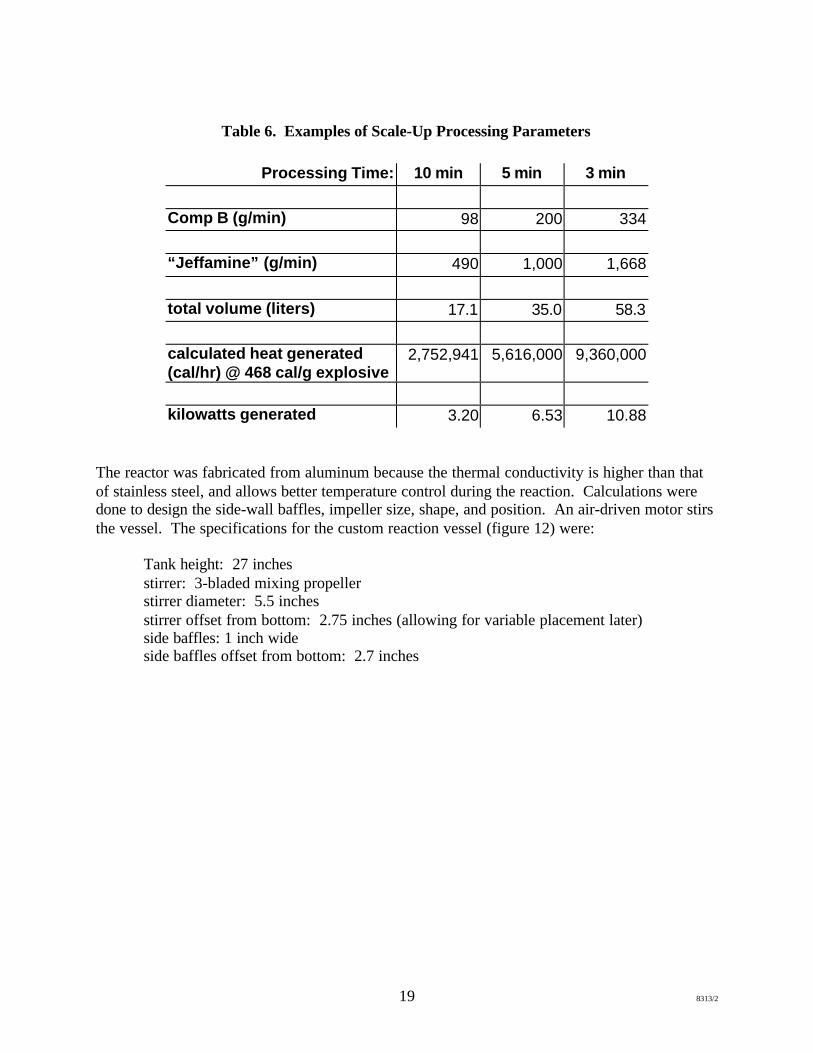
The scale-up process is a continuous operation, rather than a batch process. A conveyor beltcarries the dry, chunk Comp B explosive up to the reaction vessel. This conveyor belt waschosen so that it could be added to the final step of an existing demil operation, such as that atMcAlester Army Ammunition Plant. The conveyor is 9 feet long and 18 inches wide and has ananti-static polymeric belt, variable-speed drive, explosion-proof motor, and height adjustments.The control unit was mounted for remote operation. The conveyor belt delivered 1000g of CompB explosive in 5 minutes (Table 6).
The ambient-pressure reaction vessel was designed and sized to meet two constraints. One is thenet explosive weight limit of the building, 1000 grams in the test chamber. The reaction mustproceed at a rate, which allows slow introduction of the explosive to ensure complete reaction.This influences the second constraint, which is the rapid removal of the heat generated by thereaction. A worst case was assumed to determine the temperature increase during a typical run,assuming 468 calories/gram of explosive. As our scaled-up reactions were limited due tobuilding capacity, a 4 kW water chiller amply maintained constant temperature in the baffledwater jacket surrounding the reactor during reaction.
Examples of processing times and feedstock rates to consume 1000 grams of explosive areshown in Table 6.
19 8313/2
Table 6. Examples of Scale-Up Processing Parameters
Processing Time: 10 min 5 min 3 min
Comp B (g/min) 98 200 334
“Jeffamine” (g/min) 490 1,000 1,668
total volume (liters) 17.1 35.0 58.3
calculated heat generated(cal/hr) @ 468 cal/g explosive
2,752,941 5,616,000 9,360,000
kilowatts generated 3.20 6.53 10.88
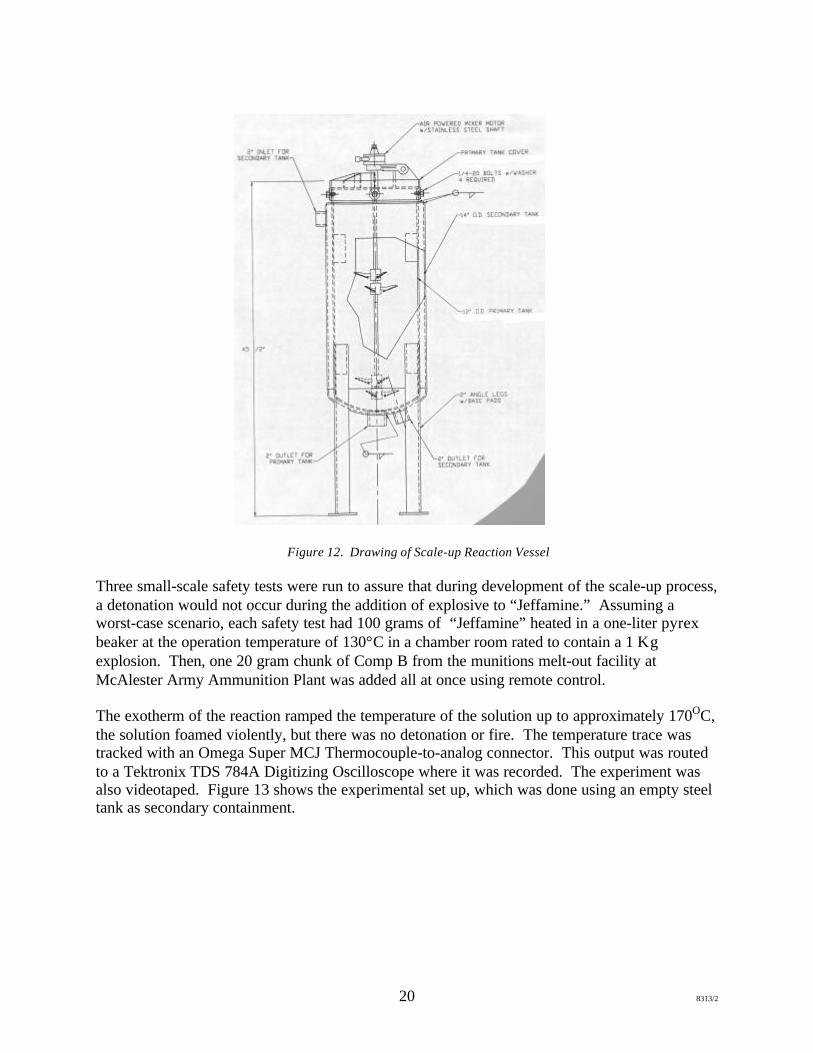
The reactor was fabricated from aluminum because the thermal conductivity is higher than thatof stainless steel, and allows better temperature control during the reaction. Calculations weredone to design the side-wall baffles, impeller size, shape, and position. An air-driven motor stirsthe vessel. The specifications for the custom reaction vessel (figure 12) were:
Tank height: 27 inchesstirrer: 3-bladed mixing propellerstirrer diameter: 5.5 inchesstirrer offset from bottom: 2.75 inches (allowing for variable placement later)side baffles: 1 inch wideside baffles offset from bottom: 2.7 inches
20 8313/2
Figure 12. Drawing of Scale-up Reaction Vessel
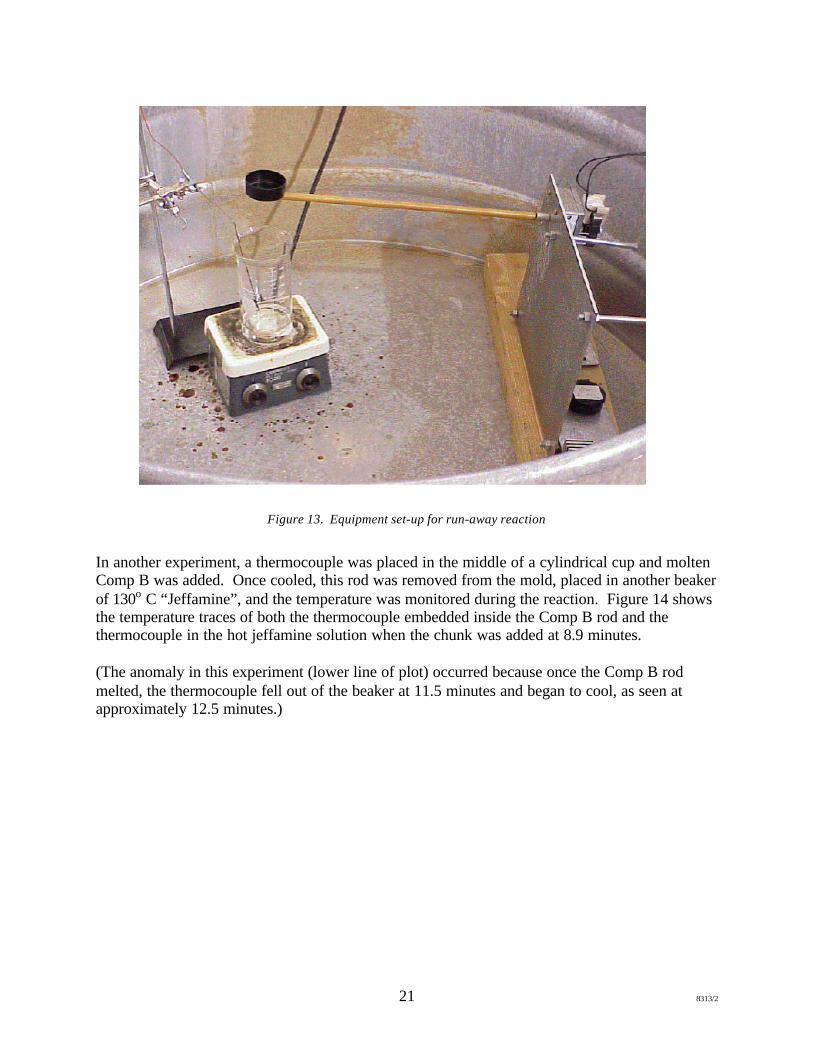
Three small-scale safety tests were run to assure that during development of the scale-up process,a detonation would not occur during the addition of explosive to “Jeffamine.” Assuming aworst-case scenario, each safety test had 100 grams of “Jeffamine” heated in a one-liter pyrexbeaker at the operation temperature of 130°C in a chamber room rated to contain a 1 Kgexplosion. Then, one 20 gram chunk of Comp B from the munitions melt-out facility atMcAlester Army Ammunition Plant was added all at once using remote control.
The exotherm of the reaction ramped the temperature of the solution up to approximately 170OC,the solution foamed violently, but there was no detonation or fire. The temperature trace wastracked with an Omega Super MCJ Thermocouple-to-analog connector. This output was routedto a Tektronix TDS 784A Digitizing Oscilloscope where it was recorded. The experiment wasalso videotaped. Figure 13 shows the experimental set up, which was done using an empty steeltank as secondary containment.
21 8313/2
Figure 13. Equipment set-up for run-away reaction
In another experiment, a thermocouple was placed in the middle of a cylindrical cup and moltenComp B was added. Once cooled, this rod was removed from the mold, placed in another beakerof 130o C “Jeffamine”, and the temperature was monitored during the reaction. Figure 14 showsthe temperature traces of both the thermocouple embedded inside the Comp B rod and thethermocouple in the hot jeffamine solution when the chunk was added at 8.9 minutes.
(The anomaly in this experiment (lower line of plot) occurred because once the Comp B rodmelted, the thermocouple fell out of the beaker at 11.5 minutes and began to cool, as seen atapproximately 12.5 minutes.)

22 8313/2
Figure 14. Typical Temperature profile of Safety test.
The viscosity of the liquid by-product was determined to provide measurements for thepumping requirements for scale-up. The viscosity measurements were made fromambient temperature up to 150o C. Typical data are shown in Figure 15.
Figure 15. Typical Viscosity Data for By-Products
Comp B + Jeffamine
0
20
40
60
80
100
120
140
160
180
200
0.000 2.000 4.000 6.000 8.000 10.000 12.000 14.000 16.000 18.000 20.000
time (min)
start (8.9 min, 132.1 deg)
(9.1 min, 18.2 deg)
(11.0, 155.8)
hot jeffamine
embedded thermocouple
Viscosity Tests of Liquid By-Products
1
10
100
1000
10000
100000
0 20 40 60 80 100 120 140 160
Temperature (C)
Jeffamine & Comp B (15% wt)
Jeffamine & Comp B (20% wt)
Jeffamine & Comp B (25% wt)
23 8313/2
The sequence of the scale-up operation starts with heating of the “Jeffamine” in its supply drum.An “Electro-Flex” band heater is wrapped around the metal drum and heated to 130o C. Duringthat time, the explosive is measured onto the conveyor belt. Because the chamber limit at SandiaNational Laboratories is 1000 grams of explosive, approximately 59 grams of explosive wereweighed out and put in each of 17 pockets on the conveyor belt. The pumping rate of the“Jeffamine” supply drum pump (Teel Air-Driven, ½ HP) is 1 liter/minute. The reaction vesselexit pump (Teel Centrifugal, ¼ HP) was previously set to a flow rate that prevents accumulationof liquid reaction products during the continuous operation. The data logger is started, with fourchannels monitoring the temperatures of the cooling jacket inlet and outlet, “Jeffamine” supplydrum, and reaction temperature. The blast door to the chamber is closed and the stirrer started at300 rpm. At time zero, the “Jeffamine” pump is started, then the conveyor belt; both run for fiveminutes. The reaction vessel exit pump is started to pump out the reacted liquid. The gasesevolved are drawn out of the room with an exhaust fan. Samples were taken from the reactionvessel and analyzed for residual explosives by high performance liquid chromatography. Nonewas found, indicating that the scale-up process can be done satisfactorily.
2.2 Computer Modeling of ProcessThe chemistry and heat production within the scale-up vessel was computer modeled to ensurecomplete reaction and safety during processing. A consulting contract with CFD ResearchCorp., Huntsville, Alabama provided computation of the flow, heat generation, heat transfer, andmass transport in the system. This model may be easily adapted for other complex geometriesand process parameters. The final report from CFDRC is found in Appendix C.
The approach to modeling the Sandia reactor will be to couple the one-phase and chemistrymodules in the multi-physics code, “CFD-ACE”. The code computes the flow, heat generation,heat transfer and mass transport in the system as part of the solution. The reaction mechanismswere supplied by Sandia. The developed model may be easily adapted for complex geometriesand process parameters. It will allow the process engineer to evaluate the potential of overheating and reaction efficiency for a given reactor design and set of operating conditions.
The foundation for the model is the general purpose, commercial computational fluid dynamicscode, CFD-ACE, which is a transient, three-dimensional, Navier-Stokes code capable ofsimulating multi-species transport, heat transfer (including thermal radiation, fully coupled gas-phase and surface chemistry for conventional chemical vapor deposition (CVD) reactors. TheCFD-ACE package is a very flexible code, that is coupled with preprocessing and postprocessing software (CFD-GEOM and CFD-VIEW) that make it relatively straight-forward toset up models for complex geometries and analyze the results. The complete report can be foundin Appendix C.
24 8313/2
3.0 Technology Transfer
3.1 Economics of Degrading Bulk ExplosivesTransferring this technology to another government or commercial organization wasinvestigated. An advertisement seeking a partner to use the by-product-”Jeffamine” or to furtherdevelop the process was published in the Commerce Business Daily (see Appendix B). Noresponses were received.
The price of degrading explosives by this method is rather high, however, at a cost of $21,000per ton of explosive. This is estimated based on buying “Jeffamine” at $2.19 per pound from theHuntsman Petrochemical Corporation, Houston, TX., USA., assuming no cost for the explosive,and loading it with 20 percent waste explosive. There would be some payback if commercialuses for the liquid or gaseous by-products could be found.
A minimal payback of this process could recover nitrous oxide for later sale. N2O is a valuablechemical in some oxidation reactions of benzene and its derivatives to phenols, and it has use inthe medical and dental fields6. There are zeolite molecular sieves which are available to adsorbN2O, for later desorption. The water (steam) venting from the process would be passed througha γ-Al2O3 bed to be absorbed before traveling to the molecular sieves. Barium-exchanged ZSM-5 zeolites trap the nitrous oxide7,8 from 25 – 80oC, then desorb the gas at 150 – 220oC. Thesezeolites could be reused after desorbing the N2O. On a large scale of processing tons ofexplosives, the reusable N2O-stripping bed would require 26,300 lbs of zeolites, a one-time costat the current price of $55/lb. The economic payback of reclaiming the N2O would only beapproximately 2.4% of the cost of processing the explosives.
There are other resource recovery technologies1 that can recover the TNT and RDX for resale.While private industry is paying $6 - $7/lb. for virgin RDX Class I, ANFO boosted with RDXsells for $1/lb9,10. TPL, Inc. has demonstrated 150lb/day plant at Ft. Wingate, N.M., for recoveryof RDX from CompA-3. AMCOM proposed to qualify reclaimed RDX for reformulation andcasting into recycled rocket motor hardware. Mechanical property, ballistic and static motorfirings will be performed for the reference and reclaimed propellant formulations. Eglin AFBhas developed a method for the recovery of TNT and RDX from melt/cast explosives such asComp B and Octol. ARDEC is developing processes to rework downloaded explosives to meetspecification requirements for military as well as reformulate into products for potentialcommercial market applications. Lawrence Livermore National Laboratory has developed a lab-scale synthesis to convert TNT to higher value products such as TATB.
3.2 Firing Range Clean-UpDue to this high cost of processing bulk explosives, this technique was considered forenvironmental clean up for firing ranges and range sustainment. Low-order-detonation shrapnelfrom 105 mm shells fired on Sandia’s remote range was picked up and placed in a beaker of hot“Jeffamine”. A seven-minute soak cleaned sub-gram amounts of explosive from the metal parts(Figure 16), leaving just nanogram-level traces of explosive on the metal surface. Agitation ofthe solution or a high-pressure spray would shorten the cleaning time. Firing ranges could be

25 8313/2
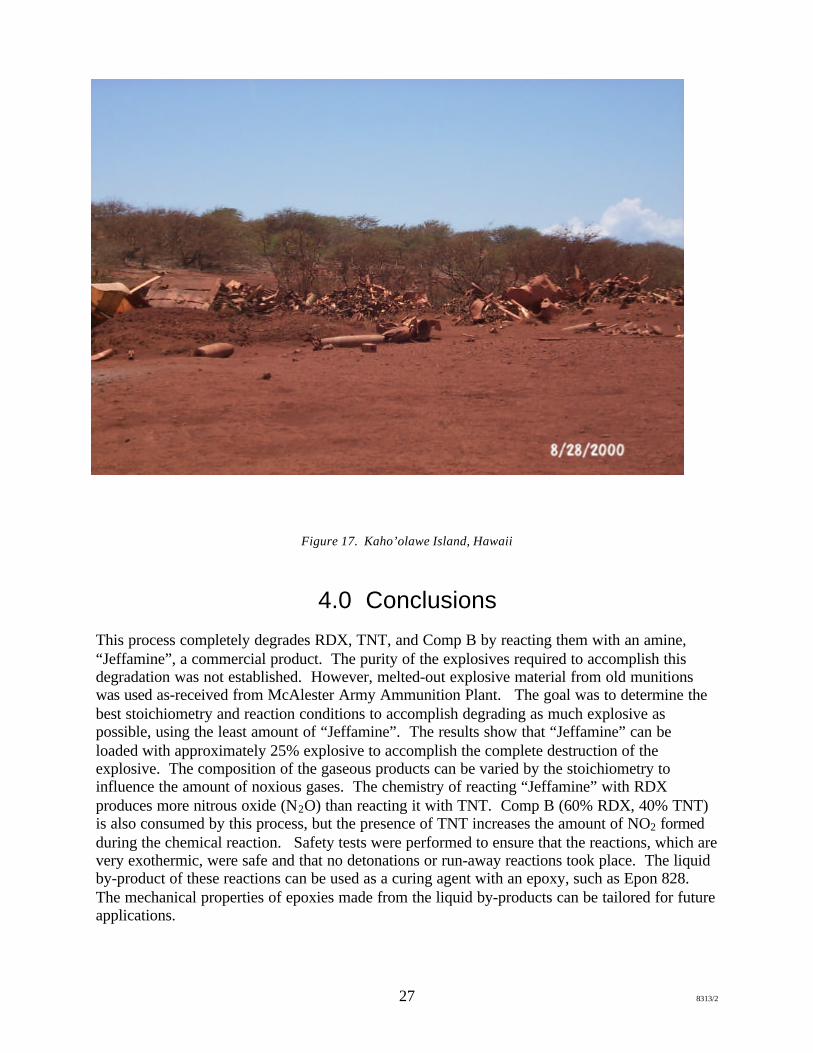
cleaned with a portable tank of hot “Jeffamine” mounted on a truck with shrapnel placed in abasket immersed in the liquid. An example of fragments to be cleaned can be found on Hawaii’sKaho’olawe Island, which was a firing range until 1995 (Figure 17).

26 8313/2
Figure 16. 105 mm shrapnel before and after soaking in “Jeffamine”. White material on the two left pieces is theexplosive before cleaning; the right pictures are after cleaning.
27 8313/2
Figure 17. Kaho’olawe Island, Hawaii
4.0 Conclusions
This process completely degrades RDX, TNT, and Comp B by reacting them with an amine,“Jeffamine”, a commercial product. The purity of the explosives required to accomplish thisdegradation was not established. However, melted-out explosive material from old munitionswas used as-received from McAlester Army Ammunition Plant. The goal was to determine thebest stoichiometry and reaction conditions to accomplish degrading as much explosive aspossible, using the least amount of “Jeffamine”. The results show that “Jeffamine” can beloaded with approximately 25% explosive to accomplish the complete destruction of theexplosive. The composition of the gaseous products can be varied by the stoichiometry toinfluence the amount of noxious gases. The chemistry of reacting “Jeffamine” with RDXproduces more nitrous oxide (N2O) than reacting it with TNT. Comp B (60% RDX, 40% TNT)is also consumed by this process, but the presence of TNT increases the amount of NO2 formedduring the chemical reaction. Safety tests were performed to ensure that the reactions, which arevery exothermic, were safe and that no detonations or run-away reactions took place. The liquidby-product of these reactions can be used as a curing agent with an epoxy, such as Epon 828.The mechanical properties of epoxies made from the liquid by-products can be tailored for futureapplications.
28 8313/2
The reaction was scaled up to process 1000 grams using Comp B and TNT from the McAlesterArmy Ammunition Plant meltout facility. Computer modeling computed heat flow, generation,and transfer, and mass transport to predict scale-up parameters for even larger scale-upoperations.
The economics of this process indicate that the cost of degrading one ton of explosive isapproximately $21,000. Minimal payback could be realized with the recovery of the nitrousoxide produced during the reaction, and any sale of the liquid by-product for use in epoxies, if acustomer could be identified.
Due to this high cost of processing bulk explosives, the process could be used instead for firingrange clean up and sustainment and processing of smaller quantities of explosive materials whenother disposal means are not feasible or economical. A portable vat of hot “Jeffamine” could betransported around a contaminated field, with a basket of shrapnel immersed in it to clean offresidual explosives.
Acknowledgments
We would like to acknowledgements the work done by other Sandia employees:
Epoxies made and Tg measurements were done by Ernie Corea.Viscosity measurements done by Mark Stavig.VISAR analyses were done by Theresa Broyles
Gas chromatography by Lori Montano-Martinez.

29 8313/2
5.0 References
1) Wheeler, James Q., et. al., “Joint Demilitarization Study”, Joint Ordnance CommandersGroup Munitions Demil/Disposal Subgroup, July 1999,
2) personal correspondence from Darryl Sasaki, Sandia National Laboratories.
3) MicroTox Toxicity Testing Procedure, instrument manual, ToxScan, Inc., Watsonville,California.
4) Rodacy, P. J., et. al., “Destruction of Explosives in Groundwater and Process WaterUsing Photocatalytic and Biological Methods”, Sandia National Laboratories, SAND96-0929.
5) Kennedy, Harold, “Demilitarization Work Takes its First Budget Hit in Years”, NationalDEFENSE, July/August 1999, pp. 35-36.
6) Centi, G., Perathoner, S., and Vazzana, F., “Catalytic control of non-CO2 greenhousegases”, Chemtech, December 1999, p 48.
7) Marcus, B., and Cormier, W., “Going Green with Zeolites”, Zeolyst Internationalpublication.
8) Centi, G., Generali, P., dall’Olio, L., Perathoner, S., and Rak, Z., “Removal of N2O fromindustrial gaseous streams by selective adsorption over metal-exchanged zeolites”,Industrial & Engineering Chemistry Research, January 2000, v. 39, pg. 131.
9) communication with BAE Systems Ordnance Systems Inc., Holston Army AmmunitionPlant.
10) communication with Ensign-Bickford Aerospace and Defense.

30 8313/2
6.0 Appendix A – IITRI Report
“Hypergolic Non-Detonative Neutralization of Energetics in Production and Demilitarization”
(The electronic version of this master document has a separate file attached that contains thisIITRI Report. The hardcopy has the text included)
HYPERBOLIC NON-DETONATIVE NEUTRALIZATION OFENERGETIC IN PRODUCTION AND DEMILITARIZATION
INTERIM TECHNICAL REPORT
IITRI Project No.C06831in Response to
Sandia National Laboratory Document No. BC-0414
Prepared for:
Sandia National LaboratoriesProcurement Organization 10232
P.O. BOX 5800 MS8724Albuquerque, NM 87185-0212
ATTENTION:Dr. Maher E. Tadros, Technical Representative
Prepared by:
Dr. Alan SnelsonMichelle Greybill
Chemical Technology DivisionIIT Research Institute
10 West 35th StreetChicago, Illinois 60616
February 1999
PREFACE
IIT Research Institute is pleased to submit this Interim Technical Report entitled “HyperbolicNon-Detonative Neutralization of Energetic in Production and Demilitarization,” IITRI ProjectNo. C06831, in response to Sandia National Laboratory Document No. BC-0414. The programwas initiated on 1/29/98 for a period of eleven months. Due to difficulties with respect torenewal of the IITRI Chicago Laboratory explosive storage license, active work on the programwas not initiated until May 16, 1998.
Data related to Tasks 1 and 3 are presented in this report. These data are recorded in IITRIlogbook numbers C31138,C31153,C31164, C31 177, C31202, C31203, C31204, C31207,C3 1213, C3 1216, C3 1218 and C3 1226. These data along with associated chromatograrns,integration results and IR Spectra will be stored in IITRI archives. This report has not beenaudited by the IITRI Quality Assurance Unit.
Respectful y submitted,
IIT RESEARCH INSTITUTE
@L/...gd2LTReviewed by:
Michelle GreybillAssistant EngineerChemical Technology Division
d by:
Division ManagerChemical Technology Division
Alan SnelsonScience AdvisorChemical Technology Division
SUMMARY
It has been known for at least twenty years that organic amines when added to explosives atambient temperature may react hyperbolically. A few grams of the amine have been shown to becapable of initiating the autocatalytic self-destruction up to 7-kg of TNT and Composition B infield tests. Arnines are currently being investigated for use in the non-detonative destruction ofexplosives in land mines. If larger quantities of the arnines are used in the initiating reaction, thereaction is not hyperbolic, but results in the formation of tarry-residue, which has been shown inlimited testsl to be non-detonable.
At the present time, the chemistries of the amine-explosive reactions are poorly understood, asare the factors responsible for the transitioning from rnildl y exothermic non self-propagating toself-propagating hyperbolic reactions,
. .
In this study (Task I of the work statement), the reactions of monoethanolarnine (MEA),diethylenetriamine (DETA) and n-tributylamine (TBA) with TNT, RDX and TNT+ RDX havebeen investigated under non self-propagating reaction conditions, i.e., an excess of amine.Characterization of the gaseous products formed and piirtial reaction stoichiometnes have beenidentified.
In addition, preliminary tests have been made to identify conditions under which solid TNT canbe burned in a “cigarette” mode in preparation for studies to characterize the gaseous productsformed in the hyperbolic amine-TNT reaction (Task 3 of the work statement),
Results for Task 1- Amine-Explosive Reactions Run in the Low Temperature Non-SelfPropagating Mode.
The reaction of MEA, DETA and TBA with TNT, RDX and TNT+ RDX were studied in thenon self-propagating mode. The reactions were preformed by adding - 10-20 g of explosive to =100g of amine in a 500-mL spherical flask fitted with a condenser, thermocouple and gascollection system. The reaction flask contents were stirred (magnetic stirrer bar) and heated asrequired on a hot plate. Reactions were performed under helium and the temperature monitoredduring the process. Gases generated in the reaction were collected in polyvinylfluoride gas bagsand analyzed by infrared spectroscopy (Ill). After completion of the reaction, the mass ofreaction product was determined and its unreacted amine content determined by gaschromatography with flame ionisation detection (GC/FID).
Based on lR analyses, NH3 and N20 were the only gaseous products formed in the TNT andRDX reaction with MEA and DETA. Gas samples from each of the reactions of TNT + MEAand RDX + MEA were analyzed for Hz, N? and Oz, but no significant amounts were detected. Inthe TNT and RDX reactions with TBA, N20, N02 and C02 where detected in the gas phase byIR.
Using the above data approximate, stoichiometries for the amine explosive reactions wereobtained:
...111
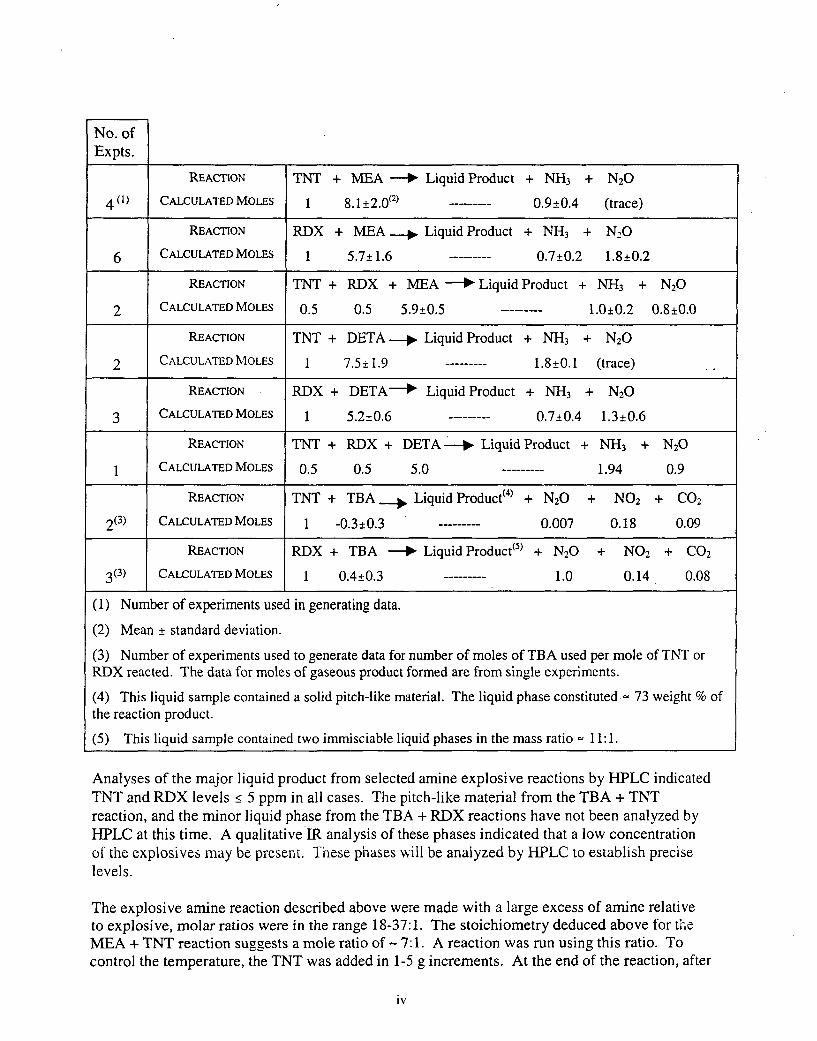
No. ofExpts.
4(1)
6
2
2
3
1
2(3)
3(3)
REACTION TNT + MEA ~ Liquid Product + NHs + NzO
CALCULATED MOLES 1 8.1 &@2) --------- 0.9*0.4 (trace)
REACTION RDX + MEA ~ Liquid Product + NH3 + NZO
CALCULATED MOLES 1 5.7* 1.6 --------- 0.74.2 1.8A0.2
REACTION TNT + RDX + MEA ~ Liquid Product + NH3 + N20
CALCULATED MOLES 0+5 0.5 5.9fo.5 .-------- 1.0~0.2 0.8~0.O
REACTION TNT + DETA -p Liquid Product + NH3 + NZO
CalCUlated NIOLES 1 7.521.9 --------- 1.8*O.1 (trace) .,
REACTION RDX + DETA~ Liquid Product + NH3 + N20
CALCULATED MOLES 1 5.2~().6 -------.- 0.7f0.4 1.3*().6
REACTJON TNT + RDX + DETA ~ Liquid Product + NH3 + N20
CALCULATED MOLES 0.5 ().5 5.0 --------- 1.94 0.9
REACTION TNT + TBA ~ Liquid Product(4) + N20 + N02 + COZ
CALCULATED MOLES 1 -0.3*0.3 --------- 0.007 0.18 0.09
REAcTlON RDX + TBA ~ Liquid Product(5) + N@ + N02 + Q
CALCULATED MOLES 1 ().4*().3 --------- 1.0 0.14, 0.08
(1) Number of experiments used in generating data.
(2) Mean ~ standard deviation.
(3) Number of experiments used to generate data for number of moles of TBA used per mole of TNT orRDX reacted. The data for moles of gaseous product formed are from single experiments.
(4) This liquid sample contained a solid pitch-like material. The liquid phase constituted .- 73 weight% ofthe reaction product.
(5) This liquid sample contained two immiscible liquid phases in the mass ratio u 11:1.
Analyses of the major liquid product from selected amine explosive reactions by HPLC indicatedTNT and RDX levels <5 ppm in all cases. The pitch-like material from the TBA + TNTreaction, and the minor liquid phase from the TBA + RDX reactions have not been analyzed byHPLC at this time. A qualitative IR analysis of these phases indicated that a low concentrationof the explosives may be present. Ti~ese phases will be analyzed by HPLC to establish preciselevels.
The explosive amine reaction described above were made with a large excess of amine relativeto explosive, molar ratios were in the range 18-37:1. The stoichiometry deduced above for the
MEA + TNT reaction suggests a mole ratio of -7:1. A reaction was run using this ratio. Tocontrol the temperature, the TNT was added in 1-5 g increments. At the end of the reaction, after
iv

elemental analysis, The TNT content of the final reaction product was determined by HPLC at s5 ppm and the MEA content by GC/FID at < 3%. Based on the above findings the stoichiometryof the reaction was determined to be:
TNT + 7MEA = Product + 3.5NH3 + 7H20
The empirical formula of the reaction product, a black pitch-like material, was calculated atC21,1H31,lN ~,@b,O,an extreme] y oxygen deficient compound from a combustion standpoint.
At the present time attempts to analyze the liquid reaction products formed in these reactions interms of the chemical species present have not been successful. GC/MS analyses have been triedwith and with out derivatization of the matrices with BSTFA to form trimethylsilyl derivatives ofreactive OH, N-H and COOH groups possibly present in the product. II? analyses also have beenattempted. Some preliminary anal yses using NMR have shown some promise but further workis needed.
Results for Task 3- TNT-Amine Reaction Run in the High Temperature Self-PropagatingMode
Attempts were made at the laboratory level to initiate a self-propagating reaction in a pellet ofTNT in the form of a cylinder = 0.5” inch diameter and 0.5” long (mean = 2 g). The pellet wasformed in a pellet press from either flake or finely ground TNT and wrapped in a few layers ofaluminum foil with one end open. Attempts to ignite the “open end” of the pellet with a heatsource (gas-ox ygen torch) and sustain the ignition after removal of the heat source failed.Attempts to initiate ignition by placing = 0.1 g of finely powdered TNT on the “open end” of theTNT pellet followed by addition of one or two drops of DETA on the powder also failed. Thepowder ignited but did not initiate sustained combustion in the TNT pellet.
Some success in obtaining sustained ignition in TNT pellets was obtained by activating the TNT
powder prior to pelletizing. Approximately 2 g of powdered TNT was added to “ 15 mL of 1weight ?io DETA in hexane. The powder was washed well with hexane and dried under vacuum.Pellets so prepared were initiated with = 0.1 g powdered TNT and a few drops of DETA.Sustained reaction in pellets prepared this way was generally obtained. If an “activated” pelletwas placed on top of “non-activated” pellet, initiation of the activated pellet sometimes resultedin sustained reaction in the second pellet.
Although the above approach holds promise for obtaining the “cigarette mode” of sustainedreaction in TNT pellets, the technique at the present time is not sufficiently reliable. It ispossible that a substantial effort maybe required to obtain sustained reaction for TNT whenreacting in the cigarette mode configuration.
TABLE OF CONTENTS
PaJjg
PREFACE ........................................................................................................................... iiSUMMARY .. .. ... .. .. .. .. .. ... .. .. ... .. ... .. ... .. ... .. .. ... .. .. ... .. .. ... .. .. .. .. ... . .. .. .. .. .. .. .. .. .. .. .. .. .. ... .. .. .... .. ... ..l1l
. . .
1. RESULTS TO DATE ON TASK I ..................................................................................... 11.1 Introduction ............................................................................................................. 11.2 Experimental ...........................................................................................................l
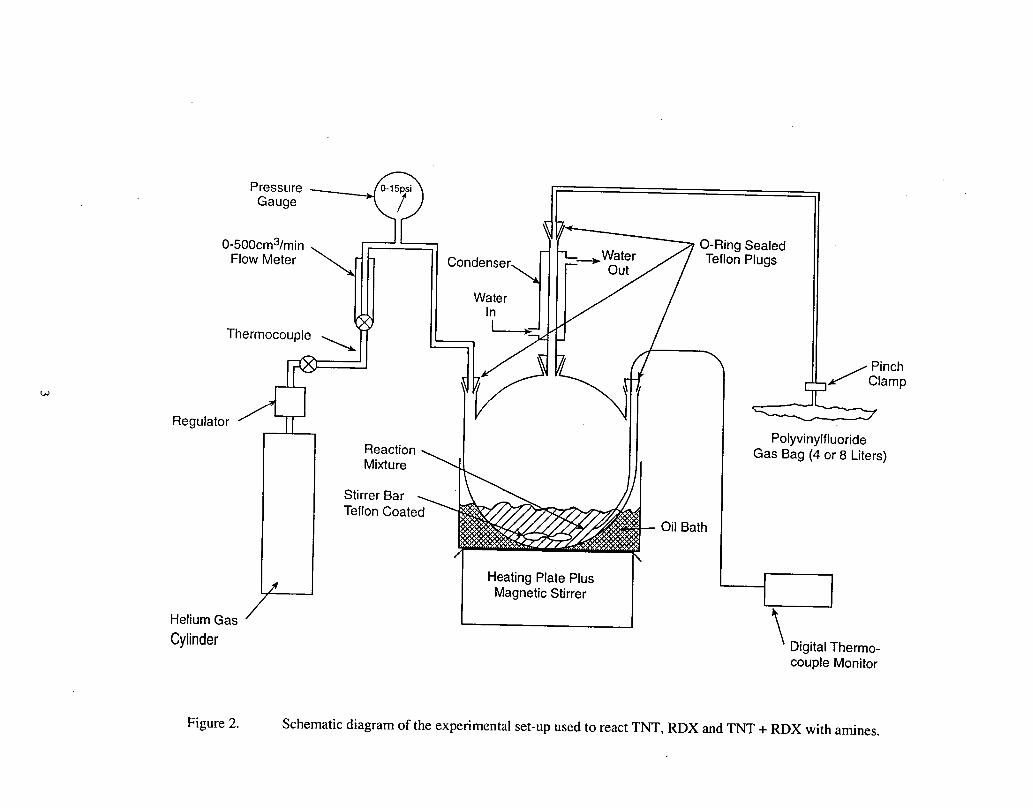
1.2.1 Reactor Operation ....................................................................................... 11.2.2 Materials Used in the Reactions ..................................................................41.2.3 Analyses of Gas Samples by Infrared Spectroscopy ................................... 5
1.2.3.1 Calibration of the II? Spectrophotometer ..................................... 5
1.2.4 Quantitative Analyses of Explosive-Amine Gas Samples ........................ 111.2.5 Analysis of Amines in Liquid Explosive-Amine Reaction Product Matrices
by Gas Chromatography withFlame Ionization Detection,GC/FID ................111.2.5.1 Calibration of the GC/FID .......................................................... 111.2.5.2 Determination ofAmine Content ofExplosive-Amine
Reaction Product Matrices ......................................................... 17
1.2.6 Analysis of TNT and RDX in Reaction Product Matrices by HPLC ........ 171.2.6.1 Calibration of the HI?LC ............................................................ 171.2.6.2 Determination ofTNT+RDX Concentrationsin
Selected Explosive-Amine Matrices .......................................... 17
1.3 Experimental Results for the Explosive-Amine Reactions ................................... 191.3.1
1.3.2
1.3.31.3.4
1.3.51.3.6
Qualitative Analytical Results for Gaseous Products Formed inExplosive-Amine Reactions ...................................................................... 191.3.1.1 Identification of Gaseous Products from Reaction of
MEA with TNT, RDX and TNT+RDX ................................... 191.3.1.2 Identification of Gaseous Products from Reaction of
DETA with TNT, RDX and TNT+ RDX .................................. 191.3.1.3 Identification of Gaseous Products from Reaction of
TBA with TNT and ~X ........................................................... 191.3.1.4 Identification of Gaseous Products Formed On Heating
MEA, DETA and TBA ............................................................... 19
Quantitative Analytical Results for Residual Amine Present inExplosive-Amine Reaction Product Mattix .............................................. 19Analytical Data on the Explosive-Amine Reaction Mass Balances ......... 20Analyses of Representative Explosive-Amine Reaction ProductProduct Matrices for Residual Explosive by HPLC .................................. 33Time-Temperature Profiles in the Explosive-Amine Reactions ...............34General Observations on the Explosive-Amine Reactions ....................... 42
vi
1.3.7 Reaction of TNT with MEA Using A Nominal ReactionStoichiometry of TNT + 7MEA = Products (Test #25-1 1-25-98) ............43
1.3.8 Speciation of the Amine-Explosive Liquid/Solid ReactionProduct Matrices .......................................................................................46
2. RESULTS TO DATE ON TASK 3 ..................................................................................472.1 Introduction ...........................................................................................................472.2 Experimental .........................................................................................................47
2.2.1 Activation of TNT (ATNT) Powder .........................................................472.2.2 TNT Pellet Preparation and Cigarette Burning Designs ........................... 482.2.3 Results .......................................................................................................48
2.3 Conclusions ...........................................................................................................49
3. wmmNcEs ..................................................................................................................55
vii
LIST OF FIGURES
Figure PaJgg
1
2
34567
8
9
10
11
1213
14
15
16
17
18
19
20
Data on exotherms generated in reaction of pyrrolidine with TNT at variousstoichiometries. Reactions initiated at ambient temperature .............................................. 2Schematic diagram of the experimental set-up used to react TNT, RDX andTNT+RDX with tines ....................................................................................................3Ill spectra of N20 at pressures of 5 and50mmof Hg ........................................................6IR spectra of NH3 at a pressure of 10 mm of Hg ................................................................7IR spectra of N02 at pressures of 4.9 and 25 mmof Hg ..................................................... 8IR spectra of C02 at pressures of 5 and50mm of Hg ........................................................9Experimental data used to calibrate the IR spectrometer response to ammoniagas at various pressures ..................................................................................................... 10GC/FID chromatogram of a calibration standard of DETA(4032.9 wglti) +IS(331.2Kg/mL) in methanol ............................................................................................ 13Graphical representation of GC/FID calibration data for MEA over theconcentration range= 4000-500 wg/mL in methanol. IS=d-8 naphthalene,concentration 313.28 ~g/mL . ............................................................................................l4Graphical representation of GC/FID calibration data for DETA over theconcentration range= 4000-500 ~g/mL in methanol. IS=d-8 naphthalene,concentration 331.2W~ti . .............................................................................................. 15Graphical representation of GC/FID calibration data for TBA over theconcentration range =2000- 1000 ~g/mL in methanol. IS= 2-meth ylnaphthalene,concentration 1565.2M~ti . ............................................................................................ 16HPLC chromatogram of a 1 ppm mix of the explosive calibration standards ..................18IR spectrum of gaseous reaction products generated in the MEA+ TNT reaction,Test No. 8-10-20-98. Gas sample pressure,400 mm of Hg .............................................2lIR spectrum of gaseous reaction products generated in the MEA+ RDX reaction,Test No. 4-10-05-98. Gas sample pressure, 740mmof Hg .............................................22IR spectrum of gaseous reaction products generated in the TBA + RDX reaction,Test No. 27-12-18-98. Gas sample pressure, 120 mm of Hg . ..........................................23GC/FID chromatography of a CH30H solution containing 2008 Lg/mL of theDETA + TNT reaction product matrix, Test No. 16-10-29-98. Data used todetermine residual DETA content of the mattix . ..............................................................24Test No. 2-10-02-98, HPLC chromatograrn of a MEA + TNT reaction productextract used in determination of the residual TNT content of the matrix ......................... 35Test No. 4-10-05-98, HPLC chromatogram of a RDX + MEA reaction productextract used in determination of the residual RDX content of the matrix ......................... 36Test No. 1-08-26-98. Time versus temperature profiles generated for anMEA(1OO.3 lg) + TNT(10.00g) reaction matrix (black diamonds) and for a heatedblank MEA(100g) reference matrix (grey squares) .......................................................... 38Test No. 13-10-26-98. Time versus temperature profiles generated for anMEA(100.39g) + RDX(20. 10g) reaction matrix (grey squares) and for a heatedblank MEA(100g) reference matrix (black diamonds) ..................................................... 39
...Vlll
21 Test No. 22-11-10-98. Time versus temperature profiles generated for aTBA(100.0Og) + TNT(10.00g) reaction matrix (grey squares) for a heatedblank TBA(100g) reference matrix (black diamonds) ......................................................4O
’22 Test No. 23-11-11-98. Time versus temperature profiles generated for aTBA(100.50g) + RDX(15.00g) reaction matrix (grey squares) for a heatedblank TBA(100g) reference matrix (black diamonds) ......................................................4l
23 Representative experimental set-up used for the “cigarette” burning of ATNTand TNTpellets in air ........................................................................................................5O
24 Representative experimental set-up used for the “cigarette” burning of ATNTand TNT pellets in an argon atmosphere .......................................................................... 51
25 Time-temperature profile of a single ATNT pellet (- 2 g) reacted in the cigaretteburning mode in air. Temperature probe just above pellet top surface ............................. 52
26 Time-temperature profile of an ATNT pellet (= 2 g) mounted in top of a TNT pellet(= 2g) reacted in the cigarette burning mode in air. Temperature probe justabove top surface of upper pellet ......................................................................................53
27 Time-temperature profile of an ATNT pellet (= 2 g) reacted in the cigarette burningmode in argon. Temperature probe just above top surface of pellet ................................ 54
ix

Table
LIST OF TABLES
12
3
4
5
678
9
IR spectrophotometer calibration data ................................................................................5GC/FID operating conditions for the determination of MEA, DETA and TBAin explosive reaction product matfices .............................................................................. 12Summary of analytical data and calculated percentage mass balances for thereaction of MEA with TNT, RDX and TNT+ RDX. ..................................................25-26Summary of analytical data and calculated percentage mass balances for thereaction of DETA with TNT, RDX and TNT +RDX. ................................................27-28Summary of analytical data and calculated percentage mass balances for thereaction of TBA with TNT and RDX ..........................................................................29.3OSummary of data for mass balances obtained for the explosive reactions studied ........... 20Approximate stoichiometries of explosive-amine reactions studied ................................. 32Summary of HPLC data for determination of residual TNT and RDX contentsin MEA +TNTand MEA +~X matrices ......................................................................37Reaction TNT(53.Olg) + MEA(100.03g): elemental mass balances ...............................45
x
SECTION 1
RESULTS TO DATE ON TASK I
1.1 INTRODUCTION.
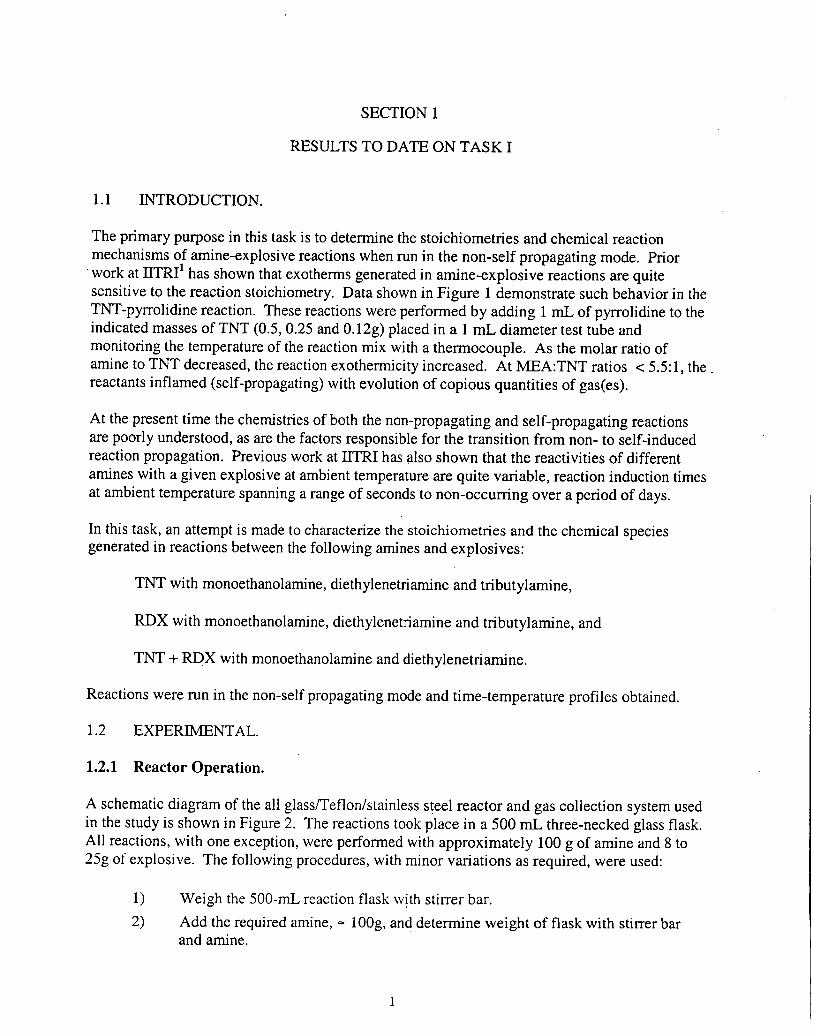
The primary purpose in this task is to determine the stoichiometries and chemical reactionmechanisms of amine-explosive reactions when run in the non-self propagating mode. Priorwork at IITRI1 has shown that exotherms generated in amine-explosive reactions are quitesensitive to the reaction stoichiometry. Data shown in Figure 1 demonstrate such behavior in theTNT-pyrrolidine reaction. These reactions were performed by adding 1 rnL of pyrrolidine to theindicated masses of TNT (0.5, 0.25 and 0, 12g) placed in a 1 mL diameter test tube andmonitoring the temperature of the reaction mix with a thermocouple. As the molar ratio ofamine to TNT decreased, the reaction exothermicity increased. At MEA: TNT ratios <5.5:1, the .reactants inflamed (self-propagating) with evolution of copious quantities of gas(es).
At the present time the chemistries of both the non-propagating and self-propagating reactionsare poorly understood, as are the factors responsible for the transition from non- to self-inducedreaction propagation. Previous work at HTR1 has also shown that the reactivities of differentarnines with a given explosive at ambient temperature are quite variable, reaction induction timesat ambient temperature spanning a range of seconds to non-occurnng over a period of days.
In this task, an attempt is made to characterize the stoichiometries and the chemical speciesgenerated in reactions between the following arnines and explosives:
TNT with monoethanolamine, diethylenetriamine and tributylamine,
RDX with monoethanolamine, diethylenetriamine and tributylamine, and
TNT + ~X with monoethanolamine and diethylenetriamine.
Reactions were run in the non-self propagating mode and time-temperature profiles obtained.
1.2 EXPERIMENTAL.
1.2.1 Reactor Operation.
A schematic diagram of the all glass/Teflon/stainless steel reactor and gas collection system usedin the study is shown in Figure 2. The reactions took place in a 500 mL three-necked glass flask.All reactions, with one exception, were performed with approximately 100 g of amine and 8 to25g of explosive. The following procedures, with minor variations as required, were used:
1) Weigh the 500-mL reaction flask \vith stirrer bar.
2) Add the required amine, = 100g, and determine weight of flask with stirrer barand amine.
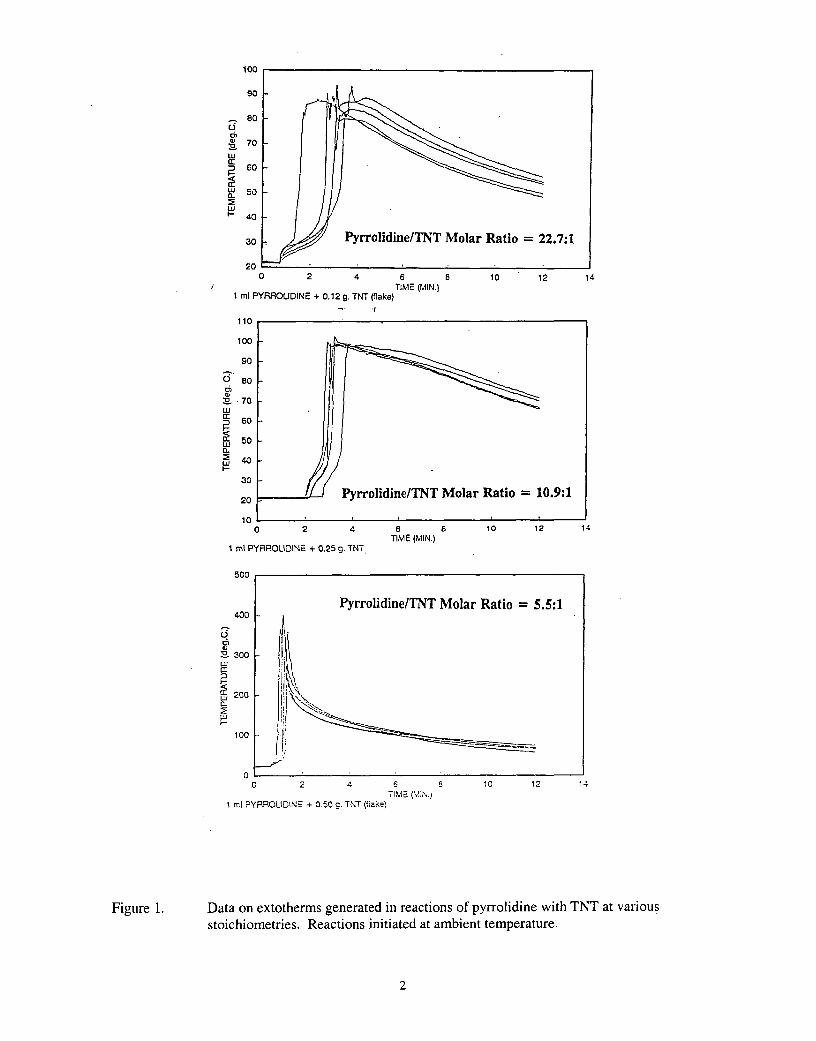
Figure 1.
301w Pyrrolidine/TNT Molar Ratio = 22.7:1 I20W ‘ I
o 2 4 6 8 10 12 14TIME (MIN.)
1 ml PYRROLIDINE + 0.12 g, TNT (f!ake)-,. .r
110
100
90
30
20Fyrrolidine/TNT Molar Ratio = 10.9:1
10 Io 2 4 8 10 12 14
ThE (MIN.).,I ml F’YRROUDINE + 0.25 g. TNT,
500 ~
Pyrrolidine/TNT Molar Ratio = 5.5:1
AIl,!;~},
, l<~.”,,(
o
Data on extotherms generated in reactions of pyrrolidine with TNT at variousstoichiometries. Reactions initiated at ambient temperature.
2
w
PressureGauge
O-500cm3/minFlow Meter
A
Thermocouple#
it
Condenser
Water
4Regulator
ReactionMixture
Stirrer Bar
/
Helium Gas /
Cylinder
Figure 2.
if
Teflon Coated
I Heating Plate Plus I
I Magnetic Stirrer ‘
Oil Bath
PolyvinylfluorideGas Bag (4 or 8 Liters)
\ Digital Thermo-couple Monitor
Schematic diagram of the experimental set-up used to react TNT, RDX and TNT+ RDX with amines.

3)
4)
5)
6)
7)
8)
9)
10)
11)
12)
13)
14)
15)
16)
17)
Assemble the reactor system shown in Figure 2 with the pinch clamp to the gascollection bag (not connected) closed.
Pressurize system to 2-3 psi and verify leak tightness.
Test gas bag for leaks by inflating and submersing in water.
Open pinch clamp to gas bag and purge system with helium at 100-200 mIJminfor at least 10 minutes.
Turn on the condenser cooling water, magnetic stirrer and record reactortemperature for at least 10 minutes to ensure temperature stability (~ 2 “C).
Weigh out the required amount of explosive in a small beaker.
When temperature stability in Item 7 is achieved, perform the following operationsequentially and quickly:
a) remove the taper joint containing the helium purge line
b) place a powder funnel in the taper joint and pour in the explosive
c) remove the powder funnel and replace the helium purge line
d) attached the gas collection bag to the system
e) turn off the helium purge gas flow
Continue to monitor the reactor temperature.
Approximately 10 minutes after addition of explosive, turn on the reaction flaskheater plate to the required setting.
Continue to monitor reactor temperature and observe the degree of gas baginflation.
If the gas bag becomes filled, quickly remove, seal and replace with a second orthird bag as required.
When the reactor temperature max@izes and begins to cool, the heater plate isturned off and the system allowed to cool to ambient.
The gas collection bag is removed and a new bag attached. The helium purge gasflow is statied and the residual reactor headspace gas collected.
As soon as is practical, (usually the same day) the collected gas is analyzed (seeSection 1.2.3 on gas analysis by II/ spectroscopy).
When the reactor has cooled to ambient temperature, it is dismantled from thesystem and weighed to determine the mass of reaction product remaining.
1.2.2 Materials Used in the Reactions.a) Monoethanolamine (MEA), HOCJ&NHZ Sigma Aldrich-Chemical Co.,
purity, 99%b) Diethylenetriamine (DETA), HzNC2HJVHC2H4NH2, Sigma-Aldrich
Chemical Co., purity 9990.c) Tributylamine (TBA), (C4Hg)3N, Fluka Chemical, purity 99%.d) TNT - Type 1, ICI Explosives, Canada. This is a flake material.e) RDX-3 Type 1, AI-water-wet (dried). This is a finely granulated material.
1.2.3 Analyses of Gas Samples by Infrared Spectroscopy.
1.2.3.1 Calibration of the II? Spectrophotometer. During the study, Ill spectroscopy was used toidentify and quantify gaseous species generated in the explosive-amine reactions. The followingspecies were identified, nitrous oxide (N20), ammonia (NH3), nitrogen dioxide (N02) and carbondioxide (C02). IR spectra were recorded on a Perkin-Elmer Model 273 El spectrophotometerusing a 10 cm pathlength gas cell fitted with either KBr windows (N20, NH3 and C02) or AgClwindows (N02 or any gas mixture containing N02). Calibration gases were introduced into theIR gas cell at known pressures using standard vacuum line techniques. The following gases wereused:
N20: supplied by AGA Gas Central, purity 99%NH3: supplied by AGA Gas Central, purity 99.99%N02: supplied by Sigma-Aldrich Chemical Co., purity, 99.5+%C02: supplied by AGA Gas Central, purity 99.99%
Spectra of the pure gases at the pressures indicated, are shown in Figures 3 through 6. Thebalance of the pressure in the gas cell was made up to 760 mm of Hg with zero air.
The response of the spectrophotometer to the various gases was determined assuming a linearrelationship:
log IJI = PX(rnm of Hg) + C
where IJI is the ratio of the transmitted IR energy at a specified wavelength, with and withoutrespectively, the gas (x) in the cell at a pressure of P, mm of Hg. Experimental data were fittedto the above equation using a linear regression analysis and the correlation coefficientdetermined. Calibration equations were generated based on 3 to 6 data points. Calibrationequations were considered satisfactory provided the correlation coefficient r was >0.99. Thecalibration equation was checked on each day of its use by comparing the actual instrumentresponse to a given gas standard of known pressure with that calculated from the calibrationequation. Providing the responses were within ~ 10% of the equation calculated values, thecalibration equation was considered acceptable, if not a new calibration equation was generated.A set of experimental data used to calibrate the IR spectrophotometer with ammonia is shown inFigure 7. Typical calibration equations are shown below:
Table 1. IR spectrophotometer calibration data.
Gas Equation No. of Correlation Absorption PressureData Pts. Coefficient Maximum Range
(r) ( cm-’) (mm of Hg)
N20 lnLJI = 0.2357P~z0 + 0.1357 5 0.9912 = 2210 4.74-0.50
NZO lnLJI = 0.0455P~zo + 0.1940 3 0.9976 = 1275 25.0-8.19
NH, I lnIJI = 0.00588PNHS+ 0.08831 I 6 I 0.9962 I u 334o I 120-21
NH3 I lnIJI = 0.2234Pm? + 0.1657 I 4 I 0.9993 I = 940 I -8.08-1.51
NOZ lnIJI = o.2959P~02 + 0.1407 5 0.9979 -1602 4.93-0.53
C02 lnIJI = O.1666Pc02 -0.0021 6 0.9988 = 2330 7.53-0.70
(1) Frequency of absorption band usedtin the calibration determination.
5
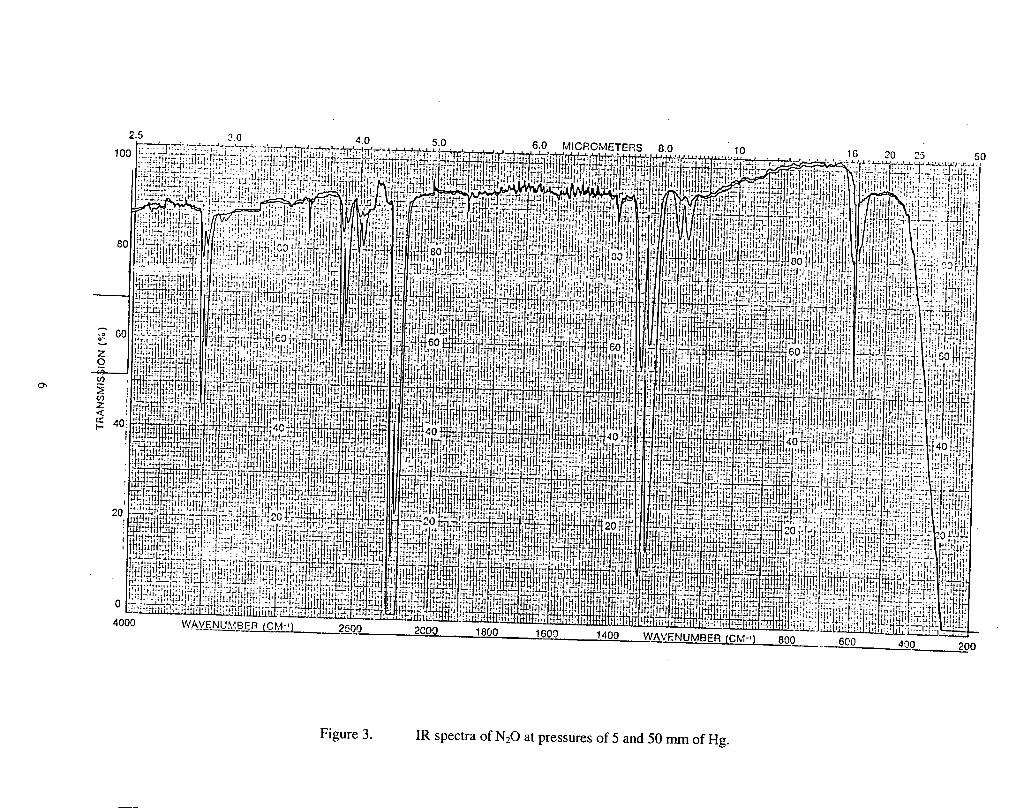
Figure 3. IR spectra of NZO at pressures of 5 and 50 mm of Hg.

Figure 4. IR spectrum of NH~ at a pressure of 10 mm of Hg.
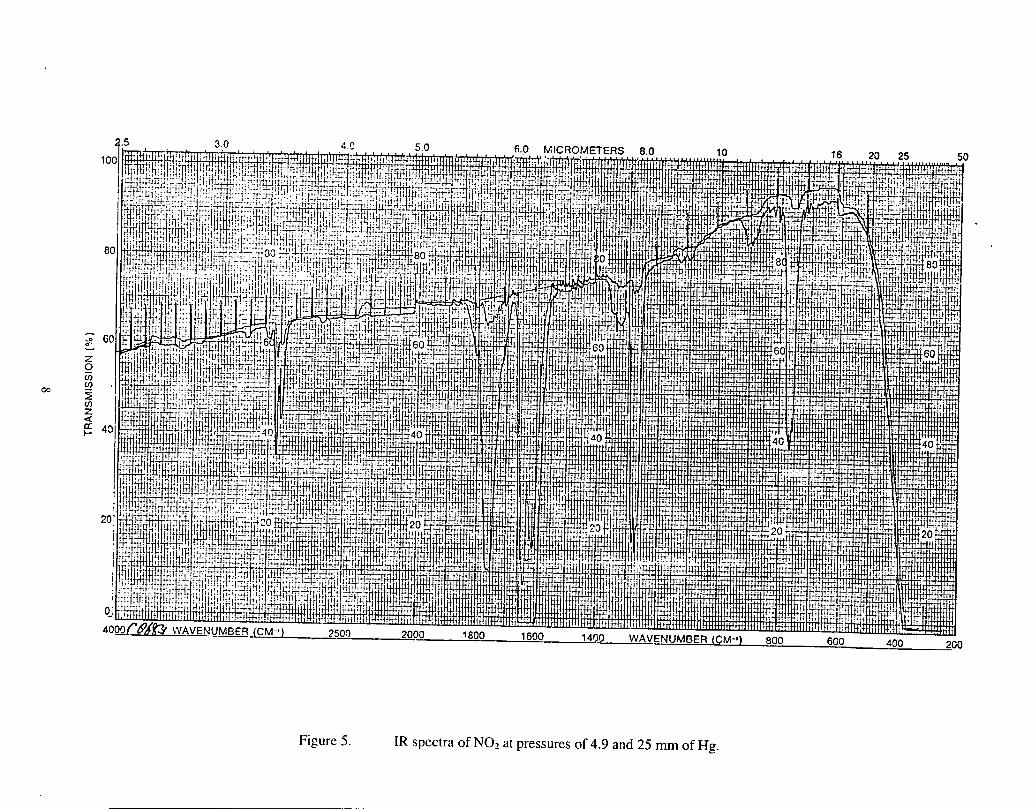
Figure 5 IR spectra of NO? at pressures of 4.9 and 25 mm of Hg.
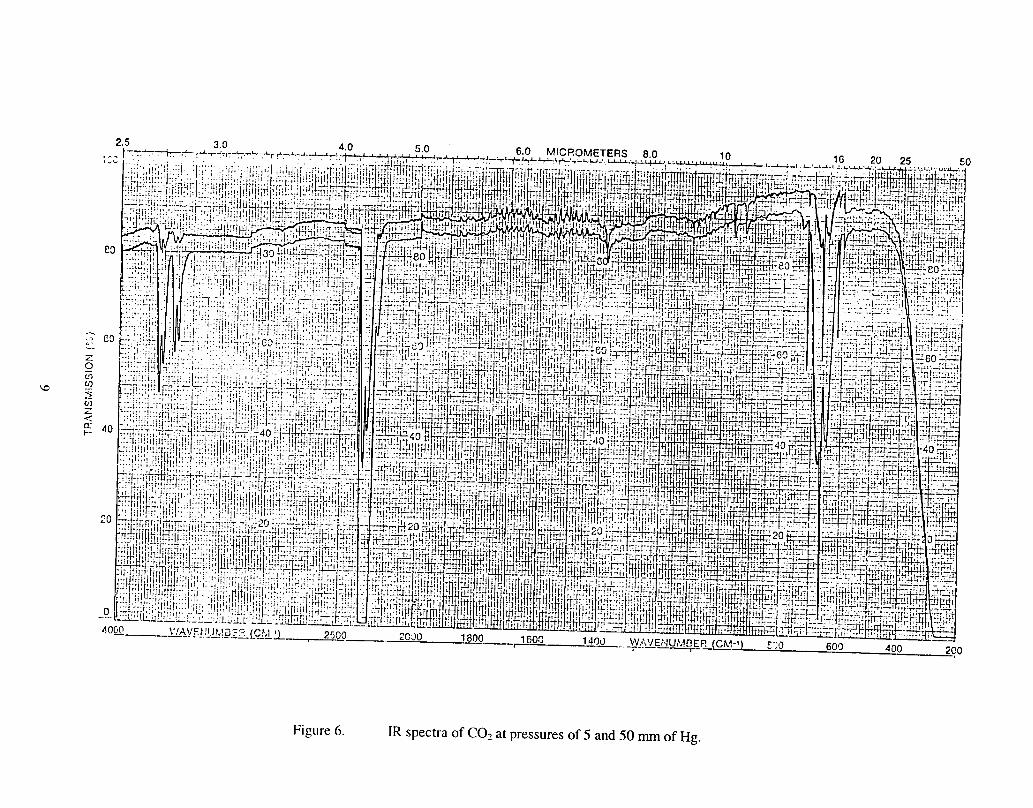
Figure 6. lR spectra of COZ at pressures of 5 and 50 mm of Hg.

-—-. . .——’
L’2L-, >.:_ - .! .. ___ -----i’ ..: l.”! .:
i... ..-. .... . . . ..... 1: .:”:.”” ::. _,_!.. ------------- . . . ... . .. . . .. . . . . ..’ +!‘ ~ F’mzi-”.a.’.-’,.: ;--. —.-... i... –... .\. . . . .
‘“f---: L--– ...... . .... . .. . .________. ---- _. -J._ .._
,..
~..._j,, :
. . . . . .,.. :
I 1::”’.l“’ .L.-
Ii,
r
“1’”$
.,-i ~;
-1.-.[.“-“i. ;
o....... .4 ,
------------- .
I
“:=f@7b””. ..,:...”:.
--------- . . . -,;.,..... ,., ,
;.:.-,’...,. ;, ;... :. ..1 t ..:::3:.:.1’::.:!::”!:.;..::j..!- :..,-
. ......:.—.
4.-.. ...:.,. ;......:.
‘“” !“”” I ::,:,:, . . “,.-”. i..
,. ,:.,,.
,,!-.!.
. .. ....... . . . .. . .,..’
~,. ;“wo.r.i.d”:,””””..... . . .
.1 ,. :!!:.--_... —--A-
. . . . .;...,, ”,!,.
Figure 7. Experimental data used to calibrate the IR spectrometer response to ammonia gas at various pressures.
1.2.4 Quantitative Analyses of Explosive-Amine Gas Samples.
Gas bags, 8- or 4-liter capacity, containing gases generated from explosive-amine reactions wereattached to a vacuum line containing a calibrated volume of -4200 cm3. Standard vacuum linetechniques were used to measure the volume of gas in collection bags using ideal gas PVTbehavior. After determining the volume (moles) of gas in each bag, the Ill cell was filled with agas sample at as high a pressure as possible (S 1 atmosphere depending on the amount of gascollected) and a survey spectrum run to identify the species present. The pressure in the cell wasthen reduced to bring the log IJI absorbance values of each gas into the range of its calibrationequation and the mole fraction of each gas present in the sample determined. These data werethen used to determine the total amount of each gas present in the original gas sample collected.
1.2.5 Analysis of Amines in Liquid Explosive-Amine Reaction Product Matrices by GasChromatography with Flame Ionization Detection, GC/FID.
1.2.5.1 Calibration of the GC/FID. Anal yses were performed on the liquid reaction productfrom the amine-explosive reactions to determine the amount of amine consumed. The analyticalmethod selected was GC/FID. Analyses were performed on a Perkin-Elmer GC/FID Autos ystemusing an internal standard (IS) method. The GC/FID was run under the conditions shown inTable 2.
Standard solutions (a minimum of five concentration levels) of each of the amines with theinternal standard were prepared in methanol for calibration of the GC/FID. Duplicate injectionsof each of these standards were used to generate GC/FID calibration equations in the form:
Amine GC/FID area response =
IS GC/FID area response
— —
A Cone. Amine (,ug/mL)
Cone. IS Q@nL)L —
+B
where A and B are constants determined from a least squares analysis of the data. A typicalchromatogram obtained in the calibration of the GC/F~ with DETA is shown in Figu;; 8.Graphical plots of typical calibration equations are shown in Figures 9, 10 and 11. Calibrationequations were considered acceptable if:
a) r, the linear regression analysis correlation coefficient was >0.99b) Amine standard concentrations calculated from the GC/FID responses were
within + 25% of the prepared values for all but the lowest standard used.
11
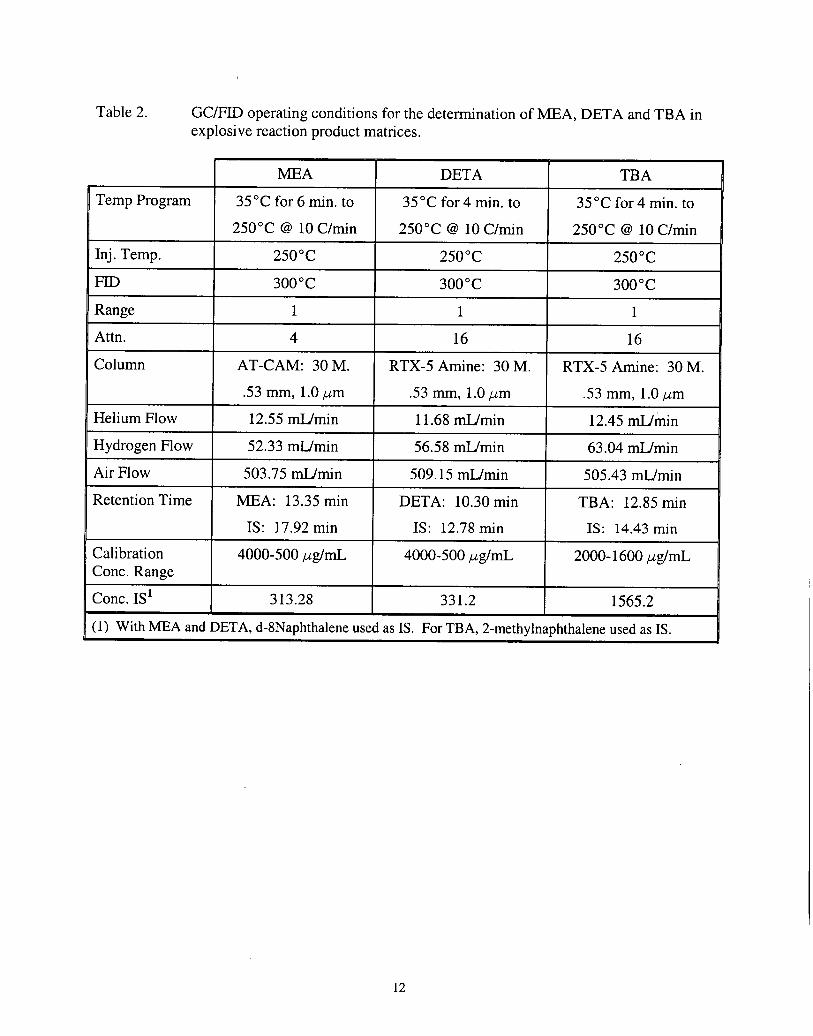
Table 2. GC/FID operating conditions for the determination of MEA, DETA and TBA inexplosive reaction product matrices.
MEA DETA TBA
Temp Program 35°C for 6 min. to 35°C for 4 min. to 35°C for 4 min. to
250°C @ 10 Chin 250”C @ 10 C/rein 25C)°C @ 10 C/rein
Inj. Temp. 250”C 250”C 250”C
FID 300”C 300°c 300°c
Range 1 1 1
Attn. 4 16 16
Column AT-CAM: 30 M. RTX-5 Amine: 30 M. RTX-5 Amine: 30 M.
.53 mm, 1.0 fim .53 mm, 1.0 flm .53 mm, 1.0 ~m
Helium Flow 12.55 rd..lmin 11.68 rrd.hin 12.45 mLJrnin
Hydrogen Flow 52.33 mL/min 56.58 mLlmin 63.04 rnLhin
Air Flow 503.75 mIJmin 509.15 m.Umin 505.43 mLimin
Retention Time MEA: 13.35 min DETA: 10.30 min TBA: 12.85 min
I IS: 17.92 min I IS: 12.78 min I IS: 14.43 min
Calibration 4000-500 /.@nL 4000-500 /JghnL 2000-1600 /L@-I-LCone. Range
I I I
Cone. lS1 313.28 331.2 1565.2
(1) With MEA and DETA, d-8Naphthalene used as IS. For TBA, 2-methylnaphthalene used as IS.1
12

4032.9 ug/mL DETA +33 1.2 ug/mL Naph; 1.2 ULPagel
4032.9 ug/mL DETA + 331,2 ug/mL Naph; 1.2 ULC:\CPWlN\DATA2\DETAl 103.04R
1200
1100
1000
900
800
700~C-Ygg 600.
~>E 500-
400-
aN
0
-
I
o 2 4 6 81
10 12 14 16Minutes (Span= 17)
Sample Name: 4032.9 ug/mL DETA + 331.2 ug/mL h’aph; 1.2 ULAcquired from PE-A--FID wa port 2 on 11/3/98 11:1S:19am by hlG ;C06831RTX-5 Amine:30Mx.53mm, 1.0um;35C,4m-250C@ 10C/mInj 250C; FID 300C; Range 1; Attn 16
Data File: C:\CPWINlDATA2U)ETAl 103.04RDate Stmmp: 11/3/9S 1l:18:18am
Method File: C:\CPWINU)ATA lIDETANAP.METVersion 4. Dde Stamp: 11/3/9S 10:22:4-l~m
Calibmtion File: C:\CPWINU)ATA lUIETA 1102.CALVersion 2. Date Stamp: 11/3/98 10:22:36am
Run Time = 16.5 min Sample Rate = 3.0 per sec.Amount Inj. = 1.000 Dilution Factor = 0,000
C:\CPWINU)ATA2WETA 1103.O4R Printed on 11/3/98 1:32:10 PM
1
I
Figure 8. GC/FID chromatogram of a calibration standard of DETA (4032.9 Kg/rnL) +1S(33 1.2 ~g/rnL) in methanol.
13
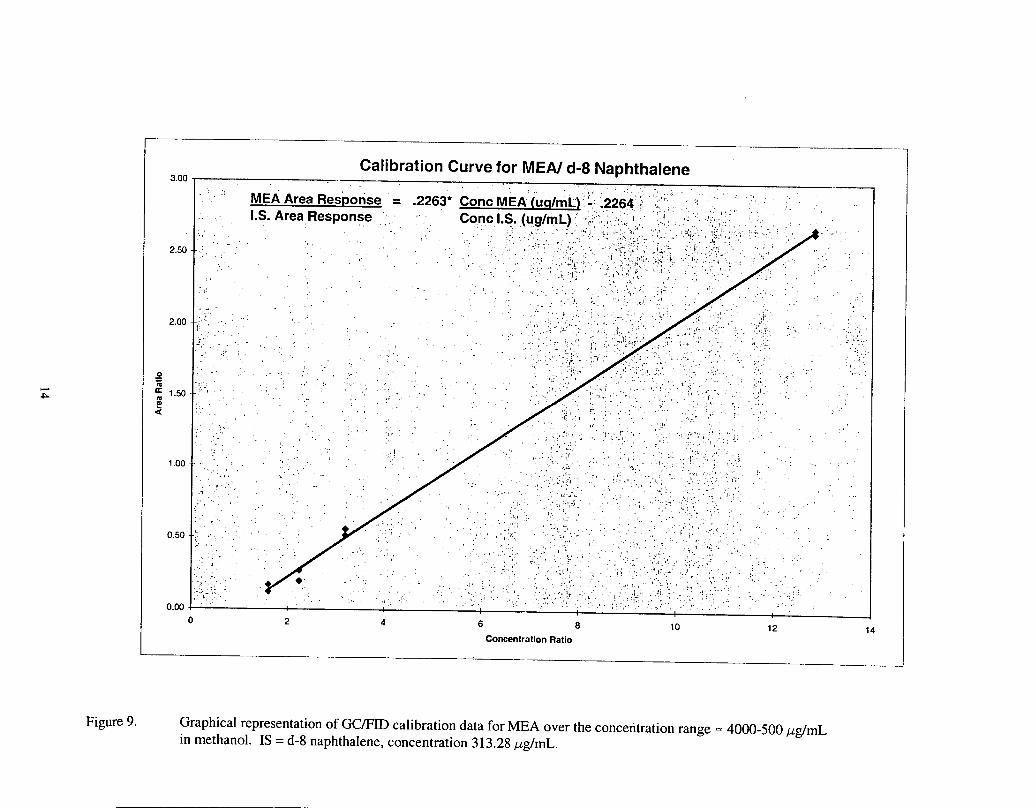
2.00
0=
: 1.50
s!a
1.00
. . .‘, ”.,
.,., .,.
‘.,”,;., ,
...
,,.,’.
;,,..
,.. -..,, ,.
,,,.....’
.,
!.. . .,.,
,’ -,.!.
.,.,,
. .
,, ./,,,
J,’.
,,
Concentration Ratio.
——. J
Figure 9. Graphical representation of GC/FID calibration data for MEA over the concentration range = 4000-500 pg/mLin methanol. IS = d-8 naphthalene, concentration 313.28 ~g/mL.

Calibration Curve for DETA/ d-8 Naphthalene
7.00
6.00
5.00
2.00
1.00
0.000 2 4 6 8 10 12 14
ConcentratingRatio
Figure 10. Graphical representation of GC/FID calibration data for DETA over the concentration range = 4000-500 vg/rnLin methanol. IS = d-8 naphthalene, concentration 331.2 #g/mL.
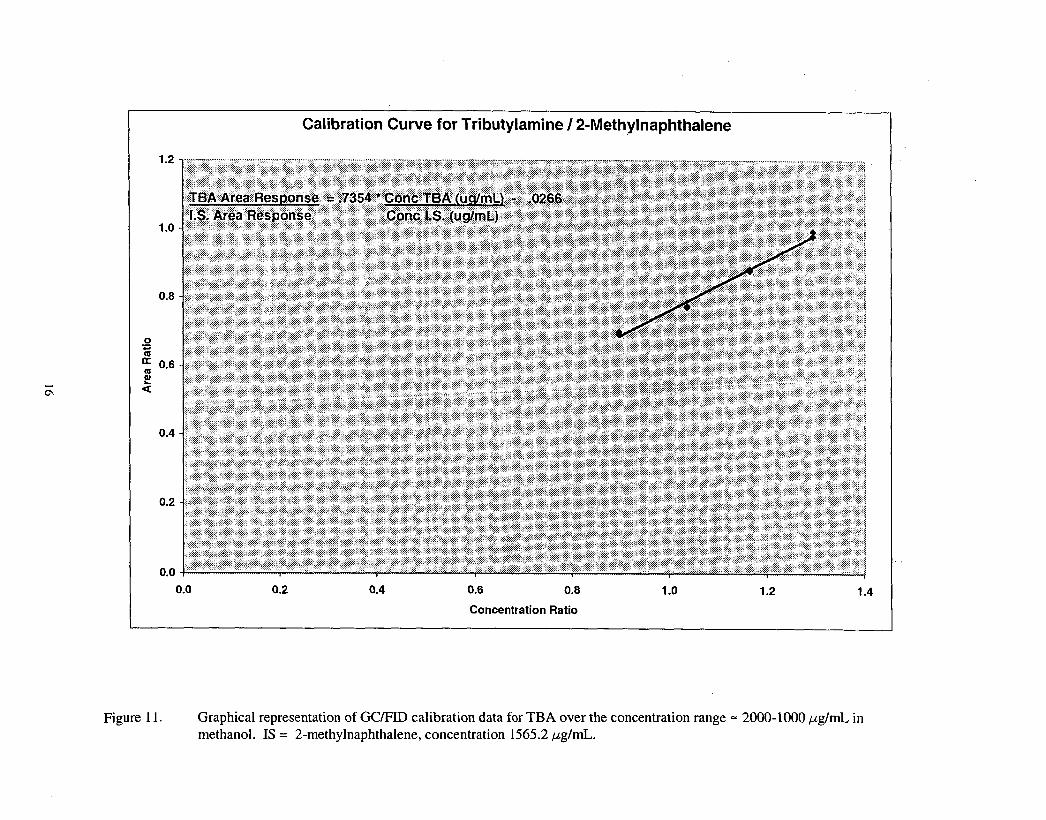
1Calibration Curve for Tributylamine / 2-Methylnaphthalene
1.2
1.0
0.8
0.4
0.2
0.00.0 0.2 0.4 0.6 0.8 1.0 1.2 1.4
Concentration Ratio
Figure 11. Graphical representation of GCIFID calibration data for TBA over the concentration range = 2000-1000 ~gh-nL inmethanol. IS= 2-methylnaphthalene, concentration 1565.2 ~g/mL.
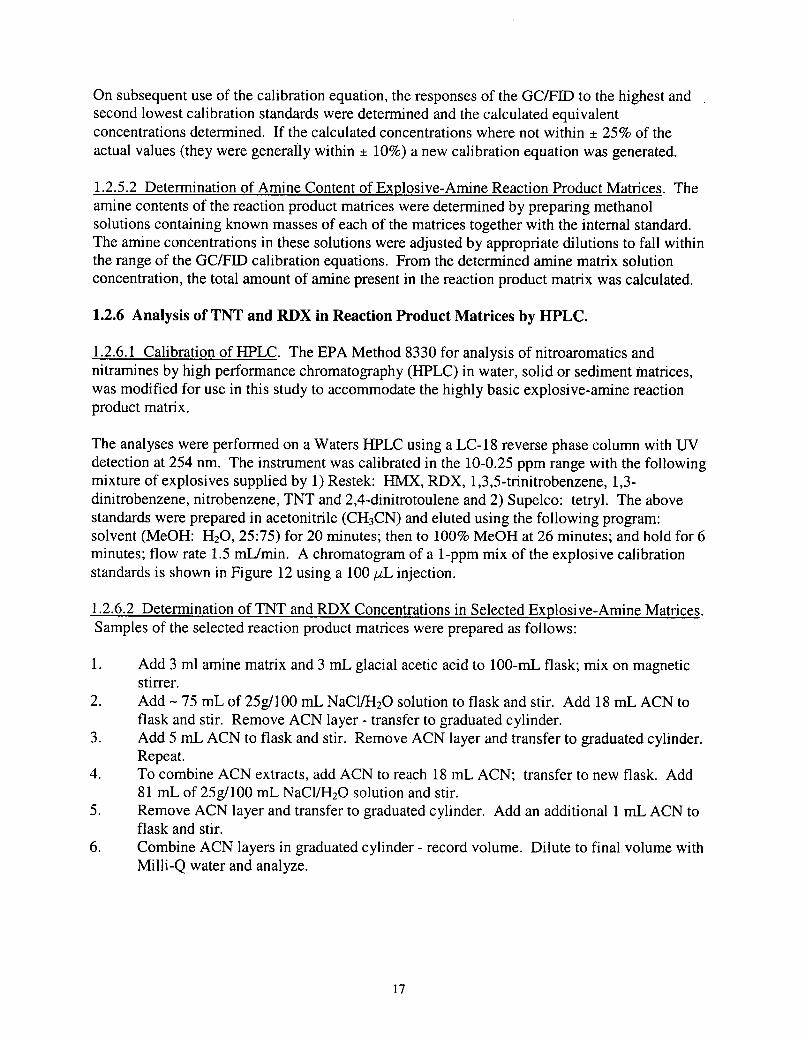
On subsequent use of the calibration equation, the responses of the GC/FID to the highest andsecond lowest calibration standards were determined and the calculated equivalentconcentrations determined. If the calculated concentrations where not within ~ 2590 of theactual values (they were generally within ~ 10’ZO)a new calibration equation was generated.
1.2.5.2 Determination of Amine Content of Explosive-Amine Reaction Product Matrices. Theamine contents of the reaction product matrices were determined by preparing methanolsolutions containing known masses of each of the matrices together with the internal standard.The amine concentrations in these solutions were adjusted by appropriate dilutions to fall withinthe range of the GC/FID calibration equations. From the determined amine matrix solutionconcentration, the total amount of amine present in the reaction product matrix was calculated.
1.2.6 Analysis of TNT and RDX in Reaction Product Matrices by HPLC.
1.2.6.1 Calibration of HPLC. The EPA Method 8330 for analysis of nitroaromatics andnitramines by high performance chromatography y (HPLC) in water, solid or sediment matrices,was modified for use in this study to accommodate the highly basic explosive-amine reactionproduct matrix.
The anal yses were performed on a Waters IWLC using aLC-18 reverse phase column with Wdetection at 254 nm. The instrument was calibrated in the 10-0.25 ppm range with the followingmixture of explosives supplied by 1) Restek: HMX, RDX, 1,3,5-trinitrobenzene, 1,3-dinitrobenzene, nitrobenzene, TNT and 2,4-dinitrotoulene and 2) Supelco: tetryl. The abovestandards were prepared in acetonitnle (CH3CN) and eluted using the following program:solvent (MeOH: H20, 25:75) for 20 minutes; then to 100% MeOH at 26 minutes; and hold for 6minutes; flow rate 1.5 mL/min. A chromatogram of a 1-ppm mix of the explosive calibrationstandards is shown in Figure 12 using a 100 KL injection.
1.2.6.2 Determination of TNT and RDX Concentrations in Selected Explosive-Amine Matrices.Samples of the selected reaction product matrices were prepared as follows:
1. Add 3 ml amine matrix and 3 mL glacial acetic acid to 100-mL flask; mix on magneticstirrer.
2. Add -75 mL of 25g/100 mL NaC1/HzO solution to flask and stir. Add 18 mL ACN toflask and stir. Remove ACN layer - transfer to graduated cylinder.
3. Add 5 rnL ACN to flask and stir. Remove ACN layer and transfer to graduated cylinder.Repeat.
4. To combine ACN extracts, add ACN to reach 18 mL ACN; transfer to new flask. Add81 mL of 25g/100 mL NaC1/H20 solution and stir.
5. Remove ACN layer and transfer to graduated cylinder. Add an additional 1 mL ACN toflask and stir.
6. Combine ACN layers in graduated cylinder - record volume. Dilute to final volume withMini-Q water and analyze.
17

IPPM STD MIX-A AND TETRYL.Y?@
r
30
25
1“
I54 I
I
I
I
I
-__lo 5 10 15 20 2; 3;
Minutes (Span=32)
!htple Name: lPPM STD MIX-A AND TETRYLAcquired from Chron13--Det3A via port 3 on 10/9/98 10:11 :.45anl by K BORCKUV254
MEOH:H20 25:75 FOR 20MIN THEN TO 100 MEOH AT 26 MIN HOLD 6
Data File: C:\CPWINU)ATAIU) ECT3\100998.OIRDate Stamp: 10/9/98 10:11 :-12anl
Method File: C:\CPWINDATAIWPEXP-A. METVersion 3. Date Stamp: 9/22/9S 09:2S: Ihn
Calibratio[l Fi’le: C:\CPWINDATA 1U2ECT3WXP-1 .CALVersion 10, Date Stamp: 10/9/9S 10:24: 160nl
Run Time = 32.() min Sample Rate = 1.0 per sec.Amount Inj. = Ioo.ulx) Dilution Factor = 1,000Sample Weight = 1.000 ln[ Std Amount = 1.000
Starting Peak Width = 0.04 min. Peak Threshold= O Area Reject = 100
c:\cPwINDATAl UlEcT3\loo99s.ol R Printed on lo/9/98-]u.24~-l~A~l
Figure 12. HPLC chromatogram of a 1 ppm mix of the explosive calibration standards.
18
1.3 EXPERIMENTAL RESULTS FOR THE EXPLOSIVE-AMINE REACTIONS,
1.3.1 Qualitative Analytical Results for Gaseous Products Formed in Explosive-AmineReactions.
1.3.1.1 Identification of Gaseous Products from Reaction of MEA with TNT. RDX and TNT+RDX. Typical IR spectra of the gases generated in the MEA + TNT and MEA + RDX reactionsare shown in Figures 13 and 14, respective y. Comparison of these spectra with those of N20and NH3 reference spectra shown in Figure 3 and 4 allow assignment of all absorption bands inFigures 13 and 14 to either NH3 or N20. In the MEA+ TNT system, NH3 is the majorcomponent with N20 present as a minor constituent = 0.01 mole% relative to NH3. In the MEA+ RDX system, both gases are present at significant levels, in the approximate mole ratioNH3:N20 of 1:3, In the MEA+ TNT+ RDX reactions, NH3 and N20 were also the on] y gaseousspecies detected.
1.3.1.2 Identification of Gaseous Products From Reaction of DETA with TNT, RDX and TNT+ -RDX. NH3 and N20 were the only gaseous products identified in the DETA-explosive reactions.Their relative amounts were very similar to those found in the MEA-explosive reactions (Section1.3.1.1 above).
1.3.1.3 Identification of Gaseous Products From Reaction of TBA with TNT and RDX. Atypical IR spectrum of the gases generated in the TBA -i-RDX reaction is shown in Figure 15,Comparison of this spectrum with those of N20, N02 and C02 reference spectra in Figures 3,5and 7 allow assignment of all absorption bands in”Figure 15 to these species. Similar resultswere obtained for the gaseous products formed in the TBA + TNT reaction.
1.3.1.4 Identification of Gaseous Products Formed on Heatin~ MEA, DETA and TBA. Testswere made to determine if the amines used in the study underwent any decomposition whenheated to temperatures of= 150”C typical of the above explosive-amine reaction,Approximately 100 g of amine was heated in the experimental set-up shown in Figure 2, underconditions typical of the explosive-amine reactions. Approximately 3-4 liters of headspace gaswas collected by purging the septem with helium after the reactor cooled to ambient temperature,The gas was analyzed by IR spectroscopy. With MEA and DETA, very small amounts of NH3were detected, equivalent to = 0.05 and 0.015 mole %, respectively, in the volume of headspacegas collected. These amounts of ammonia are <1 % of those typically generated in MEA andDETA explosive reactions. With TBA, no NH3 was detected in the headspace gas sample. Withnone of these amines were NZO, N02 or C02 detected in the headspace gases.
1.3.2 Quantitative Analytical Results for Residual Amine Present in Explosive-AmineReaction Produc+ nfi~’rices.. .!*U.
Reaction product matrices from the explosive-amine reactions were analyzed by GC/FID fortheir residual unreacted amine content. A chromatogram of a DETA + TNT reaction productmatrix is shown in Figure 16. Apart from the large solvent injection peak, there are only twoother major peaks present in the chromatogram, those of DETA and IS (d-8 naphthalene).Similar chromatograms were obtained for all amine-explosive reaction product matrices. Onlythose peaks attributable to the solvent amine and IS appeared at significant intensities. Data
19

obtained from these analyses are summarized in Tables 3,4 and 5. In the MEA and DETA,reactions significant quantities of the amine, approximately 20-50% were consumed. In contrast,in the TBA + RDX and TBA + TNT reactions, within the precision of the analytical data, theamounts of residual TBA present in the reaction product matrices were determined at 99.35 * 3.6RSD% of the original amounts of TBA present initially in the reaction, i.e., within the precisionof the data very little, if an y, TBA was consumed in the reactions with the explosives.
1.3.3 Analytical Data On The Explosive-Amine Reaction Mass Balances.
Analytical data obtained for amounts of MEA, DETA and TBA consumed and amounts ofproducts formed in the explosive-amine reactions studied are presented in Table 3, 4 and 5,respectively. The percentage mass balances were calculated as follows:
% Mass Balance =
[
Mass of Liquid+ Solid+ Gaseous Reaction Products Formed
‘“l
x 100Mass of Amine+ Explosive used in the Reaction(g)
Average % mass balances obtained for the reactions studied are summarized in Table 6.
Table 6. Summary of data for mass balances obtained for the explosive amine reactions studied.
System No. of Expts. % Mass Balance
Average * S.D.
MEA + TNT 4 98.98 0.64
MEA + RDX 6 99.18 0.75
MEA + TNT+ RDX 2 99.53 0.05
DETA + TNT 2 98.72 1.10
DETA + RDX 3 98.75 1.45
DETA + TNT + RDX 1 99.94 --
TBA + TNT 1 98.68 .-
TBA + RDX 1 98.52 --
In some of the above experiments, a small amount of liquid was observed to be present on theinside surfaces of the gas collection bags. This liquid was only noticeable when the bags werecollapsed on evacuation to measure the collected gas volume. On prolonged evacuation, theamount of liquid appeared to decrease. It is possible the liquid may have been water. The massof this liquid was probably small, but not known. For this reason, it was not included in theabove mass balance calculation. Two gas samples generated in Test #: 12- 1O-29-98(TNT +MEA) and Test #: 13-10-26-98 (RDX + MEA) were analyzed for Hz, Oz and Nz at the Instituteof Gas Technology with the following results:
Mole %Test Number H2 02 N2
12 <0.04 0.05 0.4113 <0.04 0.07 0.31
20
N
Figure 13. IR spectrum of gaseous reaction products generated in the MEA+ TNT reaction, Test No. 8-10-20-98.Gas sample pressure, 400 mm of Hg.
h)h)
Figure 14. IR spectrum of gaseous reaction products generated in the MEA+ RDX reaction, Test No. 4-10-05-98.Gas sample pressure, 740 mm of Hg.
.,
—
Figure 15. IR spectrum of gaseous reaction products generated in the TBA + RDX reaction, Test No. 27-12-18-98.Gas sample pressure, 120 mm of Hg.
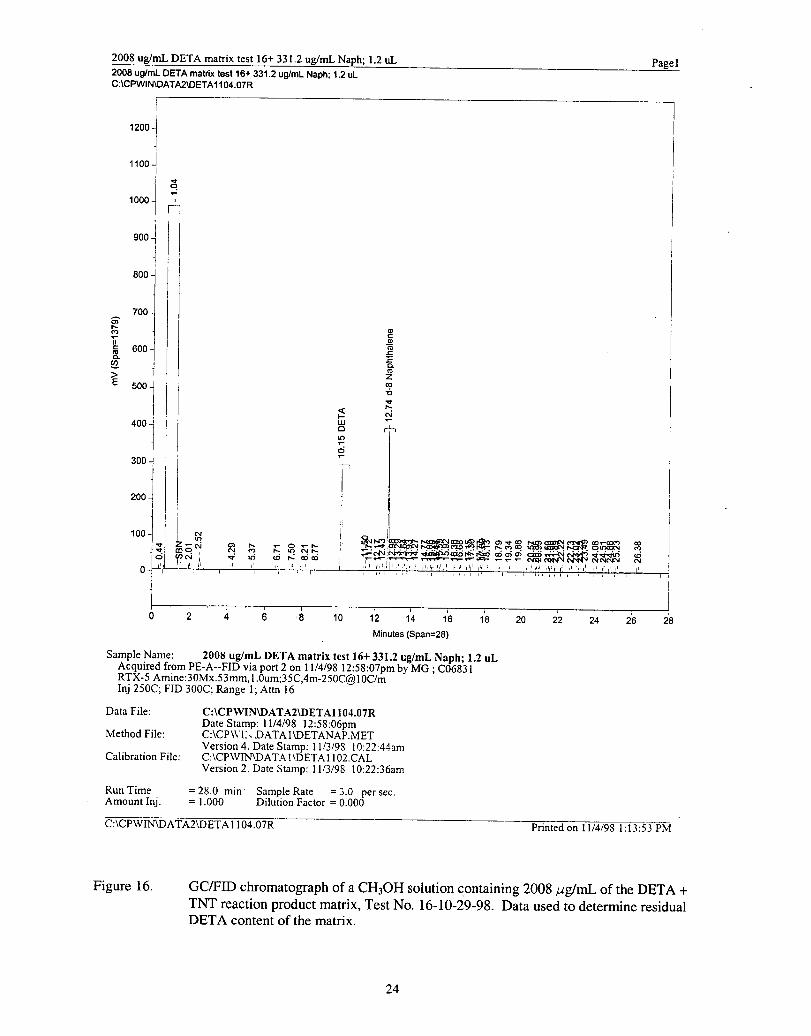
2008 ug/mL DETA matrix test 16+331.2 ug/mL Naph; 1.2 UL Page]2008 ug/mL DETA matrix test 16+ 331.2 ug/mL Naph; 1.2 ULC:\CPWlMDATA2\DETAl 104.07R
1200
I
1100i
1“
g
1000, &
(1
900 ;
~800-
700-67r& g~ *nJ 600- ~OJ s
>R
E 500
1
zm&
~ ~N
400 i ‘
1
wQIn-.0
300
1
-.
200 ;
I
1004
ImL.: 1*h-
g~ ~gx~‘ %k%x%wsw~~~=mmg==~.3$3Z’q”ti ””. ~.,- —..!s ‘2$$sa#x%.f3xR4so “ ~&+i “ “, ~ ~,:rn 1 ,, ,,, ,,’,’;:,,::;(l! ::,1,{’f: 4,~ ,,,::,(l,!,l/,,,,,!,!,,J ,,,,,,! ,, ,,,,,, ,
,,, ,, !,,,i
I(
1 (o 2 4< 6 8 10 12 14 lb 18 zo 22 24 26 2’6
Minutes (Span=28)
Sample Name: 2008 ug/mL DETA matrix test16+331.2ug/mL Naph; 1.2 ULAcquired from PE-A--FID via port 2 on 11/4/98 12:58:07pmbyMG;C06831RTX-5 Amine:30Mx.53mm, 1.0um;35C,4m-250C@l OC/mInj 250C; FID 300C; Range 1; Atm 16
Data File: C:\CPWINmATA2UlETAl 104.07RDate Stamp: 11/4/98 12:58:06pm
Method File: C:\CPIVl;\ DATAIUIETANAP.METVersion 4. Date Stamp: 11/3/9S 10:22:44am
Calibration File: C:\CPWINWAT.~ llDETAl 102.CALVersion 2. Date Stamp: 11/3/98 10:22:36am
Run Time = 28.0 min Sample Rate = 3.0 per sec.Amount Inj. = 1.000 Dilution Factor = 0.000
C:\CPWINiDATA2U3 ETA I I04.07R Printed on 11/4/98 1:13:53 PM
Figure 16. GC/FID chromatography of a CHJOH solution containing 2008 @rnL of the DETA +TNT reaction product matrix, Test No. 16-10-29-98. Data used to determine residualDETA content of the matrix.
24

Table 3. Summary of Analytical Data and Calculated Percentage Mass Balances for the Reaction of MEA with TNT,RDX and TNT+ RDX.
Initial Reactant Massesl Initial Reactant Moles]
Test Number MEAI
TNTI
RDXI
MEAI
TNTI
RDX
(d (g)
1-08-26-98 I 100.31 I 10.00 I -- I 1.6423 I 0.0440 I --
2-10-02-98
3-10-03-98
4-10-05-98
5-10-06-98
6-10-19-98
100.4 15.01 -- 1.6379 0.0661 --
99.92 I 15.06 I -- 1 1.6359 I 0.0663 I --
100.66 / -- I 10.07 I 1.6480 I -- I 0.0453
101.32 I -- 1 15.45 I 1.6588 I -- 1 0.0696
100.11 I -- I 20.62 I 1.6390 I -- 1 0.0928
7-10-20-983 I 100.06 I 20.14 I -- I 1.6382 I 0.0887 I --
8-10-20-98 I 100.00 I 17.53 I -- I 1.6372 I 0.0772 I --
9-10-21-98 I 100.02 -- I 25.04 I 1.6375 -- I 0.1127
10-10-22-98 I 100.03 I 8.00 I 8.36 I 1.6377 I 0.0352 I 0.0376
11-10-23-98 I 100.19 I -- I 15.05 I 1.6403 I -- I 0.0678
12-10-24-98 I 100.26 I 8.05 I 8.14 I 1.6415 I 0.0354 I 0.0367
13-10-24-98 I 100.39 -- I 20.10 I 1.6436 I -- I 0.0905
Mass of Liquid Max. Reaction MasszReaction Product Temperature Balance
109.26 I 101 I 99.47
113.19 I 129 1 98.90
111.39 I 139 I 98.10
106.16 I 86 I 99.59
109.60 100 97.85
111.00 131 99.69
-- .- --
115.18 150 99.43
112.06 I 142 1 98.71
112.80 I 118 1 99.56
108.58 I 90 1 99.65
112.31 I 120 1 99.49
110.76 I 126 I 99.61
(1) Not corrected for reagent purity.
(2) % Mass Balance = r 1
Mass of Liquid + Gaseous Reaction Products Formed(g) x 100Mass of Reactants Consumed(g)
- -
(3) Reaction too vigorous. no data obtained,
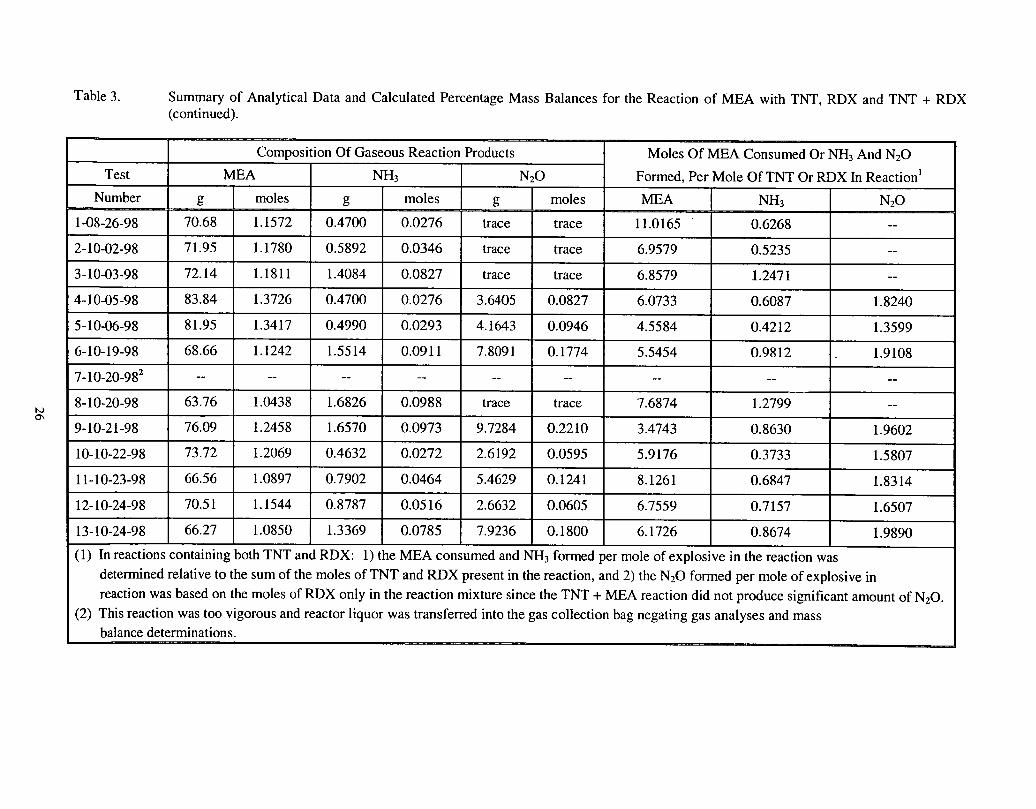
Table 3. Summary of Analytical Data and Calculated Percentage Mass Balances for the Reaction of MEA with TNT, RDX and TNT + RDX(continued).
Composition Of Gaseous Reaction Products
Test MEA NHJ N
Number g moles g moles g
1-08-26-98 70.68 1.1572 0.4700 0.0276 trace
2-10-02-98 I 71.95 I 1.1780
3-10-03-98 I 72.14 I 1.1811
4-10-05-98 I 83.84 ] 1.3726
5-10-06-98 81.95 1.3417
6-10-19-98 68.66 1.1242
7-10-20-982 -- --
8-10-20-98 63.76 1.0438
9-10-21-98 76.09 1.2458
10-10-22-98 73.72 1.2069
11-10-23-98 66.56 1.0897
12-10-24-98 70.51 1.1544
0.5892 0.0346
1.4084 0.0827
0.4700 0.0276
0.4990 0.0293
1.5514 0.0911
-- --
1.6826 0.0988
1.6570 0.0973
0.4632 0.0272
0.7902 0.0464
0.8787 ] 0.0516
trace
trace
3.6405
4.1643
7.8091
--
trace
9.7284
2.6192
5.4629
2.6632
13-10-24-98 I 66.27 I 1.0850 I 1.3369 I 0.0785 I 7.9236
(1) In reactions containing both TNT and RDX: 1) the MEA consumed and F
I Moles Of MEA Consumed Or NHs And NZO
) Formed, Per Mole Of TNT Or RDX In Reactionl
moles MEA NH~ NZO
trace 11.0165 0.6268 --
trace 6.9579 0.5235 --
trace 6.8579 1.2471 --
0.0827 6.0733 0.6087 1.8240
0.0946 4.5584 0.4212 1.3599
0.1774 5.5454 0.9812 . 1.9108
-- .- -- --
trace 7.6874 1.2799 --
0.2210 3.4743 0.8630 1.9602
0.0595 5.9176 0.3733 1.5807
0.1241 8.1261 0.6847 1.8314
0.0605 6.7559 0.7157 1.6507I I I
0.1800 6.1726 0.8674 1.9890
13formed per mole of explosive in the reaction was
determined relative to the sum of the moles of TNT and RDX present in the reaction, and 2) the NZOformed per mole of explosive in
reaction was based on the moles of RDX only in the reaction mixture since the TNT + MEA reaction did not produce significant amount of N20.(2) This reaction was too vigorous and reactor liquor was transferred into the gas collection bag negating gas analyses and mass
balance determinations.
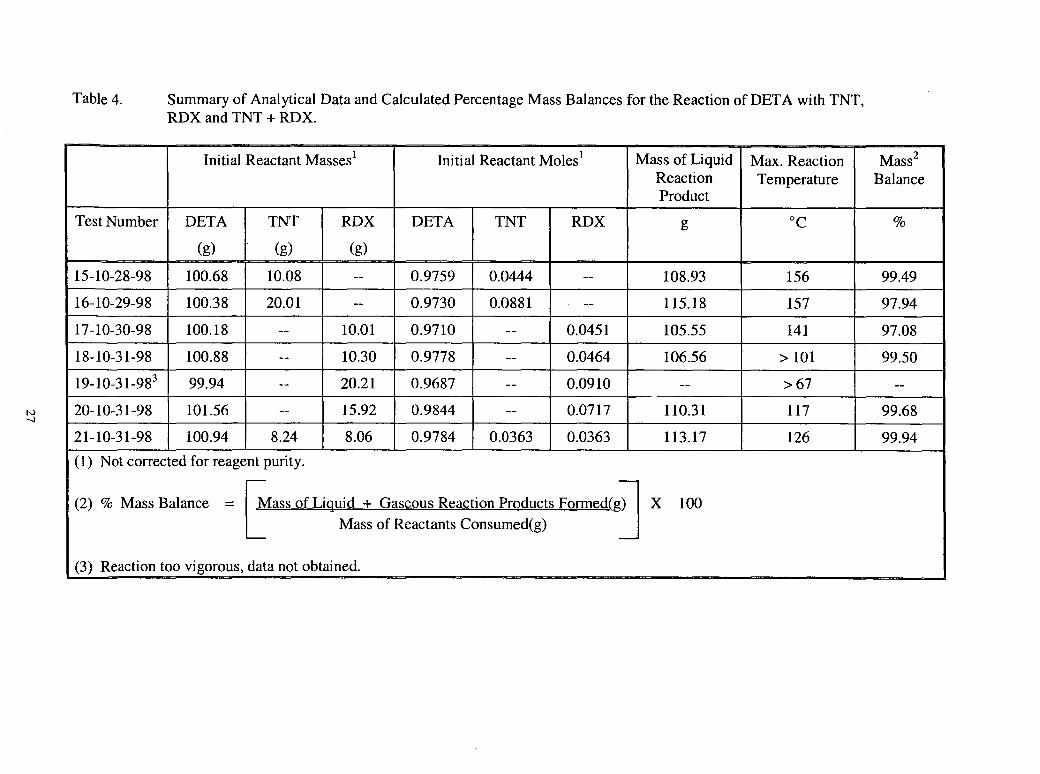
Table 4. Summary of Analytical Data and Calculated Percentage Mass Balances for the Reaction of DETA with TNT,RDX and TNT+ RDX.
Initial Reactant Massesi Initial Reactant Moles] Mass of Liquid Max. Reaction Mass2Reaction Temperature BalanceProduct
Test Number DETA TNT RDX DETA TNT RDX !3 ‘c %
(g) (g) (g)
15-10-28-98 100.68 10.08 -- 0.9759 0.0444 -- 108.93 156 99.49
16-10-29-98 100.38 20.01 -- 0.9730 0.0881 -- 115.18 157 97.94
17-10-30-98 100.18 -- 10.01 0.9710 -- 0.0451 105.55 141 97.08
18-10-31-98 100.88 -- 10.30 0.9778 -- 0,0464 106.56 >101 99.50
19-10-31-983 99.94 -- 20.21 0.9687 -- 0.0910 -- >67 --
20-10-31-98 101.56 -- 15.92 0.9844 -- 0.0717 110.31 117 99.68
Z1-10-31-98 100.94 8.24 8.06 0.9784 0.0363 0,0363 113.17 126 99.94
:1) Not corrected for reagent purity.
{2) % Mass Balance =
[ 1
Mass of Liquid + Gaseous Reaction Products Formed(g) x 100
Mass of Reactants Consumed(g)
[3) Reaction too vigorous, data not obtained.

Nm
Table 4. Summary of Analytical Data and Calculated Percentage Mass Balances for the Reaction of DETA with TNT,RDX and TNT+ RDX (continued).
Composition Of Gaseous Reaction Products Moles Of DETA Consumed Or NH~And NZO
Test DETA NHs NZO Formed Per Mole Of TNT Or RDX In Reactionl
Number g moles g moles !3 moles DETA NHq NZO
15-10-28-98 60.22 “0.5837 1.2704 0.0746 trace trace 8.8355 1.6807 --
16-10-29-98 43.93 0.4258 2.7333 0.1605 trace trace 6.2101 1.8216 --
17-10-30-98 77.63 0.7525 0.2623 0.0154 1.1577 0.0263 4.8491 0.3417 0.5835
18-10-31-98 72.84 0.7061 0.6795 0.0399 3.3895 0.0770 5.8598 0.8604 1.6604
19-10-31-982 -- -- -- -- -- -- -- -- --
20-10-31-98 64.87 0.6287 1.2483 0.0733 5.5465 0.1260 4.9618 1.0226 1.7578
21-10-31-98 63.78 0.6182 1.2040 0.0707 2.7997 0.0636 4.9625 0.9742 1.7526
(1) In reactions containing both TNT and RDX: 1) the DETA consumed and NHs formed per mole of explosive in the reaction
was determined relative to the sum of the moles of TNT and RDX present in the reaction, and 2) the N20 formed per mole of
explosive in reaction was based on the moles of RDX only in the reaction mixture since the TNT + MEA reaction did not
produce significant amounts of N20.
(2) Reaction too vigorous, data not obtained.
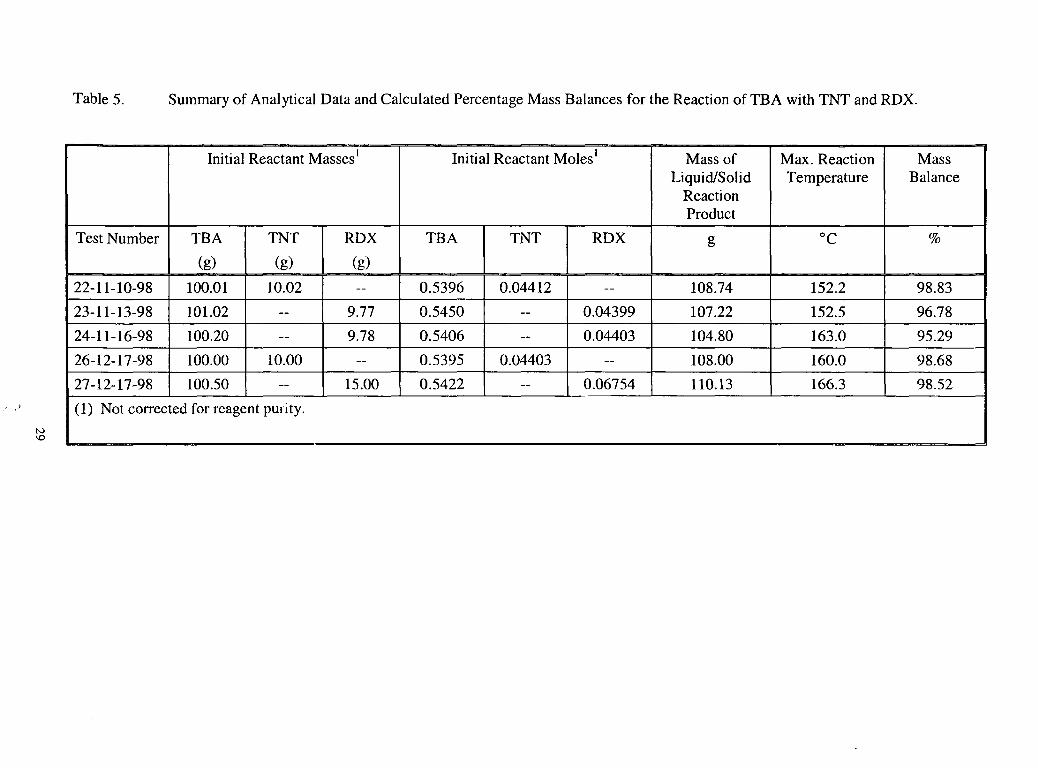
Table 5. Summary of Analytical Data and Calculated Percentage Mass Balances for the Reaction of TBA with TNT and RDX.
—Initial Reactant Massesl Initial Reactant Molesl Mass of Max. Reaction Mass
Liquid/Solid Temperature BalanceReactionProduct
Test Number TBA TNT RDX TBA TNT RDX g “c %
(g) (g) (g)
22-11-10-98 100.01 10.02 -- 0.5396 0.04412 -- 108.74 152.2 98.83
23-11-13-98 101.02 -- 9.77 0.5450 -- 0.04399 107.22 152.5 96.78
24-11-16-98 100.20 -- 9.78 0.5406 -- 0.04403 104.80 163.0 95.29
26-12-17-98 100.00 10.00 -- 0.5395 0.04403 -- 108.00 160.0 98.68 –
27-12-17-98 100.50 -- 15.00 0.5422 -- 0.06754 110.13 166.3 98.52
(1) Not corrected for reagent purity.

Table 5. Summary of Analytical Data and Calculated Percentage Mass Balances for the Reaction of TBA withTNT and RDX (continued).
Composition Of Gaseous Reaction Products Moles Of TBA Consumed Or NzO, NOZ
Test TBA N20 N02 C02 And C02 Formed Per Mole Of TNT Or RDX InReaction
Number ~ moles g moles g moles g moles TBA N20 N02 C0222-11-10-981 100.70 0.5433 -- -- -- -- -- -- -0.0846 -- -- --
23-11-13-981 97.77 0.5275 -- -- -- -- -- -- +0.3981 -- -- --
24-11-16-98’ 94.70 0.5109 -- -- -- -- -- -- +0.6740 -- -- --
26-12-17-98 103.63 0.5591 0.0132 0.0003 0.3588 0.0078 0.1760 0.0040 -0.4444 0.00681 0.17714 0.09084
27-12-17-98 101.65 0.5484 2.9669 0.0674 0.4508 0.0098 0.2421 0.0055 -0.0915 0.99797 0.14511 0.08144
(1) Anal ytical data on gaseous products formed not obtained.
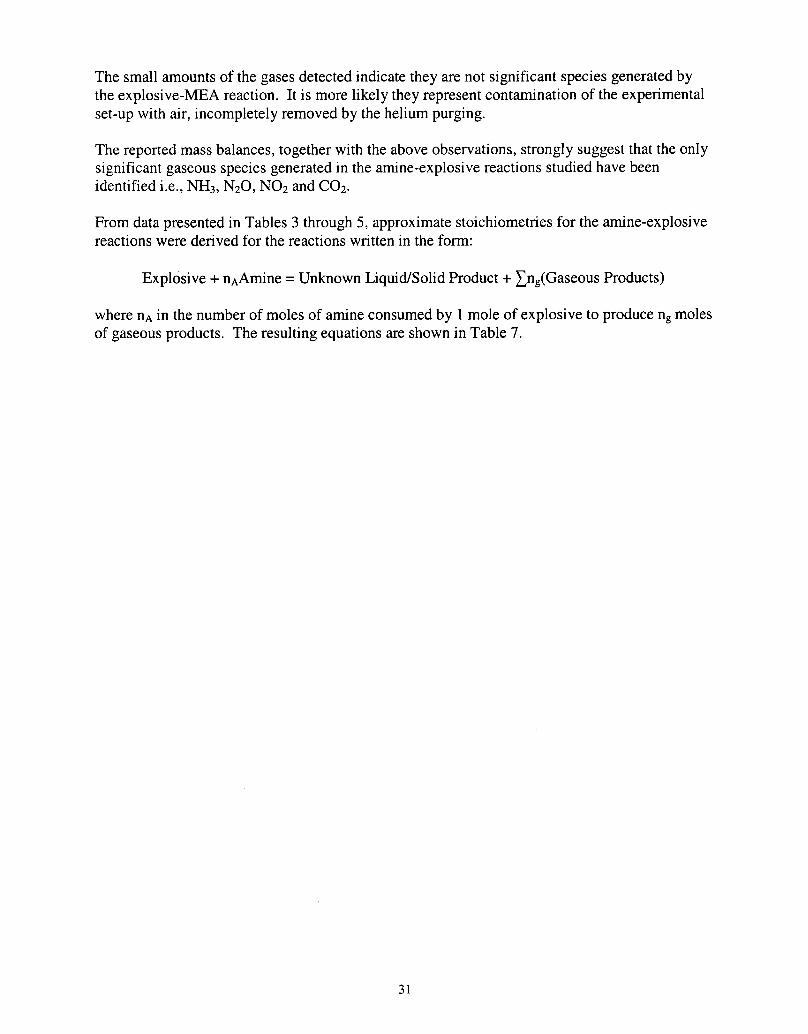
The small amounts of the gases detected indicate they are not significant species generated bythe explosive-MEA reaction. It is more likely they represent contamination of the experimentalset-up with air, incompletely removed by the helium purging.
The reported mass balances, together with the above observations, strongly suggest that the onlysignificant gaseous species generated in the amine-explosive reactions studied have beenidentified i.e., NH3, N20, N02 and C02.
From data presented in Tables 3 through 5, approximate stoichiometries for the amine-explosivereactions were derived for the reactions written in the form:
Expl&lve+nAAmine = Unknown Liquid/Solid Product + ~n~(Gaseous Products)
where nA in the number of moles of amine consumed by 1 mole of explosive to produce ng mO1esof gaseous products. The resulting equations are shown in Table 7.
31
Table 7. Approximate stoichiometnes of explosive-amine reactions studied.
No. ofExpts.
REACTION TNT + MEA Liquid Product + NH3 + NzO~o)CALCULATEDMOLES 1 8.1~2.()(z) .---..--- t).9fo.4 (trace)
REACTION RDX + MEA Liquid Product + NH3 + NzO
I 6 I CALCULATED MOLES 1 5.7*1.6 --------- 0.7~0.2 1.8*().2
I I REAcTION TNT+ RDX+ MEA Liquid Product + NH3 + NzO
I 2 CALCULATED MOLES 0.5 0.5 5.9*C).5 ------.-- [email protected] ().84).()
I I REACTION TNT + DETA Liquid Product + NH3 + NzO
I 2 I CALCULATED MOLES 1 7.5* 1.9 --------- 1.8*O.1 (trace)
I I REACTION RDX + DETA Liquid Product + NH3 + N20
I 3 I CALCULATED MOLES 1 5.2~().6 --------- 0.7*0.4 1.3*0.6
I I REACTION TNT + RDX + DETA Liquid Product + NH3 + NzO
I 1 CALCULATED MOLES 0.5 0.5 5.0 --------- 1.94 0.9
I IREACTION TNT + TBA Liquid Product(4) + N20 + N02 + COZ
2(3) CALCULATED MOLES 1 -().3fo.3 --------- 0.007 0.18 0.09
REACTION RDX + TBA Liquid Product(5) + NzO + NOZ + COZ
I 3(3) CALCULATED MOLES 1 ().4*().3 --------- 1.0 0.14 0.08
(1) Number of experiments used in generating data.
(2) Mean + standard deviation.
(3) Number of experiments used to generate data for number of moles of TBA used per mole of TNT orRDX reacted. The data for moles of gaseous product formed are from single experiments.
(4) This liquid sample contained a solid pitch-like material. The liquid phase constituted = 73 weight% ofthe reaction product.
] (5) This liquid sample contained two irnrnisciable liquid phases in the mass ratio -11:1.
32
The stoichiometries in the MEA and DETA explosive reactions show a number of similaritiesleading to the following conclusions:
a) Within the precision of the data the amounts of MEA and DETA consumed inreactions with the TNT and RDX are essentially identical.
b) Based on the amounts of MEA or DETA consumed and gaseous products formed,reaction mixtures containing TNT + RDX appear to react with the amineindependently of the presence of each other in the mixture,
c) Within the precision of the data the amounts of NHs and NZO formed in the RDX+ MEA and RDX + DETA reaction are identical.
d) Within the precision of the experimental data, approximate y twice as much NHgis formed in the DETA + TNT reaction as in the MEA + TNT reaction.
The reactions of TBA with TNT or RDX are clearly different from the analogous reactions of the
explosives with MEA and DETA:
a) With TBA, the gaseous reaction products are NZO, NOZ and COZ rather than N20and NH3 with MEA and DETA.
b) With TBA, the amount of amine consumed per mole of TNT or RDX is close tozero, whereas with MEA or DETA 5 to 8 moles of the amine are consumed.
1.3.4 Analyses Of Representative Explosive-Amine Reaction Product Matrices ForResidual Explosive By HPLC.
In deriving the stoichiometries for the explosive-amine reactions above, it was tacitly assumedthat the explosives were completely consumed in the reaction. The assumption was arrived atbased on analyses of the following representative reaction product matrices for their TNT orRDX contents.
Test #: 1-08-26-98
Test #: 2-10-02-98
Test #: 3-10-03-98
Test #: 4-10-05-98
Test #: 5-10-06-98
Test #: 16-10-29-98
Test #: 17-10-31-98
Test #: 26-12-17-98
Test #: 27-12-18-98
MEA (100.31g) + TNT (10.00g)
MEA (100.04g) + TNT (15.Olg)
MEA (99.92g) + TNT (15.06g)
MEA (100.66g) + RDX (10.07g)
MEA (101.32g) + RDX (15.45g)
DETA (100.38g) + TNT (20.Olg)
DETA (100.18g) + RDX (10.Olg)
TBA (100.00g) + TNT (10.00g)
TBA (100.50g) + RDX (15.00g)
33
Typical chromatograms obtained for MEA and TNT and MEA and RDX matrices are shown inFigure 17 and 18. A summary of the experimental data for these matrices (Tests #1 through #5)is presented in Table 8. TNT and RDX recovery data were not obtained when these analyseswere made, During subsequent analyses of DETA and TBA matrices, some explosive recoverydata were obtained suggesting values in the 10-15% range maybe assumed for the MEAmatrices. For the matrices shown in Table 8, residual TNT and RDX concentrations, assumingthe 10- 159i0recovery are estimated at less than 5 ppm and maybe <1 ppm.
Similar analyses were performed on DETA and TBA liquid matrices to determine their residualTNT and RDX contents. Although these data have not been completely reduced, preliminaryresults strongly suggest low residual TNT and RDX levels for these matrices. In the TNT +TBA reaction, the condensed phase matrix consisted of liquid, = 73 weight YOand a pitch-likesolid -27 weight 910.The condensed phase in the RDX + TBA reaction consisted of twoimmiscible liquids, present at a mass ratio of = 11:1. The explosive contents of the pitch-likesolid (TNT + TBA) and the minor liquid phase (RDX + TBA) were not determined by HPLC.Qualitative analyses of these samples by Ill spectroscopy indicate that small amounts of residualexplosive may be present.
1.3.5 Time-Temperature Profiles In The Explosive-Amine Reactions.
When performing the explosive-amine reactions, time-temperature profiles of the tests wereobtained. Typical curves obtained for TNT + MEA and RDX + MEA reactions are shown inFigures 19 and 20. In both reactions, on addition of the explosive, there were small temperaturerises in the reaction mix (exotherm), the magnitude of the temperature rise increasing as the massof explosive added increased. For the amounts of explosive and MEA used in these tests, theinitial temperature rise was <10 ‘C. Unless external heat was applied, the reaction matrix cooledto ambient temperature. For this reason, external heat was applied to the reaction. Time-temperature profiles shown in Figures 19 and 20 indicate both the TNT and RDX/MEA reactionrates accelerate markedly in the 40-50 ‘C temperature range, resulting in a significanttemperature increase in the reaction mixture.
Time-temperature profiles for TNT and RDX reactions with DETA were similar to thoseobserved with MEA, indicating a moderately exothermic reaction. “The accelerating phase of thereaction with DETA systems occumed in the 30-40 ‘C temperature range, some 10 ‘C lower thanfor the analogous MEA reactions.
Time-temperature profiles observed in TNT and RDX reactions with TBA are shown in Figures21 and 22. In contrast to the analogous reactions with MEA and DETA, no exotherms wereobserved on the initial addition of either TNT or RDX to TBA at ambient temperatures. Onheating the reaction mixtures, weak exothemm with both TNT and RDX did not occur until thetemperature of the matrix was in the 120-140 ‘C range, some - 100 ‘C higher than that observedfor the MEA and DETA reactions.
34
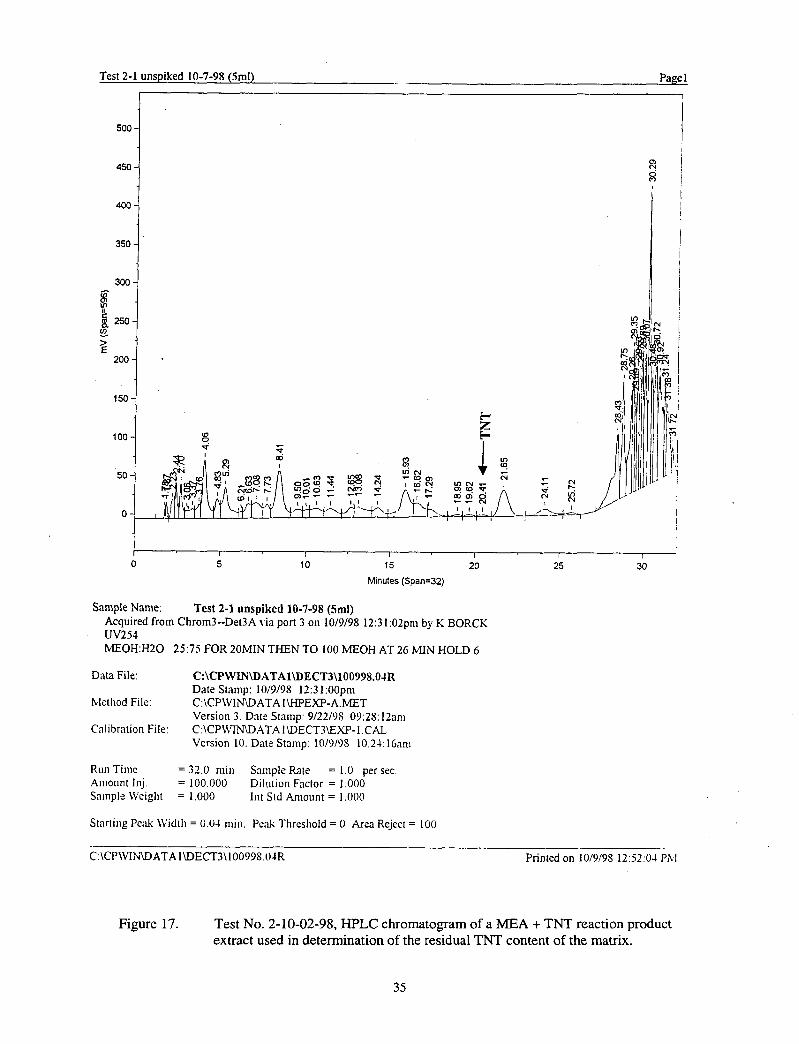
Test 2-1 unspiked 10-7-98 (5ml) Page 1
500
4501“
,
400-
350-
300-sOJ
L~ 250-~
z200- .
150-
‘+
1oo- W E0u’
0-.
4
[ I 1 , ,o 5 10 15 20 25 30
Minutes (Span=32)
Sample Name Test 2-1 unspikcd 10-7-98 (5ml)Acquired from Chrom3--Det3A via port 3 on 10/9/98 12:31 :02pnr by K BORCKUV254MEOH:H20 25:75 FOR 20MIN THEN TO 100 MEOH AT 26 MIN HOLD 6
Data File: C:\CPWINU).4TAlWECT3\ 100998.04RDate St,amp: 10/9/9S 12:31 :OOpn]
hle[hod File: C:\CPWIMDATA IU-IPEXP-A.METVersion 3. Date Stamp: 9/22/9S 09:2S: 12am
Calibration File: C:\CPW’’NlDATA 1U3ECT3UXP-I .CALVersion 10. Date Stamp: 10/!)/!)S 1O:2-I:16m
Run Time = 32.0 rnin Sample Rate = 1.0 per sec./iIllOUfll lflj. = 100,000 llilulion Factor = 1.000Sample W’eight = 1.000 Int Std Amount = 1,000
Starling Peak Width = 0.04 min. Peak Threshold= O Area Reject= 100
i:\Cp\wNwATAlWECT3 \10099S.tMR Printed on 10/9/9S 12:52:04-P&!
Figure 17. Test No. 2-10-02-98, HPLC chromatogram of a MEA + TNT reaction productextract used in determination of the residual TNT content of the matrix.
35
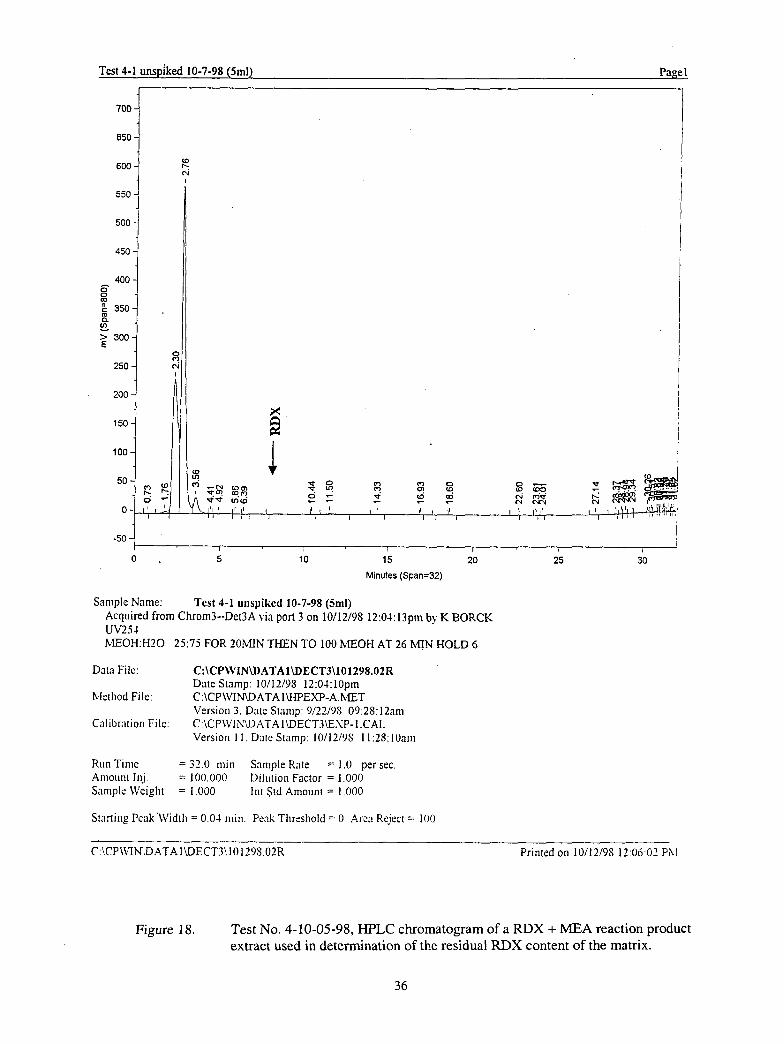
Test 4-1 unsp~ked 10-7-98 (5ml) Page 1
700
650
600
550/
{
500
450
400s 1
f ,50]
E~: 300-
250-
200-
150-
1oo- I
I
I
I
I-50 {
1 I I 1 Io. 5 10 15 20 25 30
Minutes (Span=32)
.%mple Name: Test 4-1 unspiked 10-7-98 (5ml)Acquired from Chrom3--Dct3A via port 3 on 10/12/98 12:04: 13pm by K BORCKUV254MEOH:H20 25:75 FOR 20MIN THEN TO 100 MEOH AT 26 h4JN HOLD 6
Do[a File: C:\CPWINU)ATAIU) ECT3\101298.02RDate Stamp: 10/12/98 12:0-i:lOpm
Medlod File: C:\CPWIIWDATAIWPEXP-A.METVersion 3, Date Stamp: 9/22/9S 09:28 :12arrl
Calibration File: C:\CP\VINIDATA 1WECT3WST- 1.CALVersion 11. Daft Stamp: 10/12/9S 11:28: 10WU
Run Time = 3?,0 rnin Sample R~te = l.0 per sec.Arnoun[ Inj. = 100.000 Dilution Factor = 1.000.%mple \Veighl = 1.000 Int $td Amount = 1.000
S[afiiug Peak lViddl = 0,04 min. Peak Threshold = O Area Reject= 100
C’:1.CP\VINDATA 1U)ECT31,101?9S.O?R Prirwd on 10/12/9S 12:06:0? ~hl
Figure 18. Test No. 4-10-05-98, HPLC chromatogram of a RDX + MEA reaction productextract used in determination of the residual RDX content of the matrix.
36
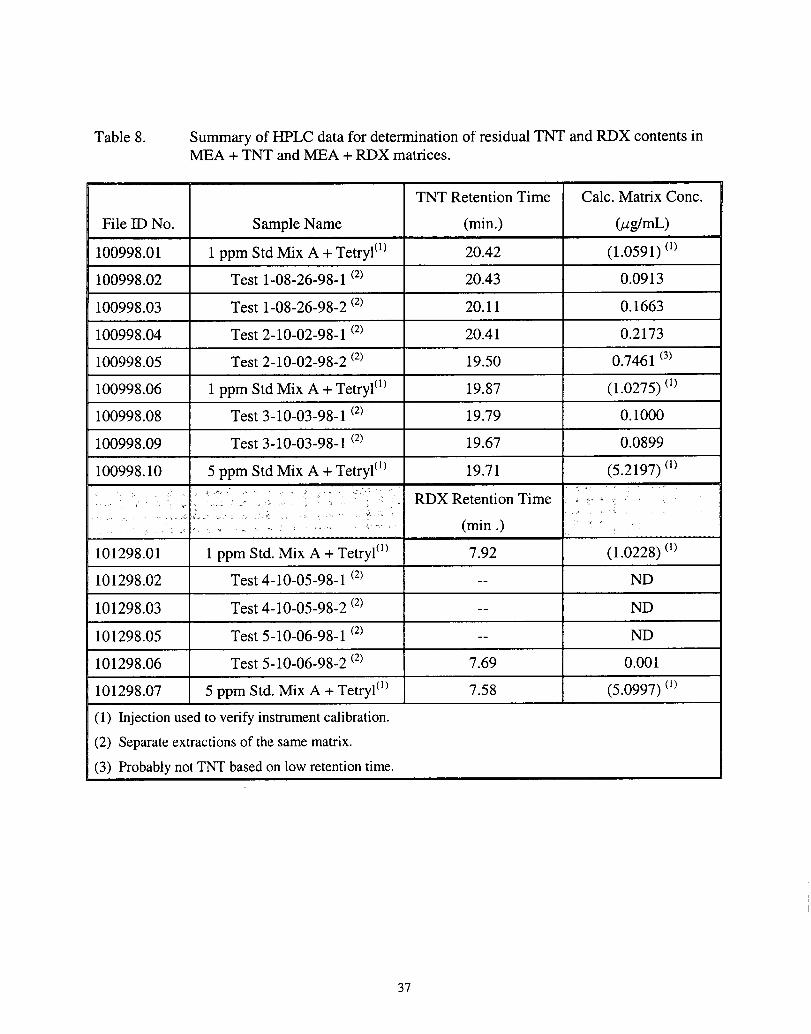
Table 8. Summary of HPLC data for determination of residual TNT and RDX contents inMEA + TNT and MEA+ RDX matrices.
TNT Retention Time Calc. Matrix Cone.
File ID No. Sample Name (min.) @ghnL)
100998.01 1 ppm Std Mix A + Tetryl(l) 20.42 (1.0591) ‘1)
100998.02 Test 1-08 -26-98-1 ‘2) 20.43 0.0913
100998.03 Test 1-08 -26-98-2 ‘2) 20.11 0.1663
100998.04 Test 2-10-02 -98-1 ‘2) 20.41 0.21731 ,
100998.05 Test 2-10-02-98-2 ‘2) 19.50 0.7461 ‘3)
100998.06 1 ppm Std Mix A + Tetryl(l) 19,87 (1.0275) ‘1)
100998.08 Test 3-10-03 -98-1 ‘2) 19.79 0.1000
100998.09 I Test 3-10-03 -98-1 ‘2) I 19.67 I 0.0899
100998.10 I 5 ppm Std Mix A + Tetryl(]) I 19.71 I (5.2197) ‘1)., ,> .:’.., ;,
,-. , .- “.. . ; ‘. RDX Retention Time ,:’:+ J,.. ,.. *,., - $.,-.>. ., ’.’. ...,.- (min .) .’”..s,, . ...,
101298.01 1 ppm Std. Mix A + Tetryl(*) 7.92 (1.0228) ‘1)
101298.02 Test 4-10-05 -98-1 ‘2) --
101298.03 Test 4-10-05 -98-2 ‘2) -- ND
101298.05 Test 5-10-06 -98-1 ‘2) --
101298.06 I Test 5-10-06 -98-2 ‘2) I 7.69 I 0.001
101298.07 5 ppm Std. Mix A + Tetryl(]) 7.58 (5.0997) “)—
(1) Injection used to verify instrument calibration.
(2) Separate extractions of the same matrix.
(3) Probably not TNT based on low retention time.
37

Test No. 1-08-26-98. Time versus temperature profiles generated for anMEA(1OO.3 lg) + TNT(10.00g) reaction matrix (black diamonds) and for a heatedblank MEA(100g) reference matrix (grey squares).
38

I
I
❑
❑
❑
•aEl
—
Figure 20. Test No. 13-10-26-98. Time versus temperature profiles generated for anMEA(100.39g) + RDX(20. 10g) reaction matrix (grey squares) and for a heatedblank MEA(100g) reference matrix (black diamonds).
39
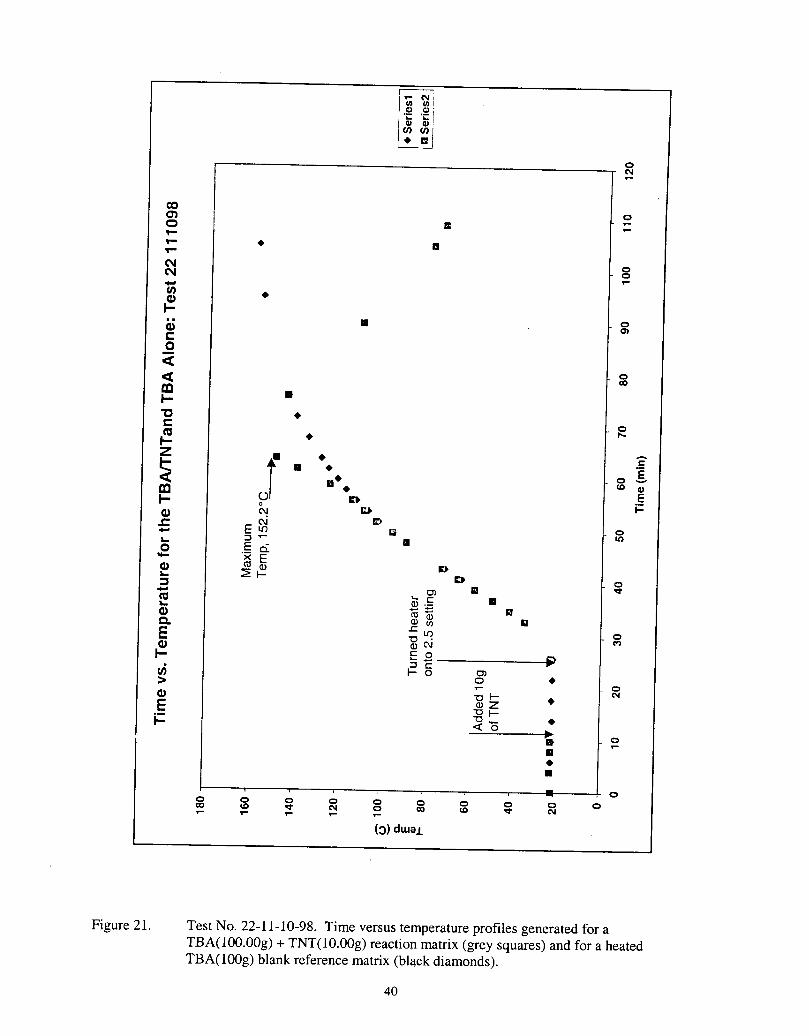
mEb
E)
a
❑
❑
●
■
4-
00)
0co
0r-
Figure 21. Test No. 22-11-10-98. Time versus temperature profiles generated for aTBA(100.0Og) + TNT(10.00g) reaction matrix (grey squares) and for a heatedTBA(100g) blank reference matrix (black diamonds).
40
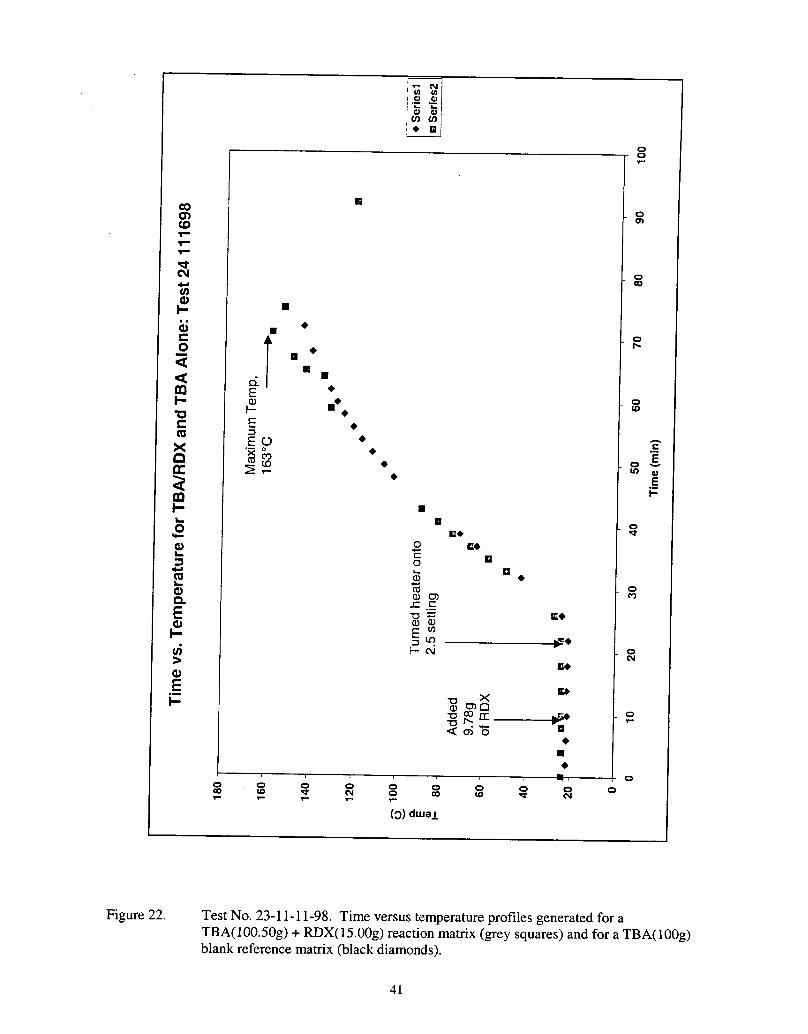
■
o 0m“lD
1-
L
c+
00
0m
s
or-
0w
0m
0N
0
0
Figure 22. Test No. 23-11-11-98. Time versus temperature profiles generated for aTBA(100.50g) + RDX(15.00g) reaction matrix (grey squares) and for a TBA(100g)blank reference matrix (black diamonds).
41
1.3.6
1)
2)
3)
4)
5)
6)
7)
General Observations On The Explosive-Amine Reactions.
Addition of TNT to stirred MEA and DETA in the 500-rnL reaction flask at ambienttemperature resulted in the immediate appearance of an intense purple red coloration inthe liquid phase. Due to the intense color of the solution it was not possible to determineif the bulk of the TNT dissolved at the TNT: MEA or DETA ratios used in the study(Tables 3 and 4) prior to heating. On sonicating TNT: MEA (1 g: 10 mL) and TNT:DETA(lg: 10 mL) mixtures in a 25 mL vial for -30 minutes at a temperature of . 30”C, all theTNT dissolved. This observation suggests that the bulk of the TNT was probably insolution in the early phase of the reaction when heat was applied to the reactor.
Addition of TNT to stirred TBA at ambient temperature resulted in the solution taking ona light brown color with the bulk of the solid remaining intact.
Addition of RDX to stirred MEA, DETA or TBA at ambient temperature did not causeany immediate color change in the liquid. On sonicating RDX:amine (1 g: 10 mL)mixtures for - 30 minutes at = 30 “C, the bulk of the RDX did not dissolve. Thesesamples were left standing without sonification overnight, again the bulk of the solidRDX remained intact. These observations suggest that the RDX-amine reactionsperformed in the study were probabl y heterogeneous.
The reaction product matrices generated using TNT with MEA or DETA (Tables 3 and 4)were dark black-brown colored solutions, that were somewhat more viscous than theoriginal amines used in their preparation. The solutions did not appear to containundissolved solid material. The matrices appeared to be completely miscible with water,and after much dilution formed a transparent pale brown solution, in which no suspendedsolids were observed to be present.
Reaction product matrices generated in using RDX with MEA or DETA (Tables 3 and 4)were clear to pale-yellow-brown colored solutions, not noticeably more viscous than thestarting amines. The matrices were completely miscible with water.
TNT + TBA reaction product matrices, (Table 5) were medium brown-red in color.There was, in addition in the flask, a dark black-brown solid which adhered to the flaskwalls. The liquid phase did not appear to contain any finely divided solid matter. Theliquid matrix viscosity was not noticeably different than that of the neat amine. Theliquid matrix was only slightly soluble in water. The dark solid was only partially watersoluble, but was completely soluble in acetone.
The reaction product matrix from the TBA + RDX reaction contained two immiscibleliquid phases; the major fraction with a light red-brown color and a minor fraction with adark black-brown color. The major liquid fraction was largely non-water soluble. Theminor liquid fraction appeared to be completely soluble in a water/acetone mixture.
42
1.3.7 Reaction Of TNT With MEA Using A Nominal Reaction Stoichiometry Of TNT +7MEA ~ Products (Test #25-n-25-98)
The explosive-amine reactions run thus far were all made with a large excess of amine relative toexplosive. In the MEA reaction system, TNT: MEA and RDX:MEA mole ratios ranged from 18-37:1 with the object of preventing uncontrollable exothenns occurring in the reaction mixture.The purpose of this test was to determine how well the TNT+ MEA reaction occurred when runat the approximate stoichiometry indicated in Table 7, i.e., TNT + 7MEA ~ Products.
The reaction was run in the equipment shown in Figure 2 using the following amounts ofreactants, TNT (53 ,01g) and MEA (100.01 g). To control the reaction temperature, the TNT wasadded in 1-5 gram increments. A maximum temperature of 133 “C was recorded during thereaction. At the end of the reaction, after allowing the flask to cool to ambient temperature, theweight of product in the flask was determined at 139.83g. The reaction product, an intense blackcolor, was observed to be extremely viscous at ambient temperature. A small quantity, 7.08gwas removed from the flask for testing. No attempt was made collect all the gas generated fromthe reaction, since incremental addition of the TNT required opening the reactor flask to theatmosphere. A small sample of gas from the reaction was obtained, analyzed by IR and shownto contain NH3 together with a trace of N20. A similar composition was found in the MEA+TNT reactions run at MEA: TNT mole ratios of = 18-37:1
After performing the above reaction, the reactor system was modified to permit distillation ofvolatile material from the reaction mixture under a reduced pressure of = 0.3 atmosphere. In atwo-stage distillation, the first at atmospheric pressure and the second at reduced pressure, thereaction flask containing the matrix lost 22.23 g and 6.10 g, respectively of volatile material.Samples of the volatiles were condensed in an ice-cooled receiver. Their water content wasanalyzed by TEI Analytical, Niles, Illinois at 90.0 wt~o (larger sample) and 98.3 wt% (smallersample). After distillation, the final weight of product from the initial reaction was determined at104.52 g. This material had a pitch-like consistency at ambient temperature. A sample of thematerial was sent to Desert Analytics of Tucson, Arizona for an elemental, C, H, N and Oanalysis. Two samples were analyzed with the following results:
Wt% %C %H %N %053.72 6.69 19.32 20.15
I 53.97 I 6.62 I 19.30 I 20.65 I
A second sample of the pitch-like material was dissolved in water and analyzed by HPLC for itsTNT content. A value estimated at c 5 ppm was determined. The experimental data for the TNT+ 7MEA reaction followed by distillation are summarized in the following equations:
Initial Reaction:
TNT + MEA = Unknown liquid product(P) + NH3(’) + X(b) (1)53.olg loo.03g 139.93g 3.58g 9.53g
43
Final Reaction Product after distillation:
= Unknown liquid product + NH3 + X + H20(C) + Y(d) (2)110.09 g 3.58g 9.53g 27.39g 2.45g
a) Empirical estimate of ammonia generated in the reaction, based on data in Table 7,1 mole of TNT = 0.9 moles of NH3;
b) Amount of unknown material required to maintain mass balance;
c) Mass of water distilled off liquid product (P) and
d) Mass of unknown liquid (not H20) distilled of liquid product (P).
Data for the overall elemental mass balances starting with the reactants in (1) and going to finalreaction products in (2) are presented in Table 9. For carbon, the calculated percentage massbalance at 100.5~0 is satisfactory and strongly suggests that volatile carbon species are notproduced in any significant amount in the reaction. For H, N and O, the mass balances foundimply that volatile or semi-volatile specie(s) have not been accounted for. It is possible that theN(8.54g) and 0(1 .82g) deficits in the elemental mass balances are due largely to 1) the amountof NH3 formed in the reaction being underestimated and 2) a small quantity of liquid water beingexperimentally not quantified. If these assumptions are correct, the N and O deficits, in terms ofNH3 and H20 respectively, would require an additional 1.72g of hydrogen to be added to theelemental mass balance. This amount of hydrogen is consistent with the calculated hydrogendeficit at 1.69g (Table 9).
Based on the above assumption for the elemental N, O and H deficits, the stoichiometry for theTNT/MEA reaction may be written as:
TNT + 7MEA = Product + 3.5NH3 + 7H@
The elemental stoichiometry of the combined initial reactants (MEA+ TNT) and finalproduct are calculated at C21HS4NICIO13and CL1,lH s1.lN @ fj.0,respective y. Relative toTNT as an explosive, the final reaction product from the MEA reaction is highly oxygendeficient. For simplicity, the high temperature detonation reaction of TNT maybe assumed toproduce the following products:
C7H5N306 = 7c@j + 2.5H20g + 1.5Nz
requiring 4.75 moles of oxygen for the reaction as written, equivalent to an oxygen deficiency of36.8%. If the same products are assumed to be formed from the MEA/TNT reaction product(DP), the calculated oxygen deficiency is 83.6%. It is highly unlikely that this material will bean effective explosive.
44
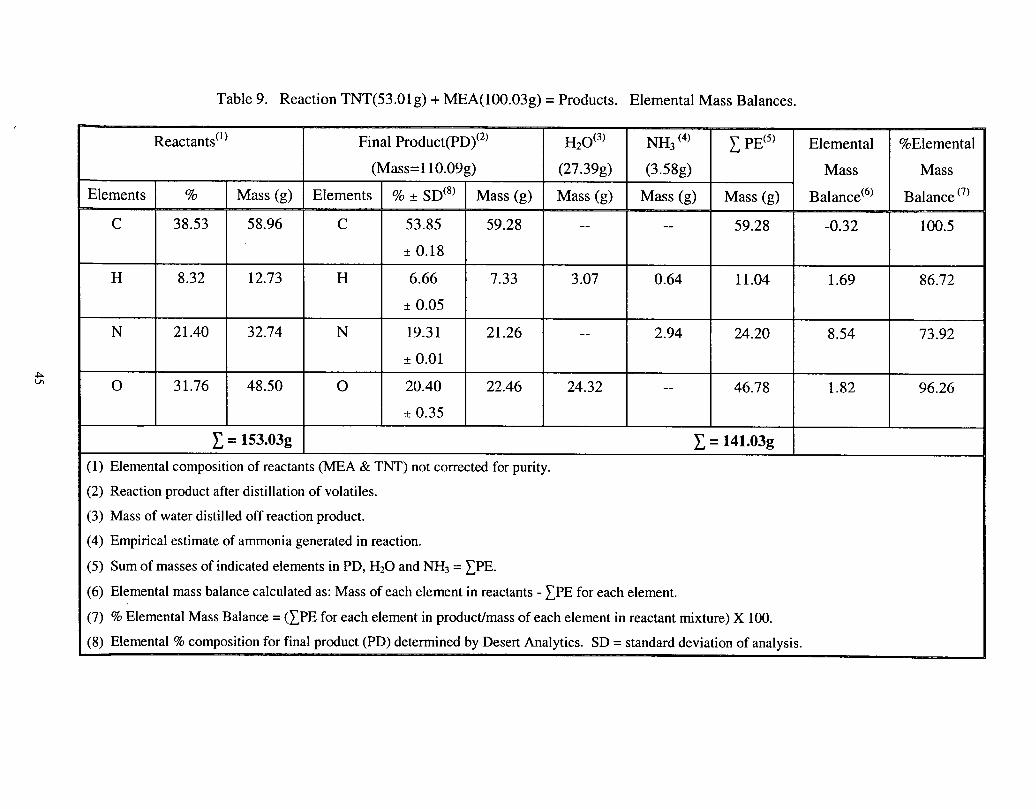
Table 9. Reaction TNT(53.O 1g) + MEA(100.03g) = Products. Elemental Mass Balances.
Reactants(l) Final Product H20(3) NHq ‘4) ~~ Elemental %Elemental
(Mass= l10.09g) (27.39g) (3.58g) Mass Mass
Elements % Mass (g) Elements % ~ SD(8) Mass (g) Mass (g) Mass (g) Mass (g) Balance(G) Balance ‘7)
c 38.53 58.96 c 53.85 59.28 -- .- 59.28 -0.32 100.5
t 0.18
H 8.32 12.73 H 6.66 7.33 3.07 0.64 11.04 1.69 86.72
+ 0.05
N 21.40 32.74 N 19.31 21.26 -- 2.94 24.20 8.54 73.92
* 0.01
0 31.76 48.50 0 20.40 22.46 24.32 -- 46.78 1.82 96.26
k 0.35
~= 153.03g ~= 141.03g
(1) Elemental composition of reactants (MEA& TNT) not corrected for purity.
(2) Reaction product after distillation of volatiles.
(3) Mass of water distilled off reaction product.
(4) Empirical estimate of ammonia generated in reaction.
(5) Sum of masses of indicated elements in PD, H,O and NH~ = ~PE.
(6) Elemental mass balance calculated as: Mass of each element in reactants - ~PE for each element.
(7) % Elemental Mass Balance= (~PE for each element in productlmass of each element in reactant mixture) X 100.
(8) Elemental % composition for final product (PD) determined by Desert Analytics. SD= standard deviation of analysis.
1.3.8 Speciation of the Arnine-Explosive Liquid/Solid Reaction Product Matrices.
Chemical speciation of the reaction product matrices was attempted in the following ways:
a)
b)
c)
d)
Reaction product matrices were diluted in methanol and analyzed by GC/MSD. Insome of these samples, a moderate number of peaks were present in thechromatograms, however none of these peaks represented major species that couldreasonably be expected to be formed in the reactions.
On the possibility that some of the major species formed in the amine-explosivereactions contained NH2, OH and COOH groupings in which hydrogen bonding mayreduce volatility, the matrices were derivatized with BSTAF to form the more volatiletrimethylsilyl derivatives. This did not produce any significant increase in thenumber of species appearing in the resulting GC/MSD chromatograms.
IR spectroscopy was used to characterize some of the reaction product matrices, butfailed to produce any definitive results.
Preliminary attempts have been made to use NMR spectroscopy to analyze thematrices; the approach shows some promise and will be investigated further.
In summary, to date the speciation of the explosive-amine reaction product matrices have notproved successful.
46
SECTION 2
RESULTS TO DATE ON TASK 3
2.1 INTRODUCTION.
TNT is known to react with DETA1. Under certain conditions, the reactions can lead to thespontaneous destruction of the TNT in a highly exothermic reaction, which may or may notresult in the visible ignition of the TNT when the reaction is performed in air. The nature of thisspontaneously induced decomposition of the TNT is poorly understood. There is evidence thatafter the initial TNT-DETA induced decomposition reaction is completed, the remaining neatTNT will spontaneously decompose in a reaction that does not produce large amounts of carbontypical of free burning solid TNT in air.
The purpose in this task is to determine if the chemical initiation of the TNT decompositionreaction produces different gaseous reaction products than those that are produced in thethermally induced TNT decomposition reaction. It was hoped that this task could be performedin the laboratory, using small amounts of explosive (s 10 g) burned in the cigarette mode, suchthat the evolved gas (not too large) could be easily sampled for analysis by GC/MSD, GC/TCDand IR.
Preliminary tests to initiate sustained reaction in small amounts of flake or powdered flake TNT<10 g using either thermal (gas-oxygen flame) of chemical (a few drops of DETA) were notsuccessful. Reaction occurred only in those areas directly contacted by either the flame or theDETA and did not propagate into the bulk of the material. Tests with pelletized (= 12 mmdiameter x 1 cm long) TNT initiated thermally and chemically (DETA) were similarlyunsuccessful. The method finally selected with some success involved activating the TNTpowder, followed by pelletizing and initiating the reaction either thermally or chemically(DETA).
2.2 EXPERIMENTAL.
2.2.1 Activation of TNT (ATNT) Powder.
The following procedure was adopted for preparation of TNT powder activated with DETA:
1) Weigh -2 g of powdered TNT (flake TNT ground in pestle and mortar) to nearest 0.01g and place in a 50 mL Pyrex beaker.
2) Weigh -1 g of DETA to nearest 0.01 gin a 100 mL volumetric flask and makeup tovolume with hexane and sonicate.
3) Add 15 mL of 1 weight ?io DETA in hexane to 2 g of TNT in beaker. Stir for = 20 sec.
4) Add = 50 mL of hexane to the beaker and stir for = 20 sec. Allow solid to settle = 1minute and decant off excess hexane.
5) Repeat washings with = 50-mL aliquots of hexane twice.
47

6) Place beaker with drained activated TNT in vacuum desicator and pump off residualsolvent (= 10 minutes).
The resulting material, a very dark red-brown in color, was a free flowing powder
2.2.2. TNT Pellet Preparation and Cigarette Burning Designs.
Cylindrical pellets of powdered and activated powdered TNT were prepared using an infraredpellet press. Approximately 2 g or less of TNT were poured into the press and pelletized atpressures of = 100,000 lb/in2. A pellet = 1.22-cm diameter and = 1 cm long weighed = 2 g,indicating the pellet had a density close to that of bulk TNT at = 1.66 g/cm3.
Pellets of TNT so prepared were burned in two configurations:
1) For reaction in the presence of air, the pellet(s) was (were) wrapped with a fewturns of aluminum foil and assembled with thermocouples (Tyre K stainless steel clad,0.080” diameter) positioned as shown in Figure 23. The assembly was supported by aclamp around the “crumpled” aluminum foil sealing the base of the cigarette.Approximately 0.1 g of powdered TNT was placed on the exposed top surface of thepellet. The system was ignited by adding a few drops of DETA to the powder.
2) For reaction in the absence of air (run under argon) the experimental set-up shownin Figure 24 was assembled allowing evacuation of the system, establishment of an argonatmosphere over the sample, and if required collection of evolved gases generated by thereaction. The reaction in the TNT pellet was initiated by addition of a few drops ofDETA to the powdered TNT on the top of the pellet. Temperatures in these reactionswere either monitored on a digital or strip chart recorder.
2.2.3. Results.
The results obtained to date are largely qualitative in nature and are summarized below.
1) Attempts to initiate sustained reaction in activated TNT (ATNT) pellets failedwhen the pellets were contained in Pyrex glass tubular holders. It was concluded that thereaction was probably being quenched on the cold Pyrex glass containment walls.
2) Sustained reaction in single ATNT pellets (= 2 gas shown in Figure 23) wrappedin aluminum foil and initiated with TNT powder plus a few drops of DETA wererepeatedly obtained. On addition of DETA, there was an initial emission of a red-browncolored gas/aerosol cloud. After = 6 seconds, a visible somewhat smoky flame appeared.Maximum temperatures (upper thermocouple in Figure 23) in the 800-900 “C range wererecorded with the vigorous reaction being sustained for = 20-25 seconds. A substantialamount of black char was found in the base of the aluminum foil holder. This char wasground up with a small amount of acetone and analyzed for TNT by GC/MSD.Qualitatively, low levels of residual TNT were detected in several such chars analyzedfrom reaction of ATNT pellets.
48
3) Tests as in (2) above were repeated with ATNT powder activated using 0.2weight 9?0DETA in hexane (rather than 1 weight YODETA in hexane). Although reactionwas initiated with these pellets on addition of DETA, it was not sustained, a large fractionof the original pellet remaining intact. The result suggests that the degree of surfaceactivation of the TNT pellet is critical to obtaining sustained reaction.
4) A time-temperature (upper thermocouple) profile obtained with a single ATNTpellet burned in the configuration shown in Figure 23 are shown in Figure 25.
5) Several tests were made using the two-pellet set-up shown in Figure 23. Theresults from these tests were variable. In some tests both pellets would completely react,in other tests the reaction would terminate part way through the lower TNT pellet. Atime-temperature (upper thermocouple) profile from a test in which both pellets werecompletely reacted is shown in Figure 26. During this test, initially, the system inflamedwith a production of fairly smoky flame. The visible flame after a short whileextinguished and the reaction continued thereafter with the emission of a white smoke.On examination of the pellet holder, complete reaction of both pellets appeared to haveoccurred.
6) A single test was made in which an aluminum foil wrapped single pellet of ATNT(= 2 g) was placed in a glass containment vessel similar to that shown in Figure 24 andinitiated with a few drops of DETA. On examination of the pellet holder after removalfrom the glass containment vessel, the pellet appeared to have been completelyconsumed. The time-temperature profile for the reaction is shown in Figure 27.
2.3 CONCLUSIONS.
A technique has been developed for initiating sustained reaction in pellets of activated TNT(ATNT). By contacting an ATNT pellet with a TNT pellet (as in Figure 23) sustained reaction inthe non-activated TNT pellet can be achieved; though not reproducibly for reasons unknown.
The reaction occurring in the pellets appear to be capable of occurring in two modes: one, whichproduces a visible fairly smoky (black) flame and a second mode in which a visible flame,present initially, extinguishes and is replaced by emission of a white smoke plume. In both casescomplete reaction in the non-activated TNT pellet may occur. The cause of the apparent changein the reaction modes is not known.
Initiation of the DETA-TNT reaction, and propagation into an ATNT pellet with sustainedreaction to completion is not dependent on the presence of air at the reaction site.
Finally, although the use of activated TNT shows promise for initiating and sustaining the self-propagating high temperature decomposition of TNT; the method needs further development toinsure its reliability.
49
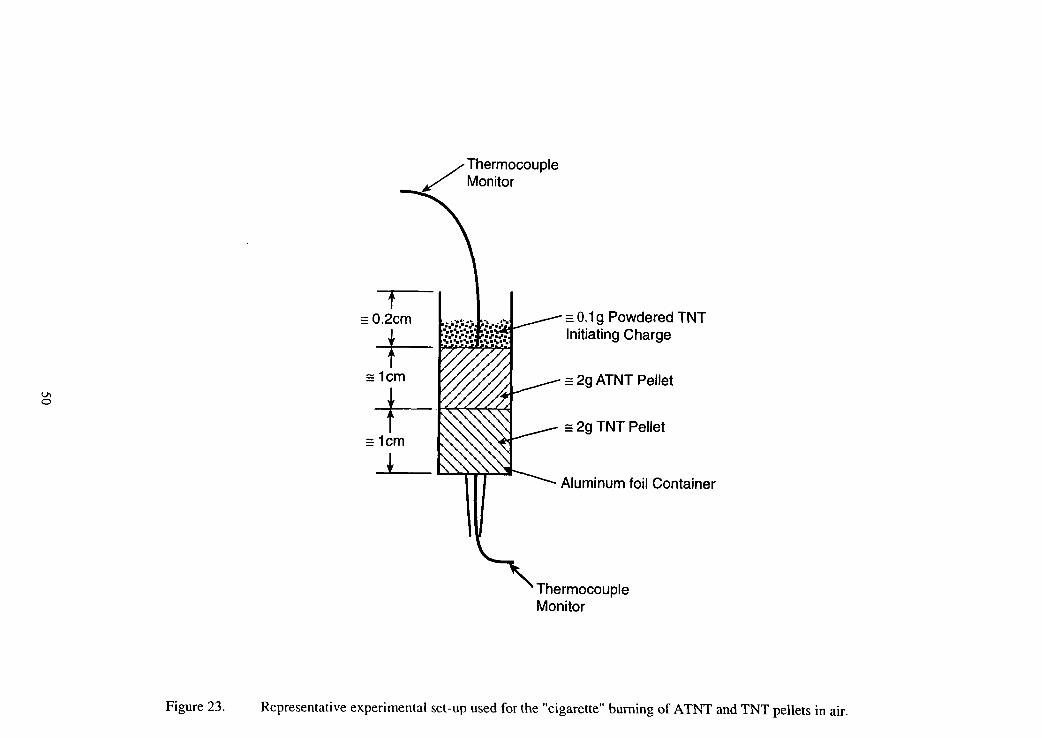
/Thermocouple
t= 0.2cm g Powdered TNT
+
ting Charge
=Icm ATNT Pellet
+ TNT Pellet=Icm
num foil Container
\ ThermocoupleMonitor
Figure 23. Representative experimental se[-up used for the “cigarette” burning of ATNT and TNT pellets in air.
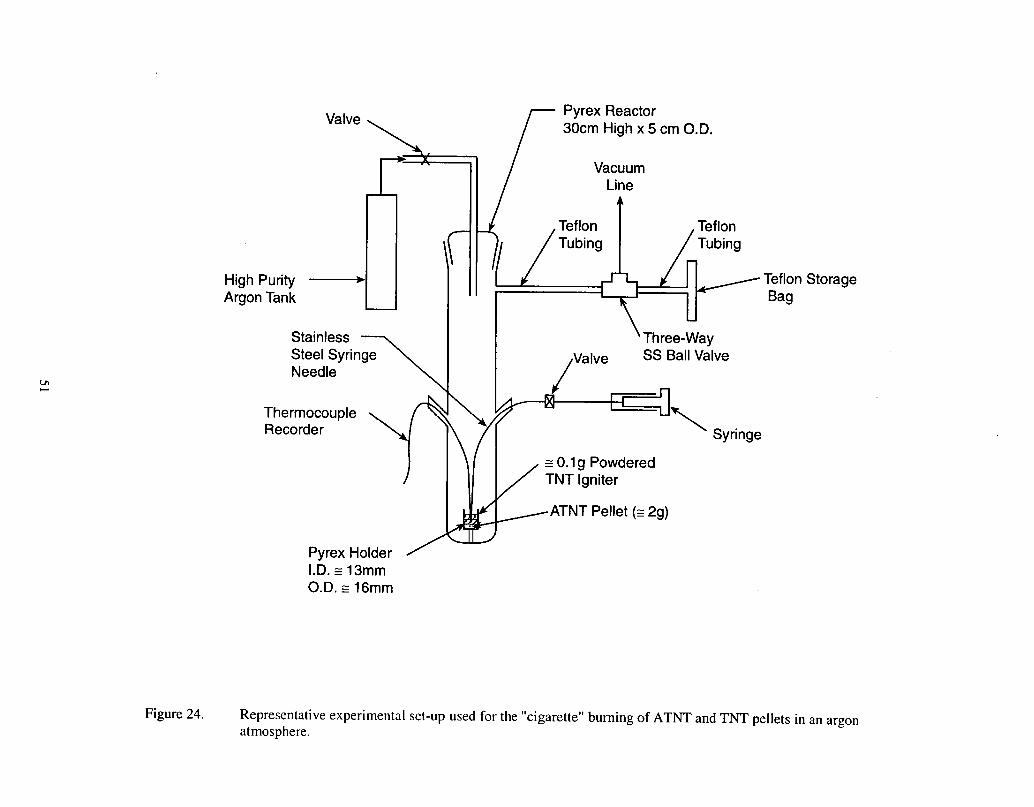
Valve30cm High x 5 cm O.D.
Vacuum
High Purity ~Argon Tank
StainlessSteel Syringe SS Ball ValveNeedle
ThermocoupleRecorder
= 0.1g Powdered
~ATNT Pellet (= 2g)
Pyrex HolderI.D. s 13mmO.D. = 16mm
TeflonBag
Storage
Figure 24. Representative experimental set-up used for the “cigarette” burning of ATNT and TNT pellets in an argonatmosphere.
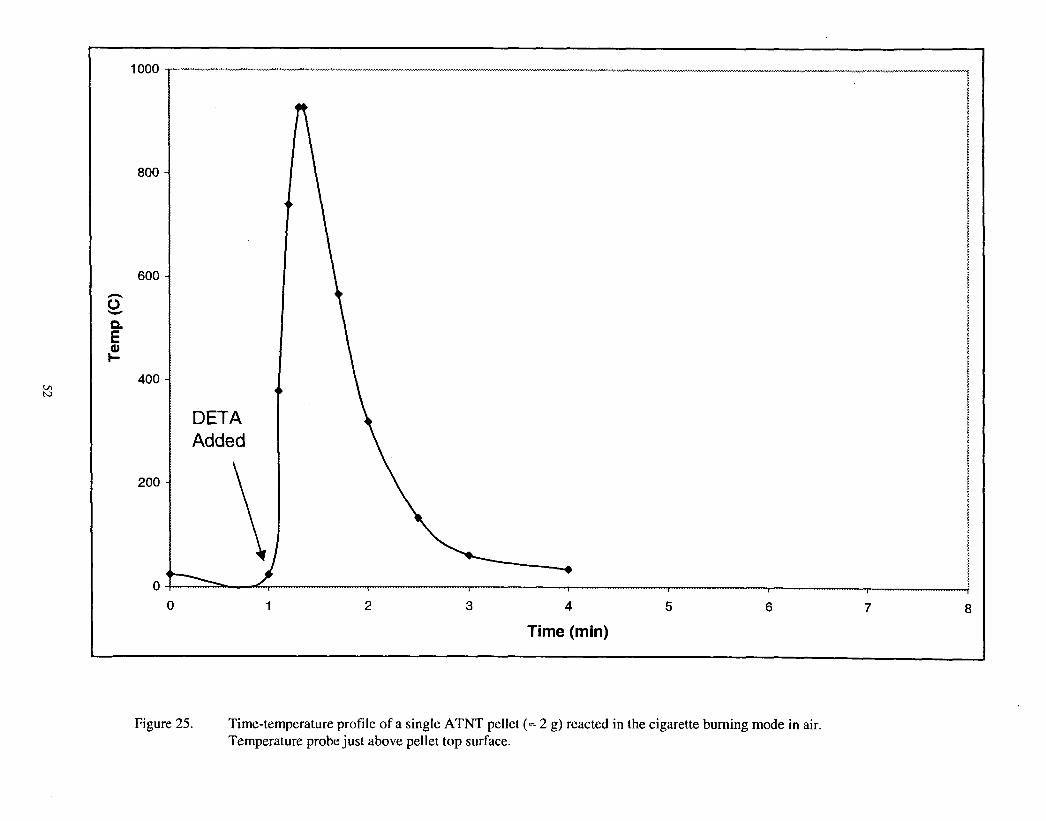
WIN
1000
800
600
400
200
00
Added
\
4
DETA
4
1 2 3 4 5 6 7 8
Time (rein)
Figure 25. Time-temperature profile of a single ATNT pellet (- 2 g) reacted in the cigarette burning mode in air.Temperature probe just above pellet top surface.
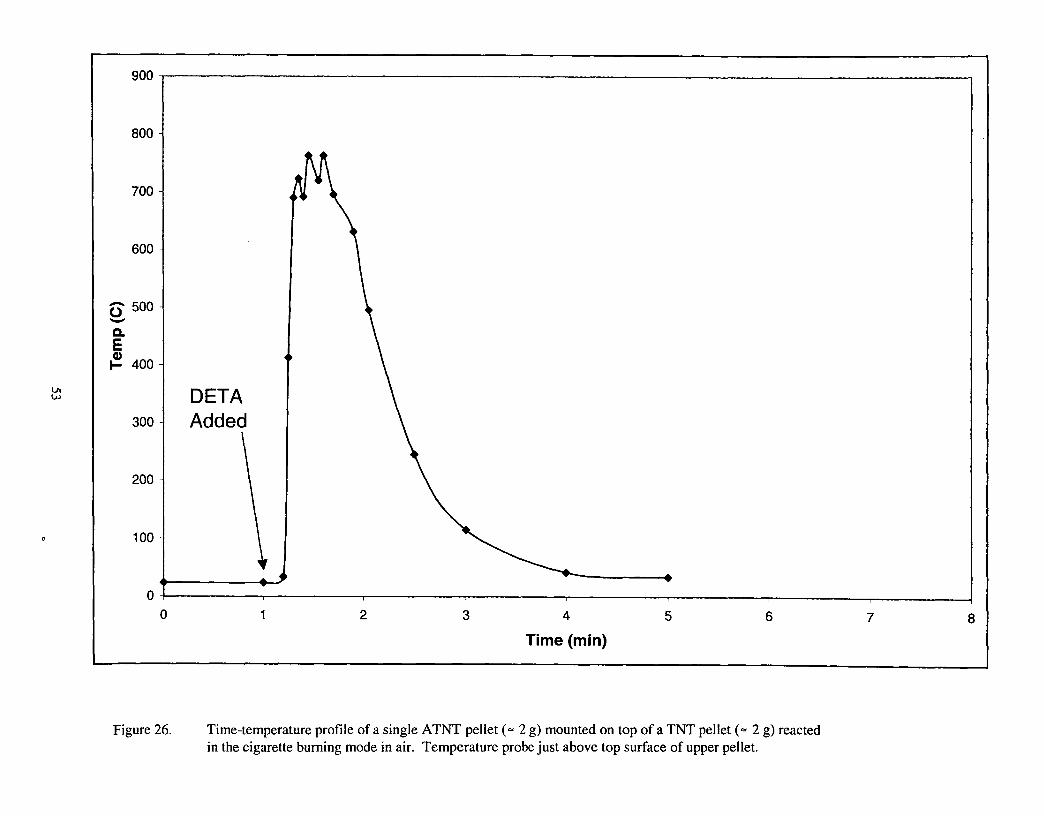
900 –
800-
700-
600-
~ 500-w
EE 400-
300-
200-
100-
4Fol-
0
4)
DETAAdded
\,●
1 2 3 4
Time (rein)
5 6 7
Figure 26. Time-temperature profile of a single ATNT pellet (= 2 g) mounted on top of a TNT pellet (= 2 g) reacted
in the cigarette burning mode in air. Temperature probe just above top surface of upper pellet.

1000
800
600
400
200
00
41
DETA
Added
1 2 3“ 4 5 6 7 8
Time-temperature profile of an ATNT pellet (- 2 g) reacted in the cigarette burning mode in argon.Temperature probe just above top surface of pellet.

TNT:DETA 5050 mole percent Calculated Equilibrium Product Distribution for Selected Temperatures at 1 atm Pressure
1100 1200
Temperature (K)
1 .OOE+Ol
1 .OOE-Ol
1 .OOE-03
1 .OOE-05
1 .OOE-07
1 .OOE-O9
1 .OOE-11
l.OOE-13
i.OOE-15
1 .OOE-17
1 .OOE-19
l.OOE-21
1 .OOE-23
1 .OOE-25
1 .OOE-27
1 .OOE-29
1 .OOE-31
1 .OOE-33
1 OOE-35
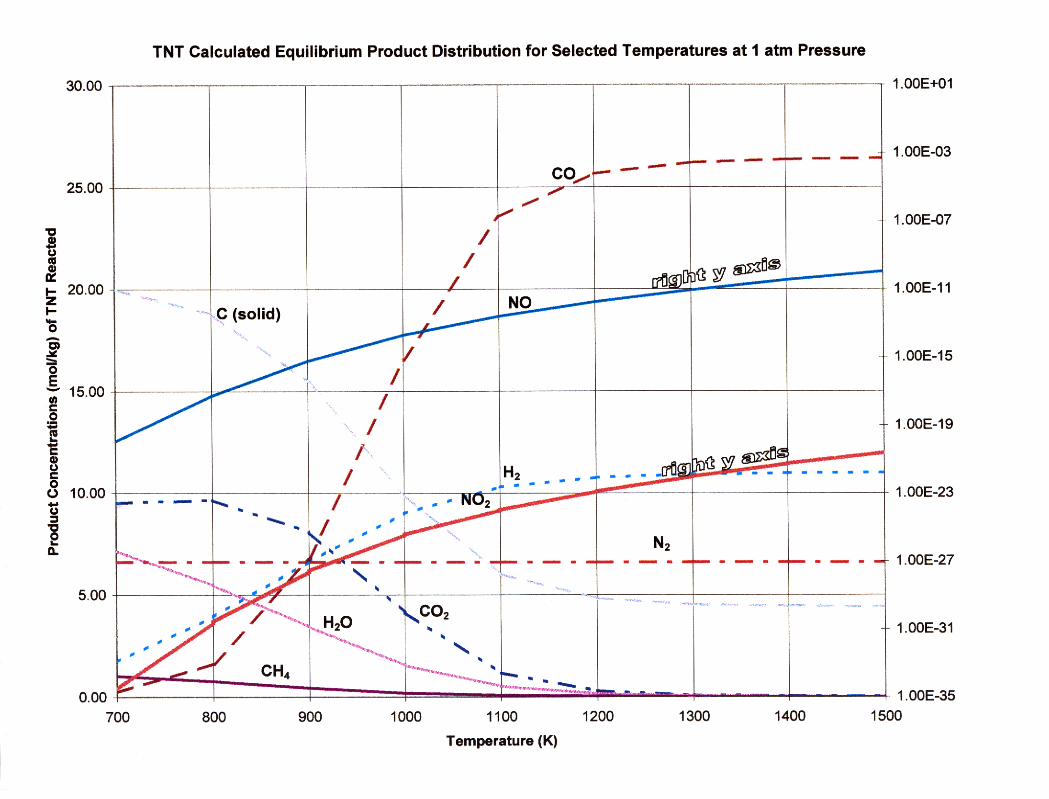
TNT Calculated Equilibrium Product Distribution for Selected Temperatures at 1 atm Pressure
.-- +----
1
;- 1
~~ 1
-- 1
-I
1
J
I
.OOE+Ol
.OOE-03
.OOE-O7
.OOE-11
.OOE-15
1 .OOE-19
1 .OOE-23
i 1 .OOE-27
I 1 .OOE-31
1 .OOE-35
---,-- - ----I ----1-r
' -L --..----.- ,---
1
25.00
: (solid)
- -
/
T mm--
5.oc
1000 1100 1200 1300 1400 1500
Temperature (K)
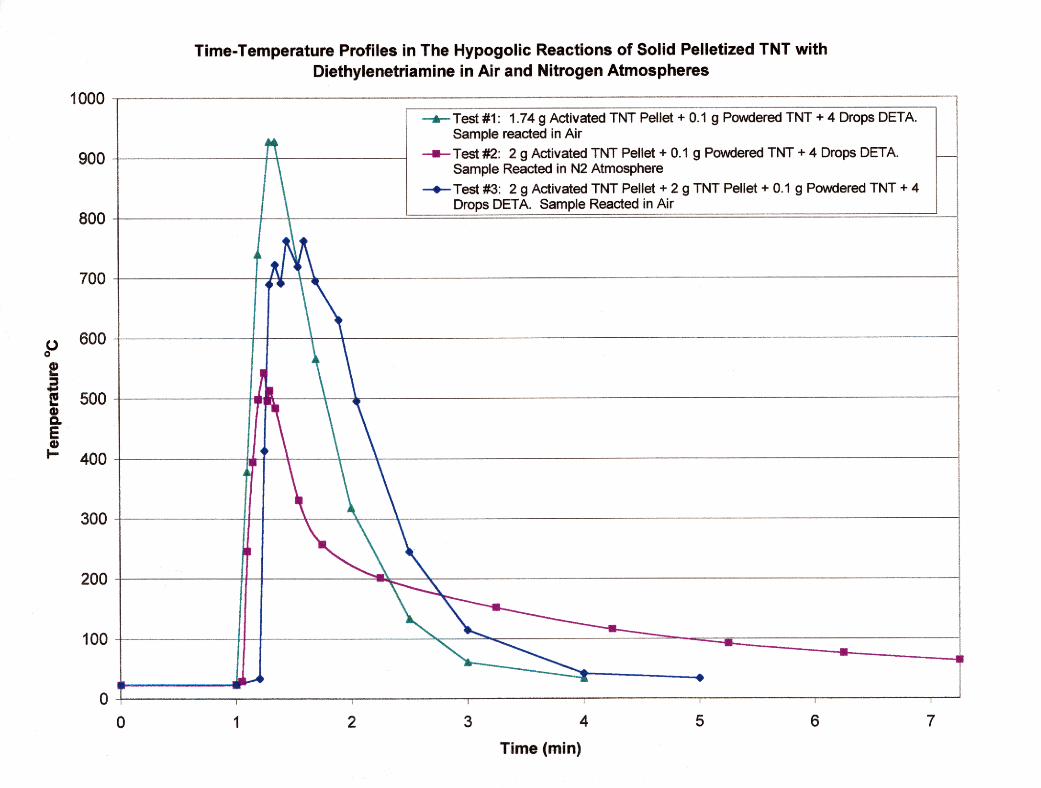
1000
900
800
700
I __
e! 3 E 500 E 5 I- 400
300
200
100
0
Time-Temperature Profiles in The Hypogolic Reactions of Solid Pelletized TNT with Diethylenetriamine in Air and Nitrogen Atmospheres
.__..._ ..--..- ..__ -.._~ ______., ---.-
--L--?&j #I: ..- -__
1.74 g Activated TNT Pellet + 0.1 g Powdered TNT + 4 Drops DETA.- Sample reacted in Air
--c Test #CL: 2 g Activated TNT Pellet + 0.1 g Powdered TNT + 4 Drops DETA. Sample Reacted in N2 Atmosphere
-s-Test ##3 2 g Activated TNT Pellet + 2 g TNT Pellet + 0.1 g Powdered TNT + 4
1 i
1 2 3 4 5 6 7
Time (min)
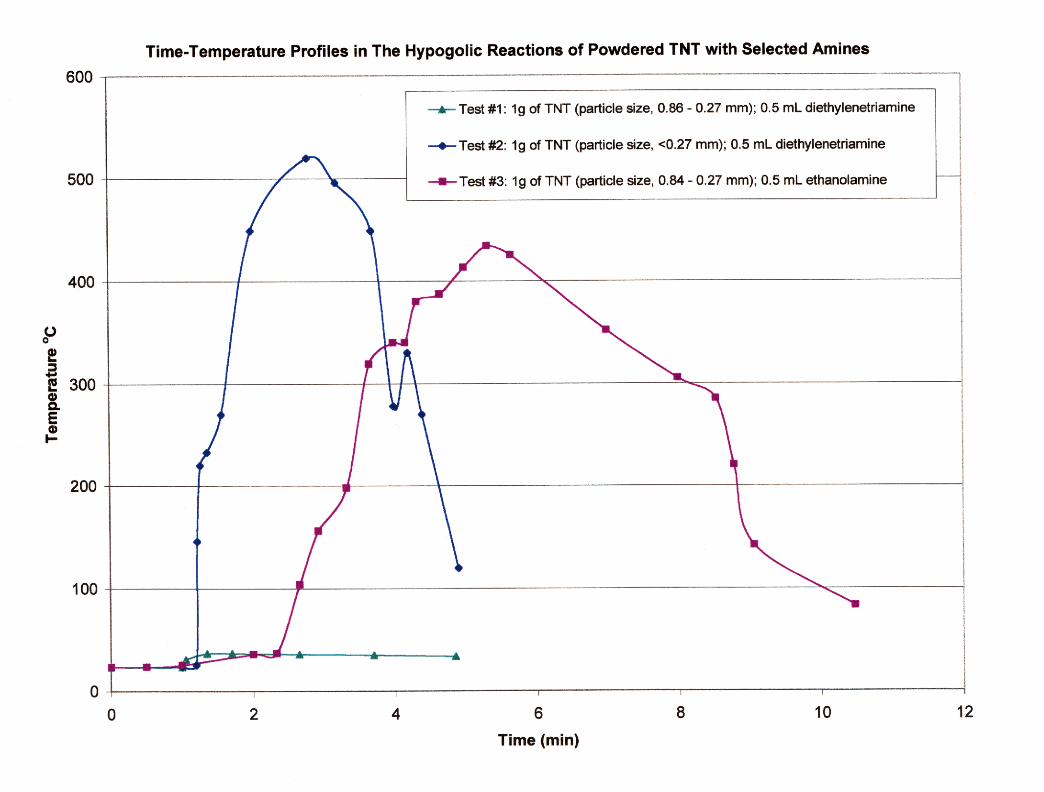
600 7.--
500
I?! a E 300 $ E 8
200
100
Time-Temperature Profiles in The Hypogolic Reactions of Powdered TNT with Selected Amines _-
A-.Test #I: lg of TNT (particle size, 0.86 - 0.27 mm); 0.5 mL diethylenetriamine
t Test #2: lg of TNT (particle size, co.27 mm); 0.5 mL diethylenetriamine
-=-Test #3: lg of TNT (particle size, 0.84 - 0.27 mm); 0.5 mL ethanolamine
-
6
Time (min)
8 10 12
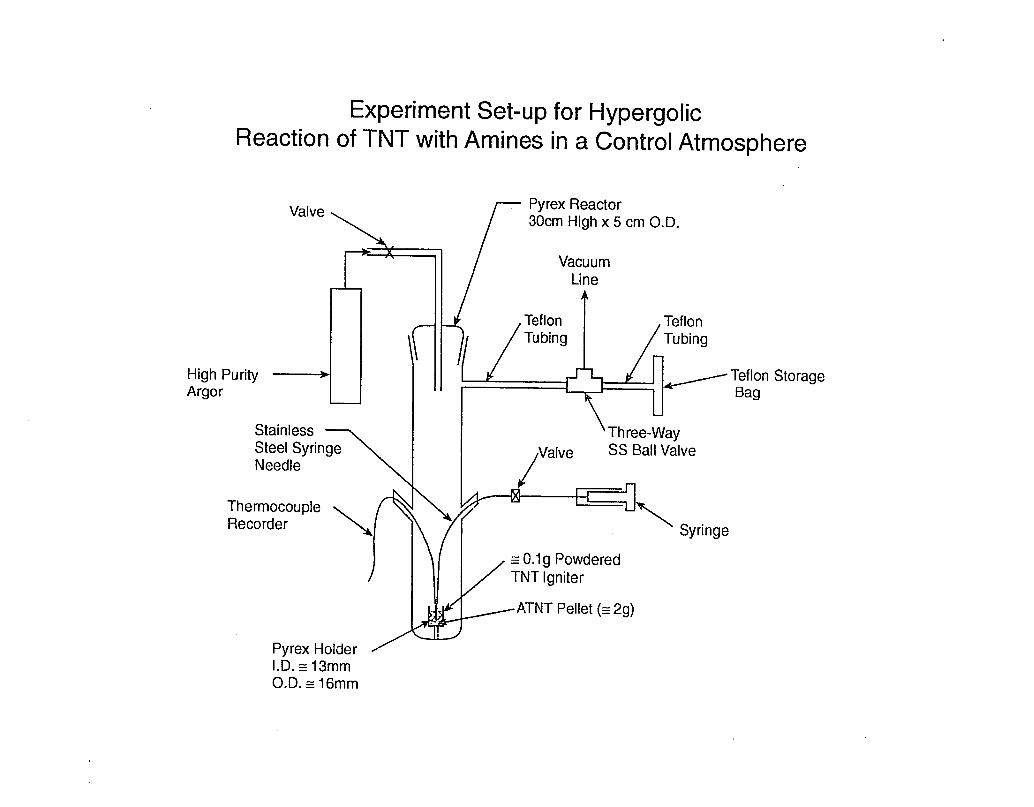
Experiment Set-up for HyperbolicReaction of TNT with Amines in a Control Atmosphere
High PurityArgor
rPyrex Reactor30cm High x 5 cm O.D.
/
VacuumLine
Teflon StorageBag
Stainless ‘Three-WaySteel Syringe Valve
$“
SS Ball ValveNeedle
ThermocoupleRecorder ‘@ T( Syringe
)
~ATNT Pellet (s 2g)
Pyrex Holder XI.D. = 13mmO.D. = 16mm
/Thermocouple/ Monitor
>
z 2.3cm
+=Icm
+=Icm
g Powdered TNTting Charge
ATNT Pellet
TNT Pellet
num foil Container
\ ThermocoupleMonitor
Experimental Set-up for HyperbolicReaction of TNT Pellets with Amines in Air
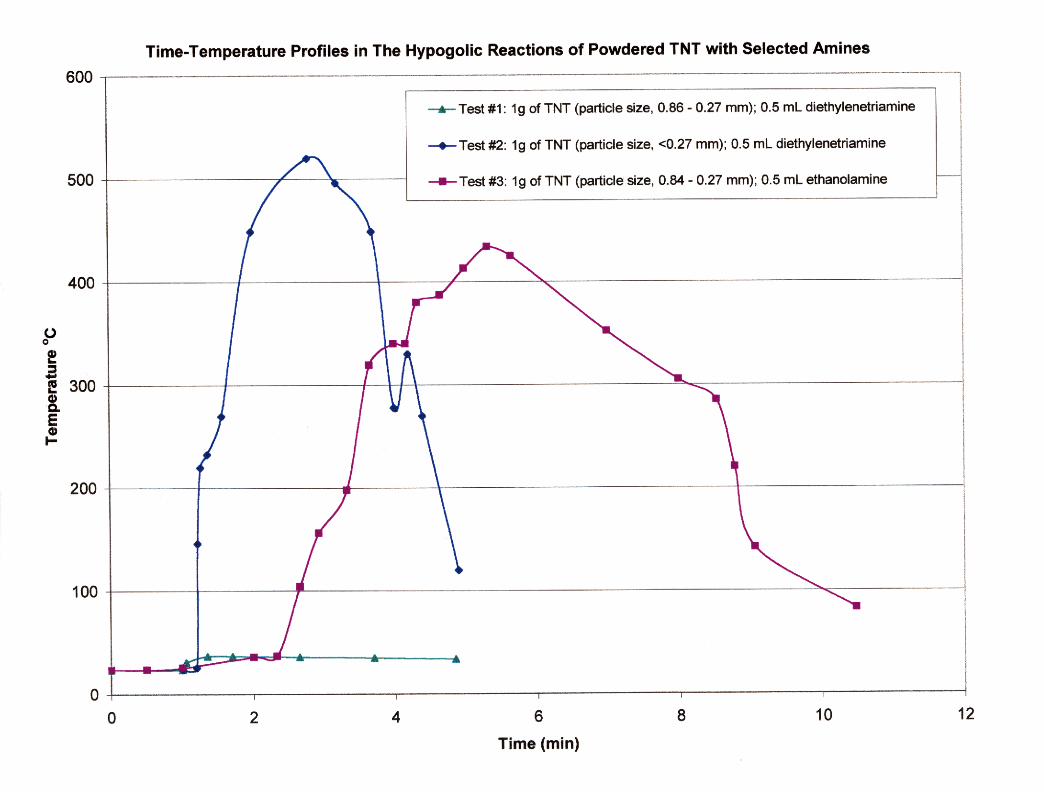
600
500
200
100
Time-Temperature Profiles in The Hypogolic Reactions of Powdered TNT with Selected Amines
-+-Test #I: lg of TNT (particle size, 0.86 - 0.27 mm); 0.5 mL diethylenetriamine
+-Test #2: lg of TNT (particle size, co.27 mm): 0.5 mL diethylenetriamine
-#-Test #3: lg of TNT (particle size, 0.84 - 0.27 mm); 0.5 mL ethanolamine c ~~. ~.~- .- L
0
/
0 2 4 6
Time (min)
8 10 12
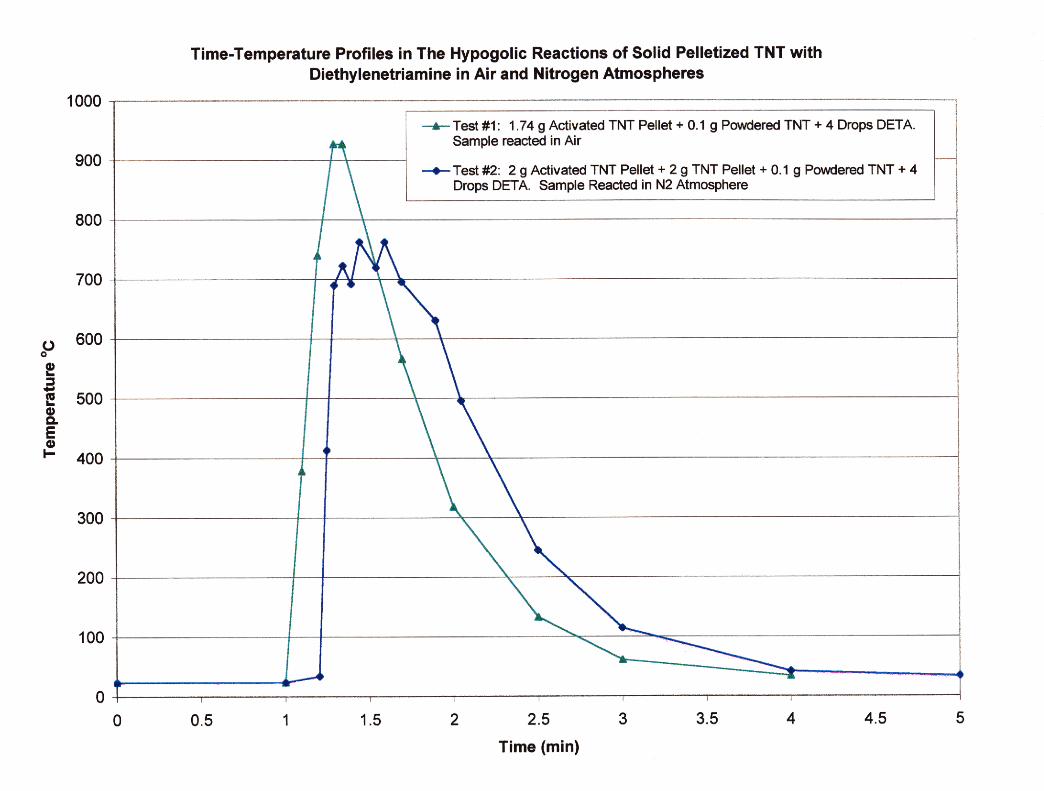
--- 1000
900
800
700
600
500
400
300
200
100
0
Time-Temperature Profiles in The Hypogolic Reactions of Solid Pelletized TNT with Diethylenetriamine in Air and Nitrogen Atmospheres
__... _ _.... --- .__.-
+-Test #I :
tTest #2: 2 g Activated TNT Pellet + 2 g TNT Pellet + 0.1 g Powdered TNT + 4 Drops DETA. Sample Reacted in N2 Atmosphere
0 1 1.5 2 2.5 3 3.5 4 4.5 5
Time (min)

/
ThermocoupleMonitor
>
z 2.3cm
+=Icm
ExperimentalReaction of TNT
r
‘ThermocoupleMonitor
Set-up for HyperbolicPellets with Amines in Air
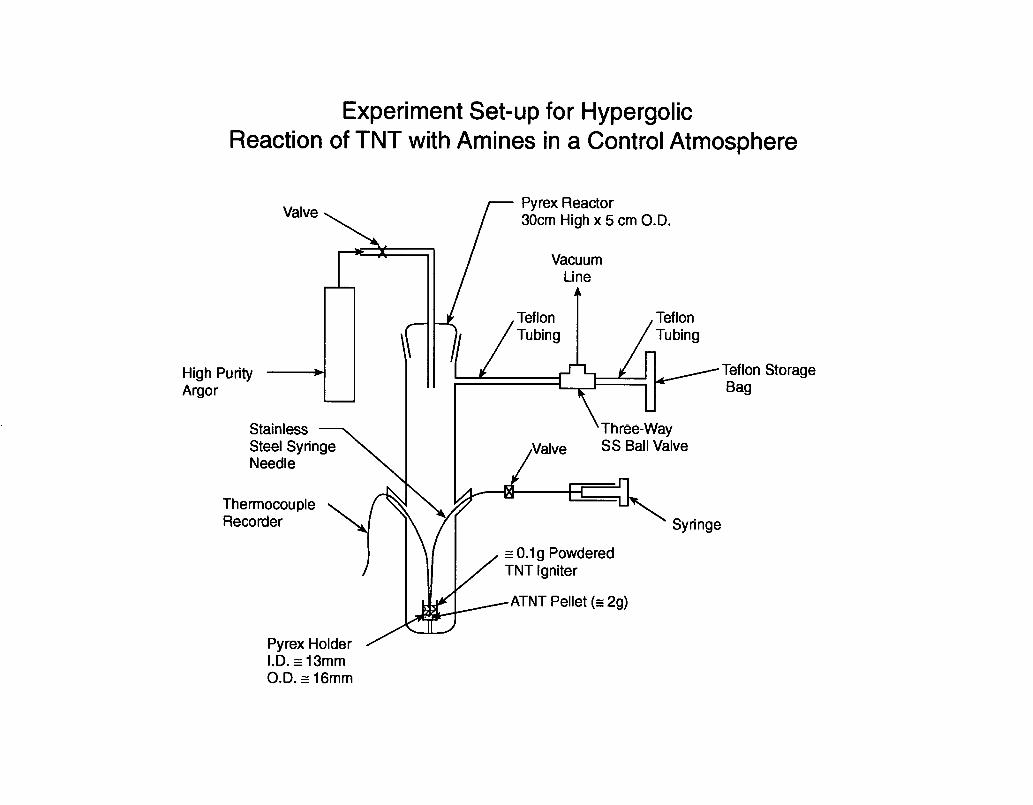
Experiment Set-up for HyperbolicReaction of TNT with Amines in a Control Atmosphere
Valve
+
-D\rHigh PurityArgor
r Pyrex Reactor30cm High x 5 cm O.D.
I VacuumLine
{/ ~ ‘/ /Teflon TeflonTubing Tubing
Teflon StorageBag
Stainless ‘Three-WaySteel Syringe SS Ball ValveNeedle
ThermocoupleRecorder Syringe
= 0.1g PowderedTNT Igniter
~ATNT Pellet (= 2g)
Pyrex HolderI.D. s 13mmO.D. = 16mm

TNT Calculated Equilibrium Product Distribution for Selected Temperatures at 1 atm Pressure
30.00
25.00
i aa
E 20.00
f 's s E
1 z 15.00
B
1
iti s 10.00
4 g Ii
5.00
0.00 700 800 900 1000 1100 1200 1300 1400 1500
Temperature (K)
1 .OOE+Ol
1 .OOE-O3
1 .OOE-07
l.OOE-15
l.OOE-19
1 .OOE-23

30.00
25.00 '0 s! ii 2 E 20.00
'i; G 5
g 2 15.00
.g
s !i E 0 10.00 0 ti G 2 P
5.00
0.00
TNT:DETA 50:50 mole percent Calculated Equilibrium Product Distribution for Selected Temperatures at 1 atm Pressure
-H20 - - N2 - - - H2 -CH4 - -co -NO
NO2
l .OOE+Ol
1 .OOE-01
1 .OOE-03
1 .OOE-05
1 .OOE-07
1 .OOE-09
1 .OOE-11
1 .OOE-13
1 .OOE-15
1 .OOE-17
1 .OOE-19
1 .OOE-21
1 .OOE-23
1 .OOE-25
1 .OOE-27
1 .OOE-29
1 .OOE-31
1 .OOE-33
1 .OOE-35 700 1100 1200
Temperature (K)
1300 1400 1500
31 8313/2
7.0 Appendix B – Commerce Business Daily Ad
[Commerce Business Daily: Posted in CBDNet on June 8, 2000]From the Commerce Business Daily Online via GPO Access[cbdnet.access.gpo.gov]
PART: SPECIAL NOTICESOFFADD: Sandia National Laboratories, Technology Partnerships
Dept., PO Box 5800-MS1380, Albuquerque, NM 87185-1380SUBJECT: MODIFIED “JEFFAMINE” T-403” AMINE CURING AGENT
FOR EPOXY FORMULATIONSDESC: Sandia National Laboratories has a laboratory-scale chemical process which produces aby-product of modified “Jeffamine” T-403” (commercial product of the Huntsman Corp.).“Jeffamine” T-403” is a trifunctional amine used as a curing agent for epoxies such as Epon 828.Sandia’s patented process utilizes the virgin “Jeffamine” T-403” to degrade explosives such asTNT and Comp B into safe products. “Jeffamine” T-403” is used as a reactant in the chemicalreaction, then, after reacting, the modified-“Jeffamine” becomes part of the waste stream. Thisnon-explosive, off-color, viscous “Jeffamine” by-product can still be used to make epoxy for usein applications which do not require virgin “Jeffamine”.” Epoxies made with this modified“Jeffamine” have altered mechanical properties, such as lower glass transition temperatures.However, the mechanical properties can be tailored for use in the final epoxy application. This chemical process is one of military interest. The Department of Defense and Departmentof Energy have funding to dispose of hundreds of thousands of tons of ammunition during thenext decade. About 100,000 tons/year of new materials are added to this inventory. The hugeinventory of obsolete military explosives are available for this process and will provide manytons of modified “Jeffamine” T-403” for commercial applications. Sandia is interested in identifying potential users of the modified “Jeffamine” T-403” aminecuring agent and/or partnering with a commercial company to scale up the operation fromlaboratory scale to industrial proportions. Demilled explosives are available from ArmyAmmunition Plants to demonstrate the process and scale-up.EMAILADD: [email protected]: Sheila L. PoundsCITE: (W-160 SN462822)
32 8313/2
8.0 Appendix C – CFD Research Final Report
DEVELOPMENT OF A NUMERICAL SIMULATION TOOLFOR THE
SANDIA ENERGETIC MATERIAL NEUTRALIZATION PROCESS
Final Report
ByDebasis Sengupta, Maryam Shariati, and Sam Lowry
CFD Research Corporation215 Wynn Drive
Huntsville, AL 35805
April 2001 CFDRC No.: 8313/2
Submitted toSandia National Laboratories
1515 Eubanks, SEAlburquerque, NM 87123

i 8313/2
ACKNOWLEDGMENTS
This work was performed under Sandia Contract H11726. CFDRC would like to expressappreciation for the help and guidance provided by the Sandia Project Engineer, Dr. PamWalker.
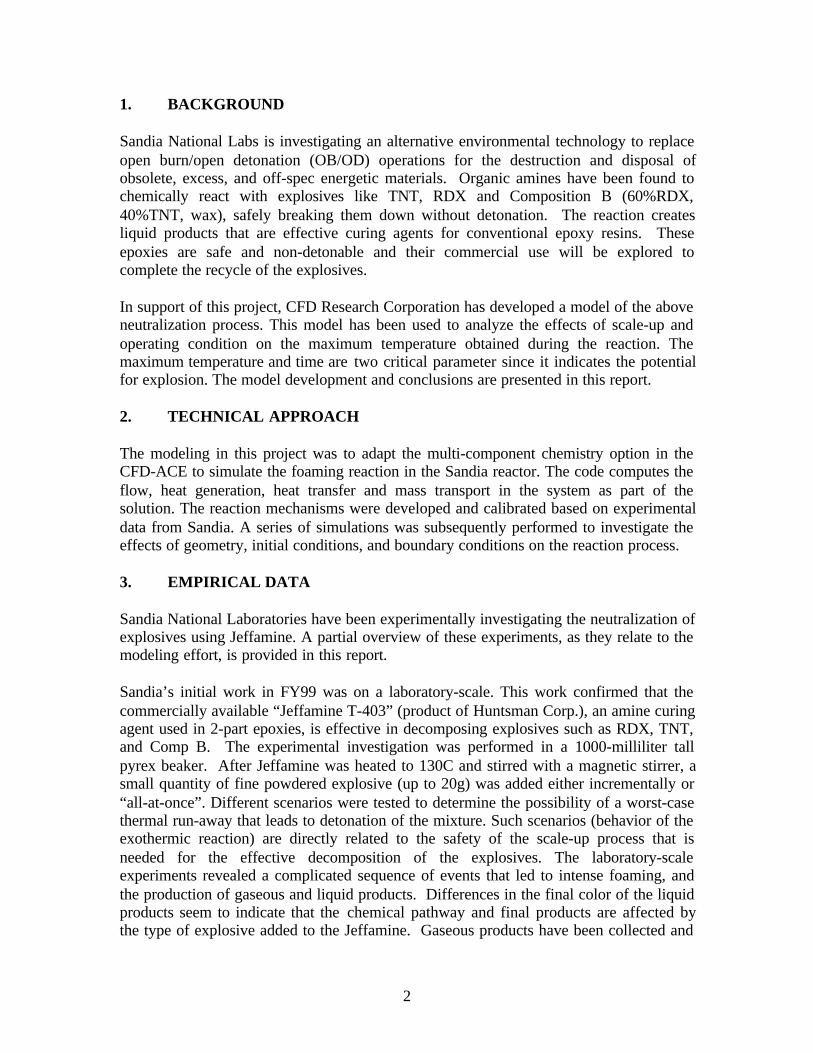
2
1. BACKGROUND
Sandia National Labs is investigating an alternative environmental technology to replaceopen burn/open detonation (OB/OD) operations for the destruction and disposal ofobsolete, excess, and off-spec energetic materials. Organic amines have been found tochemically react with explosives like TNT, RDX and Composition B (60%RDX,40%TNT, wax), safely breaking them down without detonation. The reaction createsliquid products that are effective curing agents for conventional epoxy resins. Theseepoxies are safe and non-detonable and their commercial use will be explored tocomplete the recycle of the explosives.
In support of this project, CFD Research Corporation has developed a model of the aboveneutralization process. This model has been used to analyze the effects of scale-up andoperating condition on the maximum temperature obtained during the reaction. Themaximum temperature and time are two critical parameter since it indicates the potentialfor explosion. The model development and conclusions are presented in this report.
2. TECHNICAL APPROACH
The modeling in this project was to adapt the multi-component chemistry option in theCFD-ACE to simulate the foaming reaction in the Sandia reactor. The code computes theflow, heat generation, heat transfer and mass transport in the system as part of thesolution. The reaction mechanisms were developed and calibrated based on experimentaldata from Sandia. A series of simulations was subsequently performed to investigate theeffects of geometry, initial conditions, and boundary conditions on the reaction process.
3. EMPIRICAL DATA
Sandia National Laboratories have been experimentally investigating the neutralization ofexplosives using Jeffamine. A partial overview of these experiments, as they relate to themodeling effort, is provided in this report.
Sandia’s initial work in FY99 was on a laboratory-scale. This work confirmed that thecommercially available “Jeffamine T-403” (product of Huntsman Corp.), an amine curingagent used in 2-part epoxies, is effective in decomposing explosives such as RDX, TNT,and Comp B. The experimental investigation was performed in a 1000-milliliter tallpyrex beaker. After Jeffamine was heated to 130C and stirred with a magnetic stirrer, asmall quantity of fine powdered explosive (up to 20g) was added either incrementally or“all-at-once”. Different scenarios were tested to determine the possibility of a worst-casethermal run-away that leads to detonation of the mixture. Such scenarios (behavior of theexothermic reaction) are directly related to the safety of the scale-up process that isneeded for the effective decomposition of the explosives. The laboratory-scaleexperiments revealed a complicated sequence of events that led to intense foaming, andthe production of gaseous and liquid products. Differences in the final color of the liquidproducts seem to indicate that the chemical pathway and final products are affected bythe type of explosive added to the Jeffamine. Gaseous products have been collected and
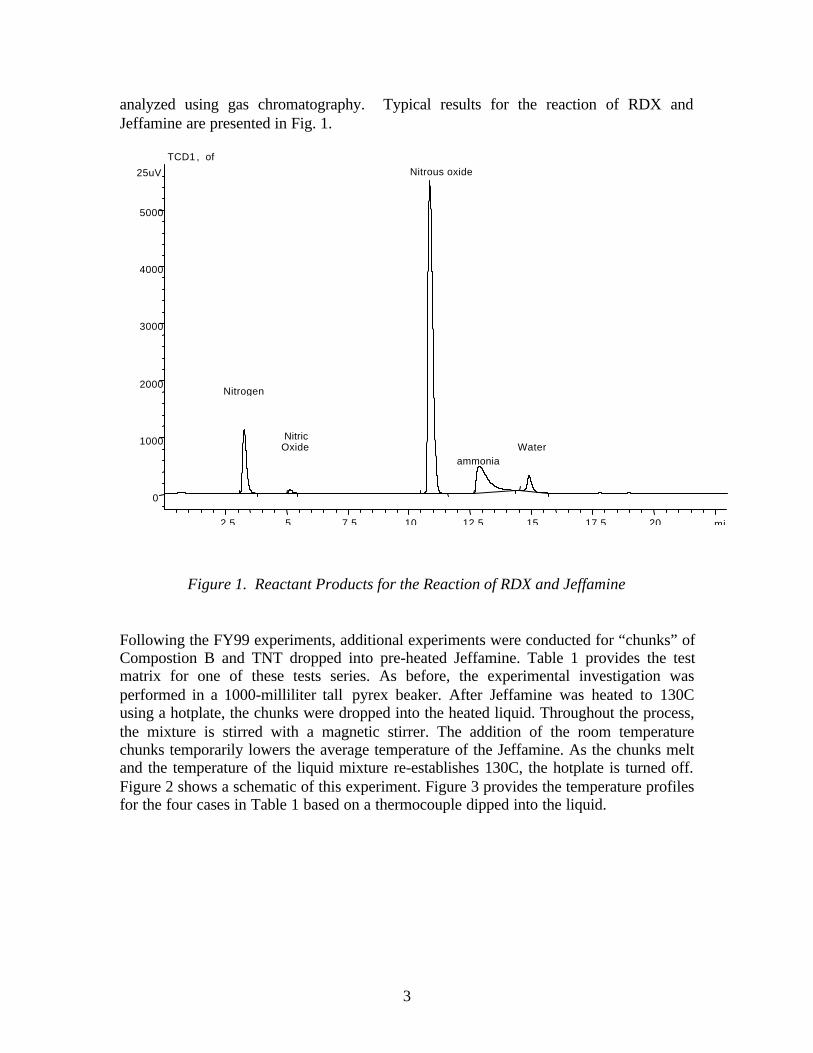
3
analyzed using gas chromatography. Typical results for the reaction of RDX andJeffamine are presented in Fig. 1.
min2.5 5 7.5 10 12.5 15 17.5 20
25uV
0
1000
2000
3000
4000
5000
TCD1A
, ofTOM\TCD00201.D
Nitrogen
NitricOxide
Nitrous oxide
ammonia Water
Figure 1. Reactant Products for the Reaction of RDX and Jeffamine
Following the FY99 experiments, additional experiments were conducted for “chunks” ofCompostion B and TNT dropped into pre-heated Jeffamine. Table 1 provides the testmatrix for one of these tests series. As before, the experimental investigation wasperformed in a 1000-milliliter tall pyrex beaker. After Jeffamine was heated to 130Cusing a hotplate, the chunks were dropped into the heated liquid. Throughout the process,the mixture is stirred with a magnetic stirrer. The addition of the room temperaturechunks temporarily lowers the average temperature of the Jeffamine. As the chunks meltand the temperature of the liquid mixture re-establishes 130C, the hotplate is turned off.Figure 2 shows a schematic of this experiment. Figure 3 provides the temperature profilesfor the four cases in Table 1 based on a thermocouple dipped into the liquid.
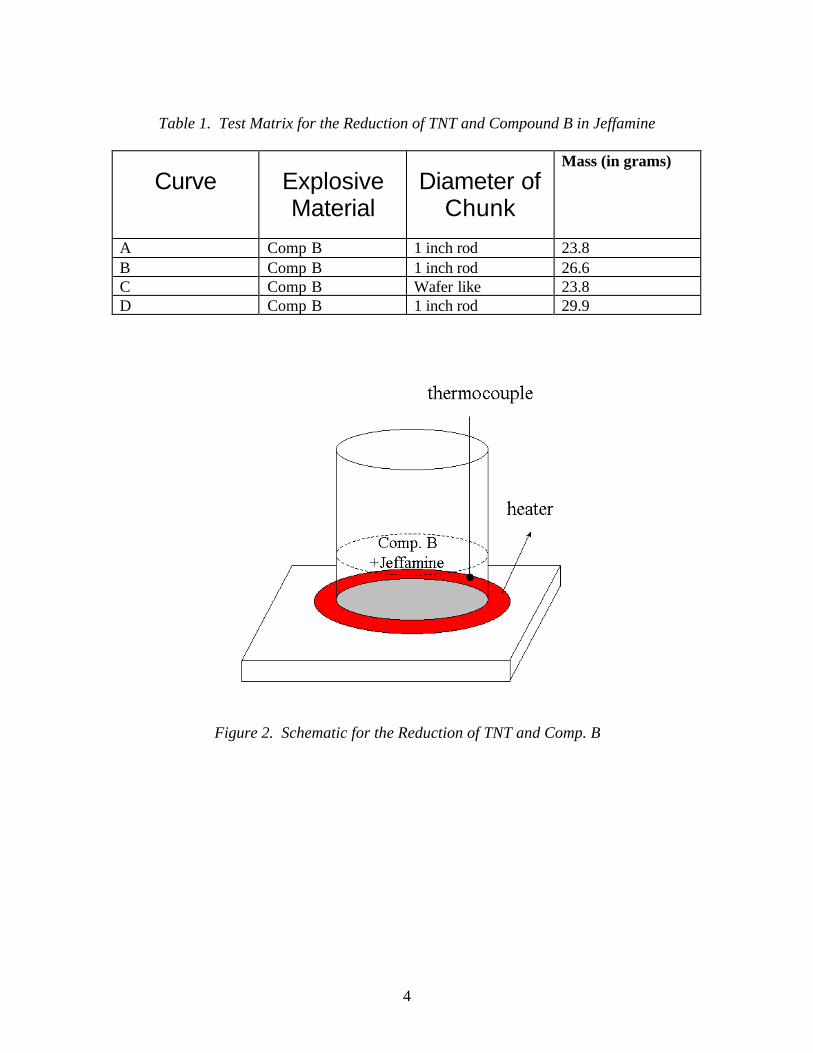
4
Table 1. Test Matrix for the Reduction of TNT and Compound B in Jeffamine
Curve ExplosiveMaterial
Diameter ofChunk
Mass (in grams)
A Comp B 1 inch rod 23.8B Comp B 1 inch rod 26.6C Comp B Wafer like 23.8D Comp B 1 inch rod 29.9
Figure 2. Schematic for the Reduction of TNT and Comp. B
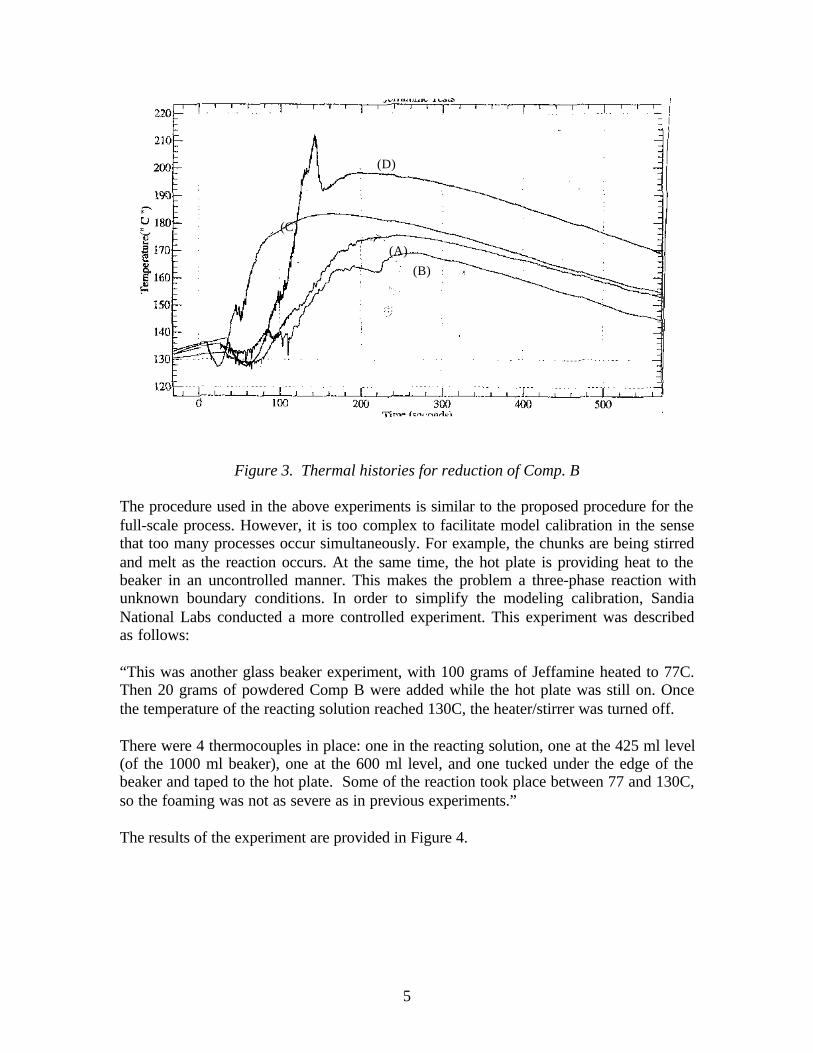
5
Figure 3. Thermal histories for reduction of Comp. B
The procedure used in the above experiments is similar to the proposed procedure for thefull-scale process. However, it is too complex to facilitate model calibration in the sensethat too many processes occur simultaneously. For example, the chunks are being stirredand melt as the reaction occurs. At the same time, the hot plate is providing heat to thebeaker in an uncontrolled manner. This makes the problem a three-phase reaction withunknown boundary conditions. In order to simplify the modeling calibration, SandiaNational Labs conducted a more controlled experiment. This experiment was describedas follows:
“This was another glass beaker experiment, with 100 grams of Jeffamine heated to 77C.Then 20 grams of powdered Comp B were added while the hot plate was still on. Oncethe temperature of the reacting solution reached 130C, the heater/stirrer was turned off.
There were 4 thermocouples in place: one in the reacting solution, one at the 425 ml level(of the 1000 ml beaker), one at the 600 ml level, and one tucked under the edge of thebeaker and taped to the hot plate. Some of the reaction took place between 77 and 130C,so the foaming was not as severe as in previous experiments.”
The results of the experiment are provided in Figure 4.
(C)
(D)
(A)
(B)

6
Figure 4. Thermal Histories for Reduction of Comp. B Using a Slow Heating Process
4.0 DESCRIPTION OF THE NUMERICAL CODE AND PHYSICALMODELS
The foundation for the model is the general purpose, commercial computational fluiddynamics code, CFD-ACE, which is a transient, three-dimensional, Navier-Stokes codecapable of simulating multi-species transport, heat transfer (including thermal radiation,fully coupled gas-phase and surface chemistry for conventional chemical vapordeposition (CVD) reactors. The CFD-ACE package is a very flexible code, that iscoupled with preprocessing and post-processing software (CFD-GEOM and CFD-VIEW)that make it relatively straightforward to set up models for complex geometries andanalyze the results.
4.1 Basic Features of CFD-ACE Code
The governing equations that are solved by CFD-ACE are:
Mass: 0t
=ρ⋅∇+∂ρ∂ u (1)
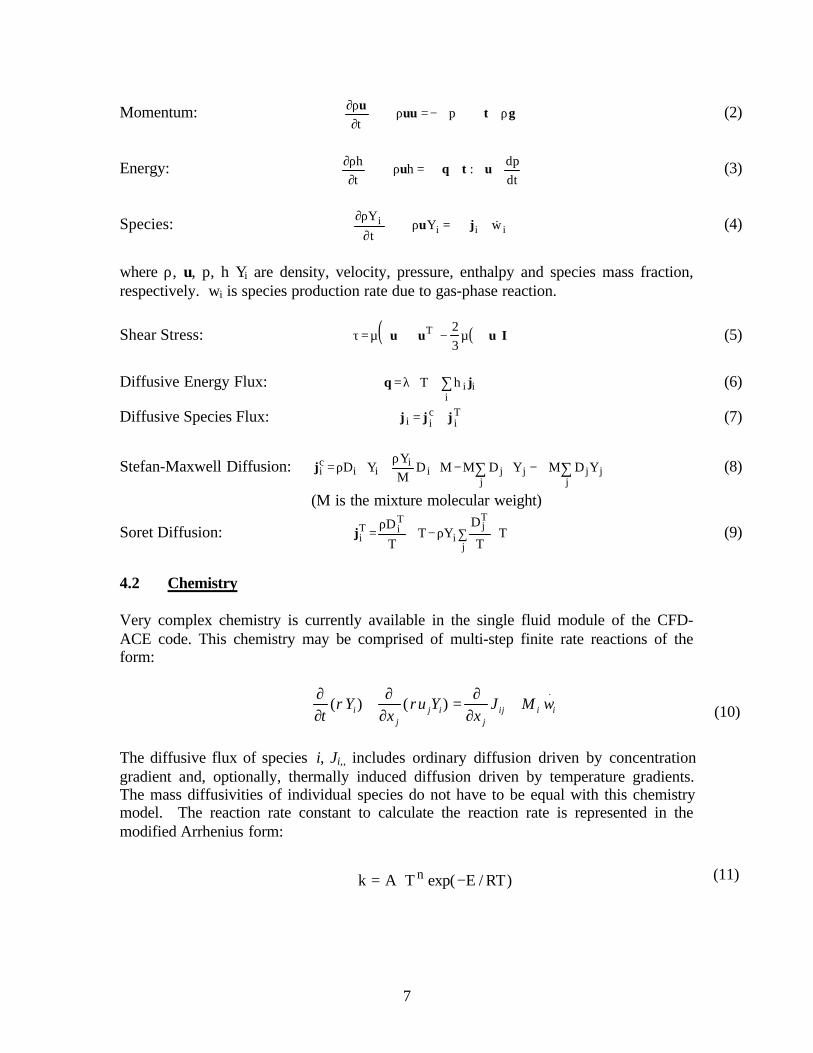
7
Momentum: guuu ρ+⋅∇+∇−=ρ⋅∇+∂ρ∂ τpt
(2)
Energy:dtdp:h
th +∇+⋅∇=ρ⋅∇+
∂ρ∂ uqu τ (3)
Species: iiii wY
tY &+⋅∇=ρ⋅∇+
∂ρ∂
ju (4)
where ρ, u, p, h Yi are density, velocity, pressure, enthalpy and species mass fraction,respectively. wi is species production rate due to gas-phase reaction.
Shear Stress: ( ) ( )Iuuu ⋅∇µ−∇+∇µ=τ32T (5)
Diffusive Energy Flux: ii
ihT jq ∑+∇λ= (6)
Diffusive Species Flux: Ti
cii jjj += (7)
Stefan-Maxwell Diffusion: ∑ ∑∇−∇−∇ρ
+∇ρ=j j
jjjjii
iici YDMYDMMD
MY
YDj (8)
(M is the mixture molecular weight)
Soret Diffusion: TT
DYT
TD
j
Tj
i
TiT
i ∇∑ρ−∇ρ
=j (9)
4.2 Chemistry
Very complex chemistry is currently available in the single fluid module of the CFD-ACE code. This chemistry may be comprised of multi-step finite rate reactions of theform:
The diffusive flux of species i, Ji,, includes ordinary diffusion driven by concentrationgradient and, optionally, thermally induced diffusion driven by temperature gradients.The mass diffusivities of individual species do not have to be equal with this chemistrymodel. The reaction rate constant to calculate the reaction rate is represented in themodified Arrhenius form:
.
)()( iiijj
ijj
i wMJx
Yux
Yt
+∂∂
=∂∂
+∂∂
ρρ
)RT/Eexp(TAk n −⋅=
(10)
(11)
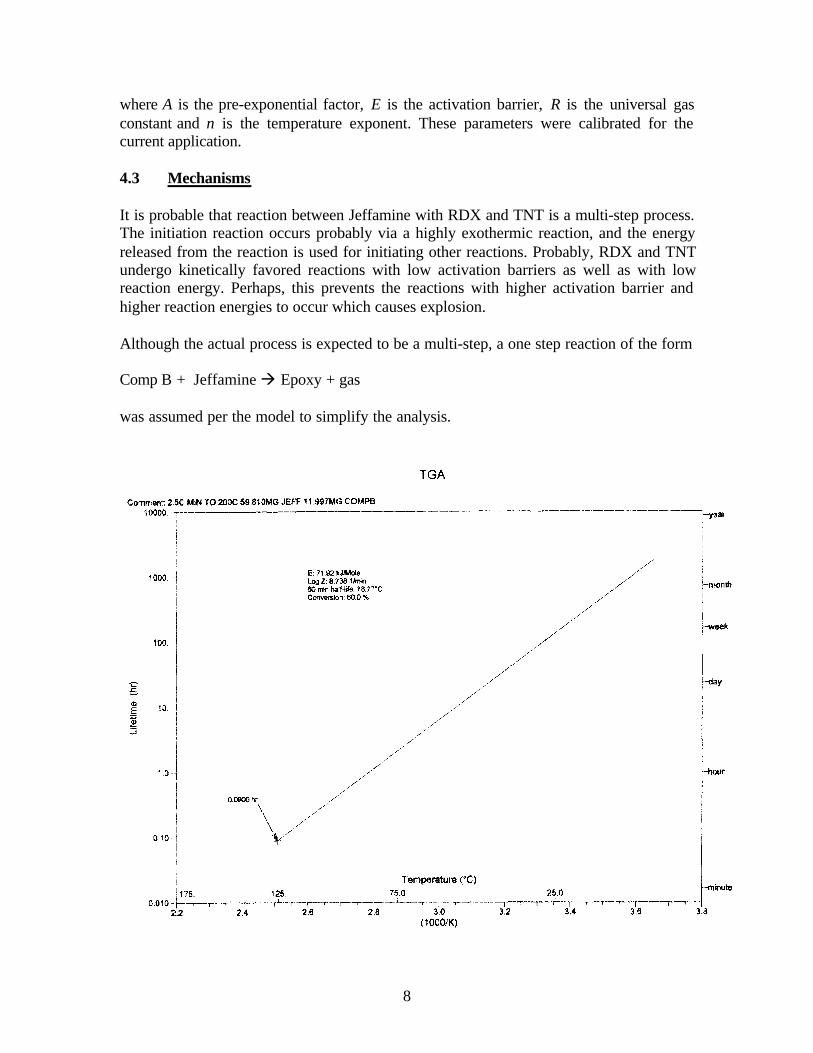
8
where A is the pre-exponential factor, E is the activation barrier, R is the universal gasconstant and n is the temperature exponent. These parameters were calibrated for thecurrent application.
4.3 Mechanisms
It is probable that reaction between Jeffamine with RDX and TNT is a multi-step process.The initiation reaction occurs probably via a highly exothermic reaction, and the energyreleased from the reaction is used for initiating other reactions. Probably, RDX and TNTundergo kinetically favored reactions with low activation barriers as well as with lowreaction energy. Perhaps, this prevents the reactions with higher activation barrier andhigher reaction energies to occur which causes explosion.
Although the actual process is expected to be a multi-step, a one step reaction of the form
Comp B + Jeffamine à Epoxy + gas
was assumed per the model to simplify the analysis.
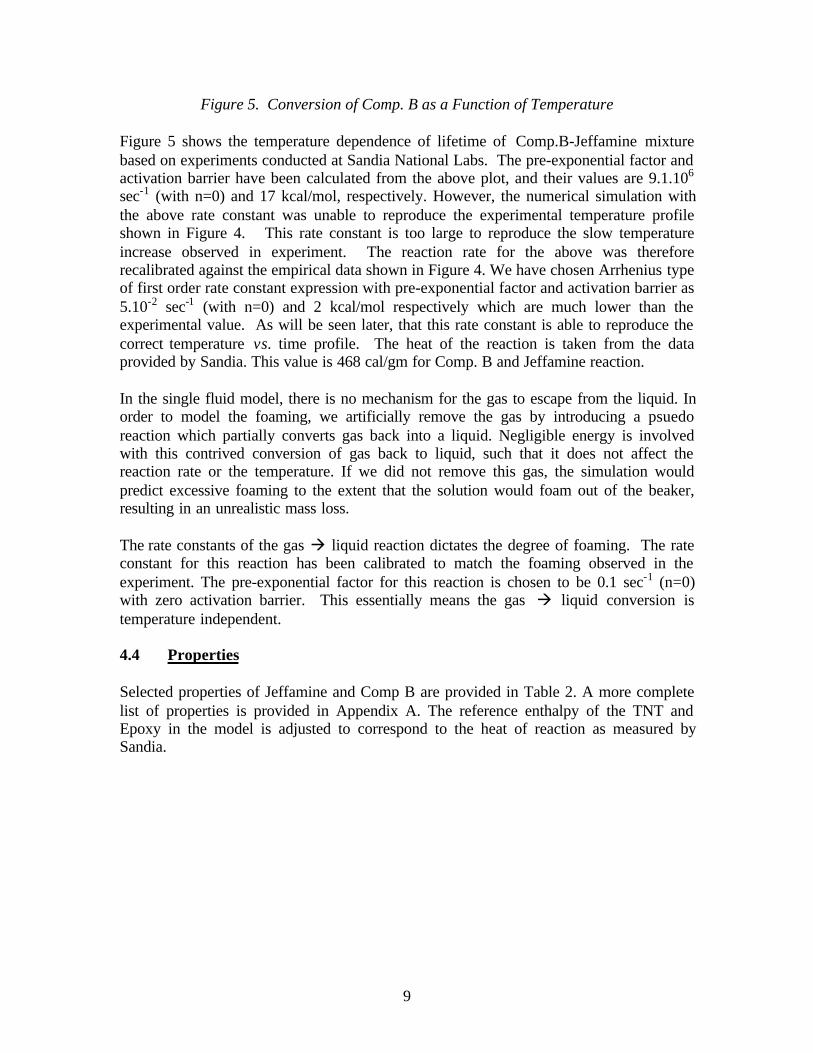
9
Figure 5. Conversion of Comp. B as a Function of Temperature
Figure 5 shows the temperature dependence of lifetime of Comp.B-Jeffamine mixturebased on experiments conducted at Sandia National Labs. The pre-exponential factor andactivation barrier have been calculated from the above plot, and their values are 9.1.106
sec-1 (with n=0) and 17 kcal/mol, respectively. However, the numerical simulation withthe above rate constant was unable to reproduce the experimental temperature profileshown in Figure 4. This rate constant is too large to reproduce the slow temperatureincrease observed in experiment. The reaction rate for the above was thereforerecalibrated against the empirical data shown in Figure 4. We have chosen Arrhenius typeof first order rate constant expression with pre-exponential factor and activation barrier as5.10-2 sec-1 (with n=0) and 2 kcal/mol respectively which are much lower than theexperimental value. As will be seen later, that this rate constant is able to reproduce thecorrect temperature vs. time profile. The heat of the reaction is taken from the dataprovided by Sandia. This value is 468 cal/gm for Comp. B and Jeffamine reaction.
In the single fluid model, there is no mechanism for the gas to escape from the liquid. Inorder to model the foaming, we artificially remove the gas by introducing a psuedoreaction which partially converts gas back into a liquid. Negligible energy is involvedwith this contrived conversion of gas back to liquid, such that it does not affect thereaction rate or the temperature. If we did not remove this gas, the simulation wouldpredict excessive foaming to the extent that the solution would foam out of the beaker,resulting in an unrealistic mass loss.
The rate constants of the gas à liquid reaction dictates the degree of foaming. The rateconstant for this reaction has been calibrated to match the foaming observed in theexperiment. The pre-exponential factor for this reaction is chosen to be 0.1 sec-1 (n=0)with zero activation barrier. This essentially means the gas à liquid conversion istemperature independent.
4.4 Properties
Selected properties of Jeffamine and Comp B are provided in Table 2. A more completelist of properties is provided in Appendix A. The reference enthalpy of the TNT andEpoxy in the model is adjusted to correspond to the heat of reaction as measured bySandia.

10
Table 2. Material Properties (Courtesy of Sandia National Laboratories)
Material Density gm/cc Viscosity (cps) Density gm/cc ConductivityCal/sec/cm/oC
Jeffamine 0.981 70 at 25C 0.981 4.70.10-4
Compound B 1.65 11200 at 25C*25 at 130C*
1.65 7.68.10-4
*viscosity for mixture of Comp. B and Jeffamine
Special user-subroutines were created to compute the average density and conductivity ofthe fluid mixture as a function of the individual properties of the reactants and products,listed in Table 2. The formulas used are as follows:
Density:
∑=
iiY ρρ
1
where Yi and ρi are the mass fraction and density of the ith species in the mixture.
Conductivity:
iiYkk ∑=
where ki are the thermal conductivities of the ith specie in the mixture.
Since the density of the fluid is a function of the gas volume, production of gas due toreaction significantly reduces the average fluid density, causing foaming and buoyancydriven flow. This foaming action reduces the effective conductivity of the fluid,increasing the potential for overheating of the reaction. The inclusion of mixtureproperties in the model enables the use of the code to analyze these physical effects.
11
4.4 Model Assumptions
The current model has the following Assumptions:
q Single Fluidq Simplified One-step Mechanismq Calibrated Ratesq Pre-melted explosives
The limitation of the single fluid approach is that it cannot model the rise of bubblesthrough the liquid. Instead, it considers the combination of liquid and gas as foam withcommon velocities. The simplified one-step mechanism treats the reaction as an averagedprocess, when in fact, multiple reactions are occurring. Given the assumed one-stepreaction mechanism, the rates of the reaction were calibrated using empirical data.
Another assumption used in the model is that the explosives have already melted prior tothe onset of reactions. Clearly, this is not the case for some of the chunk experiments.However, it does represent a “worst-case” scenario, and considering that the meltingtemperature of Comp B is 80C, is most likely a good assumption for the powder andflake experiments.
It is recommended that these assumptions be improved upon. However, they do notinvalidate the conclusion of this report.
5. WORK ACCOMPLISHED
The original tasks, as listed in the proposal are
q Link the CFD-ACE+ Two Fluid/Chemistry Modulesq Conduct Literature Search of Jeffamine -RDX /TNT
Mechanismsq Create a Model of the Sandia Test and Prototype Reactorsq Validate with Sandia experimental measurementsq Documentation
All of these tasks were completed, as planned, with the exception that task one wasmodified such that a single fluid model was adapted to model the chemical reaction andfluid dynamics of the process. The work accomplished under these tasks is described indetail below.
5.1 Adapt the CFD-ACE+ Single Fluid/Chemistry Modules
The Chemistry module in CFD-ACE was adapted to simulate multi-step chemistry,including the formation of a gas phase in the liquid. In this simulation, single-phase
12
model with chemistry has been used. Within this framework, liquid is assumed to be aincompressible gas, but the properties of the liquid have been used (such as density,thermal conductivity, molecular weight). Two user subroutines have been written inorder to perform this task. They are provided in the Appendix B.
5.2 Conduct Literature Search of Jeffamine -RDX /TNT Mechanisms
No literature data were found for the reaction mechanism between RDX/TNT withJeffamine. This includes the order of reaction, reaction rate constants of every reactionpathways as a function of temperature. We therefore decided to calibrate the rateconstant assuming that the entire process happens in one step. We preferred to use one-step reaction mechanism as opposed to multi-step. Number of unknown parameters inthe multi-step mechanism would be large, and is therefore difficult to calibrate. In theone-step mechanism there are two unknown parameters (pre-exponential factor and theactivation barrier) to be calibrated, and therefore relatively easier.
5.3 Create a Model of the Sandia Test and Prototype Reactors
Two-dimensional models of both the laboratory beaker experiment and the full scalereactor (four times the size of the laboratory beaker) were created. Figure 6 shows themodel of the beaker reactor, with sample initial conditions and boundary conditions. Theboundary conditions were set up to mimic the experiments as shown in Figure 4. Forexample, the boundary condition of the bottom wall of the beaker was set to the measuredtemperature profile of the hot plate heater element. The initial temperature of themixture solution was set to 353K, which was the Jeffamine temperature when the CompB was added.
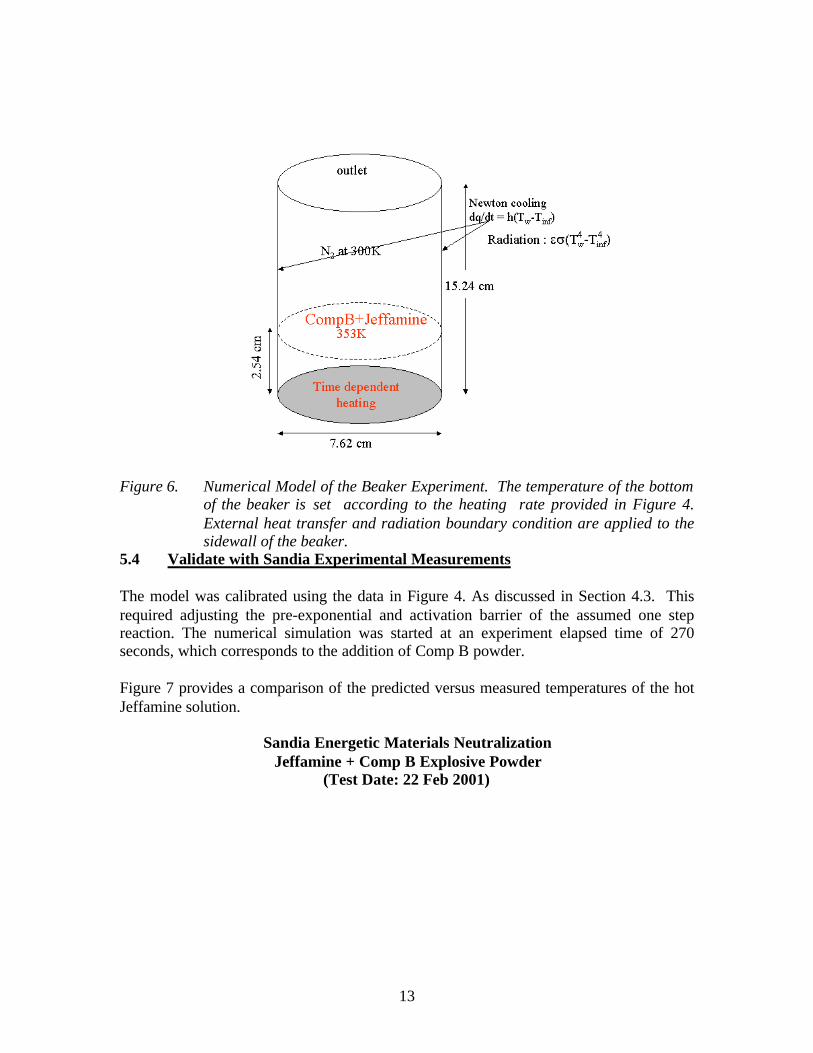
13
Figure 6. Numerical Model of the Beaker Experiment. The temperature of the bottomof the beaker is set according to the heating rate provided in Figure 4.External heat transfer and radiation boundary condition are applied to thesidewall of the beaker.
5.4 Validate with Sandia Experimental Measurements
The model was calibrated using the data in Figure 4. As discussed in Section 4.3. Thisrequired adjusting the pre-exponential and activation barrier of the assumed one stepreaction. The numerical simulation was started at an experiment elapsed time of 270seconds, which corresponds to the addition of Comp B powder.
Figure 7 provides a comparison of the predicted versus measured temperatures of the hotJeffamine solution.
Sandia Energetic Materials NeutralizationJeffamine + Comp B Explosive Powder
(Test Date: 22 Feb 2001)
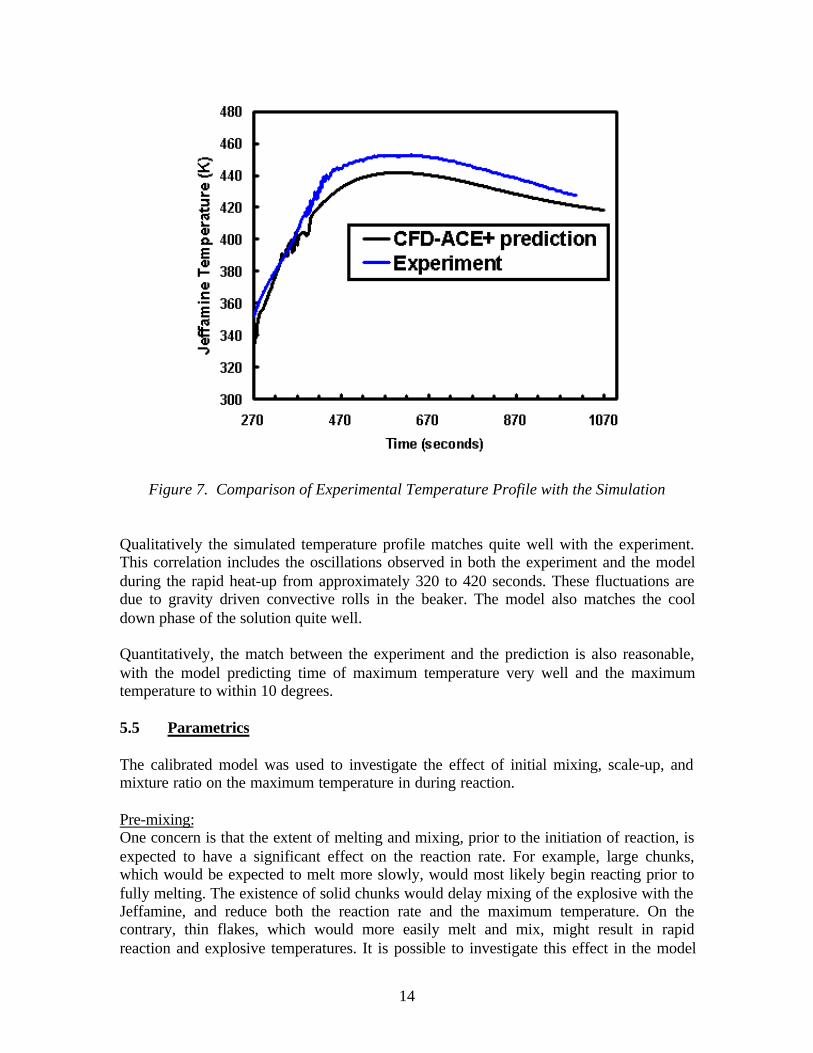
14
Figure 7. Comparison of Experimental Temperature Profile with the Simulation
Qualitatively the simulated temperature profile matches quite well with the experiment.This correlation includes the oscillations observed in both the experiment and the modelduring the rapid heat-up from approximately 320 to 420 seconds. These fluctuations aredue to gravity driven convective rolls in the beaker. The model also matches the cooldown phase of the solution quite well.
Quantitatively, the match between the experiment and the prediction is also reasonable,with the model predicting time of maximum temperature very well and the maximumtemperature to within 10 degrees.
5.5 Parametrics
The calibrated model was used to investigate the effect of initial mixing, scale-up, andmixture ratio on the maximum temperature in during reaction.
Pre-mixing:One concern is that the extent of melting and mixing, prior to the initiation of reaction, isexpected to have a significant effect on the reaction rate. For example, large chunks,which would be expected to melt more slowly, would most likely begin reacting prior tofully melting. The existence of solid chunks would delay mixing of the explosive with theJeffamine, and reduce both the reaction rate and the maximum temperature. On thecontrary, thin flakes, which would more easily melt and mix, might result in rapidreaction and explosive temperatures. It is possible to investigate this effect in the model
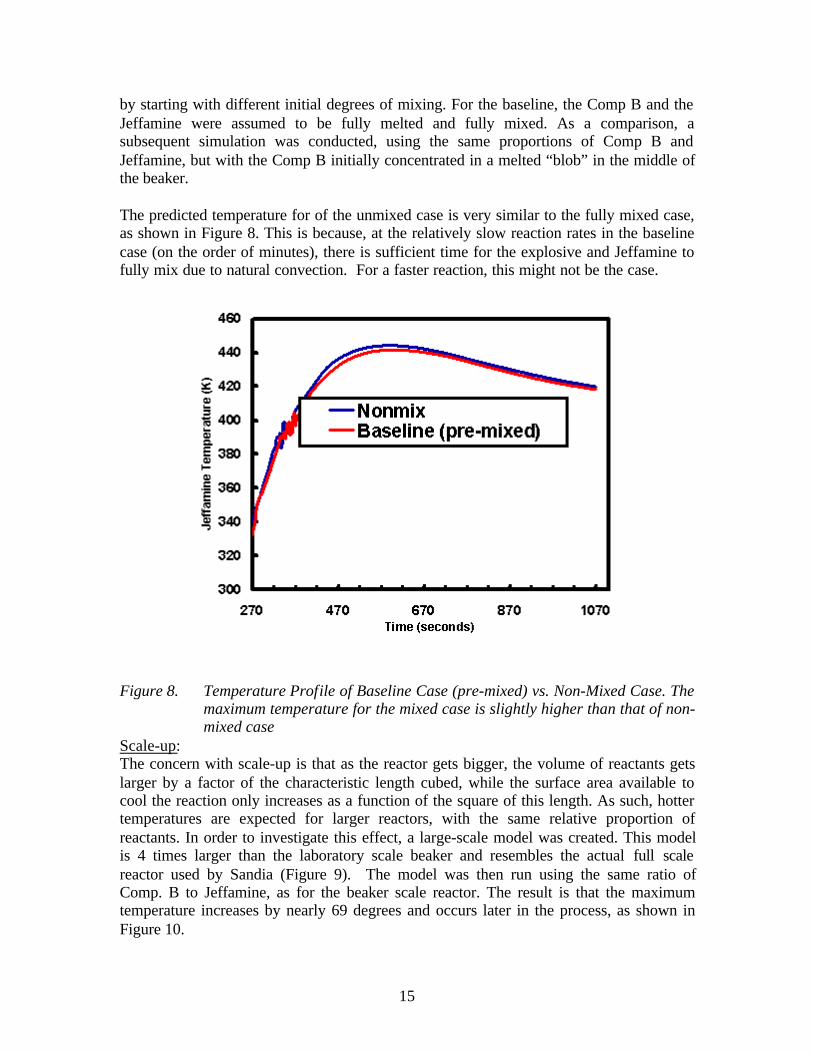
15
by starting with different initial degrees of mixing. For the baseline, the Comp B and theJeffamine were assumed to be fully melted and fully mixed. As a comparison, asubsequent simulation was conducted, using the same proportions of Comp B andJeffamine, but with the Comp B initially concentrated in a melted “blob” in the middle ofthe beaker.
The predicted temperature for of the unmixed case is very similar to the fully mixed case,as shown in Figure 8. This is because, at the relatively slow reaction rates in the baselinecase (on the order of minutes), there is sufficient time for the explosive and Jeffamine tofully mix due to natural convection. For a faster reaction, this might not be the case.
Figure 8. Temperature Profile of Baseline Case (pre-mixed) vs. Non-Mixed Case. Themaximum temperature for the mixed case is slightly higher than that of non-mixed case
Scale-up:The concern with scale-up is that as the reactor gets bigger, the volume of reactants getslarger by a factor of the characteristic length cubed, while the surface area available tocool the reaction only increases as a function of the square of this length. As such, hottertemperatures are expected for larger reactors, with the same relative proportion ofreactants. In order to investigate this effect, a large-scale model was created. This modelis 4 times larger than the laboratory scale beaker and resembles the actual full scalereactor used by Sandia (Figure 9). The model was then run using the same ratio ofComp. B to Jeffamine, as for the beaker scale reactor. The result is that the maximumtemperature increases by nearly 69 degrees and occurs later in the process, as shown inFigure 10.
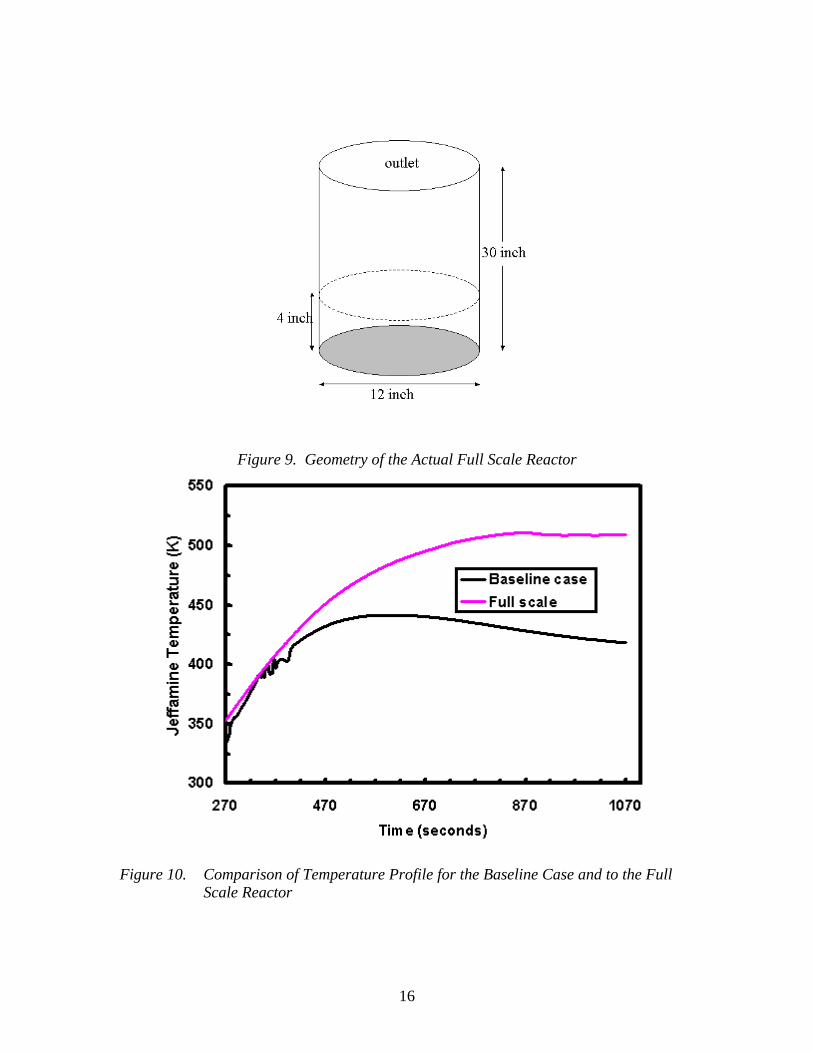
16
Figure 9. Geometry of the Actual Full Scale Reactor
Figure 10. Comparison of Temperature Profile for the Baseline Case and to the FullScale Reactor
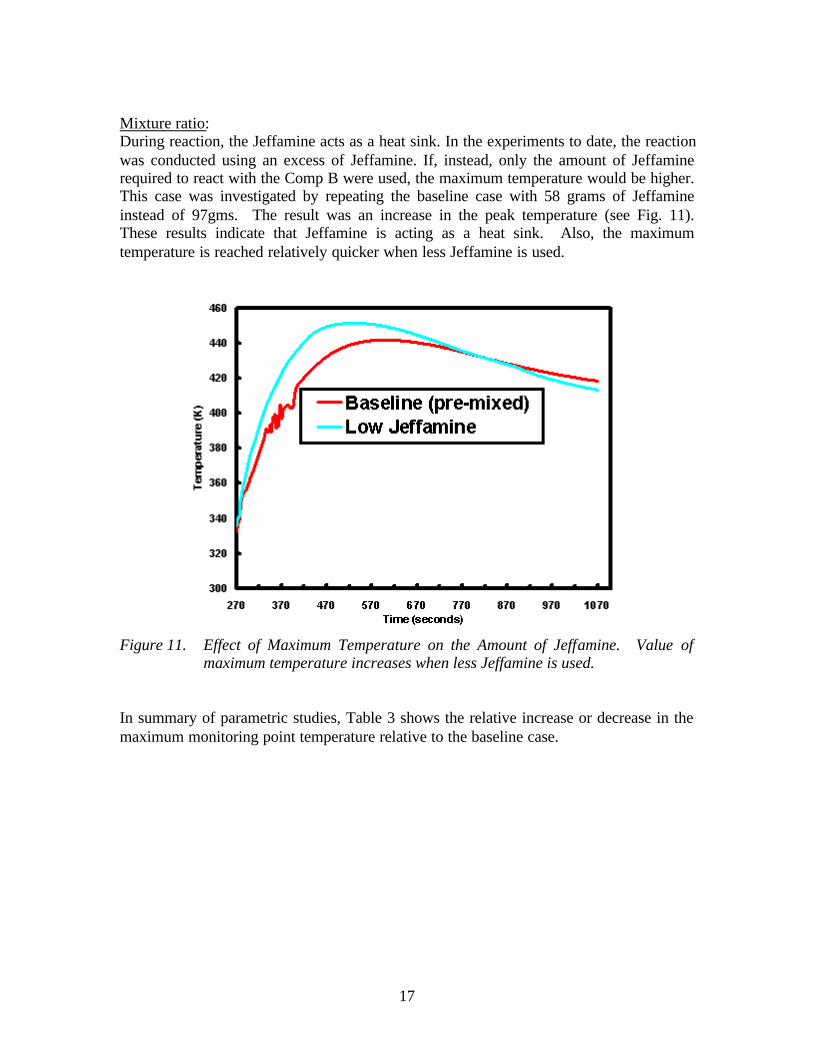
17
Mixture ratio:During reaction, the Jeffamine acts as a heat sink. In the experiments to date, the reactionwas conducted using an excess of Jeffamine. If, instead, only the amount of Jeffaminerequired to react with the Comp B were used, the maximum temperature would be higher.This case was investigated by repeating the baseline case with 58 grams of Jeffamineinstead of 97gms. The result was an increase in the peak temperature (see Fig. 11).These results indicate that Jeffamine is acting as a heat sink. Also, the maximumtemperature is reached relatively quicker when less Jeffamine is used.
Figure 11. Effect of Maximum Temperature on the Amount of Jeffamine. Value ofmaximum temperature increases when less Jeffamine is used.
In summary of parametric studies, Table 3 shows the relative increase or decrease in themaximum monitoring point temperature relative to the baseline case.
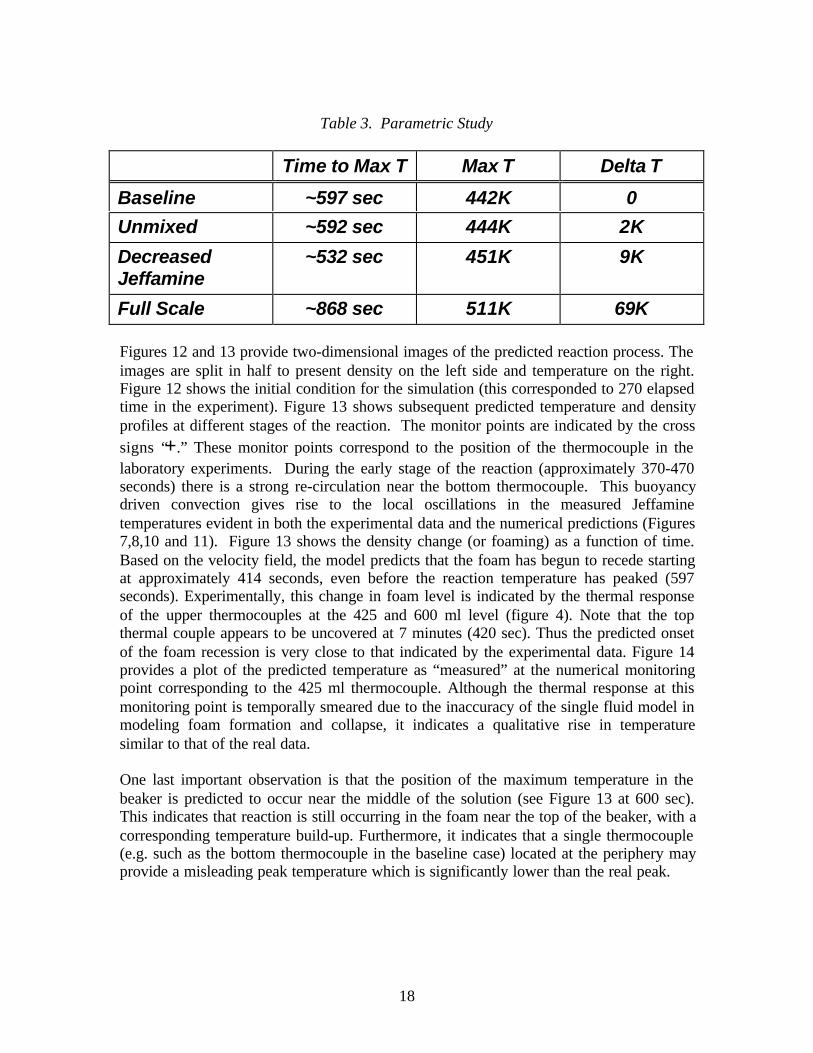
18
Table 3. Parametric Study
Time to Max T Max T Delta T
Baseline ~597 sec 442K 0
Unmixed ~592 sec 444K 2K
DecreasedJeffamine
~532 sec 451K 9K
Full Scale ~868 sec 511K 69K
Figures 12 and 13 provide two-dimensional images of the predicted reaction process. Theimages are split in half to present density on the left side and temperature on the right.Figure 12 shows the initial condition for the simulation (this corresponded to 270 elapsedtime in the experiment). Figure 13 shows subsequent predicted temperature and densityprofiles at different stages of the reaction. The monitor points are indicated by the crosssigns “+.” These monitor points correspond to the position of the thermocouple in thelaboratory experiments. During the early stage of the reaction (approximately 370-470seconds) there is a strong re-circulation near the bottom thermocouple. This buoyancydriven convection gives rise to the local oscillations in the measured Jeffaminetemperatures evident in both the experimental data and the numerical predictions (Figures7,8,10 and 11). Figure 13 shows the density change (or foaming) as a function of time.Based on the velocity field, the model predicts that the foam has begun to recede startingat approximately 414 seconds, even before the reaction temperature has peaked (597seconds). Experimentally, this change in foam level is indicated by the thermal responseof the upper thermocouples at the 425 and 600 ml level (figure 4). Note that the topthermal couple appears to be uncovered at 7 minutes (420 sec). Thus the predicted onsetof the foam recession is very close to that indicated by the experimental data. Figure 14provides a plot of the predicted temperature as “measured” at the numerical monitoringpoint corresponding to the 425 ml thermocouple. Although the thermal response at thismonitoring point is temporally smeared due to the inaccuracy of the single fluid model inmodeling foam formation and collapse, it indicates a qualitative rise in temperaturesimilar to that of the real data.
One last important observation is that the position of the maximum temperature in thebeaker is predicted to occur near the middle of the solution (see Figure 13 at 600 sec).This indicates that reaction is still occurring in the foam near the top of the beaker, with acorresponding temperature build-up. Furthermore, it indicates that a single thermocouple(e.g. such as the bottom thermocouple in the baseline case) located at the periphery mayprovide a misleading peak temperature which is significantly lower than the real peak.
19
Figure 12. Initial Conditions for the Simulation. Density and temperature areexpressed in kg/m3 and Kelvin.
Figure 13. Temperature and Density Profile at Different Stages of the Reaction.Temperature and density are expressed in Kelvin and kg/m3, respectively.The “+”signs indicate the positions of the thermocouples.
Density(kg/m3)
270 Seconds (Initial Condition)
Temp (K)
20
Figure 14. Temperature Profile at the 425 ml Llevel of the Beaker Compared to that ofJeffamine Solution
7. RECOMMENDATIONS AND FUTURE TASKS
Based on the above simulations, the following recommendations are made:
When scaling up, reduce the proportion of explosive to Jeffamine such that the increasein the quantity of explosive mass is directly proportional to the increase in surface area ofthe container.
Since Jeffamine acts as heat sink, a low proportion of Jeffamine may increase thetemperature of the reaction. A higher proportion of Jeffamine is therefore recommended.
For a slow process (e.g. on the order of minutes), pre-mixing of the explosive andJeffamine is not predicted to make much difference in the maximum temperature, sincenatural convection has time to mix the reactants during the reaction process. However,whether the materials are pre-mixed or not would be expected to influence the reactiontime and the corresponding peak temperature for faster reaction times.
The hottest temperatures are predicted to occur in the center of the solution.Consequently, care should be exercised when adding addition reactants to the top of thereactor. Fresh material will be in contact with fluid at much higher temperatures thanindicated by a thermocouple positioned near the bottom of the tank. Also, the mixershould be designed to reduce thermal stratification and the thermocouple(s) positioned torecord the true maximum.
Predicted Temperature at Two Thermocouple Locations

21
We expect the reaction occurring within the beaker is a complex, multi-step process asopposed to the simple one-step reaction assumed in the model. In order to performsimulation with experimental rate constant, the rate constants measurements of all stepsshould be performed. In addition, a two fluid model with chemistry would be requiredto more accurately predict the foaming action associated with this process.

22
APPENDIX A: Properties
Temperature Variation of Viscosity
Viscosity Tests of Liquid By-Products
1
10
100
1000
10000
100000
0 50 100 150 200
Temperature (C)
Vis
cosi
ty (c
p)
Jeffamine & Comp B (15% wt)Jeffamine & Comp B (20% wt)Jeffamine & Comp B (25% wt)
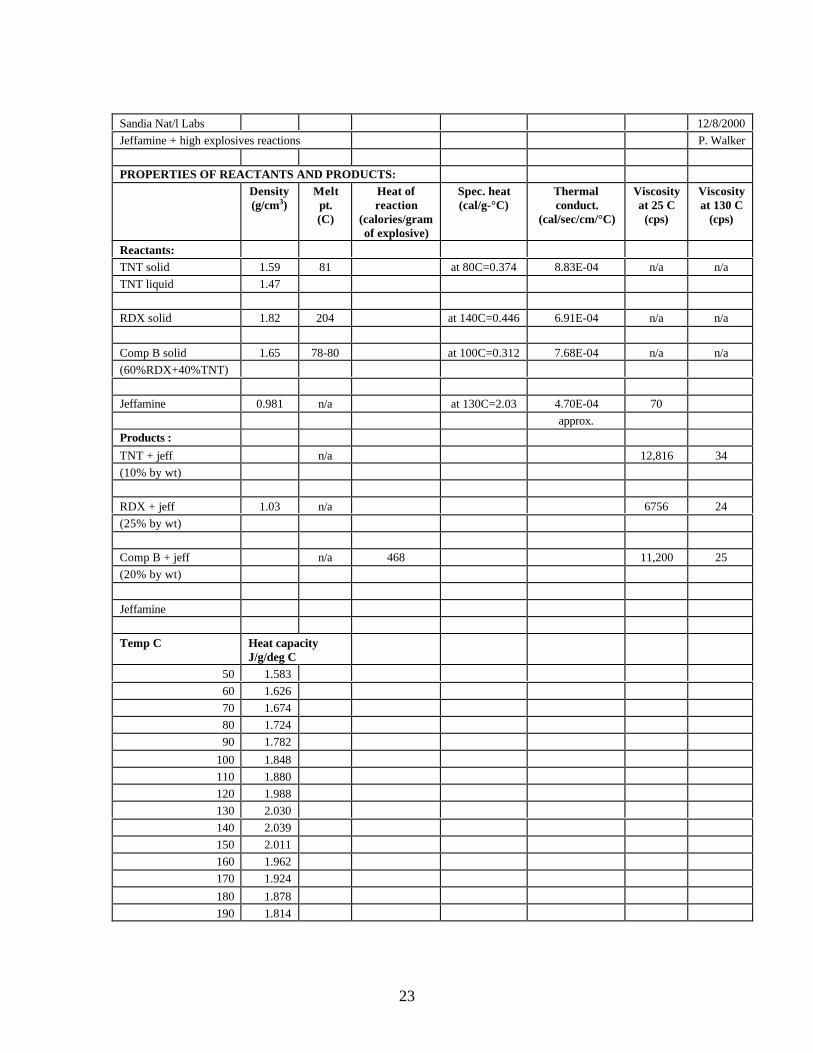
23
Sandia Nat/l Labs 12/8/2000Jeffamine + high explosives reactions P. Walker
PROPERTIES OF REACTANTS AND PRODUCTS:Density(g/cm3)
Meltpt.(C)
Heat ofreaction
(calories/gramof explosive)
Spec. heat(cal/g-°C)
Thermalconduct.
(cal/sec/cm/°C)
Viscosityat 25 C(cps)
Viscosityat 130 C
(cps)
Reactants:TNT solid 1.59 81 at 80C=0.374 8.83E-04 n/a n/aTNT liquid 1.47
RDX solid 1.82 204 at 140C=0.446 6.91E-04 n/a n/a
Comp B solid 1.65 78-80 at 100C=0.312 7.68E-04 n/a n/a(60%RDX+40%TNT)
Jeffamine 0.981 n/a at 130C=2.03 4.70E-04 70approx.
Products :TNT + jeff n/a 12,816 34(10% by wt)
RDX + jeff 1.03 n/a 6756 24(25% by wt)
Comp B + jeff n/a 468 11,200 25(20% by wt)
Jeffamine
Temp C Heat capacityJ/g/deg C
50 1.58360 1.62670 1.67480 1.72490 1.782
100 1.848110 1.880120 1.988130 2.030140 2.039150 2.011160 1.962170 1.924180 1.878190 1.814

24
APPENDIX B
User Subroutines!*********************************************************************** MODULE cfdrc_user!*********************************************************************** IMPLICIT NONE
INTEGER, PARAMETER :: int_p = SELECTED_INT_KIND(8)
INTEGER, PARAMETER :: string_length = 80
INTEGER, PARAMETER :: real_p = SELECTED_REAL_KIND(8)
INTEGER, PARAMETER :: XDIR = 1, YDIR = 2, ZDIR = 3
! Utility parameters. REAL(real_p) , PARAMETER :: zero = 0.0d0, one = 1.0d0, two = 2.0d0, & three = 3.d0, four = 4.0d0, & pi = 3.1415926535898d0
LOGICAL:: first_time = .TRUE., error,first_time1 = .TRUE.
INTEGER(int_p) :: ind_SANNO2=0, ind_TNT=0, ind_TNTB=0, & ind_N2=0, ind_JEFF=0,ind_VOL=0,ncells=0,ind_DENS=0
REAL(real_p) :: sum_first=0.0! Declare global variables! USER CODE BEGIN
! USER CODE END
END MODULE cfdrc_user
SUBROUTINE ucond(iopt, vcindex)!***********************************************************************! copyright (c) 1998 cfd research corp. all rights reserved.!! purpose : set local conductivity!! iopt: option for ways of specifying conductivity!! This routine is called on a cell-by-cell basis for each user-defined! conductivity for each zone or volume condition where conductivity is
25
! specified as user defined.!! Use get_active_cell_index(ic,error) to get the current cell index in! the volume condition.!! One may use get_value_one_cell to obtain values of various dependent! variables such as temperature, velocity etc.!! Use set_value_one_cell to set the value for conductivity.!!-----------------------------------------------------------------------
! Include required global variables declared in cfdrc_user module. USE cfdrc_user
IMPLICIT NONE REAL(real_p) , PARAMETER :: cond_SANNO2=0.0236,cond_TNT=0.37d0, & cond_JEFF=0.1974d0, cond_N2=0.0236, & cond_TNTB=0.1974d0 INTEGER(int_p), INTENT(IN) :: iopt, vcindex
REAL(real_p) :: SANNO2_mass_f, TNT_mass_f, TNTB_mass_f,N2_mass_f, & cond_cell, JEFF_mass_f INTEGER(int_p) :: ind_COND
CHARACTER(len = string_length) :: var_name
INTEGER(int_p) :: ic
! Declare required local variables here.! USER CODE BEGIN
! USER CODE END
!-----------------------------------------------------------------------
[email protected] Start writing code here.! USER CODE BEGIN
IF (first_time) THEN
first_time = .FALSE. CALL get_cells(ncells,error)
26
var_name = 'SANNO2' CALL get_var_index(var_name, ind_SANNO2, error)
var_name = 'TNTB' CALL get_var_index(var_name, ind_TNTB, error)
var_name = 'TNT' CALL get_var_index(var_name, ind_TNT, error)
var_name = 'JEFF' CALL get_var_index(var_name, ind_JEFF, error)
var_name = 'N2' CALL get_var_index(var_name, ind_N2, error)
var_name = 'THERMAL_CONDUCTIVITY' CALL get_var_index(var_name, ind_COND, error)
var_name = 'VOLUME' CALL get_var_index(var_name, ind_VOL, error)
ENDIF
CALL get_active_cell_index(ic,error)
CALL get_value_one_cell (ind_SANNO2, ic, SANNO2_mass_f, error)
CALL get_value_one_cell (ind_TNT, ic, TNT_mass_f, error)
CALL get_value_one_cell (ind_JEFF, ic, JEFF_mass_f, error)
CALL get_value_one_cell (ind_TNTB, ic, TNTB_mass_f, error)
CALL get_value_one_cell (ind_N2, ic, N2_mass_f, error)
cond_cell = SANNO2_mass_f * cond_SANNO2 + TNT_mass_f*cond_TNT & + TNTB_mass_f * cond_TNTB + N2_mass_f*cond_N2 & +JEFF_mass_f*cond_JEFF
CALL set_value_one_cell (ind_COND, ic, cond_cell, error)
27
! USER CODE END
RETURN END SUBROUTINE ucond
SUBROUTINE udens(iopt, vcindex)!***********************************************************************! copyright (c) 1998 cfd research corp. all rights reserved.!! purpose : set local density!! iopt: option for ways of specifying density!! This routine is called on a cell-by-cell basis for each user-defined! density for each zone or volume condition where density is specified! as user defined.!! Use get_active_cell_index(ic,error) to get the current cell index in! the volume condition.!! One may use get_value_one_cell to obtain values of various dependent! variables such as temperature, velocity etc.!! Use set_value_one_cell to set the value for density.!-----------------------------------------------------------------------
! Include required global variables declared in cfdrc_user module. USE cfdrc_user
IMPLICIT NONE
! Declare required local variables here.! USER CODE BEGIN
! USER CODE END
! REAL(real_p) :: den_TNT,den_JEFF, &! den_TNTB REAL(real_p) , PARAMETER :: den_TNT=1650.0d0,den_JEFF=981.0d0, & den_TNTB=981.0d0 INTEGER(int_p), INTENT(IN) :: iopt, vcindex
REAL(real_p) :: SANNO2_mass_f, TNT_mass_f, TNTB_mass_f,N2_mass_f, &

28
den_cell, JEFF_mass_f,den_SANNO2,den_N2,wt_SANNO2, & wt_N2,cell_T
INTEGER(int_p) :: ind_T CHARACTER(len = string_length) :: var_name
INTEGER(int_p) :: ic
IF (first_time1) THEN
first_time1 = .FALSE.
var_name = 'SANNO2' CALL get_var_index(var_name, ind_SANNO2, error)
CALL get_species_mol_wt(ind_SANNO2,wt_SANNO2,error)
var_name = 'TNTB' CALL get_var_index(var_name, ind_TNTB, error)
var_name = 'TNT' CALL get_var_index(var_name, ind_TNT, error)
var_name = 'JEFF' CALL get_var_index(var_name, ind_JEFF, error) var_name = 'N2' CALL get_var_index(var_name, ind_N2, error)
CALL get_species_mol_wt(ind_N2,wt_N2,error)
var_name = 'DENSITY' CALL get_var_index(var_name, ind_DENS, error)
var_name = 'T' call get_var_index(var_name,ind_T,error)
ENDIF
CALL get_active_cell_index(ic,error)
CALL get_value_one_cell (ind_SANNO2, ic, SANNO2_mass_f, error)
CALL get_value_one_cell (ind_TNT, ic, TNT_mass_f, error)
CALL get_value_one_cell (ind_JEFF, ic, JEFF_mass_f, error)
29
CALL get_value_one_cell (ind_TNTB, ic, TNTB_mass_f, error)
CALL get_value_one_cell (ind_N2, ic, N2_mass_f, error)
CALL get_value_one_cell (ind_T,ic,cell_T,error)
den_SANNO2 = 101300.0d0 * wt_SANNO2/(8314.0d0*cell_T) den_N2 = 101300.0d0 * wt_N2/(8314.0d0*cell_T)
den_cell = SANNO2_mass_f/den_SANNO2 + TNT_mass_f/den_TNT & + TNTB_mass_f/den_TNTB + N2_mass_f/den_N2 & +JEFF_mass_f/den_JEFF den_cell = 1.0d0/den_cell
CALL set_value_one_cell (ind_DENS, ic, den_cell, error)
RETURN END SUBROUTINE udens
SUBROUTINE uout(iflag)!***********************************************************************! copyright (c) 1998 cfd research corp. all rights reserved.!! purpose : for customized user output.!! iflag: flag indicating calling location.!! This routine is called 5 times at different instances of iterative! cycle indicated by iflag.!! iflag :! 0 - At the beginning (only for dtf reading calls, At this point! most of the other data may not be available.! users can get variable indices, and may be! external reading of files can be done with this! flag = 0)! 1 - At the beginning of RUN. (At this poin most of the boundary! conditions, properties are set. users! should be able to get cell or boundary! values for different variables.)! 2 - At the beginning of time step (only for transient problems).! 3 - At the end of each iteration.! 4 - At the end of each time step.(only for transient problems).! 5 - At the end of RUN.
30
!! One may use get_value_one_cell to get the values. To get the cell! indexes, user has to supply the x,y,z locations and use the! get_cell_index(vc_index,x,y,z,ic_global,error).!-----------------------------------------------------------------------
! Include required global variables declared in cfdrc_user module. USE cfdrc_user
IMPLICIT NONE
REAL(real_p) :: VOL,sum,den_cell,TNT_mass_f,timet,ratio,sum_vol,sum1 INTEGER(int_p), INTENT(IN) :: iflag INTEGER(int_p) :: i,user_iflag,time_step_no
!-----------------------------------------------------------------------
user_iflag = 4 if(iflag /= user_iflag) RETURN sum = 0.0d0 sum1 = 0.0d0 CALL get_time(timet,time_step_no,error) DO i=1,ncells CALL get_value_one_cell(ind_VOL,i,VOL,error) CALL get_value_one_cell(ind_TNT,i,TNT_mass_f,error) CALL get_value_one_cell(ind_DENS,i,den_cell,error)
sum = sum+TNT_mass_f*den_cell*VOL sum1 = sum1 + den_cell*VOL ENDDO IF(time_step_no == 1) sum_first = sum ratio = sum/sum_first write(10,*) timet, ratio,sum1
RETURN END SUBROUTINE uout

31
Distribution
1 MS-1452 Billy Marshall, 25521 MS-1453 Greg Scharrer1 MS-1454 Lloyd Bonzon1 MS-0953 Jim Rice1 MS-0521 Tom Cutchen1 MS-0457 John Stichman5 MS-1452 Pamela K. Walker, 25522 MS-1452 Thomas M. Massis, 25522 MS-1452 Robert T. Patton, 25525 MS-0389 M. Tadros, 160002 MS-0519 Steve Reber, 23481 MS-9018 Central Technical Files, 8945-12 MS 0899 Technical Library, 96161 MS 0612 Review & Approval Desk, 09612 for
DOE/OSTI