Embed Size (px)
Citation preview
SAF: Strategic Alignment Framework forMonitoring Organizations
Ernesto Damiani1, Fabio Mulazzani2, Barbara Russo2 and Giancarlo Succi2
1 Universita di Milano - Dipartimento di Tecnologie dell’InformazioneVia Bramante, 65 - Crema - Italy
[email protected] Libera Universita di Bolzano - Faculty of Computer Science
Piazza dei Domenicani, 3 - Bolzano/Bozen - Italy{fabio.mulazzani, barbara.russo, giancarlo.succi}@unibz.it
Abstract. Reaching a Strategic Alignment is a crucial aspect for any or-ganization. The alignment can be achieved by controlling, through mon-itoring probes, the coherency of the Business Processes with the relatedBusiness Strategy. In this paper we present SAF, a powerful frameworkfor those organizations that aim at a superior business performance andwant to keep monitored the organization’s alignment. SAF has been ap-plied to a real case study and it has also been compared with GQM+
Strategy [2] and Process Performance Indicators Monitoring Model [16].
Key words: Business Process Modeling, Business Strategy, StrategicAlignment, Process Monitoring, Workflow Probe, Alignment Framework.
1 Introduction
Any organization needs to be supported by an infrastructure IT in order to ac-complish its business mission [22]. The development and the adoption of an ITGovernance that orchestrates all the IT potentials can lead to superior perfor-mance of the organization. A crucial requirements for IT Governance is aligningor defining a set of operational goals and an operational management that allowthe mapping between the Business Strategy (BS) and the Business Processes(BPs), this is strategic alignment that is defined by Reich and Benbasat in [19]as the degree to which the IT mission, objectives, and plans support and aresupported by the business mission, objectives, and plans. In fact, according to[2] an organizational management system will not guarantee the organizationalsuccess unless the BS is translated into a set of operational goals and a quanti-tative business management.The manager issues of IT Governance related to strategic alignment are:
– Performance measurement - This is an activity that tracks and monitors:strategy implementation, project completion, resource usage, process perfor-mance and service delivery.
– Control and Accountability - This is about the existence and practicalapplication of a proper control and accountability system.

2 Ernesto Damiani, Fabio Mulazzani, Barbara Russo and Giancarlo Succi
In this paper we present a Strategic Alignment Framework (SAF) that combinesthe expressivity power of Jackson Problem Frames [12] together with standard-ized Object Management Group (OMG) ontology and modeling languages. Formeasuring the level of goal achievement in business processes, solutions able toconstantly monitor the workflow content and performance have to be deployedover it. Unfortunately, a methodology for realizing and representing the requiredmonitoring - including the instrumentation - does not exist yet [16]. SAF alsoprovides controls over the workflow for the BP performance, these are calledprobes. The framework presented has been compared with other two alignmentmodels as described in Section 4. SAF has also been applied over a well knownficticius case of a car rental company as initial validation (already described in[7]), and over a real case of an italian electric company.The paper is organized as follows. Section 2 provides an overview of the re-lated works on both alignment framework and on process monitoring. Section3 describes the framework. Section 4 describes the comparison with the relatedmodels. Section 5 presents the real case study applied to the framework. Section6 concludes the paper.
2 Related Works
There exists various techniques to verify the alignment between the three mainlevels of an organization: the strategy, the business processes, and the Infor-mation System (IS). In this section, we briefly summarize the literature on thestrategic alignment, on the goal modeling, and on the process monitoring.In [4] Bleistein et al. adopt i∗ - a goal modeling notation for information sys-tems requirements - [23] to represent the strategy and the context diagram fromJacksons Problem Frames to model the IT context of strategy achievement. Asstated in [21] the approach in [4] represents the business strategies and the ISdescription in the same model, and with the same formalism. Furthermore it re-lates BS and IS description through simple and mono-typed contribution links.One issue with this approach relates to the i∗ notation, which does not use theblack box/white box strategy and produces complex models when the numberof goals increases. Indeed the main difficulties with i∗ are that (i) it lacks of asystematic goal refinement mechanisms, and (ii) it has no goal-strategy couplingto help clarifying the multiple ways in which a goal can be achieved.In [11] is presented e3−V alue, a modeling notation for e-commerce systems. Itenables validation of requirements in terms of the system’s potential to generateeconomic value. However, e3−V alue has been recognized as ignoring key ele-ments of business value analysis derived by the business strategy [17, 8, 18].In [10] the authors defined two main groups of metrics corresponding to differentfacets of the process-to-organization alignment, one for generic metrics, and theother for model-specific ones.Much research has also been done on the definition and properties of businessprocess performance indicators. In the early Nineties, Kaplan and Norton intro-duced the notion of a Balanced Scorecard [14] as a set of indicators capable of
SAF: Strategic Alignment Framework for Monitoring Organizations 3
dealing with business goals related to all the four dimensions relevant to moni-toring business organizations (Financial Requirements, Customer Relations, In-ternal Business Processes, Learning and Growth Capabilities). Most approachesagree that process-level indicators must be chosen by balancing the coverage ofbusiness goals with the data collection and processing costs.Other works from the software engineering research community, focus on thealignment between business modeling and software development or execution.As discussed in [13] the general idea is that requirements models are built fromorganizational goals. Some of these works, such as for instance [15] or [9], arestrongly related to UML and do not clearly specify some organizational as-pects such as technology that implements business processes or the relationshipsamong the different organizational views.In the following two subsections we will describe the two models considered forthe comparison in Section 4.
2.1 GQM+ Strategy Method
The Goal Question Metric (GQM) approach [1] provides a top-down paradigmfor an organization or a project to define goals, refine those goals down to specifi-cations of data to be collected, and then analyze and interpret the resulting datawith respect to the original goals. GQM goals are defined in terms of purpose,focus, object of study, viewpoint, and context. Such a goals are then refined intospecific questions that must be answered in order to evaluate the achievement ofthe goal. The questions are then operationalized into specific quantitative mea-sures. The GQM formalizes the deduction process that derives the appropriatemeasures to answer a given business goal.However GQM has never provided explicit support for integrating its softwaremeasurement model with elements of the larger organization, such as higher-levelbusiness goals, strategies, and assumptions [3]. That is why Basili et al. in [2]propose and describe a method that adds several extensions on top of the GQMmodel. The GQM+ Strategy method makes the business goals, strategies, andcorresponding software goals explicit. The GQM+ Strategy method also makesthe relationships between software-related activities and measurement goals ex-plicit. Sequence of activity necessary for accomplishing the goals are defined bythe software organization and embedded into scenarios in order to achieve somesoftware-related goal. Links are established between each software goal and thebusiness-level strategy it supports. Attached to goals, strategies, and scenario ateach level of the model is information about relationships between goals, relevantcontext factors, and assumptions.
2.2 Process Performance Indicators Monitoring Model
In [16] Cristof Momm et al. present a model-driven methodology for a top-downdevelopment of a process-oriented IT support based on Service Oriented Ar-chitecture (SOA). In contrary to existing approaches Momm also include the
4 Ernesto Damiani, Fabio Mulazzani, Barbara Russo and Giancarlo Succi
monitoring required for business process controlling and introduce metamod-els for the specification of process performance indicators (PPIs) in conjunctionwith the necessary monitoring. As mentioned in [16], a PPI is attached to theconcept Process as part of the computation-independent process model. Option-ally a TargetValue indicating the objective as well as an AlarmValue defining athreshold for an intervention may be specified. The PPI is further characterizedby assigning a Dimension. Thereby information like the data type, the direc-tion (e.g. ascending or descending) and the unit of the value are specified. Thecalculation of the mandatory CurrentValue on the basis of runtime informationprovided by the underlying orchestration is handled by the PPIMonitor. Thisaspect is tackled within the scope of the PPI monitoring model. Furthermore,they have distinguished between basic and aggregated PPIs.
3 The Framework
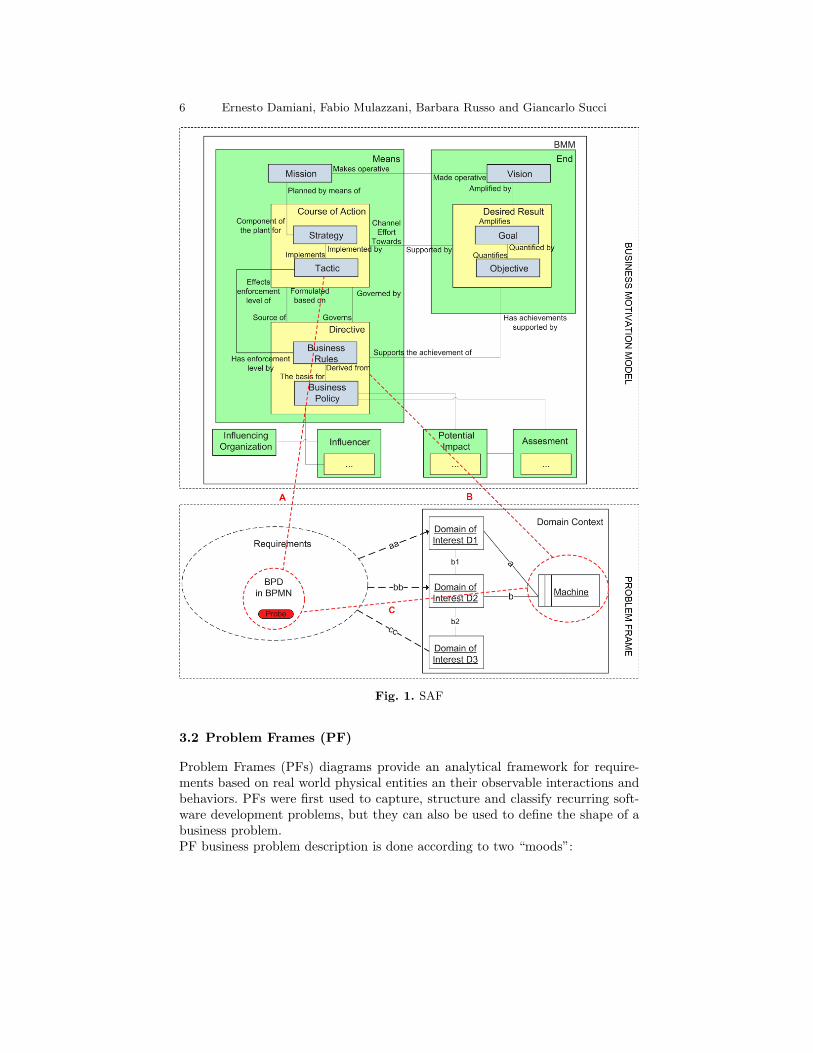
Business processes are deployed and executed in evolving organizational andtechnological environments. SAF (see Fig. 1) is a powerful tool for those orga-nizations that need to:
– align - make coherent - their BPs together with their BSs;– align their IT infrastructure together with the existing BPs;– create an IT infrastructure to support a newly founded business organization.
We focus on the first point.In order to represent the environment where the business organization activi-ties take place, we use an approach inspired by Problem Frames (PF)[12] (seeSubsection 3.2), originally introduced by Michael Jackson as a technique forrepresenting software requirements. We then combined the previous techniquetogether with the Business Motivation Model(BMM) (see Section 3.1) to elici-tate the strategy that generates the environment’s requirements in the PF. Thelink between the BMM and the Business Process Diagram (BPD), that in ourframework is included inside a PF, is justified by the element Course of Actionthat represents the overall approach that the enterprise will take to achieve itsDesired Results. Course of Action can be realized by, or made operative by, BPas explained in [5].The most important innovation of our framework is the adoption, hence themodeling, of probes (see Section 4.2) that operates on the IT to monitor theactivities taken in action by a task, or a group of tasks, of a specific process.This is to control the achievement of the strategies that have generated the con-trolled process. Probes consist of a memory for BP allocation and a logic forthe BP monitoring. So far, the logic modeling and the deployment of the probesover the BPD has been done using the expertize as mentioned in Section 4.2and 6. This approach may result hard to automatize. Our future goal will beto define models and rules (logic and deployment) of probes to facilitate theirimplementation in a software platform supporting SAF.The external and internal measurement of the BPs, is essential to verify the
SAF: Strategic Alignment Framework for Monitoring Organizations 5
achievement of business strategic goals and, in case they are not completelyachieved, to enable the management to change the strategy that generated themonitored process.The use of PF - the lower component of Fig. 1 - has been contextualized in thisframework by modeling the elements of the Domain Context with the Semanticsof Business Vocabulary and Business Rules (SBVR - See Subsection 3.2), andthe requirements with a BPD in Business Process Modeling Notation (BPMN).The advantage of using SBVR is that it can exhaustively describes the entities ofthe context and their relations. The use of BPD in the requirements, generatedby the Course of Action of the BMM, represents the procedures used by theentities of the Domain Context.In Subsection 3.1 we summarize the basic concept of the BMM while in Subsec-tion 3.2 we present the Jackson PF approach and its business modeling contex-tualization operated by SBVR and BPMN. The monitoring probes are descivedin Section 4.2 after the comparison of SAF with other two models.
3.1 Business Motivation Model (BMM)
The Business Motivation Model (BMM)[5], according to its developers, the Busi-ness Rules Group, is a metamodel of the concepts essential for business gover-nance. The BMM provides:
– A vocabulary for governance including such concepts as “influencer”, “as-sessment”, “business policy”, “strategy”, “tactic”, “goal”, and fact type thatrelate them, such as “business policy governs course of action”.
– Implicit support for an end-to-end process that runs:– From recognition that an influencer (regulation, competition, environment,etc) has an impact on the business;– To implementing the reaction to that impact in business processes, businessrules and organization responsibilities.
– The basis for logical design of a repository for storage of BMMs for individualbusinesses.
There are two major components of the BMM.
– The first is the Ends and Means of business plans. Among the Ends are thingsthe enterprise wishes to achieve - for example, Goals and Objectives. Amongthe Means are things the enterprise will employ to achieve those Ends - forexample, Strategies, Tactics, Business Policies, and Business Rules.
– The second is the Influencer that shape the elements of the business plans,and the Assessments made about the impacts of such Influencers on Ends andMeans (i.e. Strengths, Weaknesses, Opportunities, and Threats).
All elements of the BMM are developed from a business perspective. The basicidea is to develop a business model for the elements of the business plans beforesystem design or technical development is begun. In this manner, the businessplans can become the foundation for such activity, connecting system solutionsfirmly to their business intent. i∗ notation does not provide this.
6 Ernesto Damiani, Fabio Mulazzani, Barbara Russo and Giancarlo Succi
Fig. 1. SAF
3.2 Problem Frames (PF)
Problem Frames (PFs) diagrams provide an analytical framework for require-ments based on real world physical entities an their observable interactions andbehaviors. PFs were first used to capture, structure and classify recurring soft-ware development problems, but they can also be used to define the shape of abusiness problem.PF business problem description is done according to two “moods”:
SAF: Strategic Alignment Framework for Monitoring Organizations 7
– Indicative mood represents everything in the problem that is given, and itincludes physical domain entities such as people, organizations, departmentsand devices, and their shared phenomena, such as activities, processes, events,states, commands and information;
– Optative mood represents the way we would like every thing to be, it repre-sents the requirements. Requirements include business goals, objectives, pro-cesses and all other business and system requirements whose purpose is toalter the ‘As Is’ view of the world in some way.
Since a requirement can only be understood in the context in which it occurs,a PF diagram consists of two major components: a requirements part and adomain context diagram. Context diagrams contain real world physical domainentities called domains of interest. The phenomena that two or more domainsof interest share are indicated by an interface connecting the domains of inter-est. Shared phenomena consist of observable behavioral phenomena that occurbetween entities in a context diagram. Context diagrams always contain onespecial domain of interest, the machine, which is a general purpose computerthat is programmed. The requirements part of a problem diagram describes theeffects in the real world that the machine should guarantee.
Business Process Modeling Notation (BPMN) An essential component ofa business approach strategy is the modeling of activities composing individualbusiness processes. Business process modeling allows the analyst to capture boththe broad outline and the specific procedures governing a business. Intuitively,a business process can be seen as the collection of activities that are designedto produce the intended business behavior for a specific customer. The BusinessProcess Modeling Notation [6] is the standard notation used for business processmodeling.
Semantics of Business Vocabulary and Business Rules (SBVR) SBVR[20] is a CE formalism proposed by OMG that allows for the formalization ofbusiness vocabularies and rules through a combination of syntactical and textformatting rules. SBVR provides a means for describing the structure of themeaning of rules expressed in the natural language that business people use.According to OMG specifications, in SBVR works into logic modalities: alethicand deontic.
– SBVR alethic rules are used to model necessities which can not be violated.– SBVR deontic rules are used to model obligations which ought to be obeyed,
but may be violated in real world scenarios.
4 The Comparison with Models in Literature
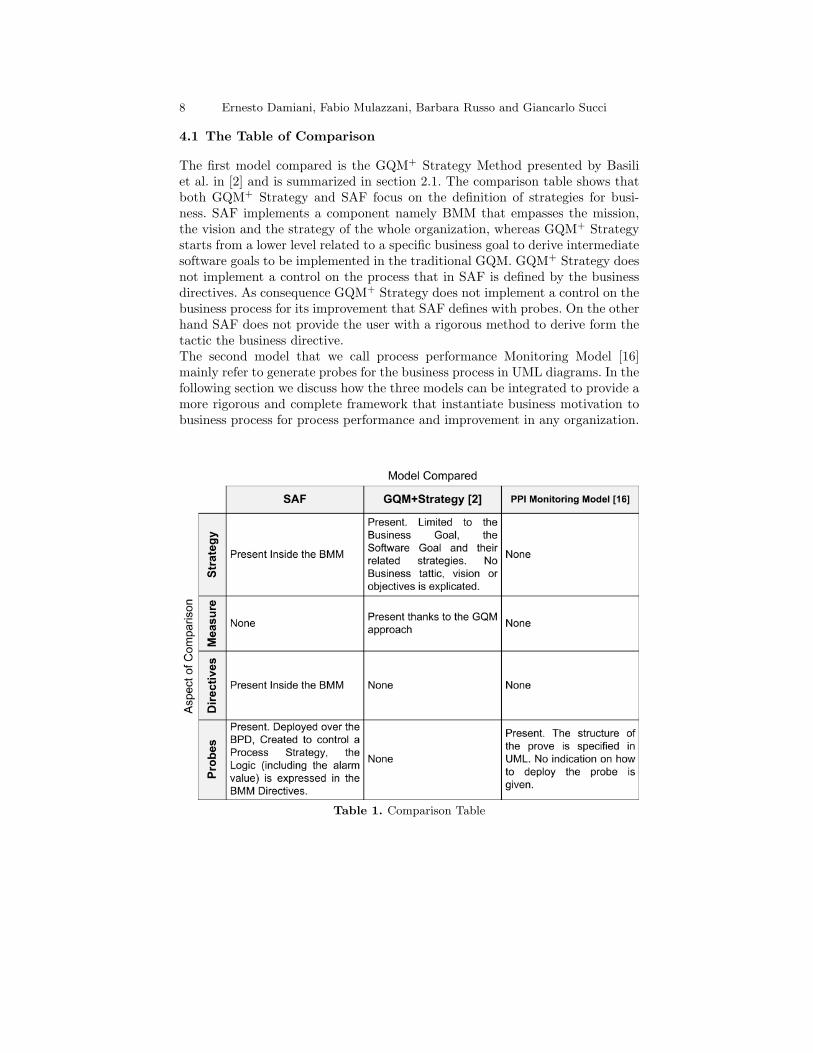
In this section we make a comparison with other two alignment models, as shownin Table 1, the columns represent the model under comparison while the rowsrepresent which aspect of the comparison has been taken into consideration.
8 Ernesto Damiani, Fabio Mulazzani, Barbara Russo and Giancarlo Succi
4.1 The Table of Comparison
The first model compared is the GQM+ Strategy Method presented by Basiliet al. in [2] and is summarized in section 2.1. The comparison table shows thatboth GQM+ Strategy and SAF focus on the definition of strategies for busi-ness. SAF implements a component namely BMM that empasses the mission,the vision and the strategy of the whole organization, whereas GQM+ Strategystarts from a lower level related to a specific business goal to derive intermediatesoftware goals to be implemented in the traditional GQM. GQM+ Strategy doesnot implement a control on the process that in SAF is defined by the businessdirectives. As consequence GQM+ Strategy does not implement a control on thebusiness process for its improvement that SAF defines with probes. On the otherhand SAF does not provide the user with a rigorous method to derive form thetactic the business directive.The second model that we call process performance Monitoring Model [16]mainly refer to generate probes for the business process in UML diagrams. In thefollowing section we discuss how the three models can be integrated to provide amore rigorous and complete framework that instantiate business motivation tobusiness process for process performance and improvement in any organization.
Table 1. Comparison Table
SAF: Strategic Alignment Framework for Monitoring Organizations 9
4.2 Deriving the Probes in SAF
The novelty introduced in SAF concerns the modeling of monitoring probes overthe BPD in accordance with the BMM.The probes operate over a process, or part of it (e.g. a group of tasks), thathas been generated in accordance with a superior business tactic and strategy.The major issue here is to logically configure and allocate the probes in the BPin order to allow the manager monitoring on the achievement of the strategicalobjectives.The link between the tactic and the underneath BP gives the position of theprobes within the processes, whereas the logical configuration of the probesas control on the BP is supplied by the GQM+ Strategy [2] machine appliedto any type of BP - not only software. Specifically, the Business Goal (BG)of the GQM+ Strategy machine is defined in the BMM by the Goal of theDesired Result, while the Measurement Goal (MG) is derived from the Courseof Action of the BMM (that is to say from the strategy and the tactic). Therules and the constraints defining the logic of the probes are derived by modelsrelating measures of performance of the BP. The thresholds of performance arethen derived with the training of the models on the existing BP and on specificrequirements expressed in the tactic. And the logic and the alarm values of theprobe reflects the Directives of the BMM in the BP.In Fig. 1, we show the role of the probes in our framework; the red dotted linenamed A is used to link a BPD (or part of it) to its generating tactic, this helpto focus on a specific part of the business activity. The line indicates “where dowe have to deploy the probe.” With our framework, probes are deployed over theBPD and they do not absolutely affect the topology of it.The probe deployed in the BP controlls the data flow and eventually reports awarning when a threshold is not met; it generates a report to the linked strategy.The red dotted line named B display the relation between the logic of the probeand the BMM Directives.The red dotted line named C represents the deployment and the logic link ofthe Probe within SAF. The PPIMM presented in Section 2.2 by [16] that aremodeled in UML can be adopted as model specification for the probes of SAF.The linking defined by the probes equips SAF of the missing feature of e3−V alue:the relation between the business value analysis and the business strategy.
5 An Application of SAF
In this section we apply SAF to a real case study. A previous validation of theframework has been done in [7] using the EU-Rent case, a fictitious car rentalcompany well known in literature [20]. In particular, in the [7] we showed howto model an organization activity at a fine granularity level.The case study illustrated below in Subsection 5.1 is based on a real case of anElectric Company. With this case we show the alignment gap that we have found
10 Ernesto Damiani, Fabio Mulazzani, Barbara Russo and Giancarlo Succi
applying our framework in the analysis of both Business Strategy vs. BusinessProcesses and Business Processes vs. Information Technology.
5.1 Electric Company Validation Case
The electric company under study produces and supplies electric power to 118000users for a total amount of about 1000 GWh per year. Two new EuropeanCommunity directives, 2003/54/CE and 2003/55/CE, has liberalized the electricmarket since 2007. To comply with the new directives and to remain competitivein this market the electric company has decided to revise its information systemin respect of its vision, mission, and business strategy, but under a strong timepressure.Its vision is to consolidate its image over the territory of a company that takescare of security, ecology and the quality of service. The derived mission is thensummarized in three points:
1. Continuously increasing on the quality of the service;2. Embrace technological innovation;3. Accurate monitoring of the cost-benefit balance.
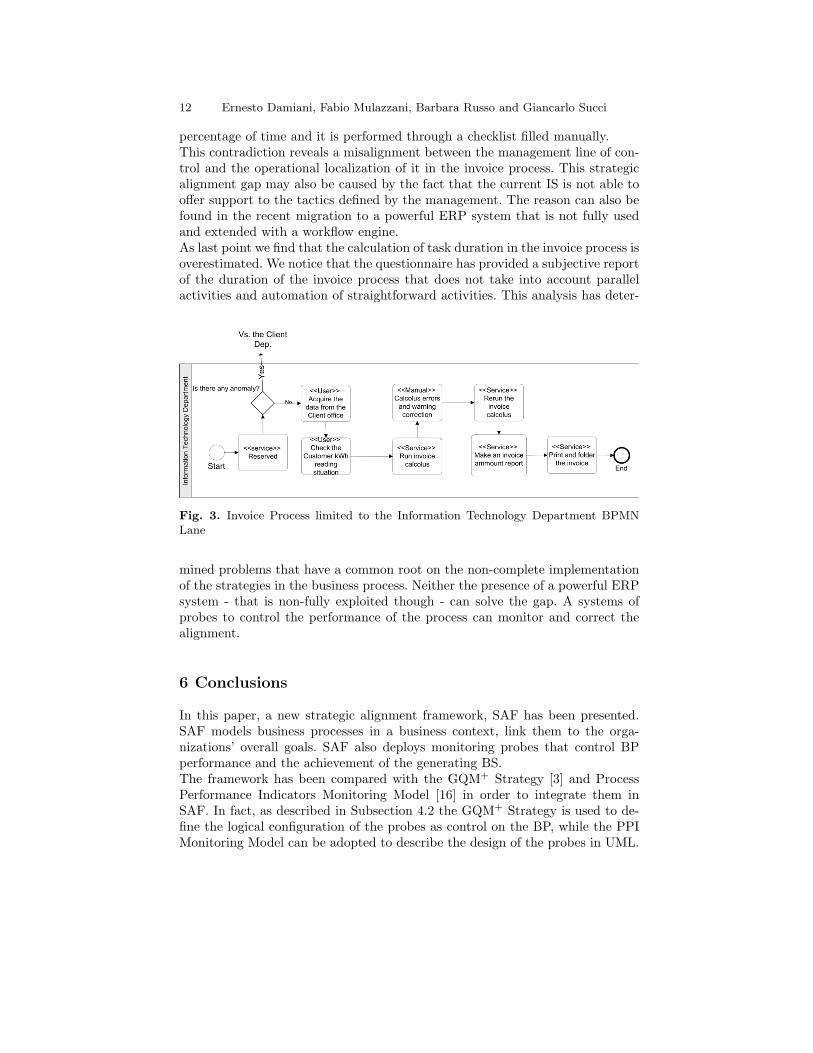
The Electric Company finds a disalignment between its mission points and theoverall performance of its BPs. We use SAF to surface this gap. A further useof SAF will define and locate appropriate probes into the BPs.In this study we analyze the BP of the Electric Company as a vendor companythat wants to maintain its image in the local market. In this sense, the ElectricCompany believes that its internal processes that lead to the definition of theinvoice represent its core business as a vendor company. Therefore we focus theapplication of SAF on the invoice process.We start modeling the invoice process with our framework investigating on thepossible strategic alignment gap on the invoice controlling procedures. The firststep is to model the process activities in respect to the strategic statements. Theinvoice process is a collaboration (global) BP with four participants, in Figure 3we focus on the IT Department lane representation that is the most importantamong the other. The customer receives the invoice notice every two months. Ina year, the amount is calculated as follows: the first invoice is calculated on thereal kWh consumed in the first bimester; the following two invoices are calculatedaccording to a prediction algorithm; the next invoice is calculated on the realkWh consumed during the two predicted bimester, plus the current bimester,less the kWh already considered in the two previous invoices.To realize the mission statements above on the invoice process the managementhas defined the following strategies:
1. Send the invoice notice to the customer regularly (e.g. in the third week ofthe month) every two months;
2. Produce invoices with ”zero” defects;3. Provide, in a year, quarterly invoices of almost the same amount.
SAF: Strategic Alignment Framework for Monitoring Organizations 11
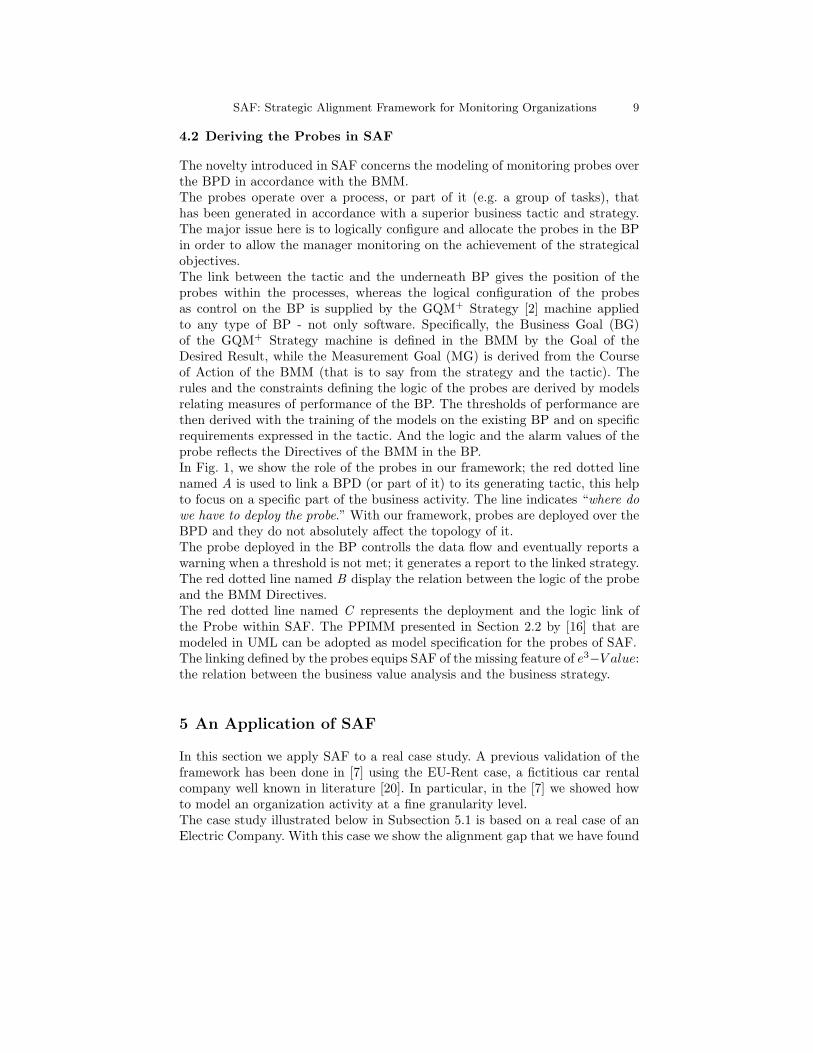
To implement the strategy in the tactic, the management has supplied the in-voice process with a new powerful ERP system. In the execution of the invoiceprocess the mangers still find the following major problem, though:There is a long delay - of about 45 days - occurring from the time the companycollects the real kWh consumed by the customer (with a manual procedure) andthe time of the delivery of the invoice. The company wants to understand thecauses of this delay and aims to reduce this period that results in a financialloss.During this context analysis we notice that the company has not defined anyperformance measurement and regular data collection on the workflow of theinvoice process yet. A measurement of performance creates thresholds and rulesof performance that allows the management to tune the process during its evo-lution in time. Only recently a one-shot questionnaire on the task duration hasbeen administrated to the employees. The data of this questionnaire is a startingpoint and a first overestimation of the overall duration of the invoice process,but reveals a weak of control of the process performance. However, the ques-tionnaire allows us to identify those tasks that mainly affect the duration of theoverall process. We find out that on the whole workflow, which is composed ofeight activities, seven activities have a mean processing time of about 32 minutesper hundred invoices, the remaining one named Calcolus Errors and WarningCorrection has a processing time almost six time greater then the mean of theothers (See Fig. 2).From the BPD of the invoice process in Fig.3 we notice that the activity Cal-
Fig. 2. Invoice Sub-Process Task Time Distribution
colus Errors and Warning Correction has a good percentage of manual tasks.The main purpose of this task is to discover, check, and correct possible prob-lems (also called warnings) that derive from the previous tasks that calculatethe invoice (for the sequence of the tasks see Fig. 3). These problems are auto-matically detected by the software system, but the operator responsible for theprocess must manually check and correct each warning. Although the activityto check the process for errors is a crucial activity that expresses directly oneof the tactic of the management, it is also the one that consumes the highest
12 Ernesto Damiani, Fabio Mulazzani, Barbara Russo and Giancarlo Succi
percentage of time and it is performed through a checklist filled manually.This contradiction reveals a misalignment between the management line of con-trol and the operational localization of it in the invoice process. This strategicalignment gap may also be caused by the fact that the current IS is not able tooffer support to the tactics defined by the management. The reason can also befound in the recent migration to a powerful ERP system that is not fully usedand extended with a workflow engine.As last point we find that the calculation of task duration in the invoice process isoverestimated. We notice that the questionnaire has provided a subjective reportof the duration of the invoice process that does not take into account parallelactivities and automation of straightforward activities. This analysis has deter-
Fig. 3. Invoice Process limited to the Information Technology Department BPMNLane
mined problems that have a common root on the non-complete implementationof the strategies in the business process. Neither the presence of a powerful ERPsystem - that is non-fully exploited though - can solve the gap. A systems ofprobes to control the performance of the process can monitor and correct thealignment.
6 Conclusions
In this paper, a new strategic alignment framework, SAF has been presented.SAF models business processes in a business context, link them to the orga-nizations’ overall goals. SAF also deploys monitoring probes that control BPperformance and the achievement of the generating BS.The framework has been compared with the GQM+ Strategy [3] and ProcessPerformance Indicators Monitoring Model [16] in order to integrate them inSAF. In fact, as described in Subsection 4.2 the GQM+ Strategy is used to de-fine the logical configuration of the probes as control on the BP, while the PPIMonitoring Model can be adopted to describe the design of the probes in UML.
SAF: Strategic Alignment Framework for Monitoring Organizations 13
The application of SAF carried out in a case study of an electric company re-vealed two major alignment gaps. Although the management has supplied theBPs with a powerful ERP system there is still a misalignment between the man-agement line of control and the operational localization of it in the BPs. Thisgap may also be caused by the fact that the current IS is not able to offer supportto the tactics defined by the management. The recent migration to a powerfulERP system that is not fully used and extended with a workflow engine can beone of reasons. At the time of writing, the authors are applying SAF also onanother case study over an italian Local Transportation Company. Form thesecase studies we aim to further develop and refine SAF supplying evidence of ituse.
Acknowledgments
This work was partly funded by the Italian Ministry of Research Fund for BasicResearch (FIRB) under project RBNE05FKZ2_004 TEKNE.We are grateful to P.Eng. Siegfried Tutzer, General Director of Azienda Ener-getica SpA/Etschwerke AG, and to P.Eng. Emiliano Lutteri, IT Division Head,and his staff for the collaboration offered.
References
1. V. Basili, G. Caldiera, and Rombach D. Goal question metric paradigm. In Ency-clopedia of Software Engineering, Marcinak, vol. 1, John Wiley and Sons, 1994.
2. Victor Basili, Jens Heidrich, Mikael Lindvall, Jrgen Mnch, Myrna Regardie, DieterRombach, Carolyn Seaman, and Adam Trendowicz. Bridging the gap betweenbusiness strategy and software development. In ICIS 2007 : Proceedings of theInternational Conference on Information Systems, Montral, Qubec, Canada, 2007.
3. Victor Basili, Jens Heidrich, Mikael Lindvall, Jurgen Munch, Myrna Regardie, andAdam Trendowicz. Gqm+ strategies – aligning business strategies with softwaremeasurement. Empirical Software Engineering and Measurement, 2007. ESEM2007. First International Symposium on, pages 488–490, 20-21 Sept. 2007.
4. Steven J. Bleistein, Karl Cox, June Verner, and Keith Phalp. B-scp: A requirementsanalysis framework for validating strategic alignment of organizational it based onstrategy, context, and process. Information Software Technology, 48(9):846–868,2006.
5. Business motivation model (bmm). Technical report, OMG, 2006.6. Business process modeling notation (bpmn). Misc, OMG, 2006.
http://www.bpmn.org/Documents/BPMN%20V1-0%20May%203%202004.pdf.7. Paolo Ceravolo, Cristiano Fugazza, Ernesto Damiani, Fabio Mulazzani, and Bar-
bara Russo. Business process monitoring via ontology-based representation models.Technical report, 2007.
8. Hakan Erdogmus, John M. Favaro, and Wolfgang Strigel. Guest editors’ introduc-tion: Return on investment. IEEE Software, 21(3):18–22, 2004.
9. Hans-Erik Eriksson and Magnus Penker. Business Modeling With UML: BusinessPatterns at Work. John Wiley & Sons, Inc., New York, NY, USA, 1998.
14 Ernesto Damiani, Fabio Mulazzani, Barbara Russo and Giancarlo Succi
10. A. Etien, C. Rolland, and C. Salinesi. Measuring the business/system alignment. InREBNITA 2005: Proceedings of the 1st International Workshop on RequirementsEngineering for Business Need and IT Alignment, pages 143–152, Paris, France,2005. University of New South Wales Press.
11. Jaap Gordijn and J. M. Akkermans. Value-based requirements engineering: ex-ploring innovative e-commerce ideas. Requir. Eng., 8(2):114–134, 2003.
12. Michael Jackson. Problem Frames: Analysing and Structuring Software Develop-ment Problems. Addison-Wesley, 2000.
13. Juan Sanchez Diaz Jose Luis De la Vara Gonzalez. Business process-driven require-ments engineering: a goal-based approach. In In proceedings of the 8th Workshopon Business Process Modeling, Development, and Support, 2007.
14. R. S. Kaplan and D. P. Norton. The balanced scorecard - measures that driveperformance. Harvard Business Review, 70(1):71–79, 1992.
15. Chris Marshall. Enterprise modeling with UML: designing successful softwarethrough business analysis. Addison-Wesley Longman Ltd., Essex, UK, UK, 2000.
16. Christof Momm, Robert Malec, and Sebastian Abeck. Towards a model-drivendevelopment of monitored processes. In Andreas Oberweis, Christof Weinhardt,Henner Gimpel, Agnes Koschmider, Victor Pankratius, and Bjrn Schnizler, editors,Wirtschaftsinformatik (2), pages 319–336. Universitaetsverlag Karlsruhe, 2007.
17. Alexander Osterwalder, Yves Pigneur, and Sarra Ben Lagha. Modeling e-businesswith ebml. Industrial Organization 0202003, EconWPA, February 2002. availableat http://ideas.repec.org/p/wpa/wuwpio/0202003.html.
18. Michael E. Porter. Competitive advantage : creating and sustaining superior per-formance. Free Press, New York, 1985.
19. Blaize H. Reich and Izak Benbasat. Factors that influence the social dimension ofalignment between business and information technology objectives. MIS Quarterly,24(1):81–113, 2000.
20. Semantics of business vocabulary and business rules (sbvr). Technical report,OMG, 2004.
21. Laure-Helene Thevenet and Camille Salinesi. Aligning is to organization’s strategy:The instalmethod. In John Krogstie, Andreas L. Opdahl, and Guttorm Sindre,editors, CAiSE, volume 4495 of Lecture Notes in Computer Science, pages 203–217. Springer, 2007.
22. Bob De Wit and Ron Meyer. Strategy - process, content, context : an internationalperspective. Mason, Ohio : Thomson/South-Western, 2004, 2004.
23. E. Yu. Towards modelling and reasoning support for early-phase requirementsengineering. pages 226–235, 1997.