Embed Size (px)
Citation preview
SAE Aero Design West - Micro Class
Flap Jacks #329
Salem Alazmi
Collin Krawczyk
Jeremy Reber
2018-2019
Project Sponsor: SAE, Northern Arizona University, Quality Vans and Specialty Vehicles, Coconino High School Engineering Group
Faculty Advisor and Sponsor Mentor: John Tester
Instructor: David Trevas
Contents List of Figures and Tables ............................................................................................................................. 4
List of Symbols and Acronyms ...................................................................................................................... 5
1.0 Executive Summary ................................................................................................................................ 6
1.1. System Overview ............................................................................................................................... 7
1.2. Competition Projections ..................................................................................................................... 7
1.3. Discriminators .................................................................................................................................... 8
2.0 Schedule Summary ................................................................................................................................. 8
3.0 Design Layout & Trade Offs .................................................................................................................... 8
3.1. Overall Design Layout and Size ......................................................................................................... 8
3.2. Optimization ....................................................................................................................................... 9
3.2.1. Competitive Scoring and Strategy Analysis ................................................................................ 9
3.2.2. Optimization and Sensitivity Analysis ......................................................................................... 9
3.3. Design Features and Details ............................................................................................................ 11
3.4. Interfaces and Attachments ............................................................................................................. 12
4.0 Loads and Environments, Assumptions ................................................................................................ 13
4.1. Design Loads Derivations ................................................................................................................ 13
4.2. Environmental Considerations ......................................................................................................... 13
5.0 Analysis ................................................................................................................................................. 14
5.1. Analysis Techniques ........................................................................................................................ 14
5.1.1. Analytical Tools ......................................................................................................................... 14
5.1.2. Developed Models .................................................................................................................... 14
5.2. Performance Analysis ...................................................................................................................... 14
5.2.1. Runway/Launch/Landing Performance ..................................................................................... 14
5.2.2. Flight and Maneuver Performance (Incl. Surface Sizing) ......................................................... 15
5.2.3. Shading and Downwash Analysis ............................................................................................. 15
5.2.4. Dynamic & Static Stability ......................................................................................................... 18
5.2.5. Aeroelasticity ............................................................................................................................. 19
5.2.6. Lifting Performance, Payload Prediction, and Margin ............................................................... 20
5.3. Structural Analysis ........................................................................................................................... 21
5.3.2. Mass Properties & Balance ....................................................................................................... 23
6.0 Assembly and Subassembly, Test and Integration ............................................................................... 23
7.0 Manufacturing ....................................................................................................................................... 24
8.0 Conclusion ............................................................................................................................................ 24
References .............................................................................................................................................. 25
Appendix A – Supporting Documentation and Backup Calculations ...................................................... 26
Appendix B – Technical Data Sheet ....................................................................................................... 27
Drawing 11x17 ........................................................................................................................................ 28
List of Figures and Tables
Figure 1: Thrust vs. Speed ........................................................................................................10
Figure 2: Lift vs. drag at varying angle of attacks ......................................................................16
Figure 3: Drag vs. velocity at varying Reynolds numbers ..........................................................17
Figure 4: Cruise drag with downwash effects ............................................................................18
Figure 5: Cantilever beam with distributed loading [8] ...............................................................19
Figure 6: Lift generated at cruise ...............................................................................................21
Figure 7: Rules of thumb for plane design [10] ..........................................................................26
Table 1: Aircraft components ....................................................................................................12
Table 2: Load assumptions .......................................................................................................13
Table 3: Deflection results .........................................................................................................20
Table 4: Wing support components ...........................................................................................22
Table 5: Building materials ........................................................................................................23
List of Symbols and Acronyms 𝛿𝐵 Maximum deflection at B
𝜌∞ Density upstream 𝜇 Dynamic viscosity ABS Acrylonitrile Butadiene Styrene AR Aspect ratio b Wing length e Wing Oswald efficiency factor c Wing chord length 𝑐̅ Wing mean aerodynamic chord c.g. Center of gravity 𝐶𝐷 Coefficient of drag 𝐶𝐷,𝑖 Induced drag
𝐶𝐷,𝑜 Parasitic drag at zero lift
𝐶𝐿 Coefficient of Lift CAD Computer aided design D Drag E Modulus of elasticity I Moment of inertia L Lift
𝐿𝐴𝐵 Length of beam from A to B
𝑙𝑡 Distance from vehicle center of gravity to tail quarter chord q Declining distributed load
𝑞∞ Dynamic pressure upstream Re Reynolds Number RC Remote controlled S Wing planform area 𝑆𝑡 Tail planform area SAE Society of automotive engineers 𝑉𝐻 Horizontal tail volume ratio 𝑉∞ Velocity upstream
1.0 Executive Summary The SAE Aero West design competition teaches students how to complete a year-long
project and successfully design aspects of an aircraft. The micro class competition
focuses on specific components of aircraft such as assembly and disassembly, weight
minimization, and payload attachments. The micro aircraft that the team at Northern
Arizona University designed was created to meet the competition requirements and
uses a Clark Y 11.4% airfoil, an RC plane racing motor, a 7”x4” propeller, a unique bolt
payload attachment system, and modular sub assembly attachment systems for the tail,
wing, and fuselage. Based on initial calculations, the lift and drag generated for cruise
by the wing at 30 mph is 1.4 lbs. and 0.12 lbs., respectively. The maximum dynamic
thrust produced is 1.4 lbs. at 30 mph, which is much greater than the drag that is
generated. The maximum weight of the aircraft is 0.9 lbs. and can carry approximately
0.3 - 0.5 lbs. of payload. The modular designs use brackets and pins to attach
subassemblies and meets the competition requirement of fitting within a fixed volume
box and the requirement of assembling the aircraft within a specific time frame. Based
upon the competition requirements and the design of the aircraft, the aircraft should
place within the top five of teams in the micro class competition.
1.1. System Overview
The selected aircraft design has a wing span of 30 inches, a wing chord length of 4
inches, an 850 mAh battery, a 7”x4” propeller, an 1850 kV electric motor, and has
control surfaces that include ailerons, elevators, and a rudder. With these selected
components, the aircraft has a weight of approximately 0.8 lbs. and can generate a
thrust to weight ratio of 2.66:1 with a flight time of 5 minutes. The wing and tail sections
are constructed using birch ribs and spars with Monokote stretched and applied over
the length of the sections. The wing is split into two 11-inch sections with one 8- inch
section. The tail has one elevator that will span the length of the 9-inch horizontal
stabilizer. A rudder, 5” tall by 1” wide, will accompany the vertical stabilizer. The aileron
dimensions are 10”x1” making the aircraft maneuverable, even with payload under the
wings.
1.2. Competition Projections
The scope of the project is to design and build a micro aircraft. The Northern Arizona
University micro team plans to compete a micro aircraft at the SAE Aero West
competition in April 2019. The SAE Aero West competition is an international
competition where universities compete to win monetary prizes and potential job offers.
The micro class involves designing an all-electric, radio-controlled aircraft that focuses
on minimizing weight while maximizing payload. A constraint is placed on the size of the
aircraft where the entire aircraft and necessary parts must fit within a cardboard
container with maximum outside dimensions of 12.125 inches x 3.625 inches x 13.875
inches. To prepare for competition, construction, testing, design iterations, and report
generations that meet competition guidelines must be completed.
1.3. Discriminators
Discriminating design features are found throughout the design of the aircraft. The most
notable discriminating factor of the design is the modularity of the subassemblies and
the disassembly of each part. Specifically, the Lego-type fit of the fuselage components
that are easily replaceable and are placed correctly due to the interlocking shape. The
next discriminating factor is the plastic bracket that connects the three main beams
within the fuselage to the tail and centers each piece within the design. Lastly, the wing
connectors are designed with small turned aluminum clips that benefit assembly and
are unlikely to be replicated by competitors.
2.0 Schedule Summary The project was assigned the beginning of September of 2018. Preliminary research
and models were completed by the start of November. Then, parts for an alpha
prototype were ordered and subassemblies were built by January of 2019. The report
was started in January and was due by late February 2019. The beta prototype was
built in February and tested in March of 2019. The final competition plane was iterated
and built based on the results of this initial flight to be prepared for the competition in
April 5, 2019.
3.0 Design Layout & Trade Offs
3.1. Overall Design Layout and Size
The size of the aircraft is as follows: tip-to-tail length is 18 inches; wingspan is 30 inches;
fuselage is 2.5 inches x 2.5 inches x 9 inches. More detailed dimensions including center
of gravity location can be found in the 2D drawing shown in the Drawing 11x17 section.
3.2. Optimization
3.2.1. Competitive Scoring and Strategy Analysis
The team’s strategy for a successful competition is to excel in the assembly
demonstration, report, and presentation, as those points are critical to success. The
strategy for trails is to use a predetermined load for the first run and then adjust payload
as necessary. It is important to maintain reliability as a major requirement for competing
is that every run is completed with payload. The team would like to carry the maximum
payload possible but understands flight conditions on any given day can be poor which is
why the focus is on various parts of the competition.
3.2.2. Optimization and Sensitivity Analysis
There are two major subsystems of the aircraft that have been carefully analyzed and
optimized. These subsystems are the electronics subsystem and the wing subsystem.
The propeller was designed based on aircrafts approximately the size of the one built for
competition and a desired value was selected. Due to the plane carrying payload under
the wing, there is ample room for a larger diameter propeller. This resulted in a 7-inch
diameter propeller. From there, the motor was sized and an 1810 kV scorpion SII was
chosen due to the thrust needed and recommendations based on propeller size. Using
an Excel sheet with an equation derived for dynamic thrust, pitch was adjusted to
maximize static thrust for takeoff and maximum thrust at a cruising speed of 30 mph.
Figure 1 shows the thrust to speed plot [1].
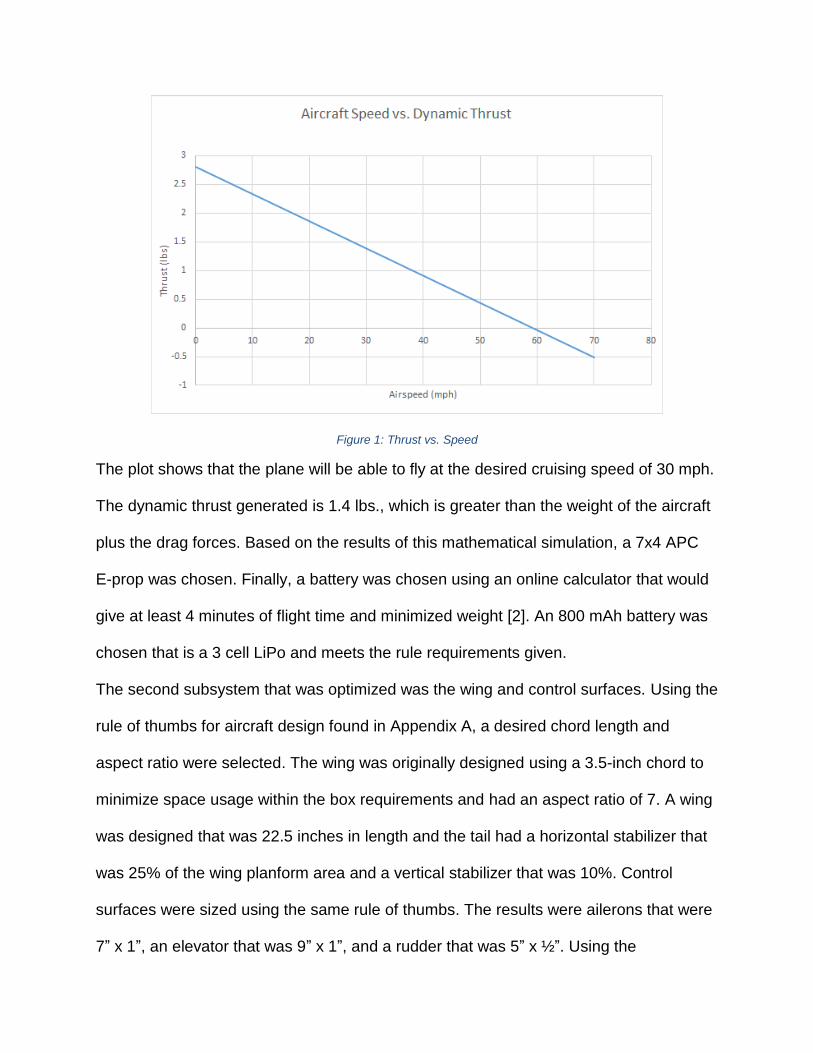
Figure 1: Thrust vs. Speed
The plot shows that the plane will be able to fly at the desired cruising speed of 30 mph.
The dynamic thrust generated is 1.4 lbs., which is greater than the weight of the aircraft
plus the drag forces. Based on the results of this mathematical simulation, a 7x4 APC
E-prop was chosen. Finally, a battery was chosen using an online calculator that would
give at least 4 minutes of flight time and minimized weight [2]. An 800 mAh battery was
chosen that is a 3 cell LiPo and meets the rule requirements given.
The second subsystem that was optimized was the wing and control surfaces. Using the
rule of thumbs for aircraft design found in Appendix A, a desired chord length and
aspect ratio were selected. The wing was originally designed using a 3.5-inch chord to
minimize space usage within the box requirements and had an aspect ratio of 7. A wing
was designed that was 22.5 inches in length and the tail had a horizontal stabilizer that
was 25% of the wing planform area and a vertical stabilizer that was 10%. Control
surfaces were sized using the same rule of thumbs. The results were ailerons that were
7” x 1”, an elevator that was 9” x 1”, and a rudder that was 5” x ½”. Using the
dimensions stated and a Clark Y-11 airfoil, the aircraft physics were modeled in
RealFlight8 (a model aircraft simulation software). Using this method of analysis, the
wing chord length was increased to 4 inches and the wing length was increased to 30
inches for a new aspect ratio of 7.5. The installation incidence angle on the wing was
set to 1𝑜 from 3𝑜 and the control surfaces were re-sized and optimized. This resulted in
ailerons that are 10” x 1”, an elevator size that is 9” x 1”, and a rudder that is 5” x 1”.
These changes made the aircraft more controllable and capable of carrying more
payload as a result of more lift.
3.3. Design Features and Details
The sub-assemblies in the aircraft were sized based on the optimization discussed in
section 3.2.2. Notable design features are related to assembly and compact features but
also to how the payload will be mounted to the plane. Most notably, is the interlocking
nature of the pieces that comprise the fuselage and tail. The design of these pieces are
instrumental in making assembly and repair of the fuselage quick and easy as it aligns
the pieces and provides additional support. Another key feature related to assembly is
how the wing sections slide and lock together. This is accomplished using a small amount
of hardware and machined aluminum end pieces that centers dowels with drilled holes
and provides consistent placement and a rigid fixture to the aircraft. Lastly, the payload
attachment is creatively designed. The payload mounting system is a 3D printed spacer
that is built into a wing rib. This piece has a small protrusion on the bottom that separates
the payload from the bottom of the airfoil to minimize the effects of its shape on the
aerodynamics of the wing. This makes attaching payload easy and does not require
disassembly of any part of the aircraft to remove the payload for weighing. Table 1 shows
the aircraft components and their size needed for the electronics sub assembly.
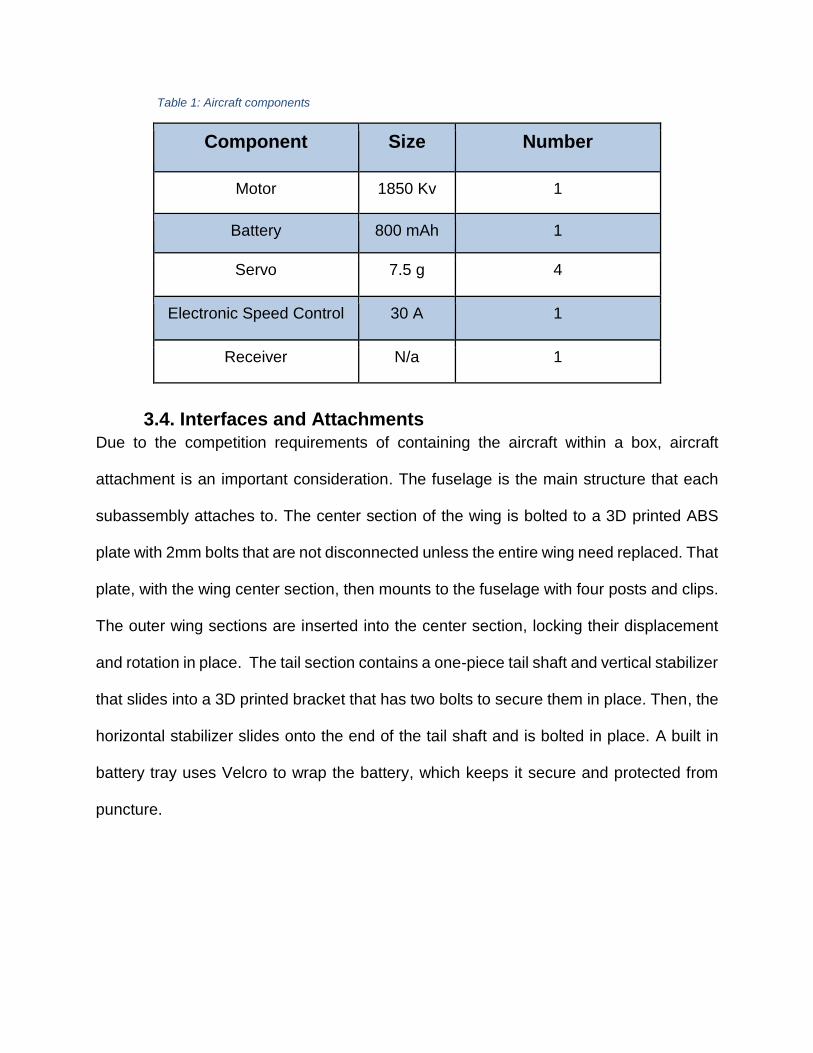
Table 1: Aircraft components
Component Size Number
Motor 1850 Kv 1
Battery 800 mAh 1
Servo 7.5 g 4
Electronic Speed Control 30 A 1
Receiver N/a 1
3.4. Interfaces and Attachments
Due to the competition requirements of containing the aircraft within a box, aircraft
attachment is an important consideration. The fuselage is the main structure that each
subassembly attaches to. The center section of the wing is bolted to a 3D printed ABS
plate with 2mm bolts that are not disconnected unless the entire wing need replaced. That
plate, with the wing center section, then mounts to the fuselage with four posts and clips.
The outer wing sections are inserted into the center section, locking their displacement
and rotation in place. The tail section contains a one-piece tail shaft and vertical stabilizer
that slides into a 3D printed bracket that has two bolts to secure them in place. Then, the
horizontal stabilizer slides onto the end of the tail shaft and is bolted in place. A built in
battery tray uses Velcro to wrap the battery, which keeps it secure and protected from
puncture.
4.0 Loads and Environments, Assumptions
4.1. Design Loads Derivations
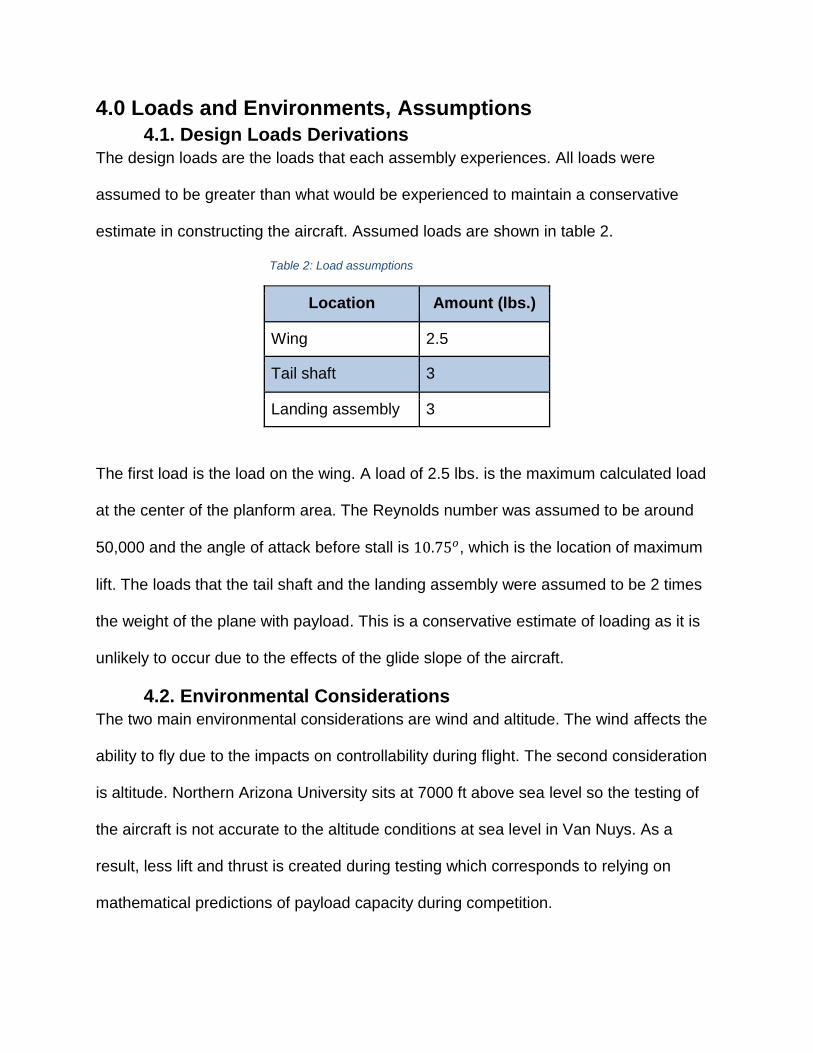
The design loads are the loads that each assembly experiences. All loads were
assumed to be greater than what would be experienced to maintain a conservative
estimate in constructing the aircraft. Assumed loads are shown in table 2.
Table 2: Load assumptions
Location Amount (lbs.)
Wing 2.5
Tail shaft 3
Landing assembly 3
The first load is the load on the wing. A load of 2.5 lbs. is the maximum calculated load
at the center of the planform area. The Reynolds number was assumed to be around
50,000 and the angle of attack before stall is 10.75𝑜, which is the location of maximum
lift. The loads that the tail shaft and the landing assembly were assumed to be 2 times
the weight of the plane with payload. This is a conservative estimate of loading as it is
unlikely to occur due to the effects of the glide slope of the aircraft.
4.2. Environmental Considerations
The two main environmental considerations are wind and altitude. The wind affects the
ability to fly due to the impacts on controllability during flight. The second consideration
is altitude. Northern Arizona University sits at 7000 ft above sea level so the testing of
the aircraft is not accurate to the altitude conditions at sea level in Van Nuys. As a
result, less lift and thrust is created during testing which corresponds to relying on
mathematical predictions of payload capacity during competition.
5.0 Analysis
5.1. Analysis Techniques
5.1.1. Analytical Tools
The primary tools used for analysis were SolidWorks and MATLAB. SolidWorks was
used to design the plane and determine component placement and weight as well as
evaluate the effect of components on the center of gravity of the plane. MATLAB was
used to calculate lift, drag, stability, and wing deflection. Lastly, a simple flow analysis
using Ansys and a Reynolds number of 50,000 was performed on the payload and
concluded that very little drag would be induced by it.
5.1.2. Developed Models
To see effects of take-off, turning flight, and landing, the RealFlight 8 flight simulation
software was used. The software allowed modeling of physics and environmental
effects to visually see performance of the aircraft. Using this software, small changes
were made to make flight adequate. These changes included increasing the chord
length and wing length, adjusting control surface sizing, and correctly placing the wing
over the c.g. This software was essential in modeling how hand launching would affect
take-off, how ailerons and control surfaces would control banking, and how much
landing distance would be needed to successfully land.
5.2. Performance Analysis
5.2.1. Runway/Launch/Landing Performance
Due to the aircraft being hand launched, the angle of attack of the aircraft will be greatly
increased during launch. The aircraft will be thrown upwards at an angle of attack of
about 30 degrees with thrust activating once the aircraft is separated from the hand.
This is to ensure that the aircraft will not nose dive and a proper flight path can be
generated. Per the SAE rules with a maximum of 200 ft landing distance, the aircraft will
be tail controlled during landing. Once touch downed, the aircraft will yaw to decrease
the distance needed to stop. The estimated landing distance is 100 ft, which is well
under the 200 ft maximum requirement.
5.2.2. Flight and Maneuver Performance (Incl. Surface Sizing)
Using the flight simulation software and general rules of thumb for aircraft design, the
control surfaces and aspect ratios were fine tuned. The aspect ratio of the aircraft is 7.5.
A smaller aspect ratio correlates to more maneuverability due to smaller moments of
inertia [3]. This is a good aspect ratio for this aircraft due to the need for gliding during
landing and not needing to make tight banks in flight.
5.2.3. Shading and Downwash Analysis
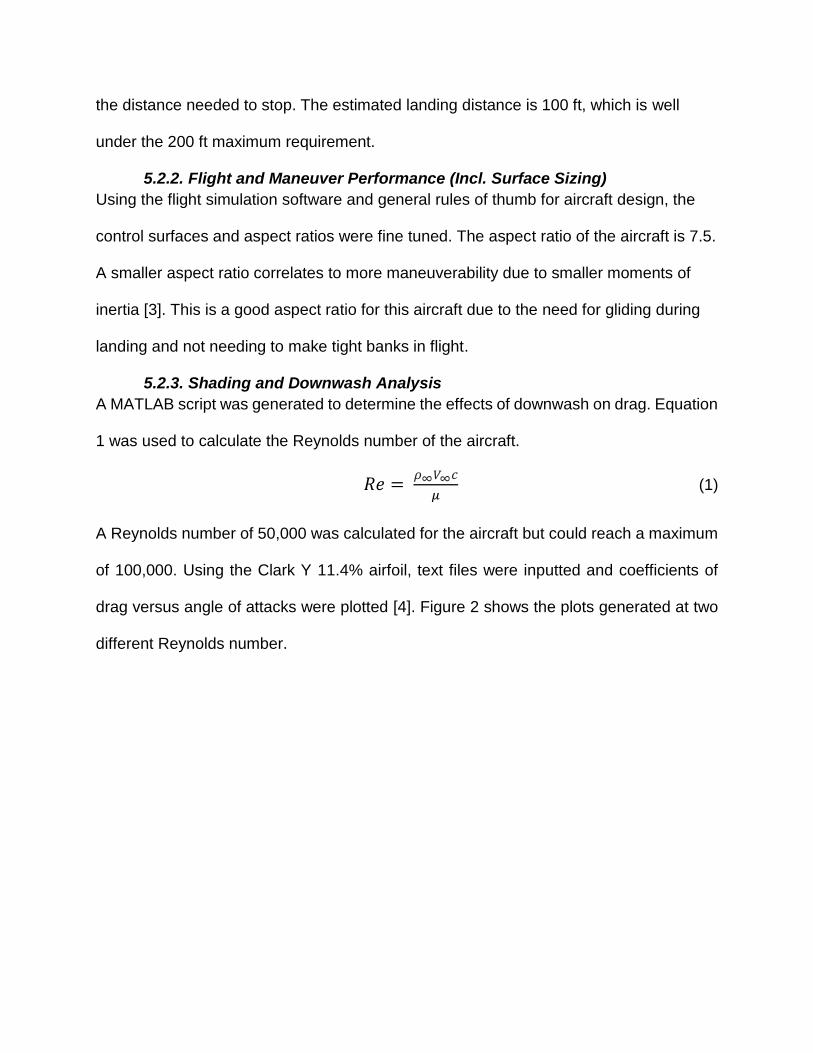
A MATLAB script was generated to determine the effects of downwash on drag. Equation
1 was used to calculate the Reynolds number of the aircraft.
𝑅𝑒 = 𝜌∞𝑉∞𝑐
𝜇 (1)
A Reynolds number of 50,000 was calculated for the aircraft but could reach a maximum
of 100,000. Using the Clark Y 11.4% airfoil, text files were inputted and coefficients of
drag versus angle of attacks were plotted [4]. Figure 2 shows the plots generated at two
different Reynolds number.
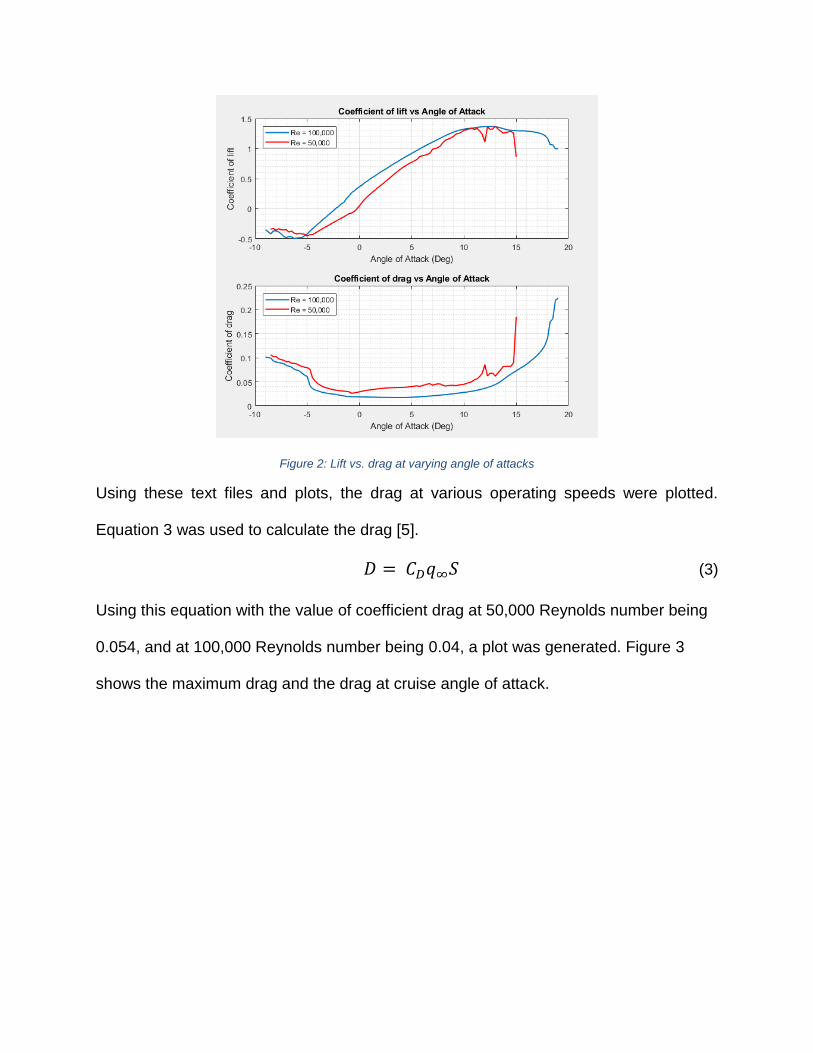
Figure 2: Lift vs. drag at varying angle of attacks
Using these text files and plots, the drag at various operating speeds were plotted.
Equation 3 was used to calculate the drag [5].
𝐷 = 𝐶𝐷𝑞∞𝑆 (3)
Using this equation with the value of coefficient drag at 50,000 Reynolds number being
0.054, and at 100,000 Reynolds number being 0.04, a plot was generated. Figure 3
shows the maximum drag and the drag at cruise angle of attack.
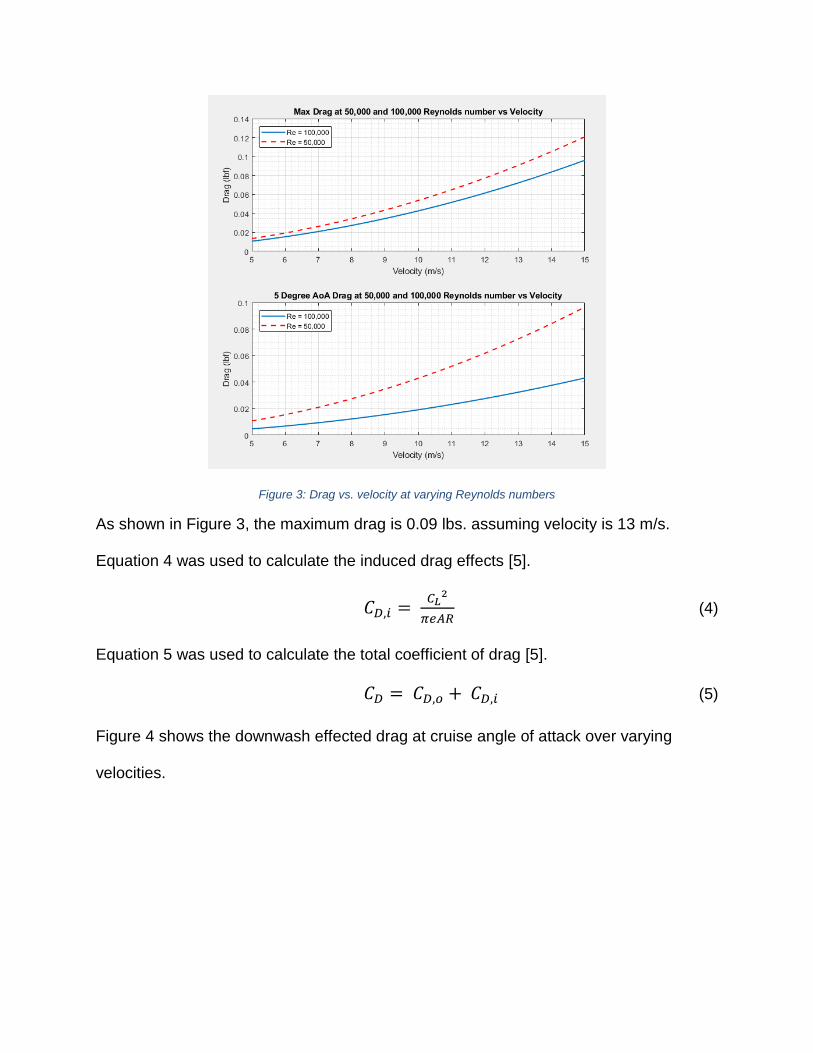
Figure 3: Drag vs. velocity at varying Reynolds numbers
As shown in Figure 3, the maximum drag is 0.09 lbs. assuming velocity is 13 m/s.
Equation 4 was used to calculate the induced drag effects [5].
𝐶𝐷,𝑖 = 𝐶𝐿
2
𝜋𝑒𝐴𝑅 (4)
Equation 5 was used to calculate the total coefficient of drag [5].
𝐶𝐷 = 𝐶𝐷,𝑜 + 𝐶𝐷,𝑖 (5)
Figure 4 shows the downwash effected drag at cruise angle of attack over varying
velocities.
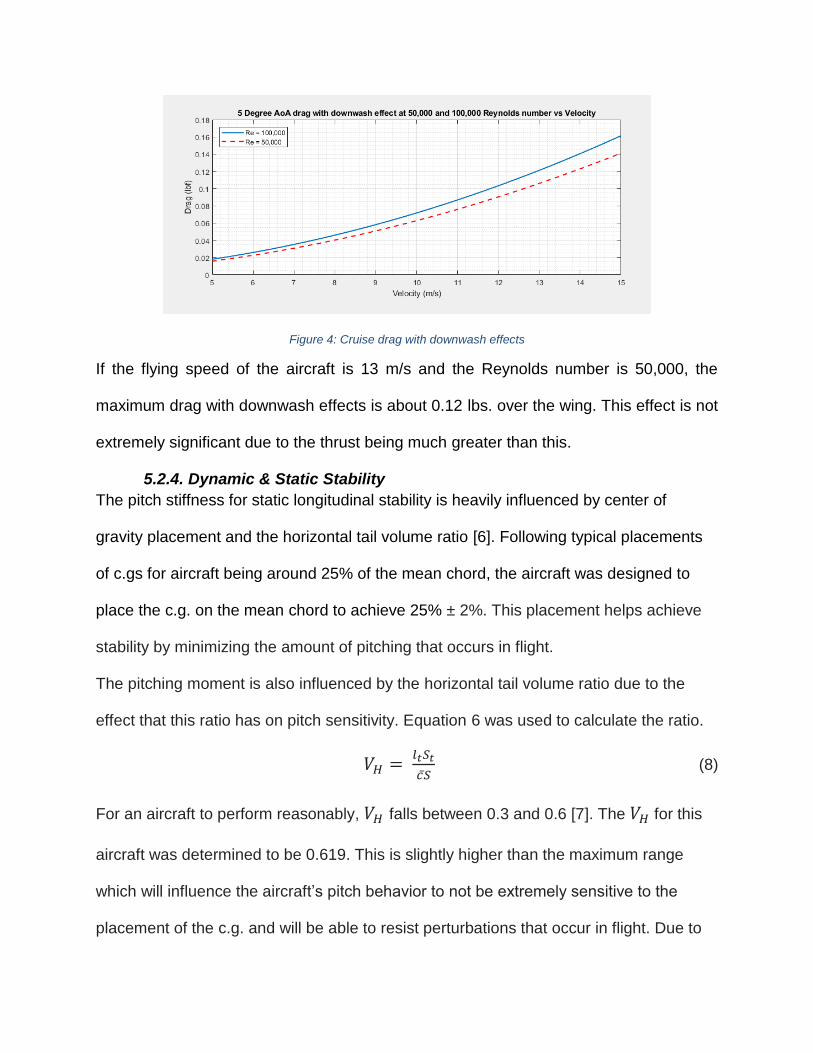
Figure 4: Cruise drag with downwash effects
If the flying speed of the aircraft is 13 m/s and the Reynolds number is 50,000, the
maximum drag with downwash effects is about 0.12 lbs. over the wing. This effect is not
extremely significant due to the thrust being much greater than this.
5.2.4. Dynamic & Static Stability
The pitch stiffness for static longitudinal stability is heavily influenced by center of
gravity placement and the horizontal tail volume ratio [6]. Following typical placements
of c.gs for aircraft being around 25% of the mean chord, the aircraft was designed to
place the c.g. on the mean chord to achieve 25% ± 2%. This placement helps achieve
stability by minimizing the amount of pitching that occurs in flight.
The pitching moment is also influenced by the horizontal tail volume ratio due to the
effect that this ratio has on pitch sensitivity. Equation 6 was used to calculate the ratio.
𝑉𝐻 = 𝑙𝑡𝑆𝑡
𝑐�̅� (8)
For an aircraft to perform reasonably, 𝑉𝐻 falls between 0.3 and 0.6 [7]. The 𝑉𝐻 for this
aircraft was determined to be 0.619. This is slightly higher than the maximum range
which will influence the aircraft’s pitch behavior to not be extremely sensitive to the
placement of the c.g. and will be able to resist perturbations that occur in flight. Due to
this higher horizontal tail volume ratio and the placement of the c.g., the pitch stiffness
of the aircraft is high and can resist and recover from perturbations in flight.
The short period mode of the dynamic longitudinal stability is largely determined by the
vehicle pitch stiffness. The vehicle pitch stiffness of the aircraft is high which correlates
to a small period during the short period mode. The period of the short period mode
determines how long the mode will last and a small period corresponds to the aircraft
recovering quickly to any perturbation that is experienced during flight. This is excellent
for the aircraft because any turbulence experienced will be damped out quickly and will
not drastically affect the flight path.
5.2.5. Aeroelasticity
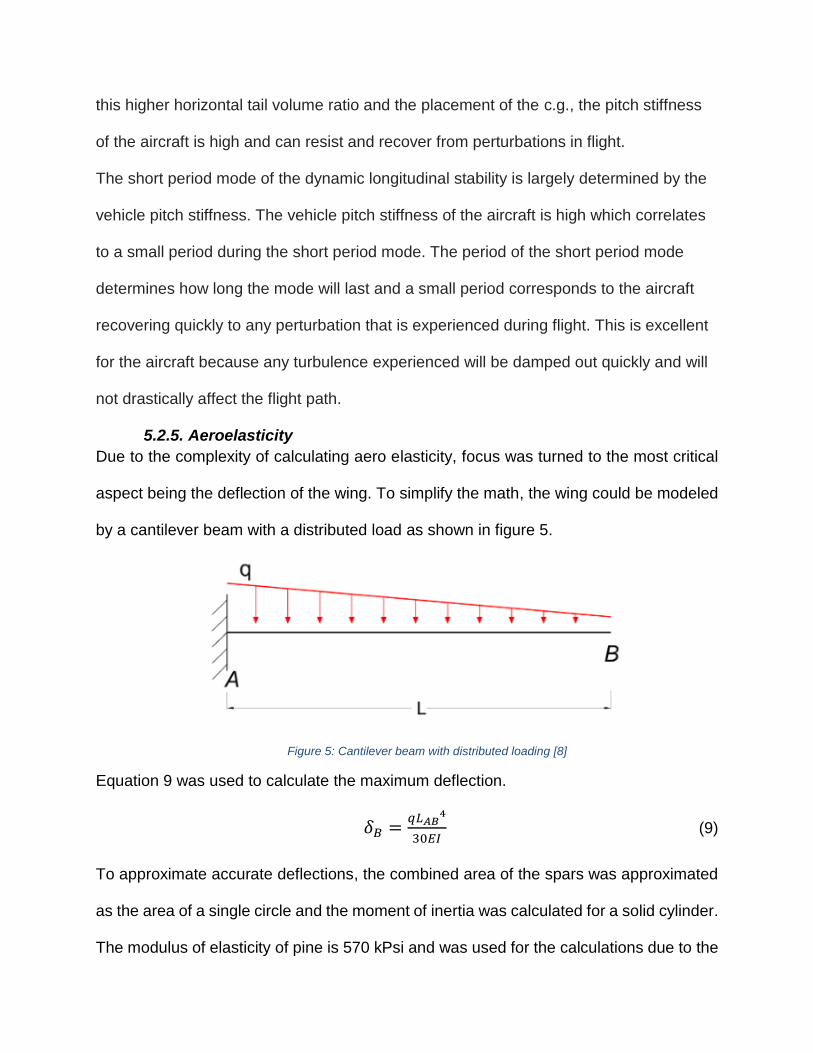
Due to the complexity of calculating aero elasticity, focus was turned to the most critical
aspect being the deflection of the wing. To simplify the math, the wing could be modeled
by a cantilever beam with a distributed load as shown in figure 5.
Figure 5: Cantilever beam with distributed loading [8]
Equation 9 was used to calculate the maximum deflection.
𝛿𝐵 =𝑞𝐿𝐴𝐵
4
30𝐸𝐼 (9)
To approximate accurate deflections, the combined area of the spars was approximated
as the area of a single circle and the moment of inertia was calculated for a solid cylinder.
The modulus of elasticity of pine is 570 kPsi and was used for the calculations due to the
spars of the wing being made of pine dowels [9]. The force of lift was 2.5 lbs. based on
maximum lift calculations.
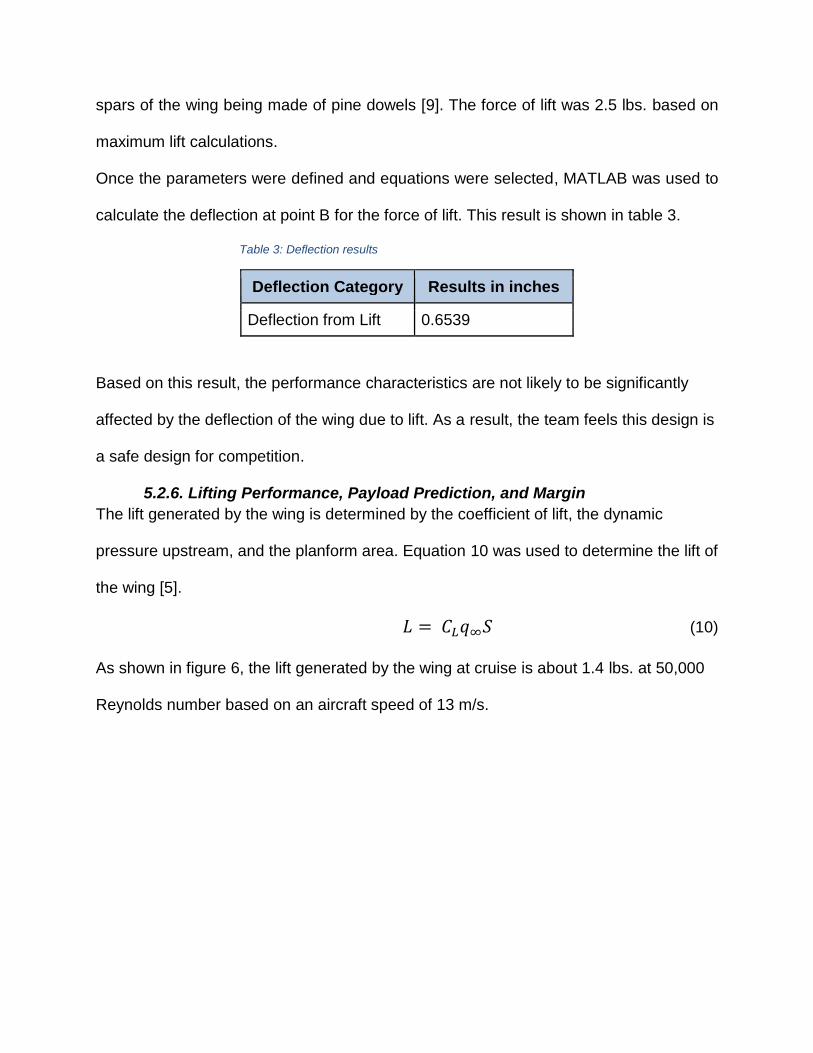
Once the parameters were defined and equations were selected, MATLAB was used to
calculate the deflection at point B for the force of lift. This result is shown in table 3.
Table 3: Deflection results
Deflection Category Results in inches
Deflection from Lift 0.6539
Based on this result, the performance characteristics are not likely to be significantly
affected by the deflection of the wing due to lift. As a result, the team feels this design is
a safe design for competition.
5.2.6. Lifting Performance, Payload Prediction, and Margin
The lift generated by the wing is determined by the coefficient of lift, the dynamic
pressure upstream, and the planform area. Equation 10 was used to determine the lift of
the wing [5].
𝐿 = 𝐶𝐿𝑞∞𝑆 (10)
As shown in figure 6, the lift generated by the wing at cruise is about 1.4 lbs. at 50,000
Reynolds number based on an aircraft speed of 13 m/s.
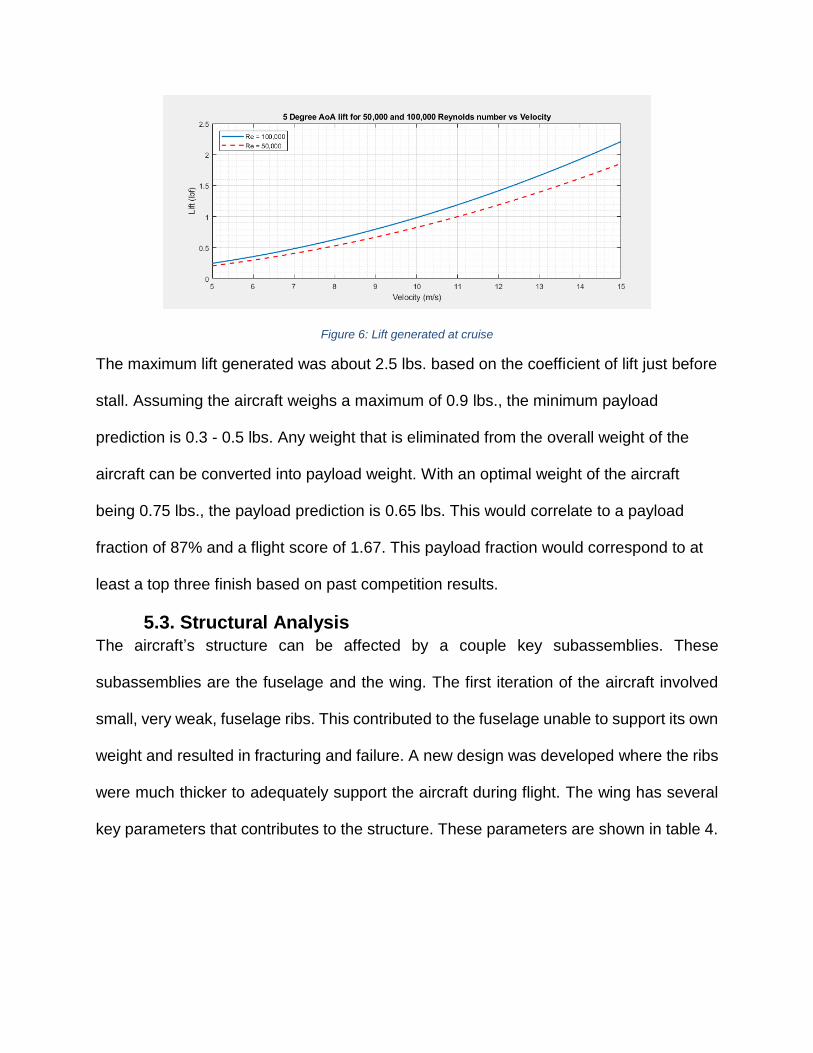
Figure 6: Lift generated at cruise
The maximum lift generated was about 2.5 lbs. based on the coefficient of lift just before
stall. Assuming the aircraft weighs a maximum of 0.9 lbs., the minimum payload
prediction is 0.3 - 0.5 lbs. Any weight that is eliminated from the overall weight of the
aircraft can be converted into payload weight. With an optimal weight of the aircraft
being 0.75 lbs., the payload prediction is 0.65 lbs. This would correlate to a payload
fraction of 87% and a flight score of 1.67. This payload fraction would correspond to at
least a top three finish based on past competition results.
5.3. Structural Analysis
The aircraft’s structure can be affected by a couple key subassemblies. These
subassemblies are the fuselage and the wing. The first iteration of the aircraft involved
small, very weak, fuselage ribs. This contributed to the fuselage unable to support its own
weight and resulted in fracturing and failure. A new design was developed where the ribs
were much thicker to adequately support the aircraft during flight. The wing has several
key parameters that contributes to the structure. These parameters are shown in table 4.
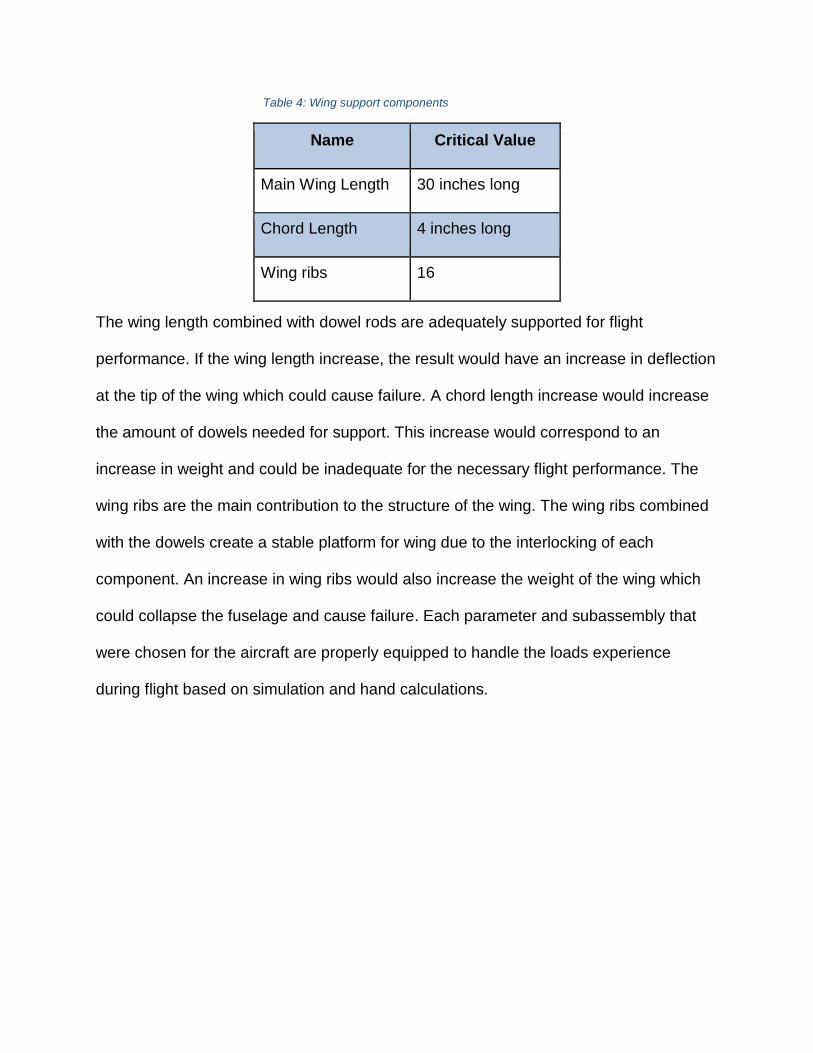
Table 4: Wing support components
The wing length combined with dowel rods are adequately supported for flight
performance. If the wing length increase, the result would have an increase in deflection
at the tip of the wing which could cause failure. A chord length increase would increase
the amount of dowels needed for support. This increase would correspond to an
increase in weight and could be inadequate for the necessary flight performance. The
wing ribs are the main contribution to the structure of the wing. The wing ribs combined
with the dowels create a stable platform for wing due to the interlocking of each
component. An increase in wing ribs would also increase the weight of the wing which
could collapse the fuselage and cause failure. Each parameter and subassembly that
were chosen for the aircraft are properly equipped to handle the loads experience
during flight based on simulation and hand calculations.
Name Critical Value
Main Wing Length 30 inches long
Chord Length 4 inches long
Wing ribs 16
5.3.2. Mass Properties & Balance
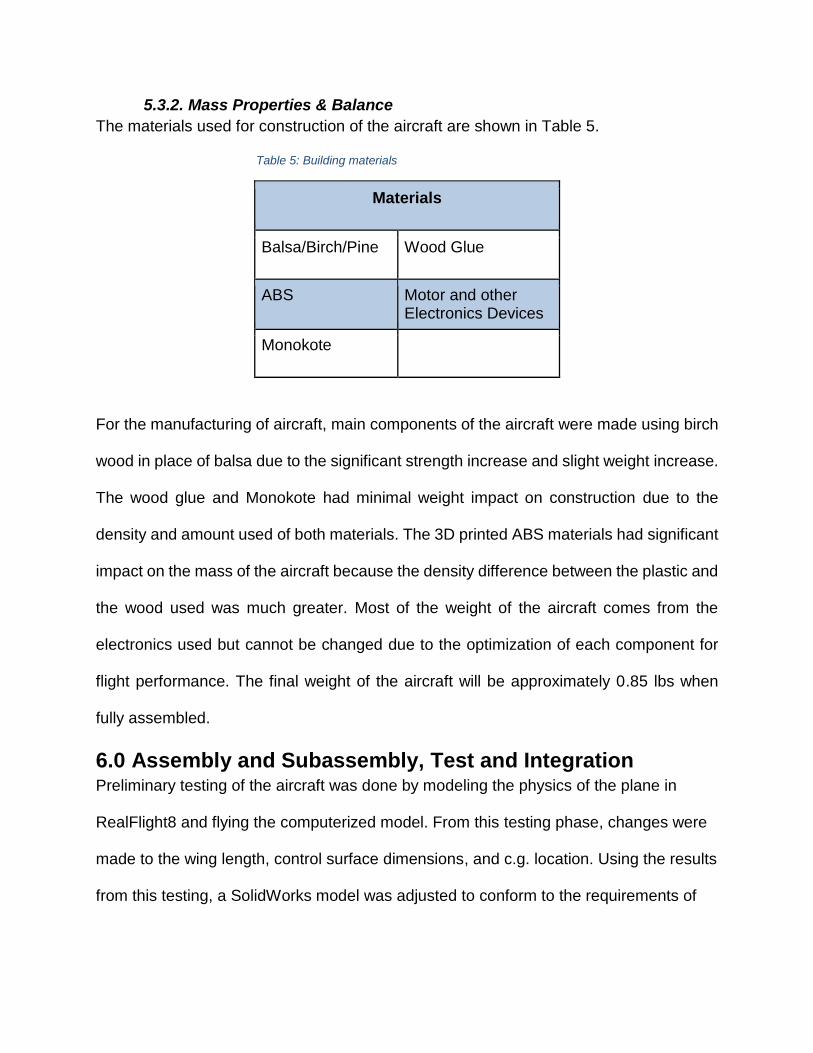
The materials used for construction of the aircraft are shown in Table 5.
Table 5: Building materials
Materials
Balsa/Birch/Pine Wood Glue
ABS Motor and other Electronics Devices
Monokote
For the manufacturing of aircraft, main components of the aircraft were made using birch
wood in place of balsa due to the significant strength increase and slight weight increase.
The wood glue and Monokote had minimal weight impact on construction due to the
density and amount used of both materials. The 3D printed ABS materials had significant
impact on the mass of the aircraft because the density difference between the plastic and
the wood used was much greater. Most of the weight of the aircraft comes from the
electronics used but cannot be changed due to the optimization of each component for
flight performance. The final weight of the aircraft will be approximately 0.85 lbs when
fully assembled.
6.0 Assembly and Subassembly, Test and Integration Preliminary testing of the aircraft was done by modeling the physics of the plane in
RealFlight8 and flying the computerized model. From this testing phase, changes were
made to the wing length, control surface dimensions, and c.g. location. Using the results
from this testing, a SolidWorks model was adjusted to conform to the requirements of
manufacturing. Once the aircraft was manufactured and constructed, final test flights
and iterations were completed to modify small aspects of the aircraft.
7.0 Manufacturing The manufacturing process for the aircraft included laser cutting, turning, 3D resin
printing, Monokote covering, and the creation of wing jigs to pursue a dimensionally
accurate and consistent final product. First, all wood products and assemblies were laid
out and laser cut. Aluminum pieces that connect the wings were turned carefully on a
lathe. Wing jigs were then designed and printed using a 3d resin printer and AB
material. The wing ribs were laid out inside the jig, checked for tolerances, and glued
into place. The leading and trailing edges then were glued into place and the wing was
sanded to final dimension and surface finish. The machined wing clips were glued to the
end of each spar rod on the left and right wing, respectively. Parallel to the construction
of the wing, the fuselage was glued together and the tail section was covered in
Monokote. Lastly, the fuselage and the wing were wrapped in Monokote after the
electronics were placed and the subassemblies were assembled to complete the final
assembly.
8.0 Conclusion In conclusion, the aircraft is aerodynamically capable of carrying the predicted payload
of 0.3-0.5 lbs.; is structurally strong enough to support the loads experienced during
flight and landing; and meets all requirements as set out by SAE rules and guide lines.
The lift generated during cruise flight is 1.4 lbs. with 0.12 lbs. of maximum drag. The
modular components of the fuselage and wing create small deflections during take-off,
flight, and landing. Based on the analysis done, the plane should be place in the top five
of competition teams at the competition in April.
References
[1] G. Staples, “Propeller Static & Dynamic Thrust Calculation - Part 1 of 2,”
ElectricRCAircraftGuy.com--RC, Arduino, Programming, & Electronics, 01-Jan-1970.
[Online]. Available: https://www.electricrcaircraftguy.com/2013/09/propeller-static-
dynamic-thrust-equation.html. [Accessed: 23-Feb-2019].
[2] M. Mueller, eCalc - the most reliable electric Motor Calculator on the Web for RC Pilots. [Online]. Available: https://www.ecalc.ch/motorcalc.php. [Accessed: 09-Nov-2018].
[3] “How Does Aspect Ratio Affect Your Wing?” Online Flight Training Courses and CFI
Tools. [Online]. Available: https://www.boldmethod.com/learn-to-fly/aircraft-
systems/how-does-aspect-ratio-affect-a-wing/. [Accessed: 23-Feb-2019].
[4] Clark y 11 airfoil. [Online]. Available:
http://airfoiltools.com/airfoil/details?airfoil=clarky-il. [Accessed: 23-Feb-2019].
[5] J. Anderson, Fundamentals of Aerodynamics. New York: McGraw-Hill, 2011, p.
437,503
[6] D. Caughey, Introduction to Aircraft Stability and Control Course Notes for M&AE
5070. New York: Cornell University, 2011, p. 23-26
[7] “Aircraft rule of thumbs” Massachusetts Institute of Technology. [Online]. Available:
https://ocw.mit.edu/courses/aeronautics-and-astronautics/16-01-unified-engineering-i-ii-
iii-iv-fall-2005-spring-2006/systems-labs-06/spl8.pdf [Accessed: 22-Feb-2019].
[8] “Cantilever Beams - Moments and Deflections,” Cantilever beams-engineering
toolbox. [Online]. Available: https://www.engineeringtoolbox.com/cantilever-beams-
d_1848.html. [Accessed: 23-Feb-2019].
[9] “Eastern White Pine,” The Wood Database. [Online]. Available: https://www.wood-
database.com/eastern-white-pine/. [Accessed: 23-Feb-2019].
[10] “Rules of thumb for plane design.” RC Group. [Online]. Available:
https://www.rcgroups.com/forums/showatt.php?attachmentid=4254867
[Accessed: 23-Feb-2019].

Appendix A – Supporting Documentation and Backup Calculations
Figure 7: Rules of thumb for plane design [10]
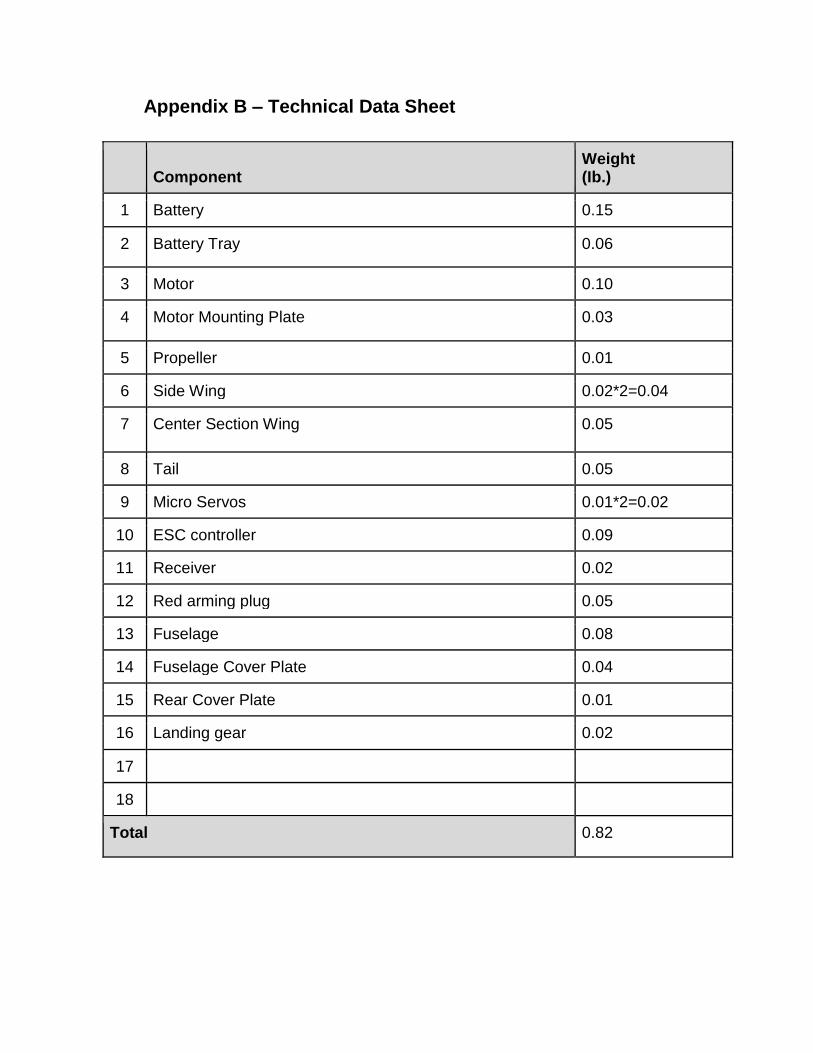
Appendix B – Technical Data Sheet
Component
Weight (Ib.)
1 Battery 0.15
2 Battery Tray 0.06
3 Motor 0.10
4 Motor Mounting Plate 0.03
5 Propeller 0.01
6 Side Wing 0.02*2=0.04
7 Center Section Wing 0.05
8 Tail 0.05
9 Micro Servos 0.01*2=0.02
10 ESC controller 0.09
11 Receiver 0.02
12 Red arming plug 0.05
13 Fuselage 0.08
14 Fuselage Cover Plate 0.04
15 Rear Cover Plate 0.01
16 Landing gear 0.02
17
18
Total 0.82
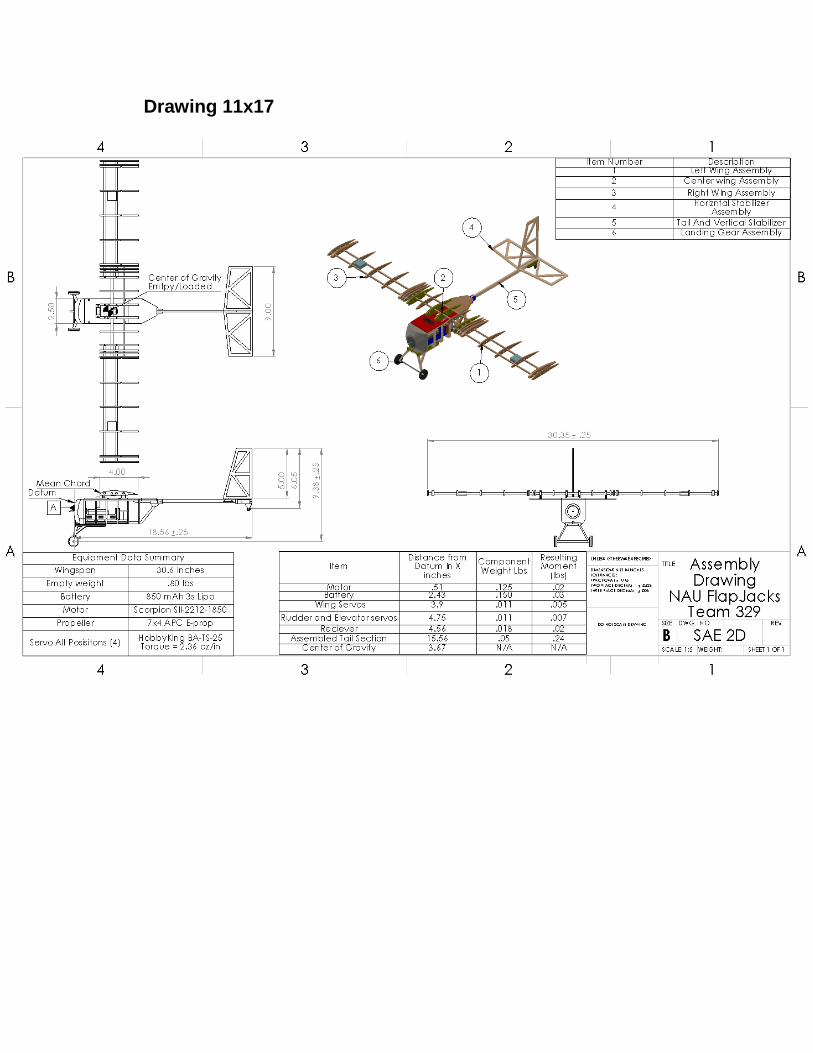
Drawing 11x17