Embed Size (px)
Citation preview

UNIVERSITY OF CALGARY
Metabolomic and lipidomic profiling of the effect of edelfosine treatment on
Saccharomyces cerevisiae
by
Nicolas Pietro Tambellini
A THESIS
SUBMITTED TO THE FACULTY OF GRADUATE STUDIES
IN PARTIAL FULFILMENT OF THE REQUIREMENTS FOR THE
DEGREE OF MASTER OF SCIENCE
DEPARTMENT OF BIOLOGICAL SCIENCES
CALGARY, ALBERTA
JANUARY, 2014
© Nicolas Pietro Tambellini 2014

ii
Abstract
Edelfosine is a lysophosphatidylcholine analogue and the prototype of a new class of
compounds being investigated for their potential as highly selective chemotherapeutic
agents. Edelfosine has been implicated as affecting numerous different metabolic
pathways, though its mechanism of action is not well understood at this time. To gain
further insight into edelfosine’s mechanism of action we carried out mass spectrometry
based metabolomic and lipidomic profiling of yeast exposed to a cytostatic
concentrations of edelfosine. Using multivariate projection methods and statistical
analysis, we determined that edelfosine exerts a significant effect on many aspects of
yeast metabolism. Metabolic pathways that were found to be perturbed included those
involved with amino acid metabolism, sugar metabolism, the TCA cycle, fatty acid
biosynthesis, sphingolipid metabolism, glycerophospholipid metabolism and glycerolipid
metabolism. It was also observed that there is a kinetic difference in the response of polar
and non-polar metabolites to edelfosine treatment in yeast.

iii
Acknowledgments
I would like to first thank Dr. Ray Turner for agreeing to be my supervisor. You
have helped me grow immensely as a person and a scientist. The skills and ideologies
you have developed and instilled in me will be instrumental as I go forward and explore
new academic and career opportunities. Your encouragement to find balance inside and
outside of my academic pursuits has been key in my success and you are everything and
more a student could ever ask for as a supervisor.
I would also like to thank my committee members Dr. Aalim Weljie and Dr.
Elmar Prenner. Dr. Weljie, you have been an excellent mentor and your patience,
knowledge and support has been extremely important. Dr. Prenner I have learned so
much from you both as an instructor and as a scientist. The insights and ideas both of you
have provided throughout my project have been extremely helpful. Additionally I would
like to thank Dr. Vanina Zaremberg for starting me on this project and for her help and
thoughts throughout the last two and a half years. Furthermore, I would also like to thank
Dr. David Schriemer for agreeing to be my internal-external examiner. I learned so much
from you about mass spectrometry through your teaching and discussion which has been
extremely helpful during the course of my project.
I would also like to past and present members of both the Turner and Weljie labs.
You are a great group of people and fun to work with and be around. I wish you all
success in your future endeavours and am positive you will be very successful as you are
all very intelligent and driven individuals.

iv
Finally I would like to all my family and friends (too many to name) who have
been with me through all of my ups and downs. Your support and generosity have
encouraged me to continue working towards the achievement of my goals and dreams
and for that I will be forever grateful.

v
Dedication
To my mom, thank you for all of your encouragement, love and sacrifices that have
allowed me to be where I am today.

vi
Table of Contents
Abstract ............................................................................................................................... ii
Acknowledgements ............................................................................................................ iii
Dedication ........................................................................................................................... v
Table of Contents ............................................................................................................... vi
List of Tables ..................................................................................................................... xi
List of Figures ................................................................................................................... xii
List of Symbols, Abbreviations and Nomenclature ......................................................... xiv
Chapter One: Introduction .............................................................................................. 1
1.1 Lipid based cancer drugs ........................................................................................... 1
1.1.1 Phosphatidylinositol ether lipid analogues (PIA’s) ............................................ 1
1.1.2 Anti-tumour lipid analogues (ATL’s)................................................................. 2
1.2 Background on edelfosine ......................................................................................... 4
1.2.1 Pathways proposed to be affected by edelfosine treatment ................................ 5
1.2.2 Uptake of edelfosine ........................................................................................... 8
1.2.3 Clinical applications of edelfosine ..................................................................... 9
1.3 Yeast as a model system for cancer ........................................................................ 10
1.3.1 Drug studies in yeast......................................................................................... 10
1.3.2 Edelfosine studies in yeast ................................................................................ 11
1.4 Metabolomics .......................................................................................................... 13
1.4.1 Metabolomics methodology ............................................................................. 13
1.4.2 Lipidomics: A subspecialty of metabolomics .................................................. 16

vii
1.5 Multivariate analysis ............................................................................................... 17
1.6 Research goals ......................................................................................................... 20
Chapter Two: Materials and Methods .......................................................................... 21
2.1 Yeast growth and sample harvesting ....................................................................... 21
2.2 Metabolite extraction............................................................................................... 21
2.3 GC-MS analysis ...................................................................................................... 22
2.3.1 Sample preparation and derivitization for GC-MS analysis ............................. 22
2.3.2 GC-MS data acquisition ................................................................................... 23
2.3.3 GC-MS data processing .................................................................................... 24
2.4 LC-MS analysis ....................................................................................................... 25
2.4.1 Addition of internal standards to LC-MS samples ........................................... 25
2.4.2 UPLC-TOF-MS data acquisition ...................................................................... 25
2.5 Multivariate statistical analysis ............................................................................... 28
2.6 Pathway analysis and metabolic network construction ........................................... 29
Chapter Three: Optimization of Metabolite and Fatty Acid Extraction from
Saccharomyces cerevisiae ................................................................................................ 31
3.1 Introduction ............................................................................................................. 31
3.2 Results and discussion ............................................................................................. 32
3.2.1 Unsupervised analysis clearly differentiates extraction method ...................... 34
3.2.2 Supervised analysis identifies 36 metabolites and four fatty acids
differentiating the extraction methods ....................................................................... 34
3.2.3 Comparison of FAME and aqueous metabolite profiles obtained ................... 39
3.2.4 Summary ........................................................................................................... 44
3.3 Experimental section ............................................................................................... 44

viii
3.3.1 Yeast growth and harvesting ............................................................................ 44
3.3.2 Metabolite extraction ........................................................................................ 44
3.3.3 Derivatization and sample preparation ............................................................. 46
3.3.4 GC-MS data acquisition .................................................................................. 47
3.3.5 Data processing and interpretation .................................................................. 47
3.4 Conclusions ............................................................................................................. 48
3.5 Contributions ........................................................................................................... 48
Chapter Four: Polar Metabolite and Fatty Acid Profiling of Edelfosine Treated
Saccharomyces cerevisiae ............................................................................................... 49
4.1 Introduction ............................................................................................................. 49
4.2 Experimental methods ............................................................................................. 50
4.2.1 Yeast and edelfosine growth curves ................................................................. 50
4.2.2 Yeast sample growth and sample harvesting .................................................... 51
4.2.3 Sample extraction and derivitization ................................................................ 51
4.2.4 GC-MS data acquisition ................................................................................... 52
4.2.6 Metabolite modelling and pathway analysis .................................................... 52
4.3 Results ..................................................................................................................... 52
4.3.1 Growth with edelfosine .................................................................................... 52
4.3.2 OPLS-DA modelling differentiates edelfosine treated and untreated samples 54
4.3.3 22 polar metabolites and 8 fatty acids altered by edelfosine treatment ............ 58
4.3.4 Metabolic pathway analysis .............................................................................. 61
4.4 Discussion ............................................................................................................... 61
3.5 Contributions ........................................................................................................... 72

ix
Chapter Five: Lipidomic Profiling using UPLC-TOF-MS of Edelfosine Treated
Saccharomyces cerevisiae ................................................................................................ 74
5.1 Introduction ............................................................................................................. 74
5.2 Experimental methods ............................................................................................. 75
5.2.1 Sample preparation ........................................................................................... 75
5.2.2 UPLC-TOF-MS analysis .................................................................................. 75
5.2.3 Data analysis and multivariate projection modelling ....................................... 75
5.2.4 Lipid identification ........................................................................................... 76
5.3 Results ..................................................................................................................... 77
5.3.1 Initial analysis reveals magnitude of edelfosine treated samples is higher than
untreated samples ...................................................................................................... 77
5.3.2. Multivariate projection modelling differentiates edelfosine treated and
untreated yeast samples from lipidomic profiling ..................................................... 81
5.3.3. 28 Lipids from 7 major lipid classes identified to be altered by edelfosine
treatment .................................................................................................................... 81
5.4 Discussion ............................................................................................................... 87
5.5 Contributions ........................................................................................................... 91
Chapter Six: Concluding Remarks and Future Directions ........................................ 93
6.1 Summary of research objectives and implications .................................................. 93
6.1.1 Evaluation of extraction protocols for yeast ..................................................... 93
6.1.2 Analysis of changes in the metabolome and fatty acid profile of yeast induced
by edelfosine treatment. ............................................................................................. 94
6.1.3 Analysis of changes in the lipidome of yeast induced by edelfosine treatment.
................................................................................................................................... 95
6.1.4 Secondary analysis and biological interpretation of the metabolomics data .... 96

x
6.2 Future directions ...................................................................................................... 99
6.2.1 Further metabolomics studies ........................................................................... 99
6.2.2 Confirming our biological interpretations ...................................................... 101

xi
List of Tables
Table 1.1. Steps and methods from a typical metabolomics experiment.......................... 14
Table 2.1. Internal standards added to samples for ultra perfomance liquid
chromatography time-of-flight mass spectrometry (UPLC-TOF-MS) analysis. ............. 26
Table 3.1. Metabolites identified to have a VIP score greater than 1 through OPLS-DA
modelling of aqueous metabolite and FAME extraction data and the corresponding
coefficient values for each extraction protocol. ................................................................ 40
Table 4.1. Summary of parameters for the assessment of the quality of OPLS-DA models
comparing edelfosine treated and untreated yeast samples. ............................................. 57
Table 4.2. Polar metabolites and fatty acids identified to have a VIP score greater than 1
through OPLS-DA modelling and the corresponding coefficient values for edelfosine
treated samples compared to untreated samples. .............................................................. 59
Table 4.3. Identified metabolites that were found to be not significantly perturbed by
edelfosine treatment through OPLS-DA modelling and have VIP scores of less than 1. 62
Table 4.4. Pathway analysis results from edelfosine treatment of yeast using
MetaboAnalyst 2.0. ........................................................................................................... 63
Table 5.1. Lipids identified as altered by edelfosine treatment, their m/z values, retention
times and the adduct used for identification. .................................................................... 84

xii
List of Figures
Figure 1.1: Names and chemical structures of lysophosphatidylcholine, the synthetic
alkylyphospholipid edelfosine and its derivatives. ............................................................. 3
Figure 1.2. Pathways that have been proposed to be affected by edelfosine treatment and
the resulting cell survival, proliferation and pro-apoptotic processes affected. ................. 6
Figure 1.3. Suggested working mode of action for edelfosine in yeast. ........................... 12
Figure 1.4 Projection methods simplify all observations for a sample into a single point to
allow for easy visualization and comparison. ................................................................... 18
Figure 3.1. Models for polar metabolites extracted from S. cerevisiae by one of three
chloroform/methanol/water based extraction protocols. ................................................... 36
Figure 3.2. Models for fatty acid metabolites extracted from S. cerevisiae by one of three
chloroform/methanol/water based extraction protocols. ................................................... 37
Figure 3.3. Shared and unique structure (SUS) plots of fatty acid and polar metabolites
from S. cerevisiae by one of three chloroform/methanol/water based extraction protocols.
........................................................................................................................................... 42
Figure 4.1. Yeast and edelfosine treatment growth curves. .............................................. 53
Figure 4.2. OPLS-DA models using cross-validated latent variables (tcv) and cross-
validated orthogonal latent variables (tocv) comparing the polar metabolite profiles of
untreated and edelfosine treated S. cerevisiae samples at 4 timepoints after treatment ... 55
Figure 4.3. OPLS-DA models comparing the fatty acid profiles using tcv’s and tocv’s for
FAME analysis of untreated and edelfosine treated S. cerevisiae samples at 4 timepoints
after treatment .................................................................................................................. 56

xiii
Figure 4.4. MetaboAnalyst 2.0 pathway analysis summary of perturbations caused by
edelfosine treatment of yeast samples............................................................................... 64
Figure 4.5. Examples illustrating the different kinetic responses from 0 to 6 hours after
edelfosine treatment observed for polar metabolites and fatty acids. ............................... 67
Figure 4.6. Schematic overview of polar metabolites, fatty acids and metabolic pathway
affected by edelfosine treatment. ...................................................................................... 69
Figure 5.1. Retention time deviation observed for 8 untreated and 10 edelfosine treated
yeast samples uploaded to XC-MS Online for analysis and peak detection. .................... 78
Figure 5.2. Cloud plot obtained from XC-MS Online analysis of 10 edelfosine treated and
8 untreated yeast samples.................................................................................................. 79
Figure 5.3. Total ion chromatograms for 8 untreated and 10 edelfosine treated yeast
samples uploaded to XC-MS Online for analysis and peak detection. ............................. 80
Figure 5.4. Pareto scaled PCA and OPLS-DA models of 8 untreated and 10 edelfosine
treated yeast samples from lipidomic profiling ................................................................ 82
Figure 5.5. S-plot of 8 untreated and 10 edelfosine treated yeast samples from lipidomic
profiling to identify lipids decreased or increased by edelfosine treatment ..................... 83
Figure 6.1. Schematic overview of polar metabolites, fatty acids and lipids identified to
be affected by edelfosine in yeast through metabolomic and lipidomic profiling. ........... 98

xiv
List of Symbols, Abbreviations and Nomenclature
Symbol or Abbreviation Definition
APL alkylphospholipid
ASK1 apoptosis signal-regulating kinase 1
ATP adenosine triphosphate
ATL anti-tumour lipids
CDP cytidine-diphosphate
Cer ceramide
CK choline kinase
CL cardiolipin
CPT choline phosphotransferase
CT CTP:phosphocholine cytidyltransferase
CV-ANOVA cross-validated analysis of variance
DAG diacylglycerol
DNA deoxyribonucleic acid
EI electron ionization
ER endoplasmic reticulum
FAME fatty acid methyl ester
GABA γ-aminobutyric acid
GC-MS gas-chromatography mass spectrometry
GC-TOF-MS gas chromatography time-of-flight mass
spectrometer
LC-MS liquid-chromatography mass spectrometry
LV latent variable
LPI lysophosphatidylinositol
LPC lysophosphatidylcholine
MALDI matrix-assisted laser desorption/ionization
MAPK/ERK mitogen-activated protein kinase/extracellular-
signal regulated kinases

xv
MS mass spectrometry
MSTFA N-methyl-N-(trimethylsilyl) trifluoroacetamide
mTOR mammalian target of rapamycin
m/z mass to charge ratio
S/N signal to noise
NMR nuclear magnetic resonance
OD600 optical density at 600 nm
OPLS-DA orthogonal partial least squares-discriminant
analysis
p magnitude of a variable
p(corr) reliability of a variable
PA phosphatidic acid
PC1 prinicipal component 1
PC phosphatidylcholine
PCA principal component analysis
PDK phosphoinositide-dependent kinase
PE phosphatidylethanolamine
PG phosphatidylglycerol
PGP phosphatidylglycerol phosphate
PIA phosphatidylinositol ether lipid analogues
PI3K phosphatidylinositol 3ˈ - kinase
PIP2 phosphatidylinositol-4,5 bisphosphate
PIP3 phosphatidylinositol-3,4,5 triphosphate
PKB protein kinase B
PKC protein kinase C
PKD protein kinase D
PLC phospholipase C
PLD phospholipase D
PM plasma membrane
Q2 predictive quality of the model
Q-TOF-MS quadropole time-of-flight mass spectrometry

xvi
R2 fit of the data
RasGRP Ras guanine-releasing protein
Req. score required similarity score
RI retention index
ΔRI change in retention index
ROS reactive oxygen species
SAPK/JNK stress-activated protein kinase/c-Jun NH2-terminal
kinase
SD selective defined
SM sphingomyelin
SMS sphingomyelin synthase
SUS shared and unique structure
TAG triacylglycerol
TCA tricarboxylic acid
tocv cross-validated orthogonal latent variables
tcv cross-validated latent variables
μl microliter
UPLC-TOF-MS ultra performance liquid chromatography time-of-
flight mass spectrometry
VIP variable influence on projection
YNB yeast nutrient broth
YPD yeast extract-peptone dextrose

1
Chapter One: Introduction
1.1 Lipid based cancer drugs
As the search for novel therapeutic approaches for cancer treatment continues to
progress, new strategies are coming to the forefront. Of the new strategies being explored
including bioactive peptides (1), non-pathogenic bacteria (2) and oncolytic viruses (3),
one approach that has gained increased interest is the use of lipid analogues as potential
therapeutic agents for cancer. Lipid analogues show promise as they do not target DNA
or DNA synthesis as is the case with traditional chemotherapeutic agents (4), potentially
leading to less toxic side effects. There are two main types of synthetic lipid analogues
currently being explored for their potential use as anti-cancer compounds;
phosphatidylinositol ether lipid analogues (PIA’s) and synthetic anti-tumour lipids
(ATL’s).
1.1.1 Phosphatidylinositol ether lipid analogues (PIA’s)
A review written in 2004 by Gills and Dennis (5) discusses in detail the
development of PIA’s and their biological activities. Briefly, PIA’s inhibit Akt
translocation, phosphorylation and kinase activity (5) and were developed based on the
observation that D-3-deoxy-3-substituted myo-inositol analogues inhibited cell growth of
oncogene transformed cells but were antagonized by myo-inositol itself (6). Akt, also
known as protein-kinase B (PKB) is involved in the phosphatidylinositol 3’-kinase
(PI3K) signalling pathway which is thought to be involved in the control of key processes
involved with cancer (5). A follow up study found that PIA’s are less potent but more
cytotoxic than other PI3K/Akt/mTOR (mammalian target of rapamycin) inhibitors and

2
biologically distinct from these inhibitors in their modes of action (7). Further studies
found that PIA’s activate p38α which is involved in the p38 pathway that responds to cell
stress and induces apoptosis (8). It was also found that PIA’s caused increased expression
of tumour suppressor genes as Akt-independent effects that likely contributed to the
increased cytotoxicity observed for PIA’s (9).
1.1.2 Anti-tumour lipid analogues (ATL’s)
Most ATL’s, more commonly referred to as alkylphospholipids (APL’s), are
derived from edelfosine which is a metabolically stable analog of
lysophosphatidylcholine and will be discussed more in depth below. An in depth review
written in 2008 of edelfosine and some of its derivatives including ilmofosine,
erucylphosphocholine, miltefosine and perifosine (Figure 1.1) by van Blitterswijk and
Verheij (10) discusses what is known about the mechanisms of action, cellular sensitivity
and clinical prospects of APL’s. A brief synopsis of some of the uses and prospects of
these compounds is discussed below, though interestingly it seems that they all have
similar modes of action based on what is currently understood.
Ilmofosine varies from edelfosine in that it has a thioether linkage as opposed to
an ether linkage. Ilmofosine initially showed promising results as it was able to induce
apoptosis in the Lewis-Lung carcinoma model (11) and neuroblastoma cells (12) and
was effective in pre-clinical trials in vivo (13). However during clinical trials much less
promise was shown (10) and little follow up work has been done since.
Miltefosine differs from most other APL’s in that it is not metabolically stable
and can be metabolized by phospholipases (14). Despite this fact, it has shown
antitumour activity in vitro (14) and differs from edelfosine in that it lacks a glycerol

3
Figure 1.1: Names and chemical structures of lysophosphatidylcholine, the synthetic alkylyphospholipid edelfosine and its
derivatives. Figure adapted from (10).
LysoPC Edelfosine Ilmofosine Miltefosine Erucylphosphcholine Perifosine

4
backbone, making it the simplest structure in the APL class of compounds that still
demonstrates antitumour activity (15). Due to its hemolytic nature when administered
intravenously (16), miltefosine is more commonly used to treat leishmaniasis (17), in
addition to being used as a topical agent for breast cancer skin metasteses (18) and
cutaneous lymphoma (19). These applications make it the most clinically used APL
compound to date. As such another edelfosine derivative, erucylphosphocholine has been
developed. Erucylphosphocholine also lacks a glycerol backbone and differs from
miltefosine only due to having a longer alkyl chain and the presence of a double bond
making it more hydrophobic and eliminating its hemolytic nature (20), allowing for
intravenous use (21). Due to these properties, erucylphosphocholine has shown promise
for the treatment of brain tumours (21) as it is able to pass the blood brain barrier.
Perifosine is another APL with a unique structure that is similar to miltefosine,
with the only difference being that the choline headgroup has been replaced with a
heterocyclic piperidin group (22). Perifosine has also shown very promising signs for its
use clinically. Firstly, it was able to induce apoptosis in patient derived multiple myeloma
cells that were resistant to conventional treatment in addition to human multiple myeloma
cell lines (23). Furthermore, it has been shown that perifosine can enhance
radiosensitivity of two carcinoma tumour types without the resulting bone marrow
toxicity that is commonly seen with current treatment strategies (24).
1.2 Background on edelfosine
As mentioned previously, edelfosine (1-O-octadecyl-2-O-methyl-rac-glycero-3-
phosphocholine, Et-18-OCH3), is the prototype for the ATL group of compounds and is a
lysophosphotidylcholine analog (Figure 1.1). It was originally synthesized in the 1960’s,

5
along with other ether lipids, while searching for novel immune modulators that were
made to be metabolically stable and resistant to acyltransferases and phospholipases
through modifications of the glycerol backbone at the C1 and C2 positions (25). In
addition to being immune modulators, many of these ether lipids were found to have
selective antitumour activities in vitro and in vivo (26,27) and the ability to induce
apoptosis in cells (28,29).
1.2.1 Pathways proposed to be affected by edelfosine treatment
Numerous pathways have been suggested to be affected by treatment with
edelfosine, with cell type potentially dictating the most important molecular target/targets
(10). The different pathways proposed to be affected by edelfosine can be seen in Figure
1.2 and the evidence for each will be briefly stated, with a more extensive discussion
found in the review by van Blitterswijk and Verheij (10).
Strong evidence exists that edelfosine has an effect on phosphatidylcholine (PC)
biosynthesis through inhibition of the endoplasmic reticulum (ER) enzyme
CTP:phosphocholine cytidylyltransferase, which is the rate limiting step for the
biosynthesis of PC (30,31). Furthermore, it has been observed that edelfosine is able to
inhibit the phospholipase D (PLD) mediated breakdown of PC to phosphatidic acid (32)
and phospholipase C (PLC) mediated breakdown of PC to diacylglycerol (DAG) in
small cell lung carcinoma cells due to inhibition of phospholipase C-β1 with its direct
activator (33). Through PLC and PLD inhibition, edelfosine has been suggested to exert
an effect on the mitogen-activated protein kinase/extracellular-signal regulated kinases
(MAPK/ERK) pathway which is involved with cell proliferation (34).
Another pathway edelfosine has been shown to exert an effect on is the

6
PC
PLD PLC
PA Choline
Bad, caspase 9,
Mdm2/p53
SMSSM
Ceramide
DAG
PC
P-Choline
CDP-Choline
DAG
c-Raf Ras
Edelfosine
rafttransporter
RasGRPPKC
PKD
MAPK/ERK
Proliferation
PIP2
Survival ER Stress, ROS, ASK1, SAPK/JNK
Apoptosis
PKB/Akt
mTOR
PI3K
PIP3 PDK
CK
CT
CPT

7
Figure 1.2. Pathways that have been proposed to be affected by edelfosine treatment and the resulting cell survival, proliferation
and pro-apoptotic processes affected. List of abbreviations: ASK1 (apoptosis signal-regulating kinase 1), APL (alkylphospholipid), CK
(choline kinase), CPT (choline phosphotranferase), CT (CTP:phosphocholine cytidyltransferase), DAG (diacylglycerol), MAPK/ERK
(mitogen-activated protein kinase/extracellular-signal regulated kinases), PA (phosphatidic acid), PC (phosphatidylcholine), PDK
(phosphoinositide-dependent kinase), PLC (phospholipase C), PLD (phospholipase D), PKB/Akt (protein kinase B/Akt), PKC (protein
kinase C), PKD (protein kinase D), PI3K (phosphatidylinositol-3-kinase), PIP2 (phosphatidylinositol-4,5 bisphosphate), PIP3
(phosphatidylinositol-3,4,5 triphosphate), RasGRP (Ras guanine-releasing protein), ROS (reactive oxygen species), SAPK/JNK (stress-
activated protein kinase/c-Jun NH2-terminal kinase), SMS (sphingomyelin synthase). Figure adapted from (10).
8
PI3K-Akt/PKB survival pathway with dose-dependent inhibition seen in A431 and HeLa
epithelial carcinoma cells seen (35). Additionally it was found that inhibition of the
PI3K/Akt pathway resulted in activation of the pro-apoptotic stress-activated protein
kinase/c-Jun NH2-terminal kinase (SAPK/JNK) pathway (35,36). The SAPK/JNK
pathway can be activated by Fas/CD95 (37), a death receptor on the surface of cells that
leads to apoptosis, stimulation and cellular stresses (38). This supports observations that
Fas/CD95 death receptor is involved in inducing apoptosis in human leukemic cells
treated with edelfosine (39) and that edelfosine induced ER stress leads to apoptosis
(40,41). Further supporting the induction of cellular stress by edelfosine and the role of
the SAPK/JNK pathway in apoptosis, it has been shown that Jurkat cells treated with
edelfosine showed enhanced productions of reactive oxygen species (ROS) (42).
1.2.2 Uptake of edelfosine
There is strong evidence that edelfosine is able to easily incorporate into the
plasma membrane (43). As discussed above the targets of edelfosine are located in the
ER, on the cytoplasmic side of the plasma membrane or the membranes of endosomes,
dictating that edelfosine has to be internalized after insertion in the plasma membrane
(10). Two modes of internalization have so far been suggested; either movement from the
outer leaflet to inner leaflet of the bilayer or internalization through lipid-raft mediated
endocytosis (Figure 1.2). As spontaneous flipping of edelfosine across the bilayer is
probably very energetically unfavourable, it seems more likely that a lipid transporter is
involved (10). Though no specific lipid transporter has been found thus far in human or
tumour cells, there is evidence to support this method of internalization. It was observed
that KB epidermal carcinoma cells were highly dependent on intracellular adenosine

9
triphosphate (ATP) and ambient temperature for APL uptake and the uptake was not
affected by treatment with an inhibitor of raft-mediated endocytosis (44). These results
showed that APL uptake was via an energy-dependent and endocytosis-independent
process, suggesting the need for a transporter (44). This conclusion was also supported by
an independent study (45).
It has been definitively shown that after insertion into the plasma membrane,
edelfosine accumulates in lipid rafts and is internalized through a lipid raft dependent
endocytosis pathway (31,46). The importance of this lipid raft-mediated endocytosis was
confirmed by experiments showing that pre-treatment of cells with raft-disrupting agents
resulted in reduced APL uptake and apoptosis (47). Furthermore, observations that the
inability to synthesize sphingomyelin (SM) due to downregulated sphingomyelin
synthase (SMS) and disruption of cholesterol trafficking to the trans-Golgi network
caused edelfosine resistance (48) suggest the importance of these components for lipid-
raft dependent uptake of edelfosine. It should be noted that SMS is involved with the
conversion of ceramide (Cer) to SM (Figure 1.2) and that increased levels of ceramide
were proposed to mediate apoptosis upon treatment with miltefosine (49), suggesting
conflicting results and that further work in this area is still needed.
1.2.3 Clinical applications of edelfosine
Despite its status as the prototype compound for the ATL family of compounds,
the only current clinical use for edelfosine is in the purging of leukemic bone marrow
cells (50). During the early 1980’s phase I clinical trials of edelfosine showed early
tumour and leukemia response with antineoplastic activity being observed, suggesting it
could potentially have clinical value (51). Phase II clinical trials of 116 non-small-cell

10
lung carcinoma patients treated with edelfosine demonstrated very little promise with
only 2 showing partial remission of the 81 patients who tolerated the treatment (52). In
addition to anti-cancer applications edelfosine has also been used for other therapeutic
purposes. Among these uses, edelfosine promoted improved clinical symptoms in a trial
with a limited number of multiple sclerosis patients (53). Edelfosine and some analogues
have also been reported to inhibit human immunodeficiency virus (HIV) reverse
transcriptase suggesting a potential future as an anti-HIV drug (54).
1.3 Yeast as a model system for cancer
Saccharomyces cerevisiae has a long history as an extremely beneficial model
organism due to the high degree of conservation in the basic cellular processes and
pathways found in yeast and higher eukaryotic organisms in addition to the advantages of
yeast genetics (55). To this end, yeast has been a very important tool for understanding
processes including DNA repair mechanisms (56) and the cell cycle (57).
1.3.1 Drug studies in yeast
Yeast also has a very successful history in the development of compounds for
pharmaceutical uses and an excellent review discussing the many advantages of using
yeast as a model organism for anticancer drug discovery are discussed (58). Among
them are its very simple growth requirements, rapid cell division and the ease with which
genetic manipulations and screens can be done (58). A number of yeast genomic assays
have been developed for drug and target discovery including drug-induced haploid
deficiency profiling, haploid deletion chemical genetic profiling, multi-copy suppression
profiling and comparative expression profiling as discussed by Smith et al. (59). One
well known example of yeasts use to uncover a mode of action is rapamycin, which was

11
instrumental in uncovering the molecular target of rapamycin (60). Another example of
how S. cerevisiae can be used to investigate the mode of action of compounds is
tamoxifen, a drug used for the treatment of breast cancer that was found to disrupt
calcium homeostasis through chemical-genetic profiling of 82 compounds and natural-
product extracts with yeast haploid deletion mutants (61).
1.3.2 Edelfosine studies in yeast
In addition to yeasts successful use for the study of different aspects of cancer, it
has also been successfully used to uncover aspects of the mode of action of edelfosine.
As previously mentioned, it has been suggested that one of two ways through which
edelfosine was internalized was likely through a lipid transporter though it has not yet
been identified. Using a combined mutant selection and screen in yeast, it was
determined that the Lem3, a plasma membrane protein, was required for normal transport
of phosphatidylcholine and APL’s including edelfosine (62). Another genetic screen
using yeast showed that edelfosine treatment resulted in Pma1, a plasma membrane
ATPase, selectively partitioning out of lipid rafts and being localized to vacuoles (63).
Additionally, this study also found that yeast cells with deficient endocytosis and
vacuolar protease activities prevented sterol movement out of the plasma membrane
(PM), in addition to preventing Pma1 loss from lipid rafts and apoptosis (63). A follow
up studying examining the protective effect exhibited by vitamin E on edelfosine treated
cells showed it is a result of both its antioxidant activity and lipophilic nature and results
in inhibition of the oxidative stress response induced by edelfosine (64). Furthermore, the
authors put forward a working model for the mode of action in yeast that can be seen in
Figure 1.3 involving the insertion of edelfosine into the plasma membrane followed by

12
Edelfosine
Sterols
Pma1p
Vacuole
51
3
2
4
6
Figure 1.3. Suggested working mode of action for edelfosine in yeast. 1) Edelfosine inserts into the plasma membrane and is flipped by
a Lem3p regulated flippase. 2) Interaction of edelfosine with the plasma membrane induces sterol internalization. 3) Displacement of the
essential proton pump, Pmap1, from lipid rafts. 4) Pmap1 is endocytosed followed by. 5-6) Degradation in the vacuole. Figure obtained
from (64).

13
flipping to the inner leaflet by a Lem3 regulated flippase and sterol internalization (64).
Pma1 is also displaced from lipid rafts, endocytosed and degraded in the vacuole (64).
1.4 Metabolomics
Metabolomics is a rapidly emerging technique that follows on the heels of other
omics technologies such as genomics, transciptomics and proteomics. It has quickly seen
widespread use across multiple disciplines as metabolites can serve as direct monitors of
biochemical activity at a given point in time or under a defined condition and are not
subject to genetic regulation or post-translational modification as is the case with genes
and proteins (65). Metabolites are defined as small molecules that are involved in cellular
processes or the regulation of them and include compounds such as organic acids, amino
acids, sugars, lipids and alcohols among others.
1.4.1 Metabolomics methodology
Metabolomics analysis requires many unique and specific methods for the various
steps involved (66). An excellent review by Dettmer et al. discusses many of the steps
required for mass-spectrometry based metabolomics including sampling, sample
preparation, separation, mass spectrometric analysis, data export and analysis, and
metabolite identification (66). Wilcoxen et al. (67) have summarized in a table the 3 main
stages of a metabolomics experiment workflow; sample preparation, sample analysis and
data analysis with the commonly used methods for each step and their advantages and
disadvantages (Table 1.1).
Sample preparation is very dependent on the type of sample being analyzed and
platform being used for the analysis. For instance yeast has cells walls that must be
disrupted by means other than sonication for efficient extraction, and bacteria have rapid

14
Table 1.1. Steps and methods from a typical metabolomics experiment. Table obtained and modified from (67)
Steps Methods Advantages Disadvantages
Sample preparation Sample quenching Minimizes formation/degradation of
metabolites due to enzymatic activity
Possible analyte loss due to cell leaching;
buffers cause ion suppression (MS)
Tissue/cell
homogenation
Necessary to obtain efficient
metabolite extraction
Potential loss of analytes
Liquid–liquid extraction Enrichment of metabolite classes by
physiochemical properties
Potential loss of analytes
Solid phase extraction Focused collection of analytes by
varying material and eluant
Potential loss of analytes
Derivatization Allows analysis of polar metabolites
(necessary for GC-MS)
Not suitable for analytes with poor
thermal stability
No modification No analyte loss and short analysis time Significant ion suppression (MS), only
abundant species identity (NMR)
Sample analysis NMR spectroscopy Quantitative, versatile, rapid, databases
for metabolite ID
Lack of sensitivity, requires large sample
volumes
LC-MS Quantitative, excellent sensitivity,
minimal sample size, databases for
metabolite ID
Expensive instrumentation, destruction of
sample, longer sample analysis times
GC-MS Quantitative, good sensitivity,
moderate sample size, databases for
metabolite ID
Requires derivatization, destruction of
sample, longer sample analysis times
Data analysis Metabolomic profiling Selected metabolite family,
quantitative, metabolite ID achievable
Not global analysis (biased)
Metabolomic
fingerprinting
Provides pattern of all metabolites,
metabolite ID unnecessary
Limited to classification tool, poor
metabolite identification
15
metabolite turnover rates so quenching is required for these sample types. Another
examples is the case of derivitization which is required for analysis by gas-
chromatography mass spectrometry (GC-MS) instruments but is always necessary for
liquid-chromatography mass spectrometry (LC-MS) analysis.
Sample analysis for metabolomics is most often done on one of 3 platforms;
nuclear magnetic resonance (NMR) spectroscopy, GC-MS or LC-MS. Many reviews are
available for each platform that discuss their applications with fairly recent reviews for
GC-MS (68), LC-MS (69) and NMR (70) of note. Additionally, a summary of the major
advantages and drawbacks for each of the 3 major metabolomics platforms can be seen in
Table 1.1.
The data analysis steps for metabolomics can be very extensive, depending on the
processing steps required and the type of analysis being done. Many instrument
manufacturers provide software that can be used for peak identification and analysis,
however more often than not the software can only be used for samples run on that
particular instrument. However, downloadable software including MET-IDEA (71),
MetaboliteDetector (72) and XC-MS (73) are available to be used for the peak detection
and identification steps and are not restricted to a specific instrument. Furthermore
commercially available software such as SIMCA (Umetrics AB, Umea Sweden) and
downloadable software such as MetaboAnalyst 2.0 (74) are also available to carry out the
multivariate analysis steps that are discussed below.
There are two main types of metabolomics approaches currently used known as
targeted or untargeted profiling. With targeted profiling a specific class of compounds or
pathway(s) are analyzed (65). Conversely untargeted profiling is a global approach which

16
aims to detect and identify as many metabolites as possible and examine sample wide
metabolism (65). Several commercial and downloadable programs are available to help
with the secondary analysis of metabolomics data as reviewed by Booth et al. (75). From
a list of altered metabolites identified using metabolomics profiling, these programs are
able to carry out enrichment analysis which identifies significantly altered metabolic
pathways, or pathway analysis which allows for the visualization of the network of
affected metabolites and puts it into a metabolic context (75). Both of these approaches
aid in the biological interpretation of metabolomics data.
1.4.2 Lipidomics: A subspecialty of metabolomics
Lipidomics is a subclass of metabolomics that focuses solely on the detection and
analysis of lipids. This speciality has recently become more prevalent as it is increasingly
recognized that lipids play essential roles in cell structure and organization, signalling
and trafficking (76). The main problem associated with lipidomic analysis is the diversity
displayed by lipids. A review of the different lipid classes and their cellular functions by
Khalil et al. (76) demonstrates the sheer magnitude of the different types of lipids that
exist. Much of the work in lipidomics up to this point has focused on trying to expand
upon the number of lipid classes that can be identified within a single sample. Several
recent reviews discussing the progress that has been made in the field of lipidomics and
the advantages and disadvantages for lipidomic profiling are available (77-79). GC-MS
shows the most promise for analysis of fatty acids and its derivatives, but is not ideal for
analysis of larger lipids due to the requirement of derivitization with GC-MS analysis
(77). Developments related to tandem MS, matrix-assisted laser desorption/ionization
(MALDI), shotgun and imaging mass spectrometry techniques have all greatly aided in

17
the advancement of lipidomic analysis (79). An example of a success story that shows
just how far lipidomic analysis methods have come is a study that was able to absolutely
quantify 95% of the lipidome of yeast covering 21 major lipid classes using a shotgun
approach, where a total lipid extract sample is directly injected into the instrument for
ionization without separation (80).
1.5 Multivariate analysis
Due to the immense amounts of data obtained through metabolomics analysis,
traditional statistical methods are not able to effectively analyze the data obtained.
Therefore multivariate statistical analysis methods are needed to extract the information
from the data. Multivariate analysis uses projection based modelling methods (Figure
1.4), which involve expressing the metabolite levels in each sample as a single point to
allow for comparison between samples and to summarize and simplify data to a point
from which meaningful information can be obtained (81).
In order for the modelling methods to be successfully carried out the data may need to be
pre-processed. Such steps may include normalization, scaling and mean centering of the
data. Normalization is done to account for small difference in dilution between samples
that can affect the data quality. Scaling is also done to account for the fact that different
metabolites will have different ranges, which if left as is can cause problems for
modelling and interpretation (81). Additionally mean centering is also carried out in order
to give all the variables (metabolites) the same reference point, allowing for the
simplified comparison of different samples.
After processing of the data, projection methods can be used to summarize the
data and allow for analysis and comparison (Figure 1.4). Two types of modelling

18
Figure 1.4 Projection methods simplify all observations for a sample into a single point to allow for easy visualization and
comparison. Figure adapted from (81).

19
methods are most commonly used for multivariate analysis of metabolomics data.
Principal component analysis (PCA) is an unsupervised projection method commonly
used to examine the dataset for outliers, trends and for pattern recognition (81).
Orthogonal partial least squares-discriminant analysis (OPLS-DA) modelling is a
supervised method that is used to identify and explain the differences between two or
more defined sample groups (81). To aid with interpretation parameters such as variable
influence on projection scores (VIP) scores can be used. VIP scores estimate the amount
different metabolites contribute to the separation of the different sample groups, with a
score of greater than 1 suggesting a significant contribution. Additionally coefficient
scores can be used to determine if individual metabolites are elevated in one sample
group compared to another. Two main types of plots are used for the analysis of
metabolomics data after modelling. Scores plots are used to summarise the samples, and
to observe patterns and trends (81). Loadings plots are used to summarise the metabolites
and how they relate to the samples (81).
After construction, models are evaluated for quality through fit of the data (R2)
and predictive quality of the model (Q2) parameters (81). The Q
2 parameter is calculated
using cross-validation which involves splitting of the data into 7 sets and using 6 of the
sets to build a model and using the 7th
to test it, and this is repeated for all the iterations.
A good model will have R2 and Q
2 scores both above 0.5, with a difference of no greater
than 0.3 between them. Additionally cross-validated analysis of variance (CV-ANOVA)
p- values can be calculated for OPLS-DA models, with a score of less than 0.05
considered to be significant and indicative of separation between the sample groups being
modelled.
20
One such program that is able to carry out such multivariate statistical analysis
and modelling is the commercial software SIMCA (Umetrics AB, Umea Sweden).
1.6 Research goals
As edelfosine is the prototype of the ATL group of compounds and its mode of
action is not well understood with different and sometimes conflicting observations
published in the literature, we hypothesize that the use of metabolomic analysis methods
with the model system S. cerevisiae will provide insight into the mode of action of
edelfosine. This hypothesis will be addressed in multiple steps using different
metabolomics technologies and analysis techniques:
1) Optimization of polar metabolite and lipid extraction from yeast cells.
2) GC-MS analysis of the changes in the metabolome and fatty acid profile of
yeast induced by edelfosine treatment.
3) LC-MS analysis of the changes in the lipidome in yeast induced by edelfosine
treatment.
4) Secondary analysis and biological interpretation of the metabolomics data.
By combining all of this metabolomics information and trying to analyze it as whole, I
aim to gain a broad data set with which to study the metabolism-wide effects of
edelfosine in yeast. Ultimately the goal of this research is to build upon the previous work
done with edelfosine characterization in yeast and expand up the current working mode
of action.

21
Chapter Two: Materials and Methods
2.1 Yeast growth and sample harvesting
Yeast strain BY4741 (MATa; his3∆1, leu2∆0, met15∆0 and ura3∆0) a commonly
used wild-type lab strain that has been used in previous studies with edelfosine (63) was
grown in minimal selective defined (SD) liquid media composed of 0.67% (w/v) yeast
nutrient broth (YNB) with ammonium sulphate (MP Biomedical, Solon OH, USA), 2%
(w/v) dextrose, 0.002% (w/v) histidine, 0.003% (w/v) leucine, 0.002% (w/v) methionine
and 0.002 % (w/v) uracil. A SD media was used so that all components of the media had
consistent quantified levels as opposed to rich media, in this case yeast extract-peptone
dextrose (YPD), which varies from batch to batch. Yeast cultures were grown in an
incubated shaker at 30⁰C or 37⁰C with a rotation speed of 150 rpm to a log phase OD600
of 0.2/ml. Each sample harvested consisted of approximately 10 OD600 total of pelleted
cells. The pellets were washed twice with water to remove all growth media, flash frozen
in liquid nitrogen to prevent further growth and/or metabolite turnover and stored at -
80⁰C.
2.2 Metabolite extraction
In order to effectively carry out metabolic profiling studies, consideration must be
given to the protocol used as the metabolite recovery process affects all downstream
analysis and interpretation steps. Furthermore, if multiple metabolite types are being
considered it is best to carry out the different types of analysis on the same sample so as
to avoid introducing non-biological variation. Given these considerations,
chloroform/methanol/water metabolite extraction methods were used as they have had

22
success with both lipid and polar metabolite extractions, have good metabolite recovery
across different metabolite classes and are reproducible.
The different chloroform/methanol/water metabolite extraction methods explored
are discussed in chapter 3.
2.3 GC-MS analysis
GC-MS analysis is a technique that allows for metabolic profiling of polar
metabolites or fatty acids from biofluid, tissue, or cell samples. In order for GC-MS
analysis to be carried out the metabolites being analyzed must first be derivitized to allow
for their detection. Metabolomic profiling using GC-MS can be quantitative and can be
done using either a targeted or untargeted approach. With a targeted approach such as
FAME (fatty acid methyl ester) profiling of fatty acids, standards are run and used for the
detection of those compounds in the samples being analyzed using their specific m/z
(mass to charge ratio) signature and retention time. With untargeted analysis, all detected
peaks are considered and compounds are identified through matching the m/z value to
those of known compounds from a database.
2.3.1 Sample preparation and derivitization for GC-MS analysis
Aqueous samples were prepared for GC-MS analysis by derivatization with
methoxyamine and MSTFA (N-methyl-N-(trimethylsilyl) trifluoroacetamide) using a
previously described protocol (82). To each dried down aqueous phase sample, 50 μl of a
20 mg/ml solution of methoxylamine-hydrochloride in pyridine was added. After
addition of methoxylamine-hydrochloride the samples were shaken at 37 °C for 2.5
hours. After shaking, 50 μL of MSTFA was then added and followed by 45 min of
additional shaking at 37 °C. Each sample was diluted with 500 μL of hexane and

23
centrifuged at 14,000 rpm with an Eppendorf 5415 C Centrifuge for 4 minutes in order to
remove any solid particulate in preparation for GC-MS analysis. After centrifugation was
complete, 200 μL of the samples was transferred to a GC-MS analysis vial with a glass
insert.
Organic samples were prepared for GC-MS FAME analysis by derivitzation with
BF3/methanol using a previously described protocol (83). The dried down organic phase
samples were dissolved in 750 μl of 1:1 (CHCl3:MeOH ) under sonication for 15
minutes. This was followed by the addition of 50 μl of 200μM D-25 tridecanoic acid
which was the internal standard. Next 125 μl of BF3/methanol was added and the samples
were incubated in glass vials at 80 °C for 90 min. After cooling, 300 μl of H2O and 600 μl
of hexane were added to each sample and the contents were vortexed to mix and allow
for separation of the aqueous phase and the organic phase which contained the fatty acid
methyl esters. The aqueous and organic layers were then isolated and placed into separate
eppendorf tubes and the organic phase was evaporated to dryness overnight in a fume
hood. Prior to GC-MS analysis the samples were reconstituted in 200 μL of hexane and
transferred to GC-MS analysis vials with glass inserts.
The derivitization methods described above were used for sample preparation as
they are the protocols most commonly found in literature and are well established.
2.3.2 GC-MS data acquisition
GC-MS acquistion was carried out using a Waters GCT Premier GC-TOF-MS
(gas chromatography time-of-flight mass spectrometer). For aqueous metabolite analysis
an EI (electron ionization) source was used with a DB-5MS 30 m x 0.25mm column
(Agilent Technologies, Mississauga Ontario) and a 0.25um filament size. For FAME

24
analysis an EI source was used with a DB-23 60m x 0.25mm column (Agilent
Technologies, Mississauga Ontario) and a 0.15um filament size. The settings on the GC-
MS were 275⁰C and 240⁰C injector temperature for the aqueous column and FAME
columns respectively with a flow rate of helium (carrier gas) of 1.2 ml/min. A blank
followed by the standards (n-alkane mix (Sigma-Aldrich, Oakville Ontario) for aqueous
metabolite samples, and a 37 FAME standard mix (Sigma-Aldrich, Oakville Ontario) for
the FAME analysis) were run between the analysis of every 10 samples to monitor
instrument and column stability throughout the course of the data acquisition. Samples
were run in a randomized order in order to avoid bias.
2.3.3 GC-MS data processing
Raw GC-MS data from polar metabolite profiling was imported to
MetaboliteDetector (72) for peak detection and compound identification using an
untargeted approach. Briefly the ΔRI, Pure/Impure, required similarity score (Req. Score)
and compound reproducibility parameters were varied with iterations of the different
value combinations carried out. The set of values that resulted in the most identified
compounds while limiting the overall number of unidentified ions was then used in each
case for further analysis.
Peak detection and identification for FAME analysis was done with
AMDIS/MetIdea using a targeted approach with a 37 FAME standard (Oakville, Ontario
Canada) serving as the dataset from which identifications were made. Briefly, AMDIS
(www.amdis.net) was used to identify the 37 FAME standard peaks and to assign
retention times and unique m/z signatures. MetIdea (71) was used for calibration of the
sample peaks and to detect the amount of the FAME’s present in the samples.
25
The data were then normalized using Excel 2010 (Microsoft, Redmond, WA,
USA) in order to account for different dilutions of the samples being analyzed. For
targeted FAME profiling normalization to the internal standard, D-25 Tridecanoic Acid,
occurred first and was followed by integral normalization. In the case of untargeted
aqueous metabolite profiling, no internal standard was used so only integral
normalization occurred.
2.4 LC-MS analysis
LC-MS analysis like GC-MS analysis is a technique that allows for metabolic
profiling. One difference between GC-MS and LC-MS profiling methods is that with LC-
MS derivitization of metabolites is not always needed, thus allowing for profiling of
intact metabolites and lipids. However, LC-MS is not very quantitative without the
extensive use of standards. As untargeted sample analysis with LC-MS methods can be
time consuming care must be taken to ensure that samples are carefully chosen for before
they are analyzed so resources and instrument availability can be conserved.
2.4.1 Addition of internal standards to LC-MS samples
Internal standards for different types of lipid species were added to each sample in
order to allow for quantification. The lipids standards (Avanti Polar Lipids Inc., Alabaster
Alabama) used were chosen as they are not naturally occurring in yeast and allow for
monitoring. The lipids standards, their ID number, concentration and mass can be seen in
Table 2.1.
2.4.2 UPLC-TOF-MS data acquisition
Dried organic extracts were dissolved in injection solvent, with initial gradient
conditions of 60% solvent A, 40% solvent B, and injected onto a 1.8 μm particle, 150 x

26
Table 2.1. Internal standards added to samples for ultra perfomance liquid chromatography time-of-flight mass spectrometry
(UPLC-TOF-MS) analysis.
Lipid Standard ID # Concentration Exact Mass Supplier
PE (17:0/14:1) LM 1104 10.90ug/1mL 675.4839 Avanti Polar Lipids
PS (17:0/20:4) LM 1302 9.57ug/1mL 797.5207 Avanti Polar Lipids
PA (17:0/14:1) LM 1404 10.34ug/1mL 422.24 Avanti Polar Lipids
PA (17:0/0:0) LM 1701 10.49ug/1mL 632.44 Avanti Polar Lipids
PA (13:0/0:0) LM 1700 9.8ug/1mL 368.2 Avanti Polar Lipids
PI (17:0/20:4) LM 1502 10.04ug/1mL 872.54 Avanti Polar Lipids
PG (17:0/14:1) LM 1204 10.93ug/1mL 706.48 Avanti Polar Lipids
PC (17:0/20:4) LM 1002 8.7ug/1mL 795.58 Avanti Polar Lipids
PC (13:0/ 0:0) LM 1600 9.67ug/1mL 453.29 Avanti Polar Lipids
PC (21:0/22:6) LM 1003 10.3ug/1mL 875.6404 Avanti Polar Lipids
PC (17:0/14:1) LM 1004 9.66ug/1mL 717.5381 Avanti Polar Lipids
PC (17:0/0:0) LM 1601 9.82ug/1mL 507.33 Avanti Polar Lipids
D5-DAG Mix LM 6004 4uM each 569.51; 629.6; 625.57; 621.54 Avanti Polar Lipids
D5-TAG Mix LM 6000 4uM each 975.74; 753.69; 809.75;
839.8; 851.8; 839.8; 977.94;
937.81; 931.77
Avanti Polar Lipids

27
2.1 mm id Waters ACQUITY HSS T3 column (Waters, Milford Massachusetts)
which was heated to 40 °C in the column oven. Mobile solvent phase A consisted of
40% HPLC grade acetonitrile (Fisher Optima, Pittsburgh Pennsylvania) and 60%
Milli-Q H2O (Millipore, Billerica Massachusetts), 10mM ammonium formate (Sigma-
Aldrich, St. Louis Missouri). Mobile solvent phase B consisted of 10% acetonitrile
and 90% HPLC grade isopropanol (Fisher Optima, Pittsburgh, Pennsylvania), 10mM
ammonium formate (Sigma-Aldrich, St. Louis Missouri). A linear gradient was used
(curve 6) over a total run time of 18 minutes. Initial conditions of 60% solvent A and
40% solvent B were held for 1 minute. The gradient was ramped up in a linear fashion
over the next 10 minutes to 96% solvent B where it was held for 2 minutes. The
column was then re-equilibrated at initial conditions for 5 minutes before the next
sample injection. The flow rate used was 0.3 ml/minute and the injection volume was
10 μL.
The ACQUITY UPLC system (Waters, Milford Massachusetts) was coupled
to a Xevo G2-S time-of-flight mass spectrometer (Waters MS Technologies,
Manchester, United Kingdom). Electrospray positive ionization mode was used in
resolution mode. A capillary voltage of +3 kV and a cone voltage of +35 V were used.
The desolvation gas flow was set to 700 L/hr at a temperature of 400 °C. Nitrogen
was used as the desolvation gas. MSE centroid mode was used for data acquisition
over the mass range of 100-1500 Da, with a scan time of 1 second. For the MSE
settings, the low energy function was set to a collision energy of 6 V, and the high
energy function was set to a ramp collision energy from 20 – 30 V. Argon gas was
used as the collision gas. The mass spectrometer was equipped with a LockSpray
exact mass ionization source that automatically collected a reference scan of the
lockmass compound every 30 seconds lasting 1 second. Leucine encephalin (Sigma-

28
Aldrich, St. Louis Missouri) was used as the lockmass reference, and exact mass
correction was applied as data was acquired based on the mass, 556.2771, of leucine
encephalin.
2.5 Multivariate statistical analysis
After normalization and compound detection, the data were exported to
SIMCA-P13 (MKS Umetrics AB, Umea, Sweden), a commercial multivariate
statistical analysis software that has been used for various metabolomics studies
including characterization of colorectal cancer using NMR (84), metabolomics
analysis of renal failure using quadropole time-of-flight mass spectrometry (Q-TOF-
MS) (85), and to identify metabolic responses to metal stress in bacteria using NMR
and GC-MS (82). In SIMCA-P, univariate scaling (shifts all variables to the same
range) and mean centering (gives all variables the same reference point) were applied
before the model construction and validation steps. PCA models were prepared,
through unsupervised modelling, in order to examine the data for outliers using a 95%
confidence interval. Additionally PCA modelling was used to examine the data for
non-biological biases that could result for things such as extraction, derivitization or
analysis batch. OPLS-DA models were constructed to identify and highlight the
differences between distinct sample types using supervised modelling. Model
construction was done using the autofit routine of SIMCA-P13, to avoid overfitting of
the data for models. The models were evaluated for quality and reliability through R2
and Q2 scores, with a good model considered to have scores over 0.5 (from a range of
0 to 1) for both parameters and values that are close to each other. OPLS-DA models
were also validated using CV-ANOVA p-values with a value of less than 0.05
considered to be significant.
From the OPLS-DA modelling, metabolites that contribute significantly to the

29
separation between sample groups can be identified. This was done using VIP scores
that are calculated by SIMCA-P13 with the cutoff value set at 1, as this provides a
relatively high level of confidence that the identified metabolites are significantly
contributing to the separation of the sample groups and is a value that has been used
commonly in the literature. Additionally, coefficient values that can be used to
identify whether specific metabolites are increased in one sample group compared to
another were calculated by SIMCA-P13 and were obtained after construction of an
OPLS-DA model. Using the VIP and coefficient scores information, a picture of the
overall differences between sample groups can be obtained to aid in biological
interpretation.
2.6 Pathway analysis and metabolic network construction
Metabolites identified to have VIP scores greater than one through OPLS-DA
modelling can be subjected to secondary analysis which usually involves enrichment
analysis or pathway analysis. The different types of methods for secondary analysis of
metabolomics data and the programs available to do these types of analysis are
discussed in a review by Booth et al. (75). The MetaboAnalyst 2.0 server (74) was the
program chosen to be used for secondary analysis of the metabolites as it has the
capability to perform both enrichment and pathways analysis and to select organism
specific metabolic pathway sets. Impact and p-value scores were used to trim and
identify the pathways that were significantly perturbed between the sample types.
These values were calculated by the server, with a p-value less than 0.05 and an
impact score greater than 0.1 considered to significant. The impact score is calculated
based on a sum of the impact scores for each metabolite identified in a pathway that
are based on the importance of the metabolites to each given pathway. Using the
information of the affected pathways and metabolites, a metabolic network of the

30
changes induced can be constructed to give an overall summary of the various
processes being affected and aid in the biological interpretation of the profiling data.

31
Chapter Three: Optimization of Metabolite and Fatty Acid Extraction from
Saccharomyces cerevisiae
3.1 Introduction
The field of metabolomics is rapidly seeing more widespread use for the
determination of system level metabolic changes caused by influences such as diet,
environmental stress and disease (82,86-89). However, to accurately determine the
changes in a metabolite profile caused by these influences, care must be taken in order to
optimize the different factors that affect data quality and reproducibility. Of paramount
importance in this regard is the metabolite extraction step, as it affects both the number of
different metabolites available for analysis as well as the reproducibility and reliability of
the data obtained.
Studies looking at optimal polar metabolite extraction protocols for biological
compounds including sugars, amino acids and water soluble metabolic precursors or
intermediates have been carried out for single platforms including NMR (90,91), GC-
MS (92-95), and LC-MS (96-98). Additional studies have focused on a polar
metabolite extraction for multi-platform use (99,100). Optimal extraction protocols
have been tested for biological samples including serum (97)
and plasma (92), and for different model organisms such as Escherichia coli (93), S.
cerevisae (101,102) and Caenorhabditis elegans (100). Furthermore, some effort has also
gone into determining the best extraction method for non-polar metabolites, such as fatty
acids and other lipids (103-105), with these types of studies becoming more frequent as the
subfield of metabolomics (also known as lipid profiling or lipidomics) has become more
popular. For instance, detailed protocols on how to extract and analyse lipids from yeast
(106), as well as body fluids and tissues (107) are now available.

32
Though much work has gone into establishing protocols to look at either polar
(water soluble) or non-polar (soluble in organic solvents) metabolites, little work has
gone into finding a protocol that is effective at simultaneously extracting both polar
and non-polar metabolites. Analysis of both polar and non-polar metabolites from the
same samples could be extremely beneficial in future metabolomic studies, as it will
avoid much of the variation that can occur when trying to combine both types of
metabolite information from separate samples. Additionally, much of the previous work
with optimizing extraction of metabolites has centered on comparing different types of
quenching and extraction solvents, while focusing mainly on optimal metabolite
recovery as opposed to reproducibility.
Here we investigated three different chloroform/methanol/water based
metabolite extraction protocols found in the literature on S. cerevisiae for the ability
to reproducibly extract high levels of polar and non-polar fatty acid metabolites.
Chloroform/methanol/water based protocols were explored as they are generally the
standard for classical lipid/fatty acid extractions and (108,109) have had success
extracting polar metabolites in yeast (102), among other sample types. Yeast was used
as it is accepted as a suitable fungal representative of the microbial community, and as
a model system for eukaryotic organisms. Additionally, it is unique in containing only
mono-unsaturated and even numbered fatty acid chain lengths, thus simplifying
analysis. We were able to successfully identify a protocol using chemoinformatics and
multivariate projection methods that was able to reproducibly extract comparatively
high levels of both polar metabolites and non-polar fatty acids.
3.2 Results and discussion
Cheminformatics is a field that is growing rapidly and will be of great use for
metabolomic studies, especially as compound databases continue to expand. This will

33
allow for untargeted analysis of many different sample types to be carried out. As
more untargeted metabolomic studies are done, it becomes necessary to use
multivariate projection methods such as those discussed below to help interpret the
complex data collected. Using this approach we can apply metabolomics in many
different areas, including biomarker studies, drug monitoring, identifying effects of
diet and responses to external stresses or stimuli.
As metabolomics becomes a more prevalent tool across multiple scientific
disciplines, it has become clear that the extraction protocol used has a large influence
on the quality and reliability of the data obtained. As such, numerous studies have
tried to improve upon previously accepted metabolite extraction methods, and identify
an optimal extraction protocol for various platforms (90-98) and sample types
(92,93,97,100-102) though few, if any, have attempted to systematically identify an
extraction protocol that is able to obtain both polar and fatty acid/lipid metabolites
simultaneously. Additionally, most of these studies have focused on optimizing the
percent metabolite recovery through the use of internal standards, with less focus
placed on the reproducibility of the extraction protocol being utilized. As there are
now a large number of validated optimal extraction protocols suggested for various
platforms and biological samples, it must be recognized that obtaining reproducible
extraction from sample to sample is also of significant concern and should be
explored further. We also believe that it is important to recognize that biological
stresses and disease affect both polar and non-polar metabolites in organisms or
biological samples, and extraction of both types of metabolites from the same sample
will overcome much of the variation and drift problems associated with combining
data from different samples. Typical problems leading to these undesirable effects can
include small changes in atmospheric pressure from day to day, temperature and

34
growth media composition that occur between cultures and can lead to so called batch
effects. Additionally, the use of different extraction techniques and solvents can lead
to metabolite loss and/or variation or drift between samples reducing reliability and
reproducibility.
3.2.1 Unsupervised analysis clearly differentiates extraction method
In order to assess the influence of the metabolite extraction process on both polar
and non-polar metabolites, three separate procedures based on
chloroform/methanol/water partitioning that have been used previously in the literature
(63,80,83) were compared using multivariate modelling. The multivariate modelling was
carried out with the polar metabolite extracts having a dimensionality of 33 samples with
322 total ion hits obtained, and lipid extracts having a dimensionality of 48 samples
with 12 fatty acids monitored. Unsupervised PCA is a tool which provides a
multivariate overview of the data based on the underlying variance between the
metabolite profiles of the samples without specifying the different sample types.
Analysis of this type is useful for screening of outliers and overviewing the metabolite
patterns of the different sample types. Samples extracted for polar metabolites were
screened for outliers with PCA (Figure 3.1A). The overall sample pattern shows
clustering by extraction protocol and not by growth temperature, with R2
and Q2
values of 0.557 and 0.438 respectively for the model, which is within the acceptable
range for a biological model. Samples extracted for fatty acids using FAME analysis
were also examined for outliers using PCA (Figure 3.2A). The model consists of one
component with R2 and Q
2 values of 0.325 and 0.176 respectively, shows no outliers
and also shows loose clustering of the samples based on the extraction protocol used.
3.2.2 Supervised analysis identifies 36 metabolites and four fatty acids differentiating
the extraction methods

35
(A)
(B) (C)

36
Figure 3.1. Models comparing the polar metabolites extracted from S. cerevisiae by one of three chloroform/methanol/water based
extraction protocols. An overview of the data confirms that there are no outlying samples within a 95% confidence interval. (A) PCA scores
plot model with R2 = 0.557 and Q
2 = 0.438 values. Green circles represent samples extracted using method 1, blue squares represent samples
extracted using method 2 and red triangles represent samples extracted using method 3. (B) OPLS-DA scores plot model of predictive latent
variables (LV) 1 and 2 showing separation based on extraction method with R2(X) = 0.704, R
2(Y) = 0.933, Q
2 = 0.881 and CV-ANOVA p = 4.20 ×
10−7
values. Green circles represent samples extracted using method 1, blue squares represent samples extracted using method 2 and red triangles
represent samples extracted using method 3. (C) OPLS-DA scores plot model of predictive LV 2 and 3 showing separation based on growth
temperature with R2(X) = 0.704, R
2(Y) = 0.933, Q
2 = 0.881 and CV-ANOVA p = 4.20 × 10
−7 values. Green circles represent samples grown at 30
°C, blue squares represent samples grown at 37 °C.

37
(A)
(B)
Figure 3.2. Models comparing the fatty acid metabolites extracted from S. cerevisiae by one
of three chloroform/methanol/water based extraction protocols. FAME’s were identified
through comparison to a 37 FAME standard. An overview of the data confirms that there are no
outlying samples within a 95% confidence interval. Green circles represent samples extracted
using method 1, blue squares represent samples extracted using method 2, red triangles represent
apolar (17:1 CHCl3:MeOH) organic fraction samples extracted using method 3 and yellow upside
down triangles represent polar (2:1 CHCl3:MeOH) organic fraction samples extracted using method
3. (A) PCA scores plot model with R2 = 0.325 and Q
2 = 0.176 values. (B) OPLS-DA scores plot
model showing separation based on extraction method with R2(X) = 0.616, R
2(Y) = 0.517, Q
2 =
0.411 and CV-ANOVA p = 1.48 × 10⁻⁶
values.

38
In order to specifically identify which metabolites significantly contributed to the
separation between sample groups, OPLS-DA was also performed on the dataset. OPLS-
DA is a supervised analysis method to cluster multivariate data by maximizing the
variance between different sample groups. OPLS-DA modelling of polar metabolite data
produced an excellent three component model with R2(X) = 0.704, R
2(Y) = 0.933, Q
2 =
0.881 and CV-ANOVA p = 4.20 × 10⁻⁷
, with all samples clustering into their respective
extraction condition (Figure 3.1B). The first latent variable (LV) shows the separation of
samples from Extraction 1 and the samples of Extractions 2 and 3, and the second latent
variable shows separation of samples from Extractions 2 and 3. The third latent variable
separates the samples based on their growth temperatures of 30 °C and 37 °C, with the
samples of the same growth temperature clustering based on the protocol by which they
were extracted (Figure 3.1C).
The OPLS-DA model for FAMEs shows the separation of Extraction 2 samples from
Extraction 3 Polar and Extraction 3 Apolar samples with the first latent variable, while the
second latent variable shows separation of Extraction 1 samples from Extraction 2 and
Extraction 3 Apolar samples (Figure 3.2B). The model has a R2(X) = 0.616, R
2(Y) = 0.517, Q
2
= 0.411 and CV-ANOVA p = 1.48 × 10⁻⁶
, and shows loose clustering of the samples based
on the protocol with which they were extracted, with the exception of the Extraction 3
Polar samples which mix with each of the samples from the other extractions.
From OPLS-DA modelling, additional information can be obtained with regard to
the metabolites contributing to the separation of sample groups and comparative
metabolite levels using VIP scores and coefficients. Comparing metabolites with a VIP
score above 1 with the corresponding coefficient values for these metabolites from each

39
extraction method gives a basis to compare the differences in metabolite levels extracted.
Metabolites with a VIP greater than 1 (as identified by OPLS-DA modelling of polar
metabolites and FAME’s) and their corresponding coefficients can be seen in Table 3.1.
Thirty-six polar metabolites were found to have a VIP greater than 1, with Extraction 2
samples having higher coefficients in the majority of cases, indicating comparatively
higher levels of those metabolites (Table 3.1). Samples for Extraction 1 had positive
coefficients for about half of these metabolites and Extraction 3 samples had negative
coefficients in the majority of cases. Four fatty acids were found to have a VIP greater
than 1, with Extraction 1 samples having positive coefficients for all 4 of the FAME’s,
Extraction 2 samples have two positive and two negative coefficients and Extraction 3
samples having three negative coefficients (Table 3.1). Shared and unique structure (SUS)
plots were also generated to compare similarities and differences in metabolites extracted by
protocols 1 and 2 using samples from Extraction 3 as a common profile (Figure 3.3). The
SUS plots for both the polar and FAME metabolites show that all metabolites identified to
have a VIP > 1 score vary in the same direction and that neither protocol 1 or 2 extracts
any unique metabolites compared to the other. This indicates that, other than differences
in the levels of the metabolites extracted by the protocols, there is no difference in the
breadth of polar and fatty acid metabolites recovered between the two extraction
protocols.
3.2.3 Comparison of FAME and aqueous metabolite profiles obtained
PCA modelling of the FAME data from the organic layer(s) of the extraction
protocols produced a relatively weak model based on the statistics R2
and Q2. This can
perhaps be attributed to the fact that S. cerevisae does not have an overly complex fatty

40
Table 3.1. Metabolites identified to have a VIP score greater than 1 through OPLS-
DA modelling of aqueous metabolite and FAME extraction data and the
corresponding coefficient values for each extraction protocol. Values with a positive
coefficient indicate higher comparative levels, while values with a negative coefficient indicate
lower comparative levels.
Metabolite VIP Coefficient
Extraction 1
Coefficient
Extraction 2
Coefficient
Extraction 3
Threonine 1.832 0.013 0.046 −0.059
Glycerol 1.703 −0.012 −0.042 0.054
Phenylalanine 1.678 0.030 0.034 −0.064
Alanine-3cyano 1.666 0.037 0.009 −0.046
Methionine 1.649 0.014 0.041 −0.055
Proline 1.630 −0.001 0.029 −0.028
Sorbitol 1.603 0.002 0.023 −0.024
Phosphoric Acid 1.575 −0.008 0.052 −0.043
Homoserine 1.531 −0.001 0.049 −0.048
Pyroglutamic Acid 1.496 0.002 0.014 −0.016
Alanine 1.476 −0.023 0.025 −0.002
Ornithine 1.461 −0.011 −0.046 0.057
Serine-O acetyl 1.382 −0.029 −0.035 0.064
Fumaric Acid 1.372 0.002 0.004 −0.006
Trehalose-alpha,alpha’-D 1.340 0.013 0.002 −0.015
Alanine-beta 1.327 0.007 0.006 −0.013
Succinic Acid 1.310 −0.006 −0.011 0.017
Malic acid, 2-isopropyl 1.299 0.016 0.020 −0.035
Decan-1-ol, n- 1.296 0.003 −0.004 0.002
Glycine 1.271 −0.027 −0.014 0.041
Valine 1.267 −0.010 0.033 −0.023
Aspartic Acid 1.261 0.016 0.012 −0.028
Arginine [-NH3] 1.259 0.030 0.003 −0.033
Glutamic Acid 1.213 0.009 0.007 −0.016
Hexadecane, n- 1.210 −0.016 0.036 −0.019
Malic Acid 1.190 0.005 0.002 −0.006

41
Uracil 1.189 −0.039 −0.017 0.056
Isoleucine 1.162 −0.009 0.019 −0.011
Glutamine, DL- 1.156 0.029 −0.023 −0.007
Octylamine 1.131 −0.005 0.005 −0.001
Tyramine 1.119 0.014 0.012 −0.026
Butanoic Acid 1.063 −0.010 0.019 −0.008
Serine 1.062 −0.016 0.036 −0.020
Pentadecane, n- 1.029 −0.015 0.022 −0.008
Citric Acid 1.024 0.018 0.005 −0.023
Heptadecan-1-ol 1.010 −0.011 0.011 −0.001
Palmitic Acid 1.950 0.581 −0.372 −0.182
Palmitoleic Acid 1.273 0.173 0.082 −0.221
Oleic Acid 1.239 0.123 0.066 −0.164
Stearic Acid 1.139 0.058 −0.197 0.121

42
(A)
(B)
Figure 3.3. Shared and unique structure (SUS) plots of fatty acid and polar
metabolites from S. cerevisiae by one of three chloroform/methanol/water based
extraction protocols. Extraction 1 and Extraction 2 are plotted against Extraction 3 in
order to observe the shared and unique metabolites obtained with Extractions 1 and 2. Red
metabolites are those with a VIP greater than 1 as identified by OPLS-DA modelling. (A)
SUS plot of polar metabolites. (B) SUS plots of FAME metabolites.

43
acid profile as it usually produces only even numbered chain length fatty acids and only
three unsaturated fatty acids all of which are monounsaturated (80). Despite this, some
clustering was observed in this study although the clustering is not as tightas that seen
with the polar metabolites extracted (Figure 3.2). This is to be expected, as the fatty acid
profile of yeast is not nearly as complex as that of its polar metabolites and small
differences in levels between samples may be magnified leading to reduced variance.
Somewhat surprisingly, the primary separation of the samples is based on extraction
method used, as opposed to growth temperature—as was the case with the polar
metabolite profiles. One could expect to see changes in the fatty acid composition as a
result of the increase in growth temperature, although the temperature increase may not
have been dramatic enough to cause the anticipated changes. Four fatty acids were
identified as significantly altered (VIP ≥ 1), and examination of the corresponding
coefficient values for each protocol suggests that samples from Extraction 1 have
comparatively higher levels, while samples from Extraction 3 have comparatively lower
levels, with samples from Extraction 2 falling in the middle.
With only four fatty acids showing differences between the 3 extraction protocols
tested, we conclude that the aqueous component of the samples is more sensitive to the
extraction system composition, although this may be a result of the diverse polar
compounds analyzed and relatively narrow class of non-polar compounds since our
analytical evaluation was not comprehensive. For example, the organic component of the
extract may not be suitable for analysis of all lipid species due to the wide variety of
headgroup chemistries and, likewise, highly polar compounds such as phosphorylated
nucleotides may be measured sub-optimally from the aqueous phase. Furthermore, our

44
analysis was limited to GC-MS analysis under specific derivatization conditions,
providing some analytical constraints. In spite of these limitations, we estimate that this
evaluation provides some guidance for a first-approach towards analysis of sample with
mixed physiochemical analytes of interest.
3.2.4 Summary
Considering the two best procedures (Extractions 1 and 2) as identified through
multivariate projection methods neither protocol extracts any unique metabolites and
essentially all metabolites vary in the same direction for both protocols (Figure 3.3). This
suggests that both protocols could serve as viable options for extraction of both polar and
non-polar metabolites, though one would tend to prefer Extraction protocol 2, as the polar
metabolite profile is more complex than that of the fatty acid profile and Extraction
protocol 2 seems to be able to extract comparatively higher levels of these metabolites in
a more reproducible manner. Furthermore, we were able to show that the use of
multivariate projection methods is a viable method to compare and evaluate established
extraction protocols for reproducibility and relative amount/breadth of metabolites
recovered.
3.3 Experimental section
3.3.1 Yeast growth and harvesting
Yeast S. cerevisiae strain BY4741 was grown and harvested as described in section
2.1.
3.3.2 Metabolite extraction
3.2.1 Extraction protocol 1

45
Cells were extracted using a modified version of an extraction previously
described by Zaremberg et al. (63). Briefly, yeast cell pellets were re-suspended in 1 mL of
CHCl3:MeOH (1:1) and transferred to 2 mL bead beater vials 1/8 filled with 0.5 mm acid
washed beads. Bead beating was sustained for 60 seconds at 4 °C using the homogenize
setting to break the cell walls, followed by transfer of the lysate to a 15 mL falcon tube.
Beads were rinsed with 1 mL CHCl3:MeOH (2:1) which was then combined with the
previously obtained cell lysate. Next 0.5 mL CHCl3:MeOH (2:1), 0.5 mL CHCl3 and 1.5 mL
H2O were added, the contents vortexed and centrifuged at 2500 rpm with an Eppendorf
5415 C Centrifuge for 10 minutes at 4 °C. The aqueous layer was then collected, the protein
layer aspirated off and the tube spun again at 2500 rpm for 5 min at 4 °C. Remaining protein
was aspirated and the organic layer was collected and retained. Organic and aqueous
fractions were stored at −80 °C after being dried overnight in a speed vacuum or fume
hood respectively.
3.3.2.2 Extraction protocol 2
Cells were extracted using a modified version of an extraction previously
described by McCombie et al. (83). Briefly yeast cell pellets were re-suspended with 300
μL CHCl3:MeOH (1:2) and transferred to a 2 mL bead beater vial 1/8 filled with 0.5 mm
acid washed beads. Bead beating for 60 seconds at 4 °C using the homogenize setting to
break the cell walls was followed by transfer of the lysate to a microcentrifuge tube and
the beads were rinsed with 300 μL CHCl3:MeOH (1:2) which was combined with the
previously obtained cell lysate. Next, 200 μL each of CHCl3 and H2O were added and the
contents vortexed, followed by centrifugation at 14,000 rpm with an Eppendorf 5415 C
Centrifuge for 7 min at 4 °C. The aqueous layer was isolated and transferred to a new

46
microcentrifuge tube, the protein layer aspirated off and the organic phase collected and
saved. The aqueous layer was then centrifuged at 14,000 rpm with an Eppendorf 5415 C
Centrifuge for 7 min at 4 °C and saved. Organic and aqueous fractions were dried down and
stored as described above.
3.3.2.3 Extraction protocol 3
Cells were extracted using a modified version of an extraction previously described
by Ejsing et al. (80). Briefly yeast cell pellets were re-suspended with 300 μL 150 mM
NH4HCO3 and transferred to a 2 mL bead beater vial 1/8 filled with 0.5 mm acid washed
beads. Bead beating for 60 seconds at 4 °C using the homogenize setting to break the cell
walls was followed by transfer of the lysate to an microcentrifuge tube and the beads
rinsed with 300 μL 150 mM NH4HCO3. This was combined with the previously obtained
cell lysate. Next 990 μL CHCl:/MeOH (17:1) was added to the microcentrifuge tube and
subject to passive extraction (extraction on a benchtop at room temperature without any
centrifugation) for 2 h at 20 °C. The upper phase was subsequently isolated and transferred
to another microcentrifuge tube while the lower organic phase was collected and saved.
This followed by passive extraction of the isolated upper phase for 2 h at 20 °C with 990
μL CHCl3:MeOH (2:1). The aqueous and organic layers were isolated and placed in
separate microcentrifuge tubes, resulting in a total of two different organic fractions and
one aqueous fraction. Organic and aqueous fractions were dried down and stored as
described above.
3.3.3 Derivatization and sample preparation
Derivatization and sample preparation for GC-MS analysis were carried out as
described in section 2.3.1.

47
3.3.4 GC-MS data acquisition
GC-MS data acquisition was carried out as described in section 2.3.2.
3.3.5 Data processing and interpretation
Raw GC-MS data was imported to MetaboliteDetector (72) for peak detection.
The data were first normalized using Excel 2010 (Microsoft, Redmond, WA, USA) to the
internal standard, D-25 Tridecanoic Acid, in the case of targeted FAME profiling,
followed by integral normalization. For the untargeted polar metabolite profiling integral
normalization was carried out. In MetaboliteDetector, for compound detection the peak
threshold, minimal peak height and bins/scan parameters were all set at 2.00 and the
deconvolution width was set at 1.90. For metabolite detection the values were set as 15.0,
0.30 and 0.70 for Maximum retention index difference (ΔRI), Pure/Impure Composition
and Cutoff score respectively. Lastly, using the batch quantification tool integrated GC-
MS analysis was done. For this step the parameters for compound matching were set as
5.0, 0.30 and 0.85 for ΔRI, Pure/Impure and Req. Score) respectively, for identification
15.0 and 0.30 for ΔRI and Pure/Impure and for compound filter the signal to noise (S/N)
parameter was set as 0.30. After normalization and compound detection, the data were
exported to SIMCA-P-13 (MKS Umetrics AB, Umea, Sweden), a multivariate statistical
analytical software, where univariate scaling and mean centering was applied before the
model construction and validation step. Model construction was done using the autofit
routine of SIMCA-P, to avoid overfitting of the data, and the OPLS-DA models were
validated with CV-ANOVA p-values.

48
3.4 Conclusions
Choosing the correct extraction protocol for a given organism or biological system is of
fundamental importance when designing metabolomic studies as the metabolite
extraction step has a direct effect on all subsequent steps of data collection and analysis.
Using multivariate projection methods, we were able to compare three established
chloroform/methanol/water partitioning metabolite extraction methods for the ability to
reproducibly extract both polar and non-polar yeast metabolites. Using this approach a
highly reproducible method was identified that was able to extract comparatively higher
amounts of polar metabolites—all three protocols were able to obtain comparable
metabolite breadths. We were able to confirm the effectiveness of chemoinformatics and
multivariate projection methods to efficiently give a comparison of different extraction
protocols for a given organism. This approach should prove an efficient way to compare
other established extraction protocols for other systems against each other, as well as
providing a quicker and more cost effective way of comparing new extraction protocols to
previously established ones.
3.5 Contributions
This chapter was published as a manuscript in the open access journal Metabolites,
“Tambellini, N.P., Zaremberg V., Turner, R.J., and Weljie A.M. (2013) Evaluation of
Extraction Protocols forSimultaneous Polar and Non-Polar Yeast Metabolite Analysis
using Multivariate Projection Methods. Metabolites 3, 592-605” and is formatted in a
manner consistent with the journal formatting. The experiments and data analysis in this
chapter were designed and carried out by me under the supervision of Dr. Ray Turner and
Dr. Aalim Weljie and with some discussional input from Dr. Vanina Zaremberg.

49
Chapter Four: Polar Metabolite and Fatty Acid Profiling of Edelfosine Treated
Saccharomyces cerevisiae
4.1 Introduction
As discussed previously the precise mechanism of edelfosine is not fully
understood but evidence exists that it may induce apoptosis through a number of
processes including the MAPK/ERK pathway (34), the Fas/CD95 death receptor (39),
endoplasmic reticulum stress (40), c-jun NH2 terminal kinase activation (36) and
inhibition of CTP:phosphocholine cytidylyltransferase, the rate limiting step for the
biosynthesis of phosphatidylcholine (30,31).
Additionally it was also discussed that two uptake methods for edelfosine have
been suggested one of which involves edelfosine insertion into the plasma membrane,
accumulation in lipid rafts and internalization through a lipid raft dependent endocytosis
pathway (31,46). The importance of lipid rafts in edelfosine uptake is highlighted by the
fact that pre-treatment of cells with raft-disrupting agents lead to reduced
alkylphospholipid uptake and apoptosis (47). The other method for edelfosine uptake,
which has been heavily implicated in yeast cells, is through an ATP-dependent flippase
moderated mechanism after insertion into the plasma membrane (62,110).
A previous metabolic flux study using 13
C-labeled glucose (42) was able to
identify some changes in metabolism induced by edelfosine, though it was targeted to the
tricarboxylic acid (TCA) cycle and de novo nucleic acid synthesis. As there is strong
evidence that edelfosine treatment leads to an altered metabolism, a metabolomics
approach could be ideal to try and elucidate more information about its mode of action.
As metabolomics has emerged as a viable tool, it has been used extensively in drug

50
discovery and development in addition to many other fields (111). Metabolomic studies
have been successfully used to uncover the mechanisms by which drugs act including the
exploration of the mechanisms of action for hydrazine induced hepatotoxicity (112) and
the xenobiotic carbon tetrachloride (113). Furthermore, changes in the fatty acid and/or
lipid profile of yeast caused by growth temperature and defective lipid biosynthesis (80)
as well as the different responses of four strains of Saccharomyces cerevisiae to furfural,
phenol and acetic acid stresses (114) have been successfully carried out using a
metabolmics approach.
For these reasons I carried out untargeted profiling of the polar metabolites and
targeted fatty acid analysis of yeast treated with edelfosine at concentrations that induce a
cytostatic effect and identified perturbations induced by the treatment through
comparison to untreated yeast. S. cerevisiae was used as it has been shown to be an
excellent model organism for studying lipid metabolism and its regulation in eukaryotes
as the regulatory structures are highly conserved between yeast and mammals (115).
Additionally yeast are susceptible to similar concentrations of edelfosine to those used
with mammalian cells (63) and edelfosine can kill and/or prevent growth of yeast cells
within two doubling cycles and has previously been used to study the effects of
edelfosine with success (62,116,117). Furthermore, we have not observed any
morphological effects caused by edelfosine treatment of yeast cells.
4.2 Experimental methods
4.2.1 Yeast and edelfosine growth curves
Yeast strain BY4741 (MATa; his3∆1, leu2∆0, met15∆0 and ura3∆0) was grown
in 50mL cultures in liquid YNB with ammonium sulphate (MP Biomedical, Solon OH,

51
USA) using the culture composition and method described in section 2.1. Log phase cultures
were grown to an OD600 of approximately 0.2/mL and edelfosine was then added.
Edelfosine was dissolved in anhydrous ethanol and added at concentrations of 2, 4, 8 and
16 μg/ml to separate flasks with ethanol only added to the control flask. OD600 readings
were taken every 90 minutes after edelfosine addition for 810 minutes (13.5 hours) and a
final reading was taken at 1920 minutes (32 hours) to determine if recovery or death of
the yeast culture had occured. Two sets of triplicate readings were taken for each
concentration of edelfosine and the control in order to ensure sufficient replicates. The
mean and standard error for each concentration were then graphed using Excel 2010
(Microsoft, Redmond, WA, USA).
4.2.2 Yeast sample growth and sample harvesting
Yeast S. cervisisae strain BY4741 was grown in two cultures, edelfosine treated
and untreated, with 1.75L of liquid YNB with ammonium sulphate (MP Biomedical,
Solon OH, USA) using the culture composition and method described in section 2.1. Log
phase cultures were grown to an OD600 of 0.2/mL. At this time 2μg/mL of edelfosine
(dissolved in anhydrous ethanol) was added to the edelfosine treated culture and an equal
volume of anhydrous ethanol was added to the untreated culture. Samples were harvested in
multiples of six at each timepoint of 0, 2, 4 and 6 hours after edelfosine addition from both
the edelfosine treated and untreated culture. Each samples was then harvested as described in
section 2.1.
4.2.3 Sample extraction and derivitization
Cells were extracted using the extraction protocol described in section 3.3.2.2.
Derivatization and sample preparation for GC-MS analysis were carried out as described

52
in section 2.3.1.
4.2.4 GC-MS data acquisition
GC-MS data acquisition was carried out as described in section 2.3.2.
4.2.5 Data processing and multivariate statistical analysis and projection modelling
GC-MS data processing was carried out as described in section 2.3.3 Multivariate
statistical analysis and projection modelling was carried as described in section 3.3.5.
4.2.6 Metabolite modelling and pathway analysis
Polar metabolites and fatty acids identified to have VIP scores greater than one
through OPLS-DA modelling of edelfosine treated and untreated yeast cells were
subjected to pathway analysis using the MetaboAnalyst 2.0 (74) server. Pathway analysis
was done with 22 polar metabolites and 8 fatty acids using the S. cervisisae pathway
library. Hypergeometric test and relative-betweeness centrality algorithms were selected
as the options for the over representation analysis and pathway topology analysis portions
respectively.
4.3 Results
4.3.1 Growth with edelfosine
In order to assess the effect on the metabolome and fatty acid composition of the
model organism S. cerevisiae induced by treatment with edelfosine, comparative
metabolomics was done. Growth curves with yeast and different concentrations of
edelfosine added were constructed in order to identify the concentration of the compound
that was able to inhibit growth of the yeast culture without killing the cells to allow for
effective metabolic profiling (Figure 4.1). It was determined that 2 μg/mL of edelfosine

53
Figure 4.1. Yeast and edelfosine treatment growth curves. Yeast strain BY4741 was grown in
50mL cultures in liquid YNB with ammonium sulphate. Each culture was grown to an initial
OD600 of approximately 0.2/mL from a start point of approximately 0.05/mL and edelfosine
dissolved in ethanol was then added at 2, 4, 8 and 16 μg/mL. Two sets of triplicate readings
were taken and the mean and standard error for each concentration were calculated and graphed
using Excel 2010 (Microsoft, Redmond WA, USA). A culture of yeast strain BY4741 without
ethanol was also grown (not shown) to confirm ethanol addition had no effect on culture growth
or viability.
0
0.2
0.4
0.6
0.8
1
1.2
1.4
1.6
1.8
0 500 1000 1500 2000
OD
60
0n
m (
op
tica
l de
nsi
ty a
t 6
00
nm
)
Time (min)
BY4741 + EtOH
BY4741 + 2ug/ml Edel
BY4741 + 4ug/ml Edel
BY4741 + 8ug/ml Edel
BY4741 + 16ug/ml Edel

54
added to culture at an OD600 of approximately 0.2/mL achieved the desired effect as seen
by the halting of growth during the first six hours after edelfosine treatment followed by
culture recovery overnight.
4.3.2 OPLS-DA modelling differentiates edelfosine treated and untreated samples
Yeast treated with edelfosine was compared to untreated yeast 0, 2, 4 and 6 hours
after the addition of edelfosine in order to monitor the effects induced during the two
doubling cycles in which it has been reported that edelfosine is able to prevent further
growth. Polar metabolites and fatty acids were extracted from each sample and analyzed
using GC-MS and multivariate projection methods to model the differences between the
treated and untreated samples. OPLS-DA modelling was performed on samples extracted
for both polar metabolites (Figure 4.2) and fatty acids (Figure 4.3). The OPLS-DA
models for polar metabolites show a significant separation between the treated and
untreated samples 2 and 4 hours after the addition of edelfosine as evidenced by the high
Q2 values of greater than 0.5 and low CV-ANOVA (cross-validated analysis of variance)
p-values of less than 0.05 (Table 4.1). Conversely the low Q2 value 0 hours after the
addition of edelfosine (Q2
= 0.005), demonstrates that there is no predictive value of the
model and suggest little difference between the treated and untreated samples. This is an
expected result as edelfosine is not known to instantaneously induce measurable changes
in metabolism. Additionally, 6 hours after the addition of edelfosine there was some
separation of the treated and untreated polar metabolite profiles (Figure 4.2D) with a Q2
value of 0.464. This timepoint falls just after two doubling cycles of untreated yeast and
it has been previously reported that edelfosine treatment of yeast will prevent further
growth within this time period (63). Fatty acid profiling using FAME analysis revealed

55
Figure 4.2. OPLS-DA models using cross-validated latent variables (tcv) and cross-
validated orthogonal latent variables (tocv) comparing the polar metabolite profiles of
untreated and edelfosine treated S. cerevisiae samples at 4 timepoints after Edelfosine
treatment. Blue circles represent untreated samples and green circles represent edelfosine
treated samples. (A) 0 hours after treatment model with R2X = 0.237, R
2Y = 0.388, Q
2 =
0.005 and CV-ANOVA (cross-validated analysis of variance) p = 1.000 values. (B) 2 hours
after treatment model with R2X = 0.607, R
2Y = 0.992, Q
2 = 0.847 and CV-ANOVA p =
0.004 values. (C) 4 hours after treatment model with R2X = 0.696, R
2Y = 0.989, Q
2 = 0.918
and CV-ANOVA p = 7.078 x 10⁻⁵
values. (D) 6 hours after treatment model with R2X =
0.202, R2Y = 0.573, Q
2 = 0.464 and CV-ANOVA p = 0.003 values.
A B
D C
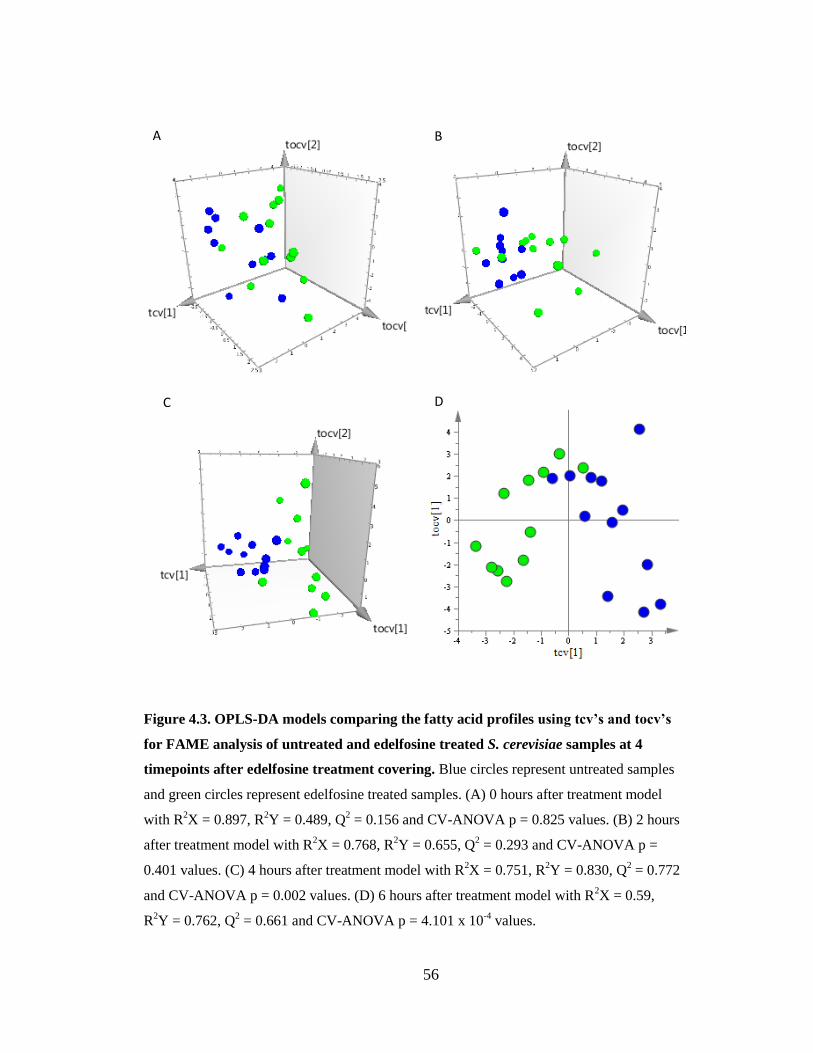
56
Figure 4.3. OPLS-DA models comparing the fatty acid profiles using tcv’s and tocv’s
for FAME analysis of untreated and edelfosine treated S. cerevisiae samples at 4
timepoints after edelfosine treatment covering. Blue circles represent untreated samples
and green circles represent edelfosine treated samples. (A) 0 hours after treatment model
with R2X = 0.897, R
2Y = 0.489, Q
2 = 0.156 and CV-ANOVA p = 0.825 values. (B) 2 hours
after treatment model with R2X = 0.768, R
2Y = 0.655, Q
2 = 0.293 and CV-ANOVA p =
0.401 values. (C) 4 hours after treatment model with R2X = 0.751, R
2Y = 0.830, Q
2 = 0.772
and CV-ANOVA p = 0.002 values. (D) 6 hours after treatment model with R2X = 0.59,
R2Y = 0.762, Q
2 = 0.661 and CV-ANOVA p = 4.101 x 10
-4 values.
A B
D C

57
Table 4.1. Summary of parameters for the assessment of the quality of OPLS-DA models
comparing edelfosine treated and untreated yeast samples. R2X and R
2Y are the modeled
variation in the X and Y matrix respectively, Q2 is the predicted variation and CV-ANOVA p-
value is obtained from the cross-validated analysis of variance of the OPLS-DA model.
Time After Edelfosine
Treatment Model Group R2X R
2Y Q
2
CV-ANOVA
p-value
0 hours Polar Metabolites 0.237 0.388 0.005 1.000
0 hours FAME's 0.897 0.489 0.156 0.825
2 hours Polar Metabolites 0.607 0.992 0.847 0.004
2 hours FAME's 0.768 0.655 0.293 0.401
4 hours Polar Metabolites 0.696 0.989 0.918 7.078 x 10⁻⁵
4 hours FAME'S 0.751 0.830 0.772 0.002
6 hours Polar Metabolites 0.202 0.573 0.464 0.003
6 hours FAME'S 0.59 0.762 0.661 4.101 x 10⁻⁴

58
significant separation between treated and untreated samples 4 and 6 hours after
edelfosine addition that can be confirmed by the Q2 and CV-ANOVA p- values meeting
the significance threshold of p<0.05 (Table 4.1). The low Q2 and insignificant CV-
ANOVA p-values obtained at the 0 (Q2 = 0.156and p = 0.825) and 2 hours (Q
2 = 0.293
and p = 0.401) after treatment time points suggest there is little difference in the fatty acid
profiles of treated and untreated samples. The observation that significant separation of
untreated and edelfosine treated samples is seen at the 4 and 6 hour timepoints for FAME
analysis, is in contrast to polar metabolite profiling which showed significant separation
at the 2 and 4 hours timepoints.
4.3.3 22 polar metabolites and 8 fatty acids altered by edelfosine treatment
Using the 2 and 4 hour timepoints from OPLS-DA modelling of polar metabolites
and the 4 and 6 hour timepoints from modelling of the FAME profiling a list of
metabolites and fatty acids significantly contributing to the separation between the
edelfosine treated and untreated was identified using a cutoff of VIP scores greater than
1, with a higher score indicating a greater influence on the separation of the two sample
groups (Table 4.2). The 2 and 4 hour timepoints from polar metabolite profiling and the 4
and 6 hour timepoints from FAME profiling were the models chosen as they were the
timepoints that displayed Q2
values greater than 0.5 and CV-ANOVA p-values of less
than 0.05, indicating significant separation between the untreated and edelfosine treated
sample groups. Additionally coefficient scores for the metabolites and fatty acids
contributing to the separation of the treated and untreated samples were obtained from the
OPLS-DA modelling and were used to identify if the levels were increased or decreased
in the edelfosine treated samples compared to the untreated samples (Table 4.2). In total,

59
Table 4.2. Polar metabolites and fatty acids identified to have a VIP score greater than 1
through OPLS-DA modelling and the corresponding coefficient values for edelfosine
treated samples compared to untreated samples. Values with a positive coefficient indicate
higher comparative levels, while values with a negative coefficient indicate lower comparative
levels.
Time After
Edelfosine Treatment Profiling Method Metabolite VIP
Coeff of Edelfosine
Treated Compared
to Untreated
2 hours Polar Metabolite myo-Inositol 2.156 0.105
2 hours Polar Metabolite α,α,D1-Trehalose 1.624 0.093
2 hours Polar Metabolite Malic Acid 1.458 0.148
2 hours Polar Metabolite Proline 1.013 0.002
2 hours Polar Metabolite Glycine 2.038 -0.080
2 hours Polar Metabolite Phosphoric Acid 1.990 -0.118
2 hours Polar Metabolite Fumaric Acid 1.588 -0.027
2 hours Polar Metabolite Octadecanoic Acid 1.580 -0.038
2 hours Polar Metabolite D-Glucopyranose 1.203 -0.070
2 hours Polar Metabolite Lactic Acid 1.201 -0.053
2 hours Polar Metabolite L-O-methyl-Threonine 1.042 -0.005
2 hours Polar Metabolite Aspartic Acid 1.015 -0.069
4 hours Polar Metabolite myo-Inositol 2.482 0.113
4 hours FAME Myristoleic Acid (C14:1) 2.344 0.434
4 hours Polar Metabolite Glucose 2.090 0.068
4 hours Polar Metabolite Galactose 1.926 0.056
4 hours Polar Metabolite Glucose-6-phosphate 1.914 0.061
4 hours Polar Metabolite Alanine 1.77 0.050
4 hours Polar Metabolite 4-Amino-Butanoic Acid 1.354 0.015
4 hours FAME Myristic Acid (C14:0) 1.334 0.17
4 hours FAME Lauric Acid (C12:0) 1.307 0.218
4 hours Polar Metabolite Sorbitol 1.101 0.038
4 hours Polar Metabolite L-O-methyl-Threonine 2.624 -0.114
4 hours Polar Metabolite Glycine 2.115 -0.052
4 hours Polar Metabolite Phosphoric Acid 2.067 -0.079
4 hours FAME Palmitic Acid (C16:0) 1.634 -0.364
4 hours Polar Metabolite Aspartic Acid 1.449 -0.031
4 hours Polar Metabolite Glutamic Acid (3TMS) 1.235 -0.026
4 hours Polar Metabolite Ornithine (3TMS) 1.165 -0.018
4 hours Polar Metabolite Glutamic Acid (2TMS) 1.163 -0.057

60
4 hours Polar Metabolite Lactic Acid 1.146 -0.074
4 hours Polar Metabolite Ornithine (4TMS) 1.022 -0.044
4 hours Polar Metabolite Citric Acid 1.019 -0.017
6 hours FAME Myristoleic Acid (C14:1) 1.764 0.292
6 hours FAME Lauric Acid (C12:0) 1.093 0.183
6 hours FAME Lignoceric Acid (C24:0) 1.600 -0.188
6 hours FAME Palmitic Acid (C16:0) 1.379 -0.188
6 hours FAME Eicosanoic Acid (C20:0) 1.049 -0.014
6 hours FAME Docosanoic Acid (C22:0) 1.036 -0.056
6 hours FAME Decanoic Acid (C10:0) 1.036 -0.168

61
22 different polar metabolites from the 2 and 4 hour timepoints and 8 different fatty acids
from the 4 and 6 hour timepoints were identified to have statistically significant changes
in the treated samples when compared to the untreated samples. Additionally, metabolites
that were detected by GC-MS analysis and identified but were found to not be perturbed
by edelfosine treatment through OPLS-DA modelling and had VIP scores of less than 1
are listed (Table 4.3).
4.3.4 Metabolic pathway analysis
Using the 22 polar metabolites and 8 fatty acids identified to be perturbed by
edelfosine treatment, pathway analysis was carried out. Six metabolic pathways were
found to be significantly perturbed with the criteria of having an impact of 0.1 and p-
value of less than 0.05 as determined by the MetaboAnalyst 2.0 software (74) (Figure 4.4
and Table 4.4). The pathways identified to be potentially altered by edelfosine treatment
involved amino acid metabolism (alanine, aspartate and glumate metabolism and arginine
and proline metabolism), sugar metabolism (galactose metabolism and starch and sucrose
metabolism) as well as TCA cycle metabolism and glutathione metabolism.
4.4 Discussion
Recent advances in metabolomics technologies and data processing have allowed
for studies that encompass the global cellular metabolism in contrast to previous studies
that targeted specific metabolite classes or metabolic pathways. This untargeted approach
has recently been used with great success in our lab to study the effects of metal toxicity
on bacteria (82,118) and cancer hypoxia (119) and in other research groups for studies
including evaluation of the HIV-1 Tat protein pathogenic mechanism (120). Furthermore
studies have successfully used FAME profiling to examine changes to fatty acid

62
Table 4.3. Identified metabolites that were found to be not significantly perturbed by
edelfosine treatment through OPLS-DA modelling and have VIP scores of less than 1. Note
this does not include peaks that could not be identified or did not have a confirmed match.
Metabolite Profiling Method
Laminaribiose Polar Metabolites
n-Heptadecane Polar Metabolites
Urea Polar Metabolites
Glycerol Polar Metabolites
Pyroglutamic Acid Polar Metabolites
Isoleucine Polar Metabolites
Threonine Polar Metabolites
Lysine Polar Metabolites
Hydroxylamine Polar Metabolites
Hexanoic Acid (C6:0) FAME
Octanoic Acid (C8:0) FAME
Palmitoleic Acid (C16:1) FAME
Stearic Acid (C18:0) FAME
Oleic Acid (C18:1) FAME

63
Table 4.4. Pathway analysis results from edelfosine treatment of yeast using MetaboAnalyst
2.0. Raw p is the p-value calculated from the enrichment analysis and the impact score is the
pathway impact calculated from the pathway topology analysis. Significantly perturbed pathways
are defined as having a raw p-value of less than 0.05 and an impact score of greater than 0.1 and
are highlighted with bold and italics.
Pathway Name
Total
Compounds Hits Raw p -log (p) Impact
Arginine and proline metabolism 37 6 0.001 7.119 0.316
Nitrogen metabolism 8 3 0.002 6.453 0.000
Alanine, aspartate and glutamate metabolism 20 4 0.003 5.776 0.637
Biosynthesis of unsaturated fatty acids 42 5 0.009 4.660 0.000
Galactose metabolism 17 3 0.016 4.155 0.308
Starch and sucrose metabolism 18 3 0.018 3.995 0.254
Citrate cycle (TCA cycle) 20 3 0.025 3.704 0.183
Glutathione metabolism 23 3 0.036 3.330 0.169
Cyanoamino acid metabolism 10 2 0.039 3.232 0.000
Glyoxylate and dicarboxylate metabolism 14 2 0.074 2.608 0.225
Butanoate metabolism 17 2 0.104 2.266 0.286
Aminoacyl-tRNA biosynthesis 67 4 0.169 1.776 0.000
Pyruvate metabolism 23 2 0.171 1.765 0.116
Glycolysis or Gluconeogenesis 24 2 0.183 1.697 0.033
Amino sugar and nucleotide sugar metabolism 24 2 0.183 1.697 0.167
Glycine, serine and threonine metabolism 26 2 0.207 1.573 0.211
beta-Alanine metabolism 7 1 0.208 1.569 0.000
Methane metabolism 11 1 0.308 1.178 0.000
Fructose and mannose metabolism 17 1 0.435 0.833 0.047
Pentose phosphate pathway 18 1 0.454 0.790 0.066
Lysine biosynthesis 19 1 0.472 0.751 0.000
Inositol phosphate metabolism 19 1 0.472 0.751 0.164
Steroid biosynthesis 23 1 0.539 0.617 0.000
Fatty acid metabolism 28 1 0.612 0.491 0.000
Cysteine and methionine metabolism 33 1 0.673 0.395 0.000
Fatty acid biosynthesis 37 1 0.716 0.335 0.000

64
Figure 4.4. MetaboAnalyst 2.0 pathway analysis summary of perturbations caused by
edelfosine treatment of yeast samples. a) alanine, aspartate and glutamate metabolism, b)
arginine and proline metabolism, c) galactose metabolism, d) starch and sucrose
metabolism, e) TCA cycle, f) glutathione metabolism.
a
c
b
e
d
f

65
composition induced by stress including different atmospheric conditions and phenethyl
alcohol in Mucor rouxii (121) as well heavy metal contamination on soil communities
(122).
In this study we combined untargeted profiling of polar metabolites and targeted
profiling of fatty acids to study the cytostatic effects of edelfosine treatment on yeast
metabolism. A cytostatic concentration of edelfosine was chosen due to the problems that
can be encountered in metabolomics studies when biological variation is introduced
through cell death as would be found if cytotoxic concentrations were used. Though
cytotoxic concentrations are more often used for studies with edelfosine due to its clinical
relevance, we hypothesize that the same alterations to metabolism seen with cytostatic
concentrations would be found at cytoxic concentrations of the compound. By subjecting
both the aqueous (polar metabolites) and organic (fatty acids) fractions of yeast samples
to GC-MS analysis we were able to study a wider range of the effects induced by
edelfosine as several different metabolic pathways have been implicated in previous
studies, while also exploring any changes to the fatty acid profile induced by its insertion
into the plasma membrane. Yeast was used as opposed to cell lines due to the ease with
which it can rapidly be grown reproducibly, the success of prior edelfosine studies in
yeast (62-64), availability of genetic screen information for edelfosine treated yeast
(116,117) and the fact that yeast is a model system for eukaryotic metabolism.
Using the 22 polar metabolites and 8 fatty acids (Table 4.2) identified to be
affected by edelfosine treatment as well as the 6 metabolic pathways that were found to
be perturbed using MetaboAnalyst 2.0 (74) (Figure 4.4 and Table 4.4), a schematic of the
perturbed metabolites and metabolic pathways was constructed to provide an overview of

66
the effects induced by edelfosine treatment (Figure 4.6) Interestingly, it also appears that
there is a kinetic difference between the polar metabolite and fatty acids responses to
edelfosine (Figure 4.5). Polar metabolites show a response to edelfosine treatment within
2 hours which lessens or is negligible by the 6 hours after treatment timepoint that covers
two doubling cycles of untreated yeast (Figure 4.5A and B). In contrast, fatty acids show
an initial response to edelfosine treatment at 2 hours that continues to strengthen through
turnover rates for fatty acids compared to polar metabolites, or could indicate a
differential response by polar metabolites and non-polar metabolites such as lipids and
fatty acids in the membrane. The major metabolic pathways and patterns as well as
potential biological interpretations for the changes induced by edelfosine treatment are
discussed below.
Proline, glutamic acid, aspartic acid, ornithine and γ-aminobutyric acid (GABA)
are all amino acids, though GABA is not an alpha amino acid and is not incorporated into
proteins, involved with the arginine and proline metabolism pathway. Our comparative
profiling found proline and GABA were increased and glutamic acid, ornithine and
aspartic acid were decreased in edelfosine treated samples compared to untreated ones.
Physiologically the arginine and proline metabolism pathway in yeast has been suggested
to be involved with stress response through an antioxidative mechanism (123) which
would support previous assertations that edelfosine induces oxidative stress (64,124). Of
further interest, arginine and proline metabolism was found to be altered in a
metabolomics study of liver cancer (125).
Alanine, aspartate and glutamate metabolism is involved with what are considered
to be non-essential amino acids. However, as it has become apparent that glutamine plays

67
Figure 4.5. Examples illustrating the different kinetic responses from 0 to 6 hours
after edelfosine treatment observed for polar metabolites and fatty acids. A) Response
of myo-inositol to edelfosine treatment. B) Response of glycine to edelfosine treatment. C)
Response of myrisotelic acid to edelfosine treatment. D) Response of lignoceric acid to
edelfosine treatment.
0
1
2
3
4
5
6
7
0h 2h 4h 6h
Rel
ati
ve
Am
ou
nt
of
my
o-I
no
sito
l
Time After Edelfosine Treatment
0
0.5
1
1.5
2
2.5
3
0h 2h 4h 6h
Rel
ati
ve
Am
ou
nt
of
Gly
cin
e
Time After Edelfosine Treatment
0
0.5
1
1.5
2
2.5
3
3.5
4
4.5
0h 2h 4h 6h
Rel
ati
ve
Am
on
t o
f
My
rist
ole
ic A
cid
Time After Edelfosine Treatment
0
0.5
1
1.5
2
2.5
0h 2h 4h 6h
Rel
ati
ve
Am
ou
nt
of
Lig
no
ceri
c A
cid
Time After Edelfosine Treatment
C D
A B

68
TCA Cycle
4-aminobutanoate
L-Glutamate
Urea Cycle
L-Glutamine
Fumarate
Proline
Ornithine
Aspartate
2-oxoglutarate
Glutathione
Metabolism
Succinate
Malate
Oxaloacetate
Arginine
Alanine
Citrate
Pyruvate Acetyl-CoA
Starch and Sucrose
Metabolism
Arginine and Proline
Metabolism
Fatty Acid
Biosynthesis
and Fatty Acid
Metabolism
Arginine
Succinate
Citrulline
Alanine, Aspartate
and Glutamate
Metabolism
Glycolysis Galactose Metabolism
Glycerophospholipid
Metabolism
myo-Inositol
D-Glucopyranose
Glucose
Glucose-6-phosphatec
Trehalose
Galactose
Sorbitol
Glycine
Lauric Acid (C12:0)
Myristic Acid (C14:0)
Myristoleic Acid (C14:1)
Decanoic Acid (C10:0)
Palmitic Acid (C16:0)
Eicosanoic Acid (C20:0)
Docosanoic Acid (C22:0)
Lignoceric Acid (C24:0)
Octadecanoic Acid
Phosphoric Acid
L-O-Methyl-Threonine
Lactate
69
Figure 4.6. Schematic overview of polar metabolites, fatty acids and metabolic pathway affected by edelfosine treatment. Open
circles indicate metabolites were not detected, green filled circles indicate the metabolite has lower levels in edelfosine treated samples
compared to untreated samples and red filled circles indicate the metabolite has higher levels in treated compared to untreated samples.
Metabolic pathways highlighted with larger font and those that are bolded represent pathways identified using MetaboAnalyst 2.0 (74)
with p-values of less than 0.05 and impact scores greater than 0.1.

70
a significant role in cancer, with several reviews and research highlights written on the
topic (126-128). As there are high levels of glutaminase in tumour cells, glutamate is
produced in abundance and can shuttle into the TCA cycle as well as aspartate through
the malate-aspartate shuttle (126). Glutamine was not detected during our polar
metabolite analysis, likely due to the fact that the derivitization required GC-MS analysis
can deaminate glutamine to glutamate (129). However, it was found that four metabolites
involved with alanine, aspartate and glutamate metabolism were perturbed by edelfosine
treatment. Glutamic acid, fumaric acid and aspartic acid all showed decreased levels in
treated compared to untreated cells, while as previously stated GABA showed increased
levels. This result could be indiciative of indicate a depletion of glutamine in the
edelfosine treated samples or at the very least disruption of the TCA cycle which is
needed for cell growth, and was found in a previous metabolic flux study with edelfosine
treated jurkat cells (42). Our pathway analysis data also seems to supports this result as
the TCA cycle was one of the metabolic pathways found to be perturbed by edelfosine
treatment with citric acid and fumaric acid levels lower in treated samples compared to
treated ones and malic acid levels higher. This may suggest a shift towards respiration
metabolism due to edelfosine treatment as yeast ferment in the presence of glucose and it
has been found that yeast mutants with impaired mitochondrial function are resistant to
edelfosine (116). Further adding to the potential significance of the glutamate findings, it
is known that glutathione metabolism is a highly responsible for antioxidant defense in
cell and promotes cells survival (130). Our polar metabolite profiling identified
glutathione synthesis as a pathway highly perturbed by edelfosine treatment with
glutamic acid, glycine and ornithine showing decreased levels in treated samples when

71
compared to untreated samples. This result ties in with our findings above suggesting that
edelfosine may promote oxidative stress in the cell. Furthermore it has been suggested
that the glutathione pathway can actually be detrimental to cancer treatment as it
interferes with and binds chemotherapeutic drugs as reviewed by Yang et al.(131). Our
results taken as a whole could suggest that edelfosine’s ability to induce oxidative stress
and potentially interfere with the glutathione pathway, may have the added effect of
promoting apotosis through a build-up of reactive oxygen species as previously suggested
(64).
The final two pathways identified to be significantly altered by edelfosine
treatment in yeast involve sugar metabolism with galactose metabolism and starch and
sucrose metabolism being affected. Galactose, glucose, glucose-6-phosphate and
trehalose were found to have higher levels in edelfosine treated samples compared to
untreated samples. This suggests that perhaps yeasts ability to utilize sugar for further
growth is affected. Alternatively it may suggest that gluconeogenesis is taking place and
could possibly explain why malic acid levels were seen to increase in edelfosine treated
cells compared to untreated cells as mentioned above.
Another potentially interesting finding from the pathway analysis found that
unsaturated fatty acid biosynthesis had a significant p-value though the impact was
calculated to be 0.000 (Table 4.4). Upon further investigation it was found that there were
no impact scores for any of the metabolites involved in the pathway defined by
MetaboAnalyst 2.0, explaining the impact score of 0 obtained. Despite this fact, the result
could still be interesting and a significant finding as 8 fatty acids were found to be
different in treated and untreated samples with the overall trend suggesting a decrease in

72
long chain fatty acids and an increase in shorter chain fatty acids and myristoleic acid, an
unsaturated fatty acid. This suggests edelfosine treatment may change the membrane
fluidity through its insertion in the membrane. Furthermore, inositol is the master
regulator of glycerophospholipid biosynthesis in yeast (132) making it of particular
interest that my-inositol was found to be increased in edelfosine treated compared to
untreated yeast samples (Table 4.2) as glycerophospholipids are a major component of
cellular membranes. This observation could further support an effect on the membrane
composition induced by edelfosine treatment and is of note as lipid metabolism has been
implicated in signalling of stress response in yeast (133).
In conclusion, the use of a metabolomics approach to study the effects of
edelfosine treatment through polar metabolite and fatty acid profiling using GC-MS
analysis identified 22 polar metabolites, 8 fatty acids and 6 metabolic pathways that were
statistically altered. Additionally, the kinetic responses of polar metabolites and non-polar
fatty acids to edelfosine treatment were found to be different. The perturbed metabolites
were suggested to be involved in alanine, aspartate and glutamate metabolism, arginine
and proline metabolism, galactose metabolism, starch and sucrose metabolism,
glutathione metabolism and the TCA cycle. The possible biological interpretations of the
effects seen in this study supports and expand upon previous findings about the
mechanism of edelfosine and are in line with the current understanding of cancer
metabolism in general.
3.5 Contributions
The experiments and data analysis in this chapter were designed and carried out
by me under the supervision of Dr. Ray Turner and Dr. Aalim Weljie and with some

73
discussional input from Dr. Vanina Zaremberg. This work is currently being prepared to
be submitted to the Journal of Biological Chemistry for publication.

74
Chapter Five: Lipidomic Profiling using UPLC-TOF-MS of Edelfosine Treated
Saccharomyces cerevisiae
5.1 Introduction
As previously discussed, edelfosine is known to insert into the plasma membrane
and has previously been shown to inhibit CTP:phosphocholine cytidylyltransferase which
is a key enzyme and the rate limiting step for the biosynthesis of phosphatidylcholine
(30,31). Additionally we have shown that edelfosine treatment in yeast leads to altered
fatty acid levels through GC-MS based FAME analysis as discussed in chapter 4. We
also found that myo-inositol levels were increased in edelfosine treated compared to
untreated yeast samples, which is of note as inositol is the master regulator of
glycerophospholipid biosynthesis in yeast (132). This is of particular interest as
glycerophospholipids are a major component of cellular membranes.
Whereas GC-MS analysis requires chemical derivitization that restricts analysis
of lipids to primarily fatty acids due to the cleavage of head groups, LC-MS generally
does not require derivitization of lipids for analysis thus allowing for detection of intact
phospholipids. A study using a shotgun lipidomics approach was able to absolutely
quantify approximately 95 percent of the yeast lipidome (80). Additionally, lipidomic
profiling has been successfully employed to study acetic acid tolerance in S. cerevisiae
and Zygosaccharomyces bailii with electrospray ionization multiple-reaction-monitoring
mass-spectrometry (134) and for lipidomic profiling and lipid biomarker discovery of
microalgael response to salt stress using UPLC-TOF-MS (135).
For these reasons, we carried out untargeted lipid profiling of edelfosine treated
yeast and compared it with untreated yeast to uncover changes in lipids induced by

75
edelfosine treatment. As we were only looking for comparative changes, the extensive
use of internal standards was not required as would be the case for absolute
quantification.
5.2 Experimental methods
5.2.1 Sample preparation
75μl aliquots from the organic phase of the edelfosine treated and untreated
samples grown and harvested as described in section 4.2.2, were taken and transferred to
1.5mL microcentrifuge tubes after extraction via the protocol described in section 3.2.2.2
had occured. After transfer to the microcentrifuge tube, samples were dried down in a
fume hood overnight and then frozen at −80 °C for later analysis if needed. Due to
instrument availability and cost, only samples from the 4 hour timepoint after edelfosine
treatment were analyzed.
5.2.2 UPLC-TOF-MS analysis
LC-MS analysis was carried out as described in section 2.4.
5.2.3 Data analysis and multivariate projection modelling
Raw LC-MS data files were converted to .mzXML format using masswolf with
the high energy scan (func 002) files removed. The data from 10 edelfosine treated and 8
untreated yeast samples was uploaded to XC-MS online (136). Analysis and peak
detection was then carried out using the HPLC/Waters TOF parameters built into the
server with [M+H], [M+NH4], [M+Na], [M+H-H20], [M+K], [M+ACN+H] and
[M+ACN+Na] adducts detected. Upon initial examination of the resulting data, it was
observed that edelfosine treated samples had approximately 5-fold higher total ion counts
than untreated samples for an unknown reason. As such the data was exported out of

76
XC-MS online and normalized using total integral normalization to allow for comparison
of treated and untreated samples using multivariate projection modelling and statistical
analysis in SIMCA-P13 (Umetrics AB, Umea Sweden). Edelfosine (523.73 g/mol)
adducts and isotope peaks were identified and removed before normalization as they
could affect the normalization and modelling steps.
After import into SIMCA-P13 mean centering and pareto scaling were applied to
the data followed by PCA and OPLS-DA modelling as described in section 3.3.5.
Additionally an S-plot was constructed to identify significantly increased or decreased
lipids as the use of VIP scores for screening is not ideal with a high number of variables,
in this case thousands. S-plots combine the modelled variance and modelled correlation
from the OPLS-DA plot using the magnitude of each variable (p) and reliability of each
variable (p(corr)) to screen out metabolite peaks that have low magnitudes of change or
intensities.
5.2.4 Lipid identification
Lipid peaks identified to be increased or decreased by edelfosine treatment from
the S-plot were identified using mzMine (137). The raw data from a representative
edelfosine treated sample with high intensity peaks was imported to mzMine and mass
detection was carried out using centroid, 1 MS level, and noise level of 1x 10²
parameters. Chromatogram builder was then used with minimum time span of 0.02
minutes, minimum height of 1 x 10³ and m/z tolerances of 0.005 or 5ppm used. This was
followed by use of the isotope peak builder function with m/z tolerance of 0.002,
retention time of 0.05, maximum charge of 1 and most intense representative isotope
parameters used. Finally, the Lipid Map database was used to for identification of the

77
peaks based on m/z and isotope pattern scores with a minimum absolute intensity of 1e2
and isotope pattern score of 70% required and m/z and isotope m/z tolerances of 0.1.
Matches were made based on the smallest difference between the expected and measured
mass and highest isotope pattern score.
5.3 Results
In order to assess the effects of edelfosine on the lipid composition of yeast,
untargeted lipidomic profiling was carried out on untreated and treated yeast samples 4
hours after treatment. The data from 8 untreated and 10 edelfosine treated samples was
uploaded to the XC-MS online (136) server to assess the quality of the data and for peak
detection.
5.3.1 Initial analysis reveals magnitude of edelfosine treated samples is higher than
untreated samples
An initial look at data quality revealed approximately 5,000 features and very
little retention time deviation (Figure 5.1). A cloud plot showed 1644 features with a fold
change of greater than 1.5 and p-value of less than 0.01 (Figure 5.2). However, all but 12
of these features were suggested to be increased in edelfosine treated samples compared
to untreated samples. The largest increases were observed at a retention time of 5.7-5.9
minutes and had m/z values consistent with edelfosine (523.73 g/mol) adducts. Looking
at the total ion chromatograms of the samples, a distinct magnitude difference was
observed between the edelfosine treated and untreated samples, indicating the need for
normalization to be carried out to allow for comparison between the sample types (Figure
5.3). As such, the feature information was exported from XC-MS online in order to allow
for integral normalization to be carried out.

78
Figure 5.1. Retention time deviation observed for 8 untreated and 10 edelfosine treated yeast samples uploaded to XC-MS Online
for analysis and peak detection. Samples 002, 005, 008, 011, 012, 015, 019 and 022 are untreated samples. Samples 001, 004, 007, 009,
010, 013, 016, 018, 020, 021 are edelfosine treated samples.

79
Figure 5.2. Cloud plot obtained from XC-MS Online analysis of 10 edelfosine treated and 8 untreated yeast samples. Features
shown have a fold change of greater than 1.5 and p-value of less than 0.01. The size of the circle for each feature corresponds to the
magnitude of the fold change. Red features are decreased in edelfosine treated samples compared to untreated samples and green features
are increased.

80
Figure 5.3. Total ion chromatograms for 8 untreated and 10 edelfosine treated yeast samples uploaded to XC-MS Online for
analysis and peak detection. Samples 002, 005, 008, 011, 012, 015, 019 and 022 are untreated samples. Samples 001, 004, 007, 009, 010,
013, 016, 018, 020, 021 are edelfosine treated samples.

81
5.3.2. Multivariate projection modelling differentiates edelfosine treated and untreated
yeast samples from lipidomic profiling
After integral normalization and trimming out of features consistent with
edelfosine treatment, PCA and OPLS-DA modelling was performed on the edelfosine
treated and untreated yeast samples from 4 hours after treatment (Figure 5.4). PCA
modelling showed separation of edelfosine treated and untreated samples with R2 = 0.716
and Q2 = 0.524 values and no outliers (Figure 5.4A). OPLS-DA modelling also showed
significant separation of treated and untreated samples as evidenced by strong model
parameters of R2(X) = 0.454, R
2(Y) = 0.876, Q
2 = 0.717 and CV-ANOVA p-value = 1.54
x 10-3
(Figure 5.4B). An S-plot was constructed to identify features that were noticeably
increased or decreased by edelfosine treatment in yeast (Figure 5.5). It was observed that
23 features were decreased and 46 increased by edelfosine treatment, with these features
highlighted in red (Figure 5.5).
5.3.3. 28 Lipids from 7 major lipid classes tentatively identified to be altered by
edelfosine treatment
Using the 23 decreased and 46 increased features identified from the S-plot,
mzMine (137) was used in combination with the Lipid Map database to tentatively
identify these features using their m/z and retention times. In total 28 different lipids from
7 major lipid classes were tentatively identified as well as 10 peaks that could not be
assigned an identity using this approach (Table 5.1). The major lipid classes proposed to
be affected by edelfosine treatment included ceramides (Cer’s), diacylglycerols (DAG’s),
triacylglycerols (TAG’s), phosphatidylcholines (PC’s), phosphatidylethanolamines
(PE’s), phosphatidylglycerols (PG’s) and lysophosphatidyl inositols (LPI’s). Identities

82
Figure 5.4. Pareto scaled PCA and OPLS-DA models of 8 untreated and 10 edelfosine treated yeast samples from lipidomic
profiling. Blue circles represent untreated samples and green circles represent edelfosine treated samples. (A) PCA scores plot
using cross-validated principal components (t[]cv[]) with R2X = 0.716 and Q2X = 0.524 values. (B) OPLS-DA model using tcv and
tocv variables with R2X = 0.454, R2Y = 0.876, Q2 = 0.717 and CV-ANOVA p = 1.54 x 10⁻³
values.
A B

83
Figure 5.5. S-plot of 8 untreated and 10 edelfosine treated yeast samples from lipidomic profiling to identify lipids decreased
or increased by edelfosine treatment. The magnitude of each variable (p) and reliability of each variable (p(corr)) are used to
screen out metabolite peaks that have low magnitudes of change or intensities.

84
Table 5.1. Lipids tentatively identified as altered by edelfosine treatment, their m/z values, retention times and the adduct used for
the proposed identifications. Tentative identifications were made using mzMine (137) and the Lipid Map database using m/z difference
between the calculated and measured masses and isotope pattern scores as determined by mzMine. 10 peaks were not identified and are
listed at the bottom of the table.
m/z Retention
Time (min) Adduct Proposed Identity
Relative Amount
Compared to Untreated
Yeast
Mass Difference Between
Expected and Measured
(m/z)
Isotope
Pattern Score
341.3052
342.3086 11.9
[M+H]
[M+H]+1 docosanoic acid Increased 0.0362 98%
311.2586 9.8 [M+H] octadecenyl acetate Increased 0.0358 97%
494.5662 10.3 [M+NH4]
myristoleyl oleate,
palmitoyl
palmitoleate, oleyl
myristoleate
Increased 0.0731 98%
522.5976 10.9 [M+NH4] palmitoleyl oleate,
oleyl palmitoleate Increased 0.0732 98%
480.5141 11.0 [M+H] ceramide (30:2) Increased 0.0730 98%
508.5458
509.6046
1016.0850
11.6
[M+H]
[M+H]+1
[2M+H]
ceramide (32:2) Increased 0.0734 94%
536.5774
537.5804
1072.1484
1074.1496
12.1
[M+H]
[M+H]+1
[2M+H]
[2M+H]+1
ceramide (34:2) Increased 0.0737 81%
582.5106
583.5134 9.8
[M+NH4]
[M+NH4]+1 DAG (32:2) Increased 0.0014 99%
587.4657 9.8 [M+Na] DAG (32:2) Increased 0.0011 98%

85
579.5356
580.5389
597.5458
11.5
[M+H-H20]
[M+H-
H20]+1
[M+H]
DAG (34:0) Increased 0.0005 89%
614.5723 11.5 [M+NH4] DAG (34:0) Increased 0.0005 99%
619.5277
1216.0667 11.5
[M+Na]
[2M+Na] DAG (34:0) Increased 0.0005 98%
610.5413 10.4 [M+NH4] DAG (34:2) Increased 0.0008 98%
615.496 10.4 [M+Na] DAG (34:2) Increased 0.0001 98%
607.5673
608.5707
609.5733
11.9
[M+H-H20]
[M+H-
H20]+1
[M+H-
H20]+2
DAG (36:0) Increased 0.0022 96%
642.6034
643.6073 11.9
[M+NH4]
[M+NH4]+1 DAG (36:0) Increased 0.0003 90%
647.5595
1272.1284
1273.1315
11.9
[M+Na]
[2M+Na]
[2M+Na]+1
DAG (36:0) Increased 0.001 95%
818.7244 12.8 [M+NH4] TAG (48:3) Increased 0.0012 89%
494.3250
495.3280 2.6
[M+H]
[M+H+1] LPC (16:1) Decreased 0.0009 94%
522.3563 3.7 [M+H] LPC (18:1) Decreased 0.0009 93%
702.5082 7.6 [M+H] PC (30:2) Increased 0.0013 87%
730.5400
731.5431 8.5
[M+H]
[M+H]+1 PC (32:2) Decreased 0.0018 75%
752.5223 8.5 [M+Na] PC (32:2) Decreased 0.0022 86%
758.5705
758.5739 9.4
[M+H]
[M+H]+1 PC (34:2) Decreased 0.001 81%
653.4412 7.7 [M+NH4] PE (28:0) Increased 0.0452 91%
654.3339
670.4673 3.9
[M+Na]
[M+K] PE (28:2) Increased
0.0766
0.0828
91%
87%

86
681.4755
682.4771
698.5009
699.5037
8.6
[M+NH4]
[M+NH4]+1
[M+2NH4]
[M+2NH4]+1
PE (30:0) Increased 0.0422 77%
688.4934 8.5 [M+H] PE (32:2) Decreased 0.0022 88%
716.5248
717.5271
718.5294
9.3
[M+H]
[M+H]+1
[M+H]+2
PE (34:2) Decreased 0.0023 87%
744.5559
745.5584 9.4
[M+H]
[M+H]+1 PE (36:2) Decreased 0.0021 96%
663.4548
680.4813 10.2
[M+H]
[M+NH4] PG (28:2) Decreased 0.0316 89%
740.5444 8.6 [M+NH4] PG (32:0) Increased 0.0008 97%
801.5521 7.3 [M+Na] PG (36:0) Increased 0.0095 78%
851.3964
852.4003 1.8
[M+Na]
[M+Na]+1 PGP (34:1) Decreased 0.0846 86%
621.3099
637. 3006
6.6
3.9
[M+Na]
[M+K] LPI (18:1) Increased
0.0089
0.0316
91%
75%
531.2753 3.5 n/a n/a Increased n/a n/a
547.4733 9.8 n/a n/a Increased n/a n/a
681.4858 8.3 n/a n/a Increased n/a n/a
699.5722 8.3 n/a n/a Increased n/a n/a
119.1678 1.6 n/a n/a Decreased n/a n/a
415.2121 1.6 n/a n/a Decreased n/a n/a
416.2159 1.6 n/a n/a Decreased n/a n/a
437.1925 1.8 n/a n/a Decreased n/a n/a
716.5236 8.6 n/a n/a Decreased n/a n/a
717.5271 8.6 n/a n/a Decreased n/a n/a

87
were proposed based on differences between calculated and expected m/z and isotope
pattern score matches as determined by mzMine.
5.4 Discussion
We previously determined that edelfosine treatment altered fatty acids levels in
yeast and found that myo-inositol was increased in edelfosine treated yeast. Combined
with the fact that inositol is a master regulator of glycerophospholipid biosynthesis (132)
in yeast and previous studies have established that edelfosine treatment disrupts the
kennedy pathway (30), there was compelling evidence to further study the effects of
edelfosine treatment on lipids in yeast.
In this study we used UPLC-TOF-MS for untargeted lipidomic profiling of
edelfosine treatment on yeast 4 hours after the compound was added to the yeast culture.
The 4 hour after treatment timepoint was chosen as this timepoint demonstrated a
response to both polar metabolites and fatty acids in our previous GC-MS study (Chapter
4). Furthermore, by using aliquots of the organic phase from the samples used in the GC-
MS study we can reliably integrate the results from both GC-MS and LC-MS analysis as
was successfully done by Liao et al. when they evaluated the HIV-1 Tat protein
pathogenic mechanism (120). Using multivariate projection methods, namely an S-plot
(Figure 5.5), we were able identify 23 features decreased by edelfosine treatment and 46
features that were increased that were then tentatively identified through the use of
mzMine and the Lipid Map database. Pareto scaling was used as opposed to univariate
scaling as univariate scaling gives equal weight to all variables whereas pareto scaling
gives more weight to larger variables. With the number of features obtained
(approximately 5,000) and the fact that an S-plot was used for identification of altered

88
lipids, pareto scaling was the more appropriate choice for this study. Using this approach
we were able to identify 28 lipids from 7 major classes that included ceramides, DAG’s,
a TAG, PC’s, PE’s, PG’s and a LPI. Some of the proposed lipid species identified and
possible biological interpretations of these results are discussed below.
Ceramide is a metabolically active cleavage product of sphingomyelinases, and is
a lipid second messenger that can induce a number of signalling pathways through
cytokines, tumor necrosis factor and interleukin-1 that can lead to cell death (138).
Increased levels of ceramides have previously been proposed to mediate apoptosis upon
treatment with miltefosine, an APL related to edelfosine (49). However this contradicted
the observation that reduced sphingomyelin (SM) biosynthesis due to downregulated
sphingomyelin synthase (SMS), which is involved in the conversion of ceramide to
sphingomyelin, resulted in edelfosine resistance (48). Due to these contradicting facts it is
very interesting that lipidomic profiling suggested the increase of 3 different ceramide
species in yeast (Cer 30:2, Cer 32:2 and Cer 34:2) upon edelfosine treatment. These
ceramides would constitute C14, C16 and C18 chain lengths suggesting they are
phytoceramides (139). Interestingly, ceramides have previously been found to increase as
part of the heat stress response of S. cerevisiae (140). It was recently discovered that the
ceramides that were increased were part of the phytoceramide family and included C14,
C16 and C18 chain lengths (139). As yeast does not produce SM, the increase in
ceramide observed must be due to a mechanism other than downregulation of SMS. This
mechanism could be sphingolipid turnover by ISC1 a gene that is involved with
sphingolipid metabolism and ceramide production in yeast (116). Of great interest in this
regard, it was found that the ISC1 deletion mutant is hyper-resistant to edelfosine

89
providing support for this assertion. Combined with observations that a ceramide-
activated protein phosphatase mediates ceramide-induced G1 arrest of yeast (141) and the
discovery that ceramides induced mitochondrial cell death in yeast through ROS (142),
there is evidence that edelfosine could at least partially induce cell death through
ceramide signalling in yeast. This could also be a potential mechanism in eukaryotes as a
study showed co-adminstration of histone deacetylase inhibitors coadministered with
perifosine, another APL related to edelfosine, resulted in Akt and MAPK/ERK disruption
in addition to increased ceramide and ROS production (143).
Another lipid second messenger that was proposed to be increased by edelfosine
treatment was diacylglycerol with DAG 32:2, DAG 34:0, DAG 34:2 and DAG 36:0 all
found to be increased. DAG is known to activate PKC which also responds to tumour
necrosis factor and interleukin-1 (138). An increase in DAG could be explained by
disruption of the Kennedy pathway which is known to be a result of edelfosine treatment
through inhibition of CTP:phosphocholine cytidylyltransferase which is the rate limiting
step for the biosynthesis of PC (30,31). Of note in this regard is the fact that PC 32:2 and
PC 34:2 were suggested to be decreased by edelfosine treatment though PC 30:2 was
increased. The decrease in PC is could be expected due to the disruption of the Kennedy
pathway, however this would lead to other biological effects to counter the loss of PC
which is the major membrane phospholipid in yeast (144). One possible mechanism to
counter PC depletion is methylation of PE usually through PC 32:2 (144). Additionally, it
has been observed that PC depletion in yeast leads to shortening and increased saturation
of lipid acyl chains and could be an attempt to overcome the non-bilayer propensity of PE
due to its tendency to cause negative curvature (144). Our results seem to support this

90
conclusion as PE 28:0, PE 28:2, and PE 30:0 were all suggested to be increased in
edelfosine treated yeast while PE 32:2, PE 34:2 and PE 36:2 were all suggested to be
decreased. As a result of this acyl chain remodelling, the increase of PC 30:2 could then
be explained as a part of the mechanism to mitigate PC depletion through PE
methylation.
Further supporting the increase in DAG due to inhibition of the Kennedy pathway
is our observations that TAG 48:3 increased in edelfosine treated yeast. This suggested
increase could be a result of the excess DAG being turned over to TAG (145) by Dga1p
(146) or Lro1p (147), though increases in more than one TAG would provide stronger
support for this conclusion. Further supporting excess DAG and potentially explaining
the increase of only a single TAG, is the fact that cytidine-diphosphate (CDP)-DAG can
be converted to phosphatidylglycerol phosphate (PGP) by Pgs1p in the mitochondria
(148). As PGP formation in the mitochondria is the committed step in the biosynthesis of
phosphatidylglycerol (PG) and cardiolipin (CL) this could explain our observations that
PGP 34:1 was decreased and PG 32:0 and PG 36:0 were increased by edelfosine
treatment as PGP is dephosphorylated to PG by Gep4p (149). Although PG 28:2 was
decreased by edelfosine treatment, this could again be a result of acyl chain remodelling.
Finally LPI (18:1) was proposed to be increased by edelfosine treatment, while
LPC (16:1) and LPC (18:1) were decreased. However, without more information it is
hard to draw any concrete biological conclusions from these results though the observed
LPC decrease may be due to the presence of edelfosine, which has an LPC-like structure.
In conclusion, 23 features were found to be decreased by edelfosine treatment of
yeast after 4 hours and 46 features were found to be increased. These features were

91
tentatively identified to comprise 28 lipids from 7 major lipid classes. Although standards
were not used to support our identifications due to the significant cost associated with
such an approach, we believed that as yeast only generates even numbered acyl chains
and single unsaturations on C14, C16 and C18 carbon length chains there was a lower
likelihood for false identifications. However in some cases, particularly with the
ceramides and phosphatidylethanolamines, the m/z differences between were in excess of
200ppm which brings into questions their validity. These differences could be due to
fragmentation patterns, or simply down to the fact that the compound was not in the Lipid
Maps Database but was closely related to the identity we proposed. Combined with the
unknown origin of the approximately 5-fold total ion count magnitude difference
between edelfosine treated and untreated samples, deeper analysis of these samples is
likely necessary. Despite these limitations potentially interesting conclusions were
generated from the lipidomic profiling of edelfosine treatment that are consistent with
and supported by current understanding in the field of cancer and our polar metabolite
and fatty acid profiling study. Biological interpretation of these results suggests possible
roles for the lipid second messengers ceramide and DAG as key players in edelfosine’s
ability to stop cell growth, possibly through tumour necrosis factor and interleukin-1.
Additionally shortening and increased saturation of fatty acyl chain lengths of the major
membrane lipids PC and PE was observed.
5.5 Contributions
The experiments and data analysis in this chapter were designed and carried out
by me under the supervision of Dr. Ray Turner and Dr. Aalim Weljie and with some
discussional input from Dr. Vanina Zaremberg. This work is currently being prepared to

92
be submitted with the work done from chapter 4 to the Journal of Biological Chemistry
for publication or possibly as its own manuscript.

93
Chapter Six: Concluding Remarks and Future Directions
6.1 Summary of research objectives and implications
When this research project was started, the mode of action of edelfosine was not
well understood, with several different metabolic pathways reported to be affected and
two uptake mechanisms suggested. Using metabolomics techniques and methodology, we
set out to understand the metabolism wide effects edelfosine induces in yeast and build
upon the working mechanism of action that has been proposed. More specifically
perturbations induced to polar metabolites, fatty acids and lipids were examined in order
to generate new hypotheses about edelfosine’s mechanism of action.
6.1.1 Evaluation of extraction protocols for yeast
The first objective involved optimization of simultaneous extraction of polar
metabolites and lipids simultaneously from a sample. GC-MS analysis of aqueous and
organic fractions from 3 chloroform/methanol/water based extraction protocols used in
the literature was carried out (Chapter 3). Using multivariate projection methods and
multivariate statistical modelling, the extraction protocols were compared for their ability
to effectively and reproducibly extract high amounts of both types of metabolites (Section
3.2).
Using this approach comparison, of the different extraction protocols was
efficiently and economically carried out. Multivariate projection methods and statistical
modelling showed that although all 3 extraction protocols were able to extract the same
metabolites, they differed in their reproducibility and metabolite recovery capabilities
(Table 3.1). A protocol was identified that was able to reproducibly extract high levels of

94
polar metabolites and fatty acids for metabolomics studies in yeast. Additionally, we
were able to show the usefulness of a multivariate projection based method for
comparison of different metabolite extraction protocols in an efficient manner without the
extensive use of standards.
6.1.2 Analysis of changes in the metabolome and fatty acid profile of yeast induced by
edelfosine treatment.
Achieving this objective involved the use of GC-MS analysis to identify changes
to the polar metabolite and fatty acid profiles of yeast 0, 2, 4 and 6 hours after edelfosine
treatment through comparison of edelfosine treated and untreated yeast samples (Chapter
4). It was key to establish concentration and exposure timing for these experiments
(Section 4.3.1)
With the aid of multivariate projection methods and statistical modelling 22 polar
metabolites and 8 fatty acids were found to be perturbed by edelfosine treatment in yeast
(Section 4.3.3). Furthermore, differences in the kinetic response of polar metabolites and
non-polar fatty acids to edelfosine treatment were observed (Figure 4.5). Combined, these
observations indicate a strong physiological response of the cells is induced upon
edelfosine treatment in yeast.
Proposed effects include a modulation of fatty acid composition and a shift
towards a more respirative than fermentative metabolism. Evidence for the possible
metabolic changes induced by edelfosine treatment include a decrease in lactate and
increase in glucose, glucose-6-phosphate, trehalose and other sugars which could be an
indication that there is a shift away from a fermentative metabolism. In the context of
tumour cells these results could suggest that edelfosine may be able to counter the

95
Warburg effect, a fermentative like metabolism that is known to be prevalent in various
types of tumours. Additionally we propose that edelfosine treatment exerts an effect on
the fatty acid composition as evidence by a shortening of acyl chain lengths and an
increase in the unsaturated fatty acid myristoleic acid in addition to an increase in myo-
inositol which is a master regulator of glycerophospholipids in yeast. Furthermore effects
on amino acid and TCA cycle metabolism are also proposed to be caused by edelfosine.
These edelfosine influenced changes could further compound the cell death or halting of
growth that edelfosine is known to cause or conversely may be a by-product of these
effects.
6.1.3 Analysis of changes in the lipidome of yeast induced by edelfosine treatment.
Using UPLC-TOF-MS and aliquots of the 4 hour after edelfosine timepoint
samples from edelfosine treated and untreated yeast, untargeted lipidomic profiling was
done in order to achieve this objective (Chapter 5). By using the same samples from polar
metabolite and fatty acid profiling, these observations can be integrated and interpreted
together.
With the aid multivariate projection methods and statisitical modelling, an S-plot
was constructed that identified 23 features decreased and 46 features increased by
edelfosine treatment, indicating that lipid metabolism is strongly effected by edelfosine
treatment in yeast (Figure 5.5). Tentative identification of these features proposed that 28
lipid species involved primarily with lipid signalling and membrane architecture were
perturbed by edelfosine treatment (Section 5.3.3). Though care must be taken to confirm
these lipid identifications more concretely, if they hold true it would represent a
significant step forward in our understanding of edelfosine’s mechanism of action.

96
6.1.4 Secondary analysis and biological interpretation of the metabolomics data
In order to propose specific metabolic pathways in yeast perturbed by edelfosine
treatment and allow for increased biological interpretation of the proposed effects
observed, pathway analysis was carried out on the 22 polar metabolites and 8 fatty acids
identified through GC-MS analysis using MetaboAnalyst 2.0 (74) (Section 4.3.4). This
approach identified alanine, aspartate and glutamate metabolism, arginine and proline
metabolism, galactose metabolism, starch and sucrose metabolism, glutathione
metabolism and the TCA cycle to be significantly perturbed by edelfosine treatment.
Using these perturbed metabolic pathways in combination with the 22 polar metabolites
and 8 fatty acids involved, a schematic of the wide ranging effects of edelfosine treatment
was constructed (Figure 4.6) that also implicated glycerophospholipid metabolism as well
as fatty acid biosynthesis and fatty acid metabolism as being perturbed.
Additionally biological interpretation of the 28 lipid species affected by
edelfosine treatment was done (Section 5.4). The lipid second messengers ceramide and
DAG were suggested to be strongly affected by edelfosine treatment. Furthermore it was
proposed that shortening and increased saturation of PC and PE acyl chain lengths
resulted from edelfosine treatment and this novel observation could be a result of or
response to edelfosine’s previously reported inhibition of the Kennedy pathway.
Our proposed biological interpretations of these effects supported and expanded
upon previous findings about edelfosine, aiding efforts to better understand its
mechanism of action through the generation of new hypotheses that can now be explored.
Additionally, a figure summarizing the proposed effects observed from metabolomic and
lipidomic profiling of edelfosine was constructed to aid further studies (Figure 6.1).

97
4-aminobutanoate
L-Glutamate
rea Cycle
L-Glutamine
Aspartate
Glutathione Metabolism
TCA Cycle
Fumarat
2-oxoglutarate
Oxaloacetate
Starch and Sucrose
Metabolism
Arginine and Proline Metabolism
Fatty Acid
Biosynthesis and Fatty Acid
Metabolism
Alanine, Aspartate
and Glutamate
Metabolism
Alanine
Pyruvate Acetyl-CoA
Glycolysis Galactose Metabolism
D-Glucopyranose
Glucose
Glucose-6-phosphate
Trehalose
Galactose
Sorbitol
Glycine
Lauric Acid (C12 0)
Myristic Acid (C14 0)
Myristoleic Acid (C14 1)
Decanoic Acid (C10 0)
Palmitic Acid (C16 0)
Eicosanoic Acid (C20 0)
Docosanoic Acid (C22 0)
Lignoceric Acid (C24 0)
Octadecanoic Acid
Lactate
Serine
Succinate
Malate
Citrate
Ornithine
Arginine
Arginine
Succinate
Citrulline
Proline
Glycerophospholipid
Metabolism
Glycerolipid Metabolism
Sphingolipid
Metabolism
Ceramide (30 2)
Ceramide (32 2)
Ceramide (34 2)
LPC (16 1)
LPC (18 1)
PC (30 2)
PC (32 2)
PC (34 2)
PE (28 0)
PE (28 2)
PE (30 0)
DAG (32 2)
DAG (34 0)
DAG (34 2)
DAG (36 0)
TAG (48 3)
Phosphoric Acid
L-O-Methyl-Threonine
Palmitoleyl oleate
LPI (18 1)
Octadecenyl acetate
Oleyl myristoleate
PG (28 2)
PG (32 0)
PG (36 0)
PGP (34 2) Myo-inositol PE (32 2)
PE (34 2)
PE (36 2)

98
Figure 6.1. Schematic overview of polar metabolites, fatty acids and lipids identified to be affected by edelfosine in yeast
through metabolomic and lipidomic profiling. Open circles indicate metabolites were not detected, green filled circles indicate
the metabolite has lower levels in edelfosine treated samples compared to untreated samples and red filled circles indicate the
metabolite has higher levels in treated compared to untreated samples.
99
6.2 Future directions
6.2.1 Further metabolomics studies
6.2.1.1 LC-MS analysis of polar metabolite perturbations
Though GC-MS analysis is an excellent and commonly used technique for
metabolomics profiling, it does have some limitations including the requirement for
chemical derivitization of compounds for analysis. This results in some bias in terms of
the number and types of compounds that can be analyzed as evidenced by our detection
of 31 polar metabolites despite that fact that yeast contains many more polar metabolites
than this. One example that was discussed previously is the conversion of glutamine to
glutamate during derivitization (129). Additionally, GC-MS cannot easily be used for the
detection of many large highly polar metabolites as they are not very volatile or stable
(150), resulting in a potential loss information and metabolic effects.
Combining GC-MS analysis with LC-MS analysis can often help overcome some
of these limitations and can be used to complement GC-MS. To follow up on our
profiling of polar metabolites using GC-MS analysis, LC-MS analysis on edelfosine
treated yeast could also be undertaken. This would likely have to be done on certain
classes of metabolites or targeted to specific metabolic pathways as LC-MS analysis
often requires extensive use of standards and can have very long sample analysis times
when global metabolite profiling is carried out. However, as GC-MS based profiling was
able to identify pathways significantly perturbed by edelfosine treatment, this could be an
excellent approach to provide a more in depth picture of how exactly the pathway is
being perturbed and what metabolites or branches within a given metabolic network are
the most affected.

100
6.2.1.2 Edelfosine resistant yeast mutants
Another set of potentially informative follow up experiments that could be
performed would be to carry out metabolomic profiling of edelfosine resistant mutants
that have been identified through chemical-genomic screens (116). As edelfosine
resistant mutants have been identified for a number of cellular processes including
uptake, endocytosis and retrograde transport (116), the different effects induced by
edelfosine at various points in the cell could be identified and analyzed. An example
would be metabolomic profiling of the Lem3p mutant of edelfosine as Lem3p has been
identified as being essential for the uptake of edelfosine itself (62). Metabolomic
profiling of this mutant would then allow for the metabolic changes induced by
edelfosine uptake to be identified. In this manner a series of mutants could be profiled
and the specific roles of each in the variety of effects induced by edelfosine could be
unravelled systematically.
6.2.1.3 Profiling of the effects of other APL’s in yeast
As mentioned previously, edelfosine is the prototype for the APL class of
compounds which also includes other potential chemotherapeutic agents including
ilmofosine, miltefosine, erucylphosphocholine and perifosine. These compounds are
thought to act through the same or similar modes of actions as edelfosine (10). As a
workflow to use metabolomic profiling to study this class of compounds in yeast has now
be tested and proven effective, the similarities and differences (if any) could be explored
and identified using this type of approach in the future.

101
6.2.2 Confirming our biological interpretations
As metabolomics has grown as a field and seen more widespread use, one
potential shortcoming that has been exposed is that the metabolic effects seen could
happen through a number of mechanisms or may be artifacts despite ones best efforts to
avoid such a result. These artifacts sometimes arise due to instrumentation or statistical
biases that are often unavoidable with metabolomics approaches. As such, it is often a
good idea to consider metabolomic profiling to be a hypothesis generating technique that
needs to be followed up on and confirmed biologically in some cases. One such method
to do this is to use classical biochemistry techniques to confirm the suggestions put
forward.
As yeast is a well-studied model system, genetic, mRNA and protein information
is readily available and its metabolism is for the most part well understood. Furthermore
as genetic screens have already been carried out and found edelfosine resistant mutants,
many of the genes of interest have already been identified. To this effect, it would be
possible to identify the proteins involved in the metabolic pathways implicated to be
perturbed by edelfosine treatment from our metabolomics profiling. Classical
biochemistry techniques such as western blotting could then be used to monitor levels of
the enzymes involved in the conversion of the metabolites that have been identified to be
altered to see if their levels are modulated as would be expected when yeast is treated
with edelfosine. Another complementary approach would be to use quantitative reverse
transcription polymerase chain reaction (qRT-PCR) to determine if the expression levels
of the enzyme in questions changed in a manner that would be consistent with what is
expected upon edelfosine treatment based on the observations made from the

102
metabolomics profiling data. In this way, further evidence could be obtained to back up
the suggestions made using the metabolmics data. An example of this type of approach
was the successful use of qRT-PCR to corroborate observations made from GC-MS and
LC-MS metabolomics data that uncovered the pathogenic mechanism of HIV-1 Tat
protein in Jurkat cells (120).
Despite the need for follow up experiments, metabolomics and lipidomic profiling
applied to exploring edelfosine’s mechanisms action was still able to provide valuable
insight as well as generate several novel hypotheses that can be explored in the future.
Furthermore, it was unique in allowing simultaneous exploration of a range of metabolic
effects and we can take comfort in that fact that many of our observations were supported
by current knowledge in the field of cancer as well as being in line with and expanding
upon previous studies carried out with edelfosine.

103
References
1. Stiuso, P., Caraglia, M., De Rosa, G., and Giordano, A. (2013) Bioactive peptides
in cancer: therapeutic use and delivery strategies. Journal of Amino Acids 2013,
http://dx.doi.org/10.1155/2013/568953
2. Patyar, S., Joshi, R., Byrav, D. S., Prakash, A., Medhi, B., and Das, B. K. (2010)
Bacteria in cancer therapy: a novel experimental strategy. Journal of Biomedical
Science 17, 21
3. Choi, J. W., Lee, J. S., Kim, S. W., and Yun, C. O. (2012) Evolution of oncolytic
adenovirus for cancer treatment. Advanced Drug Delivery Reviews 64, 720-729
4. Gajate, C., and Mollinedo, F. (2002) Biological Activities, Mechanisms of Action
and Biomedical Prosepect of the Antitumour Ether Phospholipid ET-18-OCH3
(Edelfosine), A Proapoptotic Agent in Tumor Cells. Current Drug Metabolism 3,
491-525
5. Gills, J. J., and Dennis, P. A. (2004) The development of phosphatidylinositol
ether lipid anlogues as inhibitors of the serine/threonine kinase, Akt. Expert
Opinion on Investigational Drugs 13, 787-797
6. Powis, G., Aksoy, I. A., Melder, D. C., Aksoy, S., Echinger, H., Fauq, A. H., and
Kozikowski, A. P. (1991) D-3-Deoxy-3-subsititued myo-inositol analogues as
inhibitors of cell growth. Cancer Chemotherapy and Pharmacology 29, 95-104
7. Gills, J. J., Holbeck, S., Hollingshead, M., Hewitt, S. M., Kozikowski, A. P., and
Dennis, P. A. (2006) Spectrum of activity and molecular correlates of response to
phosphatidylinositol ether lipid analogues, novel lipid-based inhibitors of Akt.
Molecular Cancer Therapeutics 5, 713-722
104
8. Gills, J. J., Castillo, S. S., Zhang, C., Petukhov, P. A., Memmott, R. M.,
Hollingshead, M., Warfel, N., Han, J., Kozikowski, A. P., and Dennis, P. A.
(2007) Phosphatidylinositol ether lipid analogues that inhibit AKT also
independently activate the stress kinase, p38alpha, through MKK3/6-independent
and -dependent mechanisms. The Journal of Biological Chemistry 282, 27020-
27029
9. Zhang, C., Elkahloun, A. G., Liao, H., Delaney, S., Saber, B., Morrow, B.,
Prendergast, G. C., Hollander, M. C., Gills, J. J., and Dennis, P. A. (2011)
Expression signatures of the lipid-based Akt inhibitors phosphatidylinositol ether
lipid analogues in NSCLC cells. Molecular Cancer Therapeutics 10, 1137-1148
10. van Blitterswijk, W. J., and Verheij, M. (2008) Anticancer Alkylphospholipids:
Mechanisms of Action, Cellular Sensitivity and Resistance, and Clinical
Prospects. Current Pharmeceutical Design 14, 2061-2074
11. Herrmann, D. B. J., Opitz, H., and Munder, P. G. (1991) Antitumour Activity of
Ilmofosine (BM 41.440) in the Lewis-Lung Carcinoma Model. Lipids 26, 1431-
1436
12. Girgert, R., Schwiezer, P., Bock, I., Narr, R., and Bruchelt, G. (1995) Cytotoxicity
of ether phospholipid BM 41.440 on neuroblastoma cells. Journal of Cancer
Research and Clinical Oncology 121, 262-266
13. Herrmann, D. B. J., Pahlke, W., Opitz, H., and Bicker, U. (1990) In vivo
antitumour activity of Ilmofosine. Cancer Treatment Reviews 17, 247-252

105
14. Unger, C., Damenz, W., Fleer, E. A. M., Kim, D. J., Breiser, A., Hilgard, P.,
Engel, J., Nagel, G., and Eibl, H. (1989) Hexadecylphosphocholine, a new ether
lipid analogue. Acta Oncologica 28, 213-217
15. Eibl, H., and Unger, C. (1990) Hexadecylphosphocholine: a new and selective
antitumor drug. Cancer Treatment Reviews 17, 233-242
16. Koetting, J., Marschner, N., Neumueller, W., Unger, C., and Eibl, H. (1992)
Hexadecylphosphocholine and octadecyl-methyl-glycero-3-phosphocholine: a
comparison of hemolytic activity, serum binding and tissue distribution. Progress
in Experimental Tumor Research 34, 131-142
17. Jha, T. K., Sundar, S., Thakur, C. P., Bachmann, P., Karbwang, J., Fischer, C.,
Voss, A., and Berman, J. (1999) Miltefosine, an oral agent, for the treatment of
indian visceral leishmaniasis. The New England Journal of Medicine 341, 1795-
1800
18. Terwogt, J. M. M., Mandjes, I. A. M., Sindermann, H., Beijnen, J. H., and ten
Bokkel Huinink, W. W. (1999) Phase II trial of topically applied miltefosine
solution in patients with skin-metastasized breast cancer. British Journal of
Cancer 79, 1158-1161
19. Dummer, R., Krasovec, M., Roger, J., Sindermann, H., and Burg, G. (1993)
Topical administration of hexadecylphosphocholine in patients with cutaneous
lymphomas: Results of a phase I/II study. Journal of the American Academy of
Dermatology 29, 963-970
20. Kaufmann-Kolle, P., Berger, M. R., Unger, C., and Eibl, H. (1996) Systemic
administration of alkylphosphocholines. Erucylphosphocholine and liposomal

106
hexadecylphosphocholine. Advances in Experminetal Medicine and Biology 416,
165-168
21. Erdlenbruch, B., Jendrossek, V., Gerriets, A., Vetterlein, F., Eibl, H., and
Lakomek, M. (1999) Erucylphosphocholine: pharmacokinetics, biodistribution
and CNS-accumulation in the rat after intravenous administration. Cancer
Chemotherapy and Pharmacology 44, 484-490
22. Hilgard, P., Klenner, T., Stekar, J., Nossner, G., Kutscher, B., and Engel, J. (1997)
D-21266, a New Heterocyclic Alkylphospholipid with Antitumour Activity.
European Journal of Cancer 33, 442-446
23. Hideshima, T., Catley, L., Yasui, H., Ishitsuka, K., Raje, N., Mitsiades, C., Podar,
K., Munshi, N. C., Chauhan, D., Richardson, P. G., and Anderson, K. C. (2006)
Perifosine, an oral bioactive novel alkylphospholipid, inhibits Akt and induces in
vitro and in vivo cytotoxicity in human multiple myeloma cells. Blood 107, 4053-
4062
24. Vink, S. R., Lagerwerf, S., Mesman, E., Schellens, J. H., Begg, A. C., van
Blitterswijk, W. J., and Verheij, M. (2006) Radiosensitization of squamous cell
carcinoma by the alkylphospholipid perifosine in cell culture and xenografts.
Clinical Cancer Research 12, 1615-1622
25. H., E., D., A., Weltzien, H. U., and Westphal, O. (1967) On the synthesis of alpha
and beta lecithins and their either analogs. Justus Liebigs Annalen der Chemie
704, 226-230

107
26. Andreesen, R., Modolell, M., and P.G., M. (1979) Selective sensitivity of chronic
myelogenous leukemia cell populations to alkyl-lysophospholipids. Blood 54,
519-523
27. Modolell, M., Andreesen, R., Pahlke, W., Brugger, U., and Munder, P. G. (1979)
Disturbance of phospholipid metabolism during destruction of tumor cells
induced by alkyl-lysophospholipids. Cancer Research 39, 4681-4686
28. Diomede, L., Colotta, F., Piovani, B., Re, F., Modest, E. J., and Salmona, M.
(1993) Induction of apoptosis in human leukemic cells by the ether lipid 1-
ocadecyl-2-methyl-RAC-glycero-3-phosphocholin: A possible basis for its
selective induction. International Journal of Cancer 53, 124-130.
29. Mollinedo, F., Martinez-Dalmau, R., and Modolell, M. (1993) Early and selective
induction of apoptosis in human leukemic cells by the alkyl-lysophospholipid ET-
18-OCH3. Biochemical and Biophysical Research Communications 192, 603-609
30. Boggs, K. P., Rock, C. O., and Jackwoski, S. (1995) Lysophosphatidylcholine and
1-Octadecyl-2-O-methyl-rac-glycero-3-phosphocholine inhibit the CDP-choline
pathway of phosphatidylcholine synthesis at the CTP:phosphocholine
cytidylyltransferase step. The Journal of Biological Chemistry 270, 7757-7764
31. Van der Luit, A. H., Budde, M., Ruurs, P., Verheij, M., and van Blitterswijk, W.
J. (2002) Alkyl-lysophospholipid accumulates in lipid rafts and induces apoptosis
via raft-dependent endocytosis and inhibition of phosphotidylcholine synthesis.
The Journal of Biological Chemistry 277, 39541-39547

108
32. Kiss, Z., and Crilly, K. S. (1997) Alkyl lysophospholipids inhibit phorbol ester-
stimlated phospholipase D activity and DNA synthesis in fibroblasts. FEBS letters
412, 313-317
33. Strassheim, D., Shafer, S. H., Phelps, S. H., and Williams, C. L. (2000) Small Cell
Lung Carcinoma Exhibits Greater Phospholipase C-B1 Expression and Edelfosine
Resistance Compared with Non-Small Cell Lung Carcinoma. Cancer Research
60, 2730-2736
34. Ruiter, G. A., Verheij, M., Zerp, S. F., and van Blitterswijk, W. J. (2001) Alkyl-
lysophospholipids as anticancer agents and enhancers of radiation-induced
apoptosis. International Journal of Radiation Oncology Biology Physics 49, 415-
419
35. Ruiter, G. A., Zerp, S. F., Bartelink, H., van Blitterswijk, W. J., and Verheij, M.
(2003) Anti-cancer alkyl-lysophospholipids inhibit the phosphatidylinositol 3-
kinase-Akt/PKB survival pathway. Anti-cancer Drugs 14, 167-173
36. Ruiter, G. A., Zerp, S. F., Bartelink, H., van Blitterswijk, W. J., and Verheij, M.
(1999) Alkyl-lysophospholipids activate the SAPK/JNK pathway and enhance
radition-induced apoptosis. Cancer Research 59, 2457-2463
37. Goillot, E., Rainegeaud, J., Ranger, A., Tepper, R. I., Davis, R. J., Harlow, E., and
Sanchez, I. (1997) Mitogen-activated protein kinase-mediated Fas apoptotic
signaling pathway. Proceedings of the National Academy of Science of the United
States of America 94, 3302-3307
38. Ichijo, H. (1999) From receptors to stress-activated MAP kinases. Oncogene 18,
6087-6093

109
39. Gajate, C., and Mollinedo, F. (2001) The antitumour ether lipid ET-18-OCH3
induces apoptosis through translocation and capping of Fas/CDC95 into
membrane rafts in human leukemic cells. Blood 98, 3860-3863
40. Nieto-Miguel, T., Fonteriz, R. I., Vay, L., Gajate, C., Lopez-Hernandez, S., and
Mollinedo, F. (2007) Endoplasmic reticulum stress in the proapoptotic action of
edelfosine in solid tumor cells. Cancer Research 67, 10368-10378
41. Gajate, C., Matos-da-Silva, M., Dakir el, H., Fonteriz, R. I., Alvarez, J., and
Mollinedo, F. (2012) Antitumor alkyl-lysophospholipid analog edelfosine induces
apoptosis in pancreatic cancer by targeting endoplasmic reticulum. Oncogene 31,
2627-2639
42. Selivanov, V. A., Vizan, P., Mollinedo, F., Fan, T. W., Lee, P. W., and Cascante,
M. (2010) Edelfosine-induced metabolic changes in cancer cells that precede the
overproduction of reactive oxygen species and apoptosis. BMC Systems Biology
4, doi:10.1186/1752-0509-4-135
43. Kelley, E. E., Modest, E. J., and Burns, P. C. (1993) Unidirectional membrane
uptake of the ether lipid antineoplasti agent edelfosine by L1210 cells.
Biochemical Pharmacology 45, 2435-2439
44. Vink, S. R., van der Luit, A. H., Klarenbeek, J. B., Verheij, M., and van
Blitterswijk, W. J. (2007) Lipid rafts and metabolic energy differentially
determine uptake of anti-cancer alkylphospholipids in lymphoma versus
carcinoma cells. Biochemical Pharmacology 74, 1456-1465
45. Munoz-Martinez, F., Torres, C., Castanys, S., and Gamarro, F. (2008) The anti-
tumor alkylphospholipid perifosine is internalized by an ATP-dependent

110
translocase activity across the plasma membrane of human KB carcinoma cells.
Biochimica et Biophysica Acta 1778, 530-540
46. van der Luit, A. H., Budde, M., Verheij, M., and van Blitterswijk, W. J. (2003)
Different modes of internalization of apoptotic alkyl-lysophospholipid and cell
rescuing lysophosphatidylcholine. The Biochemical Journal 374, 747-753
47. van der Luit, A. H., Vink, S. R., Klarenbeek, J. B., Perrissoud, D., Solary, E.,
Verheij, M., and van Blitterswijk, W. J. (2007) A new class of anticancer
alkylphospholipids uses lipid rafts as membrane gateways to induce apoptosis in
lymphoma cells. Molecular Cancer Therapeutics 6, 2337-2345
48. Van der Luit, A. H., Budde, M., Zerp, S., Caan, W., Klarenbeek, J. B., Verheij,
M., and Van Blitterswijk, W. J. (2007) Resistance to alkyl-lysophospholipid-
induced apoptosis due to downregulated sphingomyelin synthase 1 expression
with consequent sphingomyelin- and cholesterol-deficiency in lipid rafts. The
Biochemical Journal 401, 541-549
49. Wieder, T. (1998) Induction of Ceramide-mediated Apoptosis by the Anticancer
Phospholipid Analog, Hexadecylphosphocholine. The Journal of Biological
Chemistry 273, 11025-11031
50. Vogler, W. R., Olson, A. C., Okamoto, S., Somberg, L. B., and Glasser, L. (1987)
Experimental Studies in the Role of Alkyl Lysophospholipids in Autologous Bone
Marrow Transplantation. Lipids 22, 919-923
51. Berdel, W. E., Schlehe, H., Fink, U., Emmerich, B., Maubach, P. A., Emslander,
H. P., Daum, S., and Rastetter, J. (1982) Early Tumor and Leukemia Response to
Alkyl-Lysophospholipids in a Phase I Study. Cancer 50, 2011-2015

111
52. Drings, P., Gunther, I., Gatzemeier, U., Ulbrich, F., Khanavkar, B., Schreml, W.,
Lorenz, J., Brugger, W., Schick, H. D., Pawel, J. v., and Nordstrom, R. (1992)
Final Evaluation of a Phase II Study on the Effect of Edelfosine (an Ether Lipid)
in Advanced Non-Small-Cell Bronchogenic Carcinoma. Onkologie 15, 375-382
53. Munder, P. G., and Westphal, O. (1990) Antitumoral and other biomedical
activities of synthetic ether lysophospholipids. Chemical Immunology 49, 206-235
54. Piantadosi, C., Marasco, C. J., Morris-Natschke, S. L., Meyer, K. L., Gumus, F.,
Surles, J. R., and Ishaq, K. S. (1991) Synthesis and Evaluation of Novel Ether
Lipid Nucleoside Conjugates for Anti-HIV-1 Activity. Journal of Medicinal
Chemistry 34, 1408-1414
55. Almeida, B., Silva, A., Mesquita, A., Sampaio-Marques, B., Rodrigues, F., and
Ludovico, P. (2008) Drug-induced apoptosis in yeast. Biochimica et Biophysica
Acta 1783, 1436-1448
56. Tsukuda, T., Fleming, A. B., Nickoloff, J. A., and Osley, M. A. (2005) Chromatin
remodelling at a DNA double-strand break site in Saccharomyces cerevisiae.
Nature 438, 379-383
57. Hartwell, L. H., and Kastan, M. B. (1994) Cell cycle control and cancer. Science
266, 1821-1828
58. Simon, J. A., and Bedalov, A. (2004) Yeast as a model system for anticancer drug
discovery. Nature Reviews Cancer 4, 481-487
59. Smith, A. M., Ammar, R., Nislow, C., and Giaever, G. (2010) A survey of yeast
genomic assays for drug and target discovery. Pharmacology & Therapeutics 127,
156-164

112
60. Heitman, J., Movva, N. R., and Hall, M. N. (1991) Targets for cell cycle arrest by
the immunosuppressant rapamycin in yeast. Science 253, 905-909
61. Parsons, A. B., Lopez, A., Givoni, I. E., Williams, D. E., Gray, C. A., Porter, J.,
Chua, G., Sopko, R., Brost, R. L., Ho, C. H., Wang, J., Ketela, T., Brenner, C.,
Brill, J. A., Fernandez, G. E., Lorenz, T. C., Payne, G. S., Ishihara, S., Ohya, Y.,
Andrews, B., Hughes, T. R., Frey, B. J., Graham, T. R., Andersen, R. J., and
Boone, C. (2006) Exploring the mode-of-action of bioactive compounds by
chemical-genetic profiling in yeast. Cell 126, 611-625
62. Hanson, P. K., Malone, L., Birchmore, J. L., and Nichols, J. W. (2003) Lem3p is
essential for the uptake and potency of alkylphosphocholine drugs, edelfosine and
miltefosine. The Journal of Biological Chemistry 278, 36041-36050
63. Zaremberg, V., Gajate, C., Cacharro, L. M., Mollinedo, F., and McMaster, C. R.
(2005) Cytotoxicity of an anti-cancer lysophospholipid through selective
modification of lipid raft composition. The Journal of Biological Chemistry 280,
38047-38058
64. Bitew, T., Sveen, C. E., Heyne, B., and Zaremberg, V. (2010) Vitamin E prevents
lipid raft modifications induced by an anti-cancer lysophospholipid and abolishes
a Yap1-mediated stress response in yeast. The Journal of Biological Chemistry
285, 25731-25742
65. Patti, G. J., Yanes, O., and Siuzdak, G. (2012) Metabolomics: the apogee of the
omics trilogy. Nature reviews. Molecular Cell Biology 13, 263-269
66. Dettmer, K., Aronov, P. A., and Hammock, B. D. (2007) Mass spectrometry-
based metabolomics. Mass Spectrometry Reviews 26, 51-78

113
67. Wilcoxen, K. M., Uehara, T., Myint, K. T., Sato, Y., and Oda, Y. (2010) Practical
metabolomics in drug discovery. Expert Opinion in Drug Discovery 5, 249-263
68. Fiehn, O. (2008) Extending the breadth of metabolite profiling by gas
chromatography coupled to mass spectrometry. Trends in Analytical Chemistry
27, 261-269
69. Theodoridis, G., Gika, H. G., and Wilson, I. D. (2008) LC-MS-based
methodology for global metabolite profiling in metabonomics/metabolomics.
Trends in Analytical Chemistry 27, 251-260
70. Beckonert, O., Keun, H. C., Ebbels, T. M., Bundy, J., Holmes, E., Lindon, J. C.,
and Nicholson, J. K. (2007) Metabolic profiling, metabolomic and metabonomic
procedures for NMR spectroscopy of urine, plasma, serum and tissue extracts.
Nature Protocols 2, 2692-2703
71. Broeckling, C. D., Reddy, I. R., Duran, A. L., Zhao, X., and Sumner, L. W.
(2006) MET-IDEA: Data Extraction Tool for Mass Spectrometry-Based
Metabolomics. Analytical Chemistry 78, 4334-4341
72. Hiller, K., Hangebrauk, J., Christian, J., Spura, J., Schreiber, K., and Schomburg,
D. (2009) MetaboliteDetector: Comprehensive Analysis Tool for Targeted and
Nontargeted GC/MS Based Metabolome Analysis. Analytical Chemistry 81,
3429-3439
73. Smith, C. A., Want, E. J., O'Maille, G., Abagyan, R., and Siuzdak, G. (2006)
XCMS: Processing Mass Spectrometry Data for Metabolite Profiling Using
Nonlinear Peak Alignment, Matching, and Identification. Analytical Chemistry
78, 779-787
114
74. Xia, J., Mandal, R., Sinelnikov, I. V., Broadhurst, D., and Wishart, D. S. (2012)
MetaboAnalyst 2.0--a comprehensive server for metabolomic data analysis.
Nucleic Acids Research 40, W127-133
75. Booth, S. C., Weljie, A., and Turner, R. J. (2013) Computational Tools for the
Secondary Analysis of Metabolomics Experiments. Computational and Structural
Biotechnology Journal 4
76. Bou Khalil, M., Hou, W., Zhou, H., Elisma, F., Swayne, L. A., Blanchard, A. P.,
Yao, Z., Bennett, S. A., and Figeys, D. (2010) Lipidomics era: accomplishments
and challenges. Mass Spectrometry Reviews 29, 877-929
77. Roberts, L. D., McCombie, G., Titman, C. M., and Griffin, J. L. (2008) A matter
of fat: an introduction to lipidomic profiling methods. Journal of
Chromatography. B 871, 174-181
78. Wenk, M. R. (2010) Lipidomics: new tools and applications. Cell 143, 888-895
79. Blanksby, S. J., and Mitchell, T. W. (2010) Advances in mass spectrometry for
lipidomics. Annual Review of Analytical Chemistry 3, 433-465
80. Ejsing, C. S., Sampaio, J. L., Surendranath, V., Duchoslav, E., Ekroos, K.,
Klemm, R. W., Simons, K., and Shevchenko, A. (2009) Global analysis of the
yeast lipidome by quantitative shotgun mass spectrometry. Proceedings of the
National Academy of Sciences of the United States of America 106, 2136-2141
81. Umetrics. (2008) Multivariate Data Analysis for Omics. (Wiklund, S. ed.,
Umetrics, Umea Sweden
82. Booth, S. C., Workentine, M. L., Wen, J., Shaykhutdinov, R., Vogel, H. J., Ceri,
H., Turner, R. J., and Weljie, A. M. (2011) Differences in metabolism between

115
the biofilm and planktonic response to metal stress. Journal of Proteome
Research 10, 3190-3199
83. McCombie, G., Medina-Gomez, G., Lelliott, C. J., Vidal-Puig, A., and Griffin, J.
L. (2012) Metabolomic and Lipidomic Analysis of the Heart of Peroxisome
Proliferator-Activated Receptor-γ Coactivator 1-β Knock Out Mice on a High Fat
Diet. Metabolites 2, 366-381
84. Piotto, M., Moussallieh, F. M., Dillmann, B., Imperiale, A., Neuville, A., Brigand,
C., Bellocq, J. P., Elbayed, K., and Namer, I. J. (2008) Metabolic characterization
of primary human colorectal cancers using high resolution magic angle spinning
1H magnetic resonance spectroscopy. Metabolomics 5, 292-301
85. Jia, L., Chen, J., Yin, P., Lu, X., and Xu, G. (2008) Serum metabonomics study of
chronic renal failure by ultra performance liquid chromatography coupled with Q-
TOF mass spectrometry. Metabolomics 4, 183-189
86. Shearer, J., Duggan, G., Weljie, A., Hittel, D. S., Wasserman, D. H., and Vogel,
H. J. (2008) Metabolomic profiling of dietary-induced insulin resistance in the
high fat-fed C57BL/6J mouse. Diabetes, Obesity & Metabolism 10, 950-958
87. Tremaroli, V., Workentine, M. L., Weljie, A. M., Vogel, H. J., Ceri, H., Viti, C.,
Tatti, E., Zhang, P., Hynes, A. P., Turner, R. J., and Zannoni, D. (2009)
Metabolomic investigation of the bacterial response to a metal challenge. Applied
and Environmental Microbiology 75, 719-728
88. Bogdanov, M., Matson, W. R., Wang, L., Matson, T., Saunders-Pullman, R.,
Bressman, S. S., and Flint Beal, M. (2008) Metabolomic profiling to develop
blood biomarkers for Parkinson's disease. Brain 131, 389-396

116
89. Li, N., Liu, J. Y., Qiu, H., Harris, T. R., Sirish, P., Hammock, B. D., and
Chiamvimonvat, N. (2011) Use of metabolomic profiling in the study of
arachidonic acid metabolism in cardiovascular disease. Congestive Heart Failure
17, 42-46
90. Le Belle, J. E., Harris, N. G., Williams, S. R., and Bhakoo, K. K. (2002) A
comparison of cell and tissue extraction techniques using high-resolution 1H-
NMR spectroscopy. NMR in Biomedicine 15, 37-44
91. Lin, C. Y., Wu, H., Tjeerdema, R. S., and Viant, M. R. (2007) Evaluation of
metabolite extraction strategies from tissue samples using NMR metabolomics.
Metabolomics 3, 55-67
92. A, J., Trygg, J., Gullberg, J., Johansson, A. I., Jonsson, P., Antii, H., Marklund, S.
L., and Moritz, T. (2005) Extraction and GC/MS Analysis of the Human Blood
Plasma Metabolome. Analytical Chemistry 77, 8086-8094
93. Winder, C. L., Dunn, W. B., Schuler, S., Broadhurst, D., Jarvis, R., Stephens, G.
M., and Goodacre, R. (2008) Global Metabolite Profiling of Escherichia coli
Cultures: an Evaluation of Methods for Quenching and Extraction of Intracellular
Metabolites. Analytical Chemistry 80, 2939-2948
94. Sellick, C. A., Knight, D., Croxford, A. S., Maqsood, A. R., Stephens, G. M.,
Goodacre, R., and Dickson, A. J. (2010) Evaluation of extraction processes for
intracellular metabolite profiling of mammalian cells: matching extraction
approaches to cell type and metabolite targets. Metabolomics 6, 427-438
95. Dettmer, K., Nurnberger, N., Kaspar, H., Gruber, M. A., Almstetter, M. F., and
Oefner, P. J. (2011) Metabolite extraction from adherently growing mammalian
117
cells for metabolomics studies: optimization of harvesting and extraction
protocols. Analytical and Bioanalytical Chemistry 399, 1127-1139
96. Castrillo, J. I., Hayes, A., Mohammed, S., Gaskell, S. J., and Oliver, S. G. (2003)
An optimized protocol for metabolome analysis in yeast using direct infusion
electrospray mass spectrometry. Phytochemistry 62, 929-937
97. Want, E. J., O'Maille, G., Smith, C. A., Brandon, T. R., Uritboonthai, W., Qin, C.,
Trauger, S. A., and Siuzdak, G. (2006) Solven-Dependent Metabolite
Distribution, Clustering and Protein Extraction for Serum Profiling with Mass
Spectrometry. Analytical Chemistry 78, 743-752
98. Masson, P., Alves, A. C., Ebbels, T. M. D., Nicholson, J. K., and Want, E. J.
(2010) Optimization and Evaluation of Metabolite Extraction Protocols for
Untargeted Metabolic Profiling of Liver Samples by UPLC-MS. Analytical
Chemistry 82, 7779-7786
99. Buscher, J. M., Czernik, D., Ewald, J. C., Sauer, U., and Zamboni, N. (2009)
Cross-Platform Comparison of Methods for Quantitative Metabolomics of
Primary Metabolism. Analytical Chemistry 81, 2135-2143
100. Geier, F. M., Want, E. J., Leroi, A. M., and Bundy, J. G. (2011) Cross-platform
comparison of Caenorhabditis elegans tissue extraction strategies for
comprehensive metabolome coverage. Analytical Chemistry 83, 3730-3736
101. Villas-Boas, S. G., Hojer-Pedersen, J., Akesson, M., Smedsgaard, J., and Nielsen,
J. (2005) Global metabolite analysis of yeast: evaluation of sample preparation
methods. Yeast 22, 1155-1169

118
102. Canelas, A. B., ten Pierick, A., Ras, C., Seifar, R. M., van Dam, J. C., van Gulik,
W. M., and Heijnen, J. J. (2009) Quantitative Evaluation of Intracellular
Metabolite Extraction Techniques for Yeast Metabolomics. Analytical Chemistry
81, 7379-7389
103. Cequier-Sanchez, E., Rodriguez, C., Ravelo, A. G., and Zarate, R. (2008)
Dichloromethane as a Solvent for Lipid Extraction and Assessment of Lipid
Classes and Fatty Acids from Samples of Different Natures. Journal of
Agriculture and Food Chemistry 56, 4297-4303
104. Matyash, V., Liebisch, G., Kurzchalia, T. V., Shevchenko, A., and Schwudke, D.
(2008) Lipid extraction by methyl-tert-butyl ether for high-throughput lipidomics.
Journal of Lipid Research 49, 1137-1146
105. Gomez-Brandon, M., Lores, M., and Dominguez, J. (2008) Comparison of
extraction and derivatization methods for fatty acid analysis in solid
environmental matrixes. Analytical and Bioanalytical Chemistry 392, 505-514
106. Guan, X. L., Riezman, I., Wenk, M. R., and Riezman, H. (2010) Yeast Lipid
Analysis and Quantification by Mass Spectrometry. Methods in Enzymology 470,
369-391
107. Nygren, H., Seppanen-Laakso, T., Castillo, S., Hyotylainen, T., and Oresic, M.
(2011) Liquid chromatography-mass spectrometry (LC-MS)-based lipidomics for
studies of body fluids and tissues. Methods in Molecular Biology 708, 247-257
108. Folch, J., Lees, M., and Stanley, G. H. S. (1957) A Simple Method for the
Isolation and Purification of Total Lipides from Animal Tissues. Journal of
Biological Chemistry 226, 497-509

119
109. Bligh, E. G., and Dyer, W. J. (1959) A Rapid Method of Total Lipid Extraction
and Purification. Canadian Journal of Biochemistry and Physiology 37, 911-917
110. Riekhof, W. R., and Voelker, D. R. (2009) The yeast plasma membrane P4-
ATPases are major transporters for lysophospholipids. Biochimica et Biophysica
Acta 1791, 620-627
111. Wishart, D. S. (2008) Applications of metabolomics in drug discovery and
development. Drugs in R&D 9, 307-322
112. Bando, K., Kunimatsu, T., Sakai, J., Kimura, J., Funabashi, H., Seki, T., Bamba,
T., and Fukusaki, E. (2011) GC-MS-based metabolomics reveals mechanism of
action for hydrazine induced hepatotoxicity in rats. Journal of Applied
Toxicology 31, 524-535
113. Vulimiri, S. V., Berger, A., and Sonowane, B. (2011) The potential of
metabolomic approaches for investigation mod(s) of action of xenobiotics: Case
study carbon tetrachloride. Mutation Research/ Genetic Toxicology
Environmetnal Mutagenesis 722, 147-153
114. Xia, J. M., and Yuan, Y. J. (2009) Comparative Lipidomics of Four Strains of
Saccharomyces cerevisiae Reveials Different Responses to Furfural, Phenol, and
Acetic Acid. Journal of Agriculture and Food Chemistry 57, 99-108
115. Nielsen, J. (2009) Systems biology of lipid metabolism: from yeast to human.
FEBS letters 583, 3905-3913
116. Cuesta-Marban, A., Botet, J., Czyz, O., Cacharro, L. M., Gajate, C., Hornillos, V.,
Delgado, J., Zhang, H., Amat-Guerri, F., Acuna, A. U., McMaster, C. R.,
Revuelta, J. L., Zaremberg, V., and Mollinedo, F. (2013) Drug uptake, lipid rafts,

120
and vesicle trafficking modulate resistance to an anticancer
lysophosphatidylcholine analogue in yeast. The Journal of Biological Chemistry
288, 8405-8418
117. Czyz, O., Bitew, T., Cuesta-Marban, A., McMaster, C. R., Mollinedo, F., and
Zaremberg, V. (2013) Alteration of plasma membrane organization by an
anticancer lysophosphatidylcholine analogue induces intracellular acidification
and internalization of plasma membrane transporters in yeast. The Journal of
Biological Chemistry 288, 8419-8432
118. Booth, S. C., George, I. F., Zannoni, D., Cappelletti, M., Duggan, G. E., Ceri, H.,
and Turner, R. J. (2013) Effect of aluminium and copper on biofilm development
of Pseudomonas pseudoalcaligenes KF707 and P. fluorescens as a function of
different media compositions. Metallomics 5, 723-735
119. Weljie, A. M., Bondareva, A., Zang, P., and Jirik, F. R. (2011) (1)H NMR
metabolomics identification of markers of hypoxia-induced metabolic shifts in a
breast cancer model system. Journal of Biomolecular NMR 49, 185-193
120. Liao, W., Tan, G., Zhu, Z., Chen, Q., Lou, Z., Dong, X., Zhang, W., Pan, W., and
Chai, Y. (2012) Combined metabonomic and quantitative real-time PCR analyses
reveal systems metabolic changes in Jurkat T-cells treated with HIV-1 Tat
protein. Journal of Proteome Research 11, 5109-5123
121. Jeennor, S., Laoteng, K., Tanticharoen, M., and Cheevadhanarak, S. (2006)
Comparative fatty acid profiling of Mucor rouxii under different stress conditions.
FEMS Microbiology Letters 259, 60-66

121
122. Ellis, R. J., Neish, B., Trett, M. W., Best, J. G., Weightman, A. J., Morgan, P., and
Fry, J. C. (2001) Comparison of microbial and meiofaunal community analyses
for determining impact of heavy metabl contamination. Journal of
Microbiological Methods 45, 171-185
123. Nishimura, A., Kotani, T., Sasano, Y., and Takagi, H. (2010) An antioxidative
mechanism mediated by the yeast N-acetyltransferase Mpr1: oxidative stress-
induced arginine synthesis and its physiological role. FEMS Yeast Research 10,
687-698
124. Wagner, B. A., Buettner, G. R., Oberley, L. W., and Burns, P. C. (1998)
Sensitivity of K562 and HL-60 Cells to Edelfosine, an Ether Lipid Drug,
Correlates with production of reactive oxygen species. Cancer Research 58,
2809-2816
125. Chen, J., Wang, W., Lv, S., Yin, P., Zhao, X., Lu, X., Zhang, F., and Xu, G.
(2009) Metabonomics study of liver cancer based on ultra performance liquid
chromatography coupled to mass spectrometry with HILIC and RPLC
separations. Analytica Chimica Acta 650, 3-9
126. DeBerardinis, R. J., and Cheng, T. (2010) Q's next: the diverse functions of
glutamine in metabolism, cell biology and cancer. Oncogene 29, 313-324
127. Wise, D. R., and Thompson, C. B. (2010) Glutamine addiction: a new therapeutic
target in cancer. Trends in Biochemical Sciences 35, 427-433
128. Burgess, D. J. (2013) Metabolism: Glutamine connections. Nature Reviews.
Cancer 13, 293

122
129. Darmaun, D., Manary, M. J., and Matthews, D. E. (1985) A Method for
Measuring Both Glutamine and Glutamate Levels and Stable Isotopic
Enrichments. Analytical Biochemistry 147, 92-102
130. Gibellini, L., Pinti, M., Nasi, M., De Biasi, S., Roat, E., Bertoncelli, L., and
Cossarizza, A. (2010) Interfering with ROS Metabolism in Cancer Cells: The
Potential Role of Quercetin. Cancers 2, 1288-1311
131. Yang, P., Ebbert, J. O., Sun, Z., and Weinshilboum, R. M. (2006) Role of the
glutathione metabolic pathway in lung cancer treatment and prognosis: a review.
Journal of Clinical Oncology 24, 1761-1769
132. Henry, S. A., Kohlwein, S. D., and Carman, G. M. (2012) Metabolism and
regulation of glycerolipids in the yeast Saccharomyces cerevisiae. Genetics 190,
317-349
133. Villa-Garcia, M. J., Choi, M. S., Hinz, F. I., Gaspar, M. L., Jesch, S. A., and
Henry, S. A. (2011) Genome-wide screen for inositol auxotrophy in
Saccharomyces cerevisiae implicates lipid metabolism in stress response
signaling. Molecular Genetics and Genomics 285, 125-149
134. Lindberg, L., Santos, A. X. S., Riezman, H., Olsson, L., and Bettiga, M. (2013)
Lipidomic Profiling of Saccharomyces cerevisiae and Zygosaccharomyces bailii
Reveals Critical Changes in Lipid Composition in Response to Acetic Acid
Stress. PloS one 8, e73936 doi:73910.71371/journal.pone.0073936
135. Lu, N., Wei, D., Chen, F., and Yang, S.-T. (2012) Lipidomic profiling and
discovery of lipid biomarkers in snow alga Chlamydomonas nivalis under salt
stress. European Journal of Lipid Science and Technology 114, 253-265

123
136. Tautenhahn, R., Patti, G. J., Rinehart, D., and Siuzdak, G. (2012) XCMS Online:
a web-based platform to process untargeted metabolomic data. Analytical
Chemistry 84, 5035-5039
137. Pluskal, T., Castillo, S., Villar-Briones, A., and Oresic, M. (2010) MZmine 2:
modular framework for processing, visualizing, and analyzing mass spectrometry-
based molecular profile data. BMC bioinformatics 11, 395
138. Schutze, S., Machleidt, T., and Kronke, M. (1994) The role of diacylglycerol and
ceramide in tumor necrosis factor and interleukin-1 signal transduction. Journal
of Leukocyte Biology 56, 533-541
139. Montefusco, D. J., Chen, L., Matmati, N., Lu, S., Newcomb, B., Cooper, G. F.,
Hannun, Y. A., and Lu, X. (2013) Distinct signaling roles of ceramide species in
yeast revealed through systematic perturbation and systems biology analyses.
Science Signaling 6, rs14
140. Jenkins, G. M. (1997) Involvement of Yeast Sphingolipids in the Heat Stress
Response of Saccharomyces cerevisiae. Journal of Biological Chemistry 272,
32566-32572
141. Nickels, J. T., and Broach, J. R. (1996) A ceramide-activated protein phosphatase
mediates ceramide-induced G1 arrest of Saccharomyces cerevisiae. Genes &
Development 10, 382-394
142. Carmona-Gutierrez, D., Reisenbichler, A., Heimbucher, P., Bauer, M. A., Braun,
R. J., Ruckenstuhl, C., Buttner, S., Eisenberg, T., Rockenfeller, P., Frohlich, K.
U., Kroemer, G., and Madeo, F. (2011) Ceramide triggers metacaspase-
independent mitochondrial cell death in yeast. Cell Cycle 10, 3973-3978

124
143. Rahmani, M., Reese, E., Dai, Y., Bauer, C., Payne, S. G., Dent, P., Spiegel, S.,
and Grant, S. (2005) Coadministration of Histone Deacetylase Inhibitors and
Perifosine Synergistically Induces Apoptosis in Human Leukemia Cells through
Akt and Erk1/2 Inactivation and the Generation of Ceramide and Reactive
Oxygen Species. Cancer Reseach 65, 2422-2432
144. Boumann, H. A., Gubbens, J., Koorengevel, M. C., Oh, C. S., Martin, C. E.,
Heck, A. J., Patton-Vogt, J., Henry, S. A., de Kruijff, B., and de Kroon, A. I.
(2006) Depletion of phosphatidylcholine in yeast induces shortening and
increased saturation of the lipid acyl chains: evidence for regulation of intrinsic
membrane curvature in a eukaryote. Molecular Biology of the Cell 17, 1006-1017
145. de Kroon, A. I., Rijken, P. J., and De Smet, C. H. (2013) Checks and balances in
membrane phospholipid class and acyl chain homeostasis, the yeast perspective.
Progress in Lipid Research 52, 374-394
146. Oelkers, P., Cromley, D., Padamsee, M., Billheimer, J. T., and Sturley, S. L.
(2002) The DGA1 gene determines a second triglyceride synthetic pathway in
yeast. The Journal of biological chemistry 277, 8877-8881
147. Oelkers, P., Tinkelenberg, A., Erdeniz, N., Cromley, D., Billheimer, J. T., and
Sturley, S. L. (2000) A lecithin cholesterol acyltransferase-like gene mediates
diacylglycerol esterification in yeast. The Journal of Biological Chemistry 275,
15609-15612
148. Chang, S. C. (1998) The PEL1 Gene (Renamed PGS1) Encodes the
Phosphatidylglycero-phosphate Synthase of Saccharomyces cerevisiae. The
Journal of Biological Chemistry 273, 9829-9836

125
149. Osman, C., Haag, M., Wieland, F. T., Brugger, B., and Langer, T. (2010) A
mitochondrial phosphatase required for cardiolipin biosynthesis: the PGP
phosphatase Gep4. The EMBO journal 29, 1976-1987
150. Lei, Z., Huhman, D. V., and Sumner, L. W. (2011) Mass spectrometry strategies
in metabolomics. The Journal of Biological Chemistry 286, 25435-25442


![Systems Metabolomic Lecture[1]](https://img.pdfslide.us/doc/110x75/546af5e0b4af9f486b8b45b1/systems-metabolomic-lecture1.jpg)