Embed Size (px)
Citation preview

1
Sabre highlights bookings improvement, commercial activity and new
innovations with Google; reports third quarter 2020 results
Third quarter 2020 business overview:
• Bookings growth steadily improved from the previous quarter. Sabre bookings
growth exceeded industry and improved by 19 percentage points versus prior
quarter, in spite of the COVID-19 pandemic
• IT Solutions revenue exceeded Distribution revenue for the second consecutive
quarter, demonstrating the benefits of diversified revenue streams
• Hospitality bookings continued to lead the travel industry's improvement
• Signed a significant number of new commercial wins and renewals, including
renewal with company's largest customer
• Announced Sabre and Google are developing industry's first Artificial Intelligence
(AI)-driven technology platform and smart retailing engine
• Extended liquidity runway and pushed out material debt maturities
Third quarter 2020 summary:
• Third quarter revenue totaled $278 million
• Net loss attributable to common stockholders of $312 million and net loss
attributable to common stockholders per share of $1.07
• Adjusted EPS totaled ($0.82)
• All metrics were negatively impacted by the COVID-19 pandemic, partially offset by
variable cost relief and implementation of cost saving actions
SOUTHLAKE, Texas – November 6, 2020 – Sabre Corporation ("Sabre" or the "Company")
(NASDAQ: SABR) today announced financial results for the quarter ended September 30, 2020.
"In this historically low demand environment due to the COVID-19 pandemic, airlines and hoteliers
are turning to Sabre for established, robust IT solutions to help fill seats and distribute their
inventory. We continue to win new business and lock in long-term commitments with some of our
largest customers and have signed 1,400 individual airline and agency deals year-to-date," said
Sean Menke, President and CEO.

2
"In the third quarter, we saw positive signs as GDS and hospitality bookings steadily improved,
along with passengers boarded. We also recently announced two major advancements achieved
as part of Sabre and Google's Innovation Framework. Leveraging Google's state-of-the-art AI
technology and advanced machine-learning capabilities, we intend to bring to market Sabre
Travel AI TM, the industry's first AI-driven technology platform, and Sabre Smart retail engine, the
industry's first real-time, personalized merchandising engine.
"We firmly believe there is pent up demand for travel and that this is reflected in the relatively
higher growth rates of regions with fewer restrictions. We also believe our technology
transformation initiatives position us for accelerated commercial wins and increased profitability
on the other side of the COVID-19 pandemic."
Q3 2020 Financial Summary
Sabre consolidated third quarter revenue totaled $278 million, compared to $1 billion in the third
quarter of 2019. The decline in revenue was driven by unprecedented reductions in global air,
hotel and other travel bookings due to the COVID-19 pandemic.
Operating loss was $233 million, versus operating income of $113 million in the third quarter of
2019. The decline in operating results in the quarter was primarily due to the significant decline in
revenue driven by the COVID-19 pandemic and an unfavorable comparison to a $32 million
benefit in the prior year quarter related to the reversal of a previous accrual for a US Airways legal
matter. These impacts were partially offset by a decline in Travel Solutions incentive expenses,
reduced headcount-related expenses resulting from implementation of cost saving actions and a
decline in technology costs due to lower transaction volumes.
Net loss attributable to common stockholders totaled $312 million, versus net income of $64
million in the third quarter of 2019. Diluted net loss attributable to common stockholders per share
totaled $1.07, versus diluted net income attributable to common stockholders per share of $0.23
in the third quarter of 2019. The change in net income attributable to common stockholders was
driven by the items impacting operating loss described above, increased interest expense, a $14
million pension plan charge and a $10 million loss on extinguishment of debt, partially offset by a
reduction in taxes.
Adjusted Operating Loss was $197 million, versus $133 million Adjusted Operating Income in the
third quarter of 2019. The decline in operating results in the quarter was primarily due to the
significant decline in revenue driven by the COVID-19 pandemic, partially offset by a decline in
Travel Solutions incentive expenses, reduced headcount-related expenses resulting from

3
implementation of cost saving actions and a decline in technology costs due to lower transaction
volumes.
For the quarter, Sabre reported Adjusted EPS of ($0.82), versus $0.27 in the third quarter of 2019.
With regards to Sabre's third quarter 2020 cash flows (versus prior year):
• Cash used in operating activities totaled $192 million (vs. $167 million provided by)
• Cash used in investing activities totaled $9 million (vs. $32 million)
• Cash provided by financing activities totaled $566 million (vs. $58 million used in)
• Capitalized expenditures totaled $9 million (vs. $25 million)
Free Cash Flow in the third quarter was negative $201 million, versus Free Cash Flow generation
of $142 million in the third quarter of 2019.

4
Financial Highlights (in thousands, except for EPS; unaudited):
Three Months Ended September 30, Nine Months Ended September 30,
2020 2019 %
Change 2020 2019 %
Change Total Company: Revenue $ 278,365 $ 984,199 (72) $ 1,020,386 $ 3,033,566 (66) Operating (loss) income $ (233,049) $ 113,460 (305) $ (768,530) $ 305,780 (351) Net (loss) income attributable to common stockholders $ (312,449) $ 63,813 (590) $ (969,260) $ 148,501 (753) Diluted net (loss) income attributable to common stockholders per share (EPS) $ (1.07) $ 0.23 (565) $ (3.45) $ 0.54 (739) Adjusted Gross Profit* $ 192,832 $ 596,626 (68) $ 672,057 $ 1,807,134 (63) Adjusted EBITDA* $ (104,370) $ 241,564 (143) $ (290,255) $ 739,548 (139) Adjusted EBITDA Margin* NM 24.5 % NM 24.4 % Adjusted Operating (Loss) Income* $ (196,693) $ 133,074 (248) $ (576,372) $ 415,789 (239) Adjusted Net (Loss) Income* $ (240,347) $ 73,565 (427) $ (678,326) $ 235,218 (388) Adjusted EPS* $ (0.82) $ 0.27 (404) $ (2.42) $ 0.85 (385) Cash (used in) provided by operating activities $ (192,033) $ 166,704 (215) $ (587,069) $ 424,365 (238) Cash used in investing activities $ (8,888) $ (32,319) (72) $ (52,634) $ (108,482) (51) Cash provided by (used in) financing activities $ 565,611 $ (58,449) NM $ 1,873,804 $ (351,424) NM Capitalized expenditures $ 8,926 $ 24,928 (64) $ 48,259 $ 92,124 (48) Free Cash Flow* $ (200,959) $ 141,776 (242) $ (635,328) $ 332,241 (291) Net Debt (total debt, less cash) $ 3,140,861 $ 2,910,713 Net Debt / LTM Adjusted EBITDA* NM 2.9 x Travel Solutions: Revenue $ 237,018 $ 919,031 (74) $ 900,868 $ 2,842,391 (68) Operating (Loss) Income $ (145,877) $ 182,555 (180) $ (406,939) $ 572,662 (171) Adjusted Operating (Loss) Income* $ (146,337) $ 183,582 (180) $ (408,584) $ 574,635 (171) Distribution Revenue $ 104,594 $ 673,405 (84) $ 451,183 $ 2,092,362 (78) Total Bookings 19,920 140,913 (86) 98,371 437,975 (78) Air Bookings 16,539 123,586 (87) 80,439 386,752 (79) Lodging, Ground and Sea Bookings 3,381 17,327 (80) 17,932 51,223 (65) Bookings Share 43.3 % 39.6 % 42.3 % 38.8 % IT Solutions Revenue $ 132,424 $ 245,626 (46) $ 449,685 $ 750,029 (40) Passengers Boarded 56,970 187,373 (70) 244,144 553,936 (56) Hospitality Solutions: Revenue $ 44,924 $ 74,818 (40) $ 133,163 $ 221,525 (40) Operating Loss $ (12,609) $ (4,008) 215 $ (48,475) $ (15,471) 213 Adjusted Operating Loss* $ (12,609) $ (4,008) 215 $ (48,475) $ (15,471) 213 Central Reservation System Transactions 19,268 30,462 (37) 51,381 82,376 (38)
*Indicates non-GAAP financial measure; see descriptions and reconciliations below
5
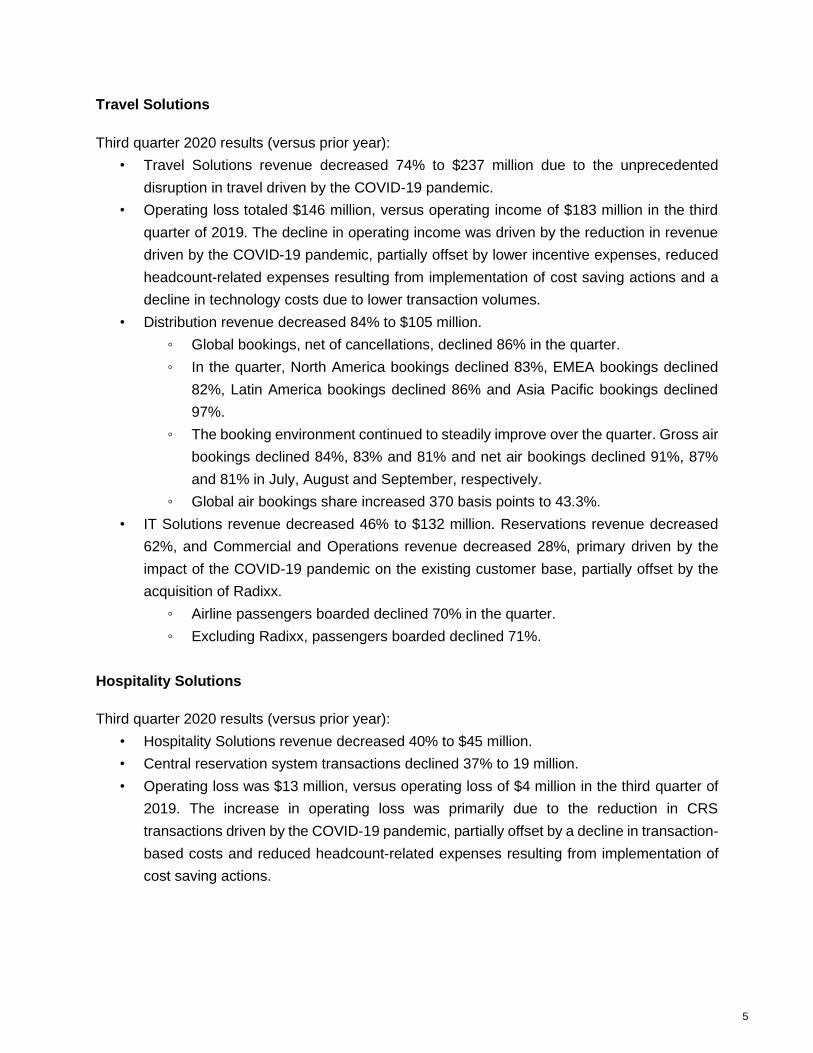
Travel Solutions
Third quarter 2020 results (versus prior year):
• Travel Solutions revenue decreased 74% to $237 million due to the unprecedented
disruption in travel driven by the COVID-19 pandemic.
• Operating loss totaled $146 million, versus operating income of $183 million in the third
quarter of 2019. The decline in operating income was driven by the reduction in revenue
driven by the COVID-19 pandemic, partially offset by lower incentive expenses, reduced
headcount-related expenses resulting from implementation of cost saving actions and a
decline in technology costs due to lower transaction volumes.
• Distribution revenue decreased 84% to $105 million.
◦ Global bookings, net of cancellations, declined 86% in the quarter.
◦ In the quarter, North America bookings declined 83%, EMEA bookings declined
82%, Latin America bookings declined 86% and Asia Pacific bookings declined
97%.
◦ The booking environment continued to steadily improve over the quarter. Gross air
bookings declined 84%, 83% and 81% and net air bookings declined 91%, 87%
and 81% in July, August and September, respectively.
◦ Global air bookings share increased 370 basis points to 43.3%.
• IT Solutions revenue decreased 46% to $132 million. Reservations revenue decreased
62%, and Commercial and Operations revenue decreased 28%, primary driven by the
impact of the COVID-19 pandemic on the existing customer base, partially offset by the
acquisition of Radixx.
◦ Airline passengers boarded declined 70% in the quarter.
◦ Excluding Radixx, passengers boarded declined 71%.
Hospitality Solutions
Third quarter 2020 results (versus prior year):
• Hospitality Solutions revenue decreased 40% to $45 million.
• Central reservation system transactions declined 37% to 19 million.
• Operating loss was $13 million, versus operating loss of $4 million in the third quarter of
2019. The increase in operating loss was primarily due to the reduction in CRS
transactions driven by the COVID-19 pandemic, partially offset by a decline in transaction-
based costs and reduced headcount-related expenses resulting from implementation of
cost saving actions.

6
Business Outlook
"We took quick action to raise additional liquidity in case the COVID-19 pandemic persists longer
than expected, although we hope this isn't the case. Importantly, we also pushed out our material
debt maturities to 2023 and beyond to extend our solid liquidity runway. We continue to see signs
of steady improvement in bookings," said Doug Barnett, CFO.
"With $200 million annual costs removed from the business, we expect to operate at a more
profitable cost structure even after recovery from the COVID-19 pandemic. The completion of our
technology transformation, migration to Google Cloud Platform and recently renegotiated DXC
contract are expected to unlock an additional $75 million in annual cost savings starting in 2024.
"Please note we have implemented two changes to our financial reporting structure. First, as part
of our recent business realignment, we will now be reporting two segments: Travel Solutions and
Hospitality Solutions. For Travel Solutions, we expect to continue reporting Distribution revenue,
bookings, IT Solutions revenue and passengers boarded detail. Second, in an effort to provide
continued clarity on our technology spend, we are now presenting "Technology Costs" as a
separate line on our income statement. This has resulted in a change to our other operating
expense lines, Cost of Revenue and Selling, General & Administrative. We have disclosed
reclassified financials that reflect these changes."
Conference Call
Sabre will conduct its third quarter 2020 investor conference call today at 9:00 a.m. ET. The live
webcast and accompanying slide presentation can be accessed via the Investor Relations section
of our website, investors.sabre.com. A replay of the event will be available on the website for at
least 90 days following the event.
About Sabre
Sabre Corporation is a leading software and technology company that powers the global travel
industry, serving a wide range of travel companies including airlines, hoteliers, travel agencies
and other suppliers. The company provides retailing, distribution and fulfillment solutions that help
its customers operate more efficiently, drive revenue and offer personalized traveler experiences.
Through its leading travel marketplace, Sabre connects travel suppliers with buyers from around
the globe. Sabre’s technology platform manages more than $260B worth of global travel spend
annually. Headquartered in Southlake, Texas, USA, Sabre serves customers in more than 160
countries around the world. For more information visit www.sabre.com.

7
Website Information
We routinely post important information for investors on the Investor Relations section of our
website, investors.sabre.com, and intend to post important information for investors on our Twitter
account, @Sabre_Corp. We intend to use the Investor Relations section of our website and our
Twitter account as means of disclosing material, non-public information and for complying with
our disclosure obligations under Regulation FD. Accordingly, investors should monitor the
Investor Relations section of our website and our Twitter account, in addition to following our
press releases, SEC filings, public conference calls, presentations and webcasts. The information
contained on, or that may be accessed through, our website or our Twitter account is not
incorporated by reference into, and is not a part of, this document.
Supplemental Financial Information
In conjunction with today’s earnings report, a file of supplemental financial information will be
available on the Investor Relations section of our website, investors.sabre.com.
Industry Data
This release contains industry data, forecasts and other information that we obtained from
industry publications and surveys, public filings and internal company sources, and there can be
no assurance as to the accuracy or completeness of the included information. Statements as to
our ranking, market position, bookings share and market estimates are based on independent
industry publications, government publications, third-party forecasts and management’s
estimates and assumptions about our markets and our internal research. We have not
independently verified this third-party information nor have we ascertained the underlying
economic assumptions relied upon in those sources, and we cannot assure you of the accuracy
or completeness of this information.
Note on Non-GAAP Financial Measures
This press release includes unaudited non-GAAP financial measures, including Adjusted Gross
Profit (Loss), Adjusted Operating (Loss) Income, Adjusted Net (Loss) Income from continuing
operations ("Adjusted Net (Loss) Income"), Adjusted EBITDA, Adjusted Net (Loss) Income from
continuing operations per share ("Adjusted EPS"), Free Cash Flow, and the ratios based on these
financial measures.
8
We present non-GAAP measures when our management believes that the additional information
provides useful information about our operating performance. Non-GAAP financial measures do
not have any standardized meaning and are therefore unlikely to be comparable to similar
measures presented by other companies. The presentation of non-GAAP financial measures is
not intended to be a substitute for, and should not be considered in isolation from, the financial
measures reported in accordance with GAAP. See “Non-GAAP Financial Measures” below for an
explanation of the non-GAAP measures and “Tabular Reconciliations for Non-GAAP Measures”
below for a reconciliation of the non-GAAP financial measures to the comparable GAAP
measures.
Forward-Looking Statements
Certain statements herein are forward-looking statements about trends, future events,
uncertainties and our plans and expectations of what may happen in the future. Any statements
that are not historical or current facts are forward-looking statements. In many cases, you can
identify forward-looking statements by terms such as "expect," "believe," "guidance," "outlook,"
"hope," "estimate," "project," "anticipate," "will," "continue," "commit," "may,” “should,” “would,”
“intend," “potential,” "long-term," "growth," "results" or the negative of these terms or other
comparable terminology. Forward-looking statements involve known and unknown risks,
uncertainties and other factors that may cause Sabre’s actual results, performance or
achievements to be materially different from any future results, performances or achievements
expressed or implied by the forward-looking statements. The potential risks and uncertainties
include, among others, the severity, extent and duration of the global COVID-19 pandemic and
its impact on our business and results of operations, financial condition and credit ratings, as well
as on the travel industry and consumer spending more broadly, the actions taken to contain the
disease or treat its impact, the effect of remote working arrangements on our operations and the
speed and extent of the recovery across the broader travel ecosystem, dependency on
transaction volumes in the global travel industry, particularly air travel transaction volumes,
including from airlines' insolvency, suspension of service or aircraft groundings, the effect of cost
savings initiatives, the timing, implementation and effects of the technology investment and other
strategic initiatives, the completion and effects of travel platforms, travel suppliers' usage of
alternative distribution models, exposure to pricing pressure in the Travel Solutions business,
changes affecting travel supplier customers, maintenance of the integrity of our systems and
infrastructure and the effect of any security breaches, failure to adapt to technological
advancements, competition in the travel distribution market and solutions markets,
implementation of software solutions, reliance on third parties to provide information technology
services and the effects of these services, the execution, implementation and effects of new,
amended or renewed agreements and strategic partnerships, including anticipated savings,
9
dependence on establishing, maintaining and renewing contracts with customers and other
counterparties and collecting amounts due to us under these agreements, dependence on
relationships with travel buyers, our collection, processing, storage, use and transmission of
personal data and risks associated with PCI compliance, our ability to recruit, train and retain
employees, including our key executive officers and technical employees, the financial and
business results and effects of acquisitions, the effects of any litigation and regulatory reviews
and investigations, adverse global and regional economic and political conditions, including, but
not limited to, economic conditions in countries or regions with traditionally high levels of exports
to China or that have commodities-based economies and the effect of "Brexit" and uncertainty
due to related negotiations, risks arising from global operations, reliance on the value of our
brands, failure to comply with regulations, use of third-party distributor partners, the effects of the
implementation of new accounting standards, and tax-related matters, including the effect of the
Tax Cuts and Jobs Act. More information about potential risks and uncertainties that could affect
our business and results of operations is included in the "Risk Factors" and “Forward-Looking
Statements” sections in our Quarterly Report on Form 10-Q filed with the SEC on August 10,
2020, in our Annual Report on Form 10-K filed with the SEC on February 26, 2020 and in our
other filings with the SEC. Although we believe that the expectations reflected in the forward-
looking statements are reasonable, we cannot guarantee future events, outlook, guidance,
results, actions, levels of activity, performance or achievements. Readers are cautioned not to
place undue reliance on these forward-looking statements. Unless required by law, Sabre
undertakes no obligation to publicly update or revise any forward-looking statements to reflect
circumstances or events after the date they are made.
Contacts:
Media
Kristin Hays
Investors
Kevin Crissey

10
SABRE CORPORATION
CONSOLIDATED STATEMENTS OF OPERATIONS
(In thousands, except per share amounts)
(Unaudited)
Three Months Ended
September 30, Nine Months Ended
September 30, 2020 2019 2020 2019 Revenue $ 278,365 $ 984,199 $ 1,020,386 $ 3,033,566 Cost of revenue 115,426 419,385 458,068 1,320,720 Technology costs 276,362 322,563 883,837 964,397 Selling, general and administrative 119,626 128,791 447,011 442,669
Operating (loss) income (233,049) 113,460 (768,530) 305,780 Other income (expense):
Interest expense, net (67,651) (39,743) (163,674) (117,364) Loss on extinguishment of debt (10,333) — (10,333) — Equity method (loss) income (460) 1,027 (1,645) 1,973 Other, net (18,431) (1,769) (72,015) (6,118)
Total other expense, net (96,875) (40,485) (247,667) (121,509) (Loss) income from continuing operations before income taxes (329,924) 72,975 (1,016,197) 184,271 Provision for income taxes (20,364) 7,795 (53,336) 31,783 (Loss) income from continuing operations (309,560) 65,180 (962,861) 152,488 Loss from discontinued operations, net of tax (533) (596) (3,331) (698) Net (loss) income (310,093) 64,584 (966,192) 151,790 Net income attributable to noncontrolling interests 125 771 837 3,289 Net (loss) income attributable to Sabre Corporation (310,218) 63,813 (967,029) 148,501 Preferred stock dividends 2,231 — 2,231 — Net (loss) income attributable to common stockholders $ (312,449) $ 63,813 $ (969,260) $ 148,501
Basic net (loss) income per share attributable to common stockholders:
(Loss) income from continuing operations $ (1.07) $ 0.24 $ (3.44) $ 0.54 Loss from discontinued operations — — (0.01) — Net (loss) income per common share $ (1.07) $ 0.24 $ (3.45) $ 0.54
Diluted net (loss) income per share attributable to common stockholders:
(Loss) income from continuing operations $ (1.07) $ 0.23 $ (3.44) $ 0.54 Loss from discontinued operations — — (0.01) — Net (loss) income per common share $ (1.07) $ 0.23 $ (3.45) $ 0.54
Weighted-average common shares outstanding:
Basic 292,392 273,763 280,750 274,524 Diluted 292,392 276,235 280,750 276,474
Dividends per common share $ — $ 0.14 $ 0.14 $ 0.42

11
SABRE CORPORATION
CONSOLIDATED BALANCE SHEETS
(In thousands)
(Unaudited)
September 30, 2020 December 31, 2019
Assets Current assets
Cash and cash equivalents $ 1,668,352 $ 436,176 Accounts receivable, net of allowance for credit losses of $111,293 and $56,367 281,789 546,533 Prepaid expenses and other current assets 138,106 139,211
Total current assets 2,088,247 1,121,920 Property and equipment, net of accumulated depreciation of $1,998,856 and $1,815,844 488,214 641,722
Equity method investments 23,618 27,494 Goodwill 2,633,585 2,633,251 Acquired customer relationships, net of accumulated amortization of $754,893 and $735,367 294,524 311,015
Other intangible assets, net of accumulated amortization of $704,317 and $674,073 231,995 262,638 Deferred income taxes 41,531 21,812 Other assets, net 613,783 670,105
Total assets $ 6,415,497 $ 5,689,957
Liabilities and stockholders’ equity Current liabilities
Accounts payable $ 100,498 $ 187,187 Accrued compensation and related benefits 104,476 94,368 Accrued subscriber incentives 94,547 316,254 Deferred revenues 116,106 84,661 Other accrued liabilities 239,637 189,548 Current portion of debt 33,452 81,614 Tax Receivable Agreement — 71,911
Total current liabilities 688,716 1,025,543 Deferred income taxes 73,720 107,402 Other noncurrent liabilities 372,512 347,522 Long-term debt 4,639,125 3,261,821 Stockholders’ equity
Preferred stock, $0.01 par value, 225,000 authorized, 3,340 and no shares issued and outstanding as of September 30, 2020 and December 31, 2019, respectively; aggregate liquidation value of $334,000 and $— as of September 30, 2020 and December 31, 2019, respectively 33 —
Common Stock: $0.01 par value; 1,000,000 authorized shares; 338,499 and 294,319 shares issued, 317,233 and 273,733 shares outstanding at September 30, 2020 and December 31, 2019, respectively 3,385 2,943
Additional paid-in capital 3,027,726 2,317,544 Treasury Stock, at cost, 21,266 and 20,587 shares at September 30, 2020 and December 31, 2019, respectively (474,165) (468,618)
Retained deficit (1,778,877) (763,482) Accumulated other comprehensive loss (146,103) (149,306) Non-controlling interest 9,425 8,588
Total stockholders’ equity 641,424 947,669 Total liabilities and stockholders’ equity $ 6,415,497 $ 5,689,957
12
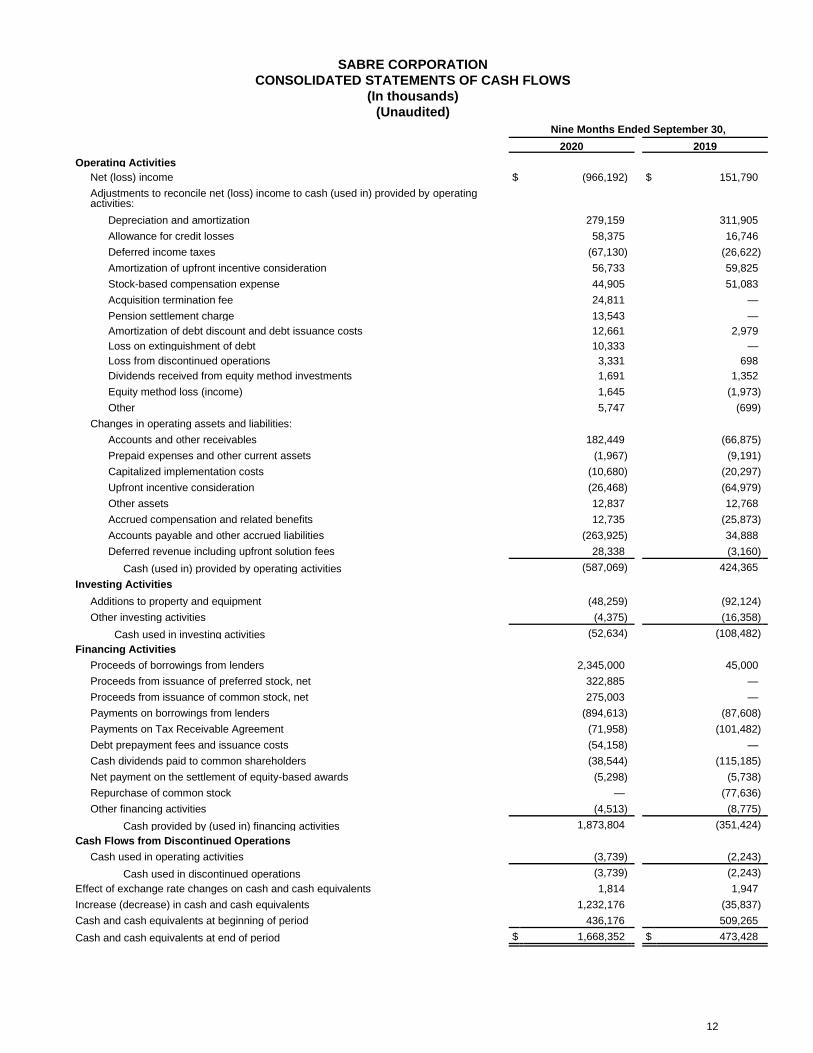
SABRE CORPORATION
CONSOLIDATED STATEMENTS OF CASH FLOWS
(In thousands)
(Unaudited)
Nine Months Ended September 30,
2020 2019 Operating Activities
Net (loss) income $ (966,192) $ 151,790 Adjustments to reconcile net (loss) income to cash (used in) provided by operating activities:
Depreciation and amortization 279,159 311,905 Allowance for credit losses 58,375 16,746 Deferred income taxes (67,130) (26,622) Amortization of upfront incentive consideration 56,733 59,825 Stock-based compensation expense 44,905 51,083 Acquisition termination fee 24,811 — Pension settlement charge 13,543 — Amortization of debt discount and debt issuance costs 12,661 2,979 Loss on extinguishment of debt 10,333 — Loss from discontinued operations 3,331 698 Dividends received from equity method investments 1,691 1,352 Equity method loss (income) 1,645 (1,973) Other 5,747 (699)
Changes in operating assets and liabilities: Accounts and other receivables 182,449 (66,875) Prepaid expenses and other current assets (1,967) (9,191) Capitalized implementation costs (10,680) (20,297) Upfront incentive consideration (26,468) (64,979) Other assets 12,837 12,768 Accrued compensation and related benefits 12,735 (25,873) Accounts payable and other accrued liabilities (263,925) 34,888 Deferred revenue including upfront solution fees 28,338 (3,160)
Cash (used in) provided by operating activities (587,069) 424,365 Investing Activities
Additions to property and equipment (48,259) (92,124) Other investing activities (4,375) (16,358)
Cash used in investing activities (52,634) (108,482) Financing Activities
Proceeds of borrowings from lenders 2,345,000 45,000 Proceeds from issuance of preferred stock, net 322,885 — Proceeds from issuance of common stock, net 275,003 — Payments on borrowings from lenders (894,613) (87,608) Payments on Tax Receivable Agreement (71,958) (101,482) Debt prepayment fees and issuance costs (54,158) — Cash dividends paid to common shareholders (38,544) (115,185) Net payment on the settlement of equity-based awards (5,298) (5,738) Repurchase of common stock — (77,636) Other financing activities (4,513) (8,775)
Cash provided by (used in) financing activities 1,873,804 (351,424) Cash Flows from Discontinued Operations
Cash used in operating activities (3,739) (2,243) Cash used in discontinued operations (3,739) (2,243)
Effect of exchange rate changes on cash and cash equivalents 1,814 1,947 Increase (decrease) in cash and cash equivalents 1,232,176 (35,837) Cash and cash equivalents at beginning of period 436,176 509,265 Cash and cash equivalents at end of period $ 1,668,352 $ 473,428

13
Tabular Reconciliations for Non-GAAP Measures
(In thousands, except per share amounts; unaudited)
Reconciliation of Net (Loss) Income attributable to common stockholders to Adjusted Net (Loss) Income,
Adjusted EPS, Adjusted EBITDA and Adjusted Operating (Loss) Income:
Three Months Ended
September 30, Nine Months Ended
September 30,
2020 2019 2020 2019
Net (loss) income attributable to common stockholders $ (312,449) $ 63,813 $ (969,260) $ 148,501 Loss from discontinued operations, net of tax 533 596 3,331 698 Net income attributable to non-controlling interests(1) 125 771 837 3,289 Preferred stock dividends 2,231 — 2,231 —
(Loss) income from continuing operations (309,560) 65,180 (962,861) 152,488 Adjustments:
Acquisition-related amortization(2a) 16,465 15,976 49,775 47,971 Restructuring and other costs(8) 947 — 74,229 — Loss on extinguishment of debt 10,333 — 10,333 — Other, net(4) 18,431 1,769 72,015 6,118 Acquisition-related costs(6) 591 9,696 22,791 30,337 Litigation costs, net(5) 247 (24,179) 2,103 (21,355) Stock-based compensation 18,566 17,094 44,905 51,083 Tax impact of adjustments(7) 3,633 (11,971) 8,384 (31,424)
Adjusted Net (Loss) Income from continuing operations $ (240,347) $ 73,565 $ (678,326) $ 235,218
Adjusted Net (Loss) Income from continuing operations per share ("Adjusted EPS") $ (0.82) $ 0.27 $ (2.42) $ 0.85
Diluted weighted-average common shares outstanding 292,392 276,235 280,750 276,474 Adjusted Net (Loss) Income from continuing operations $ (240,347) $ 73,565 $ (678,326) $ 235,218 Adjustments:
Depreciation and amortization of property and equipment(2b) 63,733 78,060 201,274 232,617 Amortization of capitalized implementation costs(2c) 9,146 9,579 28,110 31,317 Amortization of upfront incentive consideration(3) 19,444 20,851 56,733 59,825 Interest expense, net 67,651 39,743 163,674 117,364 Remaining provision for income taxes (23,997) 19,766 (61,720) 63,207
Adjusted EBITDA $ (104,370) $ 241,564 $ (290,255) $ 739,548 Less:
Depreciation and amortization(2) 89,344 103,615 279,159 311,905 Amortization of upfront incentive consideration(3) 19,444 20,851 56,733 59,825 Acquisition-related amortization(2a) (16,465) (15,976) (49,775) (47,971)
Adjusted Operating (Loss) Income $ (196,693) $ 133,074 $ (576,372) $ 415,789
Adjusted EBITDA margin NM 24.5 % NM 24.4 %

14
Reconciliation of Free Cash Flow:
Three Months Ended September 30, Nine Months Ended September 30,
2020 2019 2020 2019
Cash (used in) provided by operating activities $ (192,033) $ 166,704 $ (587,069) $ 424,365 Cash used in investing activities (8,888) (32,319) (52,634) (108,482) Cash provided by (used in) financing activities 565,611 (58,449) 1,873,804 (351,424)
Three Months Ended September 30, Nine Months Ended September 30,
2020 2019 2020 2019
Cash (used in) provided by operating activities $ (192,033) $ 166,704 $ (587,069) $ 424,365 Additions to property and equipment (8,926) (24,928) (48,259) (92,124)
Free Cash Flow $ (200,959) $ 141,776 $ (635,328) $ 332,241

15
Reconciliation of Net (Loss) Income to LTM Adjusted EBITDA (for Net Debt Ratio):
Three Months Ended
Dec 31, 2019 Mar 31, 2020 Jun 30, 2020 Sep 30, 2020 LTM
Net income (loss) attributable to common stockholders $ 10,091 $ (212,680) $ (444,131) $ (312,449) $ (959,169)
Loss from discontinued operations, net of tax 1,068 2,126 672 533 4,399
Net income (loss) attributable to non-controlling interests(1)
665 783 (71) 125
1,502
Preferred stock dividends — — — 2,231 2,231
Income (loss) from continuing operations 11,824 (209,771) (443,530) (309,560) (951,037)
Adjustments:
Acquisition-related amortization(2a) 16,633 16,801 16,509 16,465 66,408
Restructuring and other costs(8) — 25,281 48,001 947 74,229
Loss on extinguishment of debt — — — 10,333 10,333
Other, net(4) 3,314 47,486 6,098 18,431 75,329
Acquisition-related costs(6) 10,700 17,827 4,373 591 33,491
Litigation costs, net(5) (3,224) 1,741 115 247 (1,121)
Stock-based compensation 15,802 17,577 8,762 18,566 60,707
Depreciation and amortization of property and equipment(2b)
77,956 69,513 68,028 63,733
279,230
Amortization of capitalized implementation costs(2c) 8,127 9,547 9,417 9,146 36,237
Amortization of upfront incentive consideration(3) 23,110 18,213 19,076 19,444 79,843
Interest expense, net 39,027 37,442 58,581 67,651 202,701
Provision for income taxes 3,543 (27,254) (5,718) (20,364) (49,793)
Adjusted EBITDA $ 206,812 $ 24,403 $ (210,288) $ (104,370) $ (83,443)
Net Debt (total debt, less cash) $ 3,140,861 Net Debt / LTM Adjusted EBITDA NM

16
Three Months Ended
Dec 31, 2018 Mar 31, 2019 Jun 30, 2019 Sep 30, 2019 LTM
Net income attributable to common stockholders $ 84,400 $ 56,850 $ 27,838 $ 63,813 $ 232,901 Loss (income) from discontinued operations, net of tax 1,478 1,452 (1,350) 596 2,176 Net income attributable to non-controlling interests(1) 1,150 912 1,606 771 4,439
Income from continuing operations 87,028 59,214 28,094 65,180 239,516 Adjustments:
Acquisition-related amortization(2a) 16,423 15,984 16,011 15,976 64,394 Other, net(4) (2,237) 1,870 2,479 1,769 3,881 Acquisition-related costs(6) 3,266 11,706 8,935 9,696 33,603 Litigation costs, net(5) 1,250 1,438 1,386 (24,179) (20,105) Stock-based compensation 15,818 15,694 18,295 17,094 66,901 Depreciation and amortization of property and equipment(2b) 77,963 75,348 79,209 78,060 310,580
Amortization of capitalized implementation costs(2c) 11,407 12,111 9,627 9,579 42,724 Amortization of upfront incentive consideration(3) 20,298 19,128 19,846 20,851 80,123 Interest expense, net 40,208 38,013 39,608 39,743 157,572 Provision for income taxes (3,879) 11,843 12,145 7,795 27,904 Adjusted EBITDA $ 267,545 $ 262,349 $ 235,635 $ 241,564 $ 1,007,093
Net Debt (total debt, less cash) $ 2,910,713
Net Debt / LTM Adjusted EBITDA 2.9 x

17
Reconciliation of Operating (Loss) Income to Adjusted Gross Profit (Loss), Adjusted EBITDA and Adjusted
Operating (Loss) Income by business segment:
Three Months Ended September 30, 2020
Travel
Solutions
Hospitality Solutions Corporate Total
Operating loss $ (145,877) $ (12,609) $ (74,563) $ (233,049) Add back:
Selling, general and administrative 55,870 10,501 53,255 119,626 Technology costs 232,666 25,332 18,364 276,362 Cost of revenue adjustments:
Depreciation and amortization(2) 6,868 1,283 1,113 9,264 Restructuring and other costs — — (237) (237) Amortization of upfront incentive consideration(3) 19,444 — — 19,444 Stock-based compensation — — 1,422 1,422
Adjusted Gross Profit (Loss) 168,971 24,507 (646) 192,832 Selling, general and administrative (55,870) (10,501) (53,255) (119,626) Technology costs (232,666) (25,332) (18,364) (276,362) Equity method loss (460) — — (460) Selling, general and administrative and technology costs adjustments:
Depreciation and amortization(2) 54,475 9,104 16,501 80,080 Restructuring and other costs(8) — — 1,184 1,184 Acquisition-related costs(6) — — 591 591 Litigation costs, net(5) — — 247 247 Stock-based compensation — — 17,144 17,144
Adjusted EBITDA $ (65,550) $ (2,222) $ (36,598) $ (104,370) Less:
Depreciation and amortization(2) 61,343 10,387 17,614 89,344 Amortization of upfront incentive consideration(3) 19,444 — — 19,444 Acquisition-related amortization(2a) — — (16,465) (16,465)
Adjusted Operating Loss $ (146,337) $ (12,609) $ (37,747) $ (196,693)
Operating income margin NM NM NM NM
Adjusted Operating Income Margin NM NM NM NM

18
Three Months Ended September 30, 2019
Travel
Solutions
Hospitality Solutions Corporate Total
Operating income (loss) $ 182,555 $ (4,008) $ (65,087) $ 113,460 Add back:
Selling, general and administrative 74,227 10,061 44,503 128,791 Technology costs 276,572 28,322 17,669 322,563 Cost of revenue adjustments:
Depreciation and amortization(2) 7,167 1,387 871 9,425 Amortization of upfront incentive consideration(3) 20,851 — — 20,851 Stock-based compensation — — 1,536 1,536
Adjusted Gross Profit (Loss) 561,372 35,762 (508) 596,626 Selling, general and administrative (74,227) (10,061) (44,503) (128,791) Technology costs (276,572) (28,322) (17,669) (322,563) Equity method income 1,027 — — 1,027 Selling, general and administrative and technology costs adjustments:
Depreciation and amortization(2) 65,651 12,239 16,300 94,190 Acquisition-related costs(6) — — 9,696 9,696 Litigation costs, net(5) — — (24,179) (24,179) Stock-based compensation — — 15,558 15,558
Adjusted EBITDA $ 277,251 $ 9,618 $ (45,305) $ 241,564 Less:
Depreciation and amortization(2) 72,818 13,626 17,171 103,615 Amortization of upfront incentive consideration(3) 20,851 — — 20,851 Acquisition-related amortization(2a) — — (15,976) (15,976)
Adjusted Operating Income (Loss) $ 183,582 $ (4,008) $ (46,500) $ 133,074
Operating income margin 19.9 % NM NM 11.5 %
Adjusted Operating Income Margin 20.0 % NM NM 13.5 %

19
Nine Months Ended September 30, 2020
Travel
Solutions Hospitality Solutions Corporate Total
Operating loss $ (406,939) $ (48,475) $ (313,116) $ (768,530) Add back:
Selling, general and administrative 217,103 31,498 198,410 447,011 Technology costs 724,609 74,954 84,274 883,837 Cost of revenue adjustments:
Depreciation and amortization(2) 21,363 3,613 2,870 27,846 Restructuring and other costs(8) — — 21,492 21,492 Amortization of upfront incentive consideration(3) 56,733 — — 56,733 Stock-based compensation — — 3,668 3,668
Adjusted Gross Profit (Loss) 612,869 61,590 (2,402) 672,057 Selling, general and administrative (217,103) (31,498) (198,410) (447,011) Technology costs (724,609) (74,954) (84,274) (883,837) Equity method loss (1,645) — — (1,645) Selling, general and administrative and technology costs adjustments:
Depreciation and amortization(2) 170,721 29,734 50,858 251,313 Restructuring and other costs(8) — — 52,737 52,737 Acquisition-related costs(6) — — 22,791 22,791 Litigation costs, net(5) — — 2,103 2,103 Stock-based compensation — — 41,237 41,237
Adjusted EBITDA $ (159,767) $ (15,128) $ (115,360) $ (290,255) Less:
Depreciation and amortization(2) 192,084 33,347 53,728 279,159 Amortization of upfront incentive consideration(3) 56,733 — — 56,733 Acquisition-related amortization(2a) — — (49,775) (49,775)
Adjusted Operating Loss $ (408,584) $ (48,475) $ (119,313) $ (576,372)
Operating income margin NM NM NM NM
Adjusted Operating Income Margin NM NM NM NM

20
Nine Months Ended September 30, 2019
Travel
Solutions Hospitality Solutions Corporate Total
Operating income (loss) $ 572,662 $ (15,471) $ (251,411) $ 305,780 Add back:
Selling, general and administrative 221,549 32,070 189,050 442,669 Technology costs 826,680 83,969 53,748 964,397 Cost of revenue adjustments:
Depreciation and amortization(2) 22,988 4,108 2,609 29,705 Amortization of upfront incentive consideration(3) 59,825 — — 59,825 Stock-based compensation — — 4,758 4,758
Adjusted Gross Profit (Loss) 1,703,704 104,676 (1,246) 1,807,134 Selling, general and administrative (221,549) (32,070) (189,050) (442,669) Technology costs (826,680) (83,969) (53,748) (964,397) Equity method income 1,973 — — 1,973 Selling, general and administrative and technology costs adjustments:
Depreciation and amortization(2) 197,361 35,860 48,979 282,200 Acquisition-related costs(6) — — 30,337 30,337 Litigation costs, net(5) — — (21,355) (21,355) Stock-based compensation — — 46,325 46,325
Adjusted EBITDA $ 854,809 $ 24,497 $ (139,758) $ 739,548 Less:
Depreciation and amortization(2) 220,349 39,968 51,588 311,905
Amortization of upfront incentive consideration(3) 59,825 — — 59,825 Acquisition-related amortization(2a) — — (47,971) (47,971)
Adjusted Operating Income (Loss) $ 574,635 $ (15,471) $ (143,375) $ 415,789
Operating income margin 20.1 % NM NM 10.1 %
Adjusted Operating Income Margin 20.2 % NM NM 13.7 %
21
Non-GAAP Financial Measures
We have included both financial measures compiled in accordance with GAAP and certain non-
GAAP financial measures, including Adjusted Gross Profit (Loss), Adjusted Operating (Loss)
Income, Adjusted Net (Loss) Income from continuing operations ("Adjusted Net (Loss) Income"),
Adjusted EBITDA, Adjusted Net (Loss) Income from continuing operations per share ("Adjusted
EPS"), Free Cash Flow and ratios based on these financial measures. As a result of our business
realignment, we have separated our technology costs from cost of revenue and moved certain
expenses previously classified as cost of revenue to selling, general and administrative to provide
increased visibility to our technology costs for analytical and decision-making purposes and to
align costs with the current leadership and operational organizational structure. While there is no
impact to other financial measures, as a result of these changes, our Adjusted Gross Profit (Loss)
is more favorable than previously reported as it excludes costs that were previously classified as
cost of revenue. Technology costs are evaluated separately from Adjusted Gross Profit (Loss)
and excluded from this measure to provide a more transparent view of variable expenses, gross
margin, and key operational expense ratios.
We define Adjusted Gross Profit (Loss) as operating (loss) income adjusted for selling, general
and administrative expenses, technology costs, the cost of revenue portion of depreciation and
amortization, restructuring and other costs, amortization of upfront incentive consideration, and
stock-based compensation included in cost of revenue.
We define Adjusted Operating (Loss) Income as operating (loss) income adjusted for equity
method (loss) income, acquisition-related amortization, restructuring and other costs, acquisition-
related costs, litigation costs, net, and stock-based compensation.
We define Adjusted Net (Loss) Income as net (loss) income attributable to common stockholders
adjusted for loss (income) from discontinued operations, net of tax, net income attributable to
noncontrolling interests, acquisition-related amortization, loss on extinguishment of debt, other,
net, restructuring and other costs, acquisition-related costs, litigation costs, net, stock-based
compensation, and the tax impact of adjustments.
We define Adjusted EBITDA as Adjusted Net (Loss) Income adjusted for depreciation and
amortization of property and equipment, amortization of capitalized implementation costs,
amortization of upfront incentive consideration, interest expense, net, and the remaining provision
for income taxes.

22
We define Adjusted EPS as Adjusted Net (Loss) Income divided by diluted weighted-average
common shares outstanding.
We define Free Cash Flow as cash (used in) provided by operating activities less cash used in
additions to property and equipment.
These non-GAAP financial measures are key metrics used by management and our board of
directors to monitor our ongoing core operations because historical results have been significantly
impacted by events that are unrelated to our core operations as a result of changes to our
business and the regulatory environment. We believe that these non-GAAP financial measures
are used by investors, analysts and other interested parties as measures of financial performance
and to evaluate our ability to service debt obligations, fund capital expenditures and meet working
capital requirements. We also believe that Adjusted Gross Profit (Loss), Adjusted Operating
(Loss) Income, Adjusted Net (Loss) Income, Adjusted EBITDA and Adjusted EPS assist investors
in company-to-company and period-to-period comparisons by excluding differences caused by
variations in capital structures (affecting interest expense), tax positions and the impact of
depreciation and amortization expense. In addition, amounts derived from Adjusted EBITDA are
a primary component of certain covenants under our senior secured credit facilities.
Adjusted Gross Profit (Loss), Adjusted Operating (Loss) Income, Adjusted Net (Loss) Income,
Adjusted EBITDA, Adjusted EPS, Free Cash Flow and ratios based on these financial measures
are not recognized terms under GAAP. These non-GAAP financial measures and ratios based on
them are unaudited and have important limitations as analytical tools, and should not be viewed
in isolation and do not purport to be alternatives to net income as indicators of operating
performance or cash flows from operating activities as measures of liquidity. These non-GAAP
financial measures and ratios based on them exclude some, but not all, items that affect net
income or cash flows from operating activities and these measures may vary among companies.
Our use of these measures has limitations as an analytical tool, and you should not consider them
in isolation or as substitutes for analysis of our results as reported under GAAP. Some of these
limitations are:
• these non-GAAP financial measures exclude certain recurring, non-cash charges such as
stock-based compensation expense and amortization of acquired intangible assets;
• although depreciation and amortization are non-cash charges, the assets being
depreciated and amortized may have to be replaced in the future, and Adjusted Gross
Profit (Loss) and Adjusted EBITDA do not reflect cash requirements for such
replacements;

23
• Adjusted Gross Profit (Loss), Adjusted Operating (Loss) Income, Adjusted Net (Loss)
Income and Adjusted EBITDA do not reflect changes in, or cash requirements for, our
working capital needs;
• Adjusted Gross Profit (Loss) does not include technology costs, including transaction-
based technology costs, which differs from our previous presentations;
• Adjusted EBITDA does not reflect the interest expense or the cash requirements
necessary to service interest or principal payments on our indebtedness;
• Adjusted EBITDA does not reflect tax payments that may represent a reduction in cash
available to us;
• Free Cash Flow removes the impact of accrual-basis accounting on asset accounts and
non-debt liability accounts, and does not reflect the cash requirements necessary to
service the principal payments on our indebtedness; and
• other companies, including companies in our industry, may calculate Adjusted Gross Profit
(Loss), Adjusted Operating (Loss) Income, Adjusted Net (Loss) Income, Adjusted
EBITDA, Adjusted EPS or Free Cash Flow differently, which reduces their usefulness as
comparative measures.
Non-GAAP Footnotes
(1) Net income attributable to non-controlling interests represents an adjustment to include
earnings allocated to non-controlling interests held in (i) Sabre Travel Solutions Middle East
of 40%, (ii) Sabre Seyahat Dagitim Sistemleri A.S. of 40%, (iii) Sabre Travel Solutions Lanka
(Pte) Ltd of 40%, and (iv) Sabre Bulgaria of 40%.
(2) Depreciation and amortization expenses:
(a) Acquisition-related amortization represents amortization of intangible assets from the take-
private transaction in 2007 as well as intangibles associated with acquisitions since that date.
(b) Depreciation and amortization of property and equipment includes software developed for
internal use as well as amortization of contract acquisition costs.
(c) Amortization of capitalized implementation costs represents amortization of upfront costs
to implement new customer contracts under our SaaS and hosted revenue model.
(3) Our Travel Solutions business at times provides upfront incentive consideration to travel
agency subscribers at the inception or modification of a service contract, which are capitalized
and amortized to cost of revenue over an average expected life of the service contract,
generally over three to ten years. This consideration is made with the objective of increasing
the number of clients or to ensure or improve customer loyalty. These service contract terms
24
are established such that the supplier and other fees generated over the life of the contract
will exceed the cost of the incentive consideration provided up front. These service contracts
with travel agency subscribers require that the customer commit to achieving certain economic
objectives and generally have terms requiring repayment of the upfront incentive
consideration if those objectives are not met.
(4) Other, net includes a $46 million charge related to termination payments incurred in the first
quarter of 2020 in connection with the now-terminated acquisition of Farelogix Inc.
("Farelogix") and a $14 million pension settlement charge recorded in the third quarter of
2020, as well as foreign exchange gains and losses related to the remeasurement of foreign
currency denominated balances included in our consolidated balance sheets into the relevant
functional currency.
(5) Litigation costs, net represent charges associated with antitrust litigation and other foreign
non-income tax contingency matters and includes the reversal of our previously accrued loss
related to the US Airways legal matter for $32 million in the third quarter of 2019.
(6) Acquisition-related costs represent fees and expenses incurred associated with the now-
terminated agreement to acquire Farelogix.
(7) The tax impact of adjustments includes the tax effect of each separate adjustment based on
the statutory tax rate for the jurisdiction(s) in which the adjustment was taxable or deductible,
and the tax effect of items that relate to tax specific financial transactions, tax law changes,
uncertain tax positions, valuation allowance assessments and other items.
(8) Restructuring and other costs represent charges associated with business restructuring and
associated changes, including a strategic realignment of our airline and agency-focused
businesses, as well as other measures to support the new organizational structure and to
respond to the impacts of the COVID-19 pandemic on our business and cost structure.
![Overview of the evidentiary deficiencies in the …...GDS pass-through and not GDS bypass. Sabre projected that around [ ]% of Farelogix bookings would be GDS passthrough by 2021,](https://img.pdfslide.us/doc/110x75/5f9fd1ec9cf69505be60f8d3/overview-of-the-evidentiary-deficiencies-in-the-gds-pass-through-and-not-gds.jpg)