Embed Size (px)
Citation preview
SABAH SELECTED FACTS AND FIGURES
October December 2015
Compiled by:
INSTITUTE FOR DEVELOPMENT STUDIES (SABAH)
Contents Updated Information Page
Approved Manufacturing Projects in Sabah 2010 to 2015 1
External Trade (RM Million) 2
Expo 3
Exports of Major Commodities (RM Million) 4
Imports by Commodity Sections (RM '000) 5
Imports of Selected Commodities 6
7
Average Export Prices of Major Commodities, Sabah 8 -11
i
Page
Commodity Prices Monthly Average Prices of Cocoa Beans 12
Average Prices of Palm Oil Products (RM/Tonne) 13 -14
The Consumer Price Index, Index Numbers For Main Groups, Sabah and Labuan (2010=100)
15 -17
Number of Arrivals by Nationality, Sabah 18 -19
ii
New Information LABOUR FORCE SURVEY REPORT, MALAYSIA Page (a) Principal Statistics of Labour Force Participation Rate by Sex, Malaysia
2010-2014 20
(b) Principal Statistics of Labour Force by Sex, Malaysia 2010-2014 21
(c) Principal Statistics of Employed Person by Sex, Malaysia 2010-2014
22
(d) Principal Statistics of Unemployed Person by Sex, Malaysia 2010-2014 23
(e) Principal Statistics of Unemployment Rate by Sex, Malaysia 2010-2014 24
(f) Principal Statistics of Unemployed and Unemployment Rate by State, 2012-2014
25-26
(g) Labour Force by State, Strata and Sex, Malaysia 2014 27-30
iii
Page (h) Characteristics of Employed Persons by Occupation, Malaysia 2014 31
(i) Characteristics of Employed Persons by Employment, Malaysia 2014 32
(j) Characteristics of Employed Persons by Industry, Malaysia 2014 33-34
(k) Labour Force by State and Age Group, Malaysia 2014 35-38
(l) Labour Force by State and Educational Attainment, Malaysia 2014 39-40
(m) Labour Force by State and Highest Certificate Obtained, Malaysia 2014 41-44
(n) Labour Force by State and Martial Status, Malaysia 2014 45-46
iv
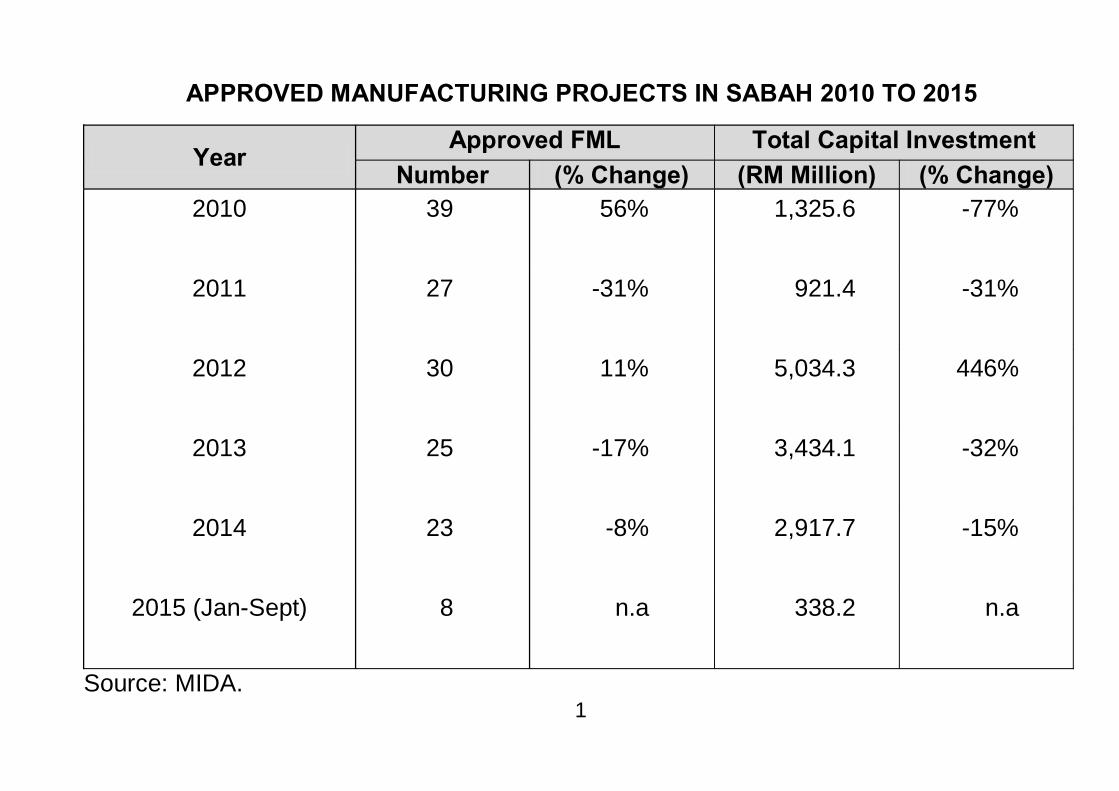
APPROVED MANUFACTURING PROJECTS IN SABAH 2010 TO 2015
Year Approved FML Total Capital Investment
Number (% Change) (RM Million) (% Change) 2010 39 56% 1,325.6 -77%
2011 27 -31% 921.4 -31%
2012 30 11% 5,034.3 446%
2013 25 -17% 3,434.1 -32%
2014 23 -8% 2,917.7 -15%
2015 (Jan-Sept) 8 n.a 338.2 n.a
Source: MIDA. 1
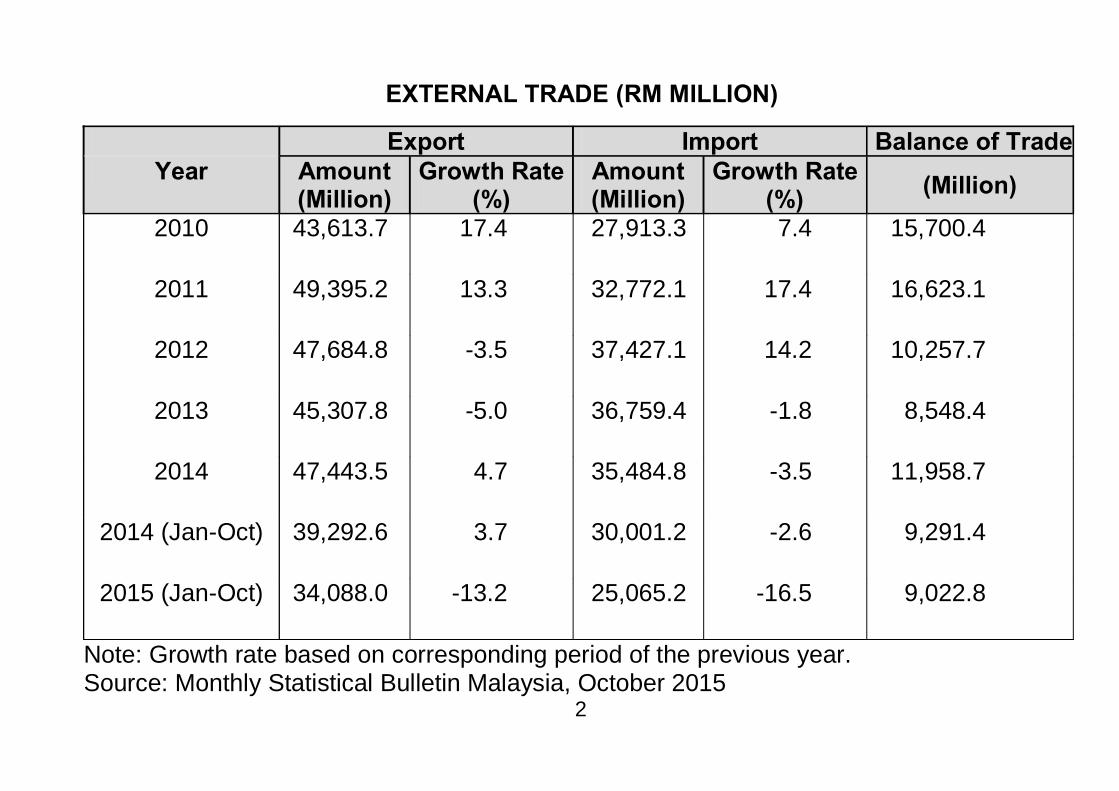
EXTERNAL TRADE (RM MILLION)
Export Import Balance of Trade Year Amount
(Million) Growth Rate
(%) Amount (Million)
Growth Rate (%) (Million)
2010 43,613.7 17.4 27,913.3 7.4 15,700.4
2011 49,395.2 13.3 32,772.1 17.4 16,623.1
2012 47,684.8 -3.5 37,427.1 14.2 10,257.7
2013 45,307.8 -5.0 36,759.4 -1.8 8,548.4
2014 47,443.5 4.7 35,484.8 -3.5 11,958.7
2014 (Jan-Oct) 39,292.6 3.7 30,001.2 -2.6 9,291.4
2015 (Jan-Oct) 34,088.0 -13.2 25,065.2 -16.5 9,022.8
Note: Growth rate based on corresponding period of the previous year. Source: Monthly Statistical Bulletin Malaysia, October 2015
2
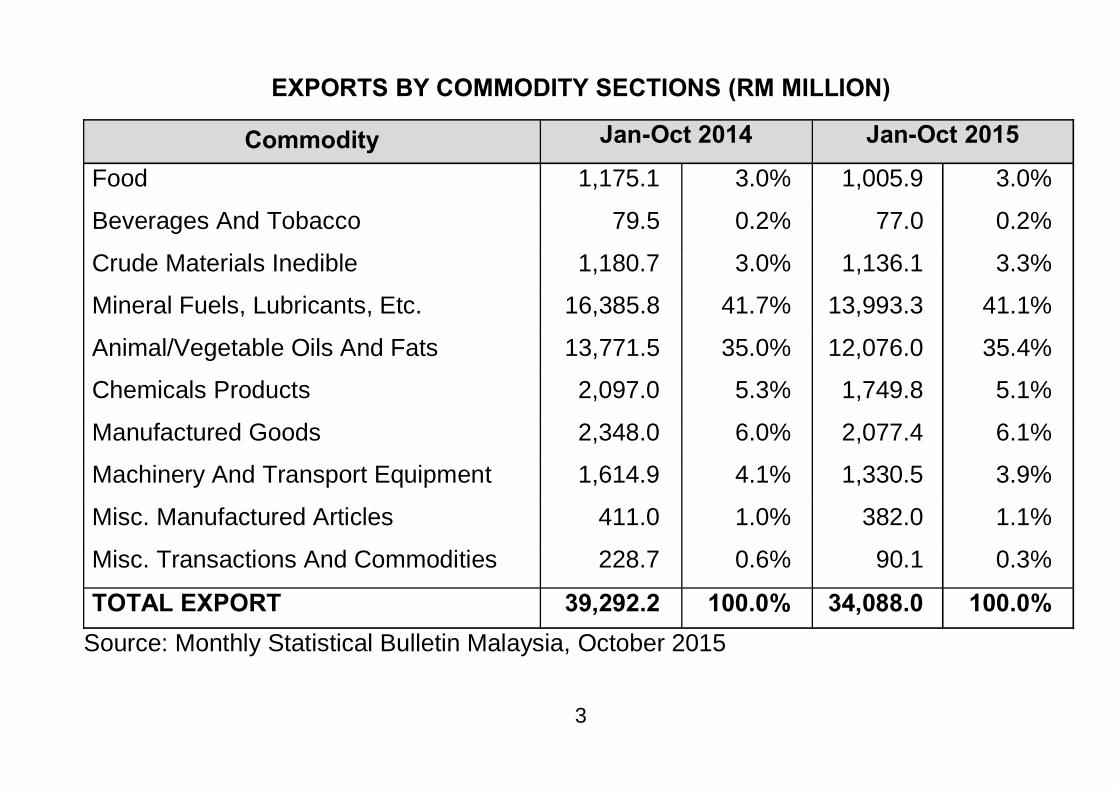
EXPORTS BY COMMODITY SECTIONS (RM MILLION)
Commodity Jan-Oct 2014 Jan-Oct 2015
Food 1,175.1 3.0% 1,005.9 3.0%
Beverages And Tobacco 79.5 0.2% 77.0 0.2%
Crude Materials Inedible 1,180.7 3.0% 1,136.1 3.3%
Mineral Fuels, Lubricants, Etc. 16,385.8 41.7% 13,993.3 41.1%
Animal/Vegetable Oils And Fats 13,771.5 35.0% 12,076.0 35.4%
Chemicals Products 2,097.0 5.3% 1,749.8 5.1%
Manufactured Goods 2,348.0 6.0% 2,077.4 6.1%
Machinery And Transport Equipment 1,614.9 4.1% 1,330.5 3.9%
Misc. Manufactured Articles 411.0 1.0% 382.0 1.1%
Misc. Transactions And Commodities 228.7 0.6% 90.1 0.3%
TOTAL EXPORT 39,292.2 100.0% 34,088.0 100.0% Source: Monthly Statistical Bulletin Malaysia, October 2015
3
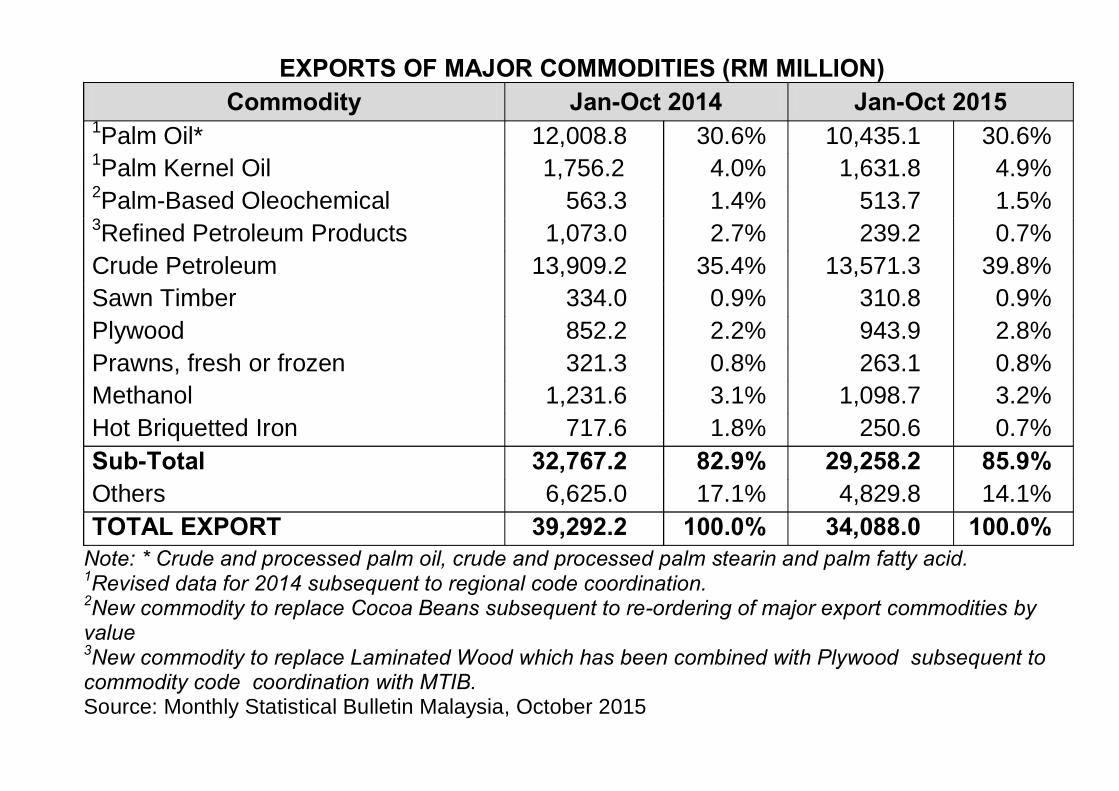
EXPORTS OF MAJOR COMMODITIES (RM MILLION) Commodity Jan-Oct 2014 Jan-Oct 2015
1Palm Oil* 12,008.8 30.6% 10,435.1 30.6% 1Palm Kernel Oil 1,756.2 4.0% 1,631.8 4.9% 2Palm-Based Oleochemical 563.3 1.4% 513.7 1.5% 3Refined Petroleum Products 1,073.0 2.7% 239.2 0.7% Crude Petroleum 13,909.2 35.4% 13,571.3 39.8% Sawn Timber 334.0 0.9% 310.8 0.9% Plywood 852.2 2.2% 943.9 2.8% Prawns, fresh or frozen 321.3 0.8% 263.1 0.8% Methanol 1,231.6 3.1% 1,098.7 3.2% Hot Briquetted Iron 717.6 1.8% 250.6 0.7% Sub-Total 32,767.2 82.9% 29,258.2 85.9% Others 6,625.0 17.1% 4,829.8 14.1% TOTAL EXPORT 39,292.2 100.0% 34,088.0 100.0%
Note: * Crude and processed palm oil, crude and processed palm stearin and palm fatty acid. 1Revised data for 2014 subsequent to regional code coordination. 2New commodity to replace Cocoa Beans subsequent to re-ordering of major export commodities by value 3New commodity to replace Laminated Wood which has been combined with Plywood subsequent to commodity code coordination with MTIB. Source: Monthly Statistical Bulletin Malaysia, October 2015
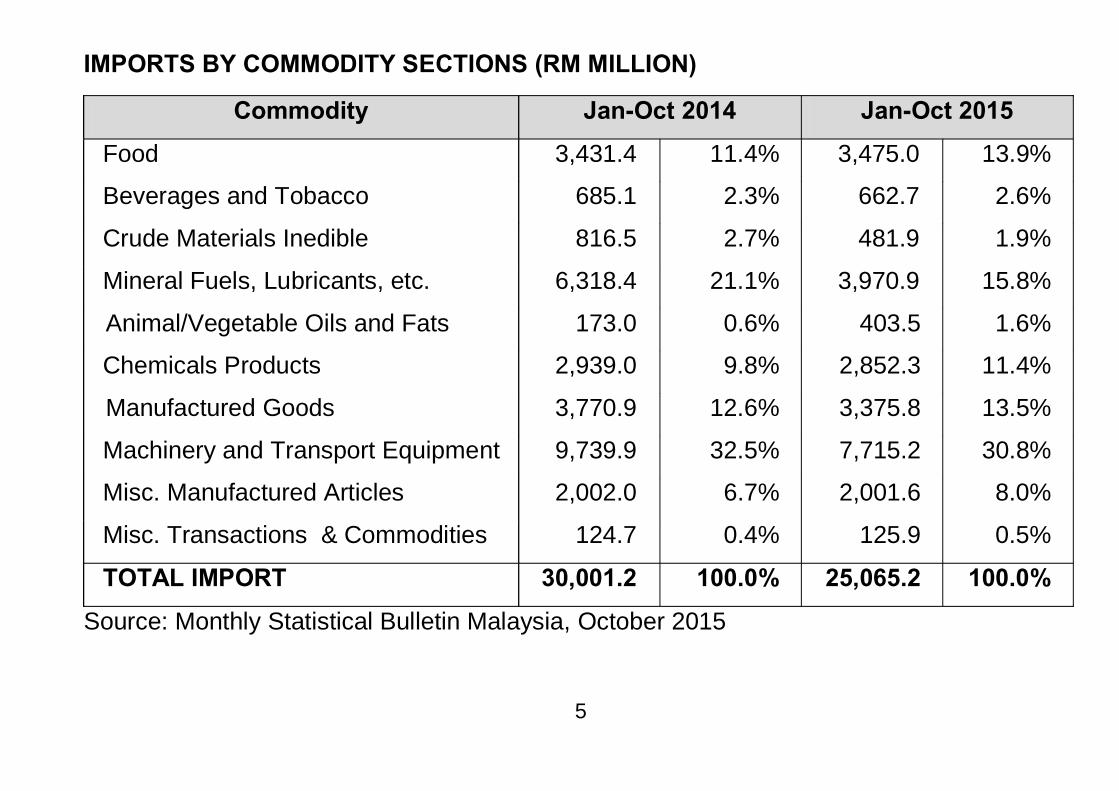
IMPORTS BY COMMODITY SECTIONS (RM MILLION)
Commodity Jan-Oct 2014 Jan-Oct 2015
Food 3,431.4 11.4% 3,475.0 13.9%
Beverages and Tobacco 685.1 2.3% 662.7 2.6%
Crude Materials Inedible 816.5 2.7% 481.9 1.9%
Mineral Fuels, Lubricants, etc. 6,318.4 21.1% 3,970.9 15.8%
Animal/Vegetable Oils and Fats 173.0 0.6% 403.5 1.6%
Chemicals Products 2,939.0 9.8% 2,852.3 11.4%
Manufactured Goods 3,770.9 12.6% 3,375.8 13.5%
Machinery and Transport Equipment 9,739.9 32.5% 7,715.2 30.8%
Misc. Manufactured Articles 2,002.0 6.7% 2,001.6 8.0%
Misc. Transactions & Commodities 124.7 0.4% 125.9 0.5%
TOTAL IMPORT 30,001.2 100.0% 25,065.2 100.0%
Source: Monthly Statistical Bulletin Malaysia, October 2015
5
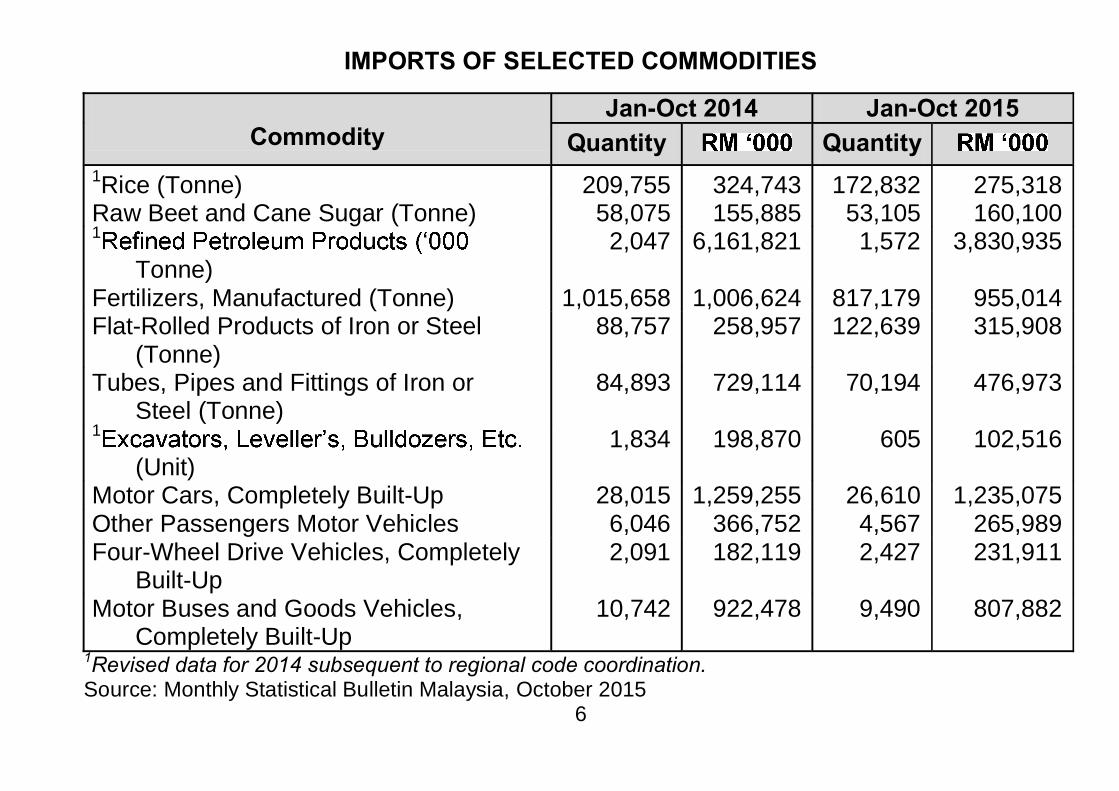
IMPORTS OF SELECTED COMMODITIES
Commodity
Jan-Oct 2014 Jan-Oct 2015 Quantity Quantity
1Rice (Tonne) 209,755 324,743 172,832 275,318 Raw Beet and Cane Sugar (Tonne) 58,075 155,885 53,105 160,100 1
Tonne) 2,047 6,161,821 1,572 3,830,935
Fertilizers, Manufactured (Tonne) 1,015,658 1,006,624 817,179 955,014 Flat-Rolled Products of Iron or Steel
(Tonne) 88,757 258,957 122,639 315,908
Tubes, Pipes and Fittings of Iron or Steel (Tonne)
84,893 729,114 70,194 476,973
1 (Unit)
1,834 198,870 605 102,516
Motor Cars, Completely Built-Up 28,015 1,259,255 26,610 1,235,075 Other Passengers Motor Vehicles 6,046 366,752 4,567 265,989 Four-Wheel Drive Vehicles, Completely
Built-Up 2,091 182,119 2,427 231,911
Motor Buses and Goods Vehicles, Completely Built-Up
10,742 922,478 9,490 807,882
1Revised data for 2014 subsequent to regional code coordination. Source: Monthly Statistical Bulletin Malaysia, October 2015
6
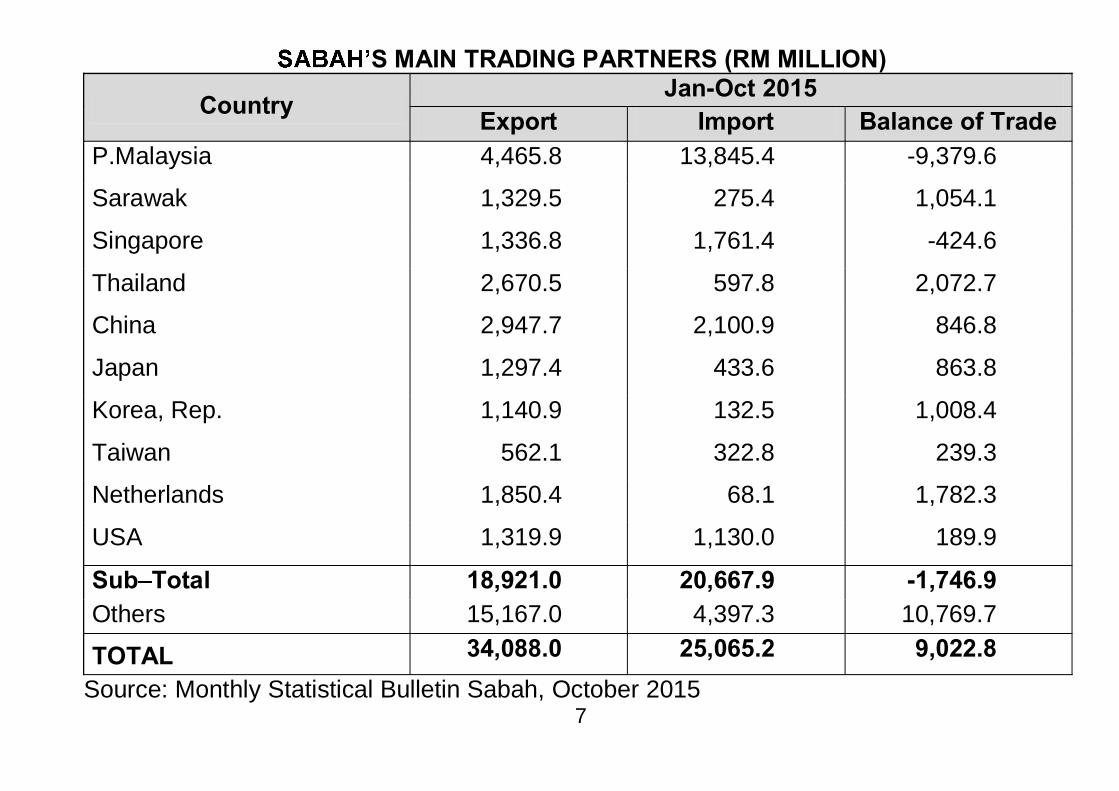
S MAIN TRADING PARTNERS (RM MILLION)
Country Jan-Oct 2015
Export Import Balance of Trade P.Malaysia 4,465.8 13,845.4 -9,379.6
Sarawak 1,329.5 275.4 1,054.1
Singapore 1,336.8 1,761.4 -424.6
Thailand 2,670.5 597.8 2,072.7
China 2,947.7 2,100.9 846.8
Japan 1,297.4 433.6 863.8
Korea, Rep. 1,140.9 132.5 1,008.4
Taiwan 562.1 322.8 239.3
Netherlands 1,850.4 68.1 1,782.3
USA 1,319.9 1,130.0 189.9
Sub Total 18,921.0 20,667.9 -1,746.9 Others 15,167.0 4,397.3 10,769.7
TOTAL 34,088.0 25,065.2 9,022.8 Source: Monthly Statistical Bulletin Sabah, October 2015
7
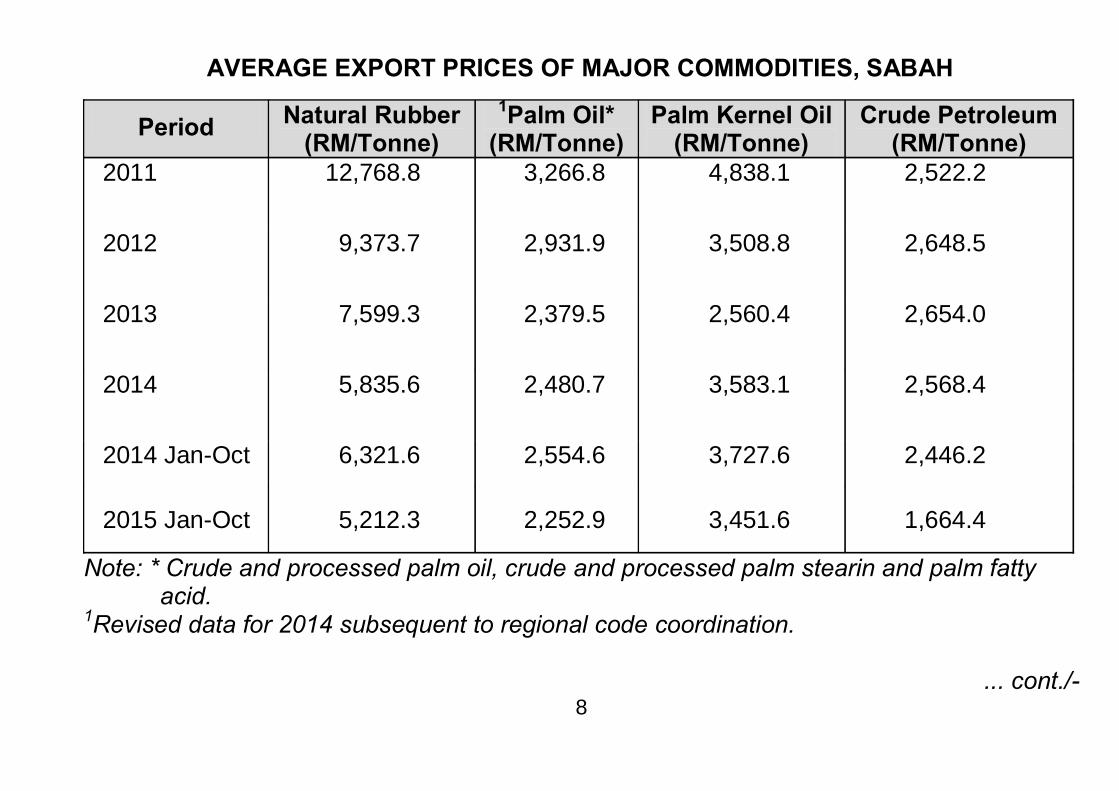
AVERAGE EXPORT PRICES OF MAJOR COMMODITIES, SABAH
Period Natural Rubber (RM/Tonne)
1Palm Oil* (RM/Tonne)
Palm Kernel Oil (RM/Tonne)
Crude Petroleum (RM/Tonne)
2011 12,768.8 3,266.8 4,838.1 2,522.2
2012 9,373.7 2,931.9 3,508.8 2,648.5
2013 7,599.3 2,379.5 2,560.4 2,654.0
2014 5,835.6 2,480.7 3,583.1 2,568.4
2014 Jan-Oct 6,321.6 2,554.6 3,727.6 2,446.2
2015 Jan-Oct 5,212.3 2,252.9 3,451.6 1,664.4
Note: * Crude and processed palm oil, crude and processed palm stearin and palm fatty acid.
1Revised data for 2014 subsequent to regional code coordination.
... cont./- 8
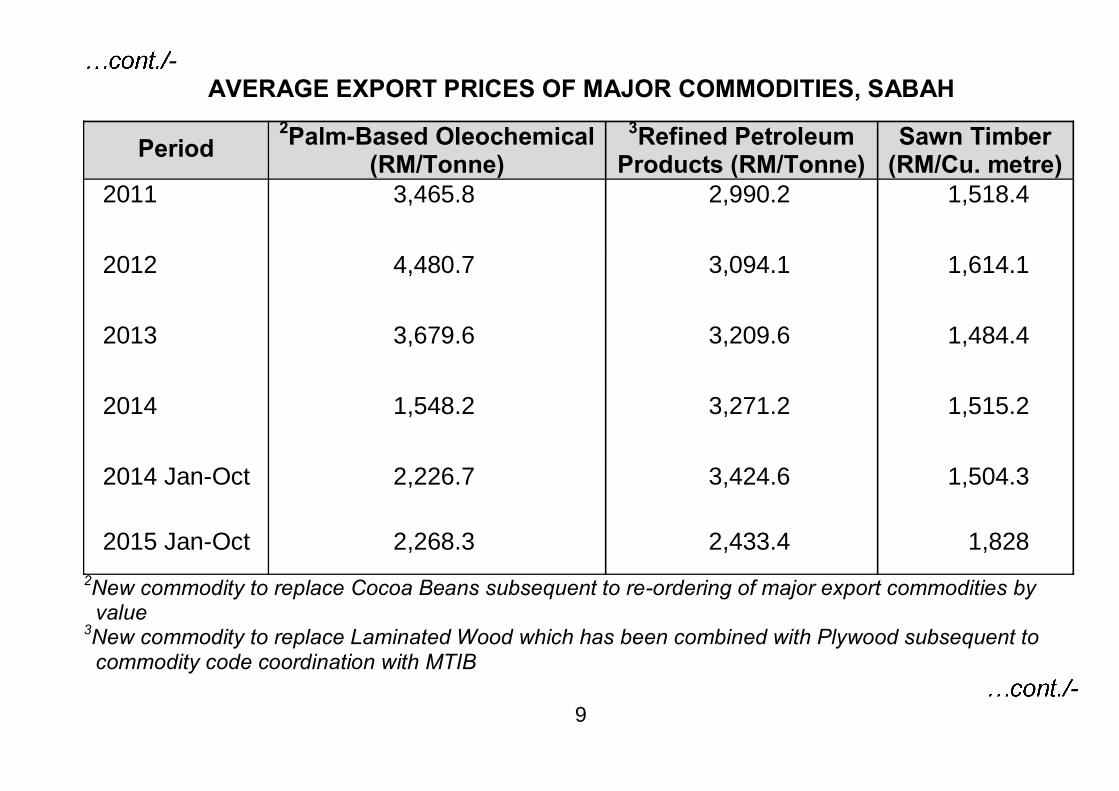
- AVERAGE EXPORT PRICES OF MAJOR COMMODITIES, SABAH
Period 2Palm-Based Oleochemical
(RM/Tonne) 3Refined Petroleum
Products (RM/Tonne) Sawn Timber
(RM/Cu. metre) 2011 3,465.8 2,990.2 1,518.4
2012 4,480.7 3,094.1 1,614.1
2013 3,679.6 3,209.6 1,484.4
2014 1,548.2 3,271.2 1,515.2
2014 Jan-Oct 2,226.7 3,424.6 1,504.3
2015 Jan-Oct 2,268.3 2,433.4 1,828 2New commodity to replace Cocoa Beans subsequent to re-ordering of major export commodities by value 3New commodity to replace Laminated Wood which has been combined with Plywood subsequent to commodity code coordination with MTIB
- 9
-
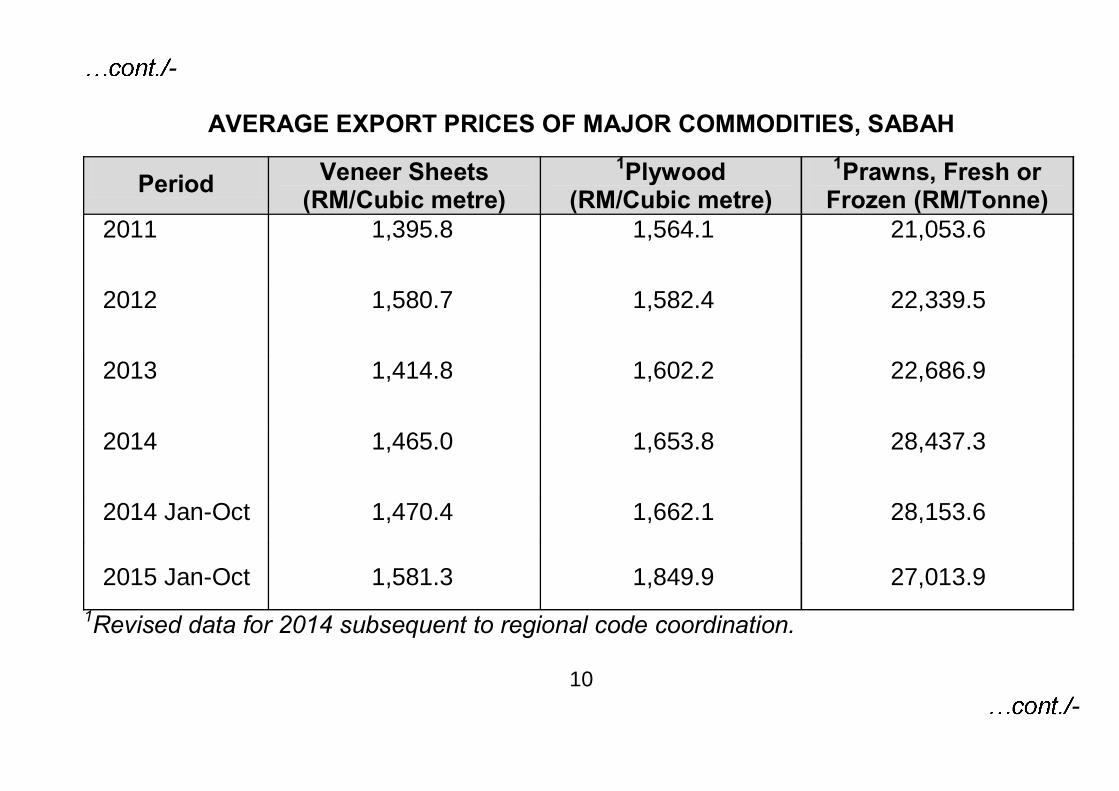
AVERAGE EXPORT PRICES OF MAJOR COMMODITIES, SABAH
Period Veneer Sheets (RM/Cubic metre)
1Plywood (RM/Cubic metre)
1Prawns, Fresh or Frozen (RM/Tonne)
2011 1,395.8 1,564.1 21,053.6
2012 1,580.7 1,582.4 22,339.5
2013 1,414.8 1,602.2 22,686.9
2014 1,465.0 1,653.8 28,437.3
2014 Jan-Oct 1,470.4 1,662.1 28,153.6
2015 Jan-Oct 1,581.3 1,849.9 27,013.9 1Revised data for 2014 subsequent to regional code coordination.
10 -
-
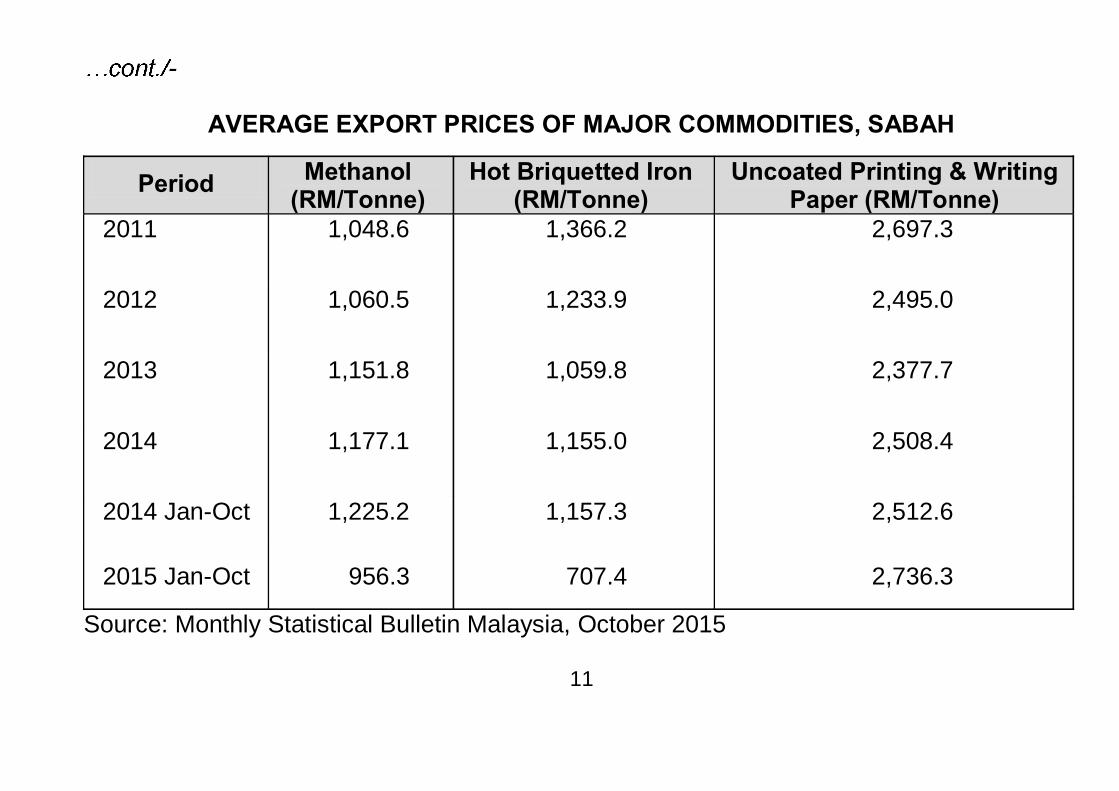
AVERAGE EXPORT PRICES OF MAJOR COMMODITIES, SABAH
Period Methanol (RM/Tonne)
Hot Briquetted Iron (RM/Tonne)
Uncoated Printing & Writing Paper (RM/Tonne)
2011 1,048.6 1,366.2 2,697.3
2012 1,060.5 1,233.9 2,495.0
2013 1,151.8 1,059.8 2,377.7
2014 1,177.1 1,155.0 2,508.4
2014 Jan-Oct 1,225.2 1,157.3 2,512.6
2015 Jan-Oct 956.3 707.4 2,736.3
Source: Monthly Statistical Bulletin Malaysia, October 2015
11
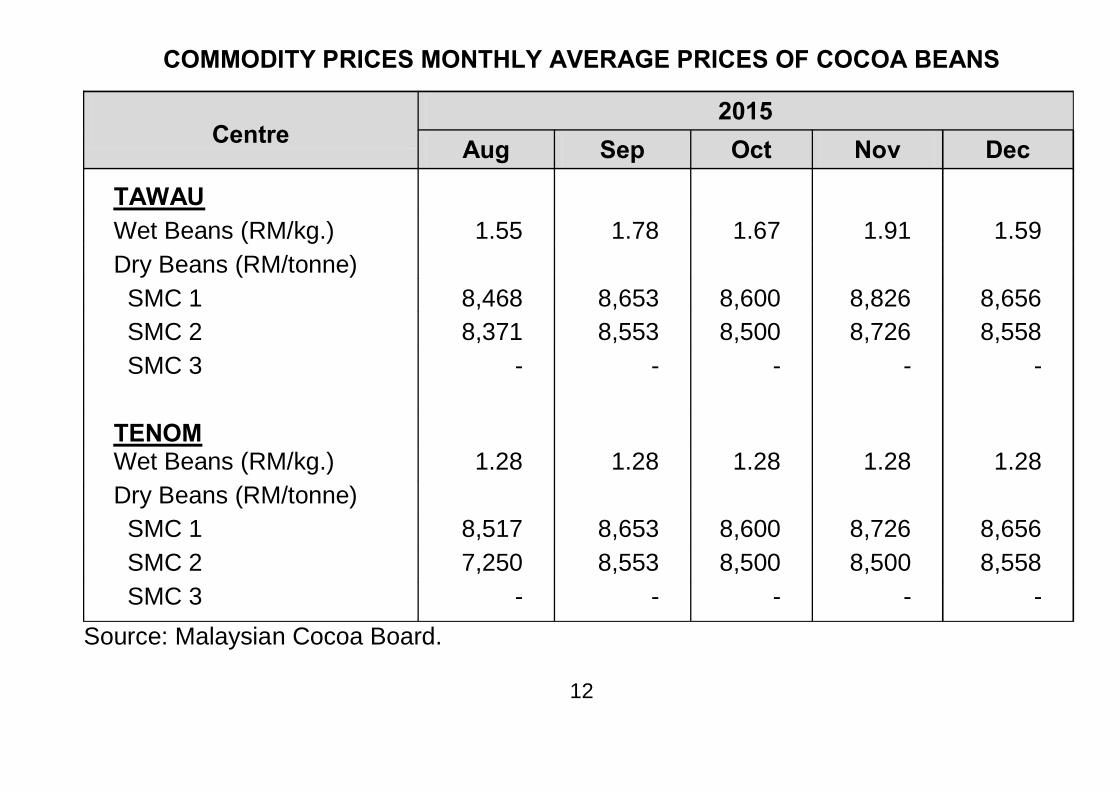
COMMODITY PRICES MONTHLY AVERAGE PRICES OF COCOA BEANS
Centre
2015 Aug Sep Oct Nov Dec
TAWAU Wet Beans (RM/kg.) 1.55 1.78 1.67 1.91 1.59 Dry Beans (RM/tonne) SMC 1 8,468 8,653 8,600 8,826 8,656 SMC 2 8,371 8,553 8,500 8,726 8,558 SMC 3
- - - - -
TENOM Wet Beans (RM/kg.) 1.28 1.28 1.28 1.28 1.28
Dry Beans (RM/tonne) SMC 1 8,517 8,653 8,600 8,726 8,656 SMC 2 7,250 8,553 8,500 8,500 8,558 SMC 3 - - - - -
Source: Malaysian Cocoa Board.
12
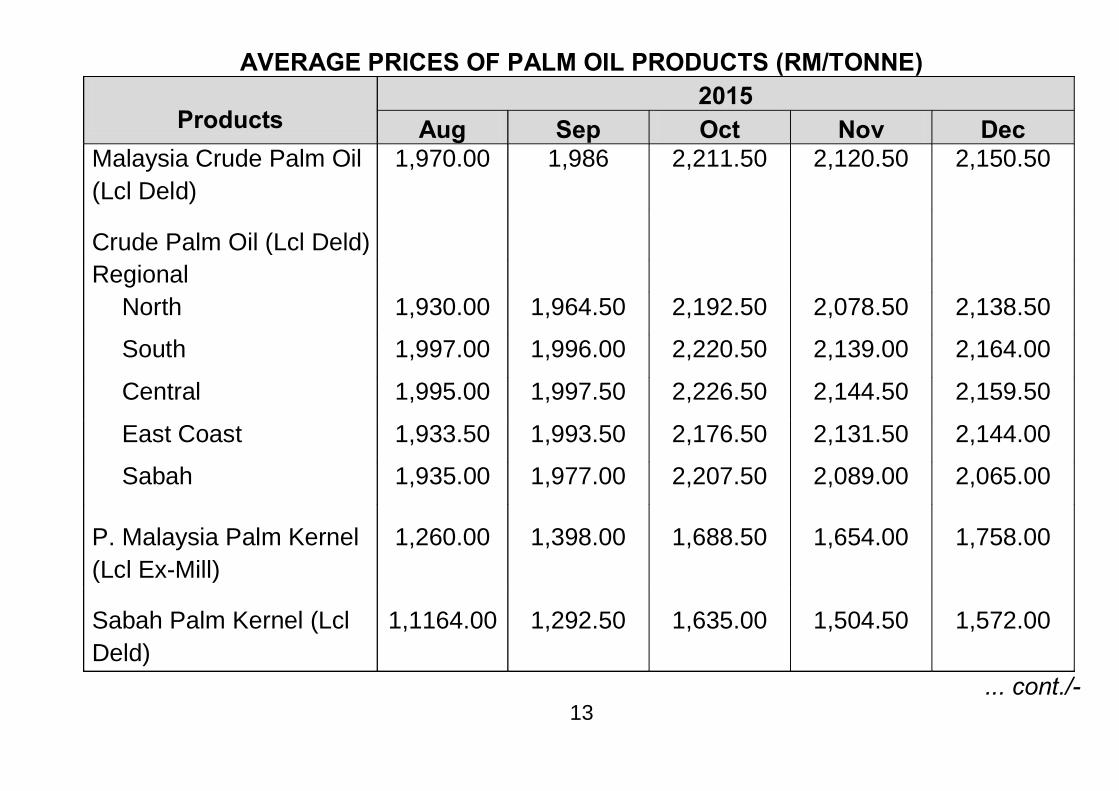
AVERAGE PRICES OF PALM OIL PRODUCTS (RM/TONNE)
Products 2015
Aug Sep Oct Nov Dec Malaysia Crude Palm Oil (Lcl Deld)
1,970.00 1,986 2,211.50 2,120.50 2,150.50
Crude Palm Oil (Lcl Deld)
Regional North 1,930.00 1,964.50 2,192.50 2,078.50 2,138.50
South 1,997.00 1,996.00 2,220.50 2,139.00 2,164.00
Central 1,995.00 1,997.50 2,226.50 2,144.50 2,159.50
East Coast 1,933.50 1,993.50 2,176.50 2,131.50 2,144.00
Sabah 1,935.00 1,977.00 2,207.50 2,089.00 2,065.00
P. Malaysia Palm Kernel (Lcl Ex-Mill)
1,260.00 1,398.00 1,688.50 1,654.00 1,758.00
Sabah Palm Kernel (Lcl Deld)
1,1164.00 1,292.50 1,635.00 1,504.50 1,572.00
... cont./- 13
... cont./-
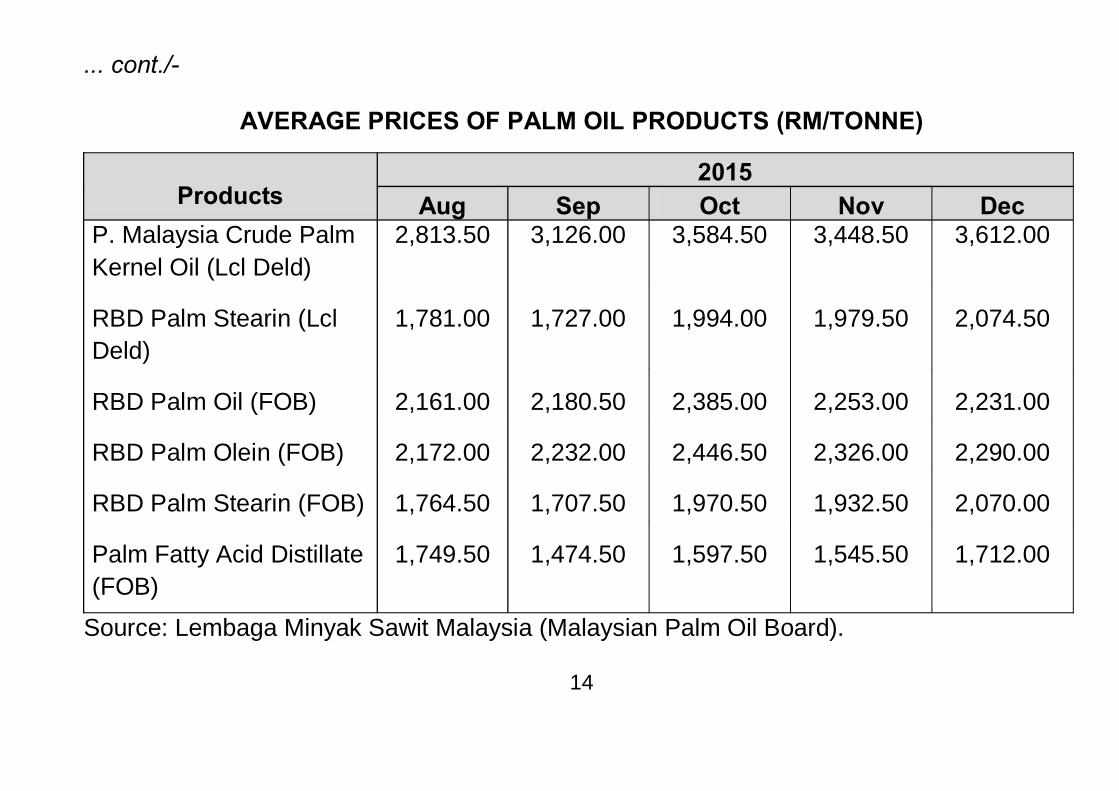
AVERAGE PRICES OF PALM OIL PRODUCTS (RM/TONNE)
Products
2015 Aug Sep Oct Nov Dec
P. Malaysia Crude Palm Kernel Oil (Lcl Deld)
2,813.50 3,126.00 3,584.50 3,448.50 3,612.00
RBD Palm Stearin (Lcl Deld)
1,781.00 1,727.00 1,994.00 1,979.50 2,074.50
RBD Palm Oil (FOB) 2,161.00 2,180.50 2,385.00 2,253.00 2,231.00
RBD Palm Olein (FOB) 2,172.00 2,232.00 2,446.50 2,326.00 2,290.00
RBD Palm Stearin (FOB) 1,764.50 1,707.50 1,970.50 1,932.50 2,070.00
Palm Fatty Acid Distillate (FOB)
1,749.50 1,474.50 1,597.50 1,545.50 1,712.00
Source: Lembaga Minyak Sawit Malaysia (Malaysian Palm Oil Board).
14
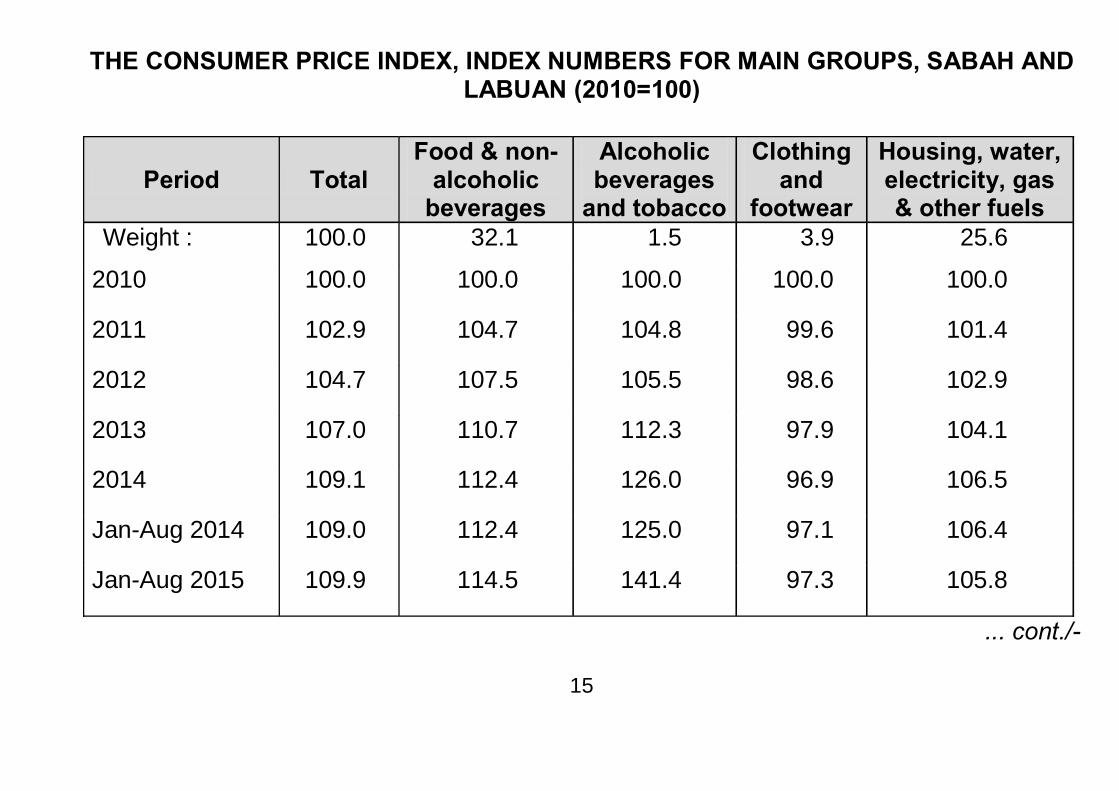
THE CONSUMER PRICE INDEX, INDEX NUMBERS FOR MAIN GROUPS, SABAH AND LABUAN (2010=100)
Period Total Food & non-
alcoholic beverages
Alcoholic beverages
and tobacco
Clothing and
footwear
Housing, water, electricity, gas & other fuels
Weight : 100.0 32.1 1.5 3.9 25.6
2010 100.0 100.0 100.0 100.0 100.0
2011 102.9 104.7 104.8 99.6 101.4
2012 104.7 107.5 105.5 98.6 102.9
2013 107.0 110.7 112.3 97.9 104.1
2014 109.1 112.4 126.0 96.9 106.5
Jan-Aug 2014 109.0 112.4 125.0 97.1 106.4
Jan-Aug 2015 109.9 114.5 141.4 97.3 105.8
... cont./-
15
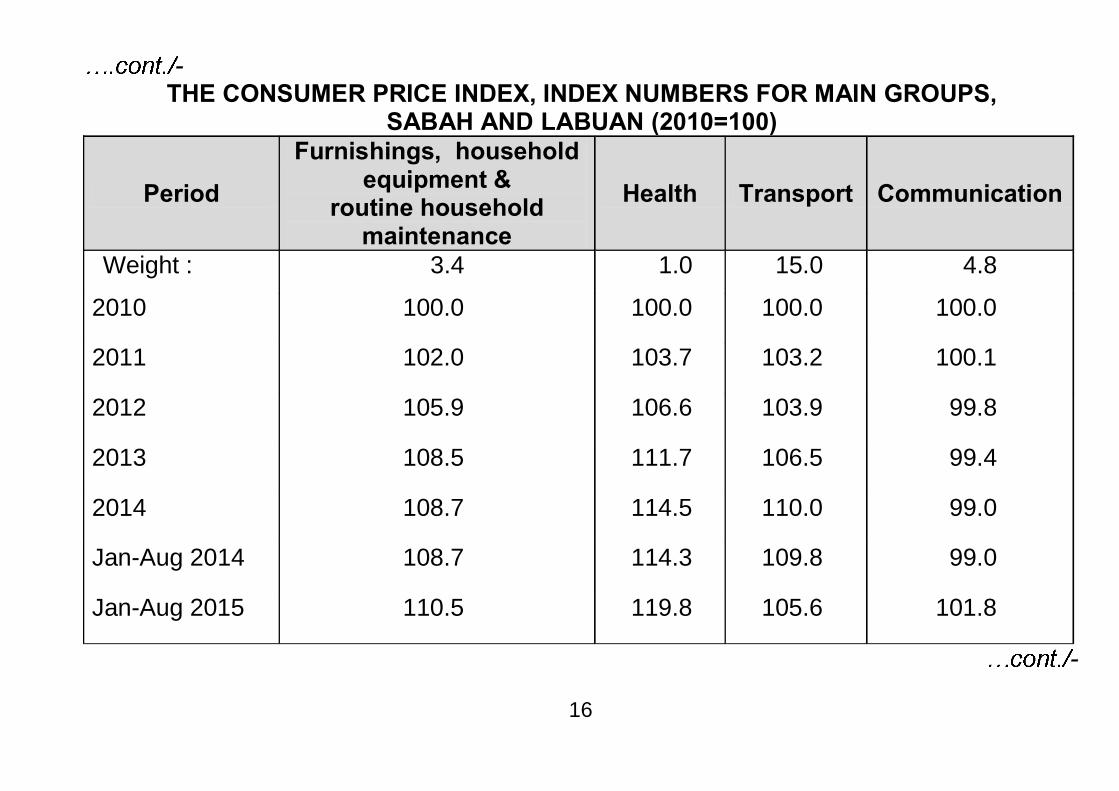
- THE CONSUMER PRICE INDEX, INDEX NUMBERS FOR MAIN GROUPS,
SABAH AND LABUAN (2010=100)
Period Furnishings, household
equipment & routine household
maintenance Health Transport Communication
Weight : 3.4 1.0 15.0 4.8
2010 100.0 100.0 100.0 100.0
2011 102.0 103.7 103.2 100.1
2012 105.9 106.6 103.9 99.8
2013 108.5 111.7 106.5 99.4
2014 108.7 114.5 110.0 99.0
Jan-Aug 2014 108.7 114.3 109.8 99.0
Jan-Aug 2015 110.5 119.8 105.6 101.8
-
16
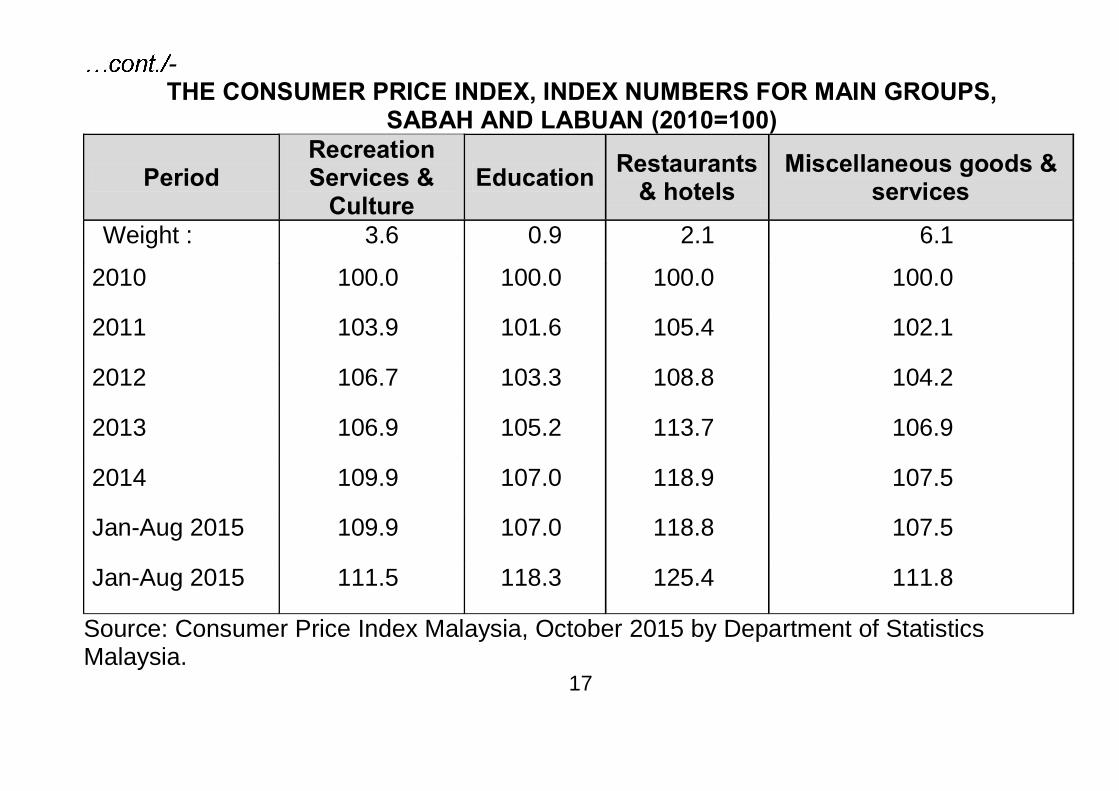
- THE CONSUMER PRICE INDEX, INDEX NUMBERS FOR MAIN GROUPS,
SABAH AND LABUAN (2010=100)
Period Recreation Services &
Culture Education Restaurants
& hotels Miscellaneous goods &
services
Weight : 3.6 0.9 2.1 6.1
2010 100.0 100.0 100.0 100.0
2011 103.9 101.6 105.4 102.1
2012 106.7 103.3 108.8 104.2
2013 106.9 105.2 113.7 106.9
2014 109.9 107.0 118.9 107.5
Jan-Aug 2015 109.9 107.0 118.8 107.5
Jan-Aug 2015 111.5 118.3 125.4 111.8
Source: Consumer Price Index Malaysia, October 2015 by Department of Statistics Malaysia.
17
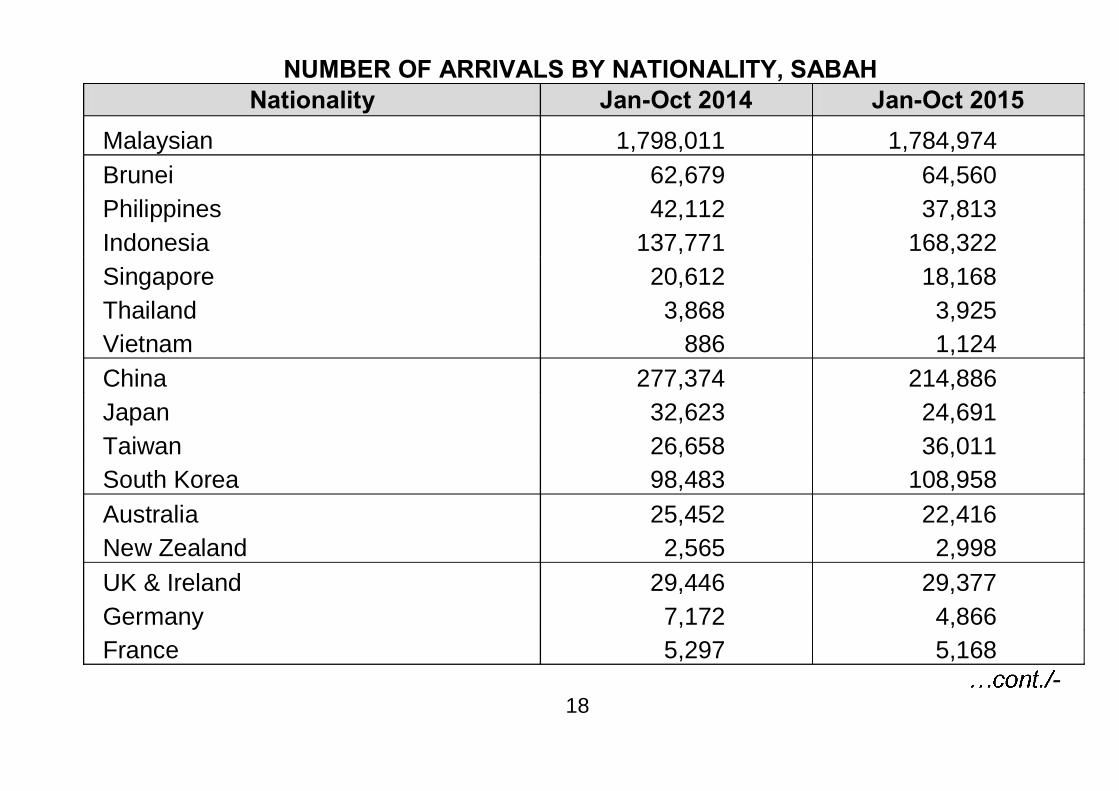
NUMBER OF ARRIVALS BY NATIONALITY, SABAH Nationality Jan-Oct 2014 Jan-Oct 2015
Malaysian 1,798,011 1,784,974 Brunei 62,679 64,560 Philippines 42,112 37,813 Indonesia 137,771 168,322 Singapore 20,612 18,168 Thailand 3,868 3,925 Vietnam 886 1,124 China 277,374 214,886 Japan 32,623 24,691 Taiwan 26,658 36,011 South Korea 98,483 108,958 Australia 25,452 22,416 New Zealand 2,565 2,998 UK & Ireland 29,446 29,377 Germany 7,172 4,866 France 5,297 5,168
- 18
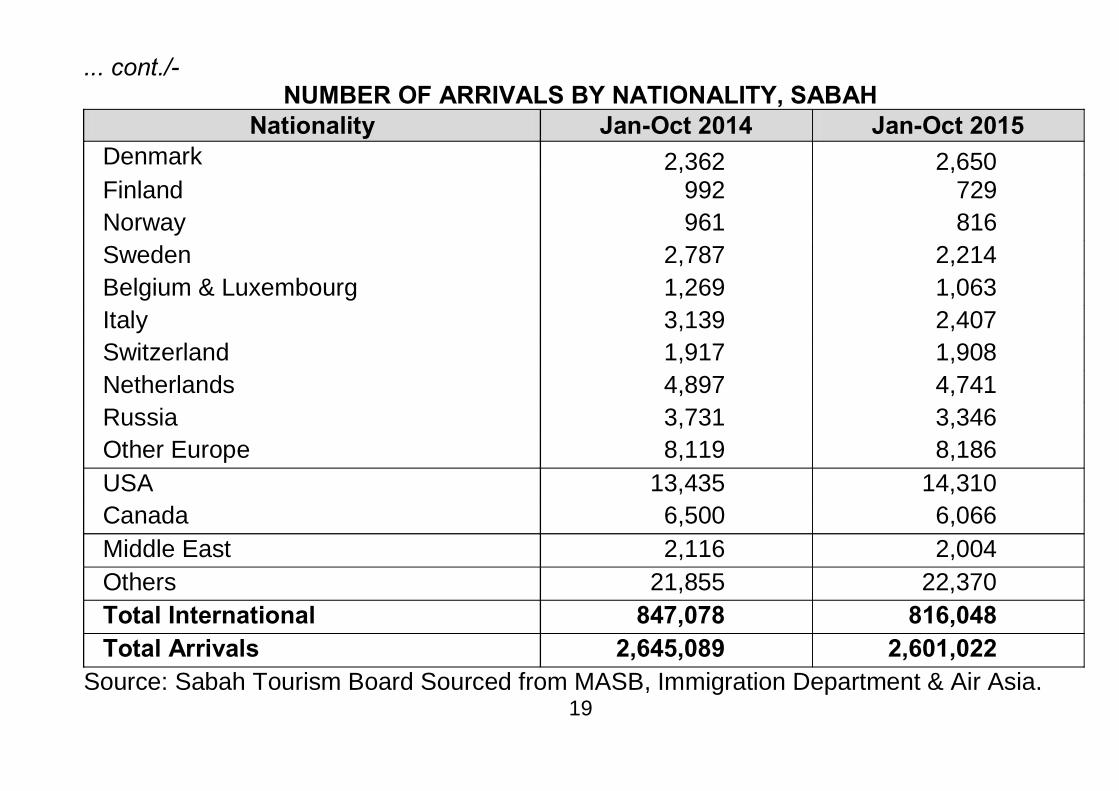
... cont./- NUMBER OF ARRIVALS BY NATIONALITY, SABAH
Nationality Jan-Oct 2014 Jan-Oct 2015 Denmark 2,362 2,650 Finland 992 729 Norway 961 816 Sweden 2,787 2,214 Belgium & Luxembourg 1,269 1,063 Italy 3,139 2,407 Switzerland 1,917 1,908 Netherlands 4,897 4,741 Russia 3,731 3,346 Other Europe 8,119 8,186 USA 13,435 14,310 Canada 6,500 6,066 Middle East 2,116 2,004 Others 21,855 22,370 Total International 847,078 816,048 Total Arrivals 2,645,089 2,601,022
Source: Sabah Tourism Board Sourced from MASB, Immigration Department & Air Asia. 19
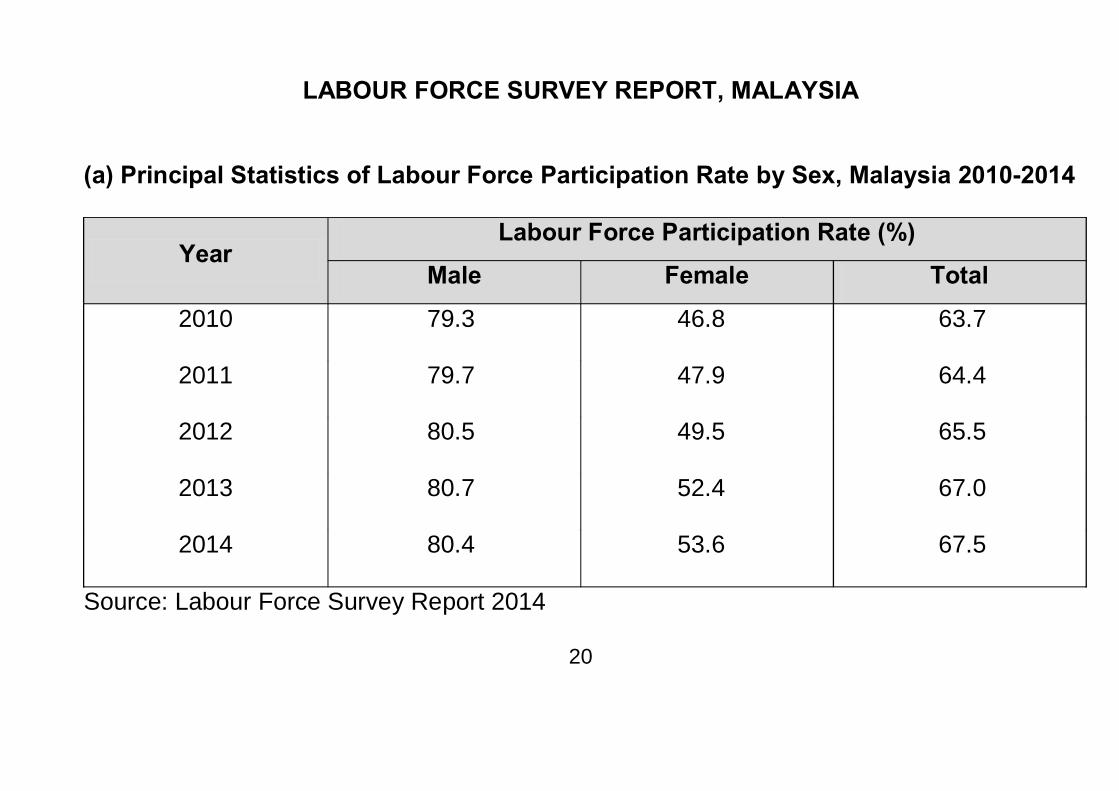
LABOUR FORCE SURVEY REPORT, MALAYSIA
(a) Principal Statistics of Labour Force Participation Rate by Sex, Malaysia 2010-2014
Year Labour Force Participation Rate (%)
Male Female Total
2010 79.3 46.8 63.7
2011 79.7 47.9 64.4
2012 80.5 49.5 65.5
2013 80.7 52.4 67.0
2014 80.4 53.6 67.5
Source: Labour Force Survey Report 2014
20
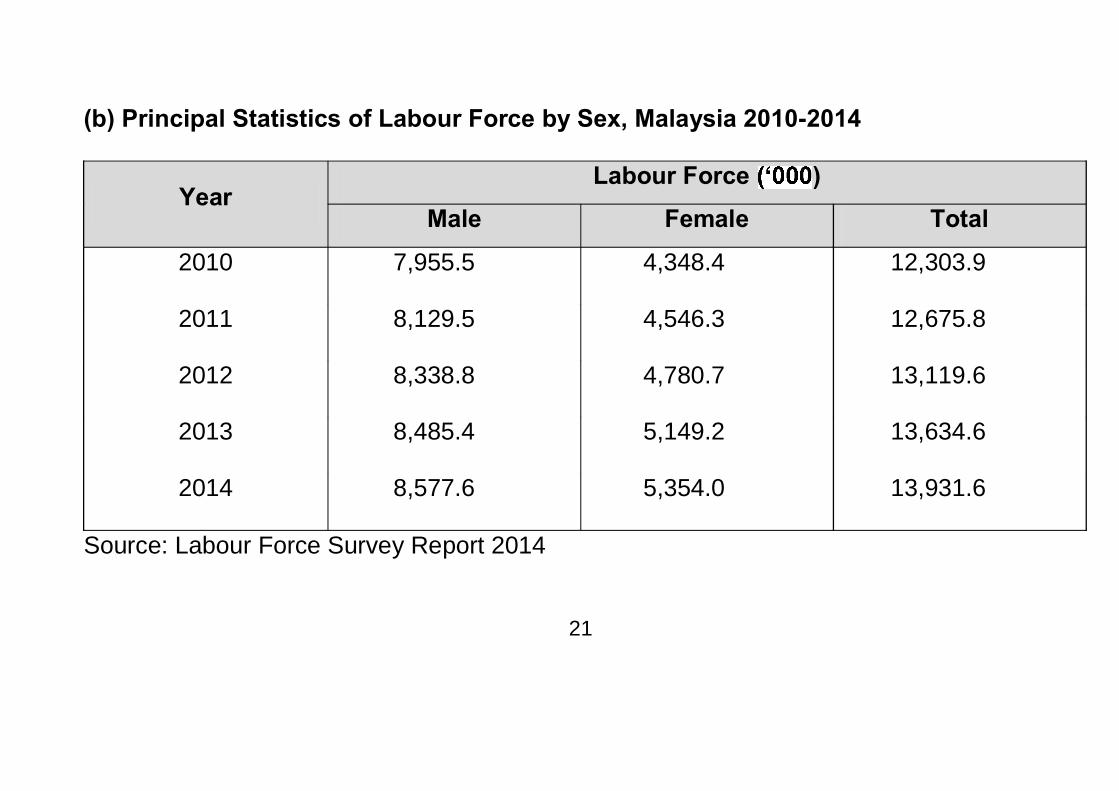
(b) Principal Statistics of Labour Force by Sex, Malaysia 2010-2014
Year Labour Force )
Male Female Total
2010 7,955.5 4,348.4 12,303.9
2011 8,129.5 4,546.3 12,675.8
2012 8,338.8 4,780.7 13,119.6
2013 8,485.4 5,149.2 13,634.6
2014 8,577.6 5,354.0 13,931.6
Source: Labour Force Survey Report 2014
21
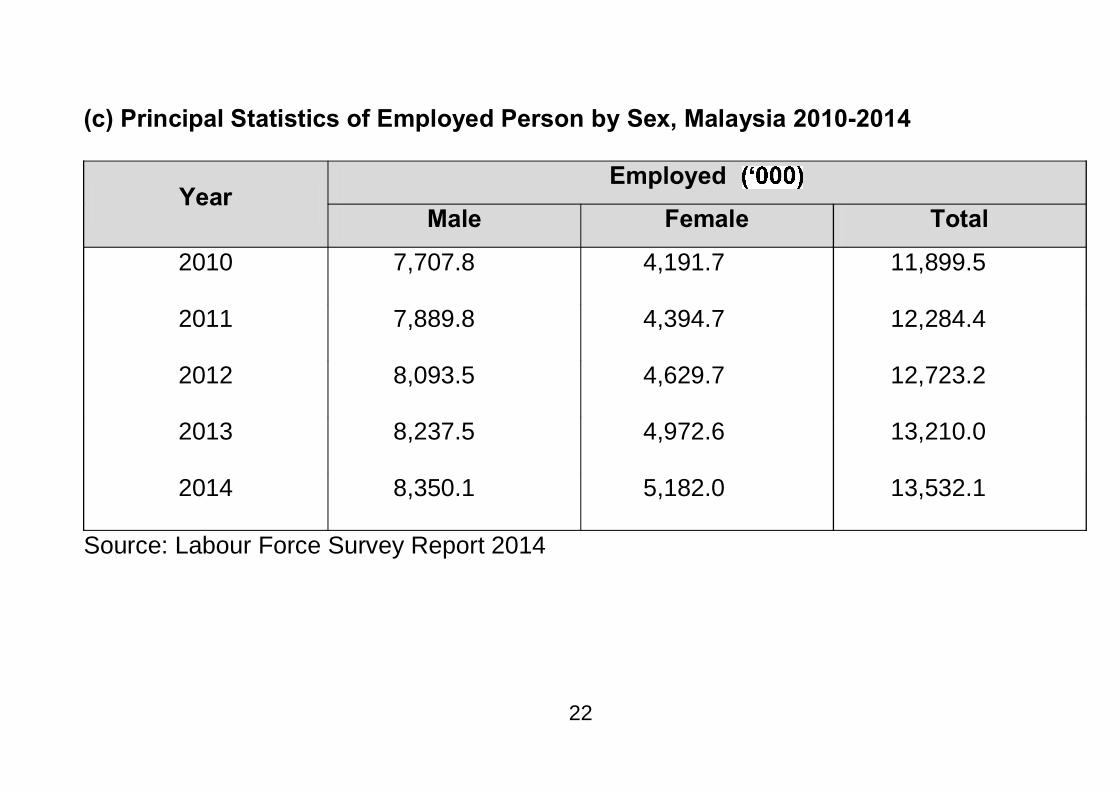
(c) Principal Statistics of Employed Person by Sex, Malaysia 2010-2014
Year Employed
Male Female Total
2010 7,707.8 4,191.7 11,899.5
2011 7,889.8 4,394.7 12,284.4
2012 8,093.5 4,629.7 12,723.2
2013 8,237.5 4,972.6 13,210.0
2014 8,350.1 5,182.0 13,532.1
Source: Labour Force Survey Report 2014
22
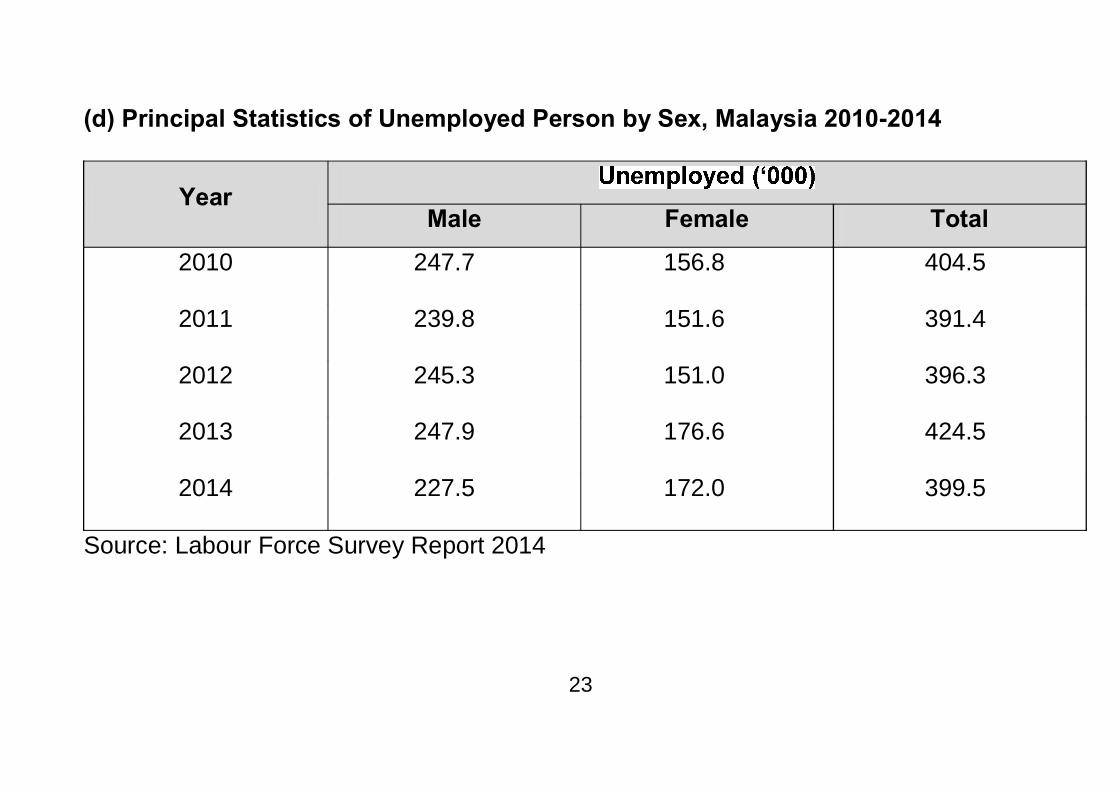
(d) Principal Statistics of Unemployed Person by Sex, Malaysia 2010-2014
Year
Male Female Total
2010 247.7 156.8 404.5
2011 239.8 151.6 391.4
2012 245.3 151.0 396.3
2013 247.9 176.6 424.5
2014 227.5 172.0 399.5
Source: Labour Force Survey Report 2014
23
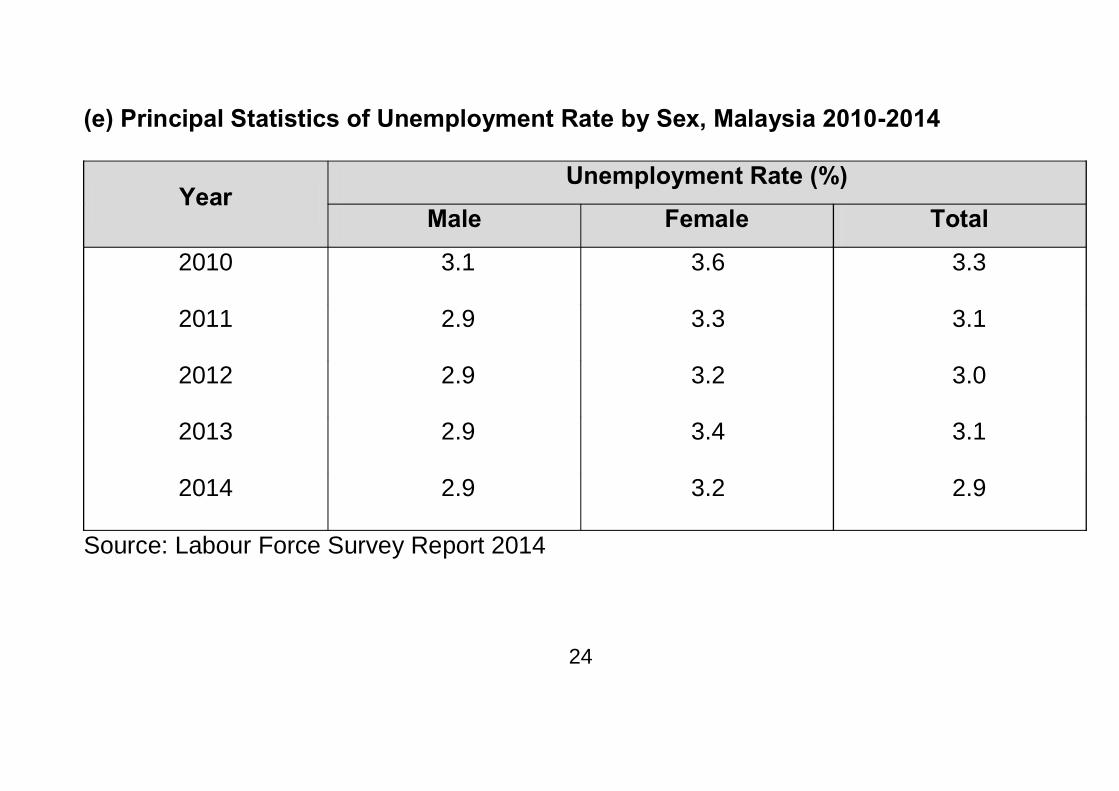
(e) Principal Statistics of Unemployment Rate by Sex, Malaysia 2010-2014
Year Unemployment Rate (%)
Male Female Total
2010 3.1 3.6 3.3
2011 2.9 3.3 3.1
2012 2.9 3.2 3.0
2013 2.9 3.4 3.1
2014 2.9 3.2 2.9
Source: Labour Force Survey Report 2014
24
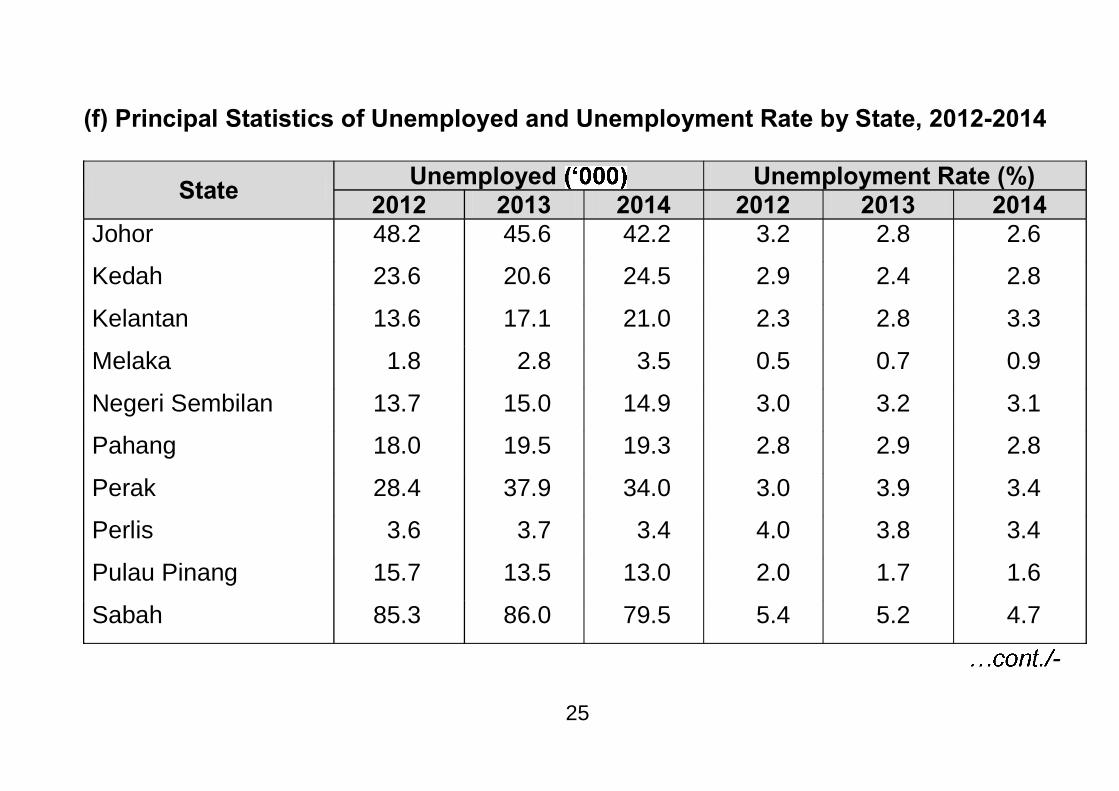
(f) Principal Statistics of Unemployed and Unemployment Rate by State, 2012-2014
State Unemployed Unemployment Rate (%) 2012 2013 2014 2012 2013 2014
Johor 48.2 45.6 42.2 3.2 2.8 2.6
Kedah 23.6 20.6 24.5 2.9 2.4 2.8
Kelantan 13.6 17.1 21.0 2.3 2.8 3.3
Melaka 1.8 2.8 3.5 0.5 0.7 0.9
Negeri Sembilan 13.7 15.0 14.9 3.0 3.2 3.1
Pahang 18.0 19.5 19.3 2.8 2.9 2.8
Perak 28.4 37.9 34.0 3.0 3.9 3.4
Perlis 3.6 3.7 3.4 4.0 3.8 3.4
Pulau Pinang 15.7 13.5 13.0 2.0 1.7 1.6
Sabah 85.3 86.0 79.5 5.4 5.2 4.7
-
25
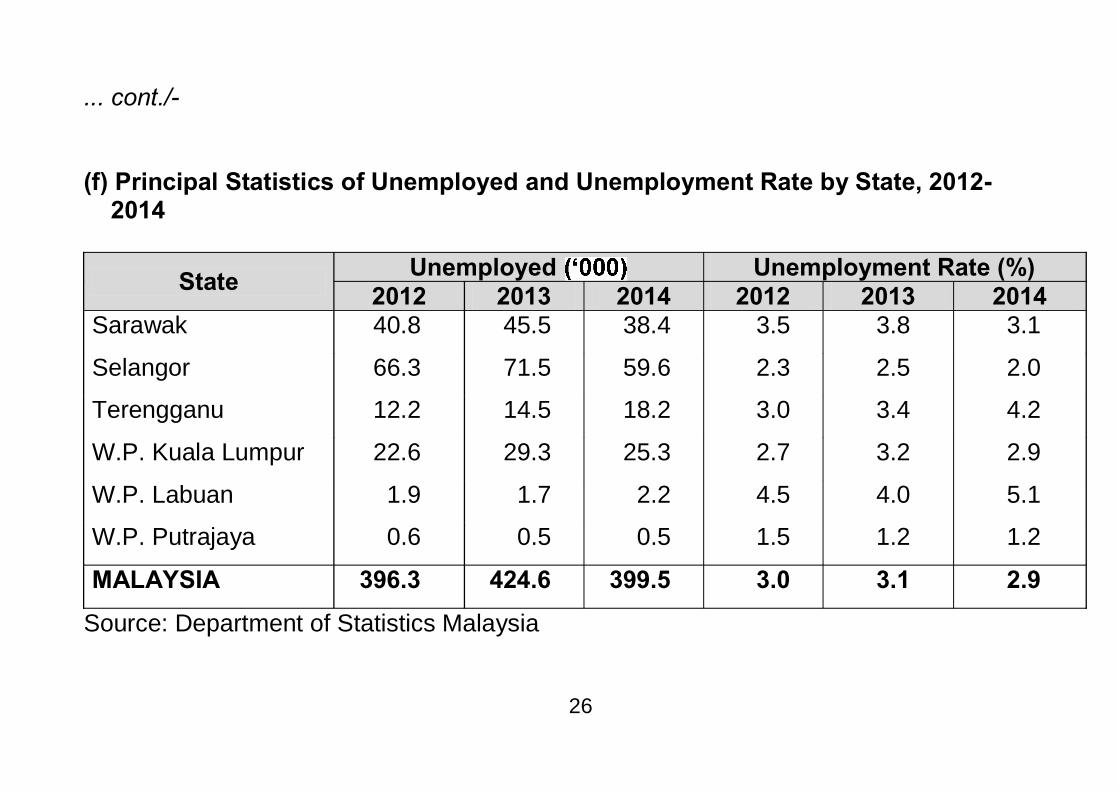
... cont./- (f) Principal Statistics of Unemployed and Unemployment Rate by State, 2012- 2014
State Unemployed Unemployment Rate (%) 2012 2013 2014 2012 2013 2014
Sarawak 40.8 45.5 38.4 3.5 3.8 3.1
Selangor 66.3 71.5 59.6 2.3 2.5 2.0
Terengganu 12.2 14.5 18.2 3.0 3.4 4.2
W.P. Kuala Lumpur 22.6 29.3 25.3 2.7 3.2 2.9
W.P. Labuan 1.9 1.7 2.2 4.5 4.0 5.1
W.P. Putrajaya 0.6 0.5 0.5 1.5 1.2 1.2
MALAYSIA 396.3 424.6 399.5 3.0 3.1 2.9
Source: Department of Statistics Malaysia
26
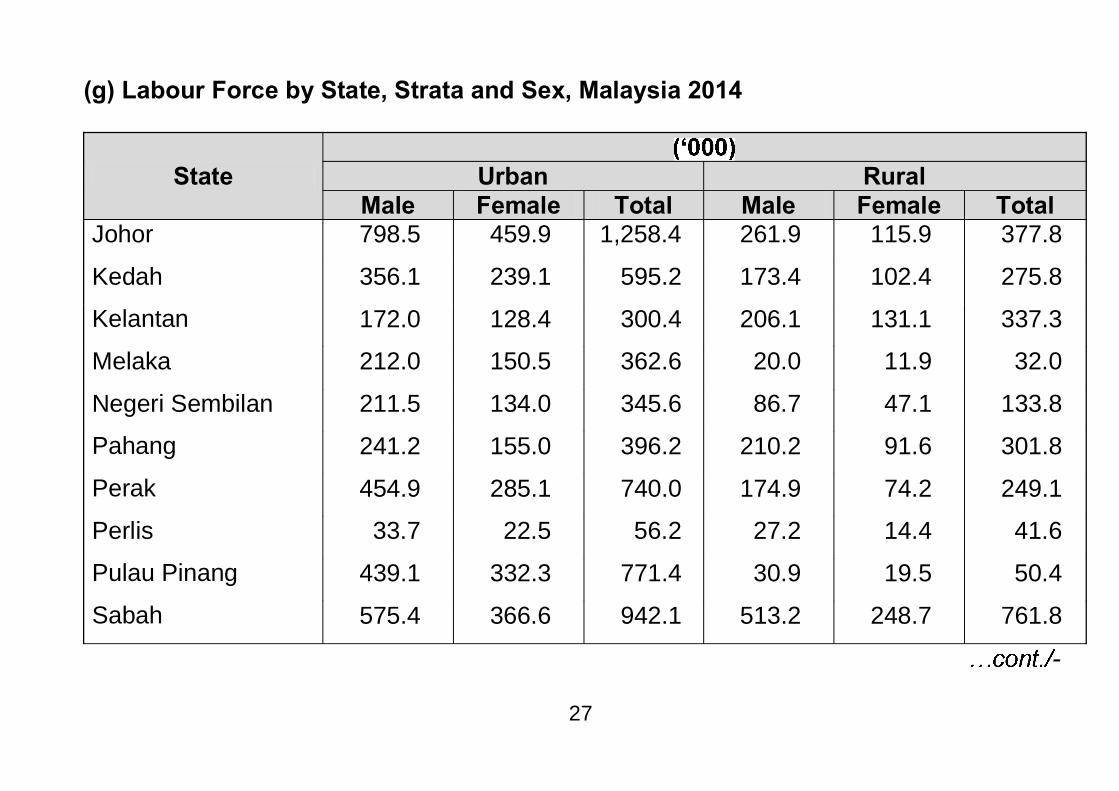
(g) Labour Force by State, Strata and Sex, Malaysia 2014
State
Urban Rural Male Female Total Male Female Total
Johor 798.5 459.9 1,258.4 261.9 115.9 377.8
Kedah 356.1 239.1 595.2 173.4 102.4 275.8
Kelantan 172.0 128.4 300.4 206.1 131.1 337.3
Melaka 212.0 150.5 362.6 20.0 11.9 32.0
Negeri Sembilan 211.5 134.0 345.6 86.7 47.1 133.8
Pahang 241.2 155.0 396.2 210.2 91.6 301.8
Perak 454.9 285.1 740.0 174.9 74.2 249.1
Perlis 33.7 22.5 56.2 27.2 14.4 41.6
Pulau Pinang 439.1 332.3 771.4 30.9 19.5 50.4
Sabah 575.4 366.6 942.1 513.2 248.7 761.8
-
27
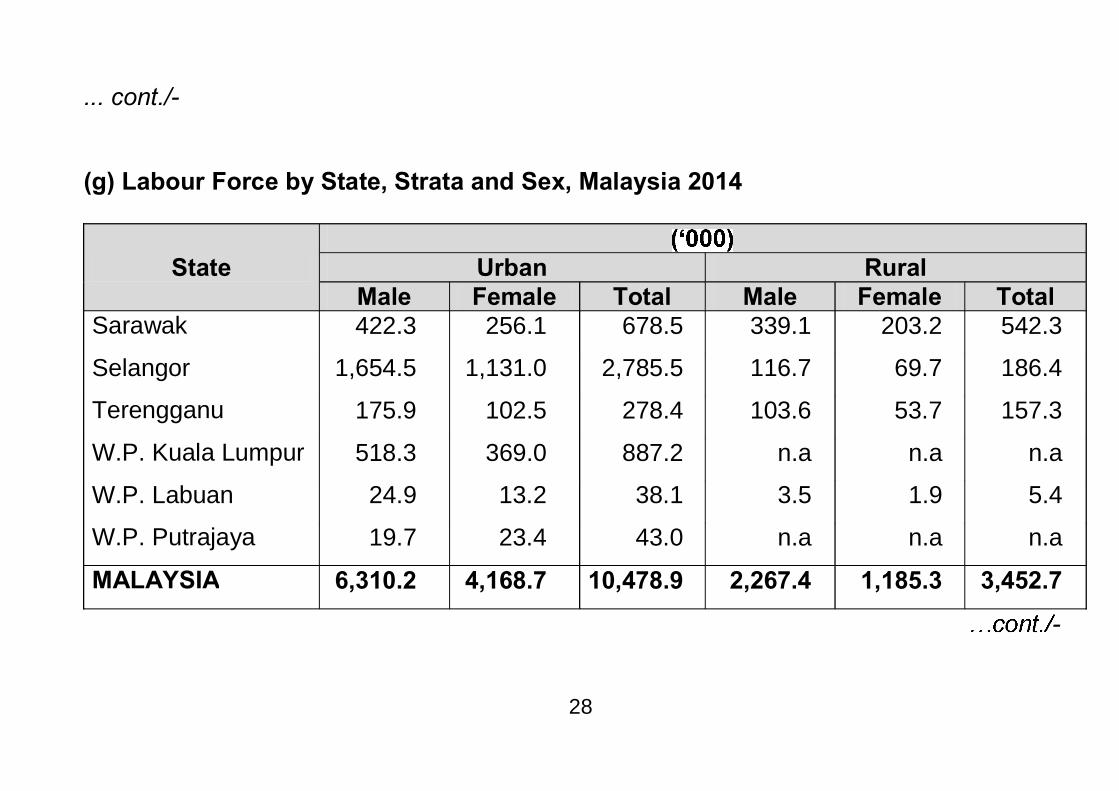
... cont./- (g) Labour Force by State, Strata and Sex, Malaysia 2014
State
Urban Rural Male Female Total Male Female Total
Sarawak 422.3 256.1 678.5 339.1 203.2 542.3
Selangor 1,654.5 1,131.0 2,785.5 116.7 69.7 186.4
Terengganu 175.9 102.5 278.4 103.6 53.7 157.3
W.P. Kuala Lumpur 518.3 369.0 887.2 n.a n.a n.a
W.P. Labuan 24.9 13.2 38.1 3.5 1.9 5.4
W.P. Putrajaya 19.7 23.4 43.0 n.a n.a n.a
MALAYSIA 6,310.2 4,168.7 10,478.9 2,267.4 1,185.3 3,452.7
-
28
-
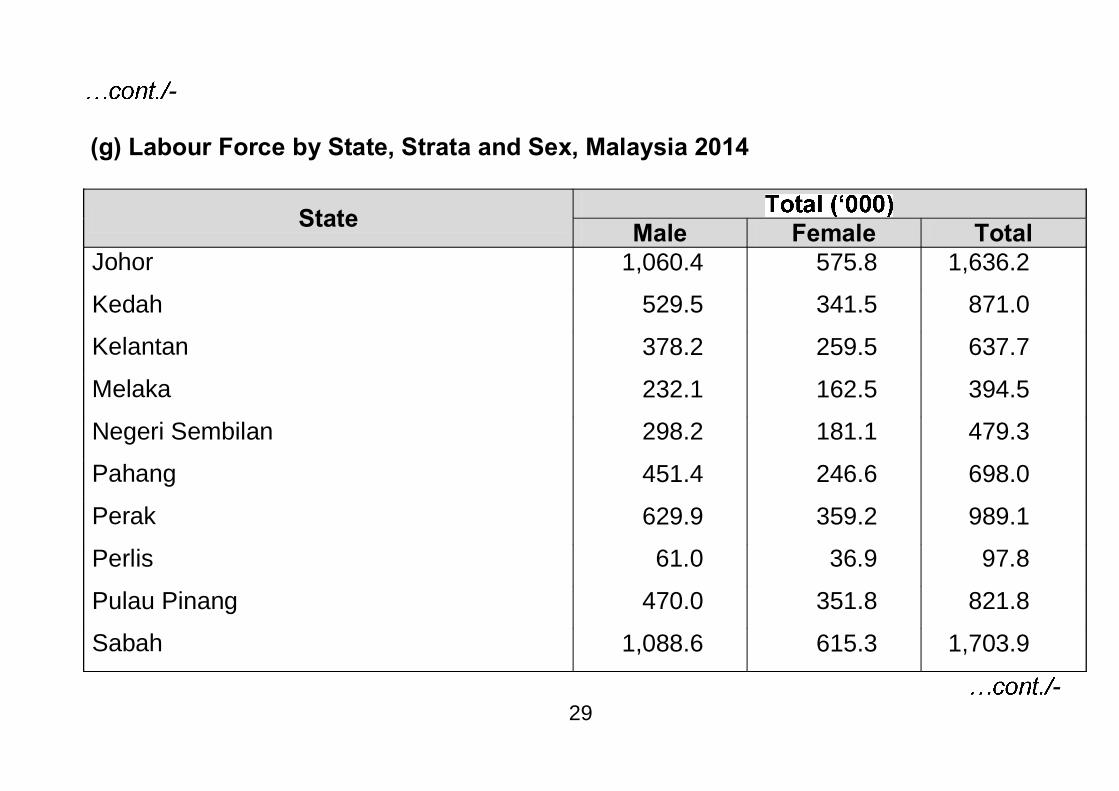
(g) Labour Force by State, Strata and Sex, Malaysia 2014
State Male Female Total
Johor 1,060.4 575.8 1,636.2
Kedah 529.5 341.5 871.0
Kelantan 378.2 259.5 637.7
Melaka 232.1 162.5 394.5
Negeri Sembilan 298.2 181.1 479.3
Pahang 451.4 246.6 698.0
Perak 629.9 359.2 989.1
Perlis 61.0 36.9 97.8
Pulau Pinang 470.0 351.8 821.8
Sabah 1,088.6 615.3 1,703.9
- 29
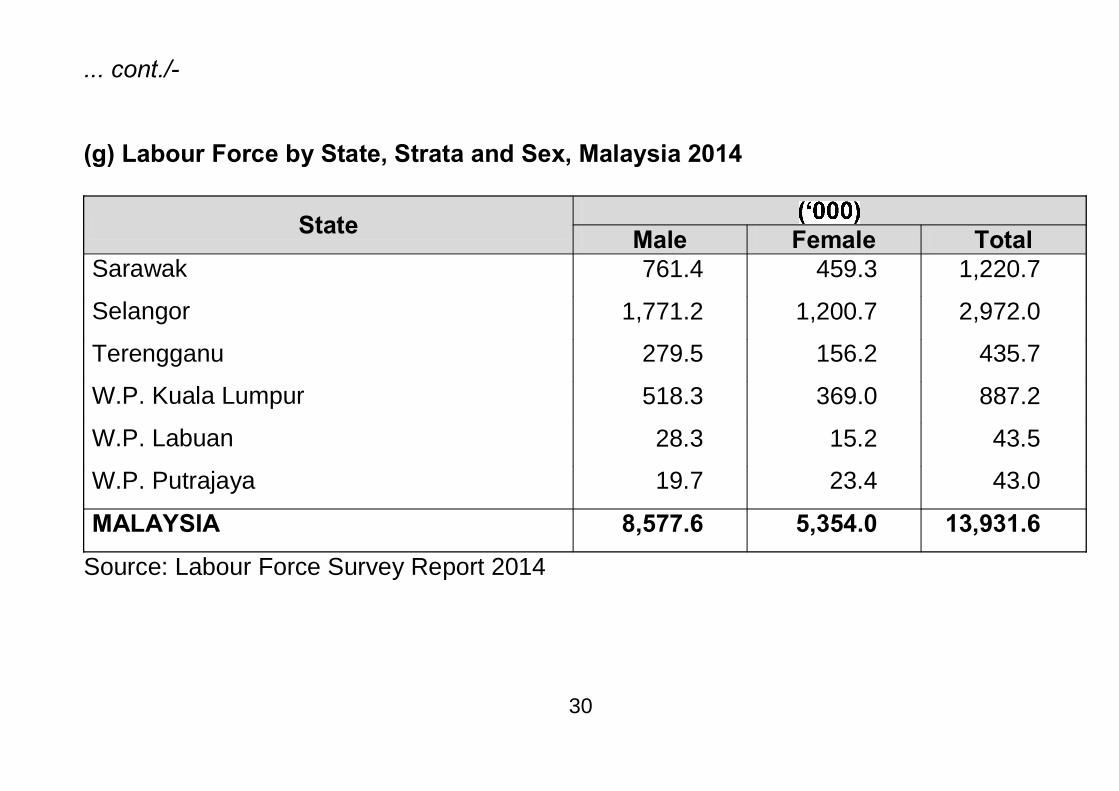
... cont./- (g) Labour Force by State, Strata and Sex, Malaysia 2014
State Male Female Total
Sarawak 761.4 459.3 1,220.7
Selangor 1,771.2 1,200.7 2,972.0
Terengganu 279.5 156.2 435.7
W.P. Kuala Lumpur 518.3 369.0 887.2
W.P. Labuan 28.3 15.2 43.5
W.P. Putrajaya 19.7 23.4 43.0
MALAYSIA 8,577.6 5,354.0 13,931.6
Source: Labour Force Survey Report 2014
30
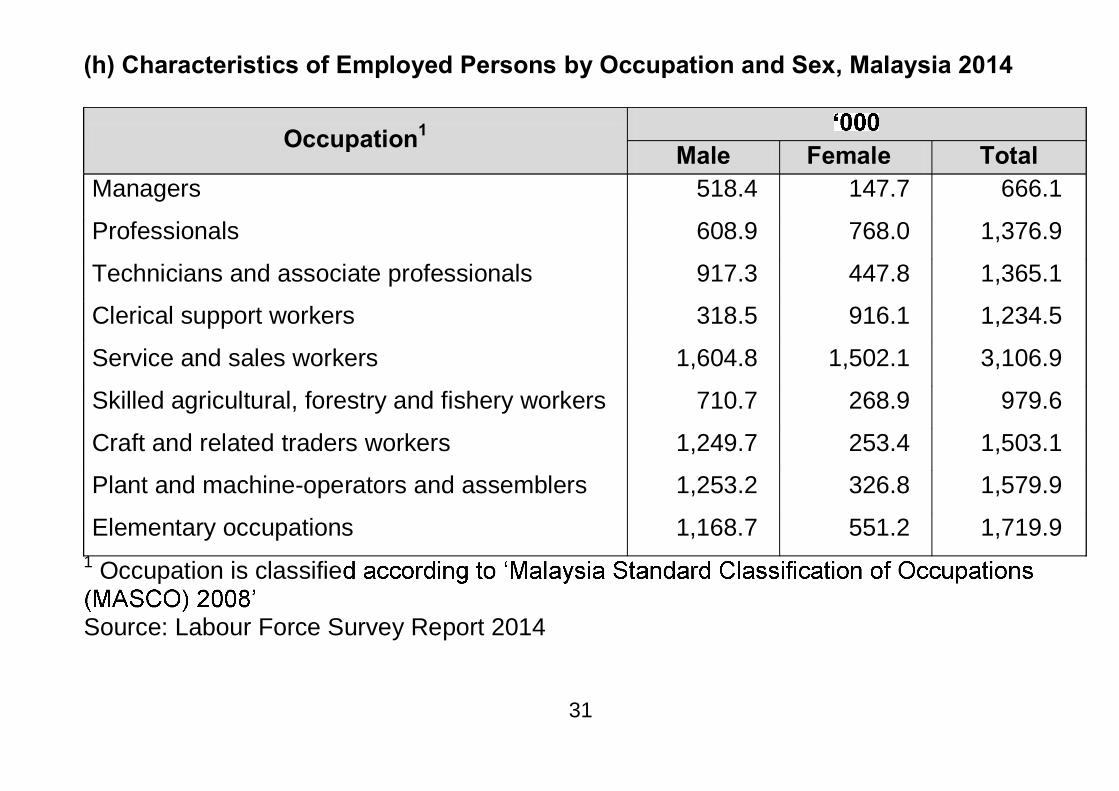
(h) Characteristics of Employed Persons by Occupation and Sex, Malaysia 2014
Occupation1 Male Female Total
Managers 518.4 147.7 666.1
Professionals 608.9 768.0 1,376.9
Technicians and associate professionals 917.3 447.8 1,365.1
Clerical support workers 318.5 916.1 1,234.5
Service and sales workers 1,604.8 1,502.1 3,106.9
Skilled agricultural, forestry and fishery workers 710.7 268.9 979.6
Craft and related traders workers 1,249.7 253.4 1,503.1
Plant and machine-operators and assemblers 1,253.2 326.8 1,579.9
Elementary occupations 1,168.7 551.2 1,719.9 1 Occupation is classifie
Source: Labour Force Survey Report 2014
31
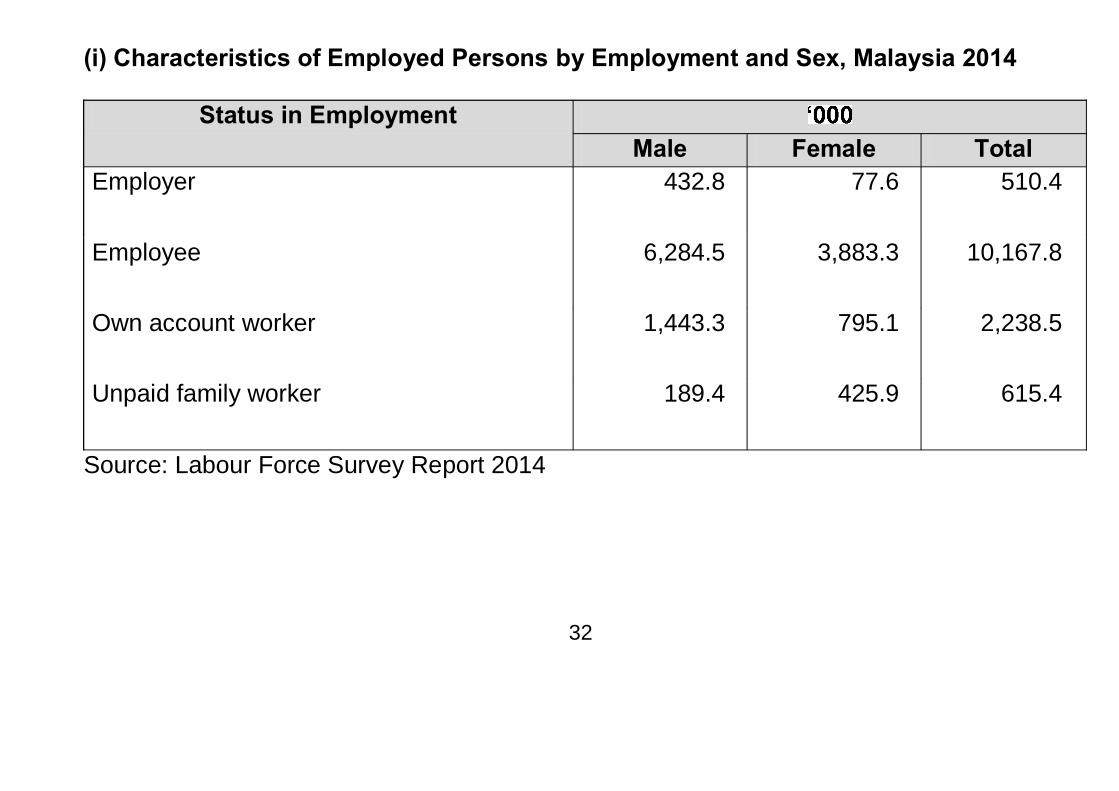
(i) Characteristics of Employed Persons by Employment and Sex, Malaysia 2014
Status in Employment Male Female Total
Employer 432.8 77.6 510.4
Employee 6,284.5 3,883.3 10,167.8
Own account worker 1,443.3 795.1 2,238.5
Unpaid family worker 189.4 425.9 615.4
Source: Labour Force Survey Report 2014
32
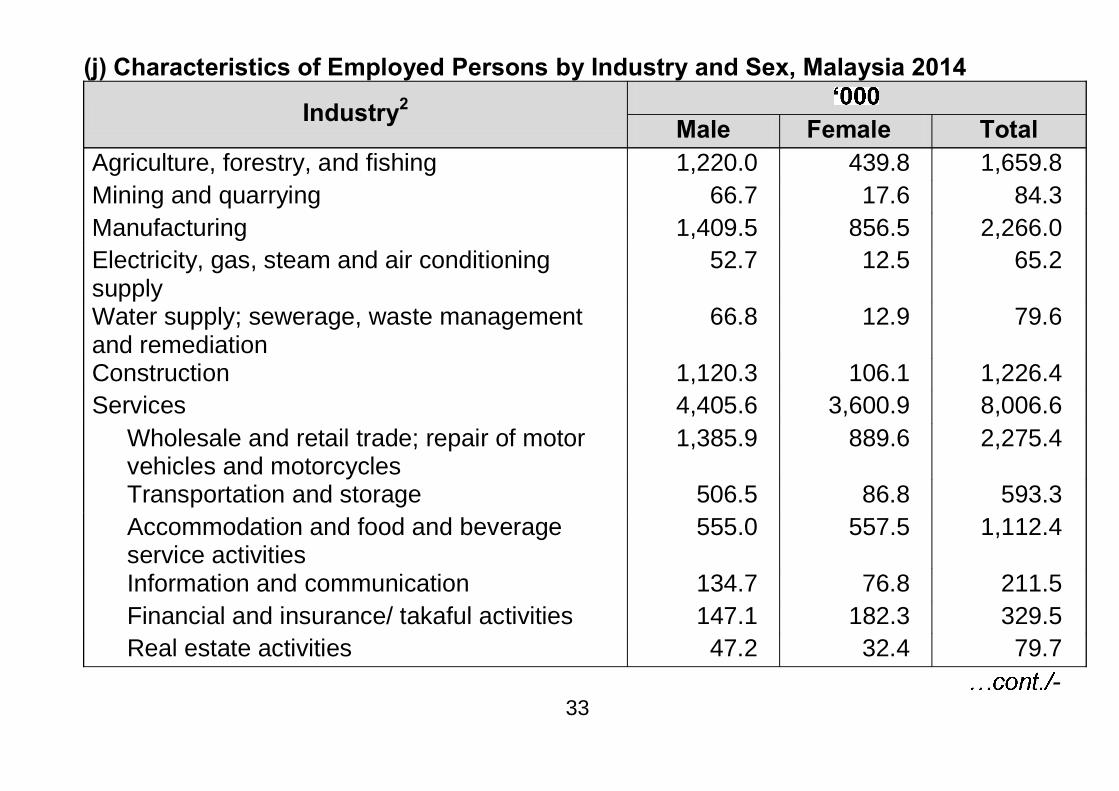
(j) Characteristics of Employed Persons by Industry and Sex, Malaysia 2014
Industry2 Male Female Total
Agriculture, forestry, and fishing 1,220.0 439.8 1,659.8 Mining and quarrying 66.7 17.6 84.3 Manufacturing 1,409.5 856.5 2,266.0 Electricity, gas, steam and air conditioning supply
52.7 12.5 65.2
Water supply; sewerage, waste management and remediation
66.8 12.9 79.6
Construction 1,120.3 106.1 1,226.4 Services 4,405.6 3,600.9 8,006.6
Wholesale and retail trade; repair of motor vehicles and motorcycles
1,385.9 889.6 2,275.4
Transportation and storage 506.5 86.8 593.3 Accommodation and food and beverage service activities
555.0 557.5 1,112.4
Information and communication 134.7 76.8 211.5 Financial and insurance/ takaful activities 147.1 182.3 329.5 Real estate activities 47.2 32.4 79.7
- 33
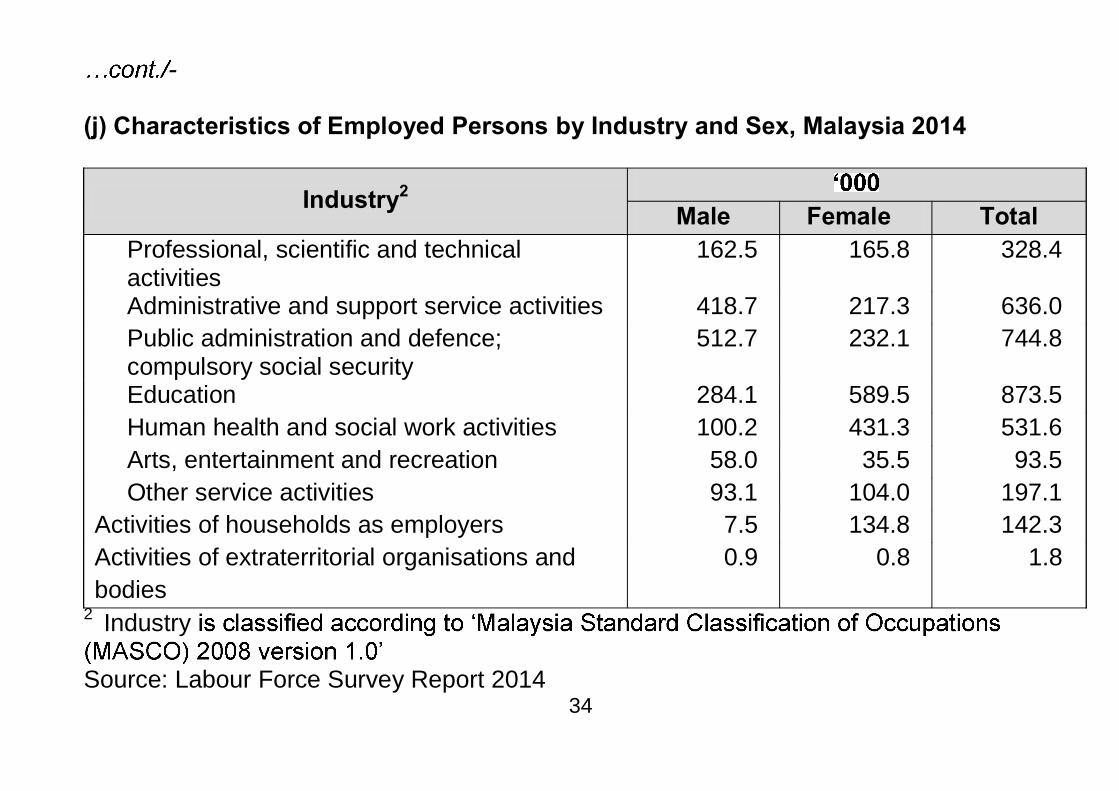
- (j) Characteristics of Employed Persons by Industry and Sex, Malaysia 2014
Industry2 Male Female Total
Professional, scientific and technical activities
162.5 165.8 328.4
Administrative and support service activities 418.7 217.3 636.0 Public administration and defence; compulsory social security
512.7 232.1 744.8
Education 284.1 589.5 873.5 Human health and social work activities 100.2 431.3 531.6 Arts, entertainment and recreation 58.0 35.5 93.5 Other service activities 93.1 104.0 197.1
Activities of households as employers 7.5 134.8 142.3 Activities of extraterritorial organisations and bodies
0.9 0.8 1.8
2 Industry
Source: Labour Force Survey Report 2014 34
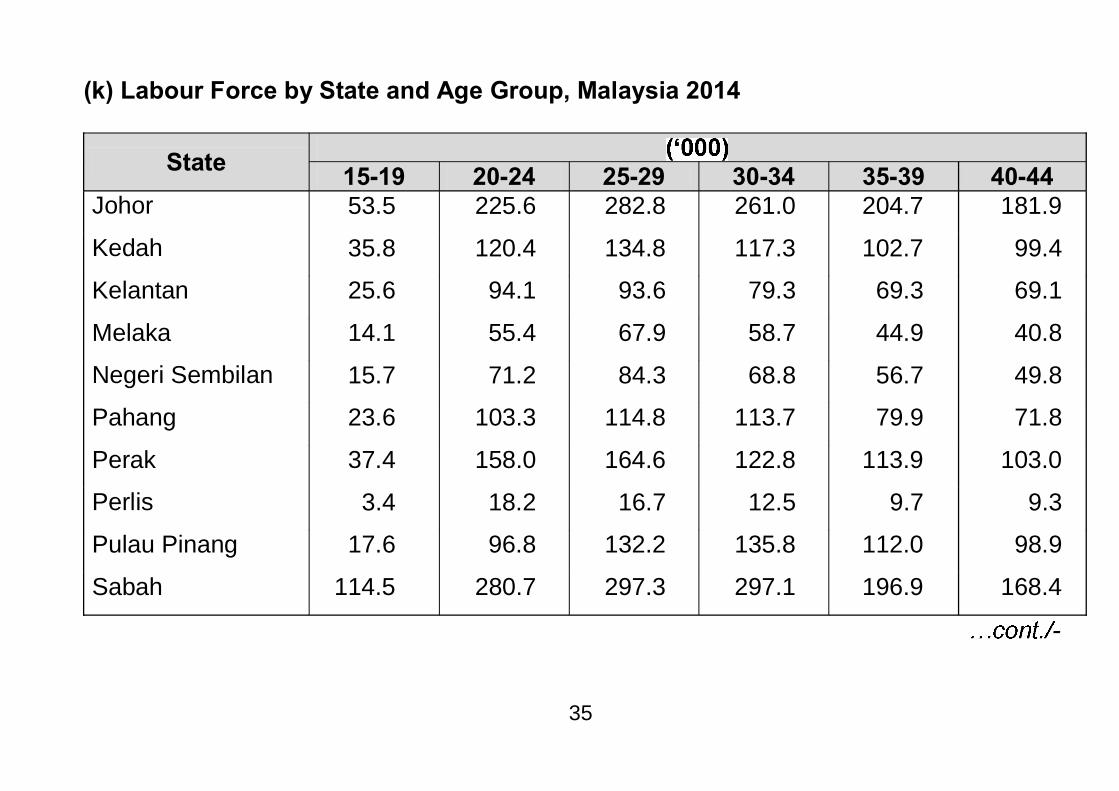
(k) Labour Force by State and Age Group, Malaysia 2014
State 15-19 20-24 25-29 30-34 35-39 40-44
Johor 53.5 225.6 282.8 261.0 204.7 181.9
Kedah 35.8 120.4 134.8 117.3 102.7 99.4
Kelantan 25.6 94.1 93.6 79.3 69.3 69.1
Melaka 14.1 55.4 67.9 58.7 44.9 40.8
Negeri Sembilan 15.7 71.2 84.3 68.8 56.7 49.8
Pahang 23.6 103.3 114.8 113.7 79.9 71.8
Perak 37.4 158.0 164.6 122.8 113.9 103.0
Perlis 3.4 18.2 16.7 12.5 9.7 9.3
Pulau Pinang 17.6 96.8 132.2 135.8 112.0 98.9
Sabah 114.5 280.7 297.3 297.1 196.9 168.4
-
35
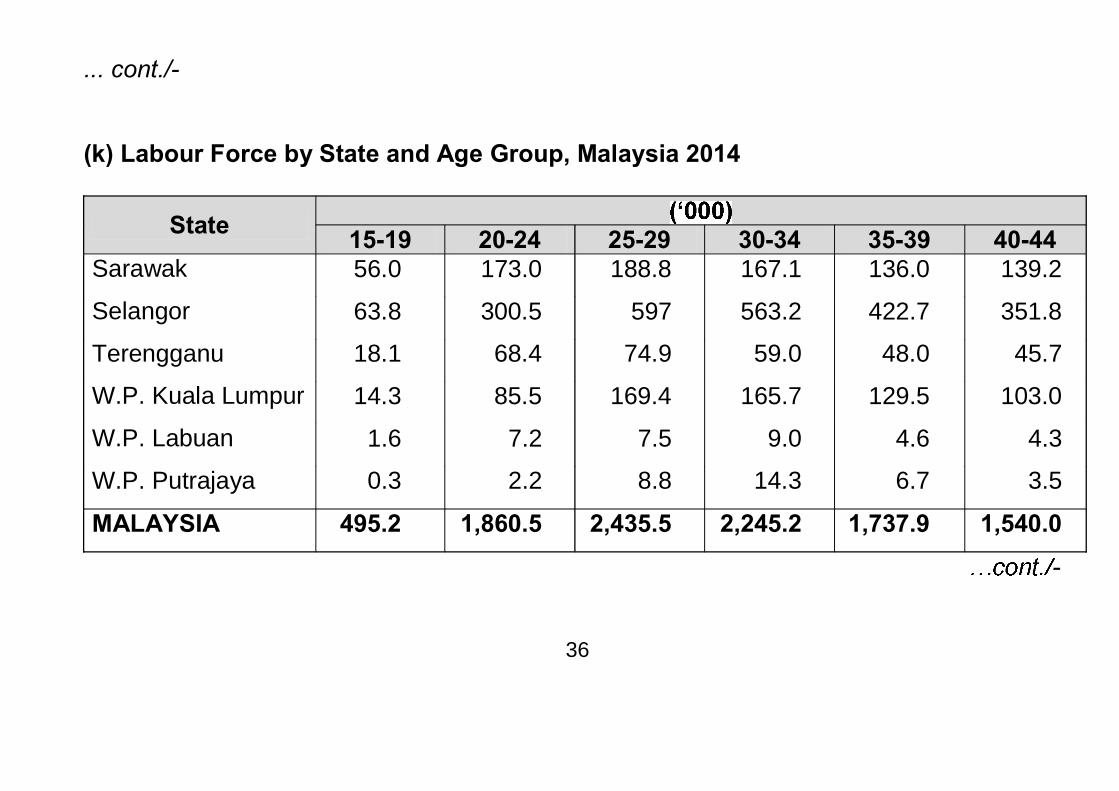
... cont./- (k) Labour Force by State and Age Group, Malaysia 2014
State 15-19 20-24 25-29 30-34 35-39 40-44
Sarawak 56.0 173.0 188.8 167.1 136.0 139.2
Selangor 63.8 300.5 597 563.2 422.7 351.8
Terengganu 18.1 68.4 74.9 59.0 48.0 45.7
W.P. Kuala Lumpur 14.3 85.5 169.4 165.7 129.5 103.0
W.P. Labuan 1.6 7.2 7.5 9.0 4.6 4.3
W.P. Putrajaya 0.3 2.2 8.8 14.3 6.7 3.5
MALAYSIA 495.2 1,860.5 2,435.5 2,245.2 1,737.9 1,540.0
-
36
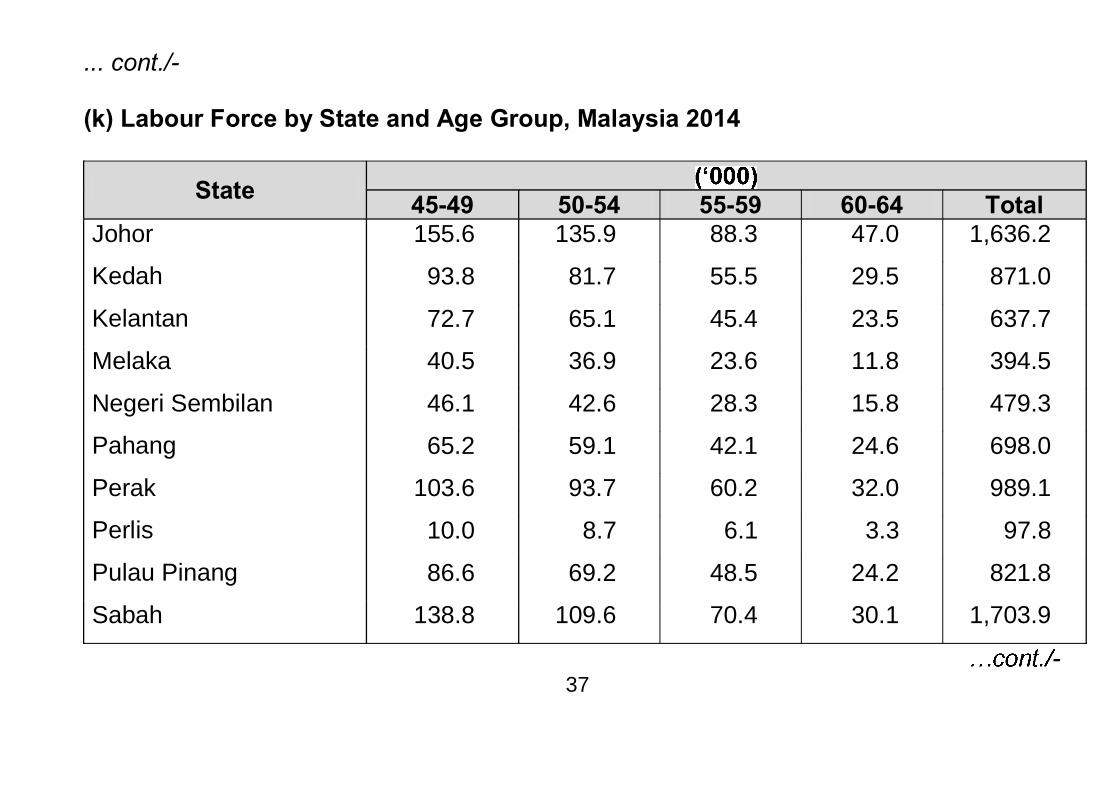
... cont./- (k) Labour Force by State and Age Group, Malaysia 2014
State 45-49 50-54 55-59 60-64 Total
Johor 155.6 135.9 88.3 47.0 1,636.2
Kedah 93.8 81.7 55.5 29.5 871.0
Kelantan 72.7 65.1 45.4 23.5 637.7
Melaka 40.5 36.9 23.6 11.8 394.5
Negeri Sembilan 46.1 42.6 28.3 15.8 479.3
Pahang 65.2 59.1 42.1 24.6 698.0
Perak 103.6 93.7 60.2 32.0 989.1
Perlis 10.0 8.7 6.1 3.3 97.8
Pulau Pinang 86.6 69.2 48.5 24.2 821.8
Sabah 138.8 109.6 70.4 30.1 1,703.9
- 37
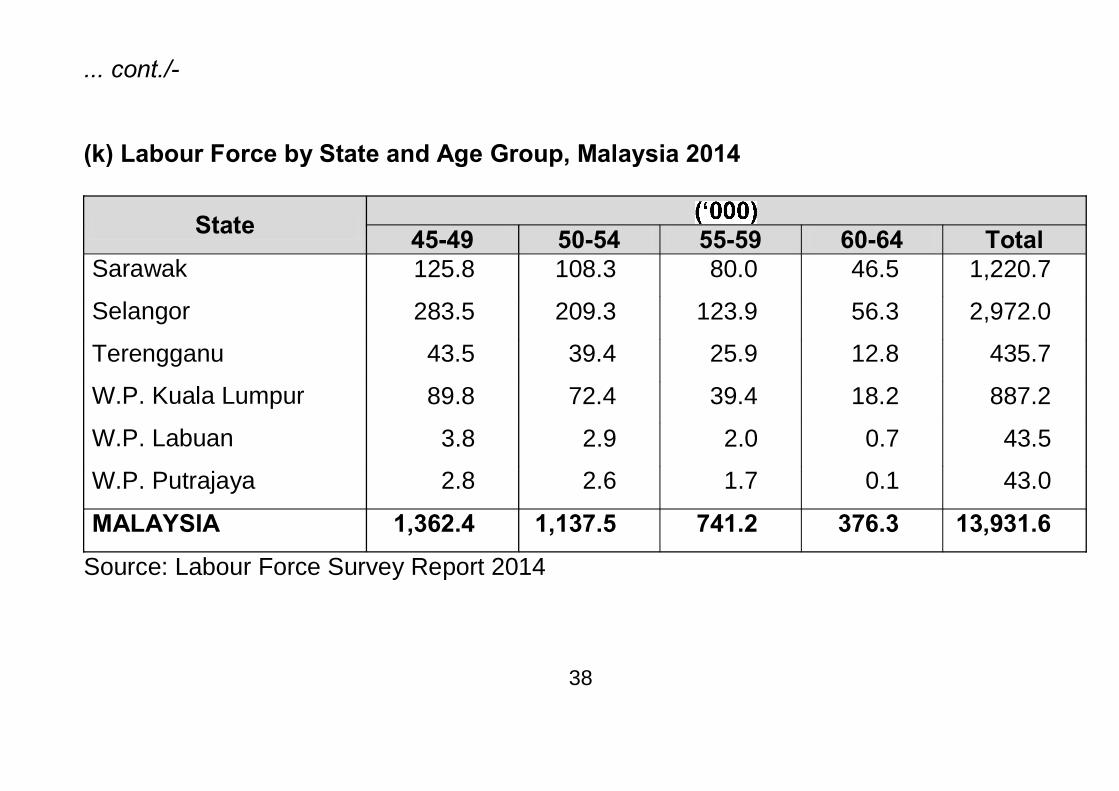
... cont./- (k) Labour Force by State and Age Group, Malaysia 2014
State 45-49 50-54 55-59 60-64 Total
Sarawak 125.8 108.3 80.0 46.5 1,220.7
Selangor 283.5 209.3 123.9 56.3 2,972.0
Terengganu 43.5 39.4 25.9 12.8 435.7
W.P. Kuala Lumpur 89.8 72.4 39.4 18.2 887.2
W.P. Labuan 3.8 2.9 2.0 0.7 43.5
W.P. Putrajaya 2.8 2.6 1.7 0.1 43.0
MALAYSIA 1,362.4 1,137.5 741.2 376.3 13,931.6
Source: Labour Force Survey Report 2014
38
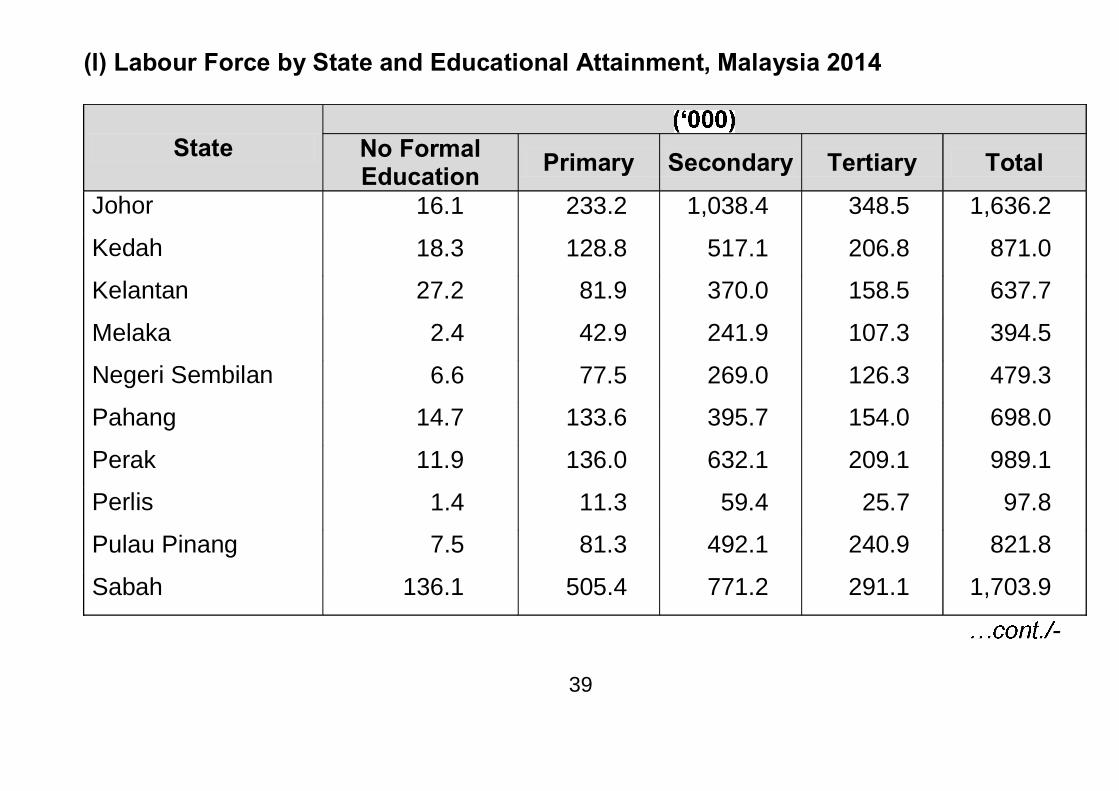
(l) Labour Force by State and Educational Attainment, Malaysia 2014
State
No Formal Education Primary Secondary Tertiary Total
Johor 16.1 233.2 1,038.4 348.5 1,636.2
Kedah 18.3 128.8 517.1 206.8 871.0
Kelantan 27.2 81.9 370.0 158.5 637.7
Melaka 2.4 42.9 241.9 107.3 394.5
Negeri Sembilan 6.6 77.5 269.0 126.3 479.3
Pahang 14.7 133.6 395.7 154.0 698.0
Perak 11.9 136.0 632.1 209.1 989.1
Perlis 1.4 11.3 59.4 25.7 97.8
Pulau Pinang 7.5 81.3 492.1 240.9 821.8
Sabah 136.1 505.4 771.2 291.1 1,703.9
-
39
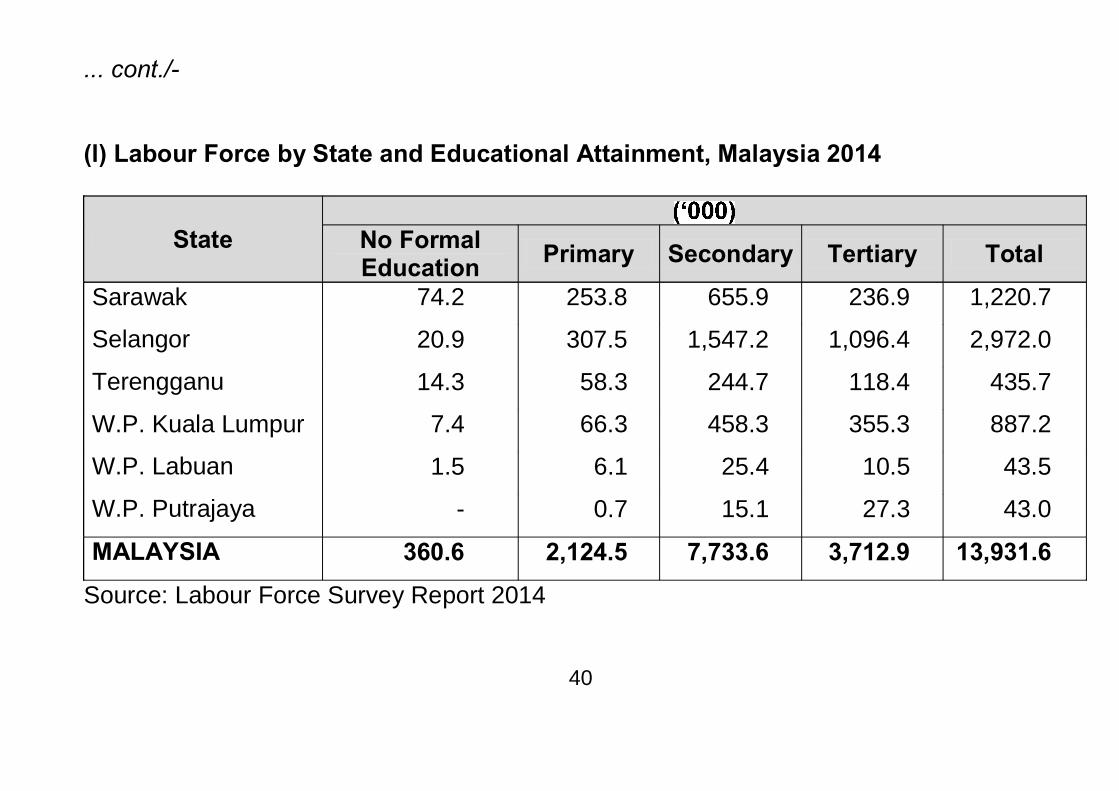
... cont./- (l) Labour Force by State and Educational Attainment, Malaysia 2014
State
No Formal Education Primary Secondary Tertiary Total
Sarawak 74.2 253.8 655.9 236.9 1,220.7
Selangor 20.9 307.5 1,547.2 1,096.4 2,972.0
Terengganu 14.3 58.3 244.7 118.4 435.7
W.P. Kuala Lumpur 7.4 66.3 458.3 355.3 887.2
W.P. Labuan 1.5 6.1 25.4 10.5 43.5
W.P. Putrajaya - 0.7 15.1 27.3 43.0
MALAYSIA 360.6 2,124.5 7,733.6 3,712.9 13,931.6
Source: Labour Force Survey Report 2014
40
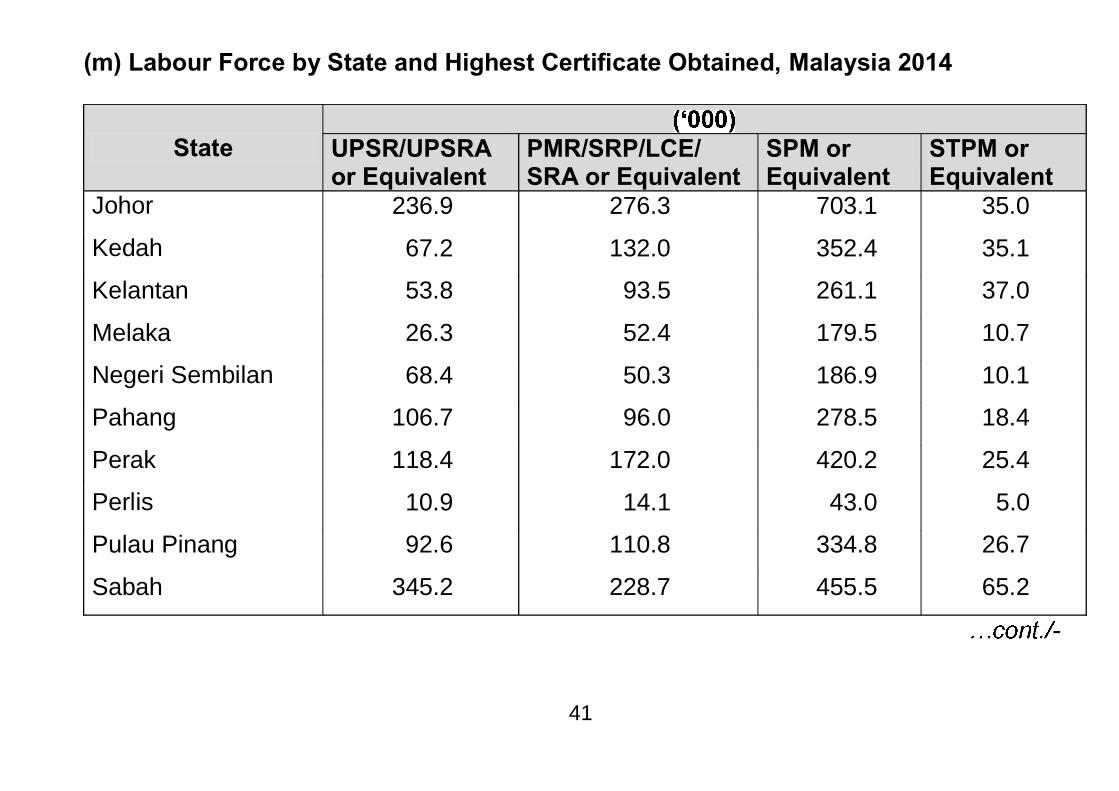
(m) Labour Force by State and Highest Certificate Obtained, Malaysia 2014
State
UPSR/UPSRA or Equivalent
PMR/SRP/LCE/ SRA or Equivalent
SPM or Equivalent
STPM or Equivalent
Johor 236.9 276.3 703.1 35.0
Kedah 67.2 132.0 352.4 35.1
Kelantan 53.8 93.5 261.1 37.0
Melaka 26.3 52.4 179.5 10.7
Negeri Sembilan 68.4 50.3 186.9 10.1
Pahang 106.7 96.0 278.5 18.4
Perak 118.4 172.0 420.2 25.4
Perlis 10.9 14.1 43.0 5.0
Pulau Pinang 92.6 110.8 334.8 26.7
Sabah 345.2 228.7 455.5 65.2
-
41
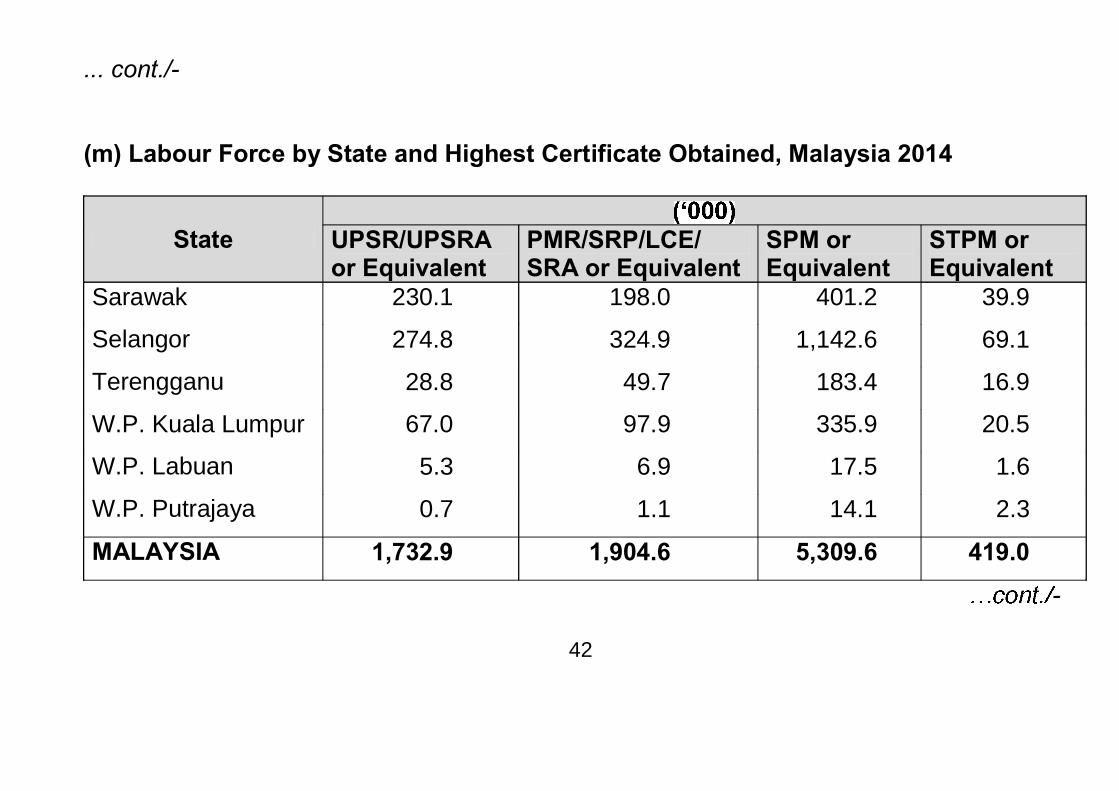
... cont./- (m) Labour Force by State and Highest Certificate Obtained, Malaysia 2014
State
UPSR/UPSRA or Equivalent
PMR/SRP/LCE/ SRA or Equivalent
SPM or Equivalent
STPM or Equivalent
Sarawak 230.1 198.0 401.2 39.9
Selangor 274.8 324.9 1,142.6 69.1
Terengganu 28.8 49.7 183.4 16.9
W.P. Kuala Lumpur 67.0 97.9 335.9 20.5
W.P. Labuan 5.3 6.9 17.5 1.6
W.P. Putrajaya 0.7 1.1 14.1 2.3
MALAYSIA 1,732.9 1,904.6 5,309.6 419.0
-
42
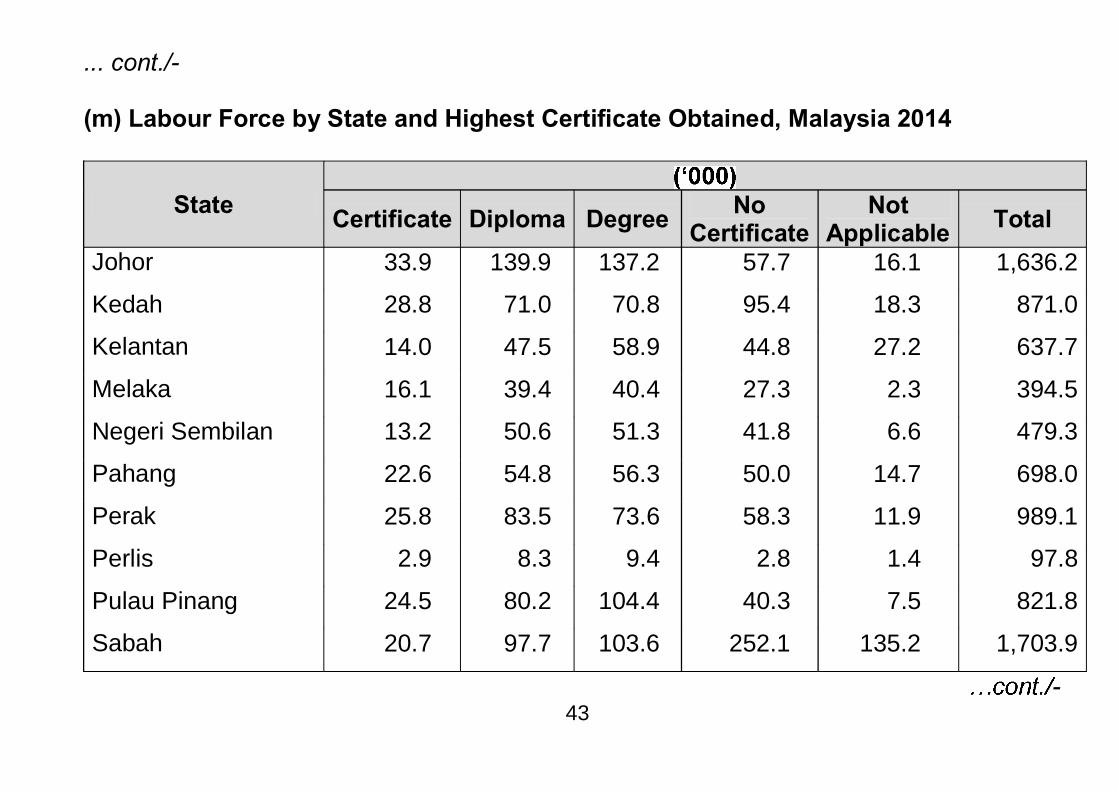
... cont./- (m) Labour Force by State and Highest Certificate Obtained, Malaysia 2014
State
Certificate Diploma Degree No Certificate
Not Applicable Total
Johor 33.9 139.9 137.2 57.7 16.1 1,636.2
Kedah 28.8 71.0 70.8 95.4 18.3 871.0
Kelantan 14.0 47.5 58.9 44.8 27.2 637.7
Melaka 16.1 39.4 40.4 27.3 2.3 394.5
Negeri Sembilan 13.2 50.6 51.3 41.8 6.6 479.3
Pahang 22.6 54.8 56.3 50.0 14.7 698.0
Perak 25.8 83.5 73.6 58.3 11.9 989.1
Perlis 2.9 8.3 9.4 2.8 1.4 97.8
Pulau Pinang 24.5 80.2 104.4 40.3 7.5 821.8
Sabah 20.7 97.7 103.6 252.1 135.2 1,703.9
- 43
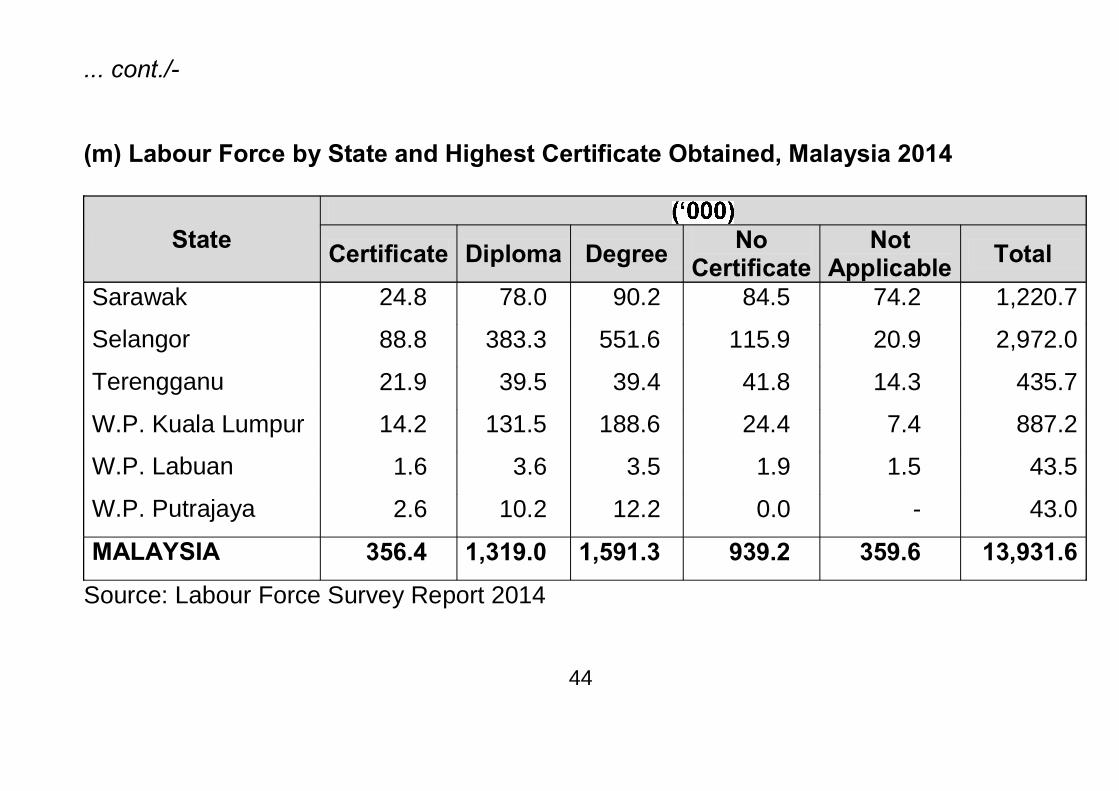
... cont./- (m) Labour Force by State and Highest Certificate Obtained, Malaysia 2014
State
Certificate Diploma Degree No Certificate
Not Applicable Total
Sarawak 24.8 78.0 90.2 84.5 74.2 1,220.7
Selangor 88.8 383.3 551.6 115.9 20.9 2,972.0
Terengganu 21.9 39.5 39.4 41.8 14.3 435.7
W.P. Kuala Lumpur 14.2 131.5 188.6 24.4 7.4 887.2
W.P. Labuan 1.6 3.6 3.5 1.9 1.5 43.5
W.P. Putrajaya 2.6 10.2 12.2 0.0 - 43.0
MALAYSIA 356.4 1,319.0 1,591.3 939.2 359.6 13,931.6
Source: Labour Force Survey Report 2014
44
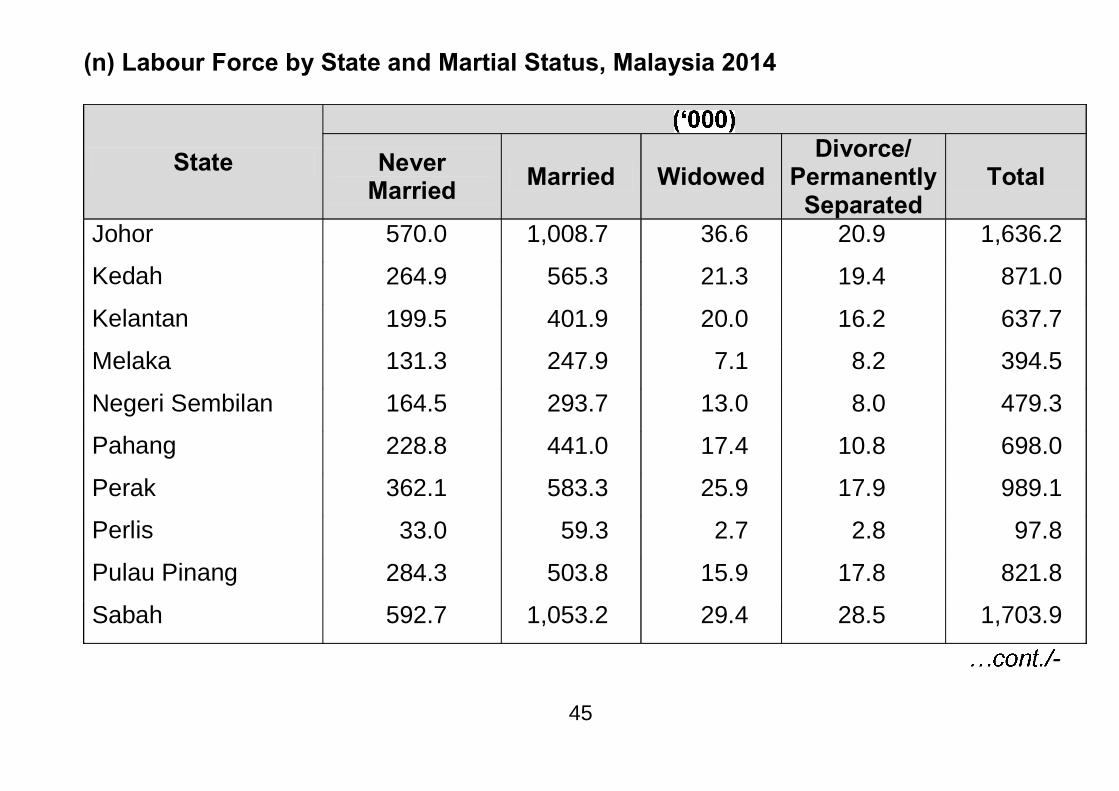
(n) Labour Force by State and Martial Status, Malaysia 2014
State
Never Married Married Widowed
Divorce/ Permanently
Separated Total
Johor 570.0 1,008.7 36.6 20.9 1,636.2
Kedah 264.9 565.3 21.3 19.4 871.0
Kelantan 199.5 401.9 20.0 16.2 637.7
Melaka 131.3 247.9 7.1 8.2 394.5
Negeri Sembilan 164.5 293.7 13.0 8.0 479.3
Pahang 228.8 441.0 17.4 10.8 698.0
Perak 362.1 583.3 25.9 17.9 989.1
Perlis 33.0 59.3 2.7 2.8 97.8
Pulau Pinang 284.3 503.8 15.9 17.8 821.8
Sabah 592.7 1,053.2 29.4 28.5 1,703.9
-
45
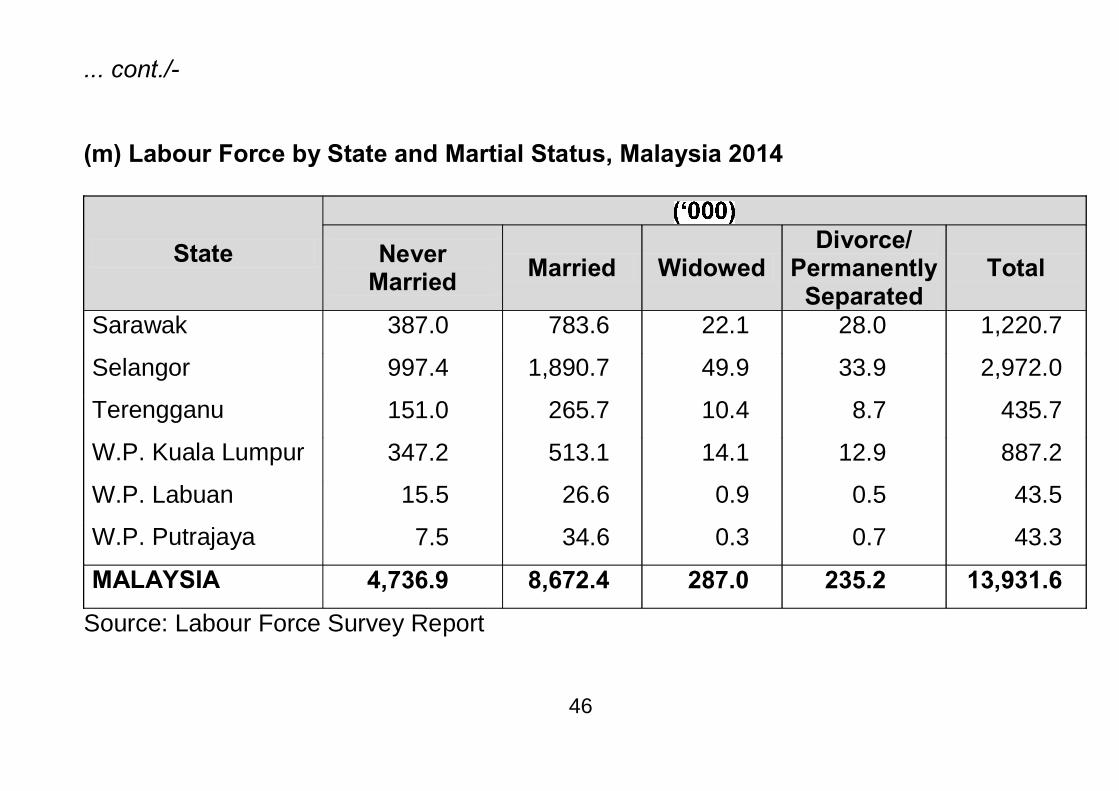
... cont./- (m) Labour Force by State and Martial Status, Malaysia 2014
State
Never Married Married Widowed
Divorce/ Permanently
Separated Total
Sarawak 387.0 783.6 22.1 28.0 1,220.7
Selangor 997.4 1,890.7 49.9 33.9 2,972.0
Terengganu 151.0 265.7 10.4 8.7 435.7
W.P. Kuala Lumpur 347.2 513.1 14.1 12.9 887.2
W.P. Labuan 15.5 26.6 0.9 0.5 43.5
W.P. Putrajaya 7.5 34.6 0.3 0.7 43.3
MALAYSIA 4,736.9 8,672.4 287.0 235.2 13,931.6
Source: Labour Force Survey Report
46
INSTITUTE FOR DEVELOPMENT STUDIES (SABAH) INSTITUT KAJIAN PEMBANGUNAN (SABAH)
Lot 2 5, Wisma SEDIA, Off Jalan Pintas, 88300 Penampang Locked Bag 127, 88994 Kota Kinabalu, Sabah, Malaysia : (088) 450500 (20 lines), Homepage: http://www.ids.org.my
Fax: (088) 450599, E-Mail: [email protected]