Embed Size (px)
Citation preview
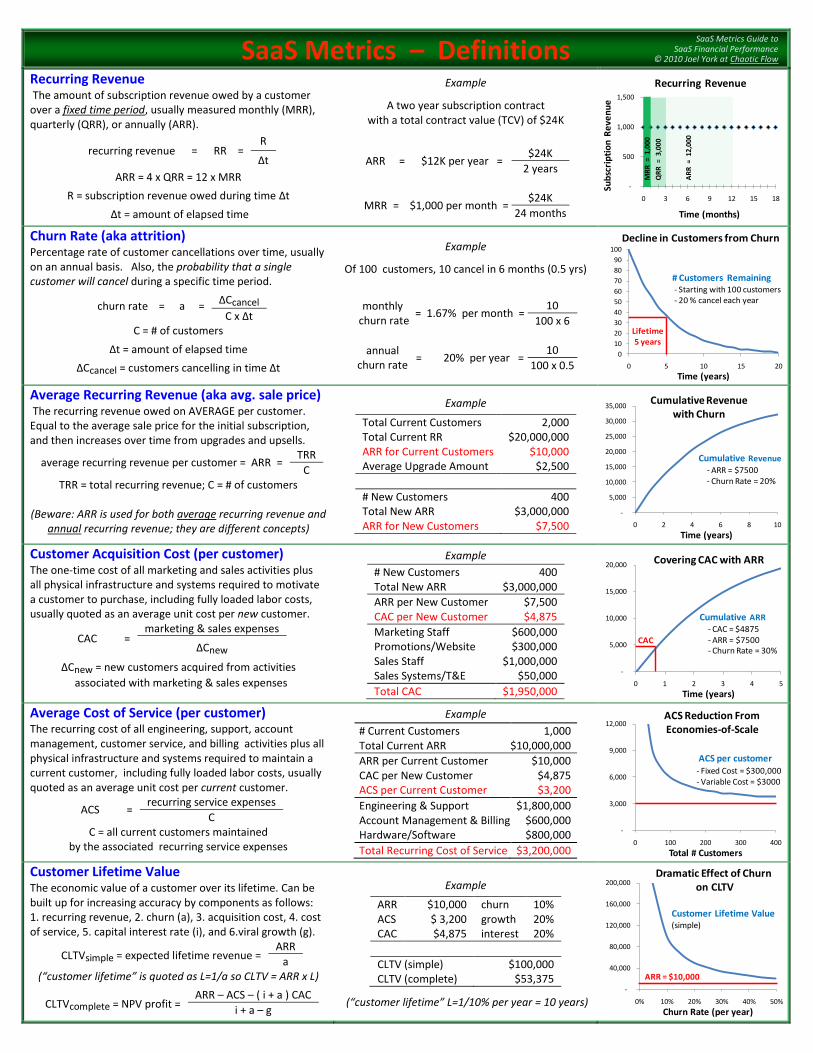
Recurring Revenue The amount of subscription revenue owed by a customer over a fixed time period, usually measured monthly (MRR), quarterly (QRR), or annually (ARR).
recurring revenue = RR = R
Δt
ARR = 4 x QRR = 12 x MRR
R = subscription revenue owed during time Δt
Δt = amount of elapsed time
Example
A two year subscription contract with a total contract value (TCV) of $24K
ARR = $12K per year = $24K
2 years
MRR = $1,000 per month = $24K
24 months
Churn Rate (aka attrition) Percentage rate of customer cancellations over time, usually on an annual basis. Also, the probability that a single customer will cancel during a specific time period.
churn rate = a = ΔCcancel
C x Δt C = # of customers
Δt = amount of elapsed time
ΔCcancel = customers cancelling in time Δt
Example
Of 100 customers, 10 cancel in 6 months (0.5 yrs)
monthly churn rate
= 1.67% per month = 10
100 x 6
annual churn rate
= 20% per year = 10
100 x 0.5
Average Recurring Revenue (aka avg. sale price) The recurring revenue owed on AVERAGE per customer. Equal to the average sale price for the initial subscription, and then increases over time from upgrades and upsells.
average recurring revenue per customer = ARR = TRR
C TRR = total recurring revenue; C = # of customers
(Beware: ARR is used for both average recurring revenue and
annual recurring revenue; they are different concepts)
Example
Total Current Customers 2,000 Total Current RR $20,000,000 ARR for Current Customers $10,000 Average Upgrade Amount $2,500
# New Customers 400 Total New ARR $3,000,000 ARR for New Customers $7,500
Customer Acquisition Cost (per customer) The one-time cost of all marketing and sales activities plus all physical infrastructure and systems required to motivate a customer to purchase, including fully loaded labor costs, usually quoted as an average unit cost per new customer.
CAC = marketing & sales expenses
ΔCnew
ΔCnew = new customers acquired from activities
associated with marketing & sales expenses
Example
# New Customers 400 Total New ARR $3,000,000
ARR per New Customer $7,500 CAC per New Customer $4,875
Marketing Staff $600,000 Promotions/Website $300,000 Sales Staff $1,000,000 Sales Systems/T&E $50,000
Total CAC $1,950,000
Average Cost of Service (per customer) The recurring cost of all engineering, support, account management, customer service, and billing activities plus all physical infrastructure and systems required to maintain a current customer, including fully loaded labor costs, usually quoted as an average unit cost per current customer.
ACS = recurring service expenses
C C = all current customers maintained
by the associated recurring service expenses
Example
# Current Customers 1,000 Total Current ARR $10,000,000
ARR per Current Customer $10,000 CAC per New Customer $4,875 ACS per Current Customer $3,200
Engineering & Support $1,800,000 Account Management & Billing $600,000 Hardware/Software $800,000
Total Recurring Cost of Service $3,200,000
Customer Lifetime Value The economic value of a customer over its lifetime. Can be built up for increasing accuracy by components as follows: 1. recurring revenue, 2. churn (a), 3. acquisition cost, 4. cost of service, 5. capital interest rate (i), and 6.viral growth (g).
CLTVsimple = expected lifetime revenue = ARR
a (“customer lifetime” is quoted as L=1/a so CLTV = ARR x L)
CLTVcomplete = NPV profit = ARR – ACS – ( i + a ) CAC
i + a – g
Example
ARR $10,000 churn 10% ACS $ 3,200 growth 20% CAC $4,875 interest 20%
CLTV (simple) $100,000 CLTV (complete) $53,375
(“customer lifetime” L=1/10% per year = 10 years)
-
500
1,000
1,500
0 3 6 9 12 15 18
Sub
scri
pti
on
Re
ven
ue
Time (months)
Recurring Revenue
AR
R =
12
,00
0
QR
R =
3,0
00
MR
R =
1,0
00
0
10
20
30
40
50
60
70
80
90
100
0 5 10 15 20
Time (years)
# Customers Remaining- Starting with 100 customers- 20 % cancel each year
Lifetime5 years
Decline in Customers from Churn
-
5,000
10,000
15,000
20,000
25,000
30,000
35,000
0 2 4 6 8 10
Time (years)
Cumulative Revenue with Churn
Cumulative Revenue
- ARR = $7500- Churn Rate = 20%
-
5,000
10,000
15,000
20,000
0 1 2 3 4 5
Time (years)
Covering CAC with ARR
Cumulative ARR
- CAC = $4875- ARR = $7500- Churn Rate = 30%
CAC
-
3,000
6,000
9,000
12,000
0 100 200 300 400
Total # Customers
ACS Reduction FromEconomies-of-Scale
ACS per customer- Fixed Cost = $300,000- Variable Cost = $3000
-
40,000
80,000
120,000
160,000
200,000
0% 10% 20% 30% 40% 50%
Churn Rate (per year)
Dramatic Effect of Churnon CLTV
Customer Lifetime Value(simple)
ARR = $10,000
SaaS Metrics – Definitions SaaS Metrics Guide to
SaaS Financial Performance © 2010 Joel York at Chaotic Flow
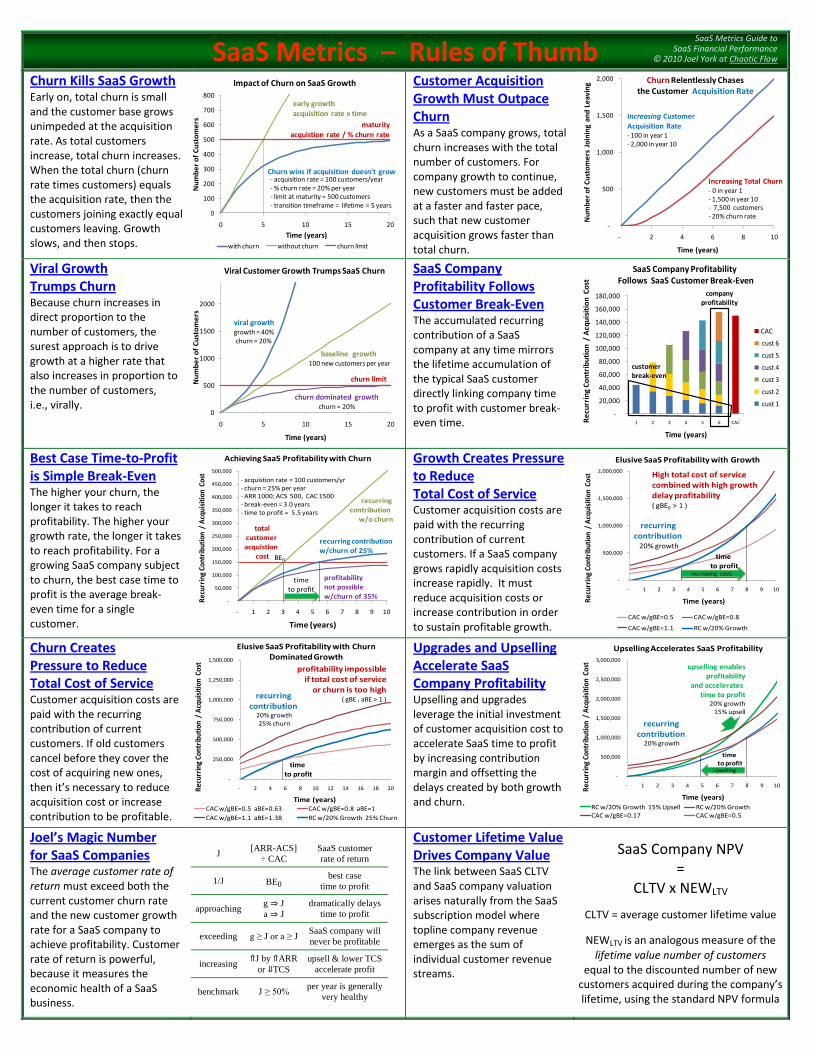
Churn Kills SaaS Growth Early on, total churn is small and the customer base grows unimpeded at the acquisition rate. As total customers increase, total churn increases. When the total churn (churn rate times customers) equals the acquisition rate, then the customers joining exactly equal customers leaving. Growth slows, and then stops.
Customer Acquisition Growth Must Outpace Churn As a SaaS company grows, total churn increases with the total number of customers. For company growth to continue, new customers must be added at a faster and faster pace, such that new customer acquisition grows faster than total churn.
Viral Growth Trumps Churn Because churn increases in direct proportion to the number of customers, the surest approach is to drive growth at a higher rate that also increases in proportion to the number of customers, i.e., virally.
SaaS Company Profitability Follows Customer Break-Even The accumulated recurring contribution of a SaaS company at any time mirrors the lifetime accumulation of the typical SaaS customer directly linking company time to profit with customer break-even time.
Best Case Time-to-Profit is Simple Break-Even The higher your churn, the longer it takes to reach profitability. The higher your growth rate, the longer it takes to reach profitability. For a growing SaaS company subject to churn, the best case time to profit is the average break-even time for a single customer.
Growth Creates Pressure to Reduce Total Cost of Service Customer acquisition costs are paid with the recurring contribution of current customers. If a SaaS company grows rapidly acquisition costs increase rapidly. It must reduce acquisition costs or increase contribution in order to sustain profitable growth.
Churn Creates Pressure to Reduce Total Cost of Service Customer acquisition costs are paid with the recurring contribution of current customers. If old customers cancel before they cover the cost of acquiring new ones, then it’s necessary to reduce acquisition cost or increase contribution to be profitable.
Upgrades and Upselling Accelerate SaaS Company Profitability Upselling and upgrades leverage the initial investment of customer acquisition cost to accelerate SaaS time to profit by increasing contribution margin and offsetting the delays created by both growth and churn.
Joel’s Magic Number for SaaS Companies The average customer rate of return must exceed both the current customer churn rate and the new customer growth rate for a SaaS company to achieve profitability. Customer rate of return is powerful, because it measures the economic health of a SaaS business.
J [ARR-ACS]
÷ CAC
SaaS customer
rate of return
1/J BE0 best case
time to profit
approaching g ⇒ J
a ⇒ J
dramatically delays
time to profit
exceeding g ≥ J or a ≥ J SaaS company will
never be profitable
increasing ⇑J by ⇑ARR
or ⇓TCS
upsell & lower TCS
accelerate profit
benchmark J ≥ 50% per year is generally
very healthy
Customer Lifetime Value Drives Company Value The link between SaaS CLTV and SaaS company valuation arises naturally from the SaaS subscription model where topline company revenue emerges as the sum of individual customer revenue streams.
SaaS Company NPV =
CLTV x NEWLTV
CLTV = average customer lifetime value
NEWLTV is an analogous measure of the
lifetime value number of customers equal to the discounted number of new
customers acquired during the company’s lifetime, using the standard NPV formula
0
100
200
300
400
500
600
700
800
0 5 10 15 20
Nu
mb
er
of
Cu
sto
me
rs
Time (years)
Impact of Churn on SaaS Growth
with churn without churn churn limit
maturityacquistion rate / % churn rate
early growthacquisition rate x time
Churn wins if acquisition doesn't grow- acquisition rate = 100 customers/year- % churn rate = 20% per year- limit at maturity = 500 customers- transition timeframe = lifetime = 5 years
-
500
1,000
1,500
2,000
- 2 4 6 8 10
Nu
mb
er
of
Cu
sto
me
rs J
oin
ing
and
Le
avin
g
Time (years)
Churn Relentlessly Chasesthe Customer Acquisition Rate
Increasing Total Churn- 0 in year 1- 1,500 in year 10- 7,500 customers- 20% churn rate
Increasing CustomerAcquisition Rate- 100 in year 1- 2,000 in year 10
0
500
1000
1500
2000
0 5 10 15 20
Nu
mb
er
of
Cu
sto
me
rs
Time (years)
Viral Customer Growth Trumps SaaS Churn
baseline growth 100 new customers per year
churn dominated growthchurn = 20%
viral growthgrowth = 40%churn = 20%
churn limit
-
20,000
40,000
60,000
80,000
100,000
120,000
140,000
160,000
180,000
1 2 3 4 5 6 CACRe
curr
ing
Co
ntr
ibu
tio
n /
Acq
uis
itio
n C
ost
Time (years)
CAC
cust 6
cust 5
cust 4
cust 3
cust 2
cust 1
SaaS Company Profitability Follows SaaS Customer Break-Even
companyprofitability
customerbreak-even
-
50,000
100,000
150,000
200,000
250,000
300,000
350,000
400,000
450,000
500,000
- 1 2 3 4 5 6 7 8 9 10
Rec
urri
ng C
ontr
ibut
ion
/ A
cqui
siti
on C
ost
Time (years)
Achieving SaaS Profitability with Churn
recurring contribution
w/o churntotal
customeracquistion
cost
recurring contribution w/churn of 25%
time to profit
- acquistion rate = 100 customers/yr- churn = 25% per year- ARR 1000; ACS 500, CAC 1500- break-even = 3.0 years- time to profit = 5.5 years
profitability not possiblew/churn of 35%
BE0
-
500,000
1,000,000
1,500,000
2,000,000
- 1 2 3 4 5 6 7 8 9 10 R
ecur
ring
Con
trib
utio
n /
Acq
uisi
tion
Cos
t
Time (years)
Elusive SaaS Profitability with Growth
CAC w/gBE=0.5 CAC w/gBE=0.8
CAC w/gBE=1.1 RC w/20% Growth
recurring contribution
20% growth
time to profit
High total cost of servicecombined with high growthdelay profitability( gBE0 > 1 )
increasing costs
-
250,000
500,000
750,000
1,000,000
1,250,000
1,500,000
- 2 4 6 8 10 12 14 16 18 20 Rec
urri
ng C
ontr
ibut
ion
/ A
cqui
siti
on C
ost
Time (years)
Elusive SaaS Profitability with ChurnDominated Growth
CAC w/gBE=0.5 aBE=0.63 CAC w/gBE=0.8 aBE=1
CAC w/gBE=1.1 aBE=1.38 RC w/20% Growth 25% Churn
recurring contribution
20% growth25% churn
time to profit
profitability impossibleif total cost of service
or churn is too high( gBE , aBE > 1 )
-
500,000
1,000,000
1,500,000
2,000,000
2,500,000
3,000,000
- 1 2 3 4 5 6 7 8 9 10
Rec
urri
ng C
ontr
ibut
ion
/ A
cqui
siti
on C
ost
Time (years)
Upselling Accelerates SaaS Profitability
RC w/20% Growth 15% Upsell RC w/20% GrowthCAC w/gBE=0.17 CAC w/gBE=0.5
recurring contribution
20% growth
time to profit
upselling enablesprofitability
and accelerates time to profit
20% growth15% upsell
Upselling
SaaS Metrics – Rules of Thumb SaaS Metrics Guide to
SaaS Financial Performance © 2010 Joel York at Chaotic Flow