Embed Size (px)
Citation preview

SA2020 SAN ANTONIO
CITY DIVIDENDSTM
Cleveland State University Maxine Goodman Levin College of Urban Affairs Center for Economic Development

TABLE OF CONTENTSLetter from Lee Fisher 6
Executive Summary 10San Antonio City Dividends: Major Findings 11
Introduction 18Talent Dividend 14Opportunity Dividend 15Green Dividend 16Health/Diabetes Dividend 17
San Antonio Talent Dividend 21
San Antonio Opportunity Dividend 26
San Antonio Green Dividend 31
San Antonio Health/Diabetes Dividend 35
Appendix A Methodology 41Appendix Table A1 Dividend Variables 41
Appendix B Tables 43Appendix Table B1 Largest Metropolitan Regions 43Appendix Table B2 Largest Metropolitan Regions City Dividends (In Millions) 44
Prepared by Senior Research Advisors for CEOs for Cities:
Ziona Austrian, Ph.D. Director Marissa C. Piazza, Research Associate Nikki Glazer, Research Assistant
Cleveland State University Maxine Goodman Levin College of Urban Affairs Center for Economic Development 2121 Euclid Ave. Cleveland, Ohio, 44115 http://urban.csuohio.edu
→ WE CURATE SMART IDEAS AND BENCHMARK CITY SUCCESS THROUGH OUR CITY VITALS.
→ WE CONNECT CROSS-SECTOR LEADERS THROUGH OUR NETWORK OF CITY CLUSTERS.
→ WE CATALYZE COLLABORATIVE CHANGE THROUGH OUR CITY DIVIDENDS AND PRIZE CHALLENGES.
CEOSFORCITIES.ORG
SA2020 CONNECTS THE COMMUNITY FOR A STRONGER SAN ANTONIO.
→ WE MEASURE PROGRESS ON OUR SHARED GOALS TO SHOW AREAS FOR IMPROVEMENT AND CELEBRATE SUCCESS.
→ WE SUPPORT PARTNERS THROUGH ALIGNMENT AND COLLABORATION.
→ WE ENGAGE THE PUBLIC WITH WAYS TO GET INVOLVED.
SA2020.ORG

SAN ANTONIO TALENT DIVIDEND 5
TABLE OF FIGURESFig.1 Infographic for San Antonio Talent Dividend 14
Fig. 2 Infographic for San Antonio Opportunity Dividend 15
Fig. 3 Infographic for San Antonio Green Dividend 16
Fig. 4 Infographic for San Antonio Health/Diabetes Dividend 17
Fig. 5 Percentage Of Population 25 Years and Older with at Least a Bachelor’s Degree, 2012 23
Fig. 6 Talent Regression, 2012 24
Fig. 7 Poverty Rate, Largest 51 Metropolitan Regions, 2012 28
Fig. 8 Opportunity Regression, 2012 29
Fig. 9 Daily Vehicle Miles Traveled Per Person By Metropolitan Region, Largest Metropolitan Regions, 2012 33
Fig. 10 Total Cost Savings for a 1% Decline In Diabetic Population, (Millions), 2012 37
Fig. 11 Diabetes Cost Savings Per Person, 2012 38

6 SAN ANTONIO TALENT DIVIDEND LETTER FROM LEE FISHER 7
AT A TIME WHEN CITIES AND METRO REGIONS HAVE BECOME
THE ECONOMIC ENGINES OF THE NATION AND WHEN THE MOST
VALUABLE CURRENCY OF THE NEW ECONOMY IS KNOWLEDGE AND
IDEAS, CITIES MUST BE CONSTANTLY LEARNING, SHARING, AND
REINVENTING. NO CITY LACKS TALENT AND IDEAS, BUT ALMOST
EVERY CITY LACKS A VEHICLE FOR CONNECTING WITH TALENT
AND IDEAS OUTSIDE THEIR OWN CITY AND FOR MOBILIZING,
ACCELERATING, AND SUSTAINING ACTION ON IMPORTANT GOALS.
CEOs for Cities fills this need through a national network of cross-sector leaders who connect with each other and with smart ideas, practices, and stories for city success.
We Curate smart ideas and benchmark city success through our City Vitals.We Connect cross-sector leaders through our network of City Clusters.We Catalyze collaborative change through our City Dividends and Prize Challenges.
The Power of Progress. City Dividends.
→ MAKING SMALL CHANGES THAT REAP BIG ECONOMIC DIVIDENDS
Our ultimate goal – catalyzing collaborative change for city success – is easier said than done. The key challenge that every city faces is how to best motivate, mobilize, focus, accelerate, and sustain action on the key issues that contribute to city success. While we know that most work by urban leaders in cities and regions contributes to the general good, the payback from investments often seems distant and uncertain. Leaders in every city are working away at challenges from different angles, but efforts are not coordinated and progress is not being made as quickly as needed.
→ THE KEY CHALLENGE THAT EVERY CITY FACES IS HOW TO BEST MOTIVATE, MOBILIZE, FOCUS, ACCELERATE, AND SUSTAIN ACTION ON THE KEY ISSUES THAT CONTRIBUTE TO CITY SUCCESS.
Our framework is that of a “what if” analysis. What if an investment of resources in a strategy could reap real, tangible and calculable economic benefits? What if my city could reach higher levels of performance in areas of primary importance to the economic success of the city and metro region?
The answer is City DividendsTM. A City Dividend is the economic benefit resulting from investing resources to successfully achieve a measurable, actionable goal toward your city’s and metro region’s economic progress. The objective of City Dividends is to provide quantitative estimates of the economic gains and/or savings that metropolitan regions and cities could achieve by improving their performance on specific priority issues. City Dividends are based on a simple but profound premise - the power of progress- or what Harvard Professor Teresa Amabile calls the “progress principle.” Her extensive research has found that the single most important motivator and catalyst of positive action is making progress and showing forward momentum in meaningful work.
City Dividends are premised on our research and experience that measurable progress, or “moving the needle,” on targeted work can reap huge economic growth dividends for cities and metro regions, and accelerate movement on important goals. Focusing on a particular goal allows us to approach a problem with the kind of intensity needed to formulate an action plan that works.
City Dividends as a Catalyst for Collective Impact
We have found that a City Dividend can be a powerful catalyst for convening stakeholders from different sectors around a common agenda and set of metrics for addressing an important challenge. CEOs for Cities’ highly successful $1 million Talent Dividend Prize, funded by the Kresge and Lumina Foundations in partnership with Living Cities, has helped to catalyze, motivate, and accelerate work on the goal of college completion in 57 American cities competing to achieve the greatest increase in college degree completion over a three-year period. We have found that when there is cross-sector, collaborative focus on achieving a targeted, measurable and actionable goal toward your city’s economic success, the collective impact is positive and measurable, and momentum is sustained. The Talent Dividend Prize incentivized accelerated progress toward the goal of college completion by shining a powerful light on the opportunity and the achievable, measurable goal provided an incentive to make meeting the challenge a priority.

SAN ANTONIO TALENT DIVIDEND 98 LETTER FROM LEE FISHER
City Dividends can be customized and applied to the situations of individual cities and metropolitan areas and used as a tool in strategic planning and policy advocacy. Cities should adopt City Dividends simply because they can’t afford to drive into the future without collective energy, intense focus, and a well-informed, accelerated path to success.
The future belongs to those cities and regions that can best catalyze collaborative, cross-sector change by demonstrating measurable progress on important goals, thus earning their City Dividends.
Lee FisherPresident and CEOCEOs for [email protected]
→ CITY DIVIDENDS ARE PREMISED ON OUR RESEARCH AND EXPERIENCE THAT MEASURABLE PROGRESS, OR “MOVING THE NEEDLE,” ON TARGETED WORK CAN REAP HUGE ECONOMIC GROWTH DIVIDENDS FOR CITIES AND METRO REGIONS, AND ACCELERATE MOVEMENT ON IMPORTANT GOALS.

10 SAN ANTONIO TALENT DIVIDEND EXECUTIVE SUMMARY 11
EXECUTIVE SUMMARY THE CHALLENGE THAT EVERY CITY FACES IS HOW TO BEST MOBILIZE,
ACCELERATE, AND SUSTAIN ACTION ON THE KEY ISSUES THAT
CONTRIBUTE TO CITY SUCCESS. THE FUTURE BELONGS TO THOSE
CITIES AND REGIONS THAT CAN BEST CATALYZE COLLABORATIVE
CHANGE BY DEMONSTRATING MEASURABLE PROGRESS ON
IMPORTANT GOALS.
CEOS FOR CITIES BELIEVES THE ANSWER IS CITY DIVIDENDS. CEOS
FOR CITIES CREATED THE CITY DIVIDEND CONCEPT TO CATALYZE
COLLABORATIVE ECONOMIC PROGRESS IN CITIES AND REGIONS.
CITY DIVIDENDS, FIRST DEVELOPED BY ECONOMIST JOE CORTRIGHT
OF IMPRESSA, INC., FOR CEOS FOR CITIES, AND CAROL COLETTA,
FORMER PRESIDENT AND CEO OF CEOS FOR CITIES, ARE PREMISED
ON RESEARCH AND EXPERIENCE THAT MEASURED PROGRESS, OR
“MOVING THE NEEDLE,” ON TARGETED WORK CAN REAP LARGE
ECONOMIC DIVIDENDS FOR CITIES AND METRO REGIONS, AND
ACCELERATE MOVEMENT ON IMPORTANT GOALS.
→ A CITY DIVIDENDTM IS THE ECONOMIC BENEFIT RESULTING FROM INVESTING RESOURCES TO SUCCESSFULLY ACHIEVE A MEASURABLE, ACTIONABLE GOAL TOWARD YOUR CITY’S AND METRO REGION’S ECONOMIC PROGRESS.
A City DividendTM is the economic benefit resulting from investing resources to successfully achieve a measurable, actionable goal toward your city’s and metro region’s economic progress. The objective of City Dividends is to provide quantitative estimates of the economic gains and/or savings that metropolitan regions and cities could achieve by improving their performance on specific priority issues.
CEOs for Cities previously developed three City Dividends—the Talent, Green, and Opportunity Dividends – and the opportunity to develop other city dividends related to city success is unlimited. This report updates the Talent, Opportunity, and Green Dividends for the San Antonio metropolitan region, and develops a new Dividend for the San Antonio metro region: the Health/Diabetes Dividend.
• The Talent DividendTM: The Talent Dividend goal is increasing the number of college graduates in the metro region by 1%, and the dividend is the increased average personal income in the region.
• The Opportunity DividendTM: The Opportunity Dividend goal is reducing the metro region poverty rate by 1%, and the dividend is the public savings associated with reducing poverty in the region.
• The Green DividendTM: The Green Dividend goal is reducing driving by one mile per person per day in the region, and the dividend is the individual savings related to driving less.
• The Health/Diabetes DividendTM: The Health/Diabetes Dividend goal is reducing the number of diabetics in the region, and the dividend is the medical and indirect economic savings associated with having fewer individuals with this chronic illness.
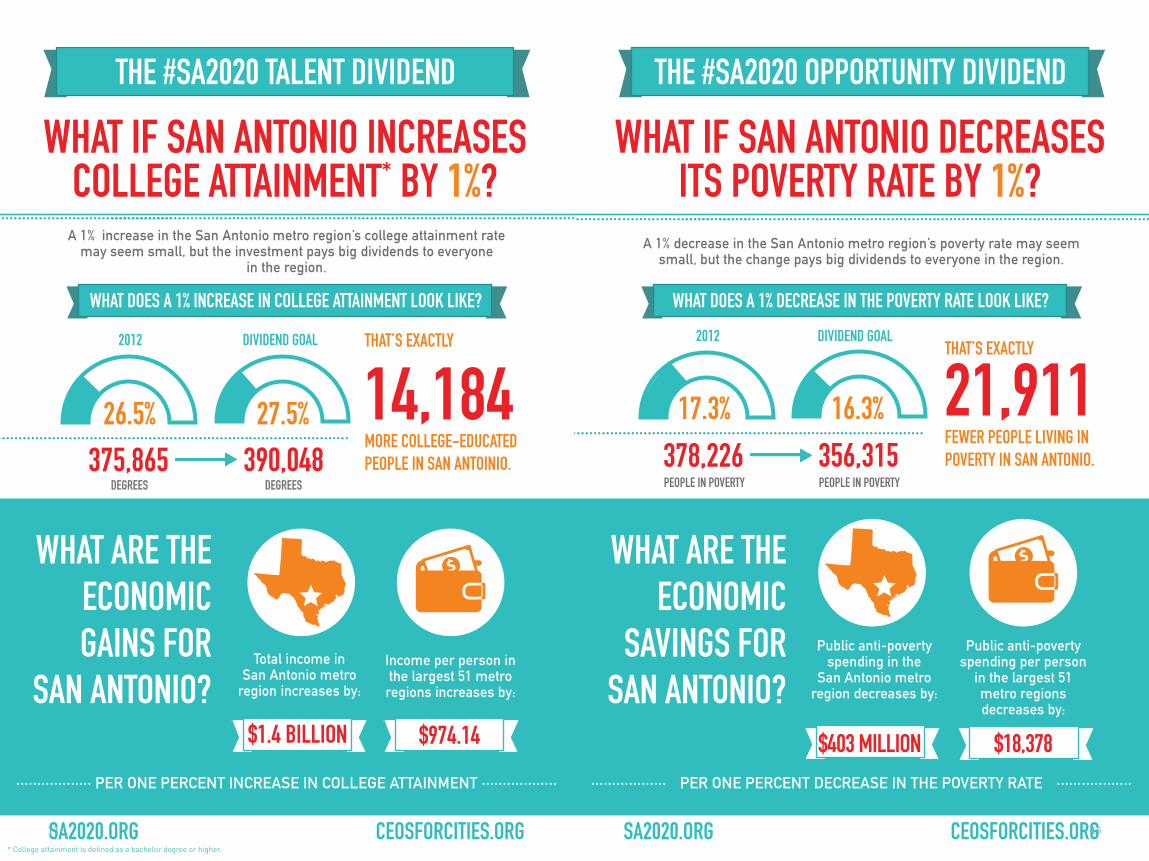
San Antonio City Dividends: Major FindingsThe Talent Dividend illustrates each metropolitan region’s growth in personal income for every 1% increase in the adult population with at least a bachelor’s degree.
• Combined Talent Dividend for the largest 51 metropolitan regions - $111 billion.
• Talent Dividend for the San Antonio metropolitan region - $1.38 billion. This means that the San Antonio metropolitan region would see an overall increase in personal income of $1.38 billion.
• San Antonio’s Talent Dividend ranks 28th of the 51 largest metropolitan regions.
• An increase in San Antonio’s bachelor’s degree or higher educational attainment from 26.5% to 27.5% means that the number of persons with a bachelor’s degree or higher will increase by 14,184 in the San Antonio metro region.
• Talent Dividend for 1 person, on average, in the largest 51 metropolitan regions is $974.14. This means that for every additional person in the average large metro region who obtains at least a bachelor’s degree, he or she will earn, on average, an additional $974 each year in income.
1American Diabetes Association. (2013). Economic Costs of Diabetes in the U.S. in 2012. Diabetes Care, 36(4). 1033-1046.
EXECUTIVE SUMMARY 1312 EXECUTIVE SUMMARY
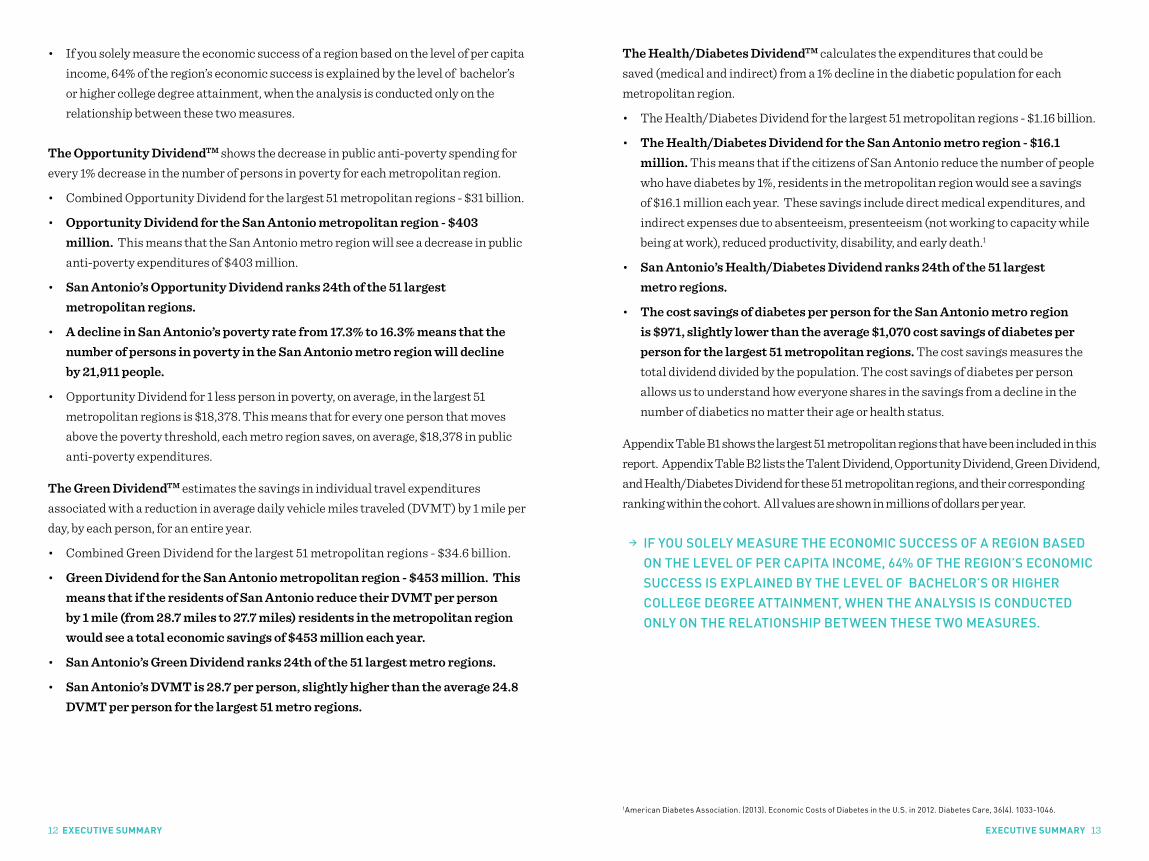
• If you solely measure the economic success of a region based on the level of per capita income, 64% of the region’s economic success is explained by the level of bachelor’s or higher college degree attainment, when the analysis is conducted only on the relationship between these two measures.
The Opportunity DividendTM shows the decrease in public anti-poverty spending for every 1% decrease in the number of persons in poverty for each metropolitan region.
• Combined Opportunity Dividend for the largest 51 metropolitan regions - $31 billion.
• Opportunity Dividend for the San Antonio metropolitan region - $403 million. This means that the San Antonio metro region will see a decrease in public anti-poverty expenditures of $403 million.
• San Antonio’s Opportunity Dividend ranks 24th of the 51 largest metropolitan regions.
• A decline in San Antonio’s poverty rate from 17.3% to 16.3% means that the number of persons in poverty in the San Antonio metro region will decline by 21,911 people.
• Opportunity Dividend for 1 less person in poverty, on average, in the largest 51 metropolitan regions is $18,378. This means that for every one person that moves above the poverty threshold, each metro region saves, on average, $18,378 in public anti-poverty expenditures.
The Green DividendTM estimates the savings in individual travel expenditures associated with a reduction in average daily vehicle miles traveled (DVMT) by 1 mile per day, by each person, for an entire year.
• Combined Green Dividend for the largest 51 metropolitan regions - $34.6 billion.
• Green Dividend for the San Antonio metropolitan region - $453 million. This means that if the residents of San Antonio reduce their DVMT per person by 1 mile (from 28.7 miles to 27.7 miles) residents in the metropolitan region would see a total economic savings of $453 million each year.
• San Antonio’s Green Dividend ranks 24th of the 51 largest metro regions.
• San Antonio’s DVMT is 28.7 per person, slightly higher than the average 24.8 DVMT per person for the largest 51 metro regions.
The Health/Diabetes DividendTM calculates the expenditures that could be saved (medical and indirect) from a 1% decline in the diabetic population for each metropolitan region.
• The Health/Diabetes Dividend for the largest 51 metropolitan regions - $1.16 billion.
• The Health/Diabetes Dividend for the San Antonio metro region - $16.1 million. This means that if the citizens of San Antonio reduce the number of people who have diabetes by 1%, residents in the metropolitan region would see a savings of $16.1 million each year. These savings include direct medical expenditures, and indirect expenses due to absenteeism, presenteeism (not working to capacity while being at work), reduced productivity, disability, and early death.1
• San Antonio’s Health/Diabetes Dividend ranks 24th of the 51 largest metro regions.
• The cost savings of diabetes per person for the San Antonio metro region is $971, slightly lower than the average $1,070 cost savings of diabetes per person for the largest 51 metropolitan regions. The cost savings measures the total dividend divided by the population. The cost savings of diabetes per person allows us to understand how everyone shares in the savings from a decline in the number of diabetics no matter their age or health status.
Appendix Table B1 shows the largest 51 metropolitan regions that have been included in this report. Appendix Table B2 lists the Talent Dividend, Opportunity Dividend, Green Dividend, and Health/Diabetes Dividend for these 51 metropolitan regions, and their corresponding ranking within the cohort. All values are shown in millions of dollars per year.
→ IF YOU SOLELY MEASURE THE ECONOMIC SUCCESS OF A REGION BASED ON THE LEVEL OF PER CAPITA INCOME, 64% OF THE REGION’S ECONOMIC SUCCESS IS EXPLAINED BY THE LEVEL OF BACHELOR’S OR HIGHER COLLEGE DEGREE ATTAINMENT, WHEN THE ANALYSIS IS CONDUCTED ONLY ON THE RELATIONSHIP BETWEEN THESE TWO MEASURES.
14 15SA2020.ORG CEOSFORCITIES.ORG
THE #SA2020 OPPORTUNITY DIVIDEND
WHAT DOES A 1% DECREASE IN THE POVERTY RATE LOOK LIKE?
WHAT ARE THE ECONOMIC
SAVINGS FOR SAN ANTONIO?
WHAT IF SAN ANTONIO DECREASES ITS POVERTY RATE BY 1%?
$971
21,911
Public anti-poverty spending in the
San Antonio metro region decreases by:
Public anti-poverty spending per person
in the largest 51 metro regions decreases by:
PER ONE PERCENT DECREASE IN THE POVERTY RATE
378,226 356,31517.3% 16.3%
FEWER PEOPLE LIVING IN POVERTY IN SAN ANTONIO.
A 1% decrease in the San Antonio metro region’s poverty rate may seem small, but the change pays big dividends to everyone in the region.
2012THAT’S EXACTLY
$403 MILLION $18,378
DIVIDEND GOAL
PEOPLE IN POVERTY PEOPLE IN POVERTY
THAT’S EXACTLY
SA2020.ORG CEOSFORCITIES.ORG
THE #SA2020 TALENT DIVIDEND
WHAT DOES A 1% INCREASE IN COLLEGE ATTAINMENT LOOK LIKE?
WHAT ARE THE ECONOMIC GAINS FOR
SAN ANTONIO?
WHAT IF SAN ANTONIO INCREASES COLLEGE ATTAINMENT* BY 1%?
$974.14$1.4 BILLION
14,184
Total income in San Antonio metro
region increases by:
Income per person in the largest 51 metro regions increases by:
PER ONE PERCENT INCREASE IN COLLEGE ATTAINMENT
375,865 390,04826.5% 27.5%
MORE COLLEGE-EDUCATED PEOPLE IN SAN ANTOINIO.
A 1% increase in the San Antonio metro region’s college attainment rate may seem small, but the investment pays big dividends to everyone
in the region.
2012 DIVIDEND GOAL
* College attainment is defined as a bachelor degree or higher.
DEGREES DEGREES

16 17SA2020.ORG CEOSFORCITIES.ORG
THE #SA2020 HEALTH/DIABETES DIVIDEND
WHAT DOES A 1% DECREASE IN THE DIABETIC POPULATION LOOK LIKE?
WHAT ARE THE ECONOMIC
SAVINGS FOR SAN ANTONIO?
WHAT IF SAN ANTONIO DECREASES ITS DIABETIC POPULATION BY 1%?
$971
1,700
Medical and other costs in San Antonio
metro region decrease by:
Each person in the San Antonio metro
region saves:
PER ONE PERCENT DECREASE IN THE DIABETIC POPULATION
170,000 168,300FEWER PEOPLE BEING TREATED FOR DIABETES IN SAN ANTONIO.
A 1% decrease in the San Antonio metro region’s diabetic population may seem small, but the change pays big dividends to everyone in the region.
THAT’S APPROXIMATELY
$16.1 MILLION $971
2012 DIVIDEND GOAL
DIABETICS DIABETICS
SA2020.ORG CEOSFORCITIES.ORG
THE #SA2020 GREEN DIVIDEND
WHAT DOES A ONE-MILE PER PERSON PER DAY DECREASE LOOK LIKE?
WHAT ARE THE ECONOMIC SAVINGS FOR SAN ANTONIO?
WHAT IF EVERYONE IN SAN ANTONIO DRIVES ONE MILE LESS PER DAY?
$202.58
2.23M
San Antonio metro region total annual driving
expenses decrease by:
Daily spend on driving in San Antonio metro
region decreases by:
Each year, each person in San Antonio metro
region saves:
PER ONE MILE DECREASE IN MILES-DRIVEN PER PERSON EACH DAY
64,004,186 61,770,18328.7 27.7
FEWER MILES DRIVEN IN SAN ANTONIO EVERY DAY.
A decrease of only one mile driven per person in the San Antonio metro region may seem small, but the change pays big dividends
to everyone in the region.
2012
MILES MILES
$1.4 BILLION$1.2 MILLION
DIVIDEND GOAL
$453 MILLION

INTRODUCTION 19
INTRODUCTIONCEOS FOR CITIES CREATED THE CITY DIVIDEND CONCEPT TO CATALYZE
COLLABORATIVE ECONOMIC PROGRESS IN CITIES AND REGIONS.
A CITY DIVIDEND IS THE ECONOMIC BENEFIT RESULTING FROM
INVESTING RESOURCES TO SUCCESSFULLY ACHIEVE A MEASURABLE,
ACTIONABLE GOAL TOWARD YOUR CITY’S AND METRO REGION’S
ECONOMIC PROGRESS. THE OBJECTIVE OF CITY DIVIDENDS IS TO
PROVIDE QUANTITATIVE ESTIMATES OF THE ECONOMIC BENEFITS
THAT METROPOLITAN REGIONS AND CITIES COULD ACHIEVE BY
IMPROVING THEIR PERFORMANCE ON SPECIFIC PRIORITY ISSUES.
This report explores four types of City Dividends: Talent, Opportunity, Green, and Health/Diabetes. The Talent Dividend associates educational attainment, as measured by college degrees, and personal income. The Opportunity Dividend examines individuals in poverty and the public money spent on combating poverty. The Green Dividend considers the savings that a person can achieve by driving one less mile per day. The Health/Diabetes Dividend estimates the costs of diabetes and the economic savings associated with reducing the number of diabetics. The first three are updates of earlier dividends, while the Health/Diabetes Dividend is a new City Dividend. Detailed methodology on how each dividend is calculated and associated data sources is included in Appendix A.
Talent DividendA successful regional economy depends on many factors, one of which is the population’s level of educational attainment. A significant amount of literature has attributed gains in educational attainment to increased earnings and a better quality of life for individuals. Edward Glaser studied the relationship between a region’s educational level and regional growth. He found that regions that have a higher percentage of the population with a bachelor’s degree (or higher) in comparison to other regions experienced both population and productivity growth.2 The educational level of a population was also a strong indicator of the formation of an agglomeration economy.3 An agglomeration economy is an economy that benefits from the colocation of businesses and people due to clustering of urbanization. In addition, studies over the last decade have shown that experience and education have been associated with higher wages, and those with high educational attainment have “propped up wages.”4 Obtaining additional education is now even more important since a significant educational achievement gap is emerging between the rich and the poor.5 The economic gains that result from education matter more now than ever. Opportunity DividendThe Opportunity Dividend estimates how much the public sector can reduce its anti-poverty expenditures when there are fewer individuals in poverty. On one hand, there are many factors associated with poverty (e.g., crime, housing, hunger, and unemployment) that are not taken into consideration by the Opportunity Dividend. On the other hand, some of the public anti-poverty spending is not generated from the local government, but rather is money allocated from the federal government that is distributed by the states (Temporary Aid for Needy Families – TANF,) or is directly dispersed from the federal government (the Earned Income Tax Credit – EITC). In these instances, the dollars in public anti-poverty spending could not have been saved by the local government because they were never generated at the local level. Total public anti-poverty spending used in the calculation of the Opportunity Dividend includes Medicaid, Supplemental Nutrition Assistance Program (SNAP), Temporary Assistance to Needy Families (TANF), Earned Income Tax Credit (EITC), and other assistance payments.
2Glaeser, E., & Saiz, A. (2003). The Rise of the Skilled City. Cambridge, MA: National Bureau of Economic Research. Working Paper 10191. http://www.nber.org/papers/w10191.pdf3Cleveland Federal Reserve. (2005). 2005 Annual Report. http://www.clevelandfed.org/about_us/annual_report/2005/pdf/essay2005.pdf4Hotchkiss, J. L. & Rios-Avila, F. (2014). The Implications of Flat or Declining Real Wages for Inequality. Federal Reserve Bank of Atlanta. http://macroblog.typepad.com/macroblog/2014/06/the-implications-of-flat-or-declining-real-wages-for-inequality.html5Reardon, S. (2011). Whither Opportunity? Rising Inequality and the Uncertain Life Chances of Low-Income Children. In Whither Opportunity? Eds. Duncan, G. J. & Murnane, R. J. pp.91-116 New York: Russell Sage Foundation Press

20 INTRODUCTION
Green DividendThe Green Dividend estimates the savings that will accrue to individuals if they drive less. With the understanding that change can result from small actions, this dividend is based on the concept that if each person decreases the amount they drive by one mile each day whether by biking, walking, carpooling, or using transit, less money has to be allocated to gas, vehicle maintenance, vehicle insurance, and related costs. In addition, cars are a major source of air pollution. Therefore, driving less reduces air pollution and carbon emissions.
Health/Diabetes Dividend According to the American Diabetes Association (ADA), the total annual cost of this disease to individuals and society in the United States in 2012 was $245 billion.6 These costs include $176 billion in direct medical expenditures and $69 billion for indirect expenses due to absenteeism, presenteeism (not working to capacity while being at work), reduced productivity, disability, and early death.7 Moreover, it is not just the effects on the individuals that suffer from diabetes, but rather there are systemic problems associated with the disease, especially economic consequences of productivity loss in a team workplace environment. A 2006 study showed that there are productivity losses in team environments when a worker is absent due to illness; and there is a ripple effect of productivity loss since the team is dependent upon all of its workers.8 Employers understand that it is important to help employees manage chronic illness in order to help decrease absenteeism and loss of productivity, while policy makers see an opportunity to align social welfare funding with chronic care management.9 The Health/Diabetes Dividend enumerates the ADA’s calculations at the metropolitan level and asks, “What will be the total economic savings (medical and indirect) if a metro region has one percentage less diabetics in their population?”
6American Diabetes Association. (2013). Economic Costs of Diabetes in the U.S. in 2012. Diabetes Care, 36(4). 1033-1046.7Ibid. 8 Nicholson, S. Pauly, M. V. Polsky, D. Sharda, C. Szrek, H. & Berger, M. L. (2006). Measuring the Effects of Work Loss on Productivity with Team Production. Health Economics. 15. 111-123.
9 Mattke, S. Balakrishan, A. Bergamo, G. & Newberry, S. J. (2007) A Review of Methods to Measure Health-Related Productivity Loss. The American Journal of Managed Care. 13 (4) 211-217.
WHAT IF THE SAN ANTONIO METRO REGION INCREASES ITS
COLLEGE ATTAINMENT BY 1%?
THE SAN ANTONIO METROPOLITAN REGION WILL INCREASE THE
PERCENT OF ITS ADULT POPULATION WITH AT LEAST A BACHELOR’S
DEGREE FROM 26.5% TO 27.5% (USING 2012 DATA). THE SAN ANTONIO
METRO REGION WILL SEE AN OVERALL INCREASE IN PERSONAL
INCOME OF $1.38 BILLION.10 COMPARED TO THE OTHER METRO REGIONS
IN THE COHORT, SAN ANTONIO’S TALENT DIVIDEND RANKS 28TH OF
THE 51 LARGEST METROPOLITAN AREAS. BY COMPARISON, THE NEW
YORK CITY METRO REGION, WITH A TALENT DIVIDEND OF NEARLY
$13 BILLION, IS THE HIGHEST IN THE COHORT. THE SALT LAKE CITY
METROPOLITAN REGION HAS A TALENT DIVIDEND OF $689 MILLION,
HALF AS MUCH AS SAN ANTONIO’S TALENT DIVIDEND. IT SHOULD BE
NOTED THAT THE TOTAL TALENT DIVIDEND FOR A METROPOLITAN
REGION IS STRONGLY RELATED TO ITS POPULATION SIZE; THE LARGER
ITS ADULT POPULATION, THE LARGER THE DIVIDEND WHEN COMPARED
TO SMALLER METROPOLITAN REGIONS.
1SAN ANTONIO TALENT DIVIDEND
10 Personal income (PI) is defined by the US Bureau of Economic Analysis as the sum of wage and salary disbursements, supplements to wages and salaries, proprietors’ income with inventory and capital consumption adjustments, personal dividend income, personal interest income, and personal current transfer receipts, lower contributions from government social insurance. This value is then divided by the total population to get per capita income (PCI) values. For more information on PI and PCI: http://www.bea.gov/regional/pdf/overview/regional_spi.pdf.

11Hall, J. (2000). Investment in Education: Private & Public Returns. Washington, Joint Economic Committee.
22 SAN ANTONIO TALENT DIVIDEND SAN ANTONIO TALENT DIVIDEND 23
In today’s knowledge-driven economy, metropolitan regions with high educational attainment have an advantage. When a city has a highly educated workforce, individuals’ income and economic well-being are increased because there is higher productivity overall. A highly educated workforce is more productive, and as a result, the businesses that hire them are more productive. Furthermore, research shows that an increase in human capital accounts for as much as a 25% increase in output per capita since the 1950s, indicating that educational attainment is key to economic growth.11
The Talent Dividend displays the correlation between education and income and shows the additional personal income that a metro area will gain if it increases the percentage of its population who has a college degree. To illustrate this, personal per capita income data was correlated with college attainment rates for the largest 51 metropolitan regions. College attainment rate is defined as the adult population (25 and over) who has earned a bachelor’s degree or higher.
Figure 5 outlines the percentage of the population greater than 25 years old that has a bachelor’s degree or higher in the largest 51 metropolitan regions. The average percentage of the population that has a bachelor’s degree or higher for the 51 largest metro regions is 33.7%. There were 33 metropolitan regions with educational attainment rates (bachelor’s degree and above) lower than the cohort average. Dividing the cohort into four groups, or quartiles, the San Antonio metro region can be found in the bottom quartile, with 26.5% of its adult population holding at least a bachelor’s degree. The Washington D.C. metro region has the highest rate of educated adults, with almost half of its residents 25 years and older holding at least a bachelor’s degree (48.2%). It is followed by San Jose and San Francisco.
Fig. 5 Percentage of Population 25 Years and Older with at least a Bachelor’s Degree, 2012
0% 5% 10% 15% 20% 25% 30% 35% 40% 45% 50%
Riverside-San Bernardino-Ontario, CA
Las Vegas-Paradise, NV
Memphis, TN-MS-AR
San Antonio-New Braunfels, TX
Louisville/Jefferson County, KY-IN
New Orleans-Metairie-Kenner, LA
Tampa-St. Petersburg-Clearwater, FL
Orlando-Kissimmee-Sanford, FL
Birmingham-Hoover, AL
Jacksonville, FL
Detroit-Warren-Livonia, MI
Oklahoma City, OK
Cleveland-Elyria-Mentor, OH
Virginia Beach-Norfolk-Newport News, VA-NC
Phoenix-Mesa-Glendale, AZ
Providence-New Bedford-Fall River, RI-MA
Miami-Fort Lauderdale-Pompano Beach, FL
Houston-Sugar Land-Baytown, TX
Cincinnati-Middletown, OH-KY-IN
Buffalo-Niagara Falls, NY
Sacramento-Arden-Arcade-Roseville, CA
Pittsburgh, PA
St. Louis, MO-IL
Dallas-Fort Worth-Arlington, TX
Los Angeles-Long Beach-Santa Ana, CA
Rochester, NY
Indianapolis-Carmel, IN
Salt Lake City, UT
Nashville-Davidson-Murfreesboro-Franklin, TN
Milwaukee-Waukesha-West Allis, WI
Richmond, VA
Charlotte-Gastonia-Rock Hill, NC-SC
Kansas City, MO-KS
Philadelphia-Camden-Wilmington, PA-NJ-DE-MD
Columbus, OH
San Diego-Carlsbad-San Marcos, CA
Chicago-Joliet-Naperville, IL-IN-WI
Portland-Vancouver-Hillsboro, OR-WA
Atlanta-Sandy Springs-Marietta, GA
Baltimore-Towson, MD
Hartford-West Hartford-East Hartford, CT
New York-Northern New Jersey-Long Island, NY-NJ-PA
Seattle-Tacoma-Bellevue, WA
Minneapolis-St. Paul-Bloomington, MN-WI
Denver-Aurora-Broomfield, CO
Austin-Round Rock-San Marcos, TX
Raleigh-Cary, NC
Boston-Cambridge-Quincy, MA-NH
San Francisco-Oakland-Fremont, CA
San Jose-Sunnyvale-Santa Clara, CA
Washington-Arlington-Alexandria, DC-VA-MD-WV
Source: US Census Bureau, 2012 American Community Survey
Bachelor Degree or Higher College Attainment Rate
Largest 51 Metro Region Average33.7%
San Antonio 26.5%

SAN ANTONIO TALENT DIVIDEND MATH
24 SAN ANTONIO TALENT DIVIDEND
In order to create the Talent Dividend, we associated educational attainment rates with per capita income using regression analysis. To do this, we regressed bachelor or higher college attainment rates on per capita income for the largest 51 metro regions, using 2012 data. We then used the regression results to calculate the Talent Dividend for the overall cohort of the largest 51 metropolitan regions.12 The regression analysis demonstrates that if you measure the economic success of a region based on the level of per capita income, 64% of the region’s economic success is explained by the level of bachelor’s or higher college degree attainment, when the analysis is conducted only on the relationship between these two measures.
Figure 6 displays the association of educational attainment to per capita income. Calculating the dividend for every metropolitan region indicates that for every 1% increase in bachelor’s or higher college attainment rate, there is an average increase in per capita income. The average Talent Dividend for the largest 51 metropolitan regions is $974.14 per person. What this dollar amount signifies is that for every additional person in the average large metro area who obtains a bachelor’s degree or above, he or she will earn, on average, an additional $974 each year in income.
FIG. 6 Talent Regression, 2012
15% 20% 25% 30% 35% 40% 45% 50%$25,000
$30,000
$35,000
$40,000
$45,000
$50,000
$55,000
$60,000
$65,000
$70,000
San Antonio
Source: US Census Bureau, American Community Survey; US Bureau of Economic Analysis
Bachelor Degree or Higher College Attainment Rate
Per
Capi
ta In
com
e
12The regression model specifies that 64% of the level of per-capita income is explained by variation in the data on bachelor’s or higher college attainment (y=97414x+14265 R2=0.642). This means that 36% of per-capita income is explained by other variables and not by educational attainment.
Increasing the number of people with a bachelor’s degree or higher
by 1% will generate a
$1.4 billion increase in income in the
San Antonio metro region.
of San Antonians have a bachelor’s degree or higher
(or 14,184 more college-educated San Antonians)
26.5%1.0%27.5%
_______________+ increase in college attainment
$974.14income increase per
person per year

SAN ANTONIO OPPORTUNITY DIVIDEND 27
The Opportunity Dividend has been estimated by analyzing the correlation between the number of individuals in poverty and total public sector anti-poverty spending within a metropolitan region. Persons in poverty are defined as the number of people with income less than the poverty threshold over the course of 12 months. Total public anti-poverty spending includes Medicaid, Supplemental Nutrition Assistance Program (SNAP), Temporary Assistance to Needy Families (TANF), Earned Income Tax Credit (EITC), and other assistance payments.
Poverty Thresholds are defined by the United States Census Bureau for each year by size of family and number of related children under 18 years of age. In 2012 the poverty threshold for one person was $11,720; for a family of four that includes two children, the poverty threshold was $23,283. For more details, please see: https://www.census.gov/hhes/www/poverty/data/threshld/.
Examining poverty rates across the largest 51 metropolitan regions reveals that the Memphis metro region has the highest poverty rate of the cohort in 2012 at nearly 20%, while the Washington, D.C. metro region has the lowest poverty rate at less than 10% (Figure 7). With a 17.3% poverty rate, the San Antonio metro region has the 8th highest poverty rate of the largest 51 metropolitan regions. The average poverty rate of this cohort is 14.8%; including San Antonio, there are 26 metro regions that have a poverty rate above the average.
WHAT IF THE SAN ANTONIO METRO REGION DECREASES ITS POVERTY
RATE BY 1%?
TO DO THIS, THE POVERTY RATE IN THE SAN ANTONIO METRO
REGION WILL DECREASE FROM 17.3% TO 16.3%. THEREFORE, THE
METROPOLITAN REGION WILL SEE A DECREASE IN PUBLIC ANTI-
POVERTY EXPENDITURES OF $403 MILLION. THIS VALUE IS KNOWN
AS SAN ANTONIO’S OPPORTUNITY DIVIDEND. COMPARED TO THE
OTHER METROPOLITAN REGIONS IN THE COHORT, SAN ANTONIO’S
OPPORTUNITY DIVIDEND RANKS 24TH OF THE 51 LARGEST METRO
REGIONS, FALLING NEAR THE MIDDLE OF THE COHORT. NEW YORK
CITY RANKS FIRST FOR THE OPPORTUNITY DIVIDEND, WITH A
CALCULATED SAVINGS OF OVER $3 BILLION. THE ROCHESTER METRO
REGION HAS THE LOWEST OPPORTUNITY DIVIDEND WITH NEARLY
$200 MILLION SAVINGS IN PUBLIC ANTI-POVERTY SPENDING.
2 SAN ANTONIO OPPORTUNITY DIVIDEND

SAN ANTONIO OPPORTUNITY DIVIDEND 2928 SAN ANTONIO OPPORTUNITY DIVIDEND
In order to create the Opportunity Dividend, the number of individuals in poverty is associated with public anti-poverty spending using a regression analysis. We regressed the number of people in poverty on public anti-poverty spending for each of the 51 largest metro regions, using 2012 data.
Figure 8 displays the association of the number of people in poverty to public anti-poverty spending. Calculating the Opportunity Dividend for each metro region signifies that for a decrease in the poverty rate, or the number of poor persons, there is a corresponding savings in public anti-poverty spending. On average, for the largest 51 metro regions, there is a saving of $18,378 per person in public anti-poverty expenditures. What this dollar amount signifies is that for every one person that moves above the poverty threshold, each metro region saves, on average, $18,378 in public anti-poverty expenditures.
Fig. 8 Opportunity Regression, 2012
0 200 400 600 800 1,000 1,200 1,4000
$5,000
$10,000
$15,000
$20,000
$25,000
$30,000
$35,000
San Antonio
Persons in Poverty (thousands)
Tota
l Ant
i-Po
vert
y Sp
endi
ng (m
illio
ns)
Source: US Census Bureau, American Community Survey; US Bureau of Economic Analysis; y=18.378x-2E+09 R2=0.8621
2.8 million,$66 billion
2.3 million,$33 billion
0% 5% 10% 15% 20%
Memphis, TN-MS-AR
New Orleans-Metairie-Kenner, LA
Riverside-San Bernardino-Ontario, CA
Los Angeles-Long Beach-Santa Ana, CA
Miami-Fort Lauderdale-Pompano Beach, FL
Phoenix-Mesa-Glendale, AZ
Detroit-Warren-Livonia, MI
San Antonio-New Braunfels, TX
Sacramento-Arden-Arcade-Roseville, CA
Orlando-Kissimmee-Sanford, FL
Birmingham-Hoover, AL
Atlanta-Sandy Springs-Marietta, GA
Houston-Sugar Land-Baytown, TX
Tampa-St. Petersburg-Clearwater, FL
Las Vegas-Paradise, NV
Oklahoma City, OK
Louisville/Jefferson County, KY-IN
Milwaukee-Waukesha-West Allis, WI
Jacksonville, FL
Cleveland-Elyria-Mentor, OH
Austin-Round Rock-San Marcos, TX
Columbus, OH
Charlotte-Gastonia-Rock Hill, NC-SC
San Diego-Carlsbad-San Marcos, CA
Dallas-Fort Worth-Arlington, TX
Cincinnati-Middletown, OH-KY-IN
New York-Northern New Jersey-Long Island, NY-NJ-PA
Chicago-Joliet-Naperville, IL-IN-WI
Rochester, NY
Indianapolis-Carmel, IN
Nashville-Davidson-Murfreesboro-Franklin, TN
St. Louis, MO-IL
Buffalo-Niagara Falls, NY
Portland-Vancouver-Hillsboro, OR-WA
Providence-New Bedford-Fall River, RI-MA
Philadelphia-Camden-Wilmington, PA-NJ-DE-MD
Virginia Beach-Norfolk-Newport News, VA-NC
Kansas City, MO-KS
Raleigh-Cary, NC
Denver-Aurora-Broomfield, CO
Salt Lake City, UT
Pittsburgh, PA
San Francisco-Oakland-Fremont, CA
Richmond, VA
Seattle-Tacoma-Bellevue, WA
Baltimore-Towson, MD
Hartford-West Hartford-East Hartford, CT
San Jose-Sunnyvale-Santa Clara, CA
Boston-Cambridge-Quincy, MA-NH
Minneapolis-St. Paul-Bloomington, MN-WI
Washington-Arlington-Alexandria, DC-VA-MD-WV
Largest 51 Metro Region Average14.8%
San Antonio 17.3%
Source: US Census Bureau, 2012 American Community Survey
Poverty Rate
FIG. 7 Poverty Rate, Largest Metropolitan Regions, 2012

SAN ANTONIO OPPORTUNITY DIVIDEND MATH
378,226 PEOPLE LIVE IN POVERTY IN THE SAN ANTONIO METRO REGION
$18,378 PUBLIC ANTI-POVERTY EXPENDITURES PER IMPOVERISHED INDIVIDUAL
1% REDUCTION IN POVERTY RATE
21,911 LESS PEOPLE IN POVERTY IN THE SAN ANTONIO METRO REGION
REDUCING THE NUMBER OF PEOPLE IN POVERTY BY 1% WILL REDUCE PUBLIC ANTI-POVERTY SPENDING IN THE SAN ANTONIO METRO REGION BY $403 MILLION ANNUALLY
WHAT IF EVERYONE IN THE SAN ANTONIO METRO REGION DRIVES
ONE MILE LESS PER DAY?
IF RESIDENTS OF SAN ANTONIO REDUCE THEIR DVMT PER PERSON
BY 1 MILE (FROM 28.7 MILES TO 27.7 MILES) PEOPLE IN THE SAN
ANTONIO METROPOLITAN REGION WILL SEE AN ECONOMIC SAVINGS
OF $453 MILLION EACH YEAR. THIS VALUE IS KNOWN AS SAN
ANTONIO’S GREEN DIVIDEND. MONEY SAVED BY INDIVIDUALS CAN BE
SPENT OR INVESTED IN THE ECONOMY TO INCREASE THE OVERALL
ECONOMIC PERFORMANCE OF THE REGION.
3SAN ANTONIO GREEN DIVIDEND

13 The US Department of Transportation reports daily vehicle miles traveled by Federal-Aid Urban Areas (FAUA). A crosswalk was developed to convert FAUA boundaries to match metropolitan areas as closely as possible.
32 SAN ANTONIO TALENT DIVIDEND SAN ANTONIO TALENT DIVIDEND 33
The Green Dividend shows the savings associated with the population of the metropolitan region driving less. The Green Dividend has been estimated by calculating the costs of driving one mile and associating that with the average daily vehicle miles traveled (DVMT) per person in each metro region. Figure 9 outlines the DVMT per person for the largest 51 metropolitan regions in 2012.13 As might be expected, the New York City metro region has the lowest DVMT per person, at 16.4 miles, which can be attributed to high population density and an extensive public transit system. The Raleigh metro region has the cohort’s highest DVMT per person, at 47.7 daily vehicle miles traveled. San Antonio ranks 32nd of the 51 largest metropolitan regions with 28.7 DVMT per person, only slightly higher than the average 24.8 DVMT per person.
To calculate the Green Dividend, the population of the metropolitan region is multiplied by the estimated daily savings associated with driving one less mile daily, per person, times 365 days for the year. Overall, if every person in each metropolitan region in the cohort reduced their driving by 1 mile per day, the Green Dividend would equate to an annual savings of nearly $35 billion.
Fig. 9 Daily Vehicle Miles Traveled per Person by Metro Region, Largest 51 Metropolitan Regions, 2012
0 10 20 30 4050
Raleigh-Cary, NC
Charlotte-Gastonia-Rock Hill, NC-SC
Nashville-Davidson--Murfreesboro--Franklin, TN
Indianapolis-Carmel, IN
Birmingham-Hoover, AL
Oklahoma City, OK
Atlanta-Sandy Springs-Marietta, GA
Orlando-Kissimmee-Sanford, FL
Jacksonville, FL
Austin-Round Rock-San Marcos, TX
Richmond, VA
Kansas City, MO-KS
Las Vegas-Paradise, NV
St. Louis, MO-IL
Dallas-Fort Worth-Arlington, TX
Louisville/Jefferson County, KY-IN
Tampa-St. Petersburg-Clearwater, FL
Cincinnati-Middletown, OH-KY-IN
Riverside-San Bernardino-Ontario, CA
San Antonio-New Braunfels, TX
Houston-Sugar Land-Baytown, TX
Columbus, OH
Phoenix-Mesa-Glendale, AZ
Memphis, TN-MS-AR
Baltimore-Towson, MD
Hartford-West Hartford-East Hartford, CT
Virginia Beach-Norfolk-Newport News, VA-NC
Sacramento--Arden-Arcade--Roseville, CA
Miami-Fort Lauderdale-Pompano Beach, FL
Denver-Aurora-Broomfield, CO
Salt Lake City, UT
Seattle-Tacoma-Bellevue, WA
Washington-Arlington-Alexandria, DC-VA-MD-WV
Minneapolis-St. Paul-Bloomington, MN-WI
San Diego-Carlsbad-San Marcos, CA
Boston-Cambridge-Quincy, MA-NH
San Jose-Sunnyvale-Santa Clara, CA
San Francisco-Oakland-Fremont, CA
Cleveland-Elyria-Mentor, OH
Detroit-Warren-Livonia, MI
Los Angeles-Long Beach-Santa Ana, CA
Rochester, NY
Milwaukee-Waukesha-West Allis, WI
Portland-Vancouver-Hillsboro, OR-WA
Providence-New Bedford-Fall River, RI-MA
Buffalo-Niagara Falls, NY
Chicago-Joliet-Naperville, IL-IN-WI
Philadelphia-Camden-Wilmington, PA-NJ-DE-MD
Pittsburgh, PA
New Orleans-Metairie-Kenner, LA
New York-Northern New Jersey-Long Island, NY-NJ-PA
Largest 51 Metro Region Average24.8
San Antonio 28.7
Source: US Department of Transportation, Federal Highway Administration
Daily Vehicle Miles Traveled per Person (DVMT)

SAN ANTONIO GREEN DIVIDEND MATH
1 MILE PER PERSON PER DAY
55.5 CENTS PER MILE OPERATING COST
365 DAYS PER YEAR
2.3 MILLION RESIDENTS IN THE SAN ANTONIO METRO REGION
THE AVERAGE SAN ANTONIO METRO REGION RESIDENT DRIVES 28.7 MILES PER DAY. REDUCING THAT BY JUST 1 MILE WILL GENERATE $453 MILLION IN SAVINGS EACH YEAR IN THE SAN ANTONIO METRO REGION
WHAT IF THE SAN ANTONIO METRO REGION DECREASES ITS
DIABETIC POPULATION BY 1%?
FIGURE 10 DISPLAYS THE COST SAVINGS IN MILLIONS OF DOLLARS
FOR A 1% DECLINE IN DIABETICS FOR EACH OF THE LARGEST 51
METROPOLITAN REGIONS IN THE UNITED STATES. SAN ANTONIO’S
COST SAVINGS WOULD BE $16.1 MILLION. THIS VALUE IS THE HEALTH/
DIABETES DIVIDEND FOR THE SAN ANTONIO METRO REGION. SAN
ANTONIO’S HEALTH/DIABETES DIVIDEND RANKS 24TH OF THE 51
LARGEST METRO REGIONS. THE COHORT AVERAGE SAVINGS IS $22.7
MILLION. IT IS IMPORTANT TO KEEP IN MIND THAT AS MUCH AS
THE OVERALL COST SAVINGS IS IMPORTANT FOR A METROPOLITAN
REGION, THIS DIVIDEND IS CALCULATED AS A FUNCTION OF THE
AMOUNT OF DIABETICS IN A REGION TO THE OVERALL STATE.
THEREFORE, IT SHOULD BE NO SURPRISE THAT THE METRO REGIONS
OF LOS ANGELES, CA, AND NEW YORK, NY, WILL HAVE THE HIGHEST
OVERALL COST SAVINGS AT $116.7 MILLION AND $79.7 MILLION,
RESPECTIVELY, DUE TO THE SHEER SIZE THESE REGIONS ACCOUNT
FOR WITHIN THEIR STATES.
SAN ANTONIO HEALTH/ DIABETES DIVIDEND4
14 Centers for Disease Control. (2013, October 13). Rising Health Care Costs are Unsustainable. Retrieved August 17, 2014, from Workplace Health Promotion: http://www.cdc.gov/workplacehealthpromotion/businesscase/reasons/rising.html
15We used the CDC BRFSS population estimates instead of the U.S. Census Bureau population estimates to keep data points congruent.
SAN ANTONIO HEALTH/DIABETES DIVIDEND 3736 SAN ANTONIO HEALTH/DIABETES DIVIDEND
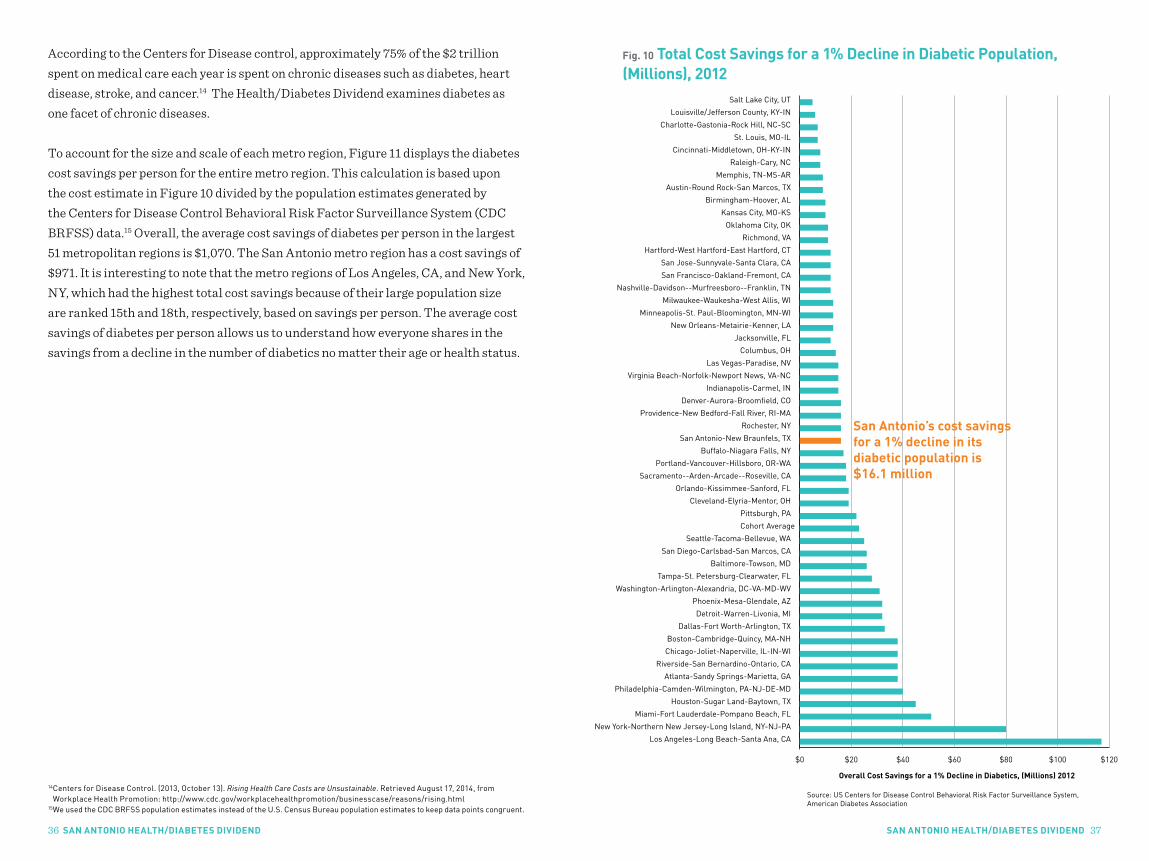
According to the Centers for Disease control, approximately 75% of the $2 trillion spent on medical care each year is spent on chronic diseases such as diabetes, heart disease, stroke, and cancer.14 The Health/Diabetes Dividend examines diabetes as one facet of chronic diseases.
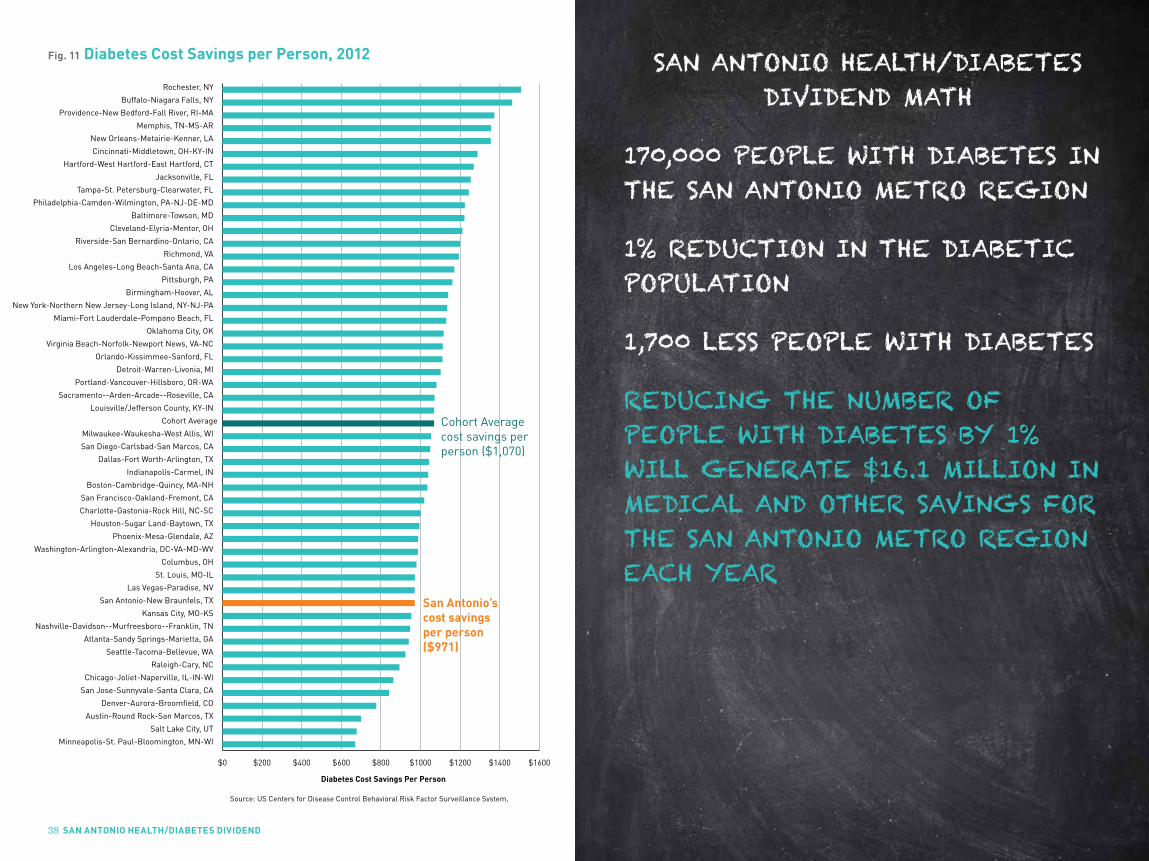
To account for the size and scale of each metro region, Figure 11 displays the diabetes cost savings per person for the entire metro region. This calculation is based upon the cost estimate in Figure 10 divided by the population estimates generated by the Centers for Disease Control Behavioral Risk Factor Surveillance System (CDC BRFSS) data.15 Overall, the average cost savings of diabetes per person in the largest 51 metropolitan regions is $1,070. The San Antonio metro region has a cost savings of $971. It is interesting to note that the metro regions of Los Angeles, CA, and New York, NY, which had the highest total cost savings because of their large population size are ranked 15th and 18th, respectively, based on savings per person. The average cost savings of diabetes per person allows us to understand how everyone shares in the savings from a decline in the number of diabetics no matter their age or health status.
$0 $20 $40 $60 $80 $100 $120
Los Angeles-Long Beach-Santa Ana, CA
New York-Northern New Jersey-Long Island, NY-NJ-PA
Miami-Fort Lauderdale-Pompano Beach, FL
Houston-Sugar Land-Baytown, TX
Philadelphia-Camden-Wilmington, PA-NJ-DE-MD
Atlanta-Sandy Springs-Marietta, GA
Riverside-San Bernardino-Ontario, CA
Chicago-Joliet-Naperville, IL-IN-WI
Boston-Cambridge-Quincy, MA-NH
Dallas-Fort Worth-Arlington, TX
Detroit-Warren-Livonia, MI
Phoenix-Mesa-Glendale, AZ
Washington-Arlington-Alexandria, DC-VA-MD-WV
Tampa-St. Petersburg-Clearwater, FL
Baltimore-Towson, MD
San Diego-Carlsbad-San Marcos, CA
Seattle-Tacoma-Bellevue, WA
Cohort Average
Pittsburgh, PA
Cleveland-Elyria-Mentor, OH
Orlando-Kissimmee-Sanford, FL
Sacramento--Arden-Arcade--Roseville, CA
Portland-Vancouver-Hillsboro, OR-WA
Buffalo-Niagara Falls, NY
San Antonio-New Braunfels, TX
Rochester, NY
Providence-New Bedford-Fall River, RI-MA
Denver-Aurora-Broomfield, CO
Indianapolis-Carmel, IN
Virginia Beach-Norfolk-Newport News, VA-NC
Las Vegas-Paradise, NV
Columbus, OH
Jacksonville, FL
New Orleans-Metairie-Kenner, LA
Minneapolis-St. Paul-Bloomington, MN-WI
Milwaukee-Waukesha-West Allis, WI
Nashville-Davidson--Murfreesboro--Franklin, TN
San Francisco-Oakland-Fremont, CA
San Jose-Sunnyvale-Santa Clara, CA
Hartford-West Hartford-East Hartford, CT
Richmond, VA
Oklahoma City, OK
Kansas City, MO-KS
Birmingham-Hoover, AL
Austin-Round Rock-San Marcos, TX
Memphis, TN-MS-AR
Raleigh-Cary, NC
Cincinnati-Middletown, OH-KY-IN
St. Louis, MO-IL
Charlotte-Gastonia-Rock Hill, NC-SC
Louisville/Jefferson County, KY-IN
Salt Lake City, UT
San Antonio’s cost savings for a 1% decline in its diabetic population is $16.1 million
Source: US Centers for Disease Control Behavioral Risk Factor Surveillance System, American Diabetes Association
Overall Cost Savings for a 1% Decline in Diabetics, (Millions) 2012
Fig. 10 Total Cost Savings for a 1% Decline in Diabetic Population, (Millions), 2012
SAN ANTONIO HEALTH/DIABETES DIVIDEND MATH
170,000 PEOPLE WITH DIABETES IN THE SAN ANTONIO METRO REGION
1% REDUCTION IN THE DIABETIC POPULATION
1,700 LESS PEOPLE WITH DIABETES
REDUCING THE NUMBER OF PEOPLE WITH DIABETES BY 1% WILL GENERATE $16.1 MILLION IN MEDICAL AND OTHER SAVINGS FOR THE SAN ANTONIO METRO REGION EACH YEAR
38 SAN ANTONIO HEALTH/DIABETES DIVIDEND
Fig. 11 Diabetes Cost Savings per Person, 2012
$0 $200 $400 $600 $800 $1000 $1200 $1400 $1600
Minneapolis-St. Paul-Bloomington, MN-WI
Salt Lake City, UT
Austin-Round Rock-San Marcos, TX
Denver-Aurora-Broomfield, CO
San Jose-Sunnyvale-Santa Clara, CA
Chicago-Joliet-Naperville, IL-IN-WI
Raleigh-Cary, NC
Seattle-Tacoma-Bellevue, WA
Atlanta-Sandy Springs-Marietta, GA
Nashville-Davidson--Murfreesboro--Franklin, TN
Kansas City, MO-KS
San Antonio-New Braunfels, TX
Las Vegas-Paradise, NV
St. Louis, MO-IL
Columbus, OH
Washington-Arlington-Alexandria, DC-VA-MD-WV
Phoenix-Mesa-Glendale, AZ
Houston-Sugar Land-Baytown, TX
Charlotte-Gastonia-Rock Hill, NC-SC
San Francisco-Oakland-Fremont, CA
Boston-Cambridge-Quincy, MA-NH
Indianapolis-Carmel, IN
Dallas-Fort Worth-Arlington, TX
San Diego-Carlsbad-San Marcos, CA
Milwaukee-Waukesha-West Allis, WI
Cohort Average
Louisville/Jefferson County, KY-IN
Sacramento--Arden-Arcade--Roseville, CA
Portland-Vancouver-Hillsboro, OR-WA
Detroit-Warren-Livonia, MI
Orlando-Kissimmee-Sanford, FL
Virginia Beach-Norfolk-Newport News, VA-NC
Oklahoma City, OK
Miami-Fort Lauderdale-Pompano Beach, FL
New York-Northern New Jersey-Long Island, NY-NJ-PA
Birmingham-Hoover, AL
Pittsburgh, PA
Los Angeles-Long Beach-Santa Ana, CA
Richmond, VA
Riverside-San Bernardino-Ontario, CA
Cleveland-Elyria-Mentor, OH
Baltimore-Towson, MD
Philadelphia-Camden-Wilmington, PA-NJ-DE-MD
Tampa-St. Petersburg-Clearwater, FL
Jacksonville, FL
Hartford-West Hartford-East Hartford, CT
Cincinnati-Middletown, OH-KY-IN
New Orleans-Metairie-Kenner, LA
Memphis, TN-MS-AR
Providence-New Bedford-Fall River, RI-MA
Buffalo-Niagara Falls, NY
Rochester, NY
San Antonio’s cost savings per person ($971)
Source: US Centers for Disease Control Behavioral Risk Factor Surveillance System, American Diabetes Association
Diabetes Cost Savings Per Person
Cohort Average cost savings per person ($1,070)

40 SAN ANTONIO TALENT DIVIDEND APPENDIX 41
Appendix A METHODOLOGYAppendix Table A1 City Dividend Variables
CITY
D
IVID
END
TALENT DIVIDEND OPPORTUNITY DIVIDEND GREEN DIVIDENDHEALTH/DIABETES
DIVIDEND
VAR
IAB
LE
TYP
E Independent Variable
Dependent Variable
Independent Variable
Dependent Variable Variable 1 Variable 2 Variable 1 Variable 2
VAR
IAB
LE
NA
ME
Bachelor’s Degree or higher educational attainment
Personal per capita income
Persons in poverty
Public expenditures on poverty reduction
Vehicle miles traveled
Cost of owning and operating a vehicle
Number of Diabetics Per MSA
Cost of Diabetes Per State
VAR
IAB
LE
SOU
RCE
U.S. Census Bureau, American Community Survey
U.S. Bureau of Economic Analysis
U.S. Census Bureau, American Community Survey
U.S. Bureau of Economic Analysis
Federal Highway Ad-ministration; U.S. Census Bureau, American Community Survey
U.S. Internal Revenue Service
Centers for Disease Control Behavioral Risk Factor Surveillance System
American Diabetes Association
This report uses data compiled from a variety of secondary data sources in order to calculate each dividend. Appendix Table A1 details each dividend, variable, and source. We used a regression analysis to calculate both the Talent and Opportunity Dividends based on data for the 51 largest metropolitan regions (see above Table A1 for description of variables and data sources).
The Talent Dividend for each metro region was calculated by multiplying the average dividend per person ($974.14) by the number of persons that account for a 1% increase in the adult population with at least a bachelor’s degree. For example, an increase in San Antonio’s bachelor’s degree or higher educational attainment from 26.5% to 27.5% means that the number of persons with a bachelor’s degree or higher will increase by 14,184 persons.
The Opportunity Dividend was estimated by multiplying the average savings in poverty spending per person ($18,378) by the number of persons that account for a 1% decrease in the poverty rate. For example, a decline in San Antonio’s poverty rate from 17.3% to 16.3% means that the number of persons in poverty will decline by 21,911 persons. The decline in number of persons in poverty is then multiplied by average savings in poverty spending per person.
The Green Dividend was calculated using a different methodology. We used cost estimates of driving one mile and associating that with the average daily vehicle miles traveled (DVMT) per person in each metro area. To calculate the San Antonio Green Dividend, the population of the metropolitan region was multiplied by the estimated daily savings associated with driving one less mile daily, per person, times 365 days for the year. The average cost per mile used for all vehicle types according to the IRS is 55.5 cents per mile.16,17
APPENDIX
16 This rate is based upon the standard mileage rate for business, which is based on an annual study of the fixed and variable costs of operating an automobile.
17 U.S. Internal Revenue Service (Oct. 8, 2013). IRS Announces 2012 Standard Mileage Rates, Most Rates Are the Same as in July. Internal Revenue Service. http://www.irs.gov/uac/IRS-Announces-2012-Standard-Mileage-Rates,-Most-Rates-Are-the-Same-as-in-July

APPENDIX 4342 APPENDIX
CBSA Code Geography
12060 Atlanta-Sandy Springs-Marietta, GA Metro Area
12420 Austin-Round Rock-San Marcos, TX Metro Area
12580 Baltimore-Towson, MD Metro Area
13820 Birmingham-Hoover, AL Metro Area
14460 Boston-Cambridge-Quincy, MA-NH Metro Area
15380 Buffalo-Niagara Falls, NY Metro Area
16740 Charlotte-Gastonia-Rock Hill, NC-SC Metro Area
16980 Chicago-Joliet-Naperville, IL-IN-WI Metro Area
17140 Cincinnati-Middletown, OH-KY-IN Metro Area
17460 Cleveland-Elyria-Mentor, OH Metro Area
18140 Columbus, OH Metro Area
19100 Dallas-Fort Worth-Arlington, TX Metro Area
19740 Denver-Aurora-Broomfield, CO Metro Area
19820 Detroit-Warren-Livonia, MI Metro Area
25540 Hartford-West Hartford-East Hartford, CT Metro Area
26420 Houston-Sugar Land-Baytown, TX Metro Area
26900 Indianapolis-Carmel, IN Metro Area
27260 Jacksonville, FL Metro Area
28140 Kansas City, MO-KS Metro Area
29820 Las Vegas-Paradise, NV Metro Area
31100 Los Angeles-Long Beach-Santa Ana, CA Metro Area
31140 Louisville/Jefferson County, KY-IN Metro Area
32820 Memphis, TN-MS-AR Metro Area
33100 Miami-Fort Lauderdale-Pompano Beach, FL Metro Area
33340 Milwaukee-Waukesha-West Allis, WI Metro Area
33460 Minneapolis-St. Paul-Bloomington, MN-WI Metro Area
The Health/Diabetes Dividend was derived from a multitude of sources. We estimated the number of individuals at the metropolitan region to have diabetes using the U.S. Centers for Disease Control Behavioral Risk Factor Surveillance System (BRFSS).18 This detailed survey data contains information on a multitude of health questions, including whether a person has diabetes, for the United States, metropolitan area, and county level. Individual identifiers are concealed but the dataset is weighted so that responses are representative of the geographic area.
Using the estimated number of diabetics per metro region from the BRFSS data and the supplementary tables provided by the ADA, we calculated the number of diabetics in the San Antonio metro region as a percentage of the total diabetics in the state.19 This percentage was then applied to the state level cost estimates from the ADA. If an MSA was contained solely within one state, MSA level BRFSS data was used. However, if an MSA crossed state boundaries, we estimated costs based on BRFSS county level data.
The unit of analysis for this study is that of the Metropolitan Statistical Area (MSA), referred to in this report as metropolitan regions, metro regions, or metropolitan areas. MSAs have been defined by using updated 2003 Office of Management and Budget (OMB) delineations.20 A cohort of the largest 51 MSAs is used in this report in keeping with the cohort of CEOs for Cities City Vitals 2.0. For a listing of all MSAs, see Appendix Table B1. It is important to note that the Green Dividend is based on Federal-Aid Urban Areas (FAUA), which feature different boundaries than MSAs.21 FAUAs are comprised of only urban areas, while MSAs follow county lines, which include both urban and rural areas. A crosswalk was developed to match FAUAs to MSAs as closely as possible, but it is important to note that the regions are not an exact match, and many rural areas found within MSA counties are not factored into the average daily vehicle miles of travel. For continuity, the MSA names are still used when describing the Green Dividend.
18 For more information see: U.S. Centers for Disease Control Behavioral Risk Factor Surveillance System http://www.cdc.gov/brfss/smart/smart_2012.html
19 American Diabetes Association. (2013). Economic Costs of Diabetes in the U.S. in 2012. Diabetes Care, 36(4). 1033-1046. See Supplementary Table 11
20 MSAs, as defined by the US Census Bureau, are associated with at least one urbanized area with a population of at least 50,000, comprising of the central county/counties (or equivalent entities) containing the core, plus adjacent, outlying counties having a high degree of social and economic integration with the central county/counties as measured through commuting. For more information: http://www.census.gov/prod/cen2010/doc/sf1.pdf.
21 FAUAs, as defined by the US DOT, are adjusted urban area boundaries allowed for transportation purposes. These boundaries extend US Census Bureau Urbanized Area and Urban Cluster boundaries outward, which only include, at a minimum, 2,500 persons with a population density. For more information: http://www.fhwa.dot.gov/planning/processes/statewide/related/highway_functional_classifications/section00.cfm.
CBSA Code Geography
34980 Nashville-Davidson--Murfreesboro--Frank-lin, TN Metro Area
35380 New Orleans-Metairie-Kenner, LA Metro Area
35620 New York-Northern New Jersey-Long Island, NY-NJ-PA Metro Area
36420 Oklahoma City, OK Metro Area
36740 Orlando-Kissimmee-Sanford, FL Metro Area
37980 Philadelphia-Camden-Wilmington, PA-NJ-DE-MD Metro Area
38060 Phoenix-Mesa-Glendale, AZ Metro Area
38300 Pittsburgh, PA Metro Area
38900 Portland-Vancouver-Hillsboro, OR-WA Metro Area
39300 Providence-New Bedford-Fall River, RI-MA Metro Area
39580 Raleigh-Cary, NC Metro Area
40060 Richmond, VA Metro Area
40140 Riverside-San Bernardino-Ontario, CA Metro Area
40380 Rochester, NY Metro Area
40900 Sacramento--Arden-Arcade--Roseville, CA Metro Area
41180 St. Louis, MO-IL Metro Area
41620 Salt Lake City, UT Metro Area
41700 San Antonio-New Braunfels, TX Metro Area
41740 San Diego-Carlsbad-San Marcos, CA Metro Area
41860 San Francisco-Oakland-Fremont, CA Metro Area
41940 San Jose-Sunnyvale-Santa Clara, CA Metro Area
42660 Seattle-Tacoma-Bellevue, WA Metro Area
45300 Tampa-St. Petersburg-Clearwater, FL Metro Area
47260 Virginia Beach-Norfolk-Newport News, VA-NC Metro Area
47900 Washington-Arlington-Alexandria, DC-VA-MD-WV Metro Area
Appendix B TABLESAppendix Table B1 Largest 51 Metropolitan Regions

APPENDIX 4544 APPENDIX
Appendix Table B2. Largest 51 Metropolitan Regions City Dividends (in millions)
MSA
Talent Dividend Opportunity Dividend Green Dividend Health/Diabetes Dividend
Value (millions) Rank Value
(millions) Rank Value (millions) Rank Value
(millions) RankCost Savings Per Person
($)Rank
Atlanta-Sandy Springs-Marietta, GA $3,430 9 $984 9 $1,102 9 $38.2 6 $941.2 43
Austin-Round Rock-San Marcos, TX $1,146 34 $330 34 $372 33 $9.7 44 $700.4 49
Baltimore-Towson, MD $1,816 20 $493 20 $558 20 $26.0 15 $1,222.1 11
Birmingham-Hoover, AL $747 49 $205 49 $230 49 $9.9 43 $1,140.3 17
Boston-Cambridge-Quincy, MA-NH $3,107 10 $825 10 $940 10 $37.8 9 $1,035.5 31
Buffalo-Niagara Falls, NY $759 47 $203 50 $230 50 $16.6 23 $1,464.0 2
Charlotte-Gastonia-Rock Hill, NC-SC $1,168 33 $331 33 $371 34 $7.3 49 $1,001.3 33
Chicago-Joliet-Naperville, IL-IN-WI $6,133 3 $1,722 3 $1,929 3 $37.8 8 $863.6 46
Cincinnati-Middletown, OH-KY-IN $1,382 27 $386 27 $435 27 $7.9 47 $1,288.3 6
Cleveland-Elyria-Mentor, OH $1,388 26 $372 29 $418 29 $19.3 19 $1,212.7 12
Columbus, OH $1,198 32 $336 32 $381 32 $14.4 31 $980.9 37
Dallas-Fort Worth-Arlington, TX $4,100 4 $1,206 4 $1,347 4 $33.0 10 $1,043.4 29
Denver-Aurora-Broomfield, CO $1,730 21 $479 21 $536 21 $15.6 27 $777.7 48
Detroit-Warren-Livonia, MI $2,827 12 $781 14 $869 14 $32.4 11 $1,102.4 23
Hartford-West Hartford-East Hartford, CT
$811 45 $215 46 $246 45 $12.1 39 $1,269.6 7
Houston-Sugar Land-Baytown, TX $3,808 8 $1,125 5 $1,257 5 $44.9 4 $995.8 34
Indianapolis-Carmel, IN $1,145 35 $324 35 $364 35 $14.9 28 $1,039.4 30
Jacksonville, FL $901 40 $248 40 $279 40 $13.2 32 $1,254.4 8
Kansas City, MO-KS $1,339 29 $373 28 $418 28 $9.9 42 $954.6 41
Las Vegas-Paradise, NV $1,293 30 $363 30 $405 30 $14.5 30 $971.0 40
Los Angeles-Long Beach-Santa Ana, CA $8,342 2 $2,364 2 $2,644 2 $116.7 1 $1,171.4 15
Louisville/Jefferson County, KY-IN $857 41 $235 42 $264 42 $6.2 50 $1,069.2 26
Memphis, TN-MS-AR $831 43 $240 41 $270 41 $9.5 45 $1,356.2 4
Miami-Fort Lauderdale-Pompano Beach, FL
$3,925 6 $1,046 8 $1,167 8 $51.3 3 $1,130.3 19
Milwaukee-Waukesha-West Allis, WI $1,012 39 $283 39 $317 39 $12.5 35 $1,054.0 27
Minneapolis-St. Paul-Bloomington, MN-WI
$2,176 16 $606 16 $679 16 $12.5 34 $670.5 51
Nashville-Davidson--Murfrees-boro--Franklin, TN
$1,063 37 $296 37 $333 37 $12.4 36 $948.6 42
New Orleans-Metairie-Kenner, LA $793 46 $218 45 $244 46 $12.9 33 $1,355.8 5
New York-Northern New Jersey-Long Island, NY-NJ-PA
$12,745 1 $3,463 1 $3,881 1 $79.7 2 $1,135.0 18

APPENDIX 4746 APPENDIX
MSA
Talent Dividend Opportunity Dividend Green Dividend Health/Diabetes Dividend
Value (millions) Rank Value
(millions) Rank Value (millions) Rank Value
(millions) RankCost Savings Per Person
($)Rank
Oklahoma City, OK $814 44 $233 43 $263 43 $10.9 41 $1,117.2 20
Orlando-Kissimmee-Sanford, FL $1,434 24 $402 25 $450 25 $19.0 20 $1,111.6 22
Philadelphia-Camden-Wilmington, PA-NJ-DE-MD
$3,942 5 $1,079 6 $1,219 6 $39.9 5 $1,224.3 10
Phoenix-Mesa-Glendale, AZ $2,727 13 $782 13 $877 13 $31.7 12 $988.9 35
Pittsburgh, PA $1,639 22 $423 22 $478 22 $22.0 18 $1,161.6 16
Portland-Vancouver-Hillsboro, OR-WA $1,525 23 $415 23 $464 23 $17.7 22 $1,081.9 24
Providence-New Bedford-Fall River, RI-MA
$1,062 38 $284 38 $324 38 $15.9 26 $1,373.9 3
Raleigh-Cary, NC $752 48 $213 47 $241 47 $7.9 46 $894.1 45
Richmond, VA $839 42 $228 44 $259 44 $11.3 40 $1,194.7 14
Riverside-San Bernardino-Ontario, CA $2,591 14 $785 12 $881 12 $38.0 7 $1,201.7 13
Rochester, NY $694 50 $187 51 $214 51 $15.9 25 $1,508.8 1
Sacramento--Arden-Arcade--Roseville, CA
$1,401 25 $398 26 $445 26 $17.9 21 $1,071.8 25
St. Louis, MO-IL $1,858 19 $507 19 $571 19 $7.5 48 $972.6 38
Salt Lake City, UT $689 51 $211 48 $235 48 $5.4 51 $678.2 50
San Antonio-New Braunfels, TX $1,382 28 $403 24 $453 24 $16.1 24 $971.5 39
San Diego-Carlsbad-San Marcos, CA $2,026 17 $569 17 $644 17 $25.8 16 $1,049.9 28
San Francisco-Oakland-Fremont, CA $3,061 11 $807 11 $903 11 $12.3 37 $1,019.8 32
San Jose-Sunnyvale-Santa Clara, CA $1,243 31 $343 31 $384 31 $12.1 38 $841.3 47
Seattle-Tacoma-Bellevue, WA $2,369 15 $642 15 $720 15 $25.5 17 $924.4 44
Tampa-St. Petersburg-Clearwater, FL $1,958 18 $515 18 $576 18 $28.2 14 $1,244.3 9
Virginia Beach-Norfolk-Newport News, VA-NC
$1,073 36 $299 36 $343 36 $14.5 29 $1,113.9 21
Washington-Arlington-Alexandria, DC-VA-MD-WV
$3,813 7 $1,048 7 $1,176 7 $30.7 13 $987.3 36
- $110,864 - $30,824 - $34,608 - $1,178.0 - $1,070.0 -
Source: US Census Bureau, 2012 American Community Survey; 2012 US Bureau of Economic Analysis; US Department of Transportation, Federal Highway Administration 2012 Highway Statistics Series; U.S. Centers for Disease Control Behavioral Risk Factor Surveillance System, American Diabetes Association

©2014 CEOs for CITIESceosforcities.org