Embed Size (px)
Citation preview
SA Power Networks Regulatory Proposal
2015–20
An overview for South Australian electricity customers

Foreword from the CEO
1An overview for South Australian electricity customers
Foreword from the CEO
At SA Power Networks we recognise that electricity is the lifeblood of our community. We are one of our State’s major essential service providers, and we understand the responsibility we hold in delivery of our services for all South Australians.
We have a proud history of providing cost efficient, safe and reliable electricity supply for our customers. Recent benchmarking data gathered from across the industry by our Regulator shows that in addition to our network being one of the most reliable, we are also the most efficient distributor. But we know we cannot rest on the achievements of the past, as we are in a time of unprecedented change in the way customers use the distribution network. Customer expectations are changing as customers embrace new electricity supply technologies and service options becoming available to them.
Balancing current and future customer needs underpins the discussion, thinking and planning that has gone into our 2015–20 Regulatory Proposal.
This document provides an overview of the Proposal submitted to the Australian Energy Regulator on 31 October 2014, for the five year regulatory period that commences on 1 July 2015.
In preparing our Proposal, we have conducted an extensive and unprecedented level of consultation with our customers and interested stakeholders. I thank the many thousands of people across the State who participated in workshops, one-on-one meetings, surveys and various research projects.
Never before have we had the benefit of this quality of information on the things that customers value. We have used these valuable insights to improve the scope and balance of our investments in the network and the range of services to our customers and the South Australian community.
While our consultation with the community has clearly shown support for appropriate investment, we have also been very mindful of community concern regarding electricity prices. Our network charges are now about a third of the average residential electricity bill. Our Proposal will ensure that increases in electricity distribution charges for the next five years stay below CPI.
Through our Proposal we will continue to provide an efficient, reliable and safe distribution network for all South Australians. We will also be well placed to respond to our customers’ evolving needs and expectations in a changing electricity market.
Rob StobbeChief Executive Officer
About SA Power Networks
2 SA Power Networks Regulatory Proposal 2015–20
About SA Power NetworksSA Power Networks has always valued its key role in ensuring our electricity distribution network supports the needs and development of South Australia and its communities. We have proudly served South Australians for almost 70 years, initially as part of the Electricity Trust of South Australia, and then as a stand-alone distribution business established in the late 1990s when the electricity supply industry was transformed by a new regulatory framework.
As the South Australian Distribution Network Service Provider our primary responsibility is planning, building, operating and maintaining the South Australian electricity distribution network — an essential community asset and core component of the State’s energy infrastructure. We do this in a safe, reliable, efficient and prudent manner.
Our roleOur business is about connecting residential and business customers to a safe and reliable electricity supply. SA Power Networks’ key distribution activities include:• maintaining the network’s safety and reliability to meet
the current power supply needs of our customers;• extending and upgrading the network so that the future
power supply needs of customers are met when required;• operating the network on a day-to-day basis;• connecting new customers to the network;• maintaining the public lighting system;• reading electricity meters; • providing meter data to retailers; and• facilitating the connection of new energy technologies
such as solar panels.
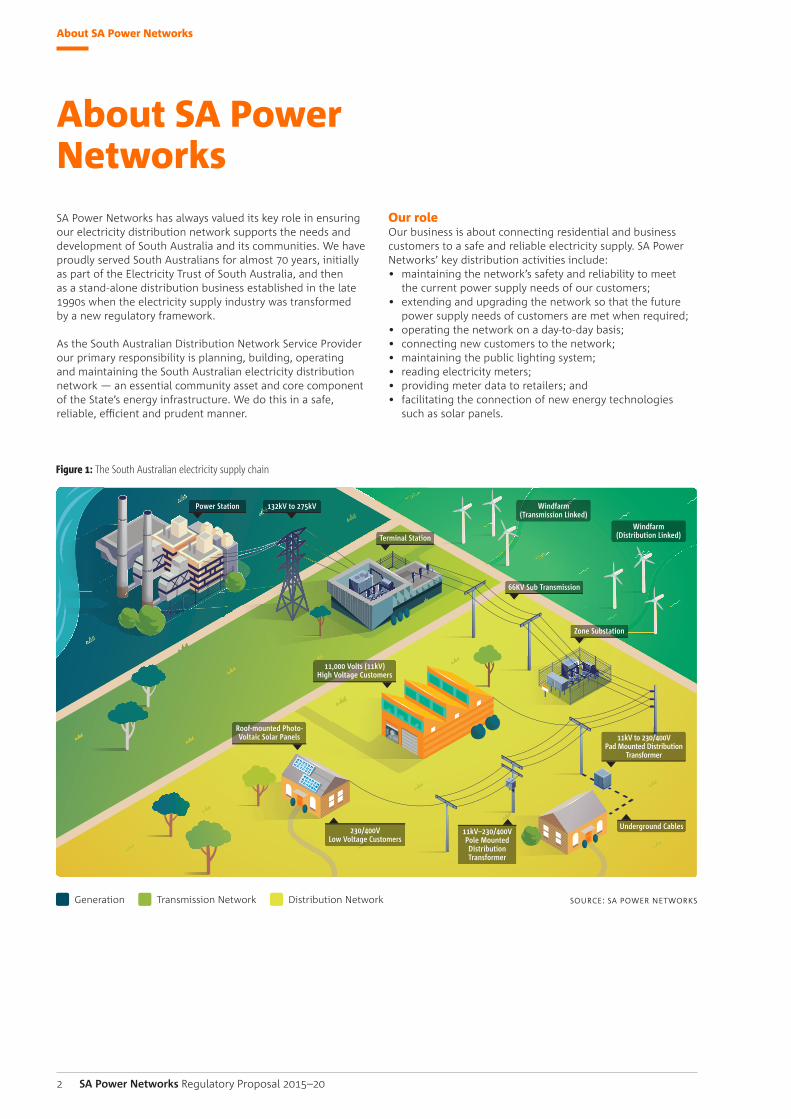
Generation Transmission Network Distribution Network
Figure 1: The South Australian electricity supply chain
Windfarm (Distribution Linked)
Windfarm (Transmission Linked)
Roof-mounted Photo-Voltaic Solar Panels
11,000 Volts (11kV) High Voltage Customers
11kV to 230/400V Pad Mounted Distribution
Transformer
66KV Sub Transmission
Zone Substation
Power Station
Terminal Station
132kV to 275kV
Underground Cables230/400V Low Voltage Customers
11kV–230/400V Pole Mounted Distribution Transformer
Source: SA power networkS
3An overview for South Australian electricity customers
Our customersThe electricity distribution network in South Australia is vast and complex, covering more than 178,000 km2 and stretching for 88,000 km. It includes 400 zone substations, 73,000 street transformers, more than 720,000 stobie poles and 200,000 km of wires. It supplies electricity to 743,918 residential, 99,180 business and 23 major business customers (at 30 June 2014).
Approximately 70% of our customers reside in the Adelaide area. However 70% of the network infrastructure is required to deliver energy to the remaining 30% of customers, who are spread widely across our extensive service territory. The average customer density across the State is the lowest in the National Electricity Market.
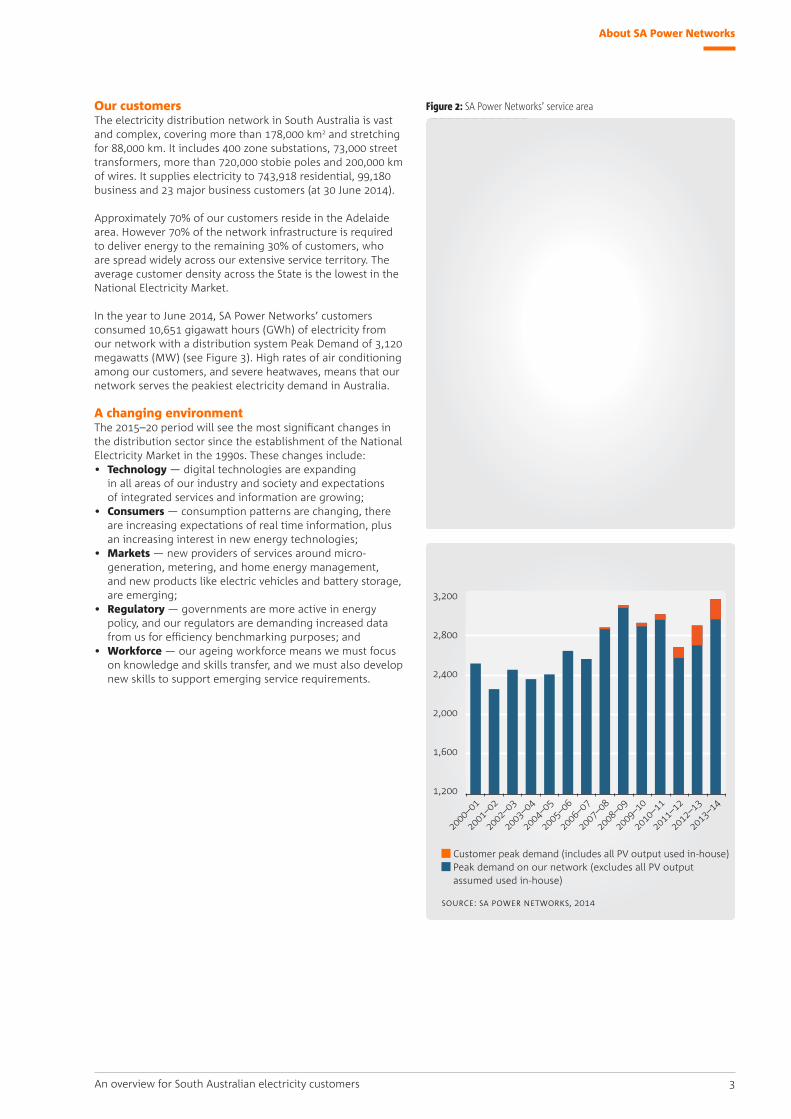
In the year to June 2014, SA Power Networks’ customers consumed 10,651 gigawatt hours (GWh) of electricity from our network with a distribution system Peak Demand of 3,120 megawatts (MW) (see Figure 3). High rates of air conditioning among our customers, and severe heatwaves, means that our network serves the peakiest electricity demand in Australia.
A changing environmentThe 2015–20 period will see the most significant changes in the distribution sector since the establishment of the National Electricity Market in the 1990s. These changes include:• Technology — digital technologies are expanding
in all areas of our industry and society and expectations of integrated services and information are growing;
• Consumers — consumption patterns are changing, there are increasing expectations of real time information, plus an increasing interest in new energy technologies;
• Markets — new providers of services around micro-generation, metering, and home energy management, and new products like electric vehicles and battery storage, are emerging;
• Regulatory — governments are more active in energy policy, and our regulators are demanding increased data from us for efficiency benchmarking purposes; and
• Workforce — our ageing workforce means we must focus on knowledge and skills transfer, and we must also develop new skills to support emerging service requirements.
About SA Power Networks
ceduna
kalkapipalyaljara
ernabellayunyarinyi
indulkaumuwamimili
amata
maralinga tjarutja lands
anangu pitjantjatjara yankunytjatjara lands
arkaroolabalcanoona
marla
manna hillyunta
maree
blinmanparachilna
oodnadatta
streaky baywudinna
cleve
port augusta
port piriewhyalla
barmera
fregonmintabie
cook rs barton rstarcoola rs
coober pedy
kingoonyaglendambo
cockburn
roxby downs
woomeramt gunson
iron knob
iron baron
andamooka beverley
moomba
yalata
oak valley
bordertown
yorketownmetro*
*metro includes: angle park, holden hill (office & depot), elizabeth (office & depot), keswick, marleston (office & depot), st marys (office & depot) & morphett vale
naracoorte
mount gambier
kadina clare
nuriootpa
gumeracha
murray bridgemount barker
victor harbor
port lincoln
kilometres
0 100 200 300 400 500
sa power networks coveragesa power networks depot locationsother distributorsaboriginal land (managed by sa power networks)remote areas electrical supply (managed by sa power networks)
aboriginal lands
kingscote
Source: SA power networkS
Figure 2: SA Power Networks’ service area
Figure 3: SA Power Networks’ peak demand (MW)
Customer peak demand (includes all PV output used in-house) Peak demand on our network (excludes all PV output assumed used in-house)
2005
–06
2004
–05
2003
–04
2002
–03
2001
–02
2000
–01
2006
–07
2007
–08
2008
–09
2009
–10
2010
–11
2011
–12
2012
–13
2013
–14
2,800
3,200
2,400
2,000
1,600
1,200
Source: SA power networkS, 2014
4 SA Power Networks Regulatory Proposal 2015–20
Our performanceReliabilitySA Power Networks’ network reliability is a key benchmark of our operational performance.
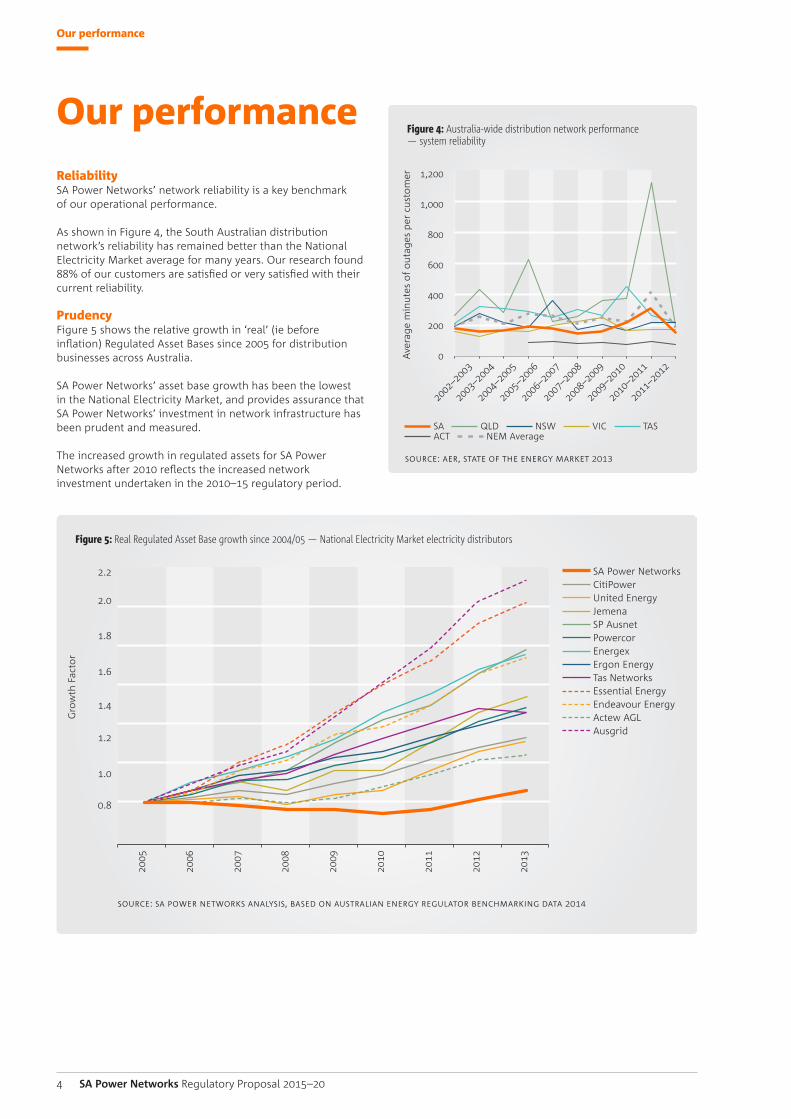
As shown in Figure 4, the South Australian distribution network’s reliability has remained better than the National Electricity Market average for many years. Our research found 88% of our customers are satisfied or very satisfied with their current reliability.
PrudencyFigure 5 shows the relative growth in ‘real’ (ie before inflation) Regulated Asset Bases since 2005 for distribution businesses across Australia.
SA Power Networks’ asset base growth has been the lowest in the National Electricity Market, and provides assurance that SA Power Networks’ investment in network infrastructure has been prudent and measured.
The increased growth in regulated assets for SA Power Networks after 2010 reflects the increased network investment undertaken in the 2010–15 regulatory period.
Our performance
Source: SA power networkS AnAlySiS, bASed on AuStrAliAn energy regulAtor benchmArking dAtA 2014
Figure 5: Real Regulated Asset Base growth since 2004/05 — National Electricity Market electricity distributors
SA Power Networks CitiPower United Energy Jemena SP Ausnet Powercor Energex Ergon Energy Tas Networks Essential Energy Endeavour Energy Actew AGL Ausgrid
Gro
wth
Fac
tor
2005
2006
2007
2008
2009
2010
2011
2012
2013
0.8
2.2
2.0
1.8
1.6
1.4
1.2
1.0
Figure 4: Australia-wide distribution network performance — system reliability
SA QLD NSW VIC TAS ACT NEM Average
Source: Aer, StAte of the energy mArket 2013
Ave
rage
min
utes
of
out
ages
per
cus
tom
er20
02–2
003
2003
–200
4
2004
–200
5
2005
–200
6
2006
–200
7
2007
–200
8
2008
–200
9
2009
–201
0
2010
–201
1
2011
–201
20
1,200
1,000
800
600
400
200
5An overview for South Australian electricity customers
Our performance
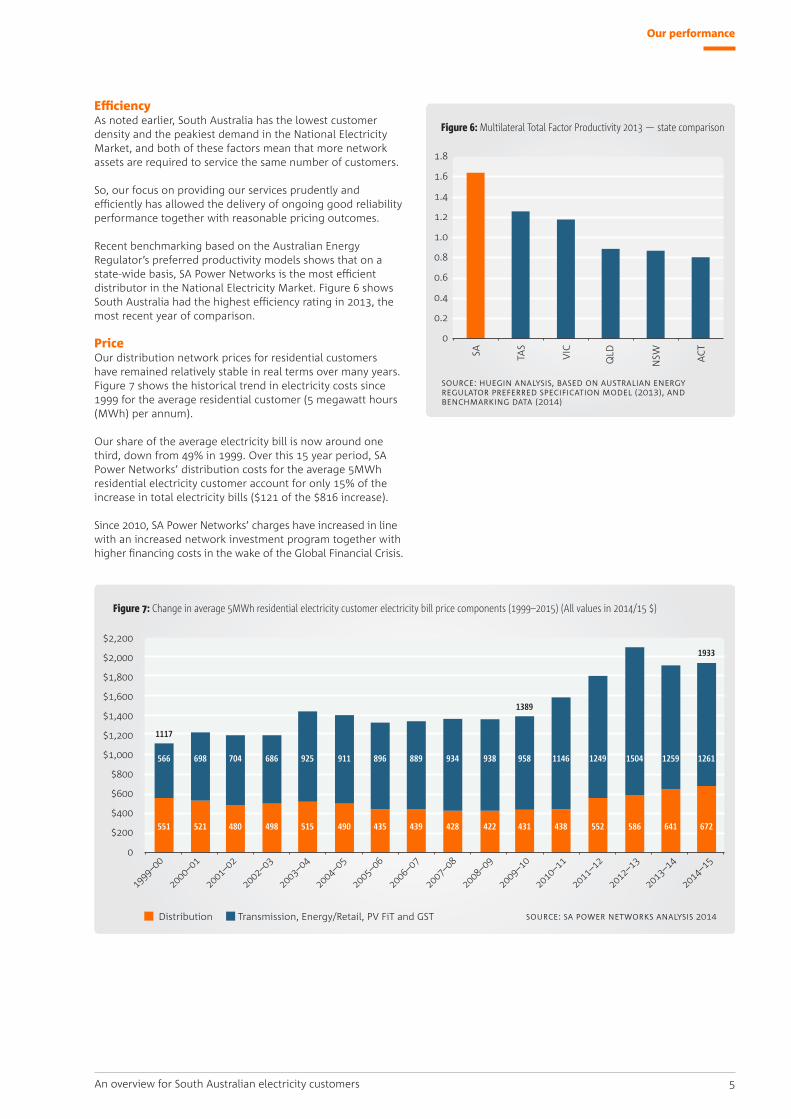
EfficiencyAs noted earlier, South Australia has the lowest customer density and the peakiest demand in the National Electricity Market, and both of these factors mean that more network assets are required to service the same number of customers.
So, our focus on providing our services prudently and efficiently has allowed the delivery of ongoing good reliability performance together with reasonable pricing outcomes.
Recent benchmarking based on the Australian Energy Regulator’s preferred productivity models shows that on a state-wide basis, SA Power Networks is the most efficient distributor in the National Electricity Market. Figure 6 shows South Australia had the highest efficiency rating in 2013, the most recent year of comparison.
PriceOur distribution network prices for residential customers have remained relatively stable in real terms over many years. Figure 7 shows the historical trend in electricity costs since 1999 for the average residential customer (5 megawatt hours (MWh) per annum).
Our share of the average electricity bill is now around one third, down from 49% in 1999. Over this 15 year period, SA Power Networks’ distribution costs for the average 5MWh residential electricity customer account for only 15% of the increase in total electricity bills ($121 of the $816 increase).
Since 2010, SA Power Networks’ charges have increased in line with an increased network investment program together with higher financing costs in the wake of the Global Financial Crisis.
Figure 7: Change in average 5MWh residential electricity customer electricity bill price components (1999–2015) (All values in 2014/15 $)
1999
–00
2000
–01
2001
–02
2002
–03
2003
–04
2004
–05
2005
–06
2006
–07
2007
–08
2008
–09
2009
–10
2010
–11
2011
–12
2012
–13
2013
–14
2014
–15
0
$2,200
$2,000
$1,800
$1,600
$1,400
$1,200
$1,000
$800
$600
$400
$200521 480 498 515 490 435 439 428 422 431 438 552 586 641 672
1117
1389
1933
551
698 704 686 925 911 896 889 934 938 958 1146 1249 1504 1259 1261566
Distribution Transmission, Energy/Retail, PV FiT and GST Source: SA power networkS AnAlySiS 2014
Figure 6: Multilateral Total Factor Productivity 2013 — state comparison
SA TAS
VIC
QLD
NSW ACT
0
1.8
1.6
1.4
1.2
1.0
0.8
0.6
0.4
0.2
Source: huegin AnAlySiS, bASed on AuStrAliAn energy regulAtor preferred SpecificAtion model (2013), And benchmArking dAtA (2014)
Our performance
Our peopleWe are one of the largest South Australian employers, with a growing and committed workforce of over 2,200 employees.
Our industry is technically specialised with an inherently high risk work environment, so it takes considerable time and money to train and develop new workers and apprentices. We invest in ongoing training, mentoring and graduate programs, as well as leadership and apprentice programs to ensure we have the right mix of skills and resources to meet current and future needs.
To address an historical bias to a male workforce, SA Power Networks is now increasing the number of women in our workforce and supporting their development, advancement and success.
Our safety performance has led our industry for many years. Safety is embedded in our business’ culture and ensuring safe outcomes for our people, contractors, customers and the South Australian community is our number one priority.
OutcomesSA Power Networks has consistently provided a strong, balanced performance across all key dimensions of our business. Over the current five year regulatory period, we have:• consistently met all regulated customer service standards;• maintained underlying network reliability;• maintained strong and productive stakeholder
relationships;• continued to set a safety performance benchmark in
our sector;• met all environmental obligations and successfully reduced
the organisation’s environmental footprint;• significantly increased our work program including
increased aged asset replacement;• managed key business risks and provided acceptable
returns to our owners; and• continued to be a major employer in South Australia.
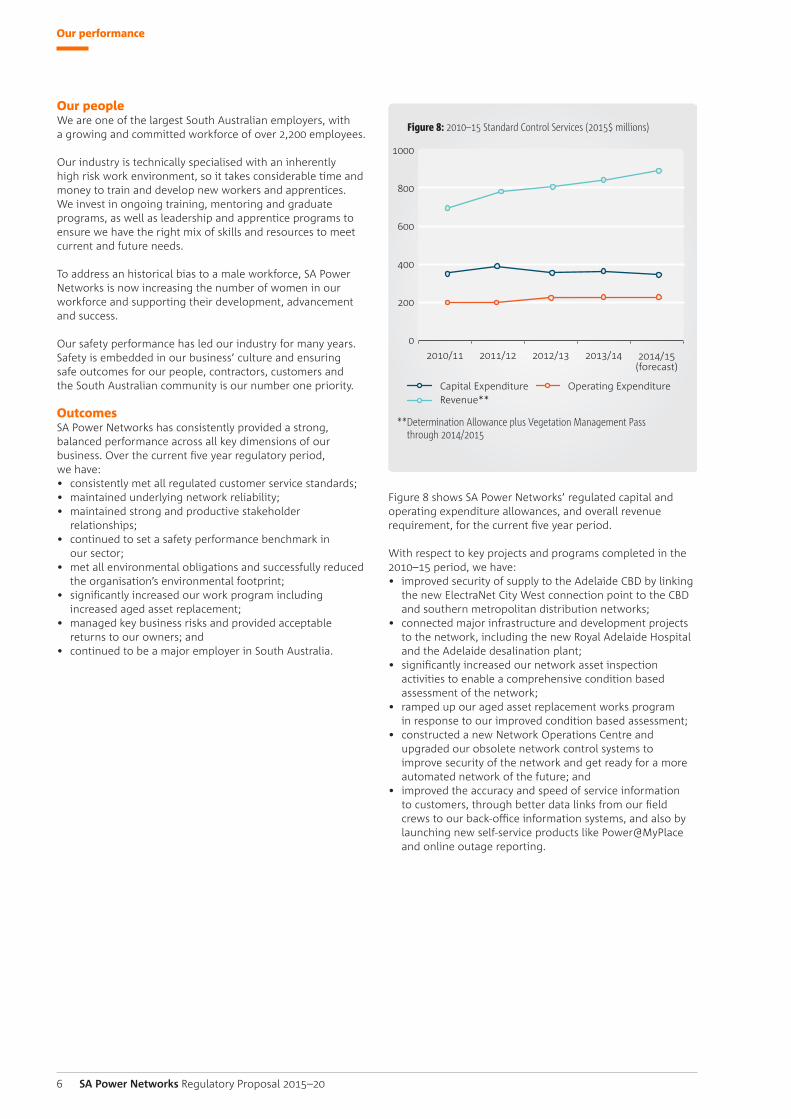
Figure 8 shows SA Power Networks’ regulated capital and operating expenditure allowances, and overall revenue requirement, for the current five year period.
With respect to key projects and programs completed in the 2010–15 period, we have:• improved security of supply to the Adelaide CBD by linking
the new ElectraNet City West connection point to the CBD and southern metropolitan distribution networks;
• connected major infrastructure and development projects to the network, including the new Royal Adelaide Hospital and the Adelaide desalination plant;
• significantly increased our network asset inspection activities to enable a comprehensive condition based assessment of the network;
• ramped up our aged asset replacement works program in response to our improved condition based assessment;
• constructed a new Network Operations Centre and upgraded our obsolete network control systems to improve security of the network and get ready for a more automated network of the future; and
• improved the accuracy and speed of service information to customers, through better data links from our field crews to our back-office information systems, and also by launching new self-service products like Power@MyPlace and online outage reporting.
Source: SA power networkS, 2014
6 SA Power Networks Regulatory Proposal 2015–20
Figure 8: 2010–15 Standard Control Services (2015$ millions)
** Determination Allowance plus Vegetation Management Pass through 2014/2015
Capital ExpenditureRevenue**
Operating Expenditure
2010/11 2011/12 2012/13 2013/14 2014/15(forecast)
0
1000
800
600
400
200
Our customer engagement
Our customer engagement
It is essential that our Regulatory Proposal addresses the concerns and expectations of our customers. So, we have designed and implemented a Customer Engagement Program to identify these concerns and expectations, and ensure they are factored into our planning.
Through our Customer Engagement Program over the past two years thousands of South Australians have participated in surveys or workshops across the State.
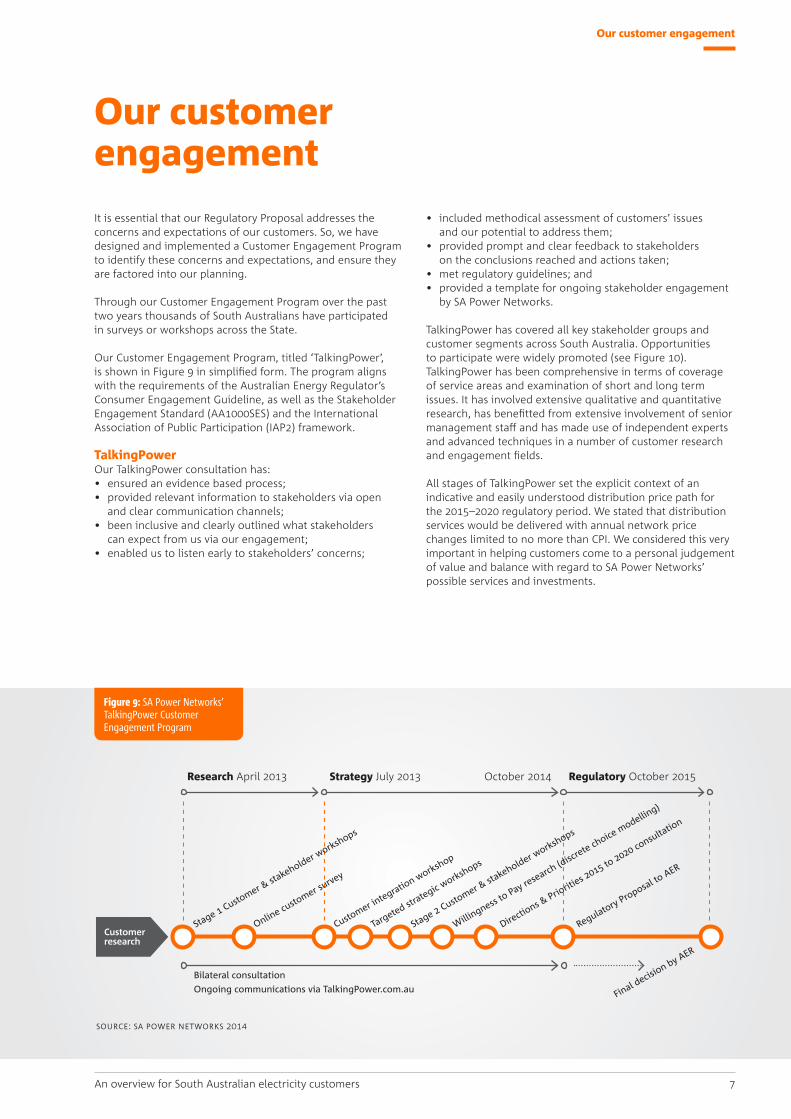
Our Customer Engagement Program, titled ‘TalkingPower’, is shown in Figure 9 in simplified form. The program aligns with the requirements of the Australian Energy Regulator’s Consumer Engagement Guideline, as well as the Stakeholder Engagement Standard (AA1000SES) and the International Association of Public Participation (IAP2) framework.
TalkingPowerOur TalkingPower consultation has:• ensured an evidence based process;• provided relevant information to stakeholders via open
and clear communication channels;• been inclusive and clearly outlined what stakeholders
can expect from us via our engagement;• enabled us to listen early to stakeholders’ concerns;
• included methodical assessment of customers’ issues and our potential to address them;
• provided prompt and clear feedback to stakeholders on the conclusions reached and actions taken;
• met regulatory guidelines; and• provided a template for ongoing stakeholder engagement
by SA Power Networks.
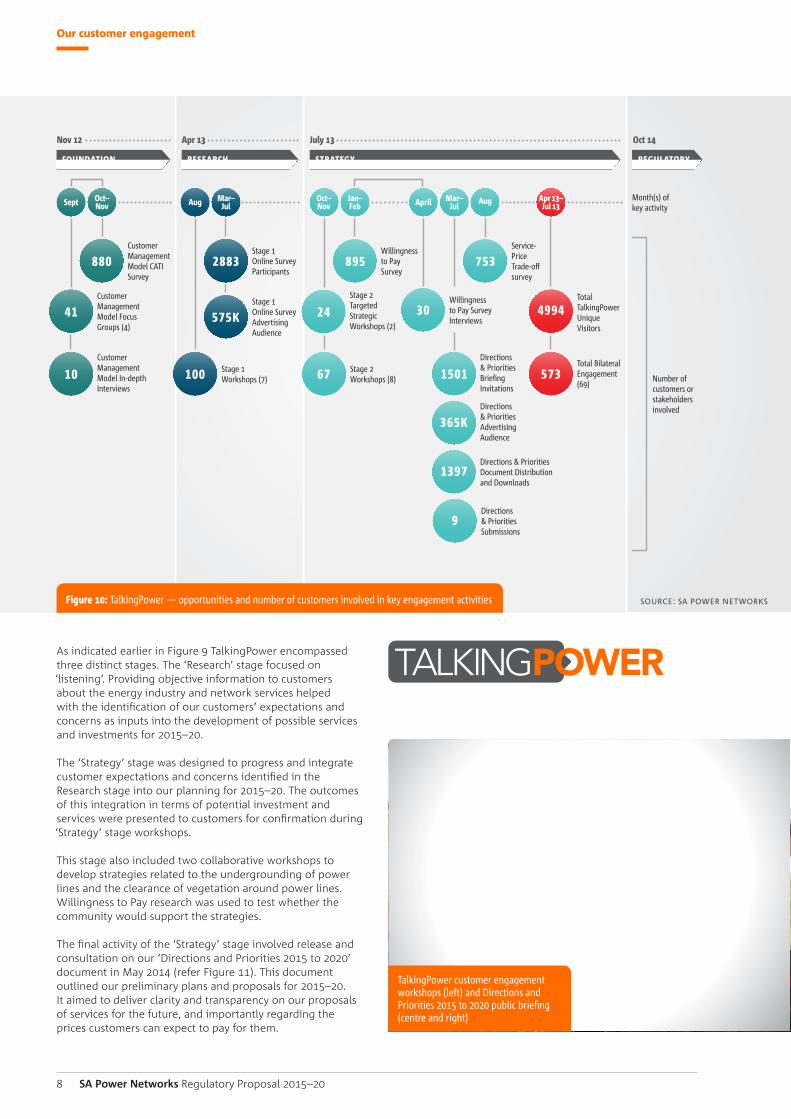
TalkingPower has covered all key stakeholder groups and customer segments across South Australia. Opportunities to participate were widely promoted (see Figure 10). TalkingPower has been comprehensive in terms of coverage of service areas and examination of short and long term issues. It has involved extensive qualitative and quantitative research, has benefitted from extensive involvement of senior management staff and has made use of independent experts and advanced techniques in a number of customer research and engagement fields.
All stages of TalkingPower set the explicit context of an indicative and easily understood distribution price path for the 2015–2020 regulatory period. We stated that distribution services would be delivered with annual network price changes limited to no more than CPI. We considered this very important in helping customers come to a personal judgement of value and balance with regard to SA Power Networks’ possible services and investments.
7An overview for South Australian electricity customers
Figure 9: SA Power Networks’ TalkingPower Customer Engagement Program
Research April 2013 Strategy July 2013 Regulatory October 2015October 2014
Customer in
tegration workshop
Targeted strategic w
orkshops
Directio
ns & Prio
rities 2
015 to 2020 co
nsultation
Regulatory Proposal to AER
Final decision by AER
Customer research
Source: SA power networkS 2014
Bilateral consultation Ongoing communications via TalkingPower.com.au
Willingness t
o Pay research (d
iscrete ch
oice modellin
g)
Stage 2 Customer &
stakeholder w
orkshops
Stage 1 Customer &
stakeholder w
orkshops
Online custo
mer survey
Our customer engagement
As indicated earlier in Figure 9 TalkingPower encompassed three distinct stages. The ‘Research’ stage focused on ‘listening’. Providing objective information to customers about the energy industry and network services helped with the identification of our customers’ expectations and concerns as inputs into the development of possible services and investments for 2015–20.
The ‘Strategy’ stage was designed to progress and integrate customer expectations and concerns identified in the Research stage into our planning for 2015–20. The outcomes of this integration in terms of potential investment and services were presented to customers for confirmation during ‘Strategy’ stage workshops.
This stage also included two collaborative workshops to develop strategies related to the undergrounding of power lines and the clearance of vegetation around power lines. Willingness to Pay research was used to test whether the community would support the strategies.
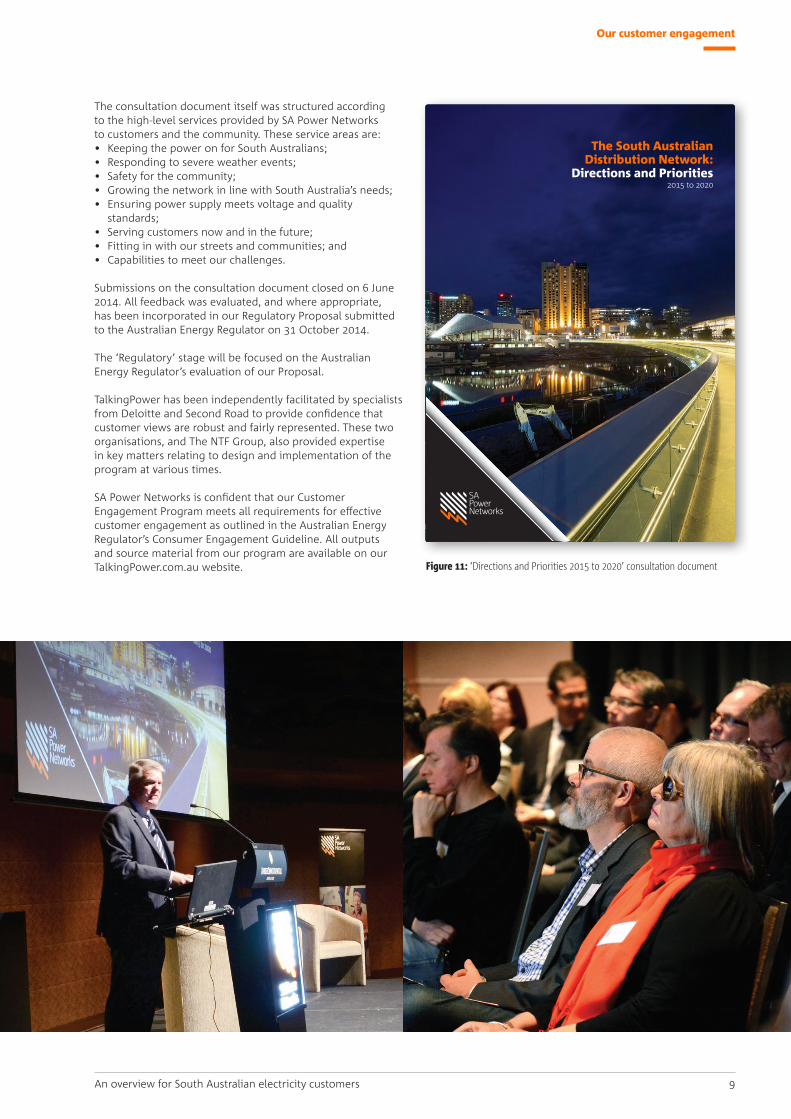
The final activity of the ‘Strategy’ stage involved release and consultation on our ‘Directions and Priorities 2015 to 2020’ document in May 2014 (refer Figure 11). This document outlined our preliminary plans and proposals for 2015–20. It aimed to deliver clarity and transparency on our proposals of services for the future, and importantly regarding the prices customers can expect to pay for them.
8 SA Power Networks Regulatory Proposal 2015–20
TalkingPower customer engagement workshops (left) and Directions and Priorities 2015 to 2020 public briefing (centre and right)
Nov 12
Willingness to Pay Survey
Stage 1 Online Survey Participants
Stage 2 Targeted Strategic Workshops (2)
Total TalkingPower Unique Visitors
Month(s) of key activity
Apr 13 Oct 14July 13
FOUNDATION RESEARCH STRATEGY
Customer Management Model Focus Groups (4)
Sept Aug AprilOct– Nov
Mar– Jul
Jan– Feb
AugOct– Nov
Mar– Jul
Apr 13– Jul 13
Customer Management Model CATI Survey
880
41
2883 895 753
24 30 4994
573Directions & Priorities Briefing Invitations
1501
Directions & Priorities Advertising Audience
365K
Directions & Priorities Document Distribution and Downloads
1397
Directions & Priorities Submissions
9
Stage 1 Online Survey Advertising Audience
575K
Customer Management Model In-depth Interviews
Stage 2 Workshops (8)
Stage 1 Workshops (7)10 67100
Total Bilateral Engagement (69)
Number of customers or stakeholders involved
Willingness to Pay Survey Interviews
Service- Price Trade-off survey
REGULATORY
Figure 10: TalkingPower — opportunities and number of customers involved in key engagement activities Source: SA power networkS
Our customer engagement
The consultation document itself was structured according to the high-level services provided by SA Power Networks to customers and the community. These service areas are:• Keeping the power on for South Australians;• Responding to severe weather events;• Safety for the community;• Growing the network in line with South Australia’s needs;• Ensuring power supply meets voltage and quality
standards;• Serving customers now and in the future;• Fitting in with our streets and communities; and• Capabilities to meet our challenges.
Submissions on the consultation document closed on 6 June 2014. All feedback was evaluated, and where appropriate, has been incorporated in our Regulatory Proposal submitted to the Australian Energy Regulator on 31 October 2014.
The ‘Regulatory’ stage will be focused on the Australian Energy Regulator’s evaluation of our Proposal.
TalkingPower has been independently facilitated by specialists from Deloitte and Second Road to provide confidence that customer views are robust and fairly represented. These two organisations, and The NTF Group, also provided expertise in key matters relating to design and implementation of the program at various times.
SA Power Networks is confident that our Customer Engagement Program meets all requirements for effective customer engagement as outlined in the Australian Energy Regulator’s Consumer Engagement Guideline. All outputs and source material from our program are available on our TalkingPower.com.au website.
9An overview for South Australian electricity customers
The South Australian Distribution Network:
Directions and Priorities 2015 to 2020
Figure 11: ‘Directions and Priorities 2015 to 2020’ consultation document
What you have told us
What you have told usTalkingPower has provided us with a depth and breadth of information on customer concerns and expectations that has not previously existed. This has allowed us to address those concerns and expectations in our plans, where appropriate, as well as to be confident that our proposals align with the short and long term interests of South Australians.
10 SA Power Networks Regulatory Proposal 2015–20
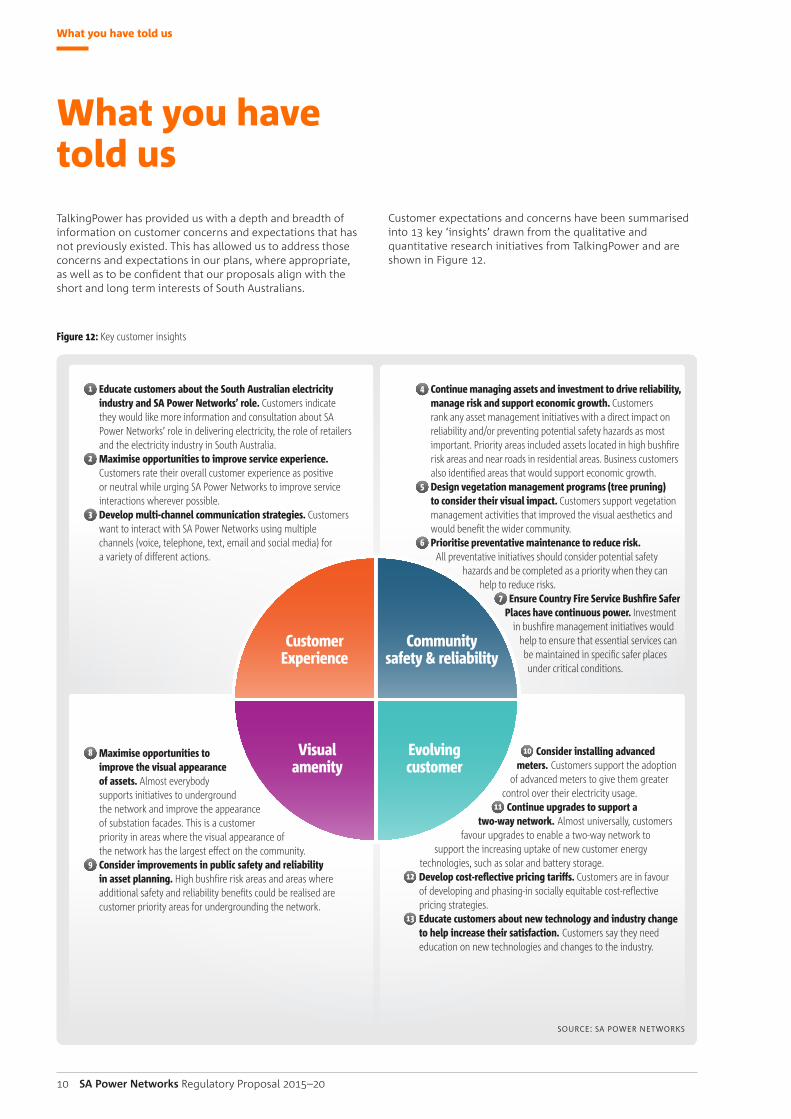
Customer expectations and concerns have been summarised into 13 key ‘insights’ drawn from the qualitative and quantitative research initiatives from TalkingPower and are shown in Figure 12.
1 Educate customers about the South Australian electricity industry and SA Power Networks’ role. Customers indicate they would like more information and consultation about SA Power Networks’ role in delivering electricity, the role of retailers and the electricity industry in South Australia.
2 Maximise opportunities to improve service experience.Customers rate their overall customer experience as positive or neutral while urging SA Power Networks to improve service interactions wherever possible.
3 Develop multi-channel communication strategies. Customers want to interact with SA Power Networks using multiple channels (voice, telephone, text, email and social media) for a variety of different actions.
8 Maximise opportunities to improve the visual appearance of assets. Almost everybody supports initiatives to underground the network and improve the appearance of substation facades. This is a customer priority in areas where the visual appearance of the network has the largest effect on the community.
9 Consider improvements in public safety and reliability in asset planning. High bushfire risk areas and areas where additional safety and reliability benefits could be realised are customer priority areas for undergrounding the network.
10 Consider installing advanced meters. Customers support the adoption
of advanced meters to give them greater control over their electricity usage.
11 Continue upgrades to support a two-way network. Almost universally, customers
favour upgrades to enable a two-way network to support the increasing uptake of new customer energy
technologies, such as solar and battery storage.12 Develop cost-reflective pricing tariffs. Customers are in favour
of developing and phasing-in socially equitable cost-reflective pricing strategies.
13 Educate customers about new technology and industry change to help increase their satisfaction. Customers say they need education on new technologies and changes to the industry.
4 Continue managing assets and investment to drive reliability, manage risk and support economic growth. Customers rank any asset management initiatives with a direct impact on reliability and/or preventing potential safety hazards as most important. Priority areas included assets located in high bushfire risk areas and near roads in residential areas. Business customers also identified areas that would support economic growth.
5 Design vegetation management programs (tree pruning) to consider their visual impact. Customers support vegetation management activities that improved the visual aesthetics and would benefit the wider community.
6 Prioritise preventative maintenance to reduce risk. All preventative initiatives should consider potential safety
hazards and be completed as a priority when they can help to reduce risks.
7 Ensure Country Fire Service Bushfire Safer Places have continuous power. Investment
in bushfire management initiatives would help to ensure that essential services can be maintained in specific safer places under critical conditions.
Customer Experience
Visual amenity
Community safety & reliability
Evolving customer
Figure 12: Key customer insights
Source: SA power networkS
How we have used your ideas
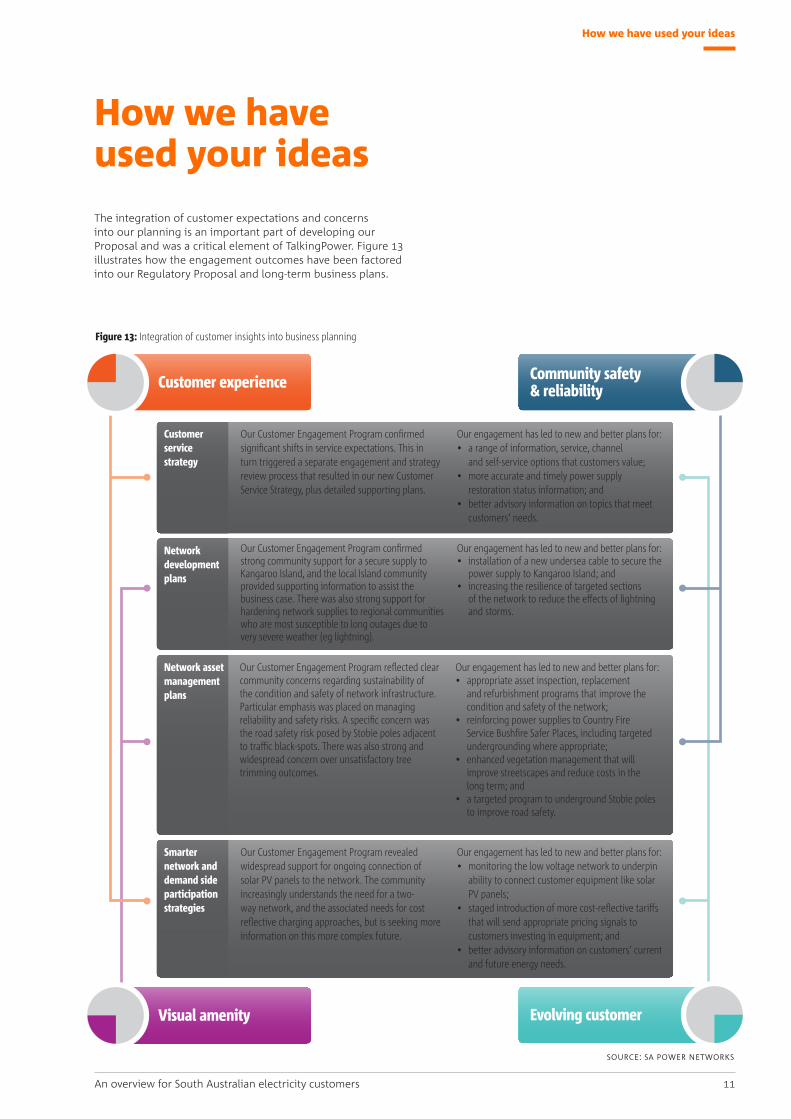
How we have used your ideasThe integration of customer expectations and concerns into our planning is an important part of developing our Proposal and was a critical element of TalkingPower. Figure 13 illustrates how the engagement outcomes have been factored into our Regulatory Proposal and long-term business plans.
11An overview for South Australian electricity customers
Figure 13: Integration of customer insights into business planning
Customer service strategy
Network development plans
Network asset management plans
Customer experience
Visual amenity
Community safety & reliability
Evolving customer
Smarter network and demand side participation strategies
Our Customer Engagement Program confirmed significant shifts in service expectations. This in turn triggered a separate engagement and strategy review process that resulted in our new Customer Service Strategy, plus detailed supporting plans.
Our engagement has led to new and better plans for:• a range of information, service, channel
and self-service options that customers value;• more accurate and timely power supply
restoration status information; and• better advisory information on topics that meet
customers’ needs.
Our Customer Engagement Program confirmed strong community support for a secure supply to Kangaroo Island, and the local Island community provided supporting information to assist the business case. There was also strong support for hardening network supplies to regional communities who are most susceptible to long outages due to very severe weather (eg lightning).
Our engagement has led to new and better plans for:• installation of a new undersea cable to secure the
power supply to Kangaroo Island; and• increasing the resilience of targeted sections
of the network to reduce the effects of lightning and storms.
Our Customer Engagement Program reflected clear community concerns regarding sustainability of the condition and safety of network infrastructure. Particular emphasis was placed on managing reliability and safety risks. A specific concern was the road safety risk posed by Stobie poles adjacent to traffic black-spots. There was also strong and widespread concern over unsatisfactory tree trimming outcomes.
Our engagement has led to new and better plans for:• appropriate asset inspection, replacement
and refurbishment programs that improve the condition and safety of the network;
• reinforcing power supplies to Country Fire Service Bushfire Safer Places, including targeted undergrounding where appropriate;
• enhanced vegetation management that will improve streetscapes and reduce costs in the long term; and
• a targeted program to underground Stobie poles to improve road safety.
Our Customer Engagement Program revealed widespread support for ongoing connection of solar PV panels to the network. The community increasingly understands the need for a two-way network, and the associated needs for cost reflective charging approaches, but is seeking more information on this more complex future.
Our engagement has led to new and better plans for:• monitoring the low voltage network to underpin
ability to connect customer equipment like solar PV panels;
• staged introduction of more cost-reflective tariffs that will send appropriate pricing signals to customers investing in equipment; and
• better advisory information on customers’ current and future energy needs.
Source: SA power networkS
Our key areas of focus in 2015–20
During 2015–20 we propose to:• continue to augment the network to meet local area and
customer needs;• provide security of supply for key areas of the network,
including installing a new undersea cable to Kangaroo Island; and
• continue to connect customers efficiently and promptly.
In the 2015–20 period we propose capital expenditure of $486m to ensure capacity is available to meet peak demand and to provide security of supply.
Network asset replacementThe South Australian distribution network covers a vast territory. Most of the network is above ground with 70% of the network assets serving the 30% of customers outside of Adelaide. Much of our existing network assets were built in the 1950s, 1960s and early 1970s. SA Power Networks now operates one of the oldest network asset fleets in Australia.
We are obligated under the Electricity Act 1996 and our Distribution Licence to prepare and comply with a Safety, Reliability, Maintenance and Technical Management Plan. This plan lays out the safety and technical compliance management framework agreed between the South Australian Office of the Technical Regulator and SA Power Networks, and is approved annually by the Essential Services Commission of South Australia.
During the 2010–15 period, SA Power Networks has significantly increased asset inspection activities. These have identified that based on condition and age a substantial increase in asset replacement works is required. This work has commenced in the current period and will need to continue over the next five to 15 years if we are to manage the increasing level of network risk.
Our key areas of focus in 2015–20The key programs of work encompassed by our Proposal, and the service areas that they relate to (shown in brackets), are:• Network augmentation and security
(Growing the network in line with South Australia’s needs);• Network asset replacement
(Keeping the power on for South Australians);• Hardening the network
(Responding to severe weather events);• Vegetation management
(Fitting in with our streets and communities);• Bushfire risk mitigation and road safety
(Safety for the community);• Customer service strategy
(Serving customers now and in the future);• Cost-reflective tariffs and demand side participation
(Serving customers now and in the future); and• People and facilities
(Capabilities to meet our challenges).
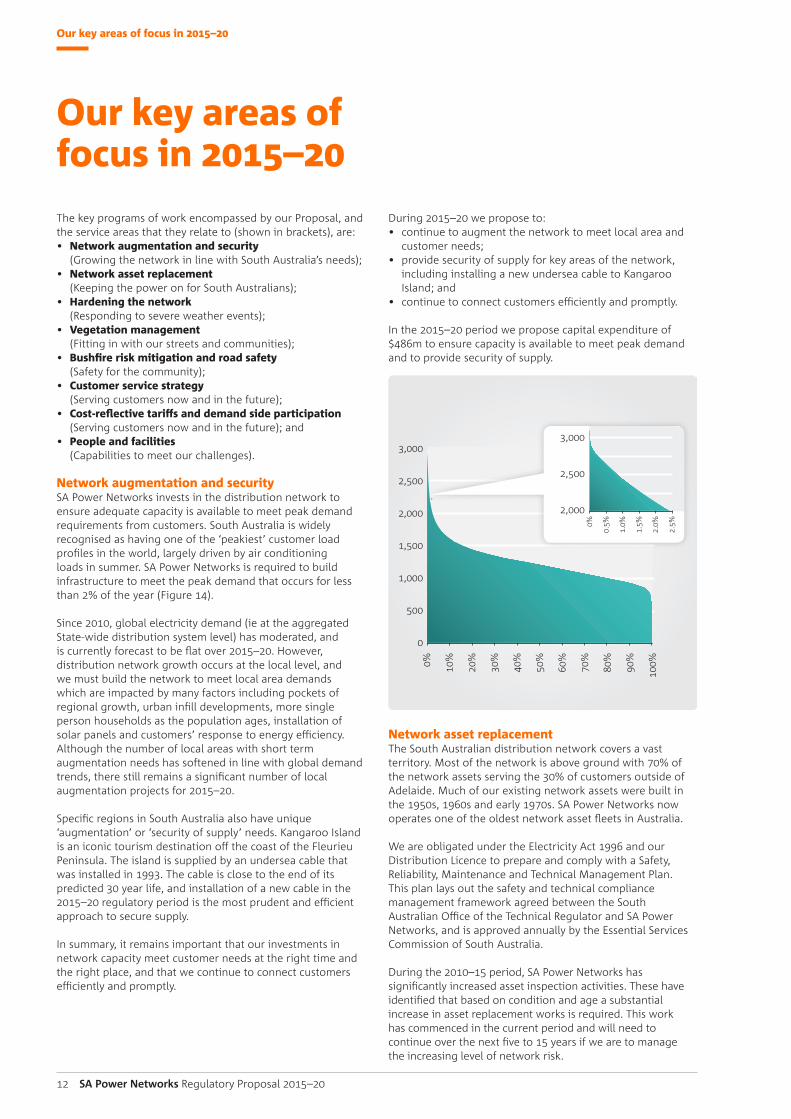
Network augmentation and securitySA Power Networks invests in the distribution network to ensure adequate capacity is available to meet peak demand requirements from customers. South Australia is widely recognised as having one of the ‘peakiest’ customer load profiles in the world, largely driven by air conditioning loads in summer. SA Power Networks is required to build infrastructure to meet the peak demand that occurs for less than 2% of the year (Figure 14).
Since 2010, global electricity demand (ie at the aggregated State-wide distribution system level) has moderated, and is currently forecast to be flat over 2015–20. However, distribution network growth occurs at the local level, and we must build the network to meet local area demands which are impacted by many factors including pockets of regional growth, urban infill developments, more single person households as the population ages, installation of solar panels and customers’ response to energy efficiency. Although the number of local areas with short term augmentation needs has softened in line with global demand trends, there still remains a significant number of local augmentation projects for 2015–20.
Specific regions in South Australia also have unique ‘augmentation’ or ‘security of supply’ needs. Kangaroo Island is an iconic tourism destination off the coast of the Fleurieu Peninsula. The island is supplied by an undersea cable that was installed in 1993. The cable is close to the end of its predicted 30 year life, and installation of a new cable in the 2015–20 regulatory period is the most prudent and efficient approach to secure supply.
In summary, it remains important that our investments in network capacity meet customer needs at the right time and the right place, and that we continue to connect customers efficiently and promptly.
12 SA Power Networks Regulatory Proposal 2015–20
Figure 14: South Australia’s total electricity system demand (MW)
Source: SA power networkS 2014
0% 20%
10%
30%
50%
70%
90%
40%
60%
80%
100%
3,000
2,500
2,000
1,500
1,000
500
0
3,000
2,500
2,000
0%
0.5%
1.5%
2.5%
1.0%
2.0%
Our key areas of focus in 2015–20
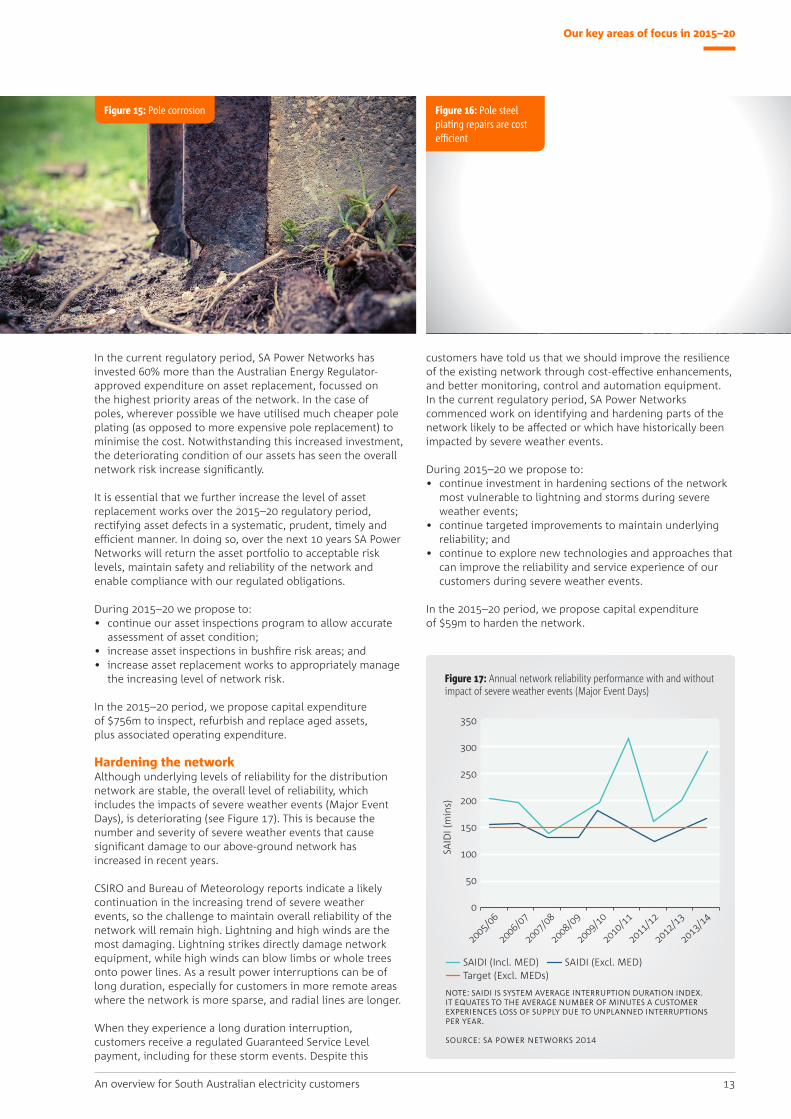
In the current regulatory period, SA Power Networks has invested 60% more than the Australian Energy Regulator-approved expenditure on asset replacement, focussed on the highest priority areas of the network. In the case of poles, wherever possible we have utilised much cheaper pole plating (as opposed to more expensive pole replacement) to minimise the cost. Notwithstanding this increased investment, the deteriorating condition of our assets has seen the overall network risk increase significantly.
It is essential that we further increase the level of asset replacement works over the 2015–20 regulatory period, rectifying asset defects in a systematic, prudent, timely and efficient manner. In doing so, over the next 10 years SA Power Networks will return the asset portfolio to acceptable risk levels, maintain safety and reliability of the network and enable compliance with our regulated obligations.
During 2015–20 we propose to:• continue our asset inspections program to allow accurate
assessment of asset condition;• increase asset inspections in bushfire risk areas; and• increase asset replacement works to appropriately manage
the increasing level of network risk.
In the 2015–20 period, we propose capital expenditure of $756m to inspect, refurbish and replace aged assets, plus associated operating expenditure.
Hardening the networkAlthough underlying levels of reliability for the distribution network are stable, the overall level of reliability, which includes the impacts of severe weather events (Major Event Days), is deteriorating (see Figure 17). This is because the number and severity of severe weather events that cause significant damage to our above-ground network has increased in recent years.
CSIRO and Bureau of Meteorology reports indicate a likely continuation in the increasing trend of severe weather events, so the challenge to maintain overall reliability of the network will remain high. Lightning and high winds are the most damaging. Lightning strikes directly damage network equipment, while high winds can blow limbs or whole trees onto power lines. As a result power interruptions can be of long duration, especially for customers in more remote areas where the network is more sparse, and radial lines are longer.
When they experience a long duration interruption, customers receive a regulated Guaranteed Service Level payment, including for these storm events. Despite this
customers have told us that we should improve the resilience of the existing network through cost-effective enhancements, and better monitoring, control and automation equipment.In the current regulatory period, SA Power Networks commenced work on identifying and hardening parts of the network likely to be affected or which have historically been impacted by severe weather events.
During 2015–20 we propose to:• continue investment in hardening sections of the network
most vulnerable to lightning and storms during severe weather events;
• continue targeted improvements to maintain underlying reliability; and
• continue to explore new technologies and approaches that can improve the reliability and service experience of our customers during severe weather events.
In the 2015–20 period, we propose capital expenditure of $59m to harden the network.
13An overview for South Australian electricity customers
Figure 15: Pole corrosion Figure 16: Pole steel plating repairs are cost efficient
Figure 17: Annual network reliability performance with and without impact of severe weather events (Major Event Days)
2005
/06
2006
/07
2007
/08
2008
/09
2009
/10
2010
/11
2011
/12
2012
/13
2013
/14
0
350
300
250
200
150
100
50
SAID
I (m
ins)
SAIDI (Incl. MED) SAIDI (Excl. MED) Target (Excl. MEDs)
note: SAidi iS SyStem AverAge interruption durAtion index. it equAteS to the AverAge number of minuteS A cuStomer experienceS loSS of Supply due to unplAnned interruptionS per yeAr.
Source: SA power networkS 2014
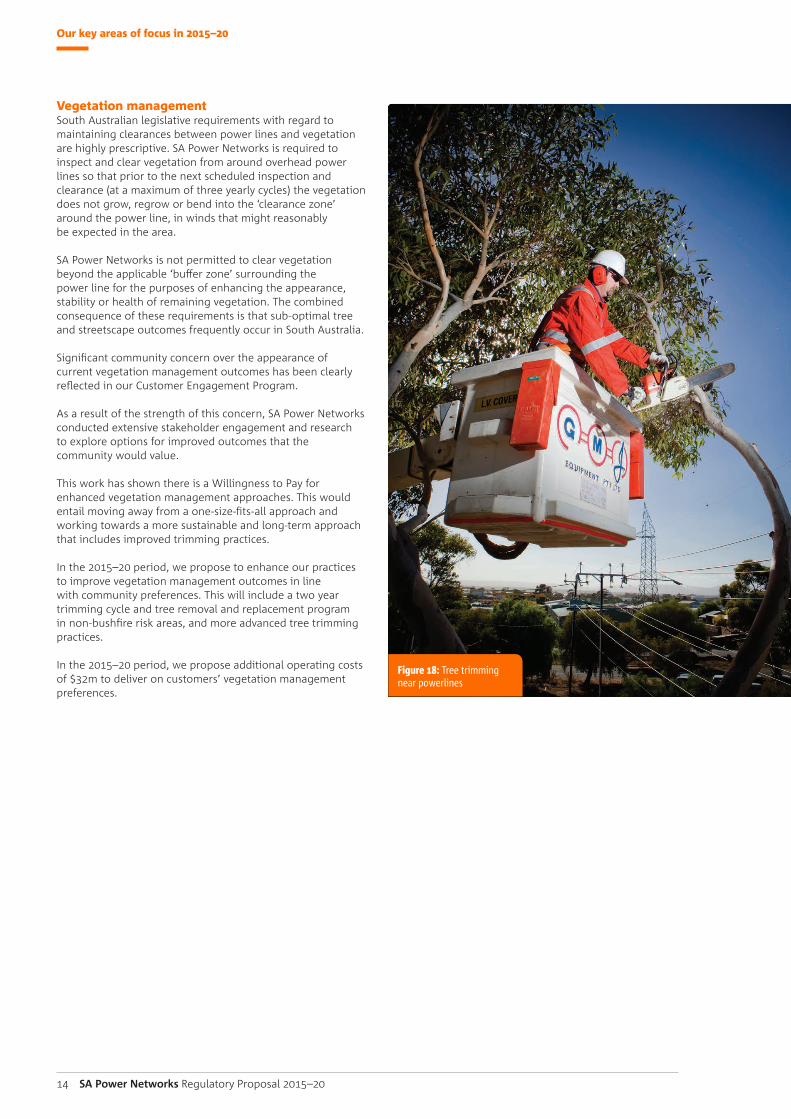
Vegetation managementSouth Australian legislative requirements with regard to maintaining clearances between power lines and vegetation are highly prescriptive. SA Power Networks is required to inspect and clear vegetation from around overhead power lines so that prior to the next scheduled inspection and clearance (at a maximum of three yearly cycles) the vegetation does not grow, regrow or bend into the ‘clearance zone’ around the power line, in winds that might reasonably be expected in the area.
SA Power Networks is not permitted to clear vegetation beyond the applicable ‘buffer zone’ surrounding the power line for the purposes of enhancing the appearance, stability or health of remaining vegetation. The combined consequence of these requirements is that sub-optimal tree and streetscape outcomes frequently occur in South Australia.
Significant community concern over the appearance of current vegetation management outcomes has been clearly reflected in our Customer Engagement Program.
As a result of the strength of this concern, SA Power Networks conducted extensive stakeholder engagement and research to explore options for improved outcomes that the community would value.
This work has shown there is a Willingness to Pay for enhanced vegetation management approaches. This would entail moving away from a one-size-fits-all approach and working towards a more sustainable and long-term approach that includes improved trimming practices.
In the 2015–20 period, we propose to enhance our practices to improve vegetation management outcomes in line with community preferences. This will include a two year trimming cycle and tree removal and replacement program in non-bushfire risk areas, and more advanced tree trimming practices.
In the 2015–20 period, we propose additional operating costs of $32m to deliver on customers’ vegetation management preferences.
Our key areas of focus in 2015–20
14 SA Power Networks Regulatory Proposal 2015–20
Figure 18: Tree trimming near powerlines
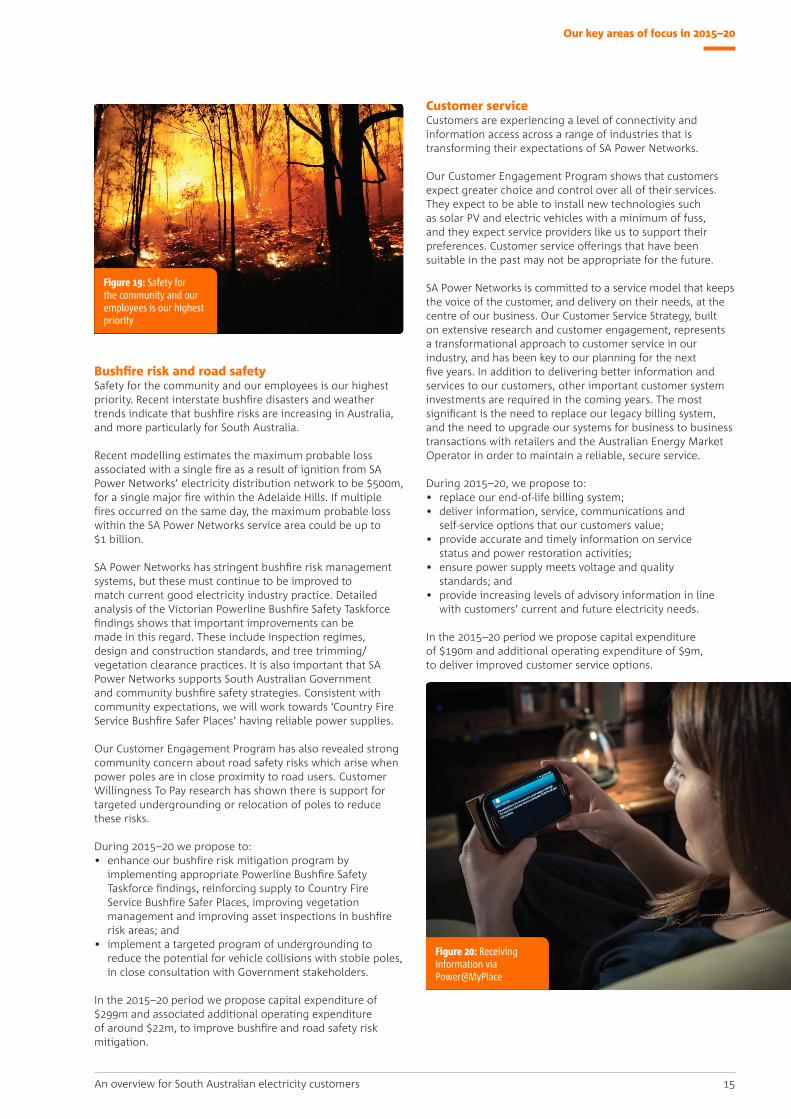
Bushfire risk and road safetySafety for the community and our employees is our highest priority. Recent interstate bushfire disasters and weather trends indicate that bushfire risks are increasing in Australia, and more particularly for South Australia.
Recent modelling estimates the maximum probable loss associated with a single fire as a result of ignition from SA Power Networks’ electricity distribution network to be $500m, for a single major fire within the Adelaide Hills. If multiple fires occurred on the same day, the maximum probable loss within the SA Power Networks service area could be up to $1 billion.
SA Power Networks has stringent bushfire risk management systems, but these must continue to be improved to match current good electricity industry practice. Detailed analysis of the Victorian Powerline Bushfire Safety Taskforce findings shows that important improvements can be made in this regard. These include inspection regimes, design and construction standards, and tree trimming/vegetation clearance practices. It is also important that SA Power Networks supports South Australian Government and community bushfire safety strategies. Consistent with community expectations, we will work towards ‘Country Fire Service Bushfire Safer Places’ having reliable power supplies.
Our Customer Engagement Program has also revealed strong community concern about road safety risks which arise when power poles are in close proximity to road users. Customer Willingness To Pay research has shown there is support for targeted undergrounding or relocation of poles to reduce these risks.
During 2015–20 we propose to:• enhance our bushfire risk mitigation program by
implementing appropriate Powerline Bushfire Safety Taskforce findings, reinforcing supply to Country Fire Service Bushfire Safer Places, improving vegetation management and improving asset inspections in bushfire risk areas; and
• implement a targeted program of undergrounding to reduce the potential for vehicle collisions with stobie poles, in close consultation with Government stakeholders.
In the 2015–20 period we propose capital expenditure of $299m and associated additional operating expenditure of around $22m, to improve bushfire and road safety risk mitigation.
Customer serviceCustomers are experiencing a level of connectivity and information access across a range of industries that is transforming their expectations of SA Power Networks.
Our Customer Engagement Program shows that customers expect greater choice and control over all of their services. They expect to be able to install new technologies such as solar PV and electric vehicles with a minimum of fuss, and they expect service providers like us to support their preferences. Customer service offerings that have been suitable in the past may not be appropriate for the future.
SA Power Networks is committed to a service model that keeps the voice of the customer, and delivery on their needs, at the centre of our business. Our Customer Service Strategy, built on extensive research and customer engagement, represents a transformational approach to customer service in our industry, and has been key to our planning for the next five years. In addition to delivering better information and services to our customers, other important customer system investments are required in the coming years. The most significant is the need to replace our legacy billing system, and the need to upgrade our systems for business to business transactions with retailers and the Australian Energy Market Operator in order to maintain a reliable, secure service.
During 2015–20, we propose to:• replace our end-of-life billing system;• deliver information, service, communications and
self-service options that our customers value;• provide accurate and timely information on service
status and power restoration activities;• ensure power supply meets voltage and quality
standards; and• provide increasing levels of advisory information in line
with customers’ current and future electricity needs.
In the 2015–20 period we propose capital expenditure of $190m and additional operating expenditure of $9m, to deliver improved customer service options.
Our key areas of focus in 2015–20
15An overview for South Australian electricity customers
Figure 19: Safety for the community and our employees is our highest priority
Figure 20: Receiving information via Power@MyPlace
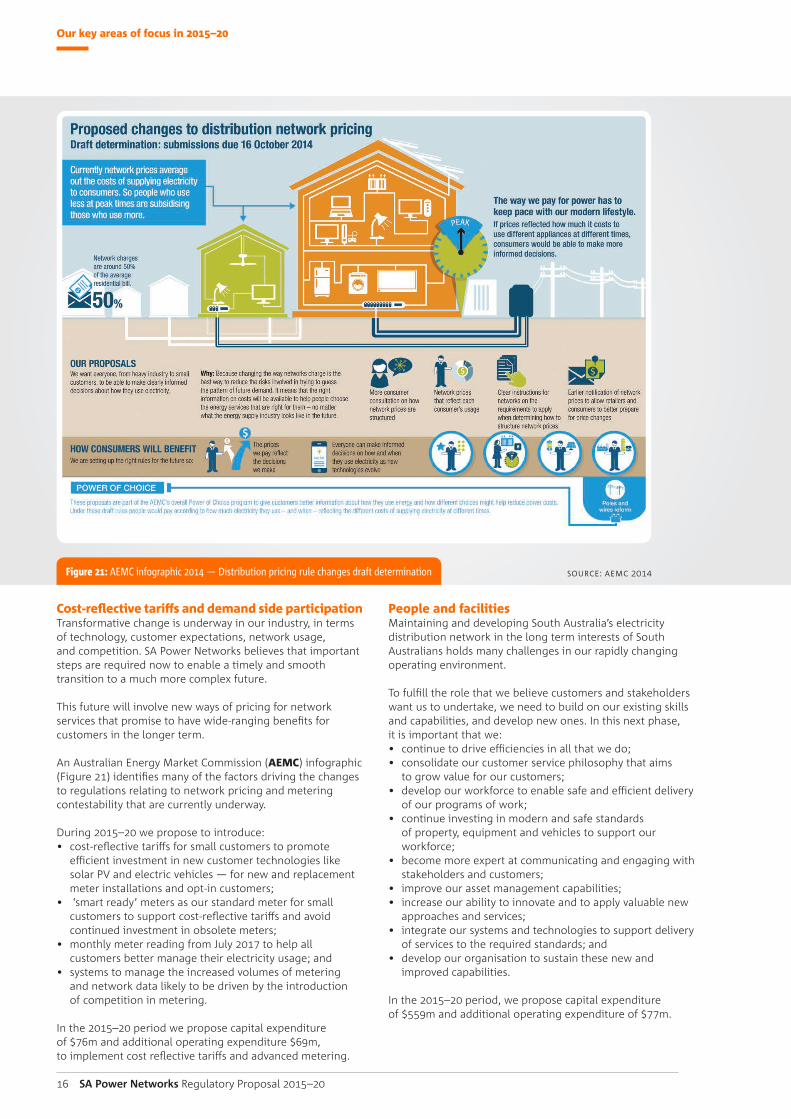
Cost-reflective tariffs and demand side participationTransformative change is underway in our industry, in terms of technology, customer expectations, network usage, and competition. SA Power Networks believes that important steps are required now to enable a timely and smooth transition to a much more complex future.
This future will involve new ways of pricing for network services that promise to have wide-ranging benefits for customers in the longer term.
An Australian Energy Market Commission (AEMC) infographic (Figure 21) identifies many of the factors driving the changes to regulations relating to network pricing and metering contestability that are currently underway.
During 2015–20 we propose to introduce:• cost-reflective tariffs for small customers to promote
efficient investment in new customer technologies like solar PV and electric vehicles — for new and replacement meter installations and opt-in customers;
• ‘smart ready’ meters as our standard meter for small customers to support cost-reflective tariffs and avoid continued investment in obsolete meters;
• monthly meter reading from July 2017 to help all customers better manage their electricity usage; and
• systems to manage the increased volumes of metering and network data likely to be driven by the introduction of competition in metering.
In the 2015–20 period we propose capital expenditure of $76m and additional operating expenditure $69m, to implement cost reflective tariffs and advanced metering.
Our key areas of focus in 2015–20
16 SA Power Networks Regulatory Proposal 2015–20
People and facilitiesMaintaining and developing South Australia’s electricity distribution network in the long term interests of South Australians holds many challenges in our rapidly changing operating environment.
To fulfill the role that we believe customers and stakeholders want us to undertake, we need to build on our existing skills and capabilities, and develop new ones. In this next phase, it is important that we:• continue to drive efficiencies in all that we do;• consolidate our customer service philosophy that aims
to grow value for our customers;• develop our workforce to enable safe and efficient delivery
of our programs of work;• continue investing in modern and safe standards
of property, equipment and vehicles to support our workforce;
• become more expert at communicating and engaging with stakeholders and customers;
• improve our asset management capabilities;• increase our ability to innovate and to apply valuable new
approaches and services;• integrate our systems and technologies to support delivery
of services to the required standards; and• develop our organisation to sustain these new and
improved capabilities.
In the 2015–20 period, we propose capital expenditure of $559m and additional operating expenditure of $77m.
Figure 21: AEMC infographic 2014 — Distribution pricing rule changes draft determination Source: Aemc 2014
Summary of our 2015–20 Proposal
17An overview for South Australian electricity customers
Summary of our 2015–20 ProposalOur total revenue for the next five years is forecast to be $4.4 billion (June 15 $) compared with $4.15 billion (June 15 $) over current five years (for our distribution services, excluding metering). The key areas of focus described above explain the work programs that will meet our regulated obligations and address the concerns and expectations of our customers, as expressed through our Customer Engagement Program.
There are differences in our work programs for the 2015–20 period, compared to the current 2010–15 period. We will increase expenditure in specific areas to:
• increase replacement of our ageing assets to maintain network safety and reliability performance, and return the risk profile of the network assets to acceptable levels;
• improve the resilience of the most vulnerable parts of the network to improve the service experience of our worst served customers during severe weather events;
• improve our vegetation management practices in line with community preferences;
• reduce the likelihood of our network starting bushfires, reinforce power supply to Country Fire Service Bushfire Safer Places, and contribute to improved road safety by removing or relocating Stobie poles from roadsides in targeted locations;
• improve the service experience of our customers, by providing more self-service options and more accurate and timely information on power restoration status;
• commence installation of more advanced meters, supporting regulatory requirements to increase the cost-reflectivity of our tariffs; and
• equip our business and employees with the systems, fleet and property resources they need to meet our regulatory obligations and work program requirements.
Offsetting these increased expenditures is reduced investment to augment the capacity of the network, in line with
some moderation of customer peak demand growth since 2011. There will also be a reduction in our allowed capital expenditure financing costs, in line with recent financial market trends.
The tables and figures that follow summarise total capital and operating expenditures, and the resulting revenue and customer charge outcomes proposed for the 2015–20 period. The tables refer to the following regulatory categories, to allow comparison with information in the detailed Regulatory Proposal document:
• ‘Standard Control Services’ costs are those recovered through our standard distribution tariffs. They are paid by all, or most, customers; and
• ‘Alternative Control Services’ costs are recovered from the individual customers receiving the specific service. Recent changes by the Australian Energy Regulator mean that the majority of metering and related services costs now fall into this category.
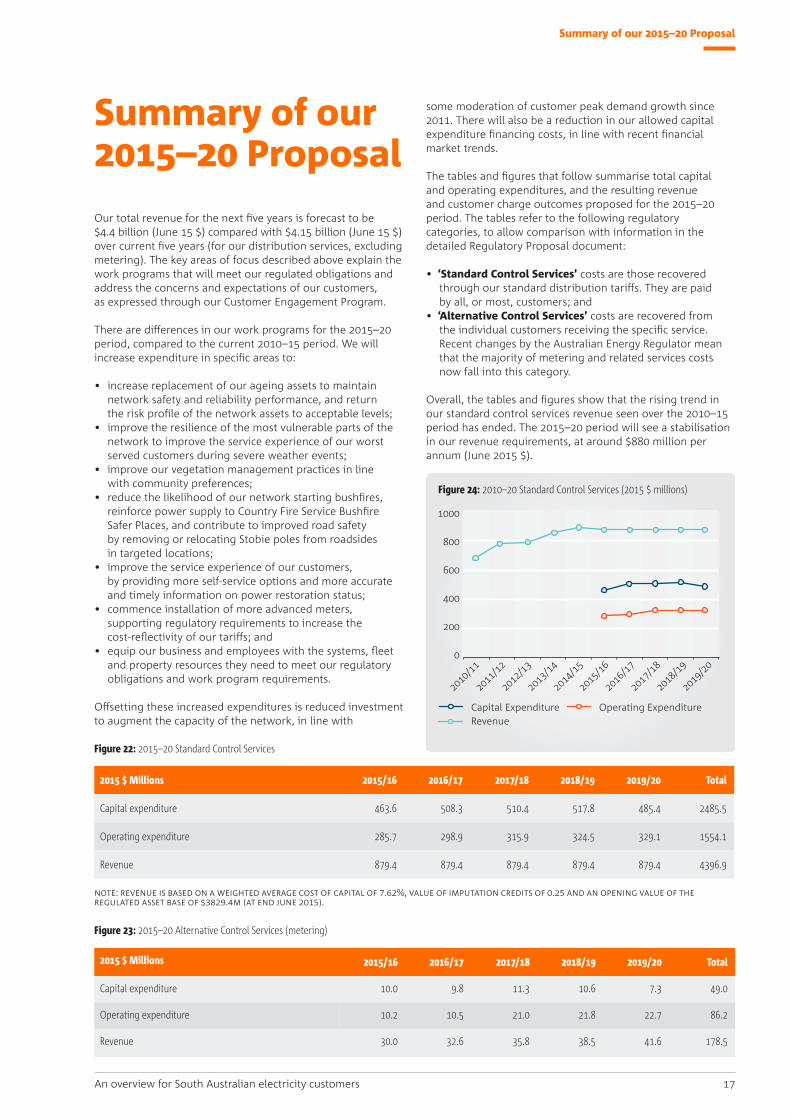
Overall, the tables and figures show that the rising trend in our standard control services revenue seen over the 2010–15 period has ended. The 2015–20 period will see a stabilisation in our revenue requirements, at around $880 million per annum (June 2015 $).
note: revenue iS bASed on A weighted AverAge coSt of cApitAl of 7.62%, vAlue of imputAtion creditS of 0.25 And An opening vAlue of the regulAted ASSet bASe of $3829.4m (At end June 2015).
2015 $ Millions 2015/16 2016/17 2017/18 2018/19 2019/20 Total
Capital expenditure 463.6 508.3 510.4 517.8 485.4 2485.5
Operating expenditure 285.7 298.9 315.9 324.5 329.1 1554.1
Revenue 879.4 879.4 879.4 879.4 879.4 4396.9
2015 $ Millions 2015/16 2016/17 2017/18 2018/19 2019/20 Total
Capital expenditure 10.0 9.8 11.3 10.6 7.3 49.0
Operating expenditure 10.2 10.5 21.0 21.8 22.7 86.2
Revenue 30.0 32.6 35.8 38.5 41.6 178.5
Figure 22: 2015–20 Standard Control Services
Figure 23: 2015–20 Alternative Control Services (metering)
Source: SA power networkS 2014
1000
800
600
400
200
0
2010
/11
2011
/12
2012
/13
2013
/14
2017
/18
2014
/15
2018
/19
2015
/16
2019
/20
2016
/17
Figure 24: 2010–20 Standard Control Services (2015 $ millions)
Capital ExpenditureRevenue
Operating Expenditure
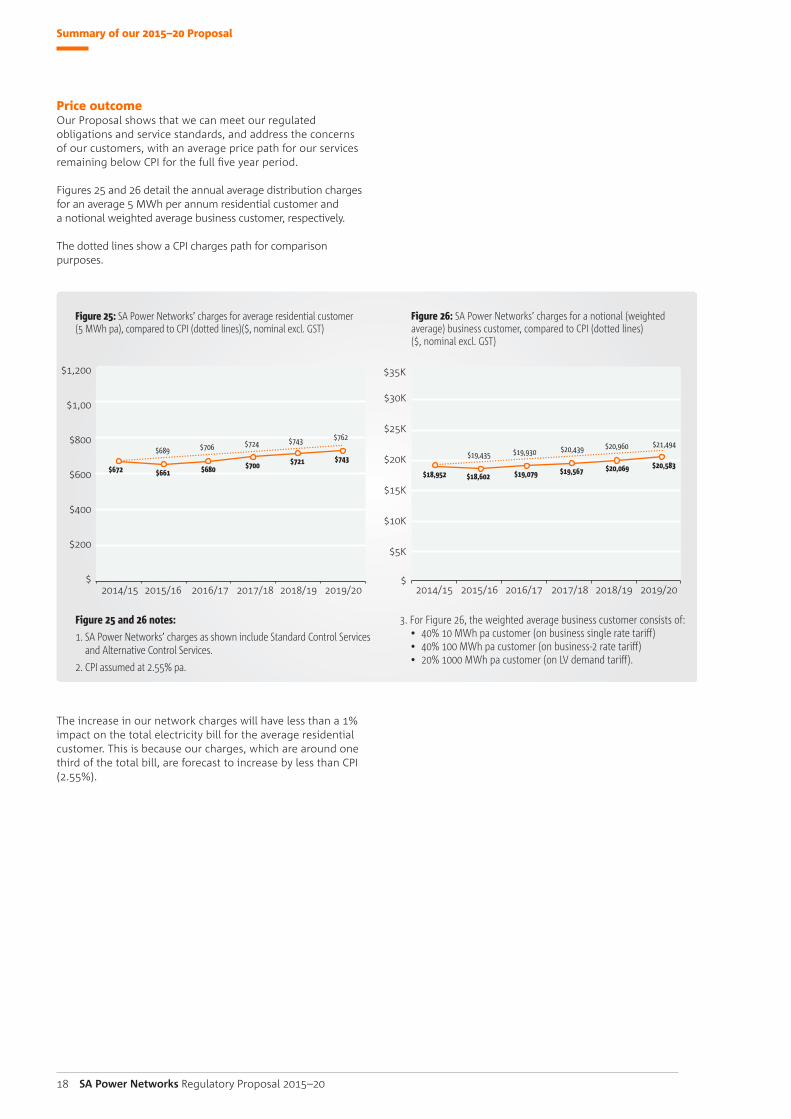
Price outcomeOur Proposal shows that we can meet our regulated obligations and service standards, and address the concerns of our customers, with an average price path for our services remaining below CPI for the full five year period.
Figures 25 and 26 detail the annual average distribution charges for an average 5 MWh per annum residential customer and a notional weighted average business customer, respectively. The dotted lines show a CPI charges path for comparison purposes.
The increase in our network charges will have less than a 1% impact on the total electricity bill for the average residential customer. This is because our charges, which are around one third of the total bill, are forecast to increase by less than CPI (2.55%).
Summary of our 2015–20 Proposal
18 SA Power Networks Regulatory Proposal 2015–20
Figure 25: SA Power Networks’ charges for average residential customer (5 MWh pa), compared to CPI (dotted lines)($, nominal excl. GST)
2014/15
$672
$689 $706 $724 $743 $762
$661 $680 $700 $721 $743
2015/16 2016/17 2017/18 2018/19 2019/20$
$1,200
$1,00
$800
$600
$400
$200
Figure 26: SA Power Networks’ charges for a notional (weighted average) business customer, compared to CPI (dotted lines) ($, nominal excl. GST)
2014/15 2015/16 2016/17 2017/18 2018/19 2019/20$
$30K
$35K
$25K
$20K
$15K
$10K
$5K
$18,952
$19,435 $19,930 $20,439 $20,960 $21,494
$18,602 $19,079 $19,567 $20,069 $20,583
Figure 25 and 26 notes:
1. SA Power Networks’ charges as shown include Standard Control Services and Alternative Control Services.
2. CPI assumed at 2.55% pa.
3. For Figure 26, the weighted average business customer consists of: • 40% 10 MWh pa customer (on business single rate tariff) • 40% 100 MWh pa customer (on business-2 rate tariff) • 20% 1000 MWh pa customer (on LV demand tariff).
Benefits and risks
Benefits and risksSA Power Networks believes that our proposals for 2015–20 strike the right balance of investments and price that support optimal service provision for South Australians.
At all stages of the Customer Engagement Program, our customers have consistently recognised the need to invest for the short term and the longer term. They have also recognised that our less direct services, such as ‘safety for the community’, are just as relevant to them and the broader community as ‘keeping the power on’. The substantial changes underway in the industry and associated markets have also been noticed by our customers, and the value of cost-reflective pricing is also recognised.
SA Power Networks must look well beyond this coming five year period in considering the level and type of investment that delivers a transition path to a very different future in terms of customer use of energy, their appetite for digital technologies and their increasing participation in energy management. The distribution network of today will change, and become a more valuable asset to South Australians, as it supports the new opportunities that will accompany the two-way network and customers’ use of new and emerging technologies.
As always, price is a key concern for our customers. From the start of our planning and engagement for 2015–20, we have consistently acknowledged the need to balance investment and the pricing preferences of our customers. We are pleased that our Proposal will deliver the investments that support optimal service provision for South Australians in both the short term and long term, while containing network prices to an average annual price increase of less than CPI.
We are also confident that our Proposal addresses a range of potential risks for our customers:• the level of service and reliability not meeting service
standards or customer expectations — Our Proposal includes efficient levels of operating and capital expenditure to maintain the current reliability level of the network.
• under or over investment in our network leading to reduced reliability or higher prices respectively — Our Proposal strikes the right balance to meet both the short and long term needs of our customers as advised to us through our Customer Engagement Program. We will continue to prudently manage this investment portfolio.
• less than optimal maintenance of the network adversely impacting reliability and life of assets — SA Power Networks maintains the network in accordance with good electricity industry practice and within the safety and technical compliance management framework approved by the Essential Services Commission of South Australia.
• additions to network capacity not meeting customers’ needs when and where required — SA Power Networks plans the additions to the network based on a detailed assessment of local needs and not just a State-wide average. Capital expenditure has been included in our Proposal to meet these needs.
• the level of cross-subsidies between customers continuing to grow — SA Power Networks will progressively introduce capacity-based tariffs for small customers by July 2017 to provide customers with more cost-reflective pricing and to reduce existing cross-subsidies.
• customers suffering power quality issues and being prevented from using new energy technologies such as solar panels, electric vehicles and battery storage — SA Power Networks is proposing to improve the monitoring of the low voltage network to enable increased penetration of customer energy technologies whilst maintaining power quality.
• customers not having sufficient, timely information to allow them to effectively manage their energy usage — Our proposed investments in metering and business systems are designed to progressively address this risk over the 2015–20 period.
• under investment may occur if a reasonable return is not being provided on investments — We have proposed a return on equity commensurate with the industry risks and the changing energy market.
Finally, based on the proposed investments, by 2020 SA Power Networks will have delivered:• stable underlying network reliability;• improved reliability performance for worst-served
customers;• innovative technologies to improve network resilience
during severe weather events;• secure supply arrangements for Kangaroo Island;• improved management of the condition and safety
of network assets;• a progressive return of the asset portfolio to acceptable
risk levels;• the continued management of environmental risks;• timely network capacity and connections;• a more adaptable network that meets supply quality
standards and can accommodate new customer energy technologies;
• management of overall bushfire safety risk levels;• rectification of specific safety risks;• secure power supply for prioritised Country Fire Service
Bushfire Safer Places;• more accurate, timely and secure operational
communications for supply interruption service events;• more valuable and timely informative/educational
communications;• expanded and improved self-service options;• new cost-reflective tariffs;• reduced cross-subsidies between customers with
or without customer energy technologies;• enhanced vegetation management approaches;• better alignment of SA Power Networks’ directions with
stakeholder needs; and• more accurate information for Australian Energy Regulator
benchmarking.
In conclusion, by listening to our customers, taking a long term view in a changing world, and developing prudent solutions that address key risks and deliver clear benefits, all within a price path that will remain below CPI, we are confident that our Proposal represents appropriate value for South Australian customers and stakeholders.
19An overview for South Australian electricity customers
Have your say
20 SA Power Networks Regulatory Proposal 2015–20
Have your saySA Power Networks values your feedback as a customer or stakeholder on the issues and directions outlined in this document.
This overview document summarises SA Power Networks’ proposed key work programs, expenditures, and rate of return, as well as the allowable distribution revenue for the 2015–20 regulatory period. Customers are encouraged to read our detailed Regulatory Proposal 2015–20 to obtain further information on these matters.
Following an assessment of our Proposal and any submissions received from interested parties, the Australian Energy Regulator will make a first determination by 30 April 2015.
SA Power Networks and other interested parties will then have the opportunity to make further submissions on the first determination to the Australian Energy Regulator by 2 July 2015. Subsequently, the Australian Energy Regulator will publish a substitute (final) determination by 31 October 2015 that will take effect from 1 July 2016. Any differences between the first determination and the substitute determination that affect our allowable revenues in the 2015/16 year will be addressed by way of a revenue ‘true-up’ at 1 July 2016.
Throughout the determination process the Australian Energy Regulator has advised it will consult with interested parties and take their views into account. We encourage our customers to have their say by making a submission to the regulator.
Further information on the Australian Energy Regulator’s approach to the SA Power Networks — Determination 2015–20 can be found at the AER website: http://www.aer.gov.au/node/20941
ContactTalking Powerwww.talkingpower.com.au [email protected]
SA Power Networks ABN 13 332 330 749 a partnership of: Spark Infrastructure SA (No.1) Pty Ltd ABN 54 091 142 380, Spark Infrastructure SA (No.2) Pty Ltd ABN 19 091 143 038, Spark Infrastructure SA (No.3) Pty Ltd ABN 50 091 142 362, each incorporated in Australia. CKI Utilities Development Limited ABN 65 090 718 880, PAI UtilitiesDevelopment Limited ABN 82 090 718 951, each incorporated in The Bahamas.

3300
sapowernetworks.com.au


![[Title] Power Networks... · Appendix A – NUoS Tariffs and explanatory notes SA Power Networks Pricing Proposal 2015-2016 Page 1 of 13 SA Power Networks [Title] u [Subheading] 23](https://img.pdfslide.us/doc/110x75/5fa5f71f58679d041d14f65a/title-power-networks-appendix-a-a-nuos-tariffs-and-explanatory-notes-sa.jpg)