Embed Size (px)
Citation preview

SA Corporate Year End 2016 Results Presentation
March 2017

Agenda
• Highlights Rory Mackey
• Financial Performance Antoinette Basson
• South African Portfolio Review Rory Mackey
• Unlocking Value in the Retail Portfolio Rory Mackey
• Zambian Portfolio Performance Rory Mackey
• Building the Afhco Business Rory Mackey
• Strategy & Prospects Rory Mackey
• Acknowledgments Rory Mackey
• Questions Team
2
HIGHLIGHTSRORY MACKEY
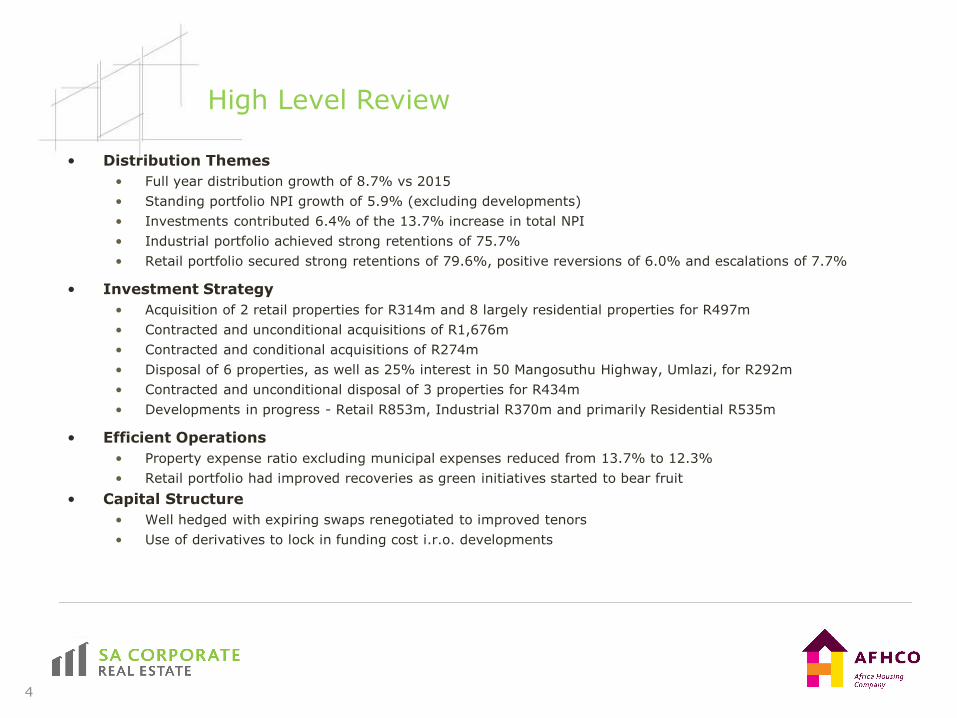
High Level Review
4
• Distribution Themes
• Full year distribution growth of 8.7% vs 2015
• Standing portfolio NPI growth of 5.9% (excluding developments)
• Investments contributed 6.4% of the 13.7% increase in total NPI
• Industrial portfolio achieved strong retentions of 75.7%
• Retail portfolio secured strong retentions of 79.6%, positive reversions of 6.0% and escalations of 7.7%
• Investment Strategy
• Acquisition of 2 retail properties for R314m and 8 largely residential properties for R497m
• Contracted and unconditional acquisitions of R1,676m
• Contracted and conditional acquisitions of R274m
• Disposal of 6 properties, as well as 25% interest in 50 Mangosuthu Highway, Umlazi, for R292m
• Contracted and unconditional disposal of 3 properties for R434m
• Developments in progress - Retail R853m, Industrial R370m and primarily Residential R535m
• Efficient Operations
• Property expense ratio excluding municipal expenses reduced from 13.7% to 12.3%
• Retail portfolio had improved recoveries as green initiatives started to bear fruit
• Capital Structure
• Well hedged with expiring swaps renegotiated to improved tenors
• Use of derivatives to lock in funding cost i.r.o. developments
FINANCIAL PERFORMANCEANTOINETTE BASSON
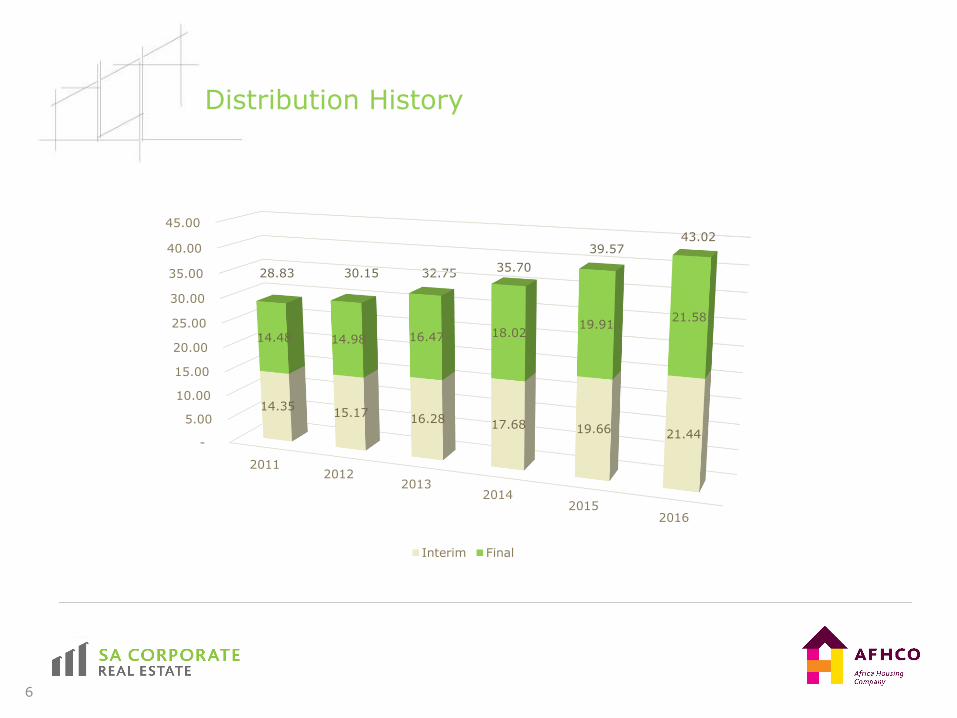
Distribution History
6
28.83 30.15 32.75
-
5.00
10.00
15.00
20.00
25.00
30.00
35.00
40.00
45.00
20112012
20132014
20152016
14.35 15.17
16.28 17.68 19.66 21.44
14.48 14.98 16.47 18.02 19.91
21.58
Interim Final
35.70
39.5743.02
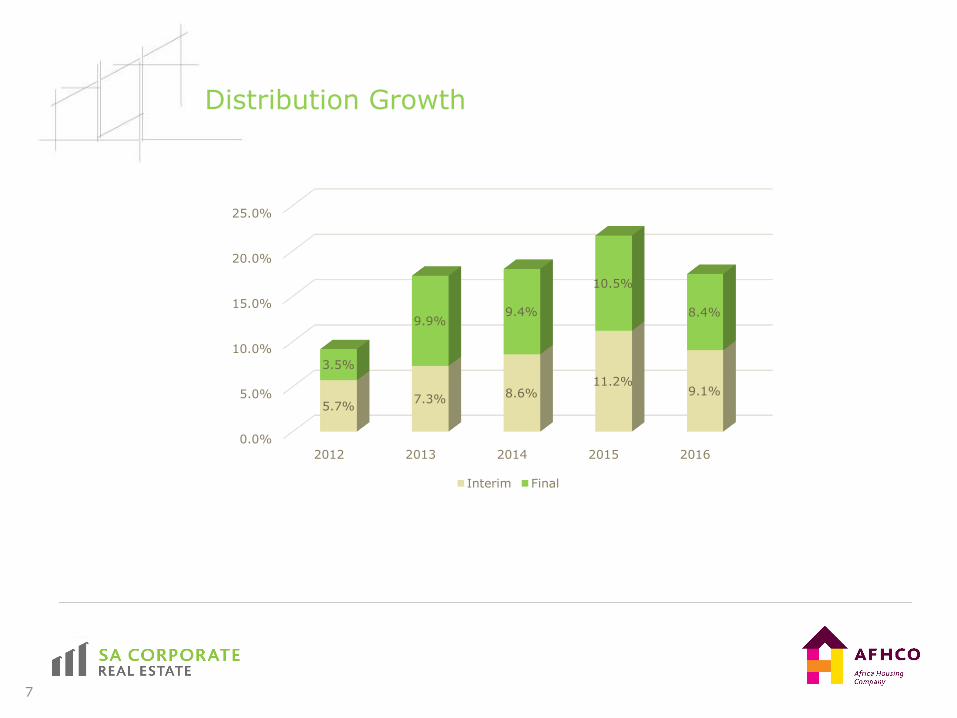
Distribution Growth
7
0.0%
5.0%
10.0%
15.0%
20.0%
25.0%
2012 2013 2014 2015 2016
5.7%7.3% 8.6%
11.2%9.1%
3.5%
9.9%9.4%
10.5%
8.4%
Interim Final
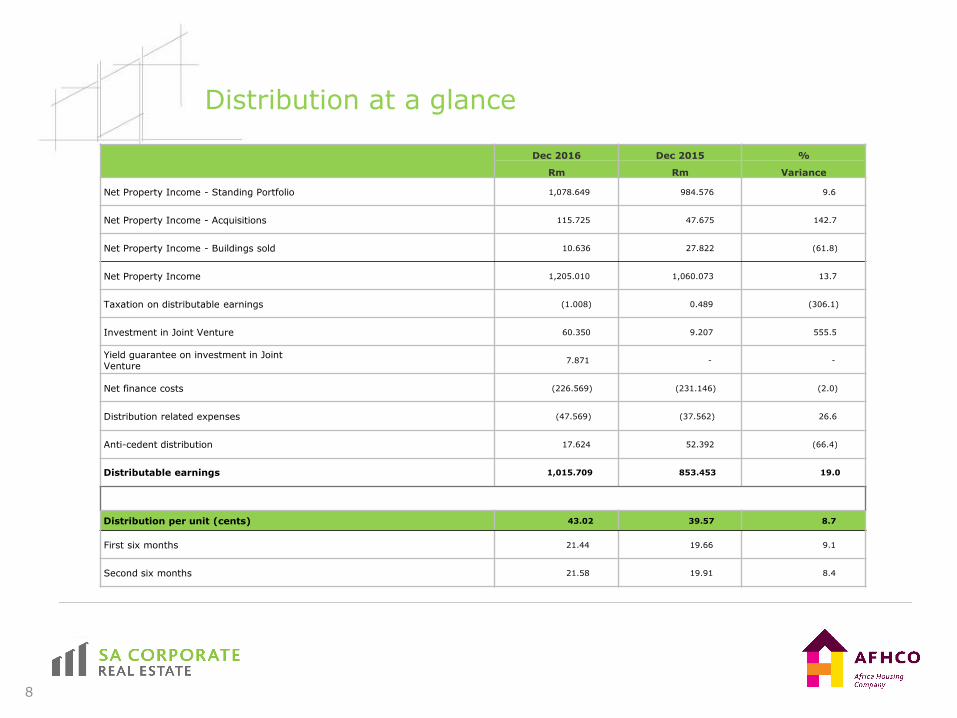
Distribution at a glance
8
Dec 2016 Dec 2015 %
Rm Rm Variance
Net Property Income - Standing Portfolio 1,078.649 984.576 9.6
Net Property Income - Acquisitions 115.725 47.675 142.7
Net Property Income - Buildings sold 10.636 27.822 (61.8)
Net Property Income 1,205.010 1,060.073 13.7
Taxation on distributable earnings (1.008) 0.489 (306.1)
Investment in Joint Venture 60.350 9.207 555.5
Yield guarantee on investment in Joint Venture
7.871 - -
Net finance costs (226.569) (231.146) (2.0)
Distribution related expenses (47.569) (37.562) 26.6
Anti-cedent distribution 17.624 52.392 (66.4)
Distributable earnings 1,015.709 853.453 19.0
Distribution per unit (cents) 43.02 39.57 8.7
First six months 21.44 19.66 9.1
Second six months 21.58 19.91 8.4
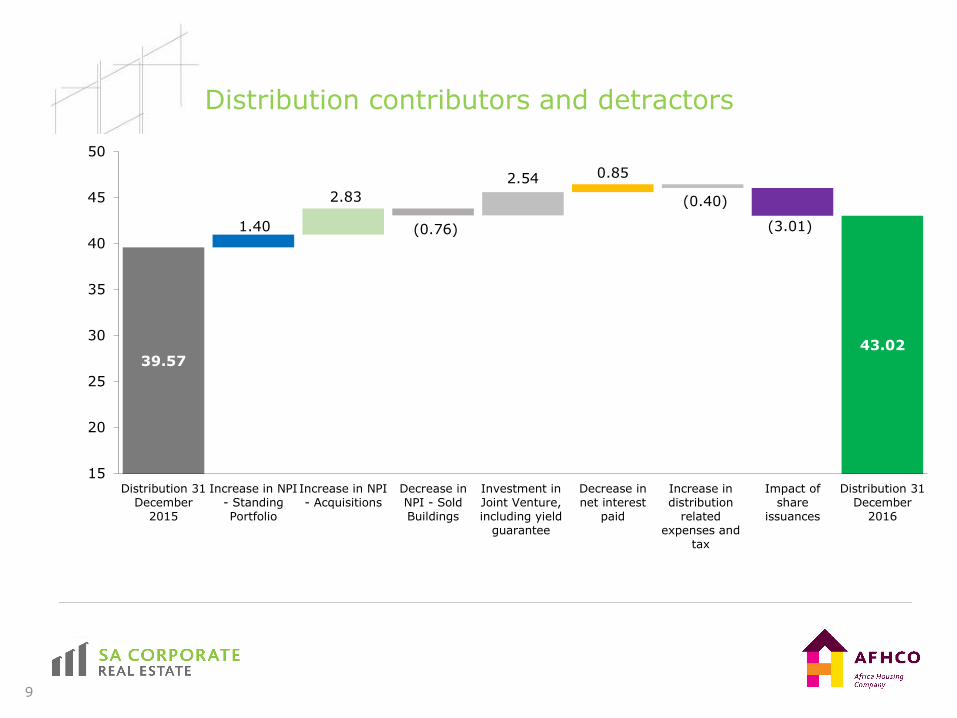
Distribution contributors and detractors
9
39.57
1.40
2.83
(0.76)
2.54 0.85
(0.40)
(3.01)
43.02
15
20
25
30
35
40
45
50
Distribution 31December
2015
Increase in NPI- StandingPortfolio
Increase in NPI- Acquisitions
Decrease inNPI - SoldBuildings
Investment inJoint Venture,including yield
guarantee
Decrease innet interest
paid
Increase indistribution
relatedexpenses and
tax
Impact ofshare
issuances
Distribution 31December
2016
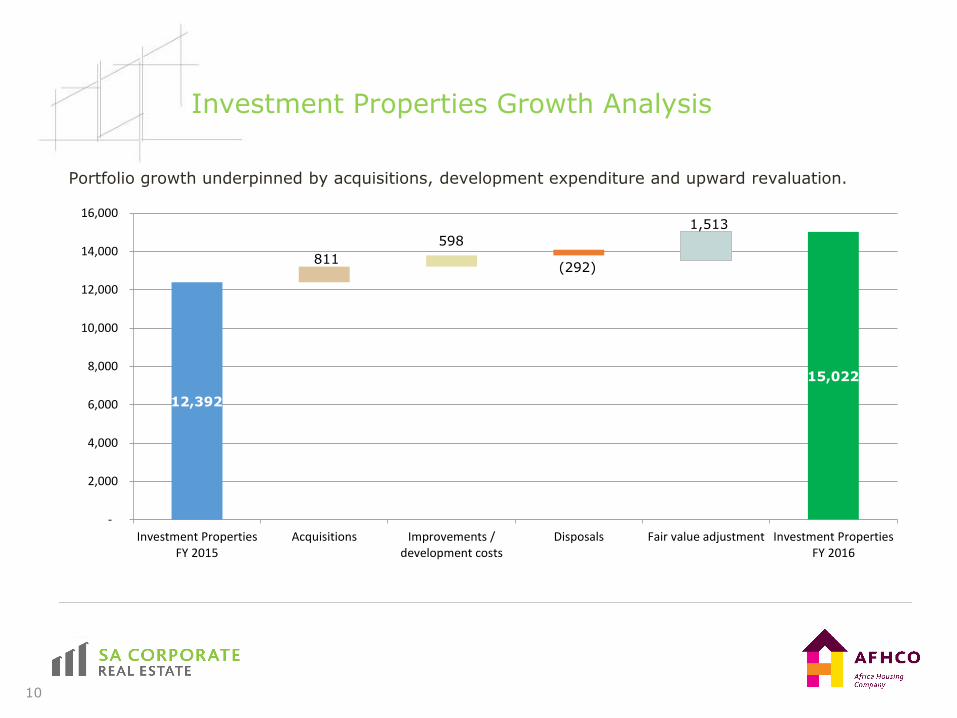
Investment Properties Growth Analysis
10
Portfolio growth underpinned by acquisitions, development expenditure and upward revaluation.
12,392
15,022
811
598
(292)
1,513
-
2,000
4,000
6,000
8,000
10,000
12,000
14,000
16,000
Investment PropertiesFY 2015
Acquisitions Improvements /development costs
Disposals Fair value adjustment Investment PropertiesFY 2016
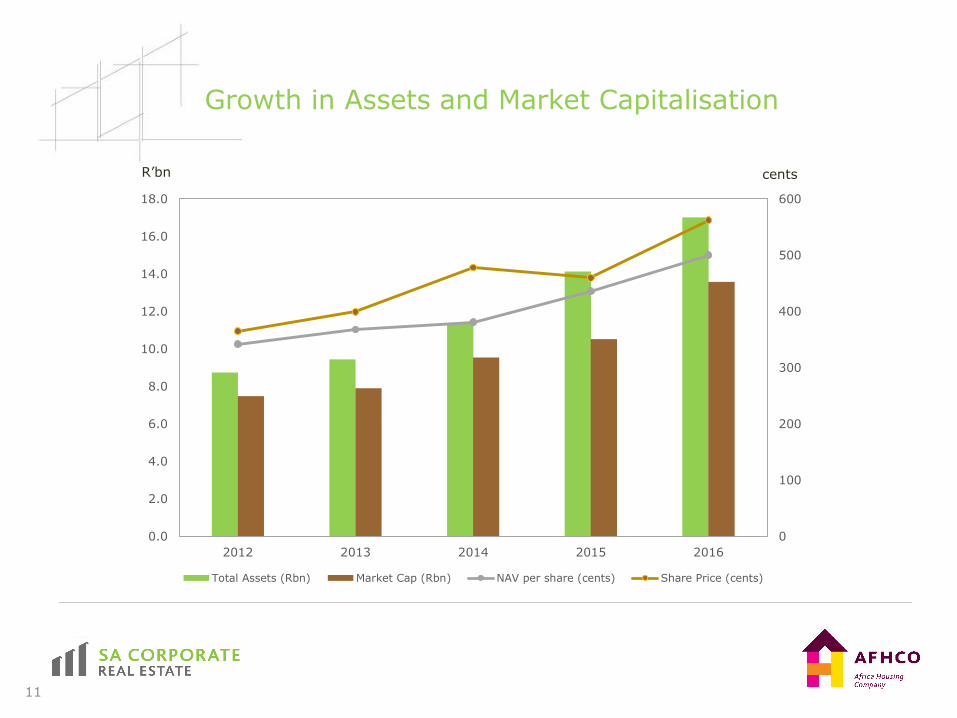
Growth in Assets and Market Capitalisation
11
R’bn cents
0
100
200
300
400
500
600
0.0
2.0
4.0
6.0
8.0
10.0
12.0
14.0
16.0
18.0
2012 2013 2014 2015 2016
Total Assets (Rbn) Market Cap (Rbn) NAV per share (cents) Share Price (cents)

Net Asset Value
12
Cents per share
436.4
21.6
61.7
(1.9 )
2.9
(1.5)(19.9)
499.3
300
325
350
375
400
425
450
475
500
525
550
Opening NAV 1
January 2016
Distributable
earnings for
the period
Revaluation of
Investment
Properties,
Shares and
Interest Rate
Swaps
Net exposure
to Zambian JV
Net new
shares issued
Other Non-
distributable
income
statement
items
Distributions
paid to
shareholders
Closing NAV
31 December
2016
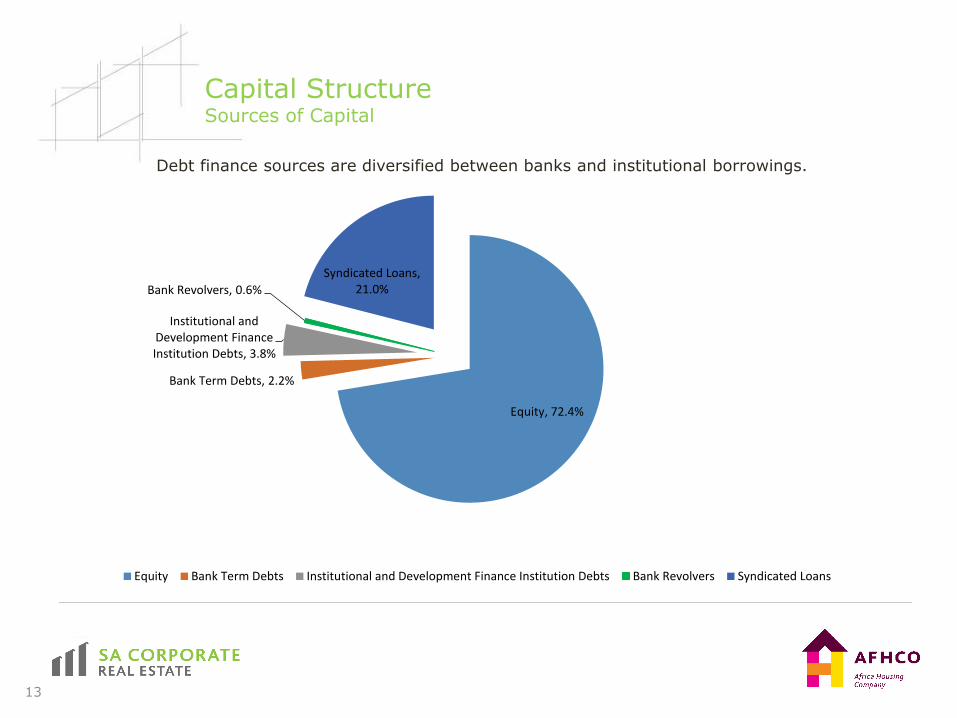
Capital Structure Sources of Capital
13
Debt finance sources are diversified between banks and institutional borrowings.
Equity, 72.4%
Bank Term Debts, 2.2%
Institutional and Development Finance Institution Debts, 3.8%
Bank Revolvers, 0.6%
Syndicated Loans, 21.0%
Equity Bank Term Debts Institutional and Development Finance Institution Debts Bank Revolvers Syndicated Loans
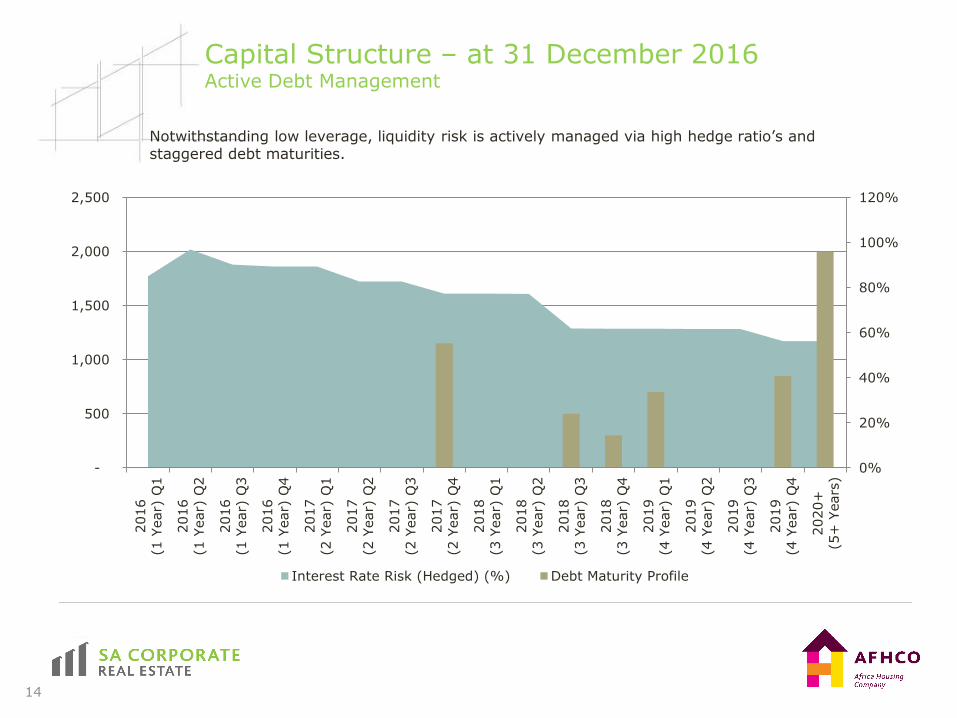
Capital Structure – at 31 December 2016Active Debt Management
14
Notwithstanding low leverage, liquidity risk is actively managed via high hedge ratio’s and staggered debt maturities.
0%
20%
40%
60%
80%
100%
120%
-
500
1,000
1,500
2,000
2,500
2016
(1 Y
ear)
Q1
2016
(1 Y
ear)
Q2
2016
(1 Y
ear)
Q3
2016
(1 Y
ear)
Q4
2017
(2 Y
ear)
Q1
2017
(2 Y
ear)
Q2
2017
(2 Y
ear)
Q3
2017
(2 Y
ear)
Q4
2018
(3 Y
ear)
Q1
2018
(3 Y
ear)
Q2
2018
(3 Y
ear)
Q3
2018
(3 Y
ear)
Q4
2019
(4 Y
ear)
Q1
2019
(4 Y
ear)
Q2
2019
(4 Y
ear)
Q3
2019
(4 Y
ear)
Q4
2020+
(5+
Years
)
Interest Rate Risk (Hedged) (%) Debt Maturity Profile
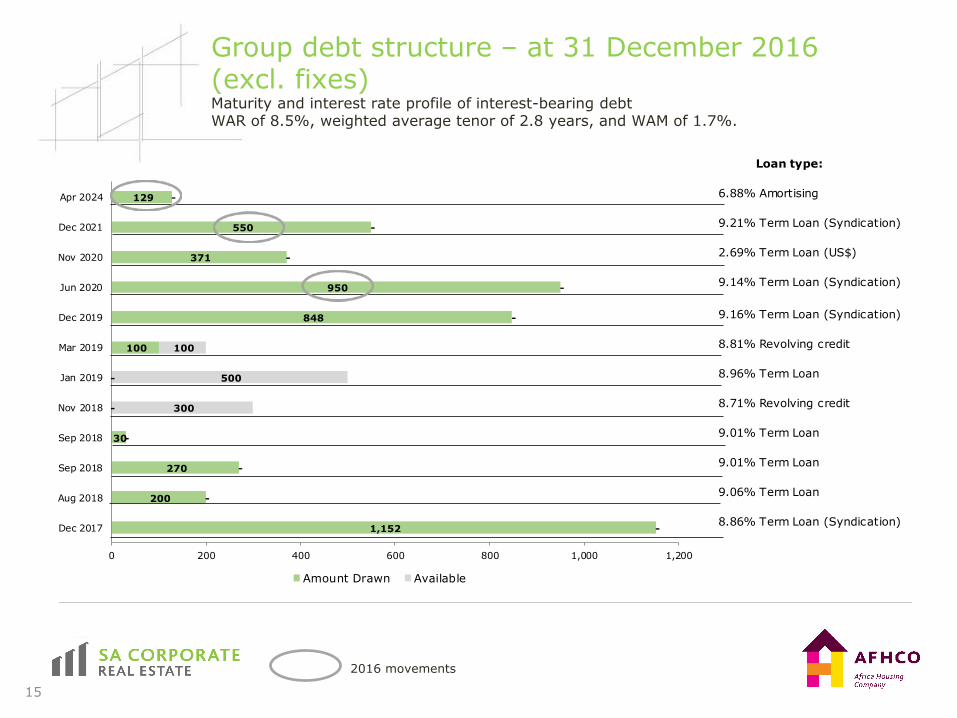
Group debt structure – at 31 December 2016 (excl. fixes)
15
Maturity and interest rate profile of interest-bearing debt WAR of 8.5%, weighted average tenor of 2.8 years, and WAM of 1.7%.
2016 movements
Loan type:
6.88% Amortising
9.21% Term Loan (Syndication)
2.69% Term Loan (US$)
9.14% Term Loan (Syndication)
9.16% Term Loan (Syndication)
8.81% Revolving credit
8.96% Term Loan
8.71% Revolving credit
9.01% Term Loan
9.01% Term Loan
9.06% Term Loan
8.86% Term Loan (Syndication)1,152
200
270
30
-
-
100
848
950
371
550
129
-
-
-
-
300
500
100
-
-
-
-
-
0 200 400 600 800 1,000 1,200
Dec 2017
Aug 2018
Sep 2018
Sep 2018
Nov 2018
Jan 2019
Mar 2019
Dec 2019
Jun 2020
Nov 2020
Dec 2021
Apr 2024
Amount Drawn Available
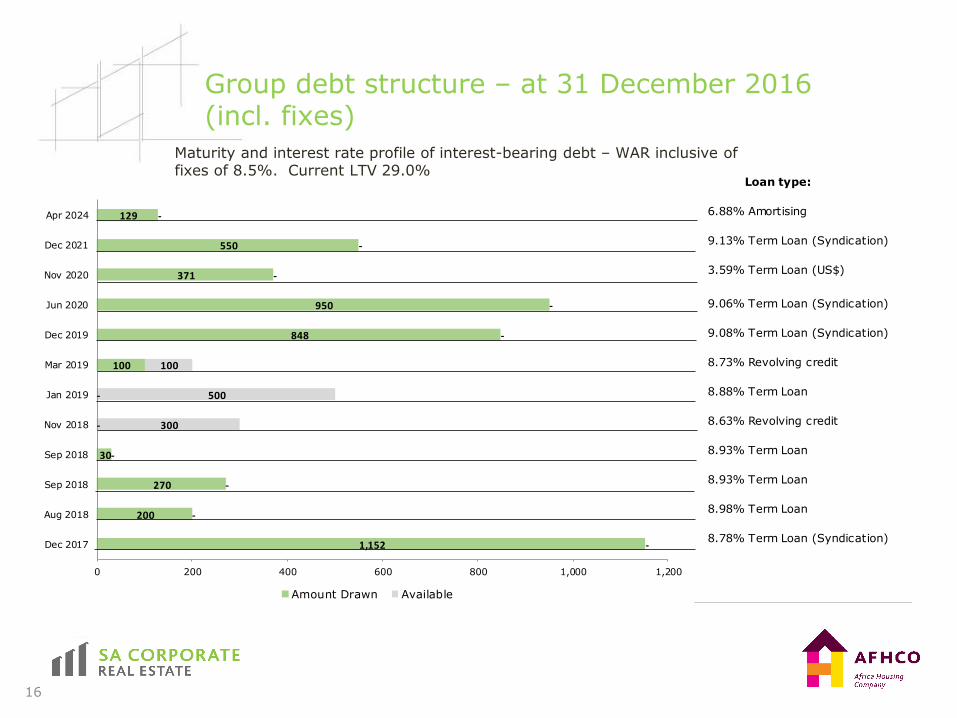
Group debt structure – at 31 December 2016 (incl. fixes)
16
Maturity and interest rate profile of interest-bearing debt – WAR inclusive of fixes of 8.5%. Current LTV 29.0%
Loan type:
6.88% Amortising
9.13% Term Loan (Syndication)
3.59% Term Loan (US$)
9.06% Term Loan (Syndication)
9.08% Term Loan (Syndication)
8.73% Revolving credit
8.88% Term Loan
8.63% Revolving credit
8.93% Term Loan
8.93% Term Loan
8.98% Term Loan
8.78% Term Loan (Syndication)1,152
200
270
30
-
-
100
848
950
371
550
129
-
-
-
-
300
500
100
-
-
-
-
-
0 200 400 600 800 1,000 1,200
Dec 2017
Aug 2018
Sep 2018
Sep 2018
Nov 2018
Jan 2019
Mar 2019
Dec 2019
Jun 2020
Nov 2020
Dec 2021
Apr 2024
Amount Drawn Available
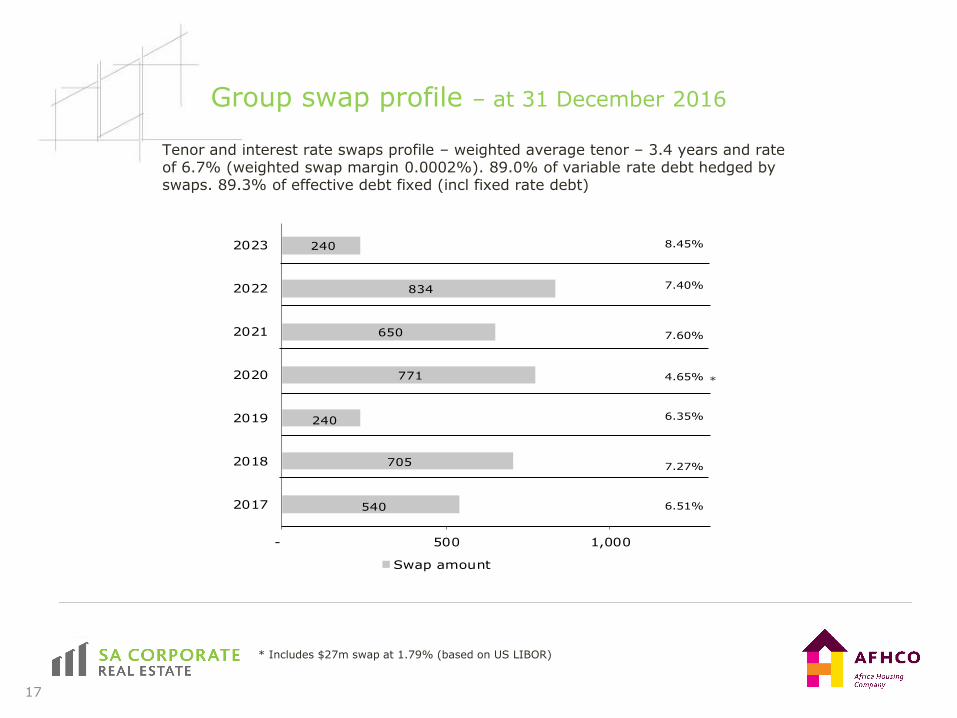
Group swap profile – at 31 December 2016
17
Tenor and interest rate swaps profile – weighted average tenor – 3.4 years and rate of 6.7% (weighted swap margin 0.0002%). 89.0% of variable rate debt hedged by swaps. 89.3% of effective debt fixed (incl fixed rate debt)
* Includes $27m swap at 1.79% (based on US LIBOR)
8.45%
7.40%
7.60%
4.65% *
6.35%
7.27%
6.51%540
705
240
771
650
834
240
- 500 1,000
2017
2018
2019
2020
2021
2022
2023
Swap amount
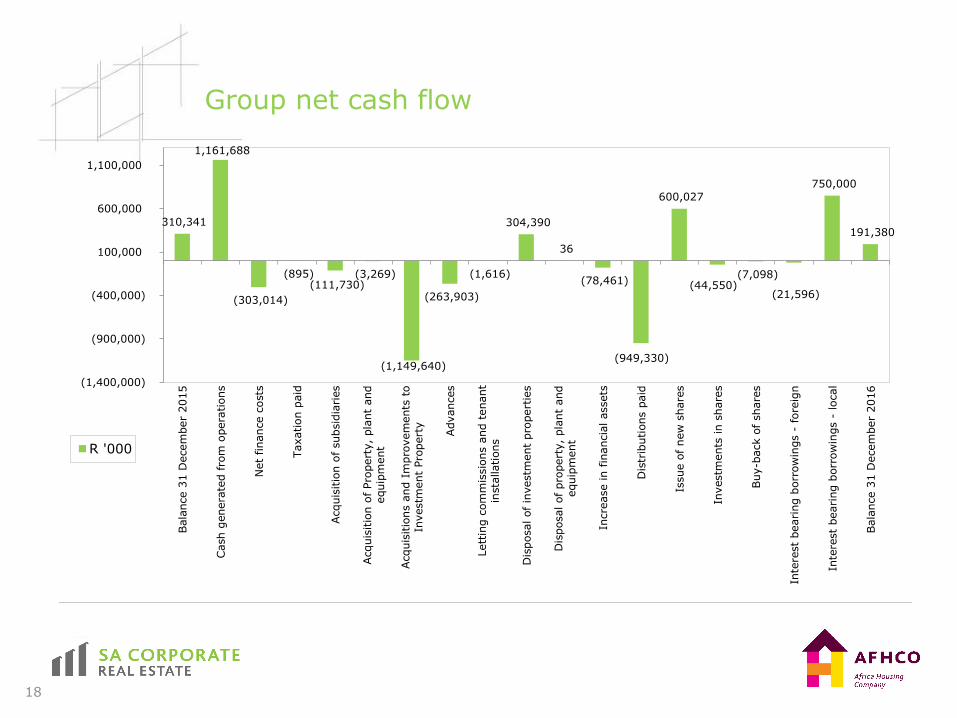
Group net cash flow
18
310,341
1,161,688
(303,014)
(895) (111,730)
(3,269)
(1,149,640)
(263,903)
(1,616)
304,390
36
(78,461)
(949,330)
600,027
(44,550) (7,098)
(21,596)
750,000
191,380
(1,400,000)
(900,000)
(400,000)
100,000
600,000
1,100,000
Bala
nce 3
1 D
ecem
ber
2015
Cash g
enera
ted fro
m o
pera
tions
Net
finance c
osts
Taxation p
aid
Acquis
itio
n o
f subsid
iaries
Acquis
itio
n o
f Pro
pert
y,
pla
nt
and
equip
ment
Acquis
itio
ns a
nd I
mpro
vem
ents
to
Investm
ent
Pro
pert
y
Advances
Lett
ing c
om
mis
sio
ns a
nd t
enant
insta
llations
Dis
posal of in
vestm
ent
pro
pert
ies
Dis
posal of pro
pert
y,
pla
nt
and
equip
ment
Incre
ase in fin
ancia
l assets
Dis
trib
utions p
aid
Issue o
f new
share
s
Investm
ents
in s
hare
s
Buy-b
ack o
f share
s
Inte
rest
bearing b
orr
ow
ings -
fore
ign
Inte
rest
bearing b
orr
ow
ings -
local
Bala
nce 3
1 D
ecem
ber
2016
R '000
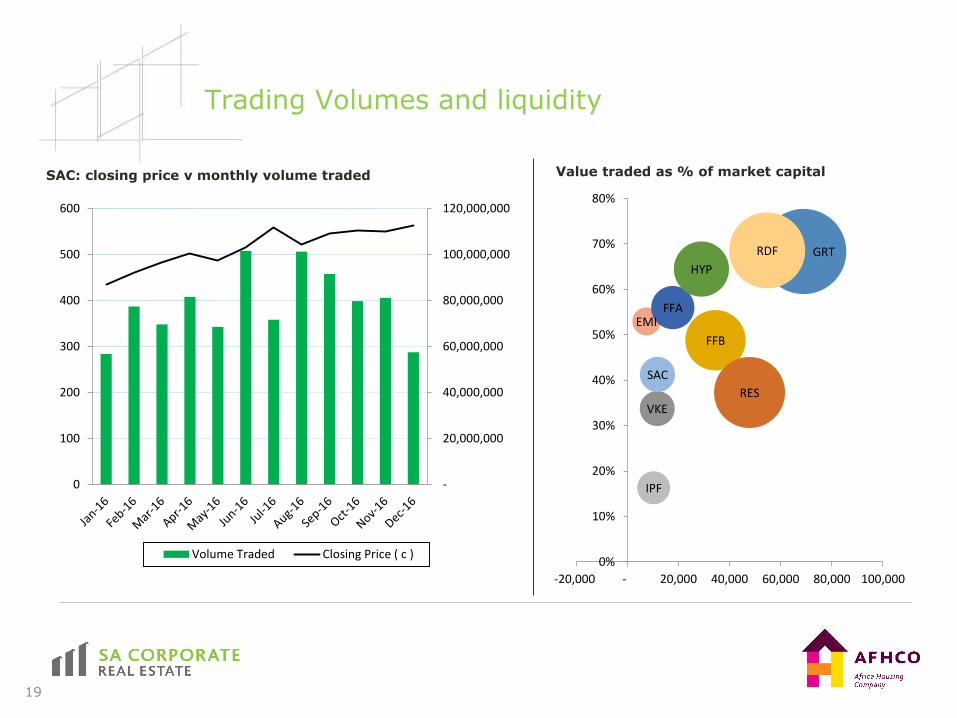
Trading Volumes and liquidity
19
SAC: closing price v monthly volume traded Value traded as % of market capital
-
20,000,000
40,000,000
60,000,000
80,000,000
100,000,000
120,000,000
0
100
200
300
400
500
600
Volume Traded Closing Price ( c )
FFB
EMI
GRT
RESVKE
FFA
HYP
SAC
IPF
RDF
0%
10%
20%
30%
40%
50%
60%
70%
80%
-20,000 - 20,000 40,000 60,000 80,000 100,000
SOUTH AFRICAN PORTFOLIO REVIEW
RORY MACKEY
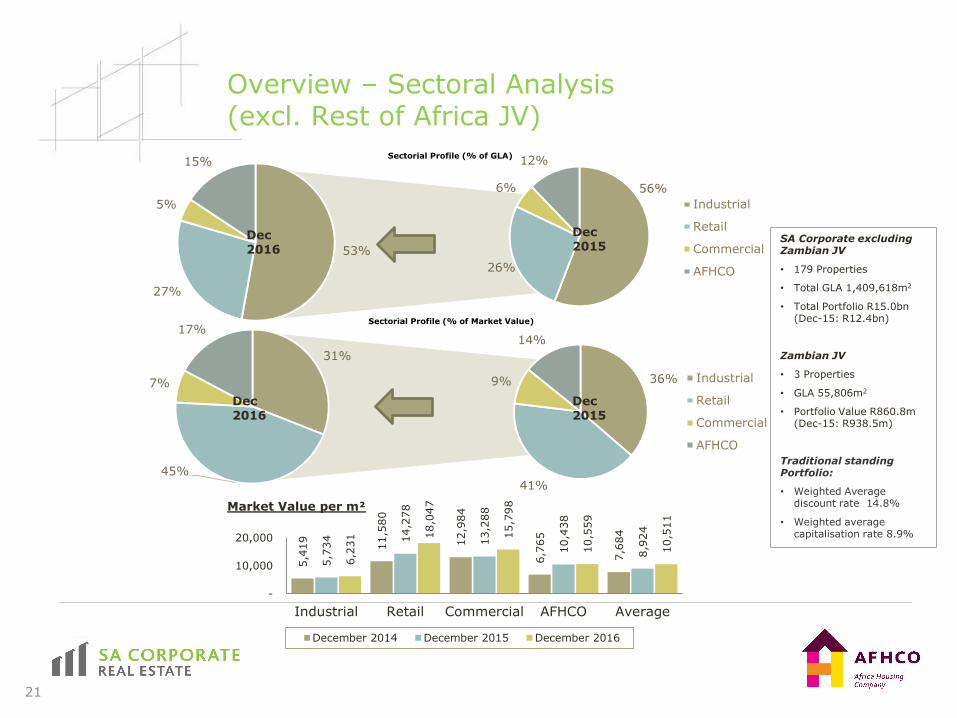
Overview – Sectoral Analysis (excl. Rest of Africa JV)
21
SA Corporate excluding Zambian JV
• 179 Properties
• Total GLA 1,409,618m2
• Total Portfolio R15.0bn (Dec-15: R12.4bn)
Zambian JV
• 3 Properties
• GLA 55,806m2
• Portfolio Value R860.8m (Dec-15: R938.5m)
Traditional standing Portfolio:
• Weighted Average discount rate 14.8%
• Weighted average capitalisation rate 8.9%
5,4
19
11,5
80
12,9
84
6,7
65
7,6
84
5,7
34
14,2
78
13,2
88
10,4
38
8,9
24
6,2
31 18,0
47
15,7
98
10,5
59
10,5
11
-
10,000
20,000
Industrial Retail Commercial AFHCO Average
Market Value per m²
December 2014 December 2015 December 2016
Sectorial Profile (% of GLA)
Sectorial Profile (% of Market Value)
31%
45%
7%
17%
Dec 2016
56%
26%
6%
12%
Industrial
Retail
Commercial
AFHCO
Dec 2015
36%
41%
9%
14%
Industrial
Retail
Commercial
AFHCO
Dec 2015
53%
27%
5%
15%
Dec 2016
22
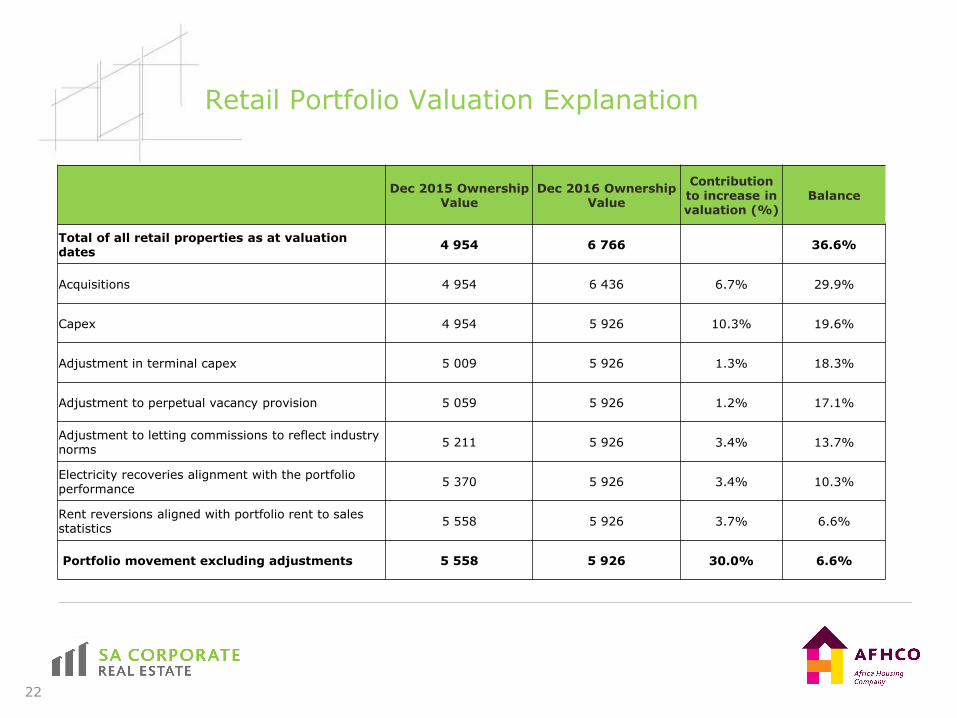
Retail Portfolio Valuation Explanation
Dec 2015 Ownership Value
Dec 2016 Ownership Value
Contribution to increase in valuation (%)
Balance
Total of all retail properties as at valuation dates
4 954 6 766 36.6%
Acquisitions 4 954 6 436 6.7% 29.9%
Capex 4 954 5 926 10.3% 19.6%
Adjustment in terminal capex 5 009 5 926 1.3% 18.3%
Adjustment to perpetual vacancy provision 5 059 5 926 1.2% 17.1%
Adjustment to letting commissions to reflect industry norms
5 211 5 926 3.4% 13.7%
Electricity recoveries alignment with the portfolio performance
5 370 5 926 3.4% 10.3%
Rent reversions aligned with portfolio rent to sales statistics
5 558 5 926 3.7% 6.6%
Portfolio movement excluding adjustments 5 558 5 926 30.0% 6.6%
Geographical Profile (% of GLA)
Geographic Profile (% of Market Value)
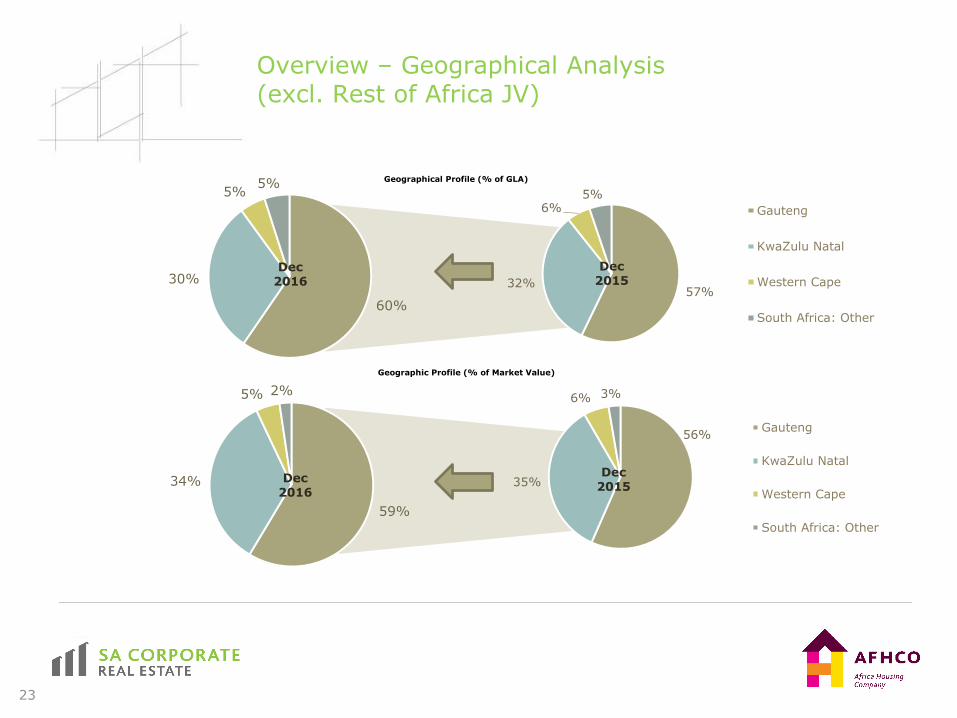
Overview – Geographical Analysis (excl. Rest of Africa JV)
23
57%32%
6%5%
Gauteng
KwaZulu Natal
Western Cape
South Africa: Other
Dec 2015
59%
34%
5% 2%
Dec 2016
56%
35%
6% 3%
Gauteng
KwaZulu Natal
Western Cape
South Africa: Other
Dec 2015
60%
30%
5%5%
Dec 2016
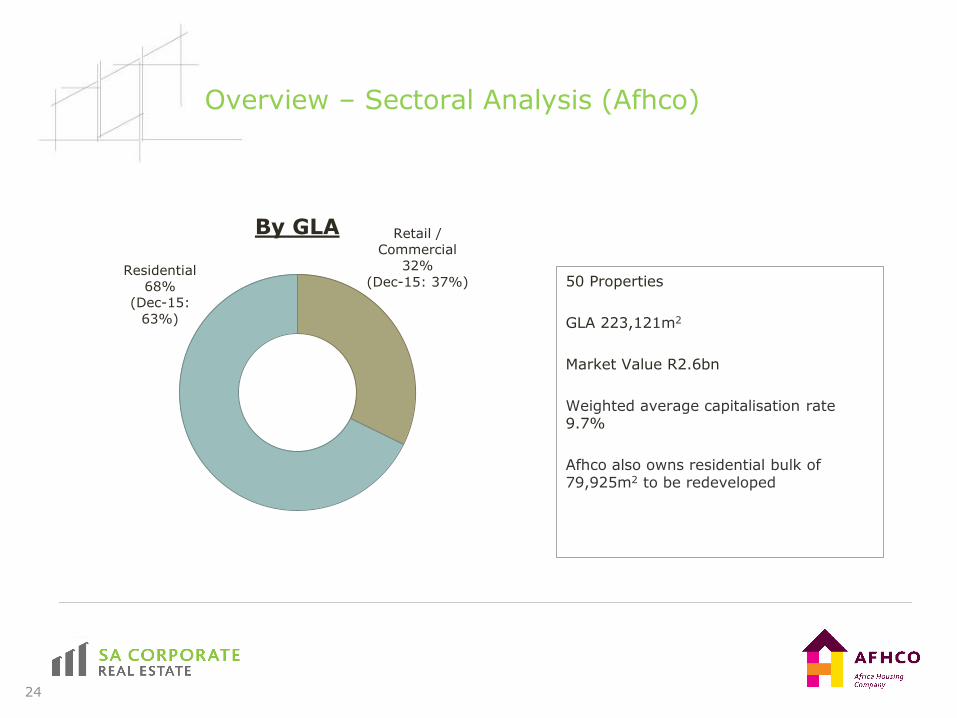
Overview – Sectoral Analysis (Afhco)
24
50 Properties
GLA 223,121m2
Market Value R2.6bn
Weighted average capitalisation rate 9.7%
Afhco also owns residential bulk of 79,925m2 to be redeveloped
Retail /
Commercial
32%
(Dec-15: 37%)Residential
68%
(Dec-15:
63%)
By GLA
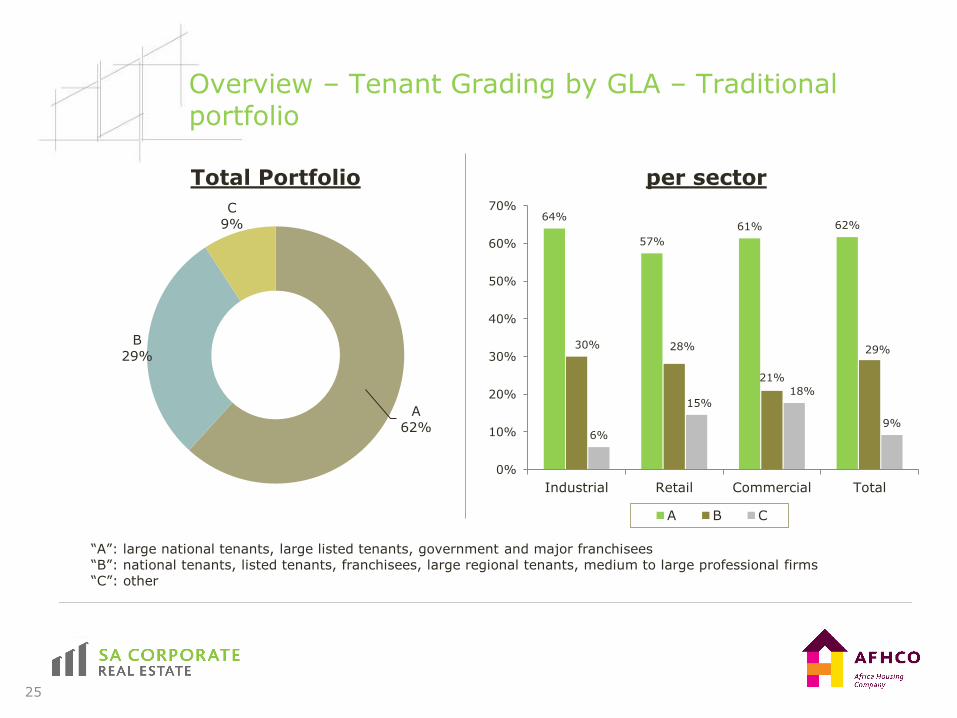
Overview – Tenant Grading by GLA – Traditional portfolio
25
“A”: large national tenants, large listed tenants, government and major franchisees “B”: national tenants, listed tenants, franchisees, large regional tenants, medium to large professional firms“C”: other
A
62%
B
29%
C
9%
Total Portfolio
64%
57%
61% 62%
30% 28%
21%
29%
6%
15%18%
9%
0%
10%
20%
30%
40%
50%
60%
70%
Industrial Retail Commercial Total
per sector
A B C
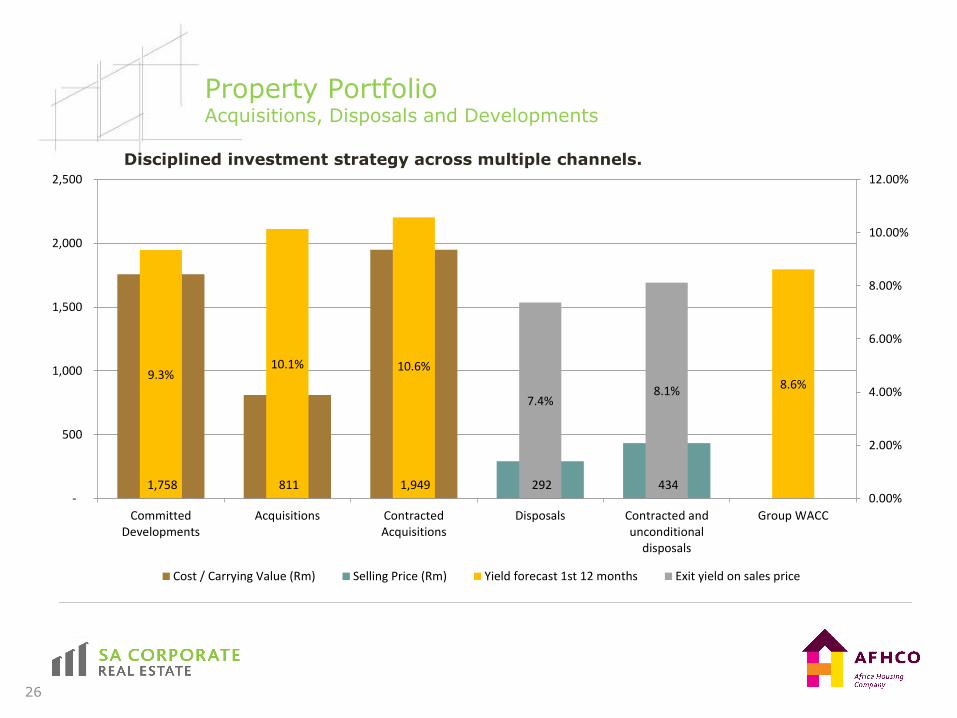
Property PortfolioAcquisitions, Disposals and Developments
26
Disciplined investment strategy across multiple channels.
1,758 811 1,949 292 434
9.3%10.1% 10.6%
8.6%
7.4%8.1%
0.00%
2.00%
4.00%
6.00%
8.00%
10.00%
12.00%
-
500
1,000
1,500
2,000
2,500
CommittedDevelopments
Acquisitions ContractedAcquisitions
Disposals Contracted andunconditional
disposals
Group WACC
Cost / Carrying Value (Rm) Selling Price (Rm) Yield forecast 1st 12 months Exit yield on sales price
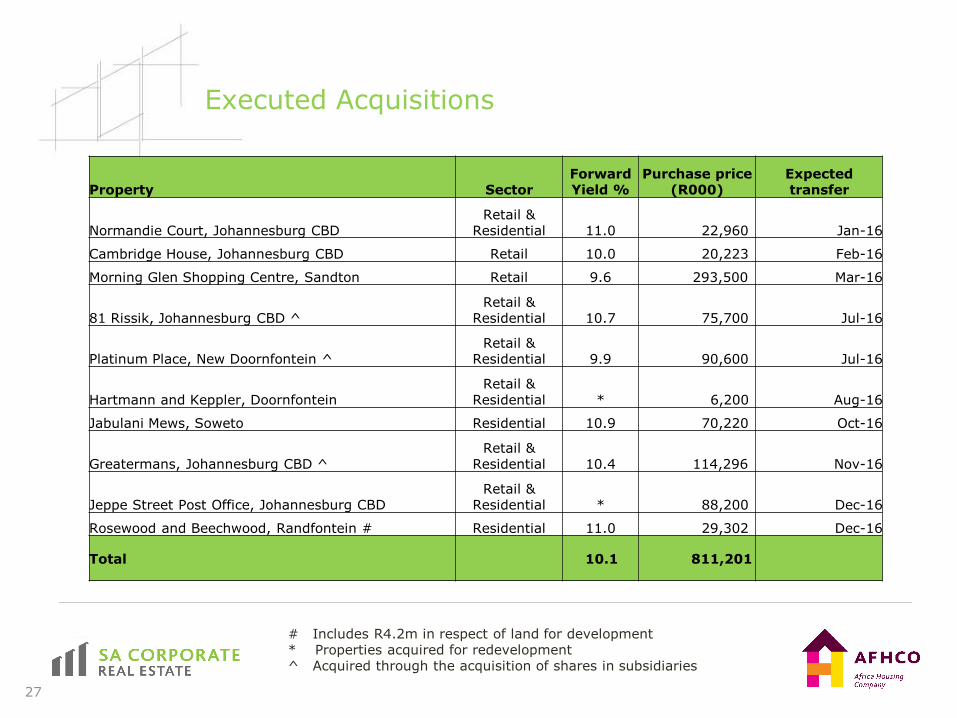
Executed Acquisitions
27
# Includes R4.2m in respect of land for development* Properties acquired for redevelopment^ Acquired through the acquisition of shares in subsidiaries
Property SectorForward Yield %
Purchase price (R000)
Expected transfer
Normandie Court, Johannesburg CBDRetail &
Residential 11.0 22,960 Jan-16
Cambridge House, Johannesburg CBD Retail 10.0 20,223 Feb-16
Morning Glen Shopping Centre, Sandton Retail 9.6 293,500 Mar-16
81 Rissik, Johannesburg CBD ^Retail &
Residential 10.7 75,700 Jul-16
Platinum Place, New Doornfontein ^Retail &
Residential 9.9 90,600 Jul-16
Hartmann and Keppler, DoornfonteinRetail &
Residential * 6,200 Aug-16
Jabulani Mews, Soweto Residential 10.9 70,220 Oct-16
Greatermans, Johannesburg CBD ^Retail &
Residential 10.4 114,296 Nov-16
Jeppe Street Post Office, Johannesburg CBDRetail &
Residential * 88,200 Dec-16
Rosewood and Beechwood, Randfontein # Residential 11.0 29,302 Dec-16
Total 10.1 811,201
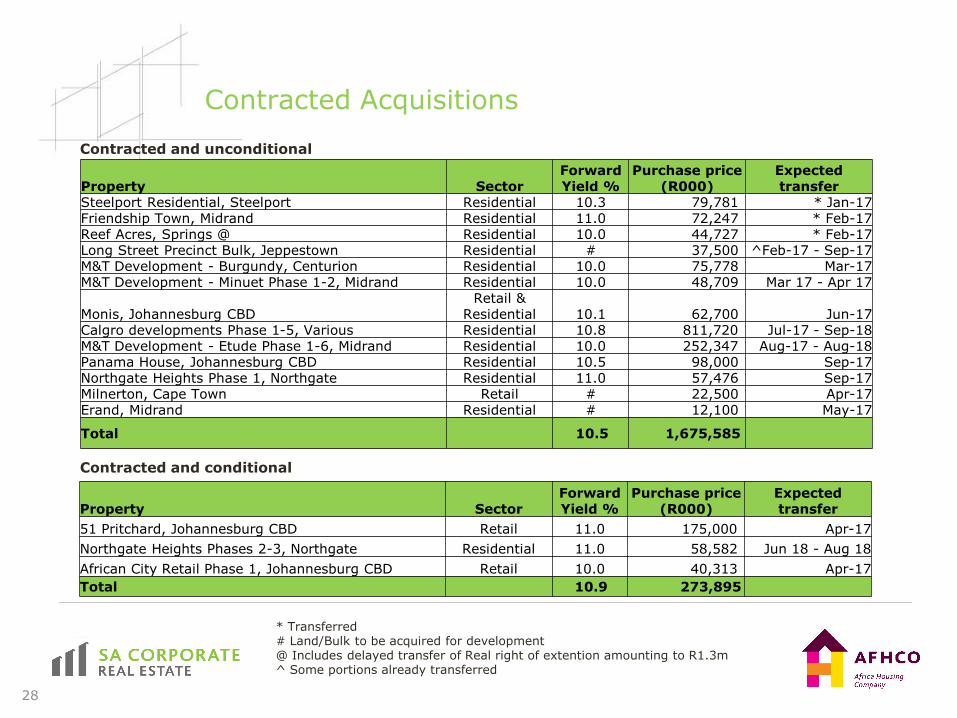
Contracted Acquisitions
28
* Transferred# Land/Bulk to be acquired for development@ Includes delayed transfer of Real right of extention amounting to R1.3m^ Some portions already transferred
Contracted and unconditional
Contracted and conditional
Property SectorForward Yield %
Purchase price (R000)
Expected transfer
51 Pritchard, Johannesburg CBD Retail 11.0 175,000 Apr-17
Northgate Heights Phases 2-3, Northgate Residential 11.0 58,582 Jun 18 - Aug 18
African City Retail Phase 1, Johannesburg CBD Retail 10.0 40,313 Apr-17
Total 10.9 273,895
Property SectorForward Yield %
Purchase price (R000)
Expected transfer
Steelport Residential, Steelport Residential 10.3 79,781 * Jan-17Friendship Town, Midrand Residential 11.0 72,247 * Feb-17Reef Acres, Springs @ Residential 10.0 44,727 * Feb-17Long Street Precinct Bulk, Jeppestown Residential # 37,500 ^Feb-17 - Sep-17M&T Development - Burgundy, Centurion Residential 10.0 75,778 Mar-17M&T Development - Minuet Phase 1-2, Midrand Residential 10.0 48,709 Mar 17 - Apr 17
Monis, Johannesburg CBD Retail &
Residential 10.1 62,700 Jun-17Calgro developments Phase 1-5, Various Residential 10.8 811,720 Jul-17 - Sep-18M&T Development - Etude Phase 1-6, Midrand Residential 10.0 252,347 Aug-17 - Aug-18Panama House, Johannesburg CBD Residential 10.5 98,000 Sep-17Northgate Heights Phase 1, Northgate Residential 11.0 57,476 Sep-17Milnerton, Cape Town Retail # 22,500 Apr-17Erand, Midrand Residential # 12,100 May-17
Total 10.5 1,675,585
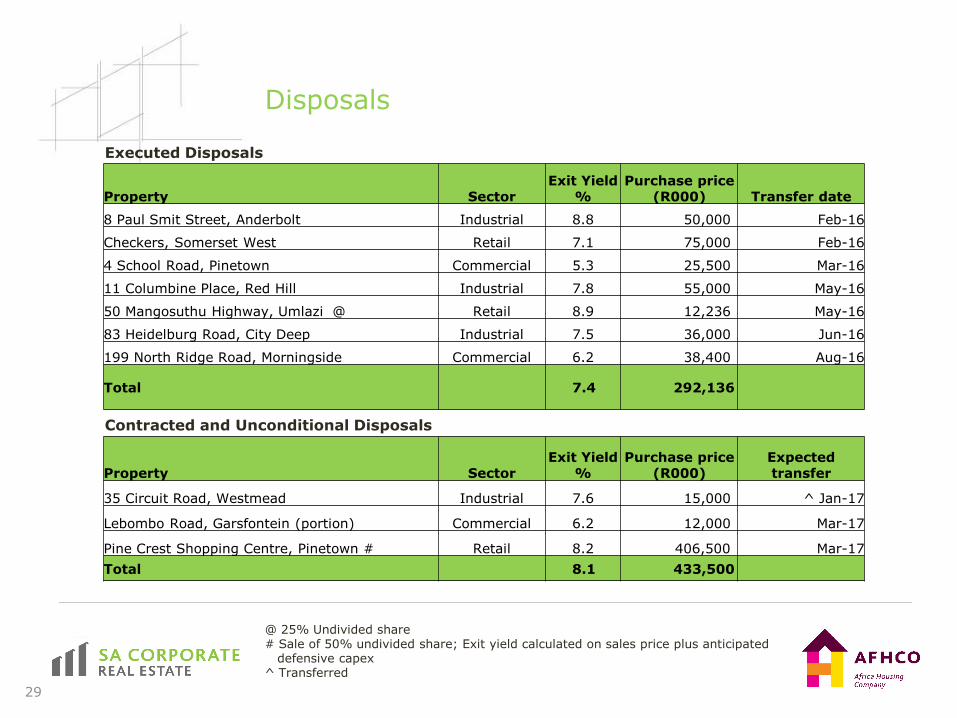
29
Disposals
Contracted and Unconditional Disposals
@ 25% Undivided share# Sale of 50% undivided share; Exit yield calculated on sales price plus anticipated
defensive capex^ Transferred
Executed Disposals
Property SectorExit Yield
%Purchase price
(R000) Transfer date
8 Paul Smit Street, Anderbolt Industrial 8.8 50,000 Feb-16
Checkers, Somerset West Retail 7.1 75,000 Feb-16
4 School Road, Pinetown Commercial 5.3 25,500 Mar-16
11 Columbine Place, Red Hill Industrial 7.8 55,000 May-16
50 Mangosuthu Highway, Umlazi @ Retail 8.9 12,236 May-16
83 Heidelburg Road, City Deep Industrial 7.5 36,000 Jun-16
199 North Ridge Road, Morningside Commercial 6.2 38,400 Aug-16
Total 7.4 292,136
Property SectorExit Yield
%Purchase price
(R000)Expected transfer
35 Circuit Road, Westmead Industrial 7.6 15,000 ^ Jan-17
Lebombo Road, Garsfontein (portion) Commercial 6.2 12,000 Mar-17
Pine Crest Shopping Centre, Pinetown # Retail 8.2 406,500 Mar-17
Total 8.1 433,500
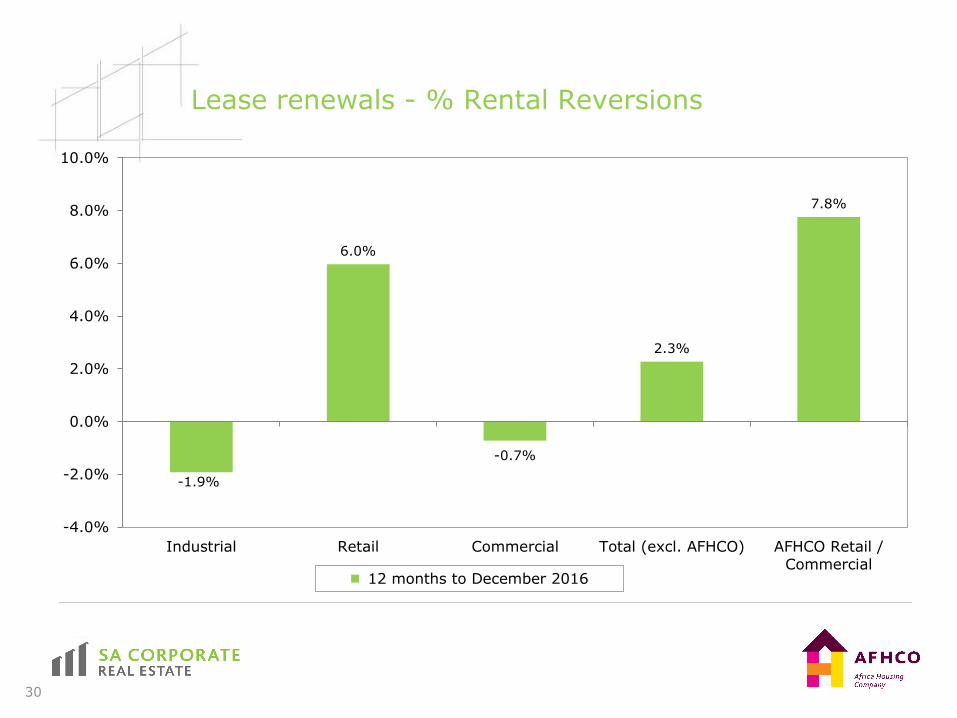
Lease renewals - % Rental Reversions
30
-1.9%
6.0%
-0.7%
2.3%
7.8%
-4.0%
-2.0%
0.0%
2.0%
4.0%
6.0%
8.0%
10.0%
Industrial Retail Commercial Total (excl. AFHCO) AFHCO Retail /Commercial
12 months to December 2016
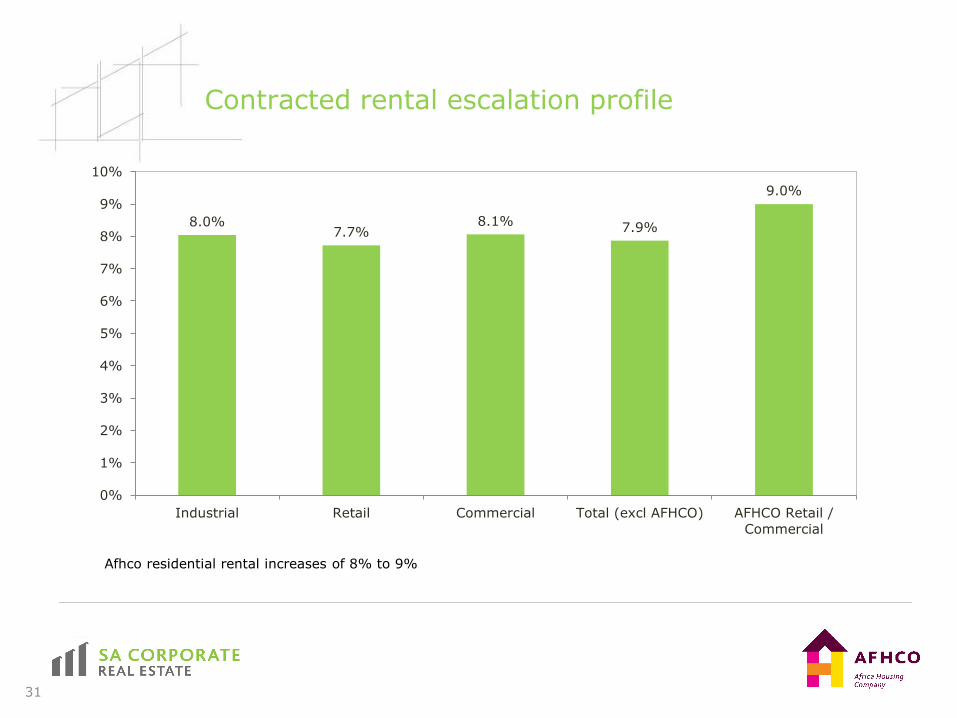
Contracted rental escalation profile
31
8.0%7.7%
8.1% 7.9%
9.0%
0%
1%
2%
3%
4%
5%
6%
7%
8%
9%
10%
Industrial Retail Commercial Total (excl AFHCO) AFHCO Retail /
Commercial
Afhco residential rental increases of 8% to 9%

Group lease expiry – Traditional Portfolio
32
Vacancies Monthly 2017 2018 2019 2020 2021+
% of GLA 2.7% 6.3% 20.7% 20.2% 12.0% 9.5% 28.6%
Cumulative 2.7% 9.0% 29.7% 49.9% 61.9% 71.4% 100.0%
2.7%
6.3%
20.7% 20.2%
12.0%
9.5%
28.6%
0.0%
20.0%
40.0%
60.0%
80.0%
100.0%
120.0%
0.0%
5.0%
10.0%
15.0%
20.0%
25.0%
30.0%
35.0%
% o
f G
LA

Group lease expiry – Afhco Retail / Commercial
33
Vacancies Monthly 2017 2018 2019 2020 2021+
% of GLA 3.4% 7.5% 24.4% 11.5% 10.7% 17.3% 25.2%
Cumulative 3.4% 10.9% 35.3% 46.8% 57.5% 74.8% 100.0%
3.4%
7.5%
24.4%
11.5%10.7%
17.3%
25.2%
0.0%
20.0%
40.0%
60.0%
80.0%
100.0%
120.0%
0.0%
5.0%
10.0%
15.0%
20.0%
25.0%
30.0%
% o
f G
LA
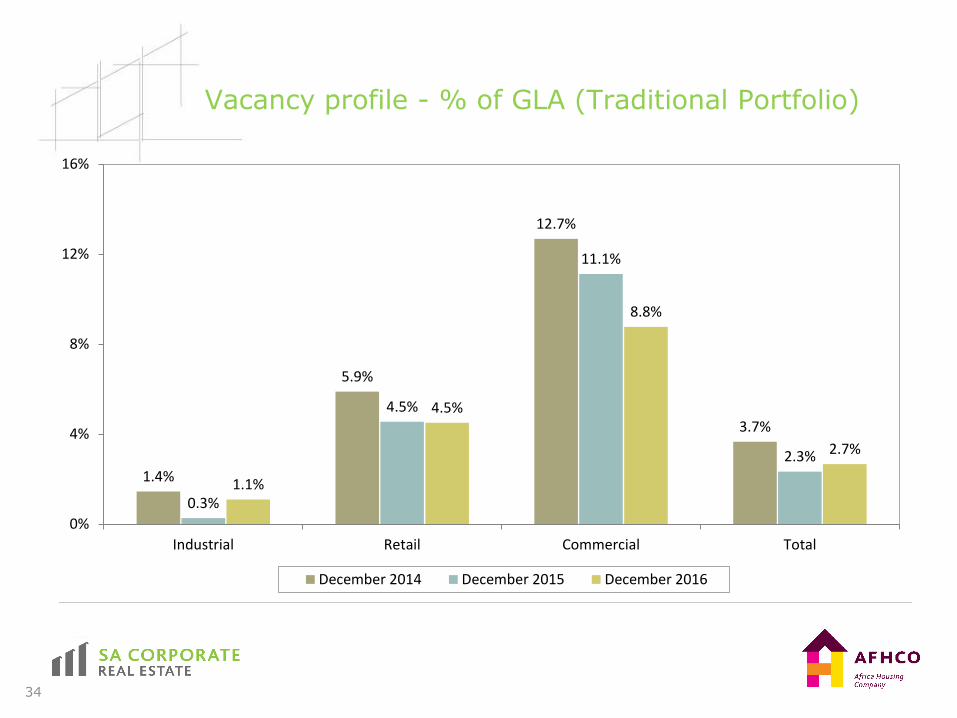
Vacancy profile - % of GLA (Traditional Portfolio)
34
1.4%
5.9%
12.7%
3.7%
0.3%
4.5%
11.1%
2.3%
1.1%
4.5%
8.8%
2.7%
0%
4%
8%
12%
16%
Industrial Retail Commercial Total
December 2014 December 2015 December 2016
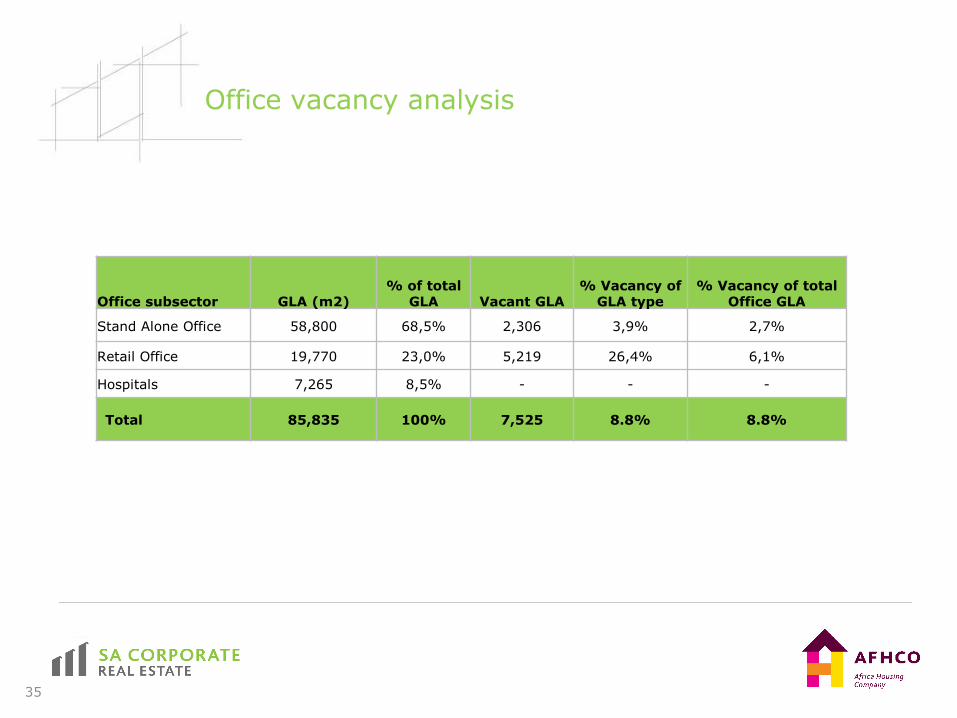
Office vacancy analysis
35
Office subsector GLA (m2)% of total
GLA Vacant GLA% Vacancy of
GLA type% Vacancy of total
Office GLA
Stand Alone Office 58,800 68,5% 2,306 3,9% 2,7%
Retail Office 19,770 23,0% 5,219 26,4% 6,1%
Hospitals 7,265 8,5% - - -
Total 85,835 100% 7,525 8.8% 8.8%
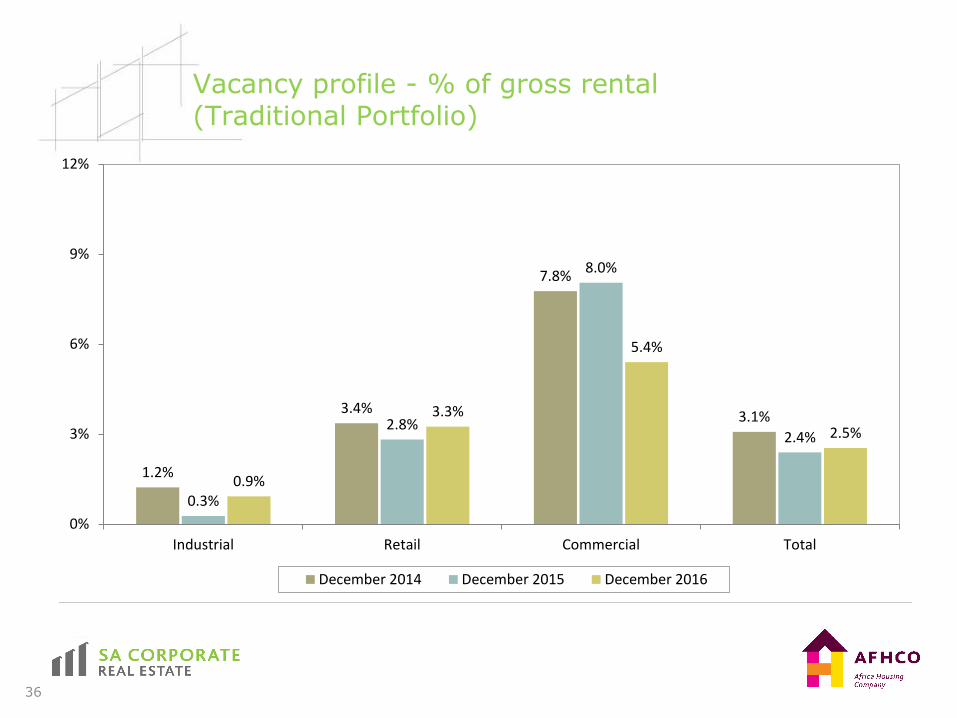
Vacancy profile - % of gross rental (Traditional Portfolio)
36
1.2%
3.4%
7.8%
3.1%
0.3%
2.8%
8.0%
2.4%
0.9%
3.3%
5.4%
2.5%
0%
3%
6%
9%
12%
Industrial Retail Commercial Total
December 2014 December 2015 December 2016
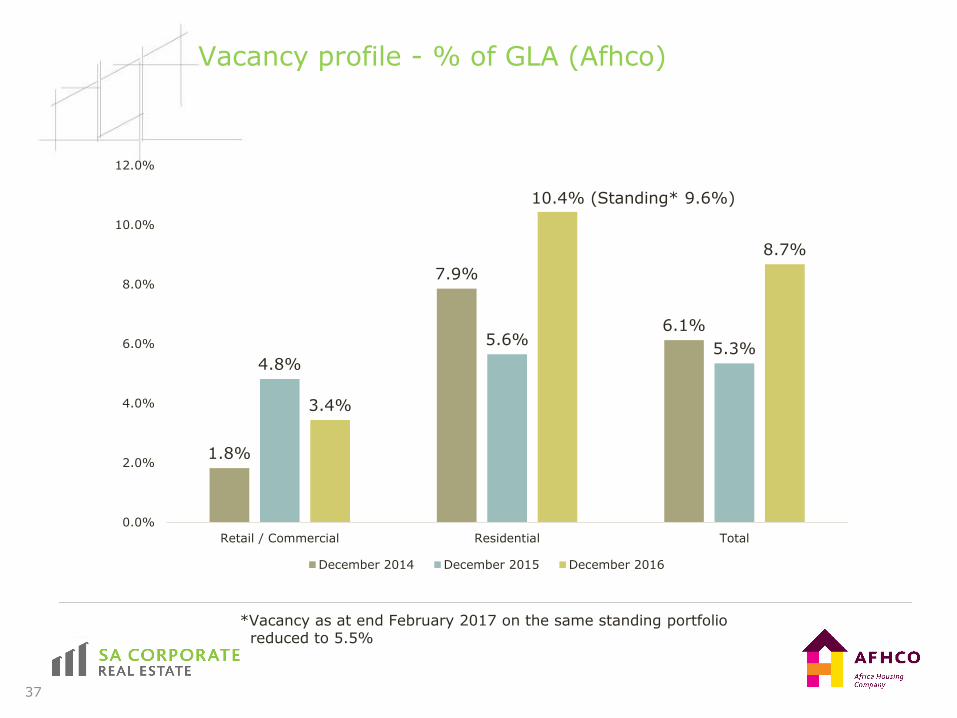
Vacancy profile - % of GLA (Afhco)
37
1.8%
7.9%
6.1%
4.8%
5.6%5.3%
3.4%
10.4% (Standing* 9.6%)
8.7%
0.0%
2.0%
4.0%
6.0%
8.0%
10.0%
12.0%
Retail / Commercial Residential Total
December 2014 December 2015 December 2016
*Vacancy as at end February 2017 on the same standing portfolioreduced to 5.5%
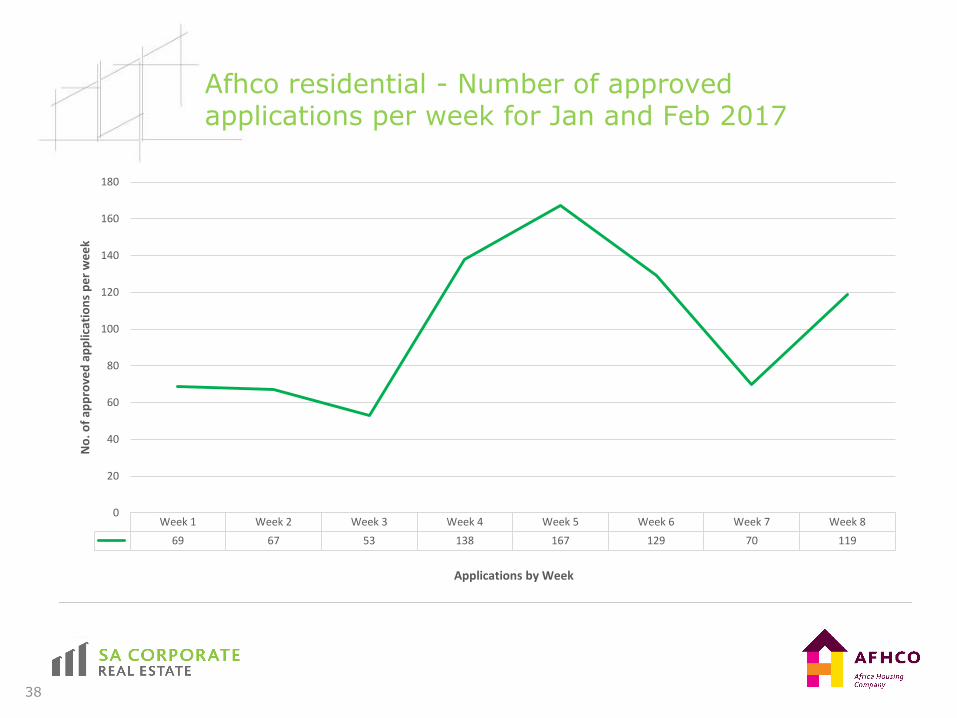
Afhco residential - Number of approved applications per week for Jan and Feb 2017
38
Week 1 Week 2 Week 3 Week 4 Week 5 Week 6 Week 7 Week 8
69 67 53 138 167 129 70 119
0
20
40
60
80
100
120
140
160
180
No
. of
app
rove
d a
pp
licat
ion
s p
er
we
ek
Applications by Week
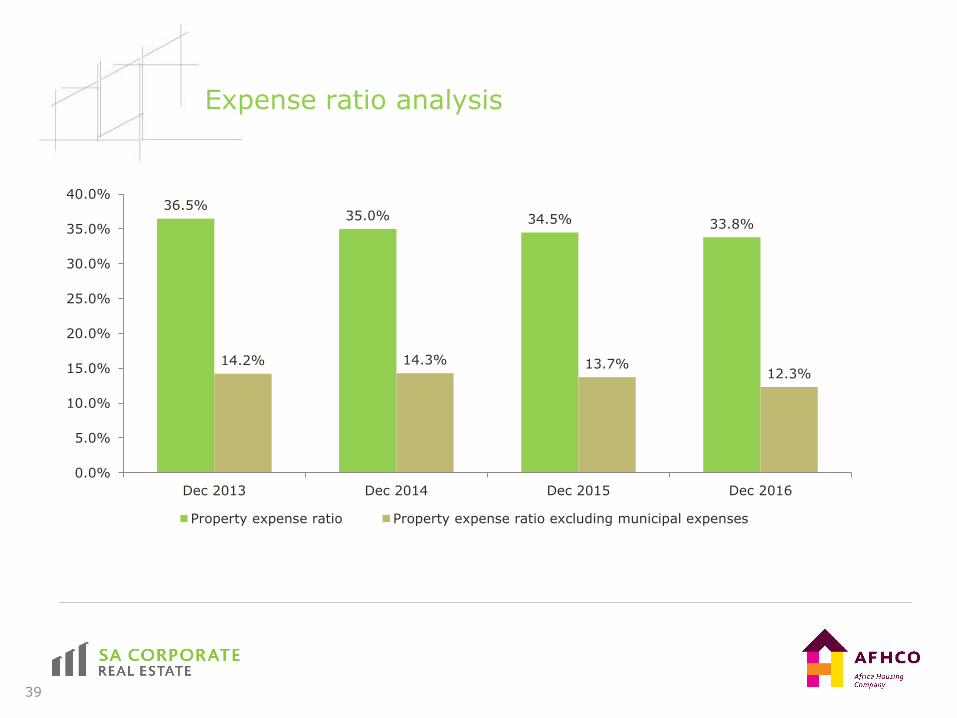
Expense ratio analysis
39
36.5%35.0% 34.5% 33.8%
14.2% 14.3% 13.7%12.3%
0.0%
5.0%
10.0%
15.0%
20.0%
25.0%
30.0%
35.0%
40.0%
Dec 2013 Dec 2014 Dec 2015 Dec 2016
Property expense ratio Property expense ratio excluding municipal expenses
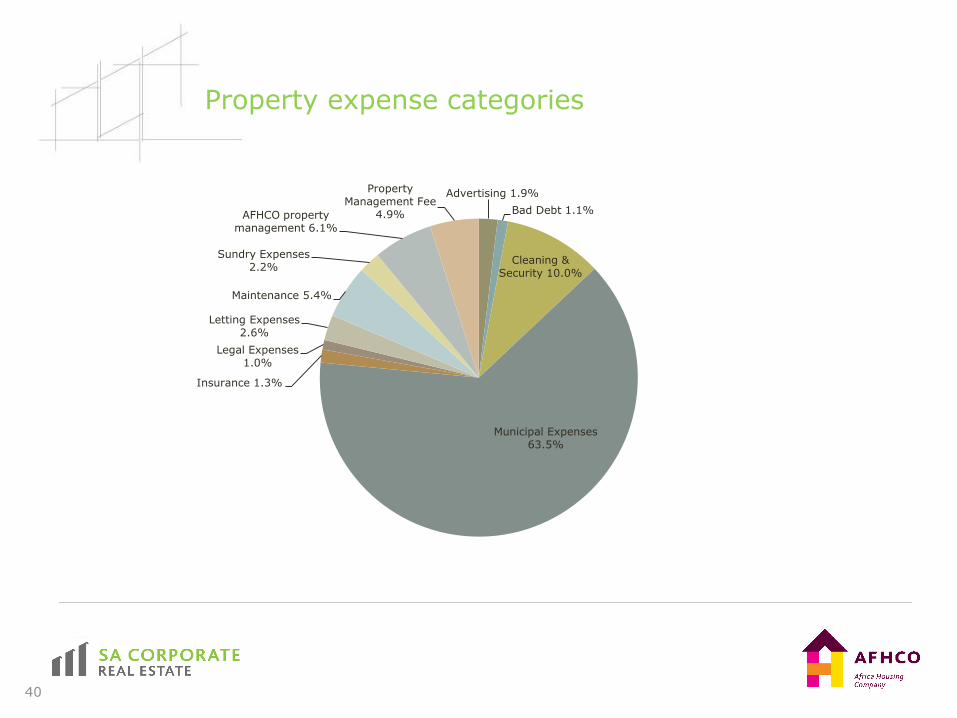
Property expense categories
40
Advertising 1.9%
Bad Debt 1.1%
Cleaning & Security 10.0%
Municipal Expenses63.5%
Insurance 1.3%
Legal Expenses1.0%
Letting Expenses2.6%
Maintenance 5.4%
Sundry Expenses2.2%
AFHCO property management 6.1%
Property Management Fee
4.9%
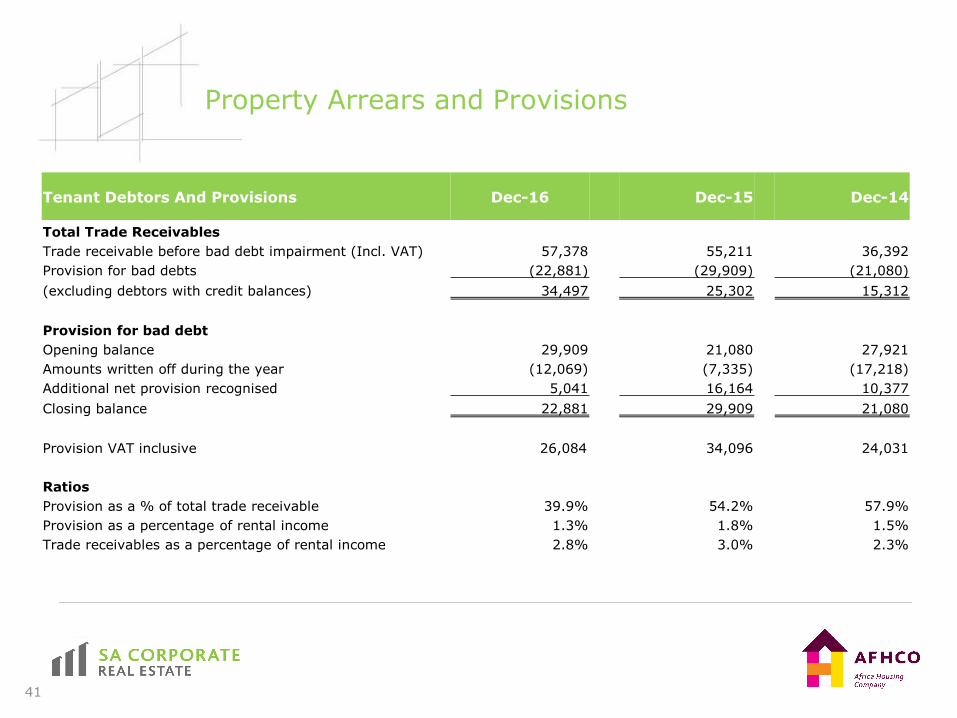
Property Arrears and Provisions
41
Tenant Debtors And Provisions Dec-16 Dec-15 Dec-14
Total Trade Receivables
Trade receivable before bad debt impairment (Incl. VAT) 57,378 55,211 36,392
Provision for bad debts (22,881) (29,909) (21,080)
(excluding debtors with credit balances) 34,497 25,302 15,312
Provision for bad debt
Opening balance 29,909 21,080 27,921
Amounts written off during the year (12,069) (7,335) (17,218)
Additional net provision recognised 5,041 16,164 10,377
Closing balance 22,881 29,909 21,080
Provision VAT inclusive 26,084 34,096 24,031
Ratios
Provision as a % of total trade receivable 39.9% 54.2% 57.9%
Provision as a percentage of rental income 1.3% 1.8% 1.5%
Trade receivables as a percentage of rental income 2.8% 3.0% 2.3%
UNLOCKING VALUE IN THE RETAIL PORTFOLIO RORY MACKEY
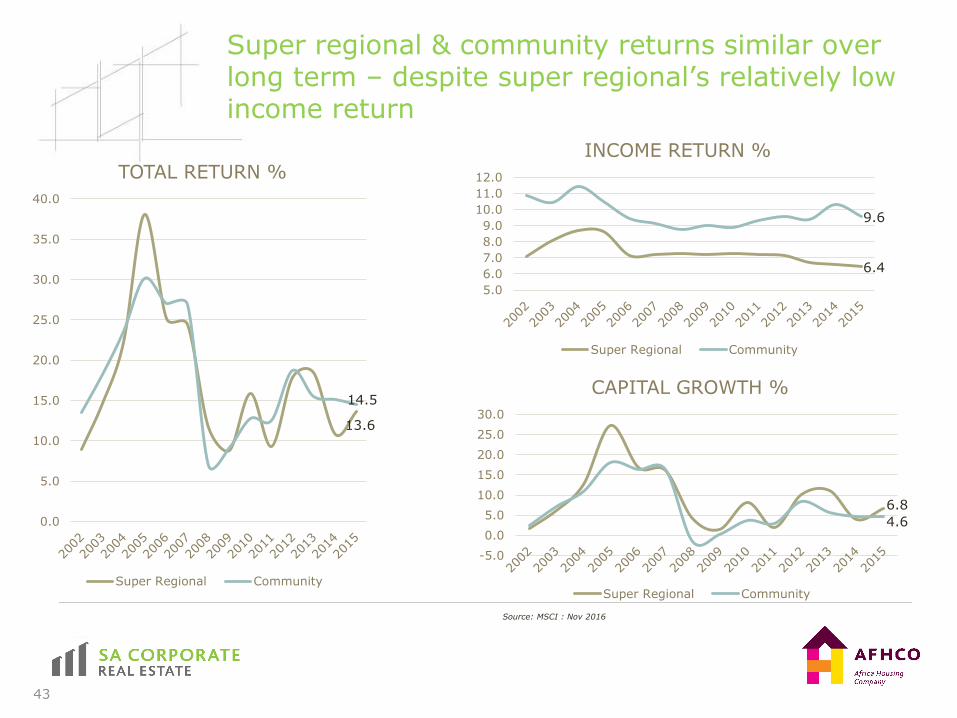
Super regional & community returns similar over long term – despite super regional’s relatively low income return
43
13.6
14.5
0.0
5.0
10.0
15.0
20.0
25.0
30.0
35.0
40.0
TOTAL RETURN %
Super Regional Community
6.4
9.6
5.0
6.0
7.0
8.0
9.0
10.0
11.0
12.0
INCOME RETURN %
Super Regional Community
6.8
4.6
-5.0
0.0
5.0
10.0
15.0
20.0
25.0
30.0
CAPITAL GROWTH %
Super Regional Community
Source: MSCI : Nov 2016

Since 2012, super regional and community trading performance has been counter cyclical. Super regional retailers cost of occupancy has increased.
44
0.0%
12.1%
-4.0%
-2.0%
0.0%
2.0%
4.0%
6.0%
8.0%
10.0%
12.0%
14.0%
12 13 14 15 16
ANNUALISED TRADING DENSITY GROWTH
Super Regional Community
4
5
6
7
8
9
10
11
11 12 13 14 15 16
GROSS RENT TO SALES RATIO
Super Regional Community
Source: MSCI : Nov 2016
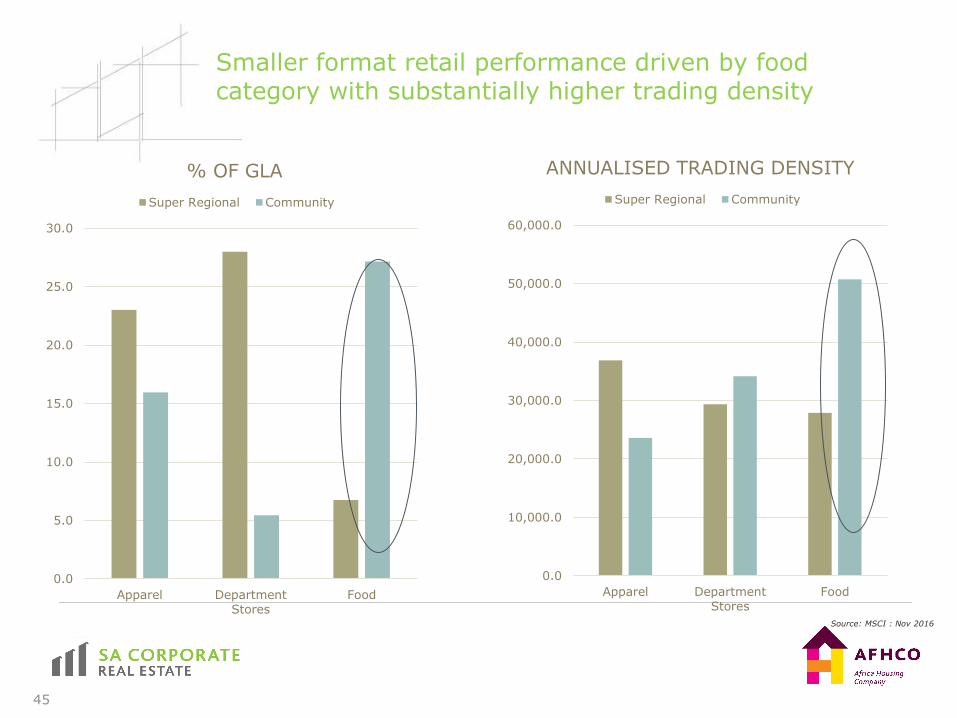
Smaller format retail performance driven by food category with substantially higher trading density
45
0.0
5.0
10.0
15.0
20.0
25.0
30.0
Apparel Department
Stores
Food
% OF GLA
Super Regional Community
0.0
10,000.0
20,000.0
30,000.0
40,000.0
50,000.0
60,000.0
Apparel Department
Stores
Food
ANNUALISED TRADING DENSITY
Super Regional Community
Source: MSCI : Nov 2016
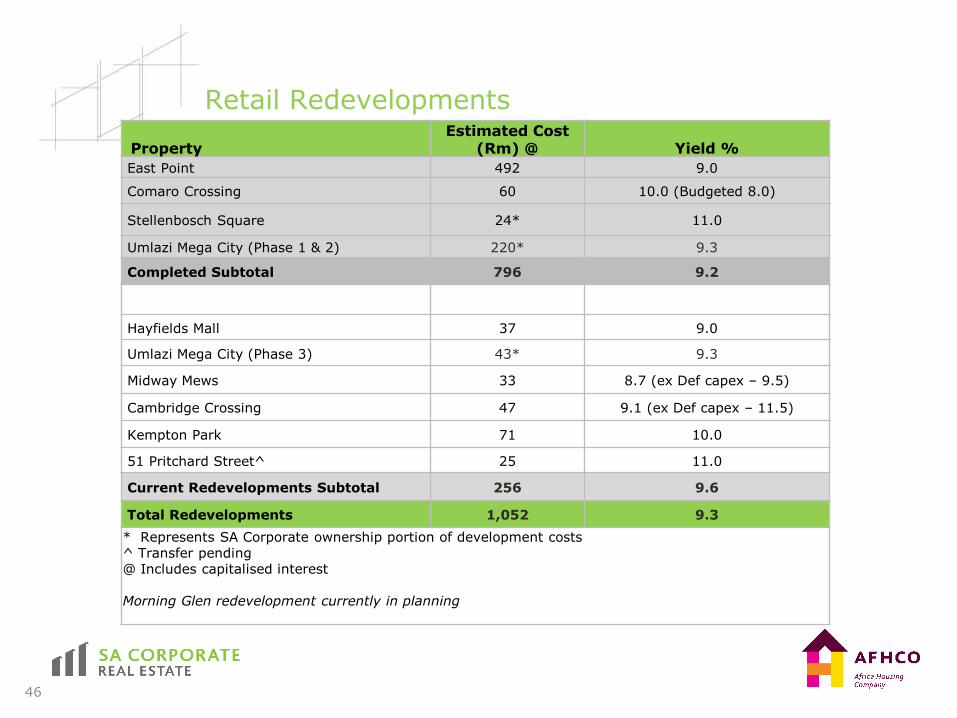
Retail Redevelopments
46
PropertyEstimated Cost
(Rm) @ Yield %
East Point 492 9.0
Comaro Crossing 60 10.0 (Budgeted 8.0)
Stellenbosch Square 24* 11.0
Umlazi Mega City (Phase 1 & 2) 220* 9.3
Completed Subtotal 796 9.2
Hayfields Mall 37 9.0
Umlazi Mega City (Phase 3) 43* 9.3
Midway Mews 33 8.7 (ex Def capex – 9.5)
Cambridge Crossing 47 9.1 (ex Def capex – 11.5)
Kempton Park 71 10.0
51 Pritchard Street^ 25 11.0
Current Redevelopments Subtotal 256 9.6
Total Redevelopments 1,052 9.3
* Represents SA Corporate ownership portion of development costs^ Transfer pending @ Includes capitalised interest
Morning Glen redevelopment currently in planning
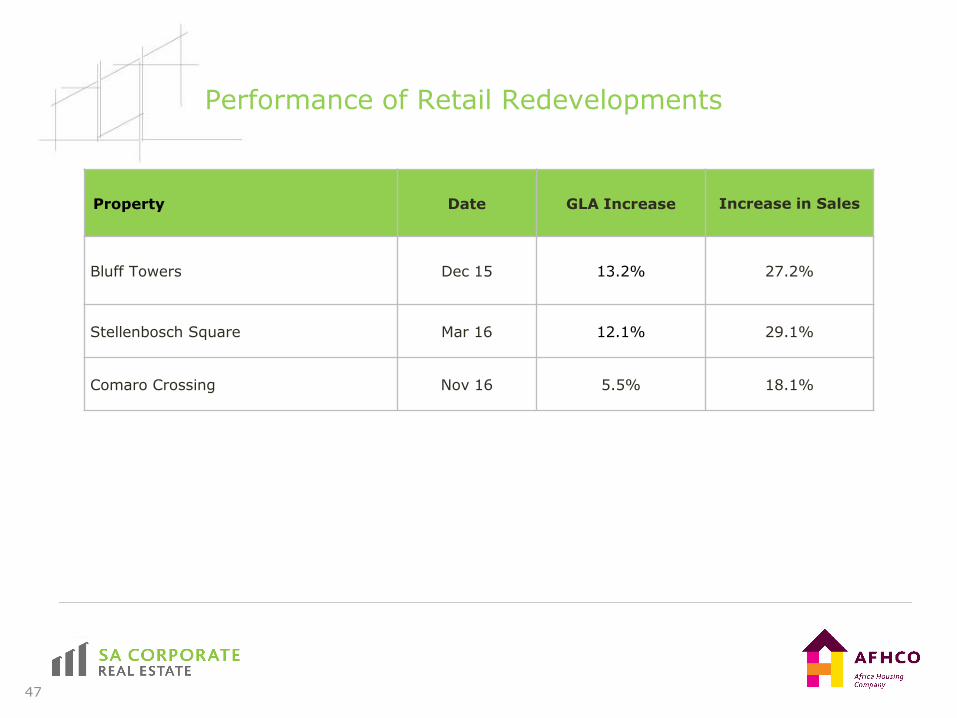
Performance of Retail Redevelopments
47
Property Date GLA Increase Increase in Sales
Bluff Towers Dec 15 13.2% 27.2%
Stellenbosch Square Mar 16 12.1% 29.1%
Comaro Crossing Nov 16 5.5% 18.1%
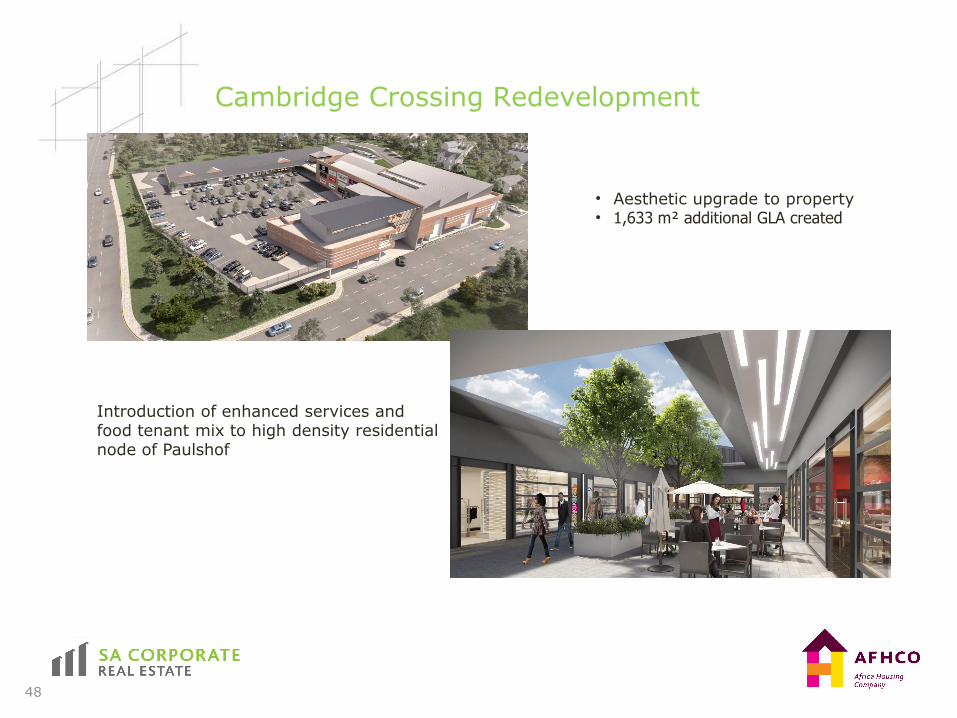
Cambridge Crossing Redevelopment
48
• Aesthetic upgrade to property• 1,633 m² additional GLA created
Introduction of enhanced services and food tenant mix to high density residential node of Paulshof
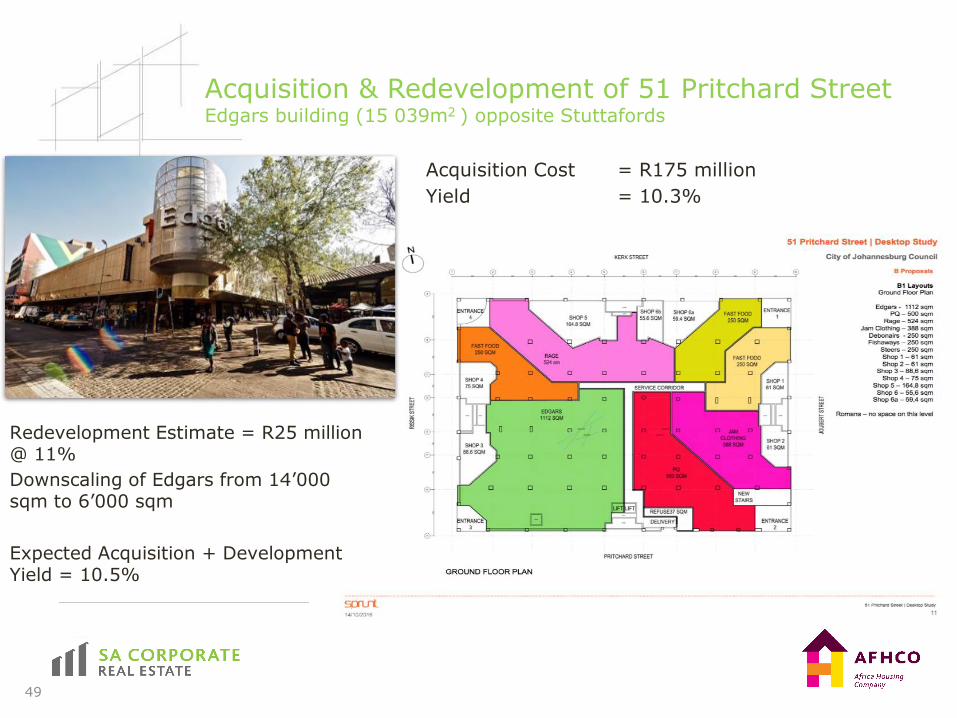
Acquisition & Redevelopment of 51 Pritchard Street Edgars building (15 039m2 ) opposite Stuttafords
Acquisition Cost = R175 million
Yield = 10.3%
49
Redevelopment Estimate = R25 million @ 11%
Downscaling of Edgars from 14’000 sqm to 6’000 sqm
Expected Acquisition + Development Yield = 10.5%
50
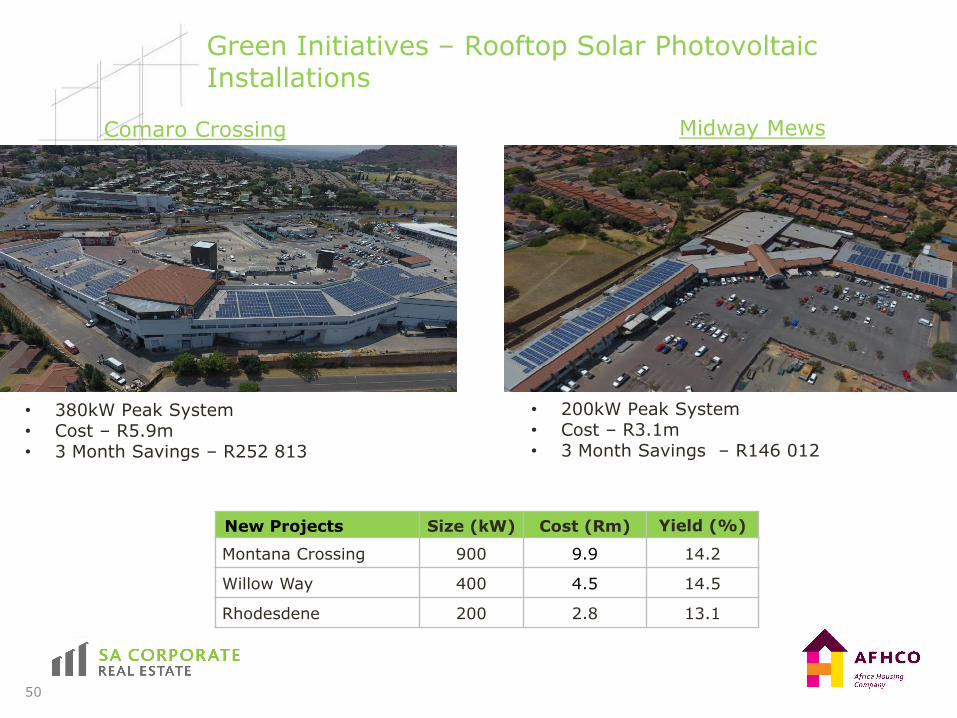
• 380kW Peak System• Cost – R5.9m• 3 Month Savings – R252 813
Comaro Crossing Midway Mews
New Projects Size (kW) Cost (Rm) Yield (%)
Montana Crossing 900 9.9 14.2
Willow Way 400 4.5 14.5
Rhodesdene 200 2.8 13.1
• 200kW Peak System• Cost – R3.1m• 3 Month Savings – R146 012
Green Initiatives – Rooftop Solar Photovoltaic Installations
51
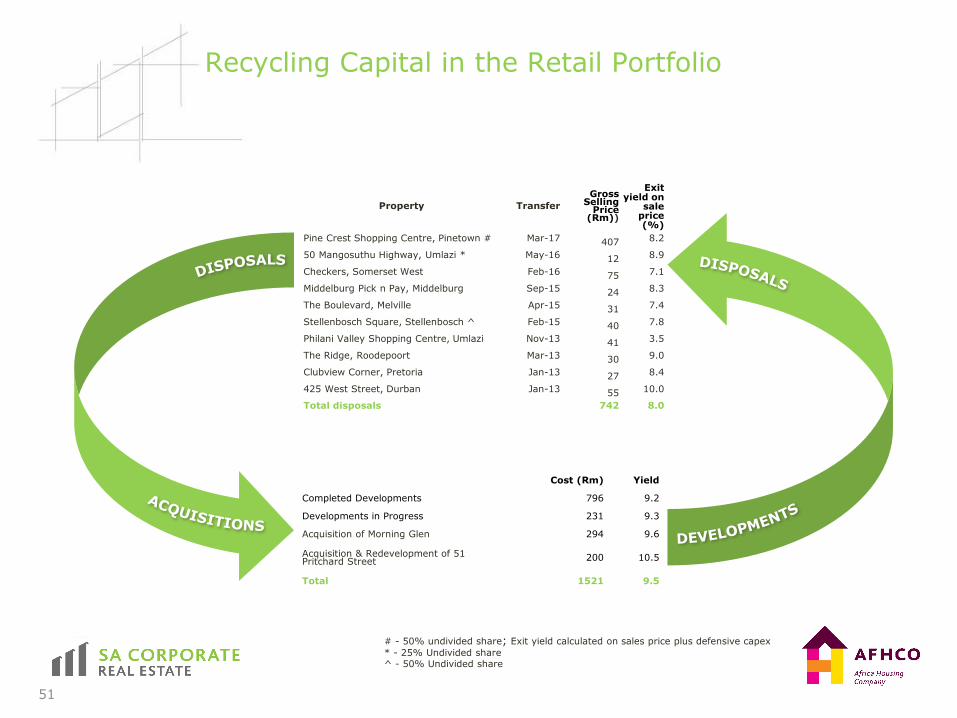
Recycling Capital in the Retail Portfolio
# - 50% undivided share; Exit yield calculated on sales price plus defensive capex
* - 25% Undivided share^ - 50% Undivided share
Cost (Rm) Yield
Completed Developments 796 9.2
Developments in Progress 231 9.3
Acquisition of Morning Glen 294 9.6
Acquisition & Redevelopment of 51 Pritchard Street 200 10.5
Total 1521 9.5
Property Transfer
Gross Selling
Price (Rm))
Exit yield on
sale price (%)
Pine Crest Shopping Centre, Pinetown # Mar-17 407 8.2
50 Mangosuthu Highway, Umlazi * May-16 12 8.9
Checkers, Somerset West Feb-16 75 7.1
Middelburg Pick n Pay, Middelburg Sep-15 24 8.3
The Boulevard, Melville Apr-15 31 7.4
Stellenbosch Square, Stellenbosch ^ Feb-15 40 7.8
Philani Valley Shopping Centre, Umlazi Nov-13 41 3.5
The Ridge, Roodepoort Mar-13 30 9.0
Clubview Corner, Pretoria Jan-13 27 8.4
425 West Street, Durban Jan-13 55 10.0
Total disposals 742 8.0
ZAMBIAN PORTFOLIO PERFORMANCERORY MACKEY
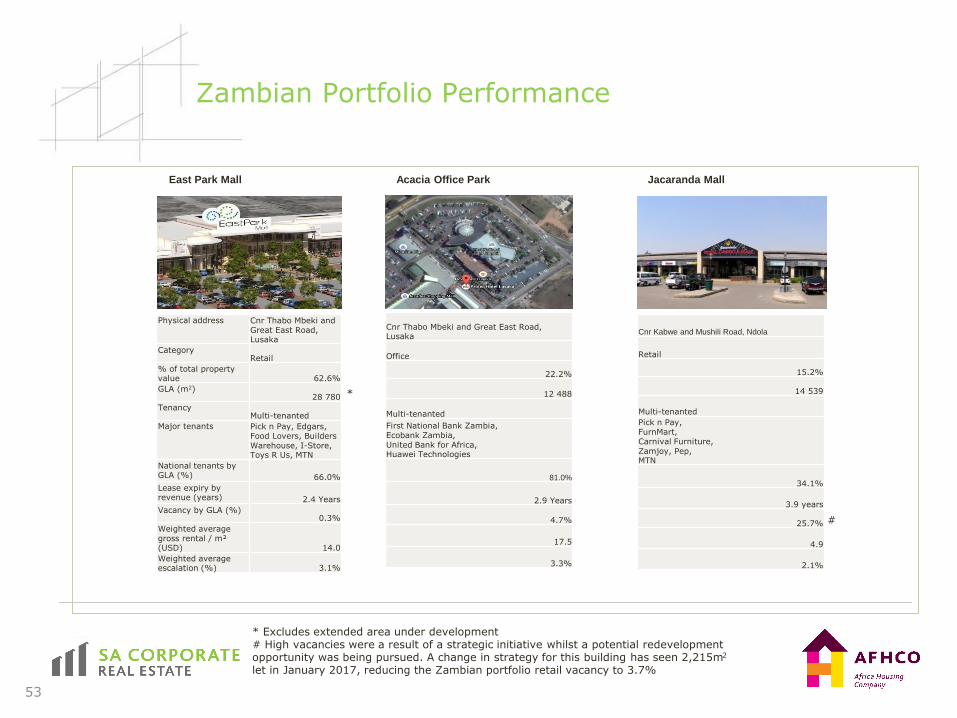
Zambian Portfolio Performance
East Park Mall Acacia Office Park Jacaranda Mall
53
Physical address Cnr Thabo Mbeki and Great East Road, Lusaka
CategoryRetail
% of total property value 62.6%
GLA (m2)28 780
TenancyMulti-tenanted
Major tenants Pick n Pay, Edgars, Food Lovers, Builders Warehouse, I-Store, Toys R Us, MTN
National tenants by GLA (%) 66.0%
Lease expiry by revenue (years) 2.4 Years
Vacancy by GLA (%)0.3%
Weighted average gross rental / m² (USD) 14.0
Weighted average escalation (%) 3.1%
Cnr Thabo Mbeki and Great East Road, Lusaka
Office
22.2%
12 488
Multi-tenanted
First National Bank Zambia, Ecobank Zambia, United Bank for Africa, Huawei Technologies
81.0%
2.9 Years
4.7%
17.5
3.3%
Cnr Kabwe and Mushili Road, Ndola
Retail
15.2%
14 539
Multi-tenanted
Pick n Pay, FurnMart, Carnival Furniture, Zamjoy, Pep,MTN
34.1%
3.9 years
25.7%
4.9
2.1%
* Excludes extended area under development# High vacancies were a result of a strategic initiative whilst a potential redevelopment opportunity was being pursued. A change in strategy for this building has seen 2,215m2
let in January 2017, reducing the Zambian portfolio retail vacancy to 3.7%
*
#
BUILDING THE AFHCO BUSINESSRORY MACKEY
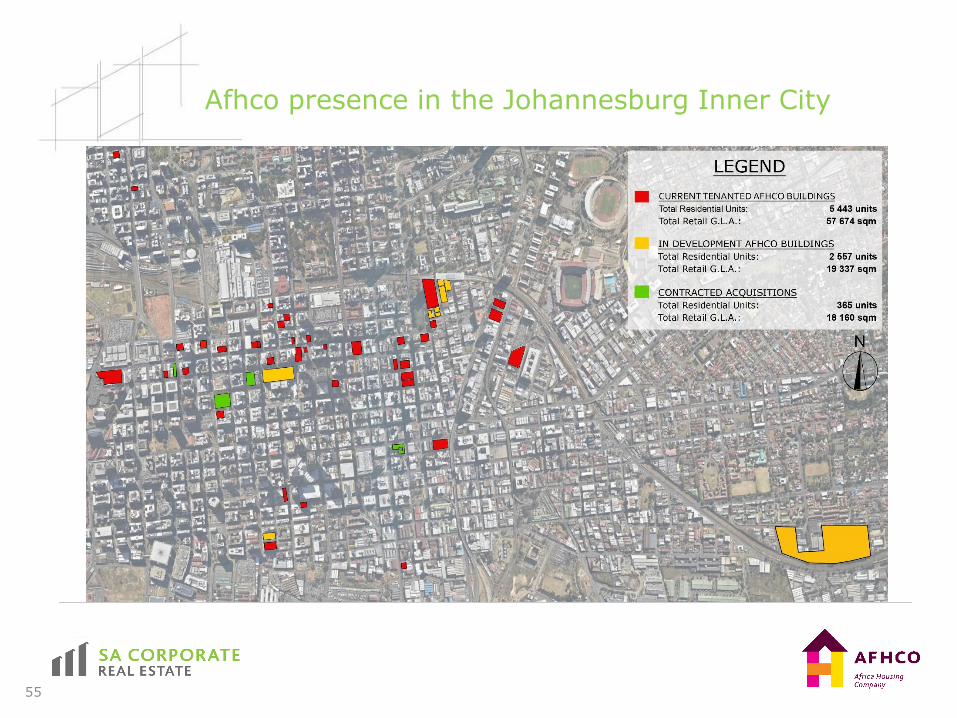
Afhco presence in the Johannesburg Inner City
55

Newly acquired bulk
56
Building No. of units Retail m²Construction costs (Rm)
Yield
Jeppe Post Office 550 14,000 276 11.0%
Hartmann & Keppler 109 - 40 11.0%
Long Street Precinct 1,150 - 599 11.0%
Randfontein 156 - 69 11.0%
Totals 1,965 14,000 984 11.0%
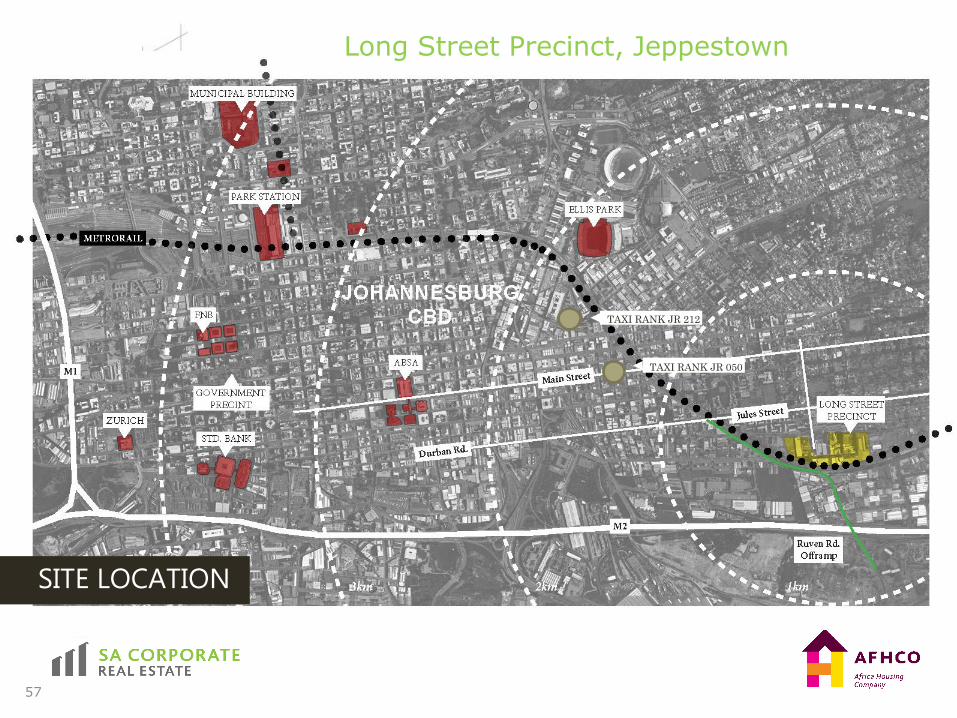
TAXI RANK JR 212
TAXI RANK JR 050
SITE LOCATION
Long Street Precinct, Jeppestown
57
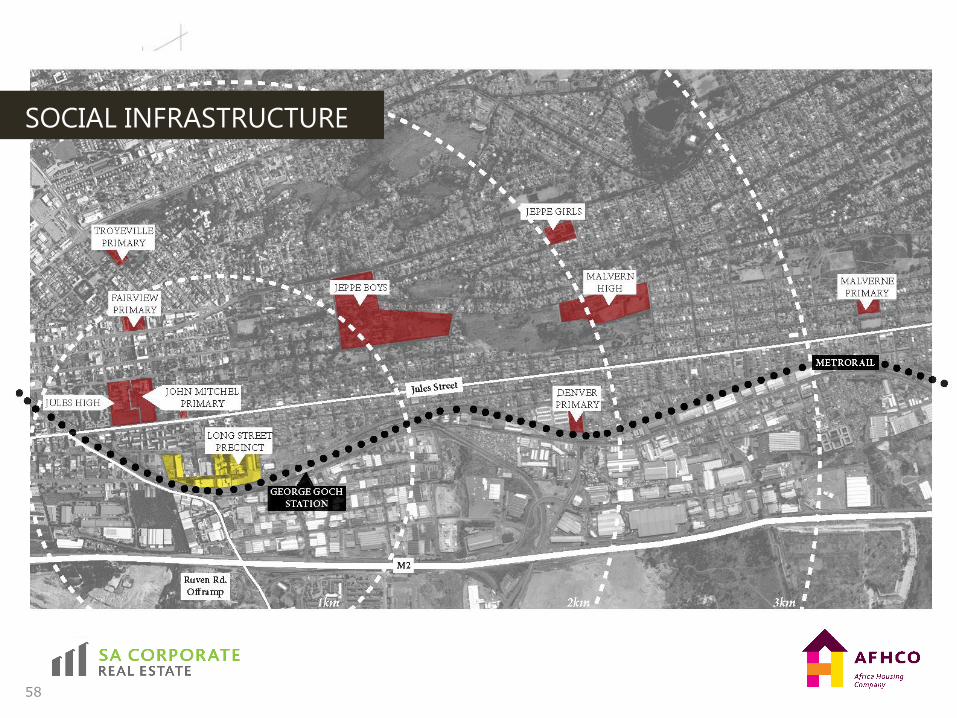
SOCIAL INFRASTRUCTURE
58
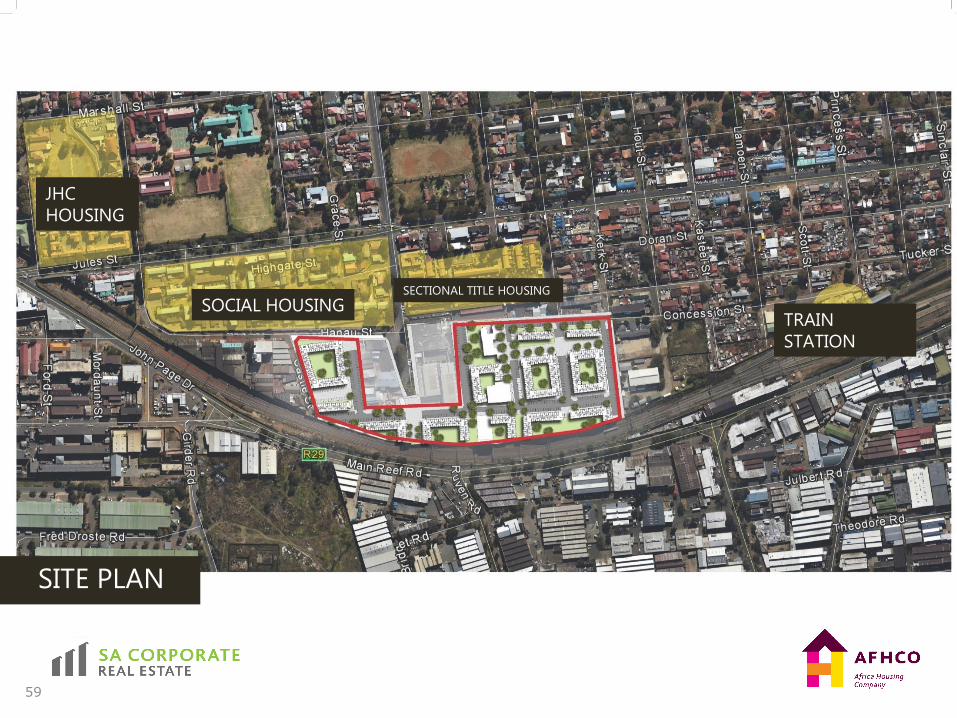
JHC
HOUSING
SOCIAL HOUSINGSECTIONAL TITLE HOUSING
TRAIN
STATION
SITE PLAN
59
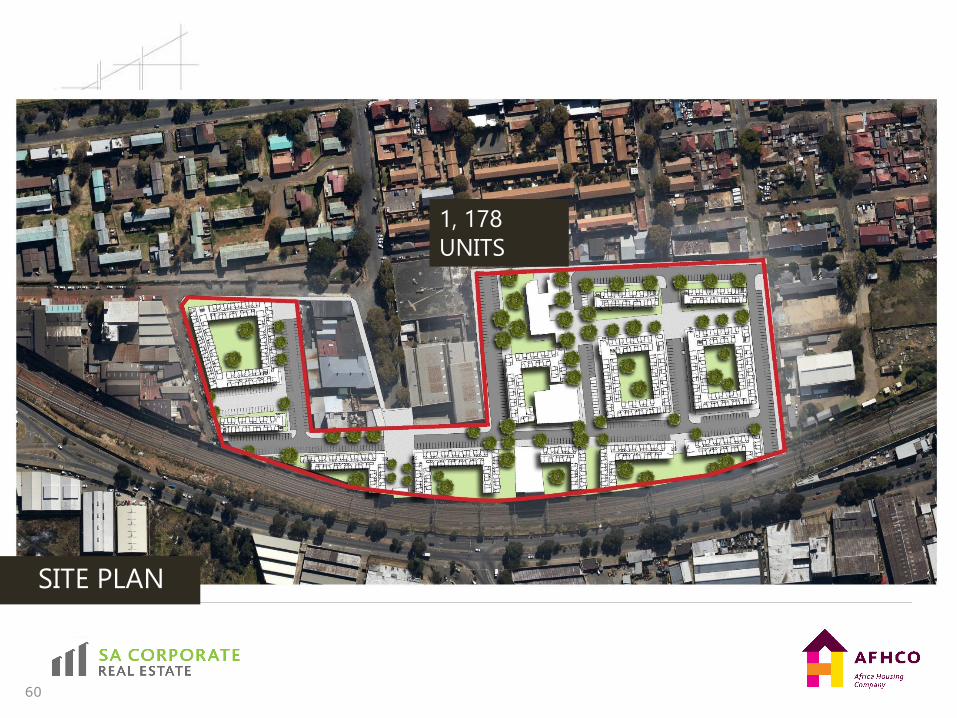
SITE PLAN
1, 178
UNITS
60
61
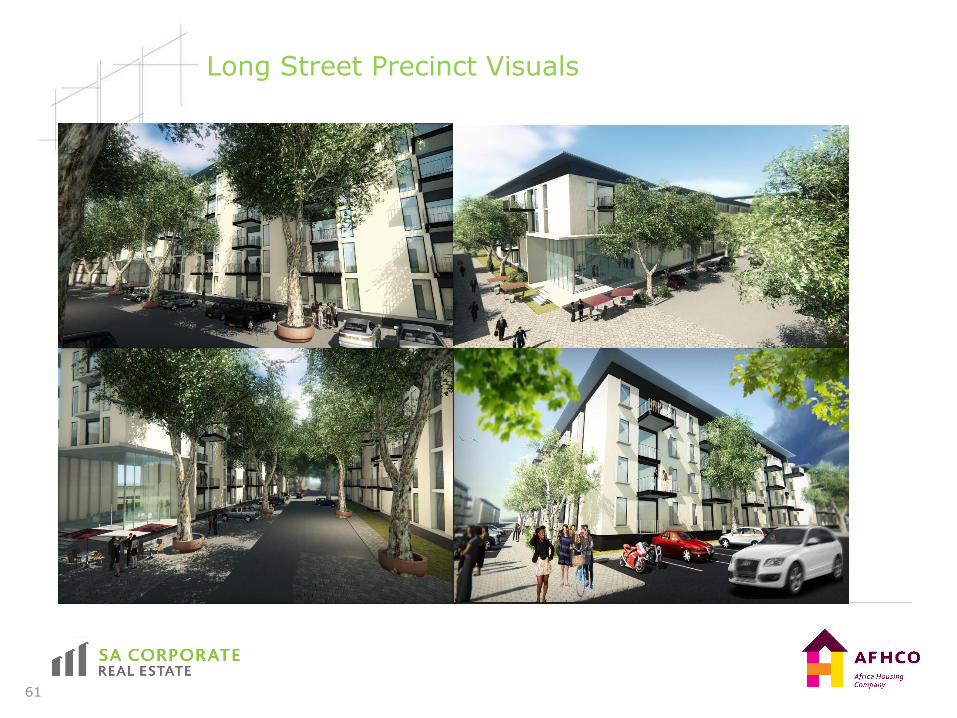
Long Street Precinct Visuals
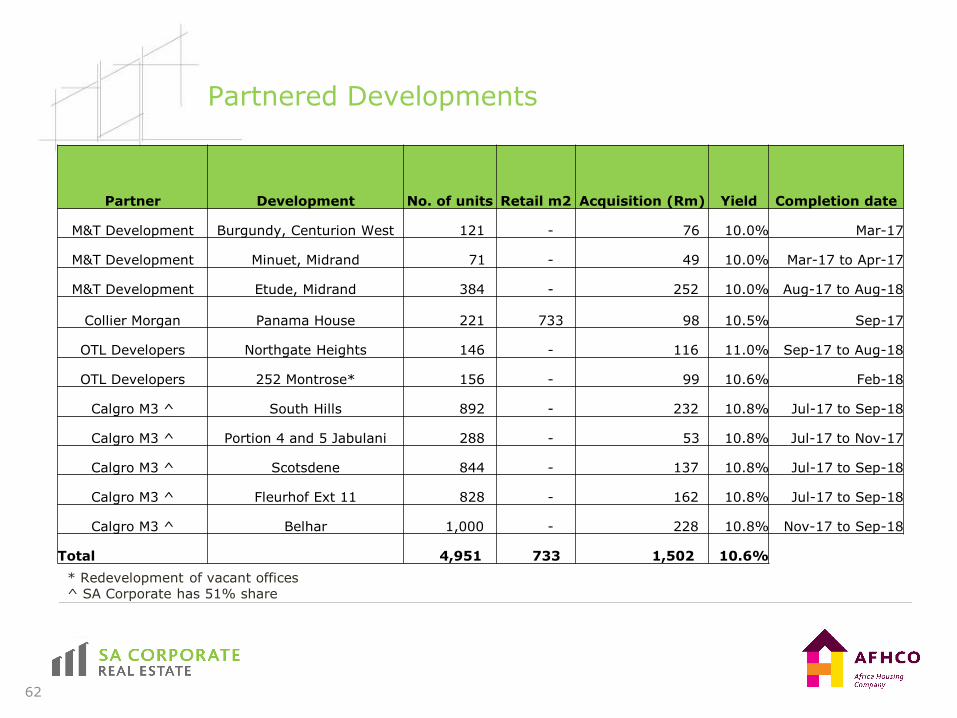
Partnered Developments
62
* Redevelopment of vacant offices^ SA Corporate has 51% share
Partner Development No. of units Retail m2 Acquisition (Rm) Yield Completion date
M&T Development Burgundy, Centurion West 121 - 76 10.0% Mar-17
M&T Development Minuet, Midrand 71 - 49 10.0% Mar-17 to Apr-17
M&T Development Etude, Midrand 384 - 252 10.0% Aug-17 to Aug-18
Collier Morgan Panama House 221 733 98 10.5% Sep-17
OTL Developers Northgate Heights 146 - 116 11.0% Sep-17 to Aug-18
OTL Developers 252 Montrose* 156 - 99 10.6% Feb-18
Calgro M3 ^ South Hills 892 - 232 10.8% Jul-17 to Sep-18
Calgro M3 ^ Portion 4 and 5 Jabulani 288 - 53 10.8% Jul-17 to Nov-17
Calgro M3 ^ Scotsdene 844 - 137 10.8% Jul-17 to Sep-18
Calgro M3 ^ Fleurhof Ext 11 828 - 162 10.8% Jul-17 to Sep-18
Calgro M3 ^ Belhar 1,000 - 228 10.8% Nov-17 to Sep-18
Total 4,951 733 1,502 10.6%
63
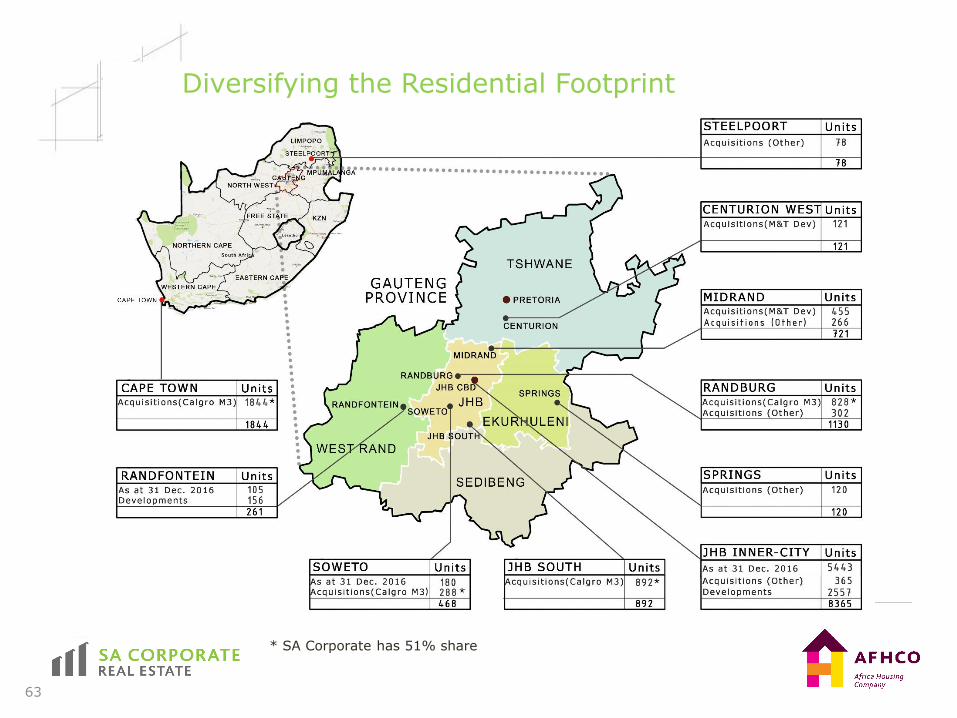
Diversifying the Residential Footprint
* SA Corporate has 51% share
STRATEGY & PROSPECTSRORY MACKEY
Strategy & Prospects
65
In 2016, through proactive asset management interventions and focussed operational management, SA
Corporate has positioned its property portfolio to generate sustainable and defensive income whilst
establishing a pipeline for growth.
In particular:
• The company’s rejuvenated retail portfolio is set on a growth trajectory which will be complemented
by the repositioning and redevelopment of a number of newly acquired and currently owned
shopping centres.
• AFHCO has entrenched itself as a dominant trusted residential rental brand of choice providing
quality and affordable accommodation in the Johannesburg inner city. This established residential
rental platform is now well poised to diversify its geographic spread in high demand nodes through
strategic partnerships with the largest developers of residential property in the country.
• The sustained low vacancies in the industrial portfolio evidences the quality and resilience of these
properties which will continue to generate strong annuity income through focussed tenant retention,
tenant-driven improvements and recycling capital.
The Board’s view of future prospects is that distribution growth of between 6% and 8% for the 2017 year
can be anticipated.
ACKNOWLEDGMENTS
QUESTIONS