Embed Size (px)
Citation preview

www.pwc.co.za/construction
SA construction4th edition
Highlighting trends in the South African construction industry
November 2016

Contents
The information contained in this publication is provided for general information purposes only, and does not constitute the provision of legal or professional advice in any way. Before making any decision or taking any action, a professional adviser should be consulted. No responsibility for loss to any person acting or refraining from action as a result of any material in this publication can be accepted by the author, copyright owner or publisher.

PwC
Executive summary
02
The South African construction industry
04Integrating risk for performance
13
Value added
19
Tax developments
23
Boardroom dynamics
26
Financial performance
29Glossary
38
Other information
40
Contacts
42

Executive summary
2 Highlighting trends in the South African construction industry

PwC 3
Executive summary
Highlights
This is the fourth edition in our series of publications highlighting trends in the South African construction industry. We trust it will provide meaningful information to industry participants in evaluating performance and addressing risks.
The construction industry, a significant contributor to employment and growth in South Africa, has been in a slump since 2009. The 2016 financial year once again got off to a poor start, with margins under pressure, tight liquidity and decreasing order books. There has been some improvement in companies’ performance as the year draws to an end, though, with signs of an increase in profitability and market performance.
A promising development for the industry is Government’s infrastructure plan, which aims to address South Africa’s infrastructure needs over the next few years. However, it will require input from and co-ordination with the construction sector for it to be successful.
Following an investigation by the Competition Commission into collusion in the industry, in October 2016 seven of the nine listed construction companies entered into an agreement with Government. This demonstrates their commitment to transformation in the industry in what is undoubtedly a move in the right direction. It is hoped that this agreement will resolve the perceived mistrust between the big construction companies and Government.
While the seven years of weak performance have resulted in weaker construction companies, we nevertheless believe that the industry is well positioned to support the country’s development goals.
Scope
Our findings are based on the financial results of the leading heavy construction companies listed on the JSE. We excluded companies with suspended listings. Section 9 of this report provides a comprehensive list of all companies included in our analysis.
The nine heavy construction companies included here are the same ones that were used for last year’s report. Our findings are based on publicly available information, predominantly annual reports, for financial years ending no later than 30 June 2016.
Andries Rossouw Project leader

The South African construction industry
4 Highlighting trends in the South African construction industry

PwC 5
The South African construction industry
Market capitalisation
Figure 1: Market capitalisation of the top nine construction companies, June 2014-October 2016 (R billions)
Source: INET BFA
Esor
Basil Read
Stefanutti Stocks
Aveng
Group Five
Calgro M3
Raubex
Murray & Roberts
WBHO
9.6
3.0
4.2
2.4
2.51.1
2.62.3
3.24.6
2.9
0.9
1.20.8
1.8
0.50.40.3
0.9
0.20.10.10.2
9.62.4
1.5
3.83.7
4.6
10.8
8.0
5.75.3
4.1
8.46.5
Oct-16 Jun-16 Jun-15 Jun-14
The 2016 financial year saw a general decline in market capitalisation performance to 30 June 2016. Seven of the nine companies reflected a decrease in market capitalisation. Murray & Roberts, Aveng and Group Five showed the largest declines, from 30 June 2015 to 30 June 2016. WBHO and Calgro showed increases in their market capitalisations. In aggregate, the market capitalisation of the nine companies analysed decreased by 3% to R25 billion as at 30 June 2016 (2015: R25.9 billion as at 30 June 2015).
After 30 June 2016, market capitalisation performance reflected mixed results. WBHO, Group Five, Raubex, Esor, Aveng and Stefannuti Stocks reflected an increase while the remaining three companies reflected a further decrease. In aggregate, the market capitalisation performance of the nine companies showed an 11% increase over the four months from 30 June 2016 to 31 October 2016.

6 Highlighting trends in the South African construction industry
The South African construction industry
Figure 2: JSE all-share vs construction and materials index
Source: INET BFA
The performance differential between the JSE all-share index and the construction and materials index is undeniable. The JSE all-share index, despite a challenging year, remained fairly flat while the construction and materials index continued its decline. Since September 2009, when reaching its high point, the construction sector has decreased by 68%. In the same period the JSE all-share index grew by 129%.
The marginal recovery in the construction and materials index since June 2016 is encouraging. However, it is too early to start predicting a resurgence in the industry. Construction is generally a lagging industry and will require general economic growth to show a substantial recovery, before one can expect any real growth in the construction sector.
A good indicator of industry performance is public sector infrastructure expenditure.
40
50
60
70
80
90
100
110
120
30 June2016
30 June2015
30 June2014
JSE All Share Index JSE Construction & Construction Materials Index

PwC 7
The South African construction industry
Public sector expenditure
Capital expenditure by public sector institutions increased by 5% during the 2015 financial year, with total expenditure amounting to R258 billion. New construction works increased by 20% to R157 billion, while expenditure on land and buildings, transport and equipment and plant, machinery and equipment decreased from 2014, by a cumulative R12 billion (10%).
Figure 3: Public expenditure: New construction, property development and major rejuvenation (R billions)
Source: Stats SA, PwC analysis
Figure 3 depicts the capital expenditure relating to new construction works, land and existing buildings actually incurred by the public sector until 2015 and forecasted for 2016. The graph shows a nominal increase in expenditure from 2014 to 2015 of 14%. Taking into account the effect of inflation of 5.58% p.a., this represents a real increase of 8%. The forecast for 2016 (done in 2014) indicates a marginal increase of 0.4% and a real decline in capital expenditure of 5%.
The real expenditure line was derived from nominal expenditure, adjusted for the standard consumer price index (CPI). Construction input cost inflation is well above CPI inflation. The actual situation is therefore even worse than indicated in the graph. The negative real growth in public expenditure has certainly impacted on the industry, especially relating to large-scale civil engineering projects.
100
110
120
130
140
150
160
170
180
2016:2015:2014:2013:2012:2011:2010:
Nominal value Real terms

8 Highlighting trends in the South African construction industry
The South African construction industry
Figure 4: Actual vs forecast public expenditure (R billions)
Source: Stats SA
Figure 4 compares the actual capital expenditure relating to new construction, development of properties and major rejuvenation projects incurred by the public sector, alongside the forecasted expenditure as forecast in the year before the actual expenditure. The last Statistics South Africa forecast was published in 2014. Actual capital expenditure for 2015 was R32 billion below forecasted expenditure for the year. The below-forecasted capital expenditure is indicative of the challenges faced in the industry.
Figure 5: Capital expenditure by Eskom, Transnet and Sanral (R billions )
Source: PwC analysis, company annual reports
0
50
100
150
200
250
2016201520142013201220112010
Forecast capital expenditure Actual expenditure
Eskom SANRAL TRANSNET
0
20
40
60
80
100
120
2016:2015:2014:2013:2012:2011:

PwC 9
The South African construction industry
The majority of public sector capital expenditure is undertaken by Eskom, Transnet and the South African National Roads Agency (Sanral). Figure 5 illustrates the capital expenditure by each of these institutions individually and in aggregate.
Eskom, Transnet and Sanral have been reliable sources of public sector expenditure over the years. Figure 5 reflects a 14% decrease in total capital expenditure in 2016 to R98 billion. The bulk of this decrease is attributable to the decrease in capital expenditure by Eskom, which shrank by 19% to R57.3 billion in 2016. Expenditure by Sanral also declined in 2016, with a marginal increase in expenditure by Transnet being noted. The bulk of Transnet’s capital expenditure relates to rolling stock purchases, however, and therefore does not necessarily support the construction industry.
Government has remained committed to significant capital expenditure in the construction of the Medupi and Kusile power stations. Unfortunately, though, over-expenditure on Eskom projects and the funding debate at Sanral has detracted from real growth in public sector infrastructure.
Private sector expenditure
Figure 6: Capital expenditure for the mining sector (R billions) vs JSE mining index
Source: PwC’s SA Mine 2016 and INET BFA
The private sector is also a significant contributor to capital expenditure in the construction industry, with the mining sector being one of the biggest players. Due to severe pressure in the sector, however, with shrinking margins attributed to volatile commodity prices, exchange rate fluctuations and labour unrest, there has been a decline in demand from this sector.
0
10
20
30
40
50
60
70
80
2016:2015:2014:2013:2012:2011:
Capital expenditure (R’ billions) Mining Index
Capit
al exp
endit
ure J
SE
Min
ing In
dex
0
5000
10000
15000
20000
25000
30000
35000
40000
Figure 6 illustrates the decline in capital expenditure in the mining sector, as reflected in PwC’s SA Mine, along with a corresponding decline in the JSE mining index. Due to difficulties experienced in the sector, mining companies have reduced their capital expenditure by R22 billion (31%) over the past three years. The 2016 mining capital expenditure was the lowest since 2007. Indications are that capital expenditure in the mining sector may decline further over the next few years, as mining companies struggle for survival in the lower commodity price cycle.
The lack of mining capital expenditure at the bottom of the cycle will create significant development opportunities once prices start increasing, as mining companies will have to catch up in order to increase production. Murray & Roberts’ strategic core focus on the resource sector, as well as other construction companies with significant exposure to the mining sector, positions them well to benefit from an upswing in this sector.

10 Highlighting trends in the South African construction industry
The South African construction industry
Figure 7: Capital expenditure for Energy (R billions)
Source: Stats SA Statistical release P0044 (Quarterly financial statistics)
The data in Figure 7 represents the energy sector’s capital expenditure per quarter to June for the past seven years. An amount of R89 billion was spent in 2016 (2015: R79 billion), which indicates excellent growth over recent years. Eskom expenditure, included in the above analysis, amounted to R 57 billion in 2016 (2015: R 71 billion), a decline from 96% to 69% of total energy sector expenditure. Private sector expenditure grew from R 4 billion in 2015 to R 25 billion in 2016, representing an increase from 5% to 31% of total energy sector expenditure.
Investment in sustainable energy in South Africa in the form of wind farms and solar energy projects continues to be a significant contributor to capital expenditure by the energy sector.
A public-private sector partnership known as the Renewable Energy Independent Power Procurement Programme (REIPPPP) was introduced in 2011. The Department of Energy procured 5 243 MWs of renewable energy in bid windows 1 to 4. The programme has secured a commitment of about R170 billion in capital investment for the South African economy. Since 2012, South Africa has ranked among the top ten countries globally in terms of renewable energy investments by independent power producers.
In the PwC’s Electricity beyond the grid report, we note that rates of electrification in sub-Saharan Africa have not kept pace with population growth. The region as a whole has now overtaken Asia as having the largest number of people lacking access to electricity. Population growth has led the International Energy Agency (IEA) to revise upward its estimate for those without electricity in sub-Saharan Africa from 585 million back in 2009 to the latest estimate of 634 million. The IEA has recommended that $450 billion be invested in the region’s energy sector.
Q1 Q2 Q3 Q4
0
10
20
30
40
50
60
70
80
90
100
2016:2015:2014:2013:2012:2011:2010:
39.7
59.766.0
60.3
73.579.4
89.0

PwC 11
The South African construction industry
Heavy construction order book
A secured order book is defined in various ways, and the consistency of information disclosed is not necessarily comparable. Figure 8 indicates that the secured order book has shown a declining trend since 2014. The secured order book only covers 1.5 times current year revenue, a marginal increase on 1.24 in the prior year. The increase was as a result of an even bigger decrease in revenue.
Figure 8: Secured order book (R’ billions)
Source: PwC analysis, company annual reports
The current-year order book reflects the impact of subdued domestic economic growth. Lower expenditure on government infrastructure and by resource companies, in particular on oil and gas developments, has undoubtedly reduced order books. Although there are encouraging signs from the resource sector, capital expenditure is set to remain under pressure.
Figure 9: Secured order book growth
Source: PwC analysis, company annual reports
WHBO
Murray and Roberts
Aveng
Calgro
Stefanutti Stocks
Group Five
Basil Read
Raubex
Esor
0 20 40 60 80 100 120 140 160 180 200
2011:
2012:
2013:
2014:
2015:
2016:
Group Five
Murray & Roberts
Esor
Raubex
Aveng
Stefanutti Stocks
Basil Read
WBHO
Calgro
14%
-3%
-1%
2%
-21%
-13%
-12%
-5%
42%
A decrease in order books was observed across six of the nine construction companies, while Calgro, WBHO and Basil Read showed growth on the previous year.
Calgro’s order book showed excellent growth of 42% this year after it acquired the Tanganani Extension 14 project from Esorfranki in 2014. They continue to have success with their integrated development projects in the governmental housing sector.
The order books of Esorfranki, Murray & Roberts and Group Five reflected significant declines on the prior year of greater than 10%.

12 Highlighting trends in the South African construction industry
The South African construction industry
Figure 10: Order book as a multiple of construction revenue
Source: PwC analysis, company annual reports
Apart from Calgro with its secured order book to construction revenue multiple of 24.55, companies’ secured order books were between 0.5 and 1.9 of construction revenue (prior year: 0.8 and 1.7). Calgro’s high multiple is the result of equity-accounted investments, which do not reflect income in revenue even though they are included in the order book. When normalised for the impact of equity-accounted investments, Calgro’s multiple decreases to 12.1. However, a large portion is expected to materialise after five years, which is an indication of the long-term nature of integrated housing development project roll-outs.
Esorfranki, Group Five and Raubex were the only entities which showed a decline in their multiples in the 2016 financial year. Raubex’s revenue increased 10% from 2015, which contributes to a decline in the multiple, while Esorfranki’s revenue remained consistent with 2015 and Group Five’s revenue declined by 12% from 2015, indicative of a real decline in the order book.
2016
22.522.9
1.2
1.18
1.91.7
1.41.3
1.31.3
1.31.2
1.4
1.01.4
0.80.7
0.81.2
2015
Group Five
Aveng
Raubex
Esor
Stefanutti Stocks
Murray & Roberts
WBHO
Basil Read
Calgro

Integrating risk for performance
PwC 13

14 Highlighting trends in the South African construction industry
Common risks identified by heavy construction companies analysed
Challenges Actions required by industryB-BBEE and transformation
Transformation is a key challenge in South Africa. Despite significant progress since the establishment of a democratic government in 1994, South African society is characterised by income and social service inequalities.
Proactive monitoring of compliance with B-BBEE codes and employment equity targets as well as changes to legislation are imperative in the South African construction industry. Timely transformation strategies (or compliance plans) should follow in order to remain competitive and achieve transformation goals.
The transformation commitments in the October 2016 settlement agreement clearly indicate the high importance attributed to transformation by both Government and the industry.
In 2007, the Department of Trade and Industry released original B-BBEE codes. Nine sectors, including construction, have their own codes and the Construction Sector Charter on Black Economic Empowerment was issued in June 2009. Compliance with the Charter by the industry is seen as not only socially but also economically imperative.
Construction companies increased their participation in discussions about the new B-BBEE codes while adjusting business practices to be compliant with new codes.
In May 2015, the new B-BBEE codes were gazetted. The amendments to the codes significantly changed the manner in which companies’ B-BBEE status is calculated, increasing the number of points required to achieve a particular level. On 4 March 2016, the Minister of Public Works, Thulas Nxesi, convened a high level meeting of construction industry captains and principals with the view to mapping out an urgent way forward in the finalisation of the gazette of the Construction Sector Code.
Other strategic responses included various empowerment programmes, a focus on management control and skills development, other internal initiatives and headhunting.
Non-compliance with employment equity could negatively impact companies in the following manner:
• Reduce their ability to win tenders;
• Increase the likelihood of client sanctions and sanctions from the Department of Labour; and
• Increase the possibilities of penalties being imposed on South African projects.
Integrating risk for performance

PwC 15
Challenges Actions required by industryHealth, safety and environmental sustainability
Construction is inherently a high-impact and dangerous industry. Any major incident, while a tragedy in its own right, also has implications for the reputation and ability of the entity involved to procure work in certain sectors. The construction industry has a less than 50 per cent rate of compliance with health and safety standards.
Health, safety and environmental statistics have improved in recent years. However, this needs to be monitored, and reporting of statistics is required across the industry.
As of August 2015, all construction projects costing more than R13 million which is above the Construction Industry Development Board’s level six grading, have to apply to the Department of Labour (DoL) for a construction permit that includes a baseline risk assessment of the construction project; the health and safety specification, based on the risk assessment. and a health and safety plan approved by the DoL.
All workers should be supplied with personal protective equipment and all construction sites should have protective equipment such as fall protection and barrier fencing. Safety equipment on construction sites is essential and cannot be dispensed with.
Industrial action
Ongoing industrial unrest in South Africa continues to cause project delays and disruptions, affecting safety, productivity and profitability. It also adds a further hurdle to the decision-making process for investment in new capital projects.
In order to mitigate the risk of labour unrest and prevent significant project disruptions and delays, open communication between unions and construction companies to monitor and resolve potential labour issues is essential.
Strikes have reached a new level in terms of number, duration and violence and have inflicted significant damage to the economy in both the short and medium terms.
Strike mitigation plans must be put into place, together with a proactive labour relations strategy with allowances in tenders for labour unrest.
This has had an impact on both project and business performance. The recent wide-scale and prolonged industrial action has placed pressure on the underlying contractual relationships.
Proactive engagement with communities prior to project commencement assists to manage expectations.
Liquidity risk
A lack of sufficient working capital increases exposure to liquidity risk. This may negatively impact credit, acquisitions and growth opportunities.
It is essential that cash-flow requirements over the life of a contract be considered at the tendering stage, together with robust working capital cash-flow management.
The negative conditions experienced in the economy has contributed to the liquidity problems experienced by construction companies as well as the significant cash outlays required for new projects.
Close monitoring and management of outstanding claims and project overheads and tougher debt collection measures are also essential to mitigate liquidity risk.
Integrating risk for performance

16 Highlighting trends in the South African construction industry
Challenges Actions required by industryTalent management and staff retention
People are an entity’s most important asset, and various specialist skills are required to deliver projects successfully. South Africa’s construction industry has grown significantly in size over the last decade, resulting in a skills shortage in the industry at all grades.
A remuneration policy focusing on performance and the retention of key talent is essential for the sustainability of a business. Regular succession reviews to identify potential talent retention risks and career planning strategies should be undertaken, as should in-house training, promotion from within and development initiatives.
Loss of skills and expertise affects the ability of companies to successfully complete contracts and undermines expansion. Growth strategies place high demands on companies to maintain appropriate leadership capacity, and this has been a continued focus of 2016.
Growth, expansion and operational performance
Growth in the South African construction industry has declined in recent years due to:
In order to address the risks posed to growth and expansion, companies need to:
• The decline in business confidence and the volatile labour market;
• Focus on effective contract negotiation on equitable terms, and efficient contract management;
• Government’s reduced spending on infrastructure projects;
• Align capacity with planned SA Government spend;
• Competition in the industry, which has continued to drive down margins;
• Focus on gaining a competitive edge in the market; and
• Limited expansion into new markets, which has been hampered by volatile commodity prices and exchange rates; and
• Explore growth options in new and emerging markets.
Poor performance has also been of concern. Due to the competitive nature of the market, combined with skills shortages, places pressure on companies to deliver on projects.
The implementation and monitoring of project management procedures and policies over the life cycle of a project and the assignment of accountability are imperative in mitigating the risks posed to project execution.
Poor execution of contracts results in margin erosion and losses. This includes the risk of poor quality control on site, which results in rework, increased costs and delayed delivery of contracts.
Increased focus on closing out loss-making projects, improving efficiencies and productivity.
Macro-economic environment
Continued poor economic performance by the South African economy has had a negative financial impact on businesses and their operations. This affects business and investor confidence and limits demand for capital projects and infrastructure.
Maintaining key stakeholder relationships in order to assist in winning of new work in this depressed cycle.
Tender risk
There is inherent risk in the tendering process as it requires educated and highly judgmental views to be taken on pricing, mark-up, geological conditions, and the quality and availability of materials.
To mitigate tender risk, extensive tender risk assessment procedures need to be undertaken at the tendering stage of each project.
There is a risk of bidding for and winning contracts on onerous terms or under unacceptable commercial conditions.
Experienced estimators should be involved in contract pricing, which is to be subject to review by senior management.
Integrating risk for performance

PwC 17
Challenges Actions required by industryLegislation and regulatory compliance
Non-compliance with applicable legal and regulatory requirements may lead to reputational damage, penalties and fines and may impact the entities operations. The increasingly complex regulatory landscape requires entities to meet new regulatory requirements and stakeholder expectations while supporting performance objectives, sustaining value and protecting the brand.”
Compliance with regulatory and legislative requirements is imperative in preventing loss to a business and maintaining a company’s reputation in the industry.
Agreement concluded with the South African government
In October 2016 the South African Government entered into an agreement with seven construction companies to implement a programme of initiatives that is expected to significantly accelerate transformation in the South African construction sector, as well as address the companies‘ exposure to potential claims for damages arising primarily from
Integrating risk for performance
These companies include WBHO, Aveng, Murray & Roberts, Group Five, Basil Read, Raubex and Stefanutti Stocks.
The settlement agreement comprises a financial contribution by the Construction Companies into a jointly administered trust fund, as well as certain transformation commitments over and above the current broad- based black economic empowerment sector requirements.
The arrangement will focus on the development and transformation of the industry through:
• Increasing investment in the sector to promote development, educational and upliftment opportunities for all, especially for black people;
• Creating employment and entrepreneurial opportunities, especially for young South Africans;
• Promoting and supporting black-owned construction companies and small business development and assisting them to be competitive and sustainable;
• Identifying opportunities for South African companies in infrastructure projects elsewhere on the African continent; and
• Building deeper partnerships with regulators and other key stakeholders such as Government and organised labour.
The settlement agreement comprises three elements:Financial contribution for development projects
The construction companies will collectively contribute R1.5 billion over 12 years to the fund, which will be established for socio-economic development. The objective of the fund will be the development, enhancement and transformation of the construction industry, as well as the promotion of social infrastructure for all South Africans.
Initiatives will include the development and promotion of construction companies owned and managed by black people, the provision of bursaries for black students and providing support for learning institutions through bursary programmes and infrastructure development.
It also includes funding the appointment of professionals to provide the Government with engineering, project management and other services to strengthen its capacity to deliver the public infrastructure needed through, amongst others, the secondment to state departments and entities of skilled personnel from organisations operating in South Africa.
the fast-track settlement process launched by the South African Competition Authorities in February 2011.

18 Highlighting trends in the South African construction industry
This financial contribution is in addition to existing annual socio-economic development investment spend by these companies.
In summary, the settlement agreement stipulates that:
• Over the next 12 years, the construction companies will be required to make a collective, annual payment of R125 million into the fund. The fund will be constituted as a trust.
• The effective date of the settlement agreement is defined as the date on which the condition precedent, that SANRAL withdraws its SANRAL claims against the construction companies, is fulfilled.
The trust will use the payments made to the fund to:
• Implement initiatives that will develop and enhance the construction industry, in conformity with the Government‘s transformation objectives; and
• Promote the development of emerging contractors and suppliers in South Africa. The Trust will be co-operatively governed by a board of trustees appointed by the Government, the construction companies and the South African Forum of Civil Engineering Contractors.
The total payment to be made to the Trust by the Construction Companies may be reduced by any claims or potential claims for damages that certain, identified public entities have made, or may be entitled to make, against the Construction Companies in relation to projects listed in the Settlement Agreement.
The Settlement Agreement does not address or eliminate any outstanding claims by the Competition Commission of South
Integrating risk for performance
Africa with regards to administrative penalties which have been or are to be levied on any of the Construction Companies.
Transformational commitments in the sector
In addition to existing enterprise development programmes, each of the construction companies will commit to initiatives that will result in each of the companies mentoring up to three emerging black-owned enterprises so that they develop the necessary skills, systems, status and quantity of work to be able to sustain a cumulative combined annual revenue equal to at least 25% of each of the mentor companies‘ annual revenue by 2024. Aligned to this obligation are fixed interim period transformation targets on each construction company, as well as penalties calculated in accordance with a formula for a failure to meet such targets. The referenced revenue is from civil engineering and building works delivered in South Africa.
The development of these emerging black-owned enterprises will be broadly in line with the Construction Charter Codes with respect to enterprise development.
The settlement agreement also stipulates that the company will be released from its responsibility for the development initiatives of the emerging contractors above if the company disposes of not less than a 40% economic interest in its South African civil engineering and general building construction business, to an enterprise that is more than 51% black owned, managed and controlled.
Integrity commitment by CEOs
The construction companies, as leading companies in the industry and the Government have committed to business practices that are based on integrity, transparency
and fair competition. As part of the settlement agreement, each company has signed a declaration to promote ethical and legal operations, free of collusion or corruption and to confirm that they will expose, confront and eradicate any sign of wrong-doing in the industry.
The settlement signifies the Government‘s and construction companies‘ commitment in promoting growth, investment, sustainability, inclusivity and transformation in the construction sector.
Value added
PwC 19

20 Highlighting trends in the South African construction industry
Value added
The heavy construction sector adds significant value to our country and its people. Stakeholders in this industry include employees together with their families and the unions representing them, the Government as regulators and custodians of the country’s tax income, investors, suppliers and customers. The monetary benefit received by each of these stakeholders is often summarised by companies in their value-added statements.
Seven of the nine companies included in the construction analysis, representing 72% of the revenue for all companies considered, provided readily available value-added statements. Figure 11 shows how the value created, being the difference between income and direct purchases, was distributed to the various stakeholders.
Figure 11: Distribution among stakeholders of value added by heavy construction industry
Source: PwC analysis, company annual reports
Analysis of the construction industry
The value received by employees represented 77% (2015: 83%) of the value created. This is a significant contribution to the labour market. According to a quarterly labour force survey conducted by Stats SA, showing employment by industry, more than 1.38 million people are employed by the construction industry either on a contract basis or permanently. During the second half of 2016, an increase in employee numbers was evident. This is encouraging, given the current economic climate and its impact on the heavy construction industry.
7%
11%9%
3%
77%
83%
Funds retained
Capital investment
Taxes
Employees
Providers of borrowing
Provider of equity
3%
3%
1%1%
1%1%
2015
2016

PwC 21
Value added
Figure 12: Number of employees in the construction industry (thousands)
Source: Stats SA
The percentage of value created that is collected by providers of debt capital has remained at 1%, the same as in the previous two years. This low percentage reflects the fairly conservative levels of gearing in the South African construction industry.
The 1% (2015: 1%) received by the providers of equity capital remained consistent from the prior year as well, and reflects the low return earned by shareholders. It is therefore not surprising that share prices have reacted negatively over the last seven years.
Funds retained increased from 4% in the prior year to 7%.
The state received 11% (2015: 9%) of value created in the form of taxes. However, the reality is that the state receives significantly more if one takes into account the tax on employee income deducted from employees’ salaries and net indirect taxes like VAT.
Employment with VAT-registered employers
Em
plo
ymen
t w
ith
VAT-
reg
iste
red
em
plo
yers
Employed per labour survey
Em
plo
yed p
er labo
ur survey
380
400
420
440
460
480
500
520
540
560
Jun
Sep
Dec
Mar
Jun
Sep
Dec
Mar
Jun
Sep
Dec
Mar
Jun
Sep
Dec
Mar
Jun
Sep
Dec
Mar
Jun
Jun
Sep
Dec
Mar
2009 2010 2014201320122011 2015
0
200
400
600
800
1000
1200
1400
1600
Mar
Jun
Sep
Dec
2016

22 Highlighting trends in the South African construction industry
Value added
Shareholder profile
Figure 13: Shareholder profile
Source: PwC analysis, company annual reports
Shareholders require a reasonable return when considering what industry to invest in. In analysing construction shareholdings of 3% and larger, the significance and importance of this industry to the South African economy becomes clear. This industry not only supports domestic economic growth and job creation, but it also contributes to the creation of wealth for pensioners and investors.
The figure above shows an increase of 1% in investment by the Government Employees Pension Fund (GEPF), while investment by the Public Investment Corporation (PIC) decreased by 1%. Combined, their investment remains constant year on year as a representation of market capitalisation. Major investments by pension funds, mutual funds, and investment companies make up a further 25% (2015: 23%) of the total investment in the industry.
Directors’ and employees’ shareholding increased compared with the prior year.
Although inconsistent disclosure and limitations to what is disclosed mean that Figure 13 by no means provides an accurate reflection of individual shareholder categories, it does reflect the importance of this industry.
3%8%
25%23%
7%4%
42% 48%
Public InvestmentCorporation
Government EmployeesPension Fund
Other pension funds, mutualfunds and investments companies
Other
Employees
Directors
Empowerment companies
7%
10%5%
2015
2016
9%
3% 7%

Tax developments
PwC 23

24 Highlighting trends in the South African construction industry
Looking beyond tomorrow – streamlining corporate structures – corporate tax considerations
There is arguably little debate to be had on the fact that the past eighteen months have been incredibly difficult in the construction industry. Decreased spend on projects, paired with ever reducing profit margins and increased regulatory scrutiny, has seen the construction industry come under increasing pressure to stop, regroup and reconsider what the optimal group structure looks like.
Recent months have seen key players in the construction industry review their existing group structures with a view to streamline operations into a more consolidated group which favours divisions over multiple subsidiary entities.
At first blush, the decision to restructure one’s group into a leaner, more robust structure seems an easy and simple route to follow – especially in difficult economic times. The cost savings associated with a simpler structure appear quite evident and include inter alia reduced compliance costs, reduced regulatory costs as well as a more streamlined, co-ordinated and centralised management function.
It is, however, important to bear in mind that streamlined and smaller group structures do not materialise overnight. Careful planning and execution is required to properly achieve the desired goals and outcomes. It is equally important to understand that this is a road fraught with tax hurdles that, whilst not insurmountable, comprise certain key factors that would need to be
2 As defined in section 41 of the South African Income Tax Act
considered and addressed. Some key restructuring considerations, often underestimated in practice, include:
• Sound commercial reasons to support the restructure
One of the primary hurdles to overcome in any successful reorganisation strategy is establishing solid commercial reasons for the course of action decided on by management. This is specifically important from a tax point of view, as without strong commercial drivers supporting each step of the restructure, the transaction as a whole could fail from a tax point of view. This is on the basis that one cannot simply move assets around from one company to another in a bid to reduce the number of companies in a group. If sound commercial reasons for executing the planned series of transactions are absent, it is best to place the restructure on hold.
• Prior restructuring transactions
A consideration that is often disregarded in practice is an assessment of the impact of any prior restructuring transactions against the plan now being tabled. This is specifically important when considering that the benefits achieved from a prior restructuring transaction can so easily be unwound if one were to trigger the claw-back provisions contained in the South African Income Tax Act, triggering adverse tax consequences for the parties involved in the original transaction.
• Application of the South African group roll-over relief provisions
The South African Income Tax Act contains a number of group roll-over provisions which may assist South African taxpayers to restructure and simplify their operations and structures in a tax-neutral manner. However, it must be noted that these roll-over provisions may not be available in all instances; for example, certain of the provisions only apply where the companies in question form part of the same group of companies where these entities are all South African tax residents. There may be instances where certain target entities are directly held by a foreign holding company, thus disqualifying those entities from using specific group roll-over provisions.
In addition, targets should note that most of the group roll-over relief provisions would be applicable only if the transactions fall within the ambit of the section. Should the parties wish to effect the restructure outside of the ambit of the group roll-over provisions, they should make a specific election to this effect. Groups may, for example, wish to elect out of the group roll-over provisions where specific tax losses (assessed losses and capital gains tax losses) exist which the group would like to utilise under the proposed transactions.
Tax development

PwC 25
• The use of tax loss companies
The matter becomes even more complicated when the group includes companies that are in a tax loss position, as restructuring transactions involving tax loss companies have come under increased scrutiny from the South African Revenue Service (SARS). It is important to understand that South Africa’s tax legislation does not prohibit the use of tax loss companies as part of restructuring transactions. What is, however, becoming more evident is that these transactions will stand or fall on the strength of the commercial reasons for choosing to use that company in the series of transactions that will encompass the overall restructure of the group.
With regard to utilising tax loss companies, it is also vital to consider recent amendments to South Africa’s reportable arrangement regulations. These now require taxpayers to report changes to the shareholding of companies with an assessed loss in excess of R50 million within a period of 45 days of the transaction being concluded. The upfront reporting of these transactions is aimed, for the most part, at assisting SARS to track transactions involving tax loss companies.
• The timing required to transfer key liabilities and contracts
Consideration will also need to be given to the commercial and legal aspects of transferring contracts and liabilities from one legal entity to another.
Management will be required to communicate with customers as well as suppliers where contracts are transferred and liabilities are assigned to a new entity. The time taken to negotiate moving these contracts to another entity should not be underestimated and is a factor that will need to be considered and planned for upfront.
• Liquidation steps
As a final point, many, if not most, restructures inevitably include some form of liquidation transaction. From a practical point of view it is important to remember that the liquidation process can only take place once all the assets of the company in question have been distributed and the liabilities have been paid. In certain instances this may inevitably require the write-off of loans, which may trigger adverse corporate income tax consequences if the loan capital was utilised to fund working capital requirements or to obtain allowance assets. Groups must therefore consider the ultimate ‘clean-up’ of the balance sheet of entities earmarked for liquidation carefully to ensure that they do not inadvertently trigger onerous tax implications.
From a compliance point of view it will also be necessary to ensure that all required tax and company law filings have been submitted and that these compliance affairs are all up to date. The administration steps leading up to an effective liquidation can admittedly be very cumbersome, but if not done properly can also hold up the entire process.
Corporate reorganisations provide an excellent opportunity to realign one’s business operations with an ever changing market. With sufficient attention to detail, corporate restructures can be an effective tool that allows a group to better position itself for whatever comes after tomorrow.
Tax development

Boardroom dynamics
26 Highlighting trends in the South African construction industry

PwC 27
Boardroom dynamics
Figure 14: Board composition by age and race
Source: PwC analysis, company annual reports
An analysis of the group of companies in the heavy construction industry suggests that 38% of board members (up from 31% in 2015) are historically disadvantaged individuals (HDIs).
The Construction Charter required a minimum of 40% representation of HDIs at board level. The current statistics indicates that companies have not met this requirement. However, analysis suggests that the industry has gained some momentum compared to the prior year’s statistics and has made a focused and dedicated effort to achieve the objectives set out in the Construction Charter.
In the heavy construction industry, female representation at board level is currently 25% of whom 73% are HDI, making HDI women 18% of the total board composition. This is below the minimum requirement of 20% HDI representation of women set out in the Construction Charter. However, it is an improvement on the 17% achieved in the previous year.
The changing construction and governance environments require a changed skill set. The average board size for the companies analysed was ten, which allows for an adequate spread of skills. The smallest board had six members and the largest board, 12.
7%
48%47%
3%
29%19%
White 50+
White 40-49
White <40
HDI<40
HDI<49
HDI 50+
4%
1%
3%17%
11%
0%
2015
2016

28 Highlighting trends in the South African construction industry
Boardroom dynamics
Notwithstanding the fact that professional qualifications are not the only factor in determining expertise and experience, the following analysis of board members by their primary professional qualifications indicates a diverse spread that provides boards with a wide array of expertise.
Figure 15: Skills represented on board
Source: PwC analysis, company annual reports
9%
44%
39%
11%23%
23%
Civil engineering
Financial
Legal
Other engineering
Other
20%18%
7%
6%
2015
2016
Financial performance
PwC 29

30 Highlighting trends in the South African construction industry
Financial performance
Income statementCurrent year Prior year Difference %
changeR’ millions R’ millions R’ millions
Construction revenue 117 414 129 368 (11 954) (9%)
Other revenue 12 735 15 224 (2 489) (16%)
Total revenue 130 149 144 592 (14 443) (10%)
Operating expenses (121 758) (138 912) 17 154 (12%)
PBIT 4 876 1 832 3 045 166%
Net interest (311) (144) (167) 116%
Tax expense (1 502) (782) (720) 92%
Equity-accounted for earnings 207 167 40 24%
Discontinued operations (344) 47 (391) (832%)
Net profit 2 927 1 120 1 807 161%
Adjusted PBIT margin 3.7% 1.3% 2.5% 196%
Net profit margin 2.2% 0.8% 1.4% 190%
Effective tax rate 34% 46% 2.4% (27%)
Construction revenue
Construction revenue decreased by 9% (prior year: 7%) mainly as a result of a decrease of R9 billion in revenues posted by Aveng, a R3.9 billion decrease by Murray & Roberts, and R0.9 billion by Stefanutti Stocks, partially offset by a R1.9 billion increase in revenues posted by WBHO and R0.5 billion by Raubex. These decreases were largely as a result of the weaker economy, in particular for commodity markets, with a notable decrease in revenue from energy, oil and gas projects. General civil works, which are infrastructure-driven, had a challenging year. Building projects, on the other hand at least from a revenue point, showed remarkable strength, as the cranes in the Gauteng and Cape Town skylines would suggest.
Construction companies did well to reduce operating costs in the lower-revenue environment. Margins began to show a slight improvement in the 2016 financial year. Construction profits seem to be following the same double dip experienced by most industries after the 2008 economic crisis.
PwC 31
Financial performance
Figure 16: Revenue vs net profit, 2007-2016 (R’ billions)
0
20
40
60
80
100
120
140
160
180
20092007 2008 2010 2011 2012 2013 2014 20150
1
2
3
4
5
6
7
8
Aveng
Reve
nue
Net p
rofi
t
Murray & Roberts
WHBO
Group Five
Stefanutti Stocks
Raubex
Basil Read
Esorfranki
Calgro
Net profit
2016
Source: PwC analysis
Other revenue
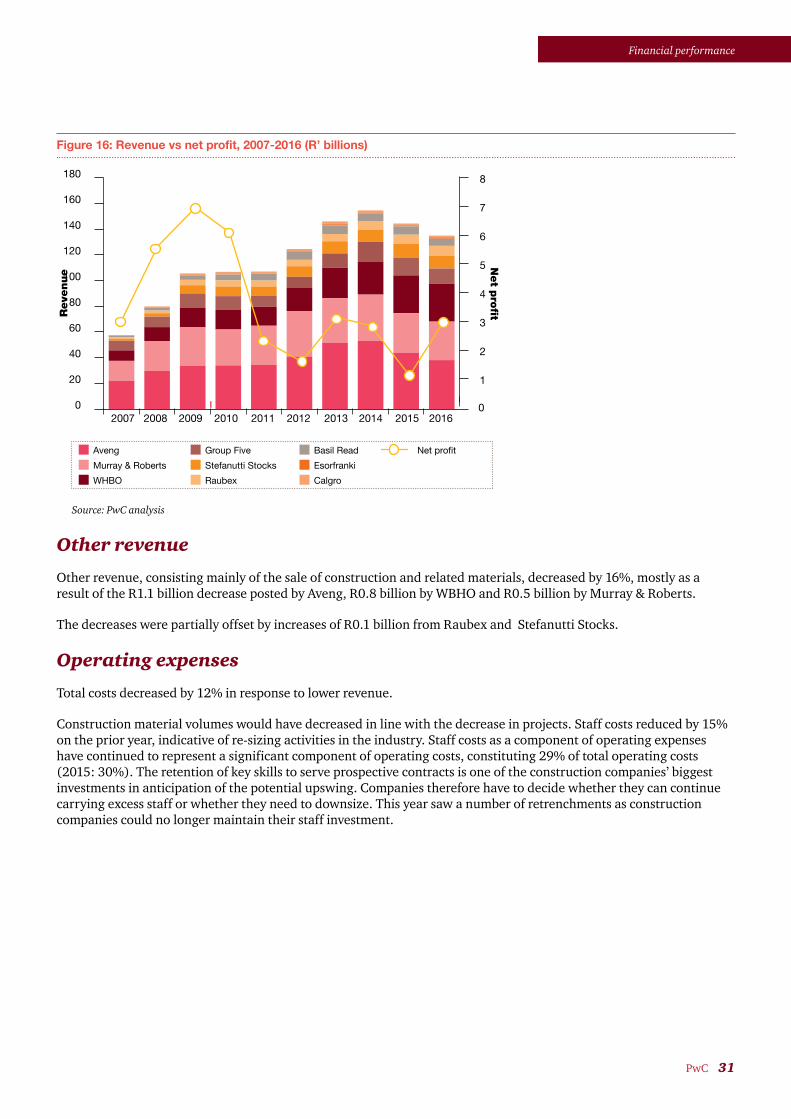
Other revenue, consisting mainly of the sale of construction and related materials, decreased by 16%, mostly as a result of the R1.1 billion decrease posted by Aveng, R0.8 billion by WBHO and R0.5 billion by Murray & Roberts.
The decreases were partially offset by increases of R0.1 billion from Raubex and Stefanutti Stocks.
Operating expenses
Total costs decreased by 12% in response to lower revenue.
Construction material volumes would have decreased in line with the decrease in projects. Staff costs reduced by 15% on the prior year, indicative of re-sizing activities in the industry. Staff costs as a component of operating expenses have continued to represent a significant component of operating costs, constituting 29% of total operating costs (2015: 30%). The retention of key skills to serve prospective contracts is one of the construction companies’ biggest investments in anticipation of the potential upswing. Companies therefore have to decide whether they can continue carrying excess staff or whether they need to downsize. This year saw a number of retrenchments as construction companies could no longer maintain their staff investment.

32 Highlighting trends in the South African construction industry
Financial performance
Net finance costs
The low level of finance costs reflects the traditionally low levels of gearing maintained by most South African construction companies. These companies are generally working capital-funded, with their biggest obligation to deliver on contract payments being received in advance.
Taxation
The effective tax rate of 34% is significantly lower than the prior year’s effective tax rate of 46%, but higher than the statutory rate of 28%. This decrease is as a result of an improvement in the companies’ ability to recognise deferred tax assets for losses made in some instances, and differential tax rates in foreign jurisdictions. The higher effective tax rate is also impacted by the non-deductibility of impairment expenses recognised.
Net profit
The construction industry is and has always been a very low-margin industry. In the current year, however, net profit increased by 161% and the PBIT margin more than doubled from the prior year.
The increase in net profit from the prior year can largely be attributed to Aveng’s R0.5 billion, Group Five’s R0.2 billion and Basil Read’s R0.9 billion.
Top five companies by profit before interest and tax margin
Current year Prior year
Calgro 13% 9%
Raubex 9% 9%
Group Five 5% 3%
Murray & Roberts 5% 4%
Stefanutti Stocks 4% 3%

PwC 33
Financial performance
Cash flows
2016 2015 Difference % change
R’ millions R’ millions R’ millions
Cash flows related to operating activities
Cash generated from operations 3 434 4 440 (1 006) (23%)
Other (323) (286) (37) 13%
Income taxes paid (1 654) (1 798) 144 (8%)
Net operating cash flows 1 457 2 356 (899) (38%)
Cash flows related to investing activities
Purchases of Property, plant and equipment (2 172) (2 475) 303 (12%)
Purchase of investments (742) (1 078) 335 (31%)
Sale of investments 2 605 1 886 719 38%
Other 160 790 (630) (80%)
Net investing cash flows (149) (877) 728 (83%)
Cash flows related to financing activities
Proceeds from ordinary shares issue 11 6 5 85%
Proceeds from interest-bearing liabilities 1 789 3 524 (1 735) (49%)
Repayment of interest-bearing liabilities (2 730) (4 877) 2 147 (44%)
Distribution to shareholders (738) (750) 12 (2%)
Acquisition of non-controlling interest - (12) 12 (100%)
Acquisition of treasury shares / shares re-purchased (155) (169) 14 (8%)
Other (Transactions with NCI) (76) (89) 13 (15%)
Net financing activities (1 898) (2 367) 469 (20%)
Net cash flows for the year (590) (888) 298 (34%)
Effect of exchange rate changes on cash held in foreign currencies
1 360 (405) 1 764 (436%)
Cash and cash equivalents at the beginning of period 15 843 17 136 (1 293) (8%)
Cash and cash equivalents at the end of the year 16 612 15 843 769 5%

34 Highlighting trends in the South African construction industry
Financial performance
Cash flows from operating activities
Net decrease of R0.9 billion (38%).Cash generated from operations is lower than EBITDA of R 5.5 billion. It decreased by 23% on last year from R4.4 billion to R3.4 billion. Profits need to be converted into cash in order to be of value to stakeholders. This is particularly true for the construction industry, where estimates of final outcomes play an integral role in the recognition of accounting profits.
The most notable improvements in cash generated from operating activities were Raubex’s R0.2 billion and Murray & Roberts’ R0.2 billion. These were offset by decreases in cash generated by operations, with WBHO recording a figure of R0.6 billion, Aveng R0.3 billion and Stefanutti Stocks R0.3 billion.
Tax paid decreased by 8% on last year, from R1.8 billion to R1.6 billion, and is in line with the R1.5 billion tax expense reflected in the income statement.
Cash flows from investing activities
Net outflow decrease of R0.15 billion (83%).Additions to plant and equipment reduced by R0.3 billion to R2.1 billion, as is to be expected with a decrease in revenue and order book. This decrease follows a R1 billion decrease in the prior year, demonstrating the severity of the negative outlook for construction companies and excess capacity.
After a number of disposals of non-core assets in the previous year, the only significant disposal in the current year relates to the R1.1 billion proceeds earned on the disposal of properties by Aveng. There were no significant individual purchases of new investments in the current year.
However, after year end Murray & Roberts disposed of their infrastructure and buildings divisions to complete their strategy to become a resource-focused construction company.
Cash flows from financing activities
Net outflow of R1.8 billion, a R0.5 billion decrease from the prior year.The net repayment of borrowings of R1.9 billion represents an increase compared with a net repayment figure of R1.4 billion in the prior year. The most notable contributors to the net repayment were Group Five with their repayment of R0.3 billion and Basil Read, also recording R0.3 billion.
Distributions to shareholders were consistent with the prior year, reflecting a marginal decrease of R 12 million (2%). Only R0.2 billion of the total R0.7 billion in distributions relates to dividends declared in the 2016 financial year.

PwC 35
Financial performance
Statement of financial position
Financial position Current year Prior year % Change
R’ millions R’ millions Difference
Non-current assets
Property, plant and equipment 14 162 16 076 (1 914) (12%)
Investment property 763 692 71 10%
Intangible assets 1 663 1 511 152 10%
Financial assets 2 524 2 101 423 20%
Investments in associates and joint ventures (includes loans) 1 129 1 292 (163) (13%)
Deferred tax assets 3 448 3 065 383 12%
Non-current receivables 3 219 3 740 (521) (14%)
Other non-current assets 364 366 (2) (1%)
Goodwill 2 324 2 361 (37) (2%)
Total non-current assets 29 596 31 204 (1 608) (5%)
Current assets
Inventories 4 384 4 860 (476) (10%)
Contracts in progress 16 567 18 904 (2 337) (12%)
Trade and other receivables 17 103 17 914 (811) (5%)
Cash and cash equivalents 16 875 15 994 881 6%
Other current assets 511 643 (132) (21%)
Total current assets 55 440 58 315 (2 875) (5%)
Assets held for sale 3 965 1 058 2 907 275%
Total assets 89 001 90 577 (1 576) (2%)
Share capital and reserves
Share capital 10 674 10 861 (187) (2%)
Other equity 28 060 24 307 3 753 15%
Non-controlling interest 559 384 175 46%
Total equity 39 293 35 552 3 741 11%
Non-current liabilities
Interest-bearing borrowings 3 710 5 002 (1 292) (26%)
Deferred tax liabilities 1 230 910 320 35%
Employment-related obligations 460 576 (116) (20%)
Other non-current liabilities 404 1 373 (969) (71%)
Total non-current liabilities 5 804 7 861 (2 057) (26%)
Current liabilities
Excess billings over work 7 371 8 168 (797) (10%)
Trade and other payables (Includes employee payables and provisions) 29 944 34 854 (4 910) (14%)
Interest-bearing borrowings 3 724 3 050 674 22%
Other current liabilities (includes current tax payable and other) 411 433 (22) (5%)
Bank overdrafts 266 167 99 59%
Total current liabilities 41 716 46 672 (4 956) (11%)
Liabilities held for sale 2 188 492 1 696 345%
Total liabilities 49 708 55 025 (5 317) (10%)
Total equity and liabilities 89 001 90 577 (1 576) (2%)
Key ratios
Solvency ratio 1.79 1.65
Liquidity ratio 1.33 1.25
Acid ratio 1.22 1.15
Gearing ratio 8% 9%

36 Highlighting trends in the South African construction industry
Financial performance
Financial position
Solvency and liquidity ratios remained strong and have remained in line with those of the prior year at 1.8 and 1.7, respectively. The gearing ratio decreased from 9% in the prior year to 8% in the current year, pointing to the fact that the South African construction industry is not only working capital-intensive but often also working capital-funded.
These ratios are all derived from historical cost-carrying amounts and therefore do not necessarily reflect the true fair-value trends. A better indication of investors’ perception of these carrying amounts and potential future growth is the market value of these entities. The market capital as a multiple of the net asset value, less non-controlling interest, reduced from 0.7 in the prior year to 0.6 in the current year. This indicates a decrease in confidence in the sustainability of the industry.
At an individual company level as at 30 June 2016, there were six (2015: five) companies with a net asset value exceeding the market capitalisation of the company.
The following table shows a disconnect between the market perception of value in these companies and management’s perception of the fair value of the underlying assets. The reason for this difference may be attributable to incomplete information being available to the market, differing perceptions over contract successes and close-outs, and different views on the profitability of order books. These companies face a tough task convincing the market of their value.
Non-current assets
Property, plant and equipment (PPE) reduced by R1.9 billion (12%). The net reduction caused by the depreciation of R2.9 billion (2015: R3.0 billion) and impairment expense of R0.6 billion (2015: R0.8 billion) was offset by the capital expenditure. The impairment was mainly made up of Aveng’s R0.3 billion and Murray & Roberts’ R0.2 billion.
Non-current receivables, relating to contractual debtors where payments are expected after 12 months, have reduced by R0.5 billion (14%), primarily as a result of an impairment of R0.4 billion being recognised by Group Five.
Other non-current assets, made up mostly of goodwill and other investments, were flat on the prior year.
Market capitalisation on 30 June 2016 as a percentage of net asset value (excluding NCI)Market capitalisation of these entities decreased to 65% of carrying amounts compared to 74% in 2015 with seven of the nine companies trading below carrying amount as at 30 June 2016. This is an indication of investors’ uncertainty of the industry’s ability to deliver future value.
The following companies displayed market capitalisations which were less than their net asset value, at 30 June 2016:
Market capitalisation as a percentage of carrying value 2016 2015
Aveng 11% 18%
Esorfranki 17% 17%
Stefanutti Stocks 29% 51%
Basil Read 34% 48%
Group Five 64% 109%
Murray & Roberts 73% 88%
Raubex 99% 112%

PwC 37
Financial performance
Working capital
Financial positionCurrent year Prior year
R’ millions R’ millions Difference % Change
Contracts in progress 16 567 18 904 (2 337) (12%)
Trade and other receivables 17 103 17 914 (811) (5%)
Excess billings over work (7 371) (8 168) 797 (10%)
Trade and other payables (29 944) (34 854) 4 910 (14%)
(3 645) (6 204) 2 559 (41%)
Cash and cash equivalents 16 875 15 994 881 6%
The working capital position reflects a fairly balanced position, with only Basil Read showing a liquidity ratio of less than one.
Combined receivables and contracts in progress reduced by 8.6%, which is marginally weaker than the decrease in revenue of 9.2%. In 2015 we reported on the significant weakening in revenue receivables days by 13%. Although the position didn’t reverse in 2016, it also didn’t weaken further. It is pleasing to note that contracts in progress as a percentage of total receivables have decreased. This could be an indication that long outstanding disputes are being settled, or at least removed from the balance sheet.
Cash position
The cash position remains strong in aggregate despite individual liquidity concerns raised for some companies.
The difference between this cash balance and the one reflecting in the cash-flow statement is due to overdrafts having been included in current liabilities on the balance sheet.
Financing for sustainability
Other than Basil Read, all of the companies evaluated were in a net cash position. A net cash position is required to comply with the requirements of large construction projects. Guarantees are usually backed by cash balances, and no changes are expected to occur in the near future.

Glossary
38 Highlighting trends in the South African construction industry

PwC 39
Glossary
Acid ratio (Current assets less inventory)/Current liabilities
ACSA Airports Company of South Africa Limited
Adjusted EBITDA EBITDA adjusted for impairment charges
ASPASA Aggregate and Sand Producers Association of South Africa
B-BBEE Broad-Based Black Economic Empowerment
DAWN Distribution and Warehousing Network
EU-OSHA European Agency for Safety and Health at Work
GEPF Government Employees Pension Fund
HDI Historically disadvantaged individual
HDSA Historically disadvantaged South African
IEA International Energy Agency
IPP Independent power producer
JSE Johannesburg Stock Exchange
KPI Key performance indicator
Market capitalisation The market value of the company calculated as the number of shares outstanding multiplied by the share price
MTEF Medium-Term Expenditure Framework
NCI Non-controlling interest
Net borrowings Interest-bearing debt, less cash
PBIT Profit before income and tax
PIC Public Investment Corporation
PPE Property, plant and equipment
REIPPPP Renewable Energy Independent Power Procurement Programme
SANRAL South African National Roads Agency Limited
SARS South African Revenue Service

40 Highlighting trends in the South African construction industry
Other information

PwC 41
Other information
Heavy construction Company year end
1. Aveng Limited (Aveng) 30 June 2016
2. Basil Read Limited (Basil Read) 31 December 2015
3. Calgro M3 Holdings Limited (Calgro) 29 February 2016
4. Esorfranki Limited (Esorfranki) 29 February 2016
5. Group Five Limited (Group Five) 30 June 2016
6. Murray and Roberts Holdings Limited (Murray & Roberts) 30 June 2016
7. Raubex Group Limited (Raubex) 29 February 2016
8. Stefanutti Stocks Holdings Limited (Stefanutti) 29 February 2016
9. Wilson Bayly Holmes-Ovcon Limited (WBHO) 30 June 2016
Basis for compiling this report
The data set out in this publication was drawn from information publicly available for the period ended 30 June 2016. The information was taken from the annual reports of the construction companies listed on the JSE.
The results aggregated in this report have been sourced from information that is publicly available, primarily annual reports or reviewed results made available to shareholders. Companies have different year ends. The information included is based upon aggregated results of those construction and materials companies reported on.
For companies with year ends other than 30 June, their latest available annual reports with year ends in the 12 months prior to June 2016 were used. Therefore, results for December 2015 and February 2016 were also included. No adjustments have been made to take the different year ends into account.
All currency figures in this publication are reported in South African rands, except where specifically stated otherwise. Some diversified companies undertake part of their activities outside the construction industry. No attempt has been made to exclude such non-construction activities from the aggregated financial information.
Contributors
• Deveshnee Naidoo
• Alwina Brand
• Bianca Raghuber
• Fiona Suburaman
• Sarah Beukes
• Tebogo Serepong

42 Highlighting trends in the South African construction industry
Contacts

PwC 43
Contacts
Eben GerrytsConsumer and Industrial Products Leader
+27 (0) 12 429 [email protected]
Jonathan CawoodCapital Projects & Infrastructure Leader
+27 (0) 11 797 [email protected]
Louis CarneyAssociate Director
+27 (0) 11 797 [email protected]
Andries RossouwProject Leader
+27 (0) 11 797 [email protected]
Georg HofmeyerCapital Projects & Infrastructure Partner
+27 (0) 11 797 [email protected]
Alwina BrandPartner
+27 (0) 11 797 [email protected]
Assurance
Advisory
Tax

©2016 PricewaterhouseCoopers (“PwC”), the South African firm. All rights reserved. In this document, “PwC” refers to PricewaterhouseCoopers in South Africa, which is a member firm of PricewaterhouseCoopers International Limited (PwCIL), each member firm of which is a separate legal entity and does not act as an agent of PwCIL. (16-19801)