Embed Size (px)
Citation preview

SEDAR Southeast Data, Assessment, and Review
SEDAR 42
Gulf of Mexico Red Grouper
SECTION III: Assessment Process Report
June 2015
SEDAR 4055 Faber Place Drive, Suite 201
North Charleston, SC 29405
This information is distributed solely for the purpose of peer review. It does not represent and should not be construed to represent any agency determination or policy.
PRE-DECIS
IONAL

June 2015 Gulf of Mexico Red Grouper
SEDAR 42 SAR Section III Assessment Process Report
2
Table of Contents
1 Workshop Proceedings .................................................................................................... 3
1.1 Introduction ..........................................................................................................................3
1.1.1. Workshop Time and Place ....................................................................................................... 3
1.1.2. Terms of Reference .................................................................................................................. 3
1.1.3. List of Participants .................................................................................................................... 5
1.1.4. List of Assessment Workshop Working Papers ........................................................................ 6
1.2 Panel Recommendations and Comment on Terms of Reference .............................................6
2 Data Review and Update ................................................................................................. 9
2.1 Life history .......................................................................................................................... 10
2.1.1 Age and growth ...................................................................................................................... 10
2.1.2 Natural mortality .................................................................................................................... 10
2.1.3 Maturity .................................................................................................................................. 11
2.1.4 Sex transition .......................................................................................................................... 11
2.1.5 Fecundity ................................................................................................................................ 11
2.2 Landings ............................................................................................................................. 11
2.2.1 Commercial landings .............................................................................................................. 11
2.2.2 Recreational landings ............................................................................................................. 12
2.2.3 Commercial Cuban landings in present day US waters .......................................................... 12
2.3 Discards .............................................................................................................................. 12
2.3.1 Commercial discards .............................................................................................................. 12
2.3.2 Recreational discards ............................................................................................................. 13
2.4 Age composition of landings ................................................................................................ 13
2.4.1 Commercial age composition of landings .............................................................................. 13
2.4.2 Recreational age composition of landings ............................................................................. 14
2.5 Length composition of discards ........................................................................................... 14
2.5.1 Commercial length composition of discards .......................................................................... 14
2.5.2 Recreational length composition of discards ......................................................................... 15
2.6 Measures of population abundance ..................................................................................... 15
2.7 Length composition data from fishery-independent surveys ................................................ 16
2.8 Discard Mortality ................................................................................................................ 16
2.9 Tables ................................................................................................................................. 18
2.10 Figures .............................................................................................................................. 33
3 Stock assessment models and results ............................................................................. 55
3.1 Stock Synthesis ................................................................................................................... 55
3.1.1 Overview................................................................................................................................. 55
3.1.2 Data sources ........................................................................................................................... 56
3.1.3 Model configuration and equations ....................................................................................... 56
3.1.4 Estimated parameters ............................................................................................................ 60
3.1.5 Model Convergence ............................................................................................................... 61
PRE-DECIS
IONAL

June 2015 Gulf of Mexico Red Grouper
SEDAR 42 SAR Section III Assessment Process Report
3
3.1.6 Uncertainty and Measures of Precision ................................................................................. 61
3.1.7 Sensitivity analysis .................................................................................................................. 62
3.1.8 Retrospective analysis ............................................................................................................ 63
3.1.9 Benchmarks/reference points ................................................................................................ 63
3.1.10 Projections ........................................................................................................................... 64
3.2 Model Results ..................................................................................................................... 64
3.2.1 Measures of model fit ............................................................................................................ 64
3.2.2 Parameter estimates and associated uncertainty .................................................................. 67
3.2.3 Selectivity and retention ........................................................................................................ 68
3.2.4 Recruitment ............................................................................................................................ 69
3.2.5 Stock biomass ......................................................................................................................... 70
3.2.6 Fishing mortality ..................................................................................................................... 70
3.2.7 Sensitivity analysis .................................................................................................................. 71
3.2.8 Retrospective results .............................................................................................................. 72
3.2.9 Benchmark and reference points ........................................................................................... 72
3.2.10 Projections ........................................................................................................................... 72
3.3 Discussion and recommendations ....................................................................................... 73
3.3.1 Discussion ............................................................................................................................... 73
3.3.2 Recommendations ................................................................................................................. 73
3.4 Acknowledgements ............................................................................................................. 73
3.5 References .......................................................................................................................... 73
3.6 Tables ................................................................................................................................. 75
3.7 Figures ................................................................................................................................ 98
3.8 Appendix .......................................................................................................................... 180
1 Workshop Proceedings
1.1 Introduction
1.1.1. Workshop Time and Place
The SEDAR 42 Assessment Process for Gulf of Mexico red grouper was conducted via a series of
webinars held between February and June 2015.
1.1.2. Terms of Reference
1. Review any changes in data following the data workshop and any analyses suggested by the data
workshop. Summarize data as used in each assessment model. Provide justification for any
deviations from Data Workshop recommendations.
2. Develop population assessment models that are compatible with available data and document
input data, model assumptions and configuration, and equations for each model considered.
3. Incorporate known applicable environmental covariates into the selected model, and provide
justification for why any of those covariates cannot be included at the time of the assessment
PRE-DECIS
IONAL

June 2015 Gulf of Mexico Red Grouper
SEDAR 42 SAR Section III Assessment Process Report
4
4. Provide estimates of stock population parameters, including:
• Fishing mortality, abundance, biomass, selectivity, stock-recruitment relationship, red
grouper being a protogynous hermaphrodite, and other parameters as necessary to describe
the population.
• Appropriate measures of precision for parameter estimates.
5. Characterize uncertainty in the assessment and estimated values.
• Consider uncertainty in input data, modeling approach, and model configuration.
• Provide a continuity model consistent with the prior assessment configuration, if one exists,
updated to include the most recent observations. Alternative approaches to a strict
continuity run that distinguish between model, population, and input data influences on
findings, may be considered.
• Consider and include other sources as appropriate for this assessment.
• Provide appropriate measures of model performance, reliability, and ‘goodness of fit’.
• Provide measures of uncertainty for estimated parameters.
6. Provide estimates of yield and productivity.
• Include yield-per-recruit, spawner-per-recruit, and stock-recruitment models.
7. Provide estimates of population benchmarks or management criteria consistent with available
data, applicable FMPs, proposed FMPs and Amendments, other ongoing or proposed
management programs, and National Standards.
• Examine the effect of being a protogynous hermaphrodite on stock status criteria and other
management benchmarks.
• Evaluate existing or proposed management criteria as specified in the management
summary.
• Recommend proxy values when necessary.
8. Provide declarations of stock status relative to management benchmarks or alternative data
poor approaches if necessary.
9. Provide uncertainty distributions of proposed reference points and stock status metrics that
provides the values indicated in the management specifications. Include probability density
functions for biological reference point estimates and population metrics (e.g., biomass and
exploitation) used to evaluate stock status.
10. Project future stock conditions (biomass, abundance, and exploitation; including probability
density functions) and develop rebuilding schedules if warranted; include estimated generation
time. Develop stock projections for the following circumstances, in accordance with the
guidance on management needs provided in the management history:
A) If stock is overfished:
F=0, FCurrent, F=FMSY, FTarget
F=FRebuild (max exploitation that rebuild in greatest allowed time)
Fixed landings equal to the ABC
B) If stock is overfishing
F=FCurrent, F=FMSY, F= FTarget, Fixed landings equal to the ABC
C) If stock is neither overfished nor overfishing
PRE-DECIS
IONAL

June 2015 Gulf of Mexico Red Grouper
SEDAR 42 SAR Section III Assessment Process Report
5
F=FCurrent, F=FMSY, F=FTarget, Fixed landings equal to the ABC
D) If data limitations preclude classic projections (i.e. A, B, C above), explore alternate
models to provide management advice.
11. Provide recommendations for future research and data collection.
• Be as specific as practicable in describing sampling design and sampling intensity.
• Emphasize items which will improve future assessment capabilities and reliability.
• Consider data, monitoring, and assessment needs.
12. Complete the Assessment Workshop Report in accordance with project schedule deadlines
(Section III of the SEDAR Stock Assessment Report).
1.1.3. List of Participants
Workshop Panel
Meaghan Bryan, Lead Analyst..................................................................................... NMFS Miami
Bob Gill ....................................................................................................................................... SSC
Patrick Lynch .................................................................................................... NMFS Silver Spring
Sean Powers ................................................................................................................................ SSC
Adyan Rios................................................................................................................... NMFS Miami
Skyler Sagarese ............................................................................................................................ UM
Jim Tolan .................................................................................................................................... SSC
John Walter .................................................................................................................. NMFS Miami
Appointed Observers
Jim Clements ......................................................................................................................................
Paul Giordano ....................................................................................................................................
Staff
Julie Neer .............................................................................................................................. SEDAR
Ryan Rindone...................................................................................................................... GMFMC
Additional Participants via Webinar
Neil Baertlein ............................................................................................................... NMFS Miami
Shannon Cass-Calay .................................................................................................... NMFS Miami
Nancie Cummings ........................................................................................................ NMFS Miami
Michael Drexler ................................................................................................. Ocean Conservancy
Michael Larkin ............................................................................................................. NMFS/SERO
Linda Lombardi ................................................................................................. NMFS Panama City
Rich Malinowski .......................................................................................................... NMFS/SERO
Vivian Matter ............................................................................................................... NMFS Miami
Adam Pollack ....................................................................................................... NMFS Pascagoula
Jessica Stephen............................................................................................................. NMFS/SERO
Elbert Whorton............................................................................................................................ SSC
PRE-DECIS
IONAL

June 2015 Gulf of Mexico Red Grouper
SEDAR 42 SAR Section III Assessment Process Report
6
1.1.4. List of Assessment Workshop Working Papers
Documents Prepared for the Assessment Process
SEDAR42-AW-01 Red tide mortality on red grouper
(Epinephelus morio) between 1980
and 2009 on the West Florida Shelf
Skyler R. Sagarese,
Alisha M. Gray,
Cameron H.
Ainsworth, David D.
Chagaris, Behzad
Mahmoudi
5 Feb 2015
SEDAR42-AW-02 Standardized catch rates for red
grouper from the Unites States Gulf
of Mexico vertical line and longline
fisheries
Meaghan D. Bryan
and Kevin McCarthy
10 March 2015
SEDAR42-AW-03 Standardized Catch Rates of Red
Grouper (Epinephelus morio) from the
U.S. Headboat Fishery in the Gulf of
Mexico, 1986-2013
Adyan Rios 13 March 2015
SEDAR42-AW-04 Standardized Catch Rates of Red
Grouper (Epinephelus morio) from the
Gulf of Mexico Recreational
Charterboat and Private Boat Fisheries
(MRFSS) 1986-2013
Adyan Rios 13 March 2015
SEDAR 42-AW-05 Estimating age- and size-specific natural
mortality rates for Gulf of Mexico red
grouper (Epinephelus morio) using the
ecosystem model OSMOSE-WFS
A. Grüss, M. J.
Schirripa, D.
Chagaris, P. Verley,
Y.-J. Shin, L. Velez, C.
H. Ainsworth, S. R.
Sagarese, and L.
Lombardi-Carlson
11 March 2015
1.2 Panel Recommendations and Comment on Terms of Reference
Term of Reference 1: Review any changes in data following the data workshop and any analyses
suggested by the data workshop. Summarize data as used in each assessment model. Provide
justification for any deviations from Data Workshop recommendations.
All changes to the data following the data workshop are reviewed in Section Error! Reference source
not found..
Term of Reference 2: Develop population assessment models that are compatible with available data
and document input data, model assumptions and configuration, and equations for each model
considered.
PRE-DECIS
IONAL

June 2015 Gulf of Mexico Red Grouper
SEDAR 42 SAR Section III Assessment Process Report
7
A fully integrated age and length based statistical-catch-at-age model configured using Stock Synthesis
was used for the assessment. The model configuration and data inputs are described in Section Error!
Reference source not found.. See section Error! Reference source not found. for a complete description
of all data inputs. Appendix A includes the data file to run the Stock Synthesis model.
Term of Reference 3: Incorporate known applicable environmental covariates into the selected model,
and provide justification for why any of those covariates cannot be included at the time of the
assessment.
The Assessment Panel recommended that mortality associated with the 2005 red tide event be
incorporated into the assessment model. Two alternative approaches to incorporating red tide
were explored (see section Error! Reference source not found.).
Term of Reference 4: Provide estimates of stock population parameters, including:
• Fishing mortality, abundance, biomass, selectivity, stock-recruitment relationship, red grouper being a
protogynous hermaphrodite, and other parameters as necessary to describe the population. •
Appropriate measures of precision for parameter estimates.
Estimates of assessment model parameters and their associated standard errors are reported in Section
3.1.4 and Table 3.1.1. Estimates of stock biomass, spawning stock biomass, recruitment, and fishing
mortality are presented in Table 3.2.2 and Table 3.2 3.
Term of Reference 5: Characterize uncertainty in the assessment and estimated values.
• Consider uncertainty in input data, modeling approach, and model configuration.
• Provide a continuity model consistent with the prior assessment configuration, if one exists, updated to
include the most recent observations. Alternative approaches to a strict continuity run that distinguish
between model, population, and input data influences on findings, may be considered.
• Consider and include other sources as appropriate for this assessment.
• Provide appropriate measures of model performance, reliability, and ‘goodness of fit’.
• Provide measures of uncertainty for estimated parameters.
Uncertainty in the assessment and estimated values was characterized using sensitivity analyses. Results
of the sensitivity analyses are characterized in Section 3.1.7, Table 3.2.4 - Table 3.2. 6, and Figure 3.2.67
- Figure 3.2.76. Model convergence was tested by varying starting parameters and refitting the model
(Table 3.1.3). Uncertainty in the assessment parameters and estimated values is characterized in Section
3.2.2 and Table 3.2.1.
Term of Reference 6: Provide estimates of yield and productivity.
• Include yield-per-recruit, spawner-per-recruit, and stock-recruitment models.
Estimates of yield per recruit and spawner per recruit are summarized in Figure 3.2.84.
Term of Reference 7: Provide estimates of population benchmarks or management criteria consistent
with available data, applicable FMPs, proposed FMPs and Amendments, other ongoing or proposed
management programs, and National Standards.
• Examine the effect of being a protogynous hermaphrodite on stock status criteria and other
management benchmarks.
PRE-DECIS
IONAL

June 2015 Gulf of Mexico Red Grouper
SEDAR 42 SAR Section III Assessment Process Report
8
• Evaluate existing or proposed management criteria as specified in the management summary.
• Recommend proxy values when necessary.
Reference points were calculated for a SSB-female model, where SSB was derived as a function of the
proportion of mature females and batch fecundity. Stock synthesis can calculate reference points in
terms of yield-per recruit, spawner biomass per-recruit and equilibrium yield as a function of fishing
mortality. Reference points were calculated in terms of equilibrium yield. See section 3.1.9 and 3.2.9.
Term of Reference 8: Provide declarations of stock status relative to management benchmarks or
alternative data poor approaches if necessary.
Stock status was evaluated with respect to the minimum stock size threshold (MSST= (1-M)*SSBmsy)
and Fmsy. This terms of reference is addressed in section 3.2.9.
Term of Reference 9: Provide uncertainty distributions of proposed reference points and stock status
metrics that provides the values indicated in the management specifications. Include probability density
functions for biological reference point estimates and population metrics (e.g., biomass and exploitation)
used to evaluate stock status.
Estimates of uncertainty in the proposed reference points and stock status will be provided at the
review workshop.
Term of Reference 10: Project future stock conditions (biomass, abundance, and exploitation; including
probability density functions) and develop rebuilding schedules if warranted; include estimated
generation time. Develop stock projections for the following circumstances, in accordance with the
guidance on management needs provided in the management history:
A) If stock is overfished: F=0, FCurrent, F=FMSY, FTarget F=FRebuild (max exploitation that rebuild in greatest
allowed time) Fixed landings equal to the ABC
B) If stock is overfishing F=FCurrent, F=FMSY, F= FTarget, Fixed landings equal to the ABC
C) If stock is neither overfished nor overfishing F=FCurrent, F=FMSY, F=FTarget, Fixed landings equal to the
ABC
D) If data limitations preclude classic projections (i.e. A, B, C above), explore alternate models to provide
management advice.
Projections were carried out for three fishing mortality scenarios F = Fmsy, F= Foy, and F=Fcurrent. The
projection methods are described in Section 3.1.10 and the results are summarized in Section 3.2.10,
Figure 3.2.83, and Table 3.2.7.
Term of Reference 11: Provide recommendations for future research and data collection.
• Be as specific as practicable in describing sampling design and sampling intensity.
• Emphasize items which will improve future assessment capabilities and reliability.
• Consider data, monitoring, and assessment needs.
Recommendations are provided in Section 3.3.2.
Term of Reference 12: Complete the Assessment Workshop Report in accordance with project schedule
deadlines (Section III of the SEDAR Stock Assessment Report).
This report satisfies this Term of Reference.
PRE-DECIS
IONAL

June 2015 Gulf of Mexico Red Grouper
SEDAR 42 SAR Section III Assessment Process Report
9
2 Data Review and Update
The following list summarizes the main data inputs used in the assessment model:
Life history
Age and growth
Natural mortality
Maturity
Sex transition
Fecundity
Landings
Commercial vertical line: 1880-2013
Commercial longline: 1981-2013
Commercial trap: 1964-2006
Recreational charterboat and private: 1946-2013
Recreational headboat: 1946-2013
Commercial Cuban landings in present day US waters: 1937-1977
Discards
Commercial vertical line: 1993-2013
Commercial longline: 1993-2013
Commercial trap: 1990-2006
Recreational charterboat and private: 1981-2013
Recreational headboat: 1981-2013
Age composition of landings
Commercial vertical line: 1991-2013
Commercial longline: 1991-2013
Commercial trap: 1992-2006
Recreational charterboat and private: 1991-2013
Recreational headboat: 1991-2013
Length composition of discards
Commercial vertical line: 2006-2013
Commercial longline: 2006-2013
Recreational charterboat: 2010-2013
Recreational headboat: 2005-2007 & 2009-2013
Abundance indices
Fishery-independent
SEAMAP groundfish: 2009-2013
NMFS bottom longline: 2001 & 2003-2013
Combined video: 1993-1997, 2002 & 2004-2013
Fishery-dependent
Commercial vertical line: 1993-2009
Commercial longline: 1993-2009
Recreational charterboat and private: 1986-2013
Recreational headboat: 1986-2013
Length composition data from fishery-independent survey
Combined video: 2002 & 2004-2013
PRE-DECIS
IONAL

June 2015 Gulf of Mexico Red Grouper
SEDAR 42 SAR Section III Assessment Process Report
10
SEAMAP groundfish: 2008-2013
NMFS bottom longline: 2000-2013
Discard mortality
Commercial vertical line
Commercial longline pre-IFQ
Commercial longline post-IFQ
Commercial trap
Recreational fleets
A brief summary of each input will be provided in the following sections.
2.1 Life history
2.1.1 Age and growth
A single von Bertalanffy equation was used to model growth of Red Grouper for both sexes (Figure
2.1.1). The von Bertalanffy parameters; Linf, the asymptotic length, k, the von Bertalanffy growth
coefficient, and t0, the theoretical age at length zero, were fixed within the SS model.
The von Bertalanffy parameter values recommended from the Data Workshop and described in
SEDAR42-DW10 were:
Linf (cm FL) = 82.89
K (year-1
) = 0.1251
t0 (year) = -1.20
The recommendation from the Data Workshop (DW) was to model the distribution of length at age
using a constant CV at age (CV = 0.15). More recently, the distribution of length at age was modeled
with a CV that increased linearly (CVyoung = 0.1435 and CVold = 0.1647). Furthermore, t0 was adjusted to
account for peak spawning on May 15th. The von Bertalanffy parameter values used in the SS model
were:
Linf (cm FL) = 82.72
K (year-1
) = 0.1243
t0 (year) = -0.89
Meristic relationships were provided at the Data Workshop. The parameters describing these
relationships are summarized in Table 2.1.1.
2.1.2 Natural mortality
The recommendation from the Data Workshop was to estimate natural mortality using the Lorenzen
(2005) estimator with a target M determined using Hoenig (1983) and a maximum age of 29 years. The
natural mortality vector was fixed within the assessment model. The natural mortality vector along with
the lower and upper ranges are included in table 2.1.2 and plotted in Figure 2.1.2.
PRE-DECIS
IONAL

June 2015 Gulf of Mexico Red Grouper
SEDAR 42 SAR Section III Assessment Process Report
11
2.1.3 Maturity
A logistic relationship was recommended by the DW to model maturity. The logistic fit via the Gompertz
equation predicts age at 50% maturity to be 2.8 years (Figure 2.1.3).
Proportion mature at age = exp(-exp(-(-2.55+1.05*age))).
2.1.4 Sex transition
A logistic relationship was recommended by the Data Workshop to model transition of females to males.
The logistic fit via the Gompertz equation predicts 50% male at age 11.2 years (Figure 2.1.4).
Proportion female at age = exp(-exp(-(2.14-0.16*age)))
2.1.5 Fecundity
The Data Workshop recommendation of a power function fit to batch fecundity data was used to model
female reproductive potential (Figure 2.1.5).
Batch fecundity (in thousands) = 3.878 * age ^2.12
In the combined single sex SS model, males and females were treated identically. To account for a
decrease in fecundity as females transition and become males, the equation characterizing total
fecundity at age was modeled as the proportion female * proportion mature * batch fecundity (Figure
2.1.6). The fecundity at age vector was fixed within the SS model.
2.2 Landings
2.2.1 Commercial landings
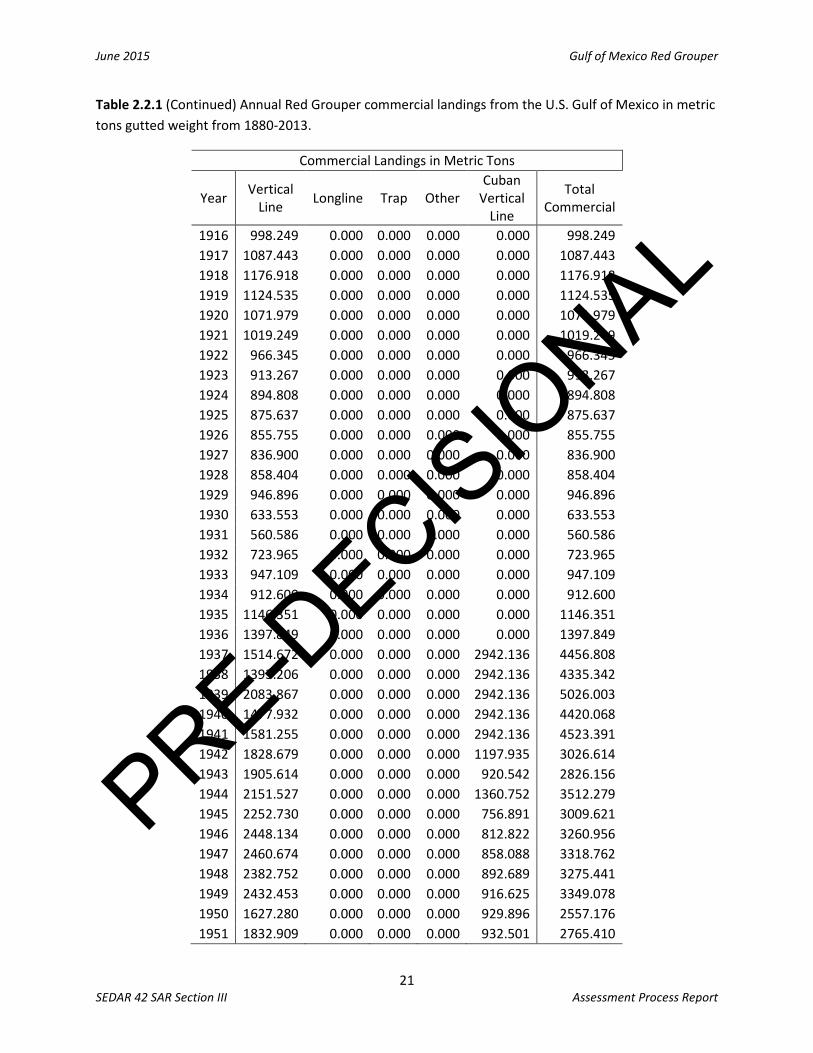
The commercial landings reviewed at the Data Workshop and described in SEDAR42-RD-02 are
presented in Table 2.2.1 and in Figure 2.2.1 (units converted to metric tons). The commercial landings
are available by gear including vertical line, longline, trap, and ‘other’. Prior to 1982, almost all of the
commercial landings were from the vertical line fishery. In 1983, annual landings by the longline fishery
were similar to the landings by the vertical line fishery. In all years after 1990, except 2009 and 2010,
landings by the longline fishery made up more than 50% of annual commercial landings. Landings by the
trap fishery were largest between 1984 and 2006 and ranged from 5-23% of annual commercial
landings.
Landings by vertical line, longline and trap fleets were used in the assessment model. Landings reported
under ‘other’ were excluded as they made up less than 1% of overall commercial landings.
PRE-DECIS
IONAL

June 2015 Gulf of Mexico Red Grouper
SEDAR 42 SAR Section III Assessment Process Report
12
2.2.2 Recreational landings
The recreational landings reviewed at the Data Workshop are presented in Table 2.2.2 and Figure 2.2.2
(units in thousands of fish). The recreational landings are available by mode and include headboat,
charterboat, private boat, and shore. Prior to 1981 the private and charterboat landings are only
available as a single combined mode. Between 1946 and 1980, the combined private and charterboat
mode made up 76-95% of annual recreational landings. Between 1981 and 2013 the private mode made
up 45-92%, the charterboat mode made up 4-44%, and the headboat mode made up 2-17% of annual
recreational landings.
Landings by the headboat, charterboat, and private modes were used in the assessment model.
Landings for the charterboat and private modes were aggregated into a combined mode.
Landings reported for the shore mode were excluded since they made up only 1% of overall recreational
landings.
2.2.3 Commercial Cuban landings in present day US waters
The numbers of Red Grouper caught in the U.S. Gulf of Mexico and landed in Cuba that were reviewed
at the Data Workshop and are presented in Table 2.2.1 and in Figure 2.2.1 (units converted to metric
tons, the native units of the Stock Synthesis model). Landings are from 1937 through 1977. During these
years, Cuban landings made up 0-68% of annual commercial landings. Missing landings in 1959-1962
were likely attributed to the Cuban revolution. The Cuban landings series ends in 1977 due to the
expansion of the US Exclusive Economic Zone (EEZ) to 200 nautical miles and the expulsion of Cuban
vessels.
Landings in US waters by the Cuban vertical line fleet were used in explorations of the assessment
model where the start year was set to 1880. However, these landings were not included in model runs
that started in 1986.
2.3 Discards
2.3.1 Commercial discards
The commercial discards are available by gear for vertical line, longline and trap. They are summarized in
Table 2.3.1 and Figure 2.3.1 (units in thousands of fish). Numbers of discards for the commercial trap
fishery were retained from the SEDAR12 2006 benchmark and 2009 update assessments (fish traps were
banned in the Gulf of Mexico beginning in 2006). The vertical line and longline commercial discards that
were reviewed at the Data Workshop were re-estimated after evaluating the reliability of the logbook
effort data used in the discard calculation. Following a Data Workshop research recommendation to
investigate appropriate methods for calculating discards using observer reported discard rates and
coastal logbook reported fishing effort, effort data were investigated by calculating total landings as
kept rate*logbook effort and comparing the results to the estimates of landings compiled from trip
ticket data. The calculated landings differed from the trip ticket landings, particularly in the vertical line
fishery (Figure 2.3.2 A and B), and an additional investigation of discard calculation using observer
reported discard rates and fisher reported total effort is needed. An alternative method was
PRE-DECIS
IONAL

June 2015 Gulf of Mexico Red Grouper
SEDAR 42 SAR Section III Assessment Process Report
13
recommended for the current Red Grouper assessment. That alternative method of estimating discards
was:
��������� ������ ��� ����� ������� ����������� ������ ��� ����� �� ��� � × ��� ����� ��������
For 2007 and 2008, discards were calculated for each year/subregion/season, whereas for 2009-2013,
discards were calculated for each year/subregion/season/IFQ allocation category. Calculated discards
across strata within each year were summed to obtain yearly total discards.
Strata were:
Year (2007-2013)
Subregion (east = statistical zones 1-8, west = 9-21)
Season (shallow water grouper season – open or closed)
IFQ allocation available to a vessel during a trip (none or 1+ pounds, applicable to 2009-2013)
Fishery (shark or reef fish, used for bottom longline discard calculations only – shark fishery
discards were calculated using shark fishery observer data, reef fish discards were
calculated using reef fish fishery observer data)
For years 1993-2006, discard and kept rates were calculated over the years 2007-2009 for each
subregion/season/fishery. Calculated discards across strata within each year were summed to
obtain yearly total discards. Prior to 1993, only 20% of Florida vessels were required to report
the coastal logbook program, therefore proportion of landings by strata could not be accurately
calculated.
2.3.2 Recreational discards
The recreational discards reviewed at the Data Workshop are presented in Table 2.3.2 and Figure 2.3.3
(units in thousands of fish). The recreational landings are available by mode for headboat, charterboat,
private boat, and shore. The majority of annual discards, 75% on average, are from the private
recreational fleet. The discards from the charterboat, headboat and shore fleets make-up 15%, 6% and
4% on average of annual discards.
Discards by the headboat, charterboat, and private modes were used in the assessment model. The
discards from the recreational shore mode were excluded since landings from this fleet were excluded
from the model (shore mode made up 1% of overall recreational landings).
2.4 Age composition of landings
2.4.1 Commercial age composition of landings
The age composition data for Red Grouper landed by the commercial fleet are summarized in Figures
2.4.1, 2.4.2 and 2.4.3. Age composition data were available by gear for vertical line, longline, and trap
(SEDAR 42-DW-12). The number of aged fish by gear was quite small in some years, particularly for the
trap fishery (Table 2.4.1).
PRE-DECIS
IONAL

June 2015 Gulf of Mexico Red Grouper
SEDAR 42 SAR Section III Assessment Process Report
14
Cohorts are apparent in the vertical line data in years 1994-1996, 2000-2003, 2004-2006, 2007-2009,
and 2011-2013, corresponding to year classes from 1988, 1995, 1998, 2001 and 2005, respectively
(Figure 2.4.1). Although less apparent, the 1998, 2001, and 2005 cohorts were also present in the
longline data (Figure 2.4.2). Cohorts were not particularly apparent in the trap data (Figure 2.4.3).
2.4.2 Recreational age composition of landings
The age composition data for Red Grouper landed by the recreational fleet are summarized in Figures
2.4.4 and 2.4.5. Age composition data were available by mode for headboat, charterboat, and private
boat. The number of aged fish was quite small in some years, particularly for the private fishery (Table
2.4.1). Data for the charterboat and private modes were aggregated into a combined mode.
Previous SEDAR assessments for Red Grouper modeled the recreational fishery using a single combined
fleet. In the current assessment, the recreational fishery was separated into two fleets. The assessment
panel agreed to have a separate headboat fleet since mode-specific total landings, total discards, age
composition of landings, length composition of discards, and a headboat index of abundance
wereavailable. The private and charterboat modes were modeled as a single, combined fleet for the
following reasons. First, private and charterboat landings between 1946 and 1980 were only available in
a single combined mode (Section 2.2). Further, private and charterboat catch rates from 1986 to 2013
were modeled into a single index of abundance (Section 2.6). Lastly, there were few annual age samples
(Section 2.4) and no discard lengths associated with the private recreational fishery (Section 2.5).
Cohorts are apparent in the combined charterboat and private mode data in years 1995-1997, 2000-
2002, 2003-2007 and 2009-2012, corresponding to year classes from 1989, 1995, 1998 and 2005,
respectively (Figure 2.4.4). The 1989, 1998 and 2005 cohorts are also apparent in the headboat data
(Figure 2.4.5). In general, the recreational sector captured younger Red Grouper than the commercial
sector.
2.5 Length composition of discards
2.5.1 Commercial length composition of discards
In July 2006, a mandatory observer program was implemented to characterize the commercial reef fish
fishery operating in the U.S. Gulf of Mexico (SEDAR42-DW-01). The observer program provides detailed
information for each trip and each fish captured, including the size and disposition of Red Grouper
caught. Length composition data of discarded fish from the commercial fishery were only available and
included in the model for the vertical line and longline fleets for 2006-2013. These data are shown in
Figures 2.5.1 and 2.5.2.
A 20 inch (50.8 cm) total length commercial size limit was implemented between 1990 and 2008. This
size limit was reduced to 18 inches (45.7 cm) in 2009. The majority of the observed length distribution of
discards from the vertical line and longline fisheries have been below the size limits with some
observations of larger discarded fish in 2009 (Figures 2.5.1 and 2.5.2).
PRE-DECIS
IONAL

June 2015 Gulf of Mexico Red Grouper
SEDAR 42 SAR Section III Assessment Process Report
15
2.5.2 Recreational length composition of discards
A fisheries observer program on recreational for-hire vessels, including headboats and charter vessels,
was implemented in 2005 in the U.S. Gulf of Mexico (SEDAR42-DW14). The observer program provides
detailed information for each trip and each fish captured, including the size and disposition of all Red
Grouper caught. Length composition data of discarded fish from the recreational fleets were only
available and included in the model for the headboat and charterboat fleets. These data are shown in
Figures 2.5.3 and 2.5.4.
The recreational fishery has been managed using size limits and bag limits. A 20 inch (50.8 cm) total
length recreational size limit was implemented in 1990. Also in 1990, a 5 fish bag limit for Red Grouper
was implemented. The recreational bag limit was changed to 2 fish in 2004, and was then further
reduced to 1 fish in 2005. The bag limit was increased to 4 fish in 2011. The majority of discards from the
recreational charterboat and headboat fisheries have been below the size limits (Figures 2.5.3 and
2.5.4). Discards of fish above the size limit were observed in both fleets and particularly in the
charterboat fleet. Generally, the Red Grouper discarded by the recreational sector show a larger range
in size than Red Grouper discarded by the commercial sector.
2.6 Measures of population abundance
Fifteen indices of abundance were presented and considered during the Data Workshop, seven of which
were recommended for use. The indices of abundance that were recommended for use in the
assessment include:
Fishery-independent indices
SEAMAP groundfish 2009-2013
NMFS bottom longline 2001 & 2003-2013
Combined video 1993-1997, 2002 & 2004-2013
Fishery-dependent indices
Commercial vertical line 1993-2009
Commercial longline 1993-2009
Recreational charterboat and private 1986-2013
Recreational headboat 1986-2013
Three of the seven recommended indices were from fishery-independent data sources: the SEAMAP
summer groundfish survey, the NMFS bottom longline survey, and the combined SEAMAP, Panama City
and FWRI video survey (Table 2.6.1 and Figures 2.6.1 – 2.6.3). The SEAMAP groundfish index was derived
as the number of Red Grouper caught per trawl hour. The NMFS bottom longline index was derived as
the number of Red Grouper caught per 100 hook hours. The combined video survey was derived as the
minimum count of Red Grouper (maximum number of individuals in the field of view at one instance)
per 20 minute recording.
There were four recommended fishery-dependent indices: the Marine Recreational Fishery Statistic
Survey (MRFSS) index, the Southeast Regional Headboat Survey index (SERHS), the commercial vertical
line index, and the commercial longline index (Table 2.6.2 and Figures 2.6.4 – 2.6.7). The SERHS index
was derived using numbers of Red Grouper landed per angler hour and the MRFSS index, which
PRE-DECIS
IONAL

June 2015 Gulf of Mexico Red Grouper
SEDAR 42 SAR Section III Assessment Process Report
16
represents the charterboat and private modes, was derived using the numbers of Red Grouper landed
or discarded per angler hour. The commercial vertical line index was derived as pounds of Red Grouper
landed per hook hour. The commercial longline index was derived as pounds of Red Grouper landed per
number of hooks fished. The recommended terminal year for both commercial indices was 2009, prior
to the implementation of commercial individual fishing quotas in 2010. This terminal year was chosen
because the influence of individual fishing quotas is not well understood.
The standardized indices of relative abundance and associated CVs used in the assessment are
presented in Tables 2.6.1 and 2.6.2. For input into the Stock Synthesis assessment model, the
coefficients of variation (CV) associated with the standardized indices were converted to log-scale
standard errors by:
log���� = ���!�1 + $%&�
A brief summary of the limitations of the 8 rejected indices will be provided here but the reader is
referred to the SEDAR 42 Data Workshop Report for a more comprehensive explanation.
Of the datasets/indices not recommended for use, three (SEAMAP VIDEO, Panama City Video, and FWRI
Video) were combined into the Combined Video index. Two trap indices, the Panama City Trap and the
FWRI Trap indices, which covered the same portion of the population as the Combined Video index,
were not recommended because they had lower spatial coverage and a shorter time series than the
Combined Video index. The Commercial Trap and Everglades National Park Creel indices were not
recommended because of low numbers of Red Grouper present in the data. Finally, the Headboat
Observer Discard index, which covers sub-legal sized fish, was not recommended for two reasons. The
first reason is that the observed discards covered similar sizes of fish but had lower spatial coverage and
a shorter time series when compared to the Combined Video index. The second reason is that only one
fishery-dependent index can represent a single fleet in the assessment model and the Southeast Region
Headboat index was favored over the Headboat Observer Discard index to represent the headboat fleet.
2.7 Length composition data from fishery-independent surveys
The length composition data for the fishery-independent surveys are plotted in Figures 2.7.1 – 2.7.3.
Cohorts were not particularly apparent in the length composition data for the surveys. Generally,
smaller Red Grouper were observed in the SEAMAP groundfish survey than in the combined video and
bottom longline surveys.
2.8 Discard Mortality
The Data Workshop included a working group that focused on discard mortality. Based on new data
available since the previous assessment (see the SEDAR 42 Data Workshop Report), the following
discard mortality rates were used in the assessment model for SEDAR42:
1. An estimate of 11.6% for the recreational fishery (sensitivity range 5.8% to 14.5%).
2. An estimate of 19.0% for the commercial vertical line fishery (sensitivity range 10.0% to 31.0%).
3. An estimate of 41.4% for the commercial bottom longline fishery pre-IFQ (sensitivity range
34.3% to 48.7%).
4. An estimate of 43.6% for the commercial bottom longline fishery post-IFQ (sensitivity range
36.7% to 50.8%).
PRE-DECIS
IONAL

June 2015 Gulf of Mexico Red Grouper
SEDAR 42 SAR Section III Assessment Process Report
17
5. An estimate of 10% for the commercial trap fishery. No new data on discard mortality rates
were available for the commercial trap fishery. This estimate was retained from the SEDAR12
2006 benchmark and 2009 update assessments.
PRE-DECIS
IONAL

June 2015 Gulf of Mexico Red Grouper
SEDAR 42 SAR Section III Assessment Process Report
18
2.9 Tables
Table 2.1.1 Meristic regressions for Red Grouper (1978-2013) from the Gulf of Mexico. Data combined from all data sources, both fishery-
independent and dependent. Length Type: Max TL – Maximum Total Length, FL – Fork Length, Nat TL – Natural Total Length, SL – Standard
Length. Weight Type: G Wt – Gutted Weight, W Wt – Whole Weight. Units: length (mm) and weight (kg). Linear and non-linear regressions
calculated using R (lm and nls functions, respectively).
Regression Equation Statistic N Data Range
Max TL to FL FL = 5.35 + max_TL *0.95 r2
= 0.9963 5818 Max TL: 120 – 954; FL: 116 – 910
Nat TL to FL FL = 5.71 + nat_TL * 0.95 r2
= 0.9909 3901 Nat TL: 151 – 957; FL: 149 – 910
SL to FL FL = 15.90 + SL * 1.14 r2
= 0.9938 985 SL: 130 – 686; FL: 159 – 830
SL to Max TL Max_TL = 9.19 + SL * 1.21 r2 = 0.9944 3399 SL: 130 – 720; Max TL: 161 – 876
SL to Nat TL Nat_TL = -51.18 + SL * 1.32 r2
= 0.9791 7 SL: 404 – 670; Nat TL: 484 – 860
Max TL to G Wt GWT = 4.33 x 10⁻⁸
* (max_TL^2.83
) RSE = 0.7421 633 Max TL: 458 – 980; G WT: 0.82 – 15.05
Max TL to W Wt WWT = 5.21 x 10-09
* (max_TL^3.16
) RSE = 0.5152 3725 Max TL: 127 – 954; W WT: 0.03 – 16.96
Nat TL to G Wt GWT = 5.70 x 10-08
* (nat_TL^2.78
) RSE = 0.6398 34 Nat TL: 490 – 802; G WT: 1.28 – 7.17
Nat TL to W Wt WWT = 7.58 x 10-09
* (nat_TL^3.10
) RSE = 0.3482 3912 Nat TL: 120 – 957; W WT: 0.02 – 14.00
FL to G Wt GWT = 3.37 10-09
* (FL^3.25
) RSE = 0.3499 37414 FL: 230 – 935; G WT: 0.26 – 16.96
FL to W Wt WWT = 5.46 x 10-09
* (FL^3.18
) RSE = 0.4667 7361 FL: 123 – 965; W WT: 0.05 – 16.96
SL to W Wt WWT = 2.32 x 10-08
* (SL^3.03
) RSE = 0.1825 483 SL: 147 – 670; W WT: 0.10 – 9.00
PRE-DECIS
IONAL

June 2015 Gulf of Mexico Red Grouper
SEDAR 42 SAR Section III Assessment Process Report
19
Table 2.1.2 Recommended values for age-specific natural mortality for Red Grouper in the Gulf of
Mexico. The standard deviation (± 5 yrs) at age for the maximum age (29 yrs) was used to calculate the
upper and lower range for natural mortality.
Age
Age-specific
natural mortality Lower Upper
0 0.5837 0.5053 0.7336
1 0.3952 0.3421 0.4967
2 0.3082 0.2669 0.3874
3 0.2583 0.2236 0.3247
4 0.2261 0.1957 0.2841
5 0.2036 0.1763 0.256
6 0.1873 0.1621 0.2354
7 0.1749 0.1514 0.2198
8 0.1652 0.1431 0.2077
9 0.1576 0.1364 0.198
10 0.1514 0.1311 0.1903
11 0.1463 0.1267 0.1839
12 0.1421 0.123 0.1786
13 0.1386 0.12 0.1742
14 0.1356 0.1174 0.1705
15 0.1331 0.1152 0.1673
16 0.131 0.1134 0.1646
17 0.1291 0.1118 0.1623
18 0.1276 0.1105 0.1603
19 0.1262 0.1093 0.1586
20 0.125 0.1083 0.1572
21 0.124 0.1074 0.1559
22 0.1231 0.1066 0.1548
23 0.1224 0.106 0.1538
24 0.1217 0.1054 0.153
25 0.1211 0.1049 0.1522
26 0.1206 0.1044 0.1516
27 0.1202 0.104 0.151
28 0.1198 0.1037 0.1505
29 0.1194 0.1034 0.1501
PRE-DECIS
IONAL

June 2015 Gulf of Mexico Red Grouper
SEDAR 42 SAR Section III Assessment Process Report
20
Table 2.2.1 Annual Red Grouper commercial landings from the U.S. Gulf of Mexico in metric tons gutted
weight from 1880-2013.
Commercial Landings in Metric Tons
Year Vertical
Line Longline Trap Other
Cuban
Vertical
Line
Total
Commercial
1880 686.997 0.000 0.000 0.000 0.000 686.997
1881 620.472 0.000 0.000 0.000 0.000 620.472
1882 553.947 0.000 0.000 0.000 0.000 553.947
1883 487.421 0.000 0.000 0.000 0.000 487.421
1884 420.895 0.000 0.000 0.000 0.000 420.895
1885 354.369 0.000 0.000 0.000 0.000 354.369
1886 287.844 0.000 0.000 0.000 0.000 287.844
1887 221.318 0.000 0.000 0.000 0.000 221.318
1888 159.244 0.000 0.000 0.000 0.000 159.244
1889 173.697 0.000 0.000 0.000 0.000 173.697
1890 166.687 0.000 0.000 0.000 0.000 166.687
1891 190.366 0.000 0.000 0.000 0.000 190.366
1892 214.046 0.000 0.000 0.000 0.000 214.046
1893 237.726 0.000 0.000 0.000 0.000 237.726
1894 261.406 0.000 0.000 0.000 0.000 261.406
1895 273.991 0.000 0.000 0.000 0.000 273.991
1896 287.227 0.000 0.000 0.000 0.000 287.227
1897 295.172 0.000 0.000 0.000 0.000 295.172
1898 289.298 0.000 0.000 0.000 0.000 289.298
1899 284.818 0.000 0.000 0.000 0.000 284.818
1900 275.815 0.000 0.000 0.000 0.000 275.815
1901 264.775 0.000 0.000 0.000 0.000 264.775
1902 298.395 0.000 0.000 0.000 0.000 298.395
1903 308.433 0.000 0.000 0.000 0.000 308.433
1904 316.754 0.000 0.000 0.000 0.000 316.754
1905 323.373 0.000 0.000 0.000 0.000 323.373
1906 332.766 0.000 0.000 0.000 0.000 332.766
1907 336.208 0.000 0.000 0.000 0.000 336.208
1908 337.999 0.000 0.000 0.000 0.000 337.999
1909 410.998 0.000 0.000 0.000 0.000 410.998
1910 468.978 0.000 0.000 0.000 0.000 468.978
1911 556.488 0.000 0.000 0.000 0.000 556.488
1912 644.279 0.000 0.000 0.000 0.000 644.279
1913 732.350 0.000 0.000 0.000 0.000 732.350
1914 820.702 0.000 0.000 0.000 0.000 820.702
1915 909.335 0.000 0.000 0.000 0.000 909.335
PRE-DECIS
IONAL
June 2015 Gulf of Mexico Red Grouper
SEDAR 42 SAR Section III Assessment Process Report
21
Table 2.2.1 (Continued) Annual Red Grouper commercial landings from the U.S. Gulf of Mexico in metric
tons gutted weight from 1880-2013.
Commercial Landings in Metric Tons
Year Vertical
Line Longline Trap Other
Cuban
Vertical
Line
Total
Commercial
1916 998.249 0.000 0.000 0.000 0.000 998.249
1917 1087.443 0.000 0.000 0.000 0.000 1087.443
1918 1176.918 0.000 0.000 0.000 0.000 1176.918
1919 1124.535 0.000 0.000 0.000 0.000 1124.535
1920 1071.979 0.000 0.000 0.000 0.000 1071.979
1921 1019.249 0.000 0.000 0.000 0.000 1019.249
1922 966.345 0.000 0.000 0.000 0.000 966.345
1923 913.267 0.000 0.000 0.000 0.000 913.267
1924 894.808 0.000 0.000 0.000 0.000 894.808
1925 875.637 0.000 0.000 0.000 0.000 875.637
1926 855.755 0.000 0.000 0.000 0.000 855.755
1927 836.900 0.000 0.000 0.000 0.000 836.900
1928 858.404 0.000 0.000 0.000 0.000 858.404
1929 946.896 0.000 0.000 0.000 0.000 946.896
1930 633.553 0.000 0.000 0.000 0.000 633.553
1931 560.586 0.000 0.000 0.000 0.000 560.586
1932 723.965 0.000 0.000 0.000 0.000 723.965
1933 947.109 0.000 0.000 0.000 0.000 947.109
1934 912.600 0.000 0.000 0.000 0.000 912.600
1935 1146.351 0.000 0.000 0.000 0.000 1146.351
1936 1397.849 0.000 0.000 0.000 0.000 1397.849
1937 1514.672 0.000 0.000 0.000 2942.136 4456.808
1938 1393.206 0.000 0.000 0.000 2942.136 4335.342
1939 2083.867 0.000 0.000 0.000 2942.136 5026.003
1940 1477.932 0.000 0.000 0.000 2942.136 4420.068
1941 1581.255 0.000 0.000 0.000 2942.136 4523.391
1942 1828.679 0.000 0.000 0.000 1197.935 3026.614
1943 1905.614 0.000 0.000 0.000 920.542 2826.156
1944 2151.527 0.000 0.000 0.000 1360.752 3512.279
1945 2252.730 0.000 0.000 0.000 756.891 3009.621
1946 2448.134 0.000 0.000 0.000 812.822 3260.956
1947 2460.674 0.000 0.000 0.000 858.088 3318.762
1948 2382.752 0.000 0.000 0.000 892.689 3275.441
1949 2432.453 0.000 0.000 0.000 916.625 3349.078
1950 1627.280 0.000 0.000 0.000 929.896 2557.176
1951 1832.909 0.000 0.000 0.000 932.501 2765.410
PRE-DECIS
IONAL

June 2015 Gulf of Mexico Red Grouper
SEDAR 42 SAR Section III Assessment Process Report
22
Table 2.2.1 (Continued) Annual Red Grouper commercial landings from the U.S. Gulf of Mexico in metric
tons gutted weight from 1880-2013.
Commercial Landings in Metric Tons
Year Vertical
Line Longline Trap Other
Cuban
Vertical
Line
Total
Commercial
1952 1160.141 0.000 0.000 0.000 924.441 2084.582
1953 898.587 0.000 0.000 0.000 905.716 1804.304
1954 822.813 0.000 0.000 0.000 876.326 1699.140
1955 757.298 0.000 0.000 0.000 836.271 1593.569
1956 1056.799 0.000 0.000 0.000 884.107 1940.907
1957 1293.115 0.000 0.000 0.000 1258.068 2551.183
1958 1325.103 0.000 0.000 0.000 966.525 2291.627
1959 1790.434 0.000 0.000 0.000 0.000 1790.434
1960 2052.356 0.000 0.000 0.000 0.000 2052.356
1961 2015.890 0.000 0.000 0.000 0.000 2015.890
1962 2359.066 0.000 0.000 0.000 0.000 2359.066
1963 1616.872 0.000 0.000 1.308 460.788 2078.968
1964 1878.026 0.000 2.099 6.246 985.746 2872.117
1965 2094.211 0.000 2.292 0.000 1916.580 4013.083
1966 2010.955 0.000 2.972 0.496 2274.056 4288.479
1967 1625.397 0.000 3.358 7.007 2391.069 4026.832
1968 1788.373 0.000 6.128 1.454 2508.082 4304.038
1969 2080.768 0.000 3.540 0.933 2625.096 4710.336
1970 2027.152 0.000 5.516 0.000 2551.595 4584.263
1971 1729.196 0.000 5.511 0.000 1426.257 3160.964
1972 1797.869 0.000 1.033 0.005 1454.697 3253.604
1973 1387.552 0.000 0.000 0.240 2744.581 4132.373
1974 1618.772 0.000 0.000 0.375 1828.073 3447.220
1975 1956.078 0.000 5.636 0.074 1828.073 3789.861
1976 1690.673 0.000 5.173 0.000 1828.073 3523.919
1977 1350.602 0.000 18.993 2.048 1828.073 3199.715
1978 1238.823 0.000 40.321 2.553 0.000 1281.697
1979 1714.108 0.000 31.813 0.000 0.000 1745.921
1980 1745.249 0.000 20.309 4.841 0.000 1770.399
1981 1507.819 0.001 30.248 4.457 0.000 1542.526
1982 1394.360 369.979 22.689 5.894 0.000 1792.921
1983 1318.835 1389.905 0.503 5.738 0.000 2714.981
1984 1336.999 1128.127 141.326 1.519 0.000 2607.971
1985 1654.628 940.352 290.486 3.303 0.000 2888.770
1986 1421.948 1136.626 327.249 5.088 0.000 2890.912
1987 1153.087 1712.243 203.246 5.027 0.000 3073.603
PRE-DECIS
IONAL

June 2015 Gulf of Mexico Red Grouper
SEDAR 42 SAR Section III Assessment Process Report
23
Table 2.2.1 (Continued) Annual Red Grouper commercial landings from the U.S. Gulf of Mexico in metric
tons gutted weight from 1880-2013.
Commercial Landings in Metric Tons
Year Vertical
Line Longline Trap Other
Cuban
Vertical
Line
Total
Commercial
1988 929.465 994.634 245.043 2.371 0.000 2171.514
1989 1730.406 1414.392 268.877 5.013 0.000 3418.688
1990 1116.269 918.839 154.628 2.425 0.000 2192.161
1991 949.748 1171.895 169.529 15.371 0.000 2306.543
1992 655.426 1092.953 273.147 3.917 0.000 2025.443
1993 589.817 1938.815 322.543 19.629 0.000 2870.805
1994 563.102 1224.284 414.504 17.092 0.000 2218.982
1995 531.270 1101.965 479.444 7.277 0.000 2119.956
1996 392.427 1318.679 244.649 4.609 0.000 1960.364
1997 430.177 1371.747 311.088 3.102 0.000 2116.115
1998 336.390 1207.755 134.966 2.326 0.000 1681.437
1999 550.097 1730.638 341.019 7.906 0.000 2629.660
2000 780.627 1319.655 464.846 13.789 0.000 2578.916
2001 705.660 1542.048 337.150 9.641 0.000 2594.499
2002 738.529 1419.999 444.653 8.384 0.000 2611.565
2003 507.236 1344.782 318.271 5.585 0.000 2175.874
2004 624.441 1534.715 338.021 6.409 0.000 2503.586
2005 636.955 1456.744 277.924 5.625 0.000 2377.248
2006 624.002 1366.521 266.189 4.062 0.000 2260.774
2007 708.094 900.102 0.000 5.941 0.000 1625.239
2008 856.484 1271.938 0.000 11.237 0.000 2139.659
2009 1109.096 510.213 0.000 55.212 0.000 1674.521
2010 614.033 596.212 0.000 125.008 0.000 1335.253
2011 765.790 1381.228 0.000 22.811 0.000 2169.836
2012 1011.300 1333.590 0.000 22.470 0.000 2367.359
2013 698.756 1368.763 0.000 18.553 0.000 2086.071
PRE-DECIS
IONAL

June 2015 Gulf of Mexico Red Grouper
SEDAR 42 SAR Section III Assessment Process Report
24
Table 2.2.2. Annual Red Grouper recreational landings from the U.S. Gulf of Mexico in thousands of fish
from 1946-2013.
Recreational Landings in Thousands of Fish
Year Charterboat Private
Combined
Charterboat
Private
Headboat Shore Total Recreational
1946 - - 12.022 0.689 0.000 12.711
1947 - - 24.044 1.378 0.000 25.422
1948 - - 36.067 2.066 0.000 38.133
1949 - - 48.089 2.755 0.000 50.844
1950 - - 60.111 3.444 0.000 63.555
1951 - - 72.133 4.133 0.000 76.266
1952 - - 84.155 4.821 0.000 88.977
1953 - - 96.178 5.510 0.000 101.688
1954 - - 108.200 6.199 0.000 114.399
1955 - - 120.222 6.888 0.000 127.110
1956 - - 127.848 9.184 0.000 137.032
1957 - - 135.474 11.480 0.000 146.953
1958 - - 143.100 13.775 0.000 156.875
1959 - - 150.726 16.071 0.000 166.797
1960 - - 158.352 18.367 0.000 176.719
1961 - - 158.764 20.663 0.000 179.428
1962 - - 159.177 22.959 0.000 182.136
1963 - - 159.589 25.255 0.000 184.844
1964 - - 160.002 27.551 0.000 187.553
1965 - - 160.415 29.847 0.000 190.261
1966 - - 164.277 32.602 0.000 196.879
1967 - - 168.140 35.357 0.000 203.497
1968 - - 172.002 38.112 0.000 210.114
1969 - - 175.865 40.867 0.000 216.732
1970 - - 179.727 43.622 0.000 223.349
1971 - - 186.048 43.622 0.000 229.670
1972 - - 192.369 45.918 0.000 238.287
1973 - - 198.690 48.214 0.000 246.904
1974 - - 205.011 48.214 0.000 253.225
1975 - - 211.332 66.581 0.000 277.914
1976 - - 223.354 64.285 0.000 287.639
1977 - - 235.376 59.694 0.000 295.069
1978 - - 247.397 57.398 0.000 304.795
1979 - - 259.419 64.285 0.000 323.704
1980 - - 271.441 64.285 0.000 335.726
1981 44.565 77.072 121.637 24.813 0.000 146.450
PRE-DECIS
IONAL

June 2015 Gulf of Mexico Red Grouper
SEDAR 42 SAR Section III Assessment Process Report
25
Table 2.2.2 (Continued) Annual Red Grouper recreational landings from the U.S. Gulf of Mexico in
thousands of fish from 1946-2013.
Recreational Landings in Thousands of Fish
Year Charterboat Private
Combined
Charterboat
Private
Headboat Shore Total Rec.
1982 9.413 163.825 173.238 5.241 0.000 178.479
1983 27.335 351.074 378.409 15.219 0.000 393.628
1984 75.279 118.114 193.393 41.913 28.098 263.404
1985 107.215 418.989 526.204 59.694 0.000 585.898
1986 79.799 525.519 605.318 32.913 6.969 645.200
1987 38.279 298.229 336.508 25.729 0.000 362.237
1988 51.948 687.306 739.254 27.954 9.160 776.368
1989 38.012 713.005 751.017 49.777 0.000 800.794
1990 50.212 130.122 180.334 14.582 16.048 210.964
1991 11.401 284.585 295.986 9.509 10.155 315.650
1992 52.191 419.526 471.717 9.049 26.238 507.004
1993 27.501 331.594 359.095 8.802 18.946 386.843
1994 32 279.441 311.441 9.617 2.750 323.808
1995 59.008 226.726 285.734 14.499 0.000 300.233
1996 22.673 87.205 109.878 15.594 0.000 125.472
1997 22.229 55.004 77.233 4.676 0.000 81.909
1998 25.665 83.245 108.910 4.382 0.000 113.292
1999 34.514 160.692 195.206 6.918 0.000 202.124
2000 126.774 240.164 366.938 8.861 0.000 375.799
2001 63.966 173.124 237.090 5.560 0.000 242.650
2002 49.186 218.694 267.880 4.402 0.000 272.282
2003 53.85 164.178 218.028 7.521 0.000 225.549
2004 91.84 438.051 529.891 13.810 0.000 543.701
2005 86.712 96.952 183.664 13.967 0.000 197.631
2006 37.001 94.509 131.510 4.630 0.000 136.140
2007 26.289 128.452 154.741 4.245 0.000 158.986
2008 41.527 91.601 133.128 5.003 0.000 138.131
2009 28.96 95.599 124.559 4.666 1.607 130.832
2010 55.165 100.922 156.087 4.952 0.000 161.039
2011 48.798 62.111 110.909 7.387 0.000 118.296
2012 91.304 208.979 300.283 13.544 0.000 313.827
2013 139.184 301.203 440.387 14.089 0.000 454.476
PRE-DECIS
IONAL

June 2015 Gulf of Mexico Red Grouper
SEDAR 42 SAR Section III Assessment Process Report
26
Table 2.3.1 Annual Red Grouper commercial discards from the U.S. Gulf of Mexico in thousands of fish
from 1990-2013.
Commercial Discards in Thousands of Fish
Year Vertical
Line Longline Trap
Total
Commercial
1990
69.050 69.050
1991
131.400 131.400
1992
87.500 87.500
1993 510.274 3188.763 169.870 3868.907
1994 487.564 2024.416 53.900 2565.880
1995 459.256 1885.655 124.730 2469.641
1996 338.619 2308.812 732.740 3380.171
1997 370.695 2336.638 598.570 3305.903
1998 290.808 2053.713 50.190 2394.710
1999 474.742 2926.611 106.190 3507.543
2000 674.094 2186.000 234.980 3095.074
2001 728.260 2479.017 167.620 3374.898
2002 853.126 2296.999 146.060 3296.185
2003 549.732 2194.268 134.700 2878.700
2004 709.340 2497.772 81.900 3289.012
2005 829.348 2359.919 122.090 3311.357
2006 612.745 2216.679 139.270 2968.695
2007 553.145 1511.243
2064.388
2008 975.072 1275.026
2250.098
2009 1289.459 793.207
2082.665
2010 994.088 616.223
1610.311
2011 593.650 1408.009
2001.659
2012 599.240 1133.235
1732.476
2013 405.278 840.290
1245.567
PRE-DECIS
IONAL

June 2015 Gulf of Mexico Red Grouper
SEDAR 42 SAR Section III Assessment Process Report
27
Table 2.3.2 Annual Red Grouper recreational discards from the U.S. Gulf of Mexico in thousands of fish
from 1981-2013.
Recreational Discards in Thousands of Fish
Year Charterboat Private
Combined
Charterboat
Private
Headboat Shore Total Recreational
1981 7.906 53.292 61.198 4.005 11.623 76.826
1982 3.078 35.734 38.812 1.559 0.000 40.371
1983 6.516 42.091 48.607 3.301 0.000 51.908
1984 18.893 27.223 46.116 9.570 0.000 55.686
1985 27.212 35.973 63.185 13.784 31.584 108.553
1986 75.968 388.292 464.260 57.059 36.162 557.481
1987 55.687 255.963 311.650 68.103 0.000 379.753
1988 45.691 727.407 773.098 44.776 71.741 889.615
1989 112.586 1718.771 1831.357 268.558 11.065 2110.980
1990 217.875 1244.607 1462.482 115.232 128.784 1706.498
1991 57.281 2586.268 2643.549 87.707 206.175 2937.431
1992 165.448 2115.433 2280.881 52.245 505.104 2838.230
1993 133.344 1444.787 1578.131 77.613 46.668 1702.412
1994 119.009 1344.305 1463.314 65.148 101.182 1629.644
1995 165.497 1295.002 1460.499 74.073 2.252 1536.824
1996 62.371 705.629 768.000 78.145 20.857 867.002
1997 108.861 703.972 812.833 41.698 33.507 888.038
1998 326.922 1139.286 1466.208 101.358 10.471 1578.037
1999 393.899 1572.920 1966.819 143.725 21.518 2132.062
2000 634.966 1524.541 2159.507 80.840 23.009 2263.356
2001 279.996 1289.411 1569.407 44.312 0.000 1613.719
2002 273.975 1571.390 1845.365 44.637 0.000 1890.002
2003 386.452 1573.177 1959.629 98.172 5.635 2063.436
2004 452.240 2697.519 3149.759 123.862 39.812 3313.433
2005 274.709 999.489 1274.198 80.594 7.549 1362.341
2006 127.967 503.284 631.251 29.164 0.000 660.415
2007 133.750 666.434 800.184 17.365 19.033 836.582
2008 425.320 2549.796 2975.116 89.615 556.633 3621.364
2009 479.498 2713.425 3192.923 153.829 117.783 3464.535
2010 543.936 1667.811 2211.747 117.879 6.583 2336.209
2011 502.370 1526.879 2029.249 134.114 9.170 2172.533
2012 539.422 1202.880 1742.302 117.809 6.982 1867.093
2013 613.660 2036.644 2650.304 112.267 1.281 2763.852
PRE-DECIS
IONAL

June 2015 Gulf of Mexico Red Grouper
SEDAR 42 SAR Section III Assessment Process Report
28
Table 2.4.1 Number of Red Grouper aged in the Gulf of Mexico by year and fleet.
Number of Aged Fish
Commercial Recreational
Year
Vertical
Line Longline Trap Total Charterboat Private
Combined
CBT/PRI Headboat Total
1980
5 5
1981
13 13
1985
1 1
1986
8 8
1987
11 11
1988
10 10
1989
11 11
1991 43 37 2 80 1 0 1 36 37
1992 42 143 14 185 24 1 25 33 58
1993 93 200 84 293 61 1 62 21 83
1994 239 88 29 327 72 0 72 29 101
1995 180 140 39 320 91 0 91 53 144
1996 141 96 8 237 134 0 134 41 175
1997 35 7 17 42 61 9 70 28 98
1998 39 122 33 161 72 4 76 21 97
1999 77 643 31 720 104 2 106 8 114
2000 206 405 38 611 59 0 59 12 71
2001 575 1210 39 1785 45 2 47 1 48
2002 573 1067 89 1640 292 7 299 50 349
2003 561 1080 65 1641 101 68 169 30 199
2004 1062 1153 38 2215 144 41 185 43 228
2005 626 1455 173 2081 64 1 65 52 117
2006 629 538
1167 38 6 44 33 77
2007 497 599
1096 52 10 62 28 90
2008 503 509
1012 73 32 105 44 149
2009 895 994
1889 90 27 117 102 219
2010 1030 650
1680 263 47 310 85 395
2011 629 499
1128 391 13 404 114 518
2012 1019 861
1880 223 14 237 39 276
2013 558 1130
1688 216 25 241 45 286
PRE-DECIS
IONAL

June 2015 Gulf of Mexico Red Grouper
SEDAR 42 SAR Section III Assessment Process Report
29
Table 2.5.1 Number of discarded Red Grouper lengths measured in the Gulf of Mexico by year and fleet.
Number of Discard Length Measurements
Commercial Recreational
Year
Vertical
Line Longline
Total
Charterboat Headboat
Total
2005
1126 1126
2006 937 3926 4863
1058 1058
2007 2064 2931 4995
1633 1633
2008 1073 920 1993
2009 1529 6496 8025
1734 1734
2010 2980 18735 21715 2313 1592 3905
2011 5190 40572 45762 1834 1056 2890
2012 8917 12028 20945 1324 635 1959
2013 2291 22261 24552 1195 772 1967
PRE-DECIS
IONAL

June 2015 Gulf of Mexico Red Grouper
SEDAR 42 SAR Section III Assessment Process Report
30
Table 2.6.1 Fishery-independent standardized indices of abundance and associated log-scale standard
errors for the Gulf of Mexico Red Grouper. The indices are scaled to a mean of one over each respective
time series.
Fishery-Independent Indices
Year
Combined
Video
NMFS Bottom
Longline
SEAMAP
Groundfish
Index SE Index SE Index SE
1993 0.7660 0.1634
1994 1.0119 0.1660
1995 1.0444 0.1890
1996 0.9761 0.1354
1997 1.1872 0.1042
1998
1999
2000
2001
0.6445 0.2868
2002 1.1571 0.1082
2003
0.8907 0.2003
2004 1.3156 0.0979 1.4493 0.1906
2005 1.0877 0.0809 0.5438 0.3892
2006 0.9176 0.0812 0.4974 0.3767
2007 0.5652 0.1132 0.7700 0.4413
2008 0.6947 0.0962 0.5298 0.3132
2009 0.8743 0.0724 0.8180 0.2587 1.4703 0.2646
2010 1.1093 0.0632 1.1009 0.2597 0.9486 0.2701
2011 1.2464 0.0506 2.0208 0.1799 0.9334 0.2890
2012 1.0255 0.0600 1.8742 0.2503 0.9518 0.2514
2013 1.0211 0.0741 0.8606 0.2980 0.6959 0.2831
PRE-DECIS
IONAL

June 2015 Gulf of Mexico Red Grouper
SEDAR 42 SAR Section III Assessment Process Report
31
Table 2.6.2. Fishery-dependent standardized indices of abundance and associated log-scale standard
errors for Gulf of Mexico Red Grouper. The indices are scaled to a mean of one over each respective
time series.
Fishery-Dependent Indices
Year
Commercial
Vertical Line
Commercial
Longline
Recreational
MRFSS
Recreational
Headboat
Index SE Index SE Index SE Index SE
1986
1.0925 0.2752 1.0334 0.6450
1987
0.8681 0.3258 1.6494 0.5837
1988
1.1339 0.3675 1.6056 0.5734
1989
1.3293 0.3179 1.5487 0.5934
1990
1.5569 0.2834 0.6990 0.6698
1991
1.4756 0.3589 0.4941 0.7086
1992
1.2438 0.3113 0.4723 0.7077
1993 0.7311 0.3042 0.9785 0.0535 0.7682 0.3662 0.6343 0.6513
1994 0.7160 0.3006 0.7235 0.0474 0.8707 0.3448 0.5523 0.6713
1995 0.7886 0.3041 0.7742 0.0491 0.8627 0.3396 0.8352 0.6310
1996 0.4907 0.3126 1.0397 0.0513 0.5555 0.3998 0.4933 0.6856
1997 0.5647 0.3132 0.9069 0.0428 0.5467 0.4064 0.4750 0.6884
1998 0.5185 0.3119 0.9552 0.0441 0.6533 0.3583 0.5671 0.6762
1999 0.7399 0.3059 0.9968 0.0438 0.7350 0.3378 0.4741 0.6845
2000 0.9911 0.2987 0.8980 0.0465 0.8305 0.3295 0.5944 0.6754
2001 1.3470 0.2904 1.0563 0.0447 0.6524 0.3360 0.8726 0.6229
2002 1.3871 0.2900 1.0600 0.0471 0.7901 0.3281 0.8929 0.6086
2003 0.9471 0.2859 0.9284 0.0453 0.9794 0.3142 1.4145 0.5301
2004 1.2740 0.2810 1.1124 0.0440 1.2459 0.2753 2.1247 0.4972
2005 1.4169 0.2828 1.4437 0.0455 0.8296 0.3100 2.3719 0.4915
2006 1.1435 0.2862 1.0927 0.0435 0.4391 0.3920 0.8687 0.6264
2007 1.2066 0.2834 0.7796 0.0502 0.6953 0.3325 0.9534 0.6002
2008 1.5309 0.2819 1.1811 0.0496 1.1731 0.2788 0.8800 0.6073
2009 1.2061 0.2816 1.0731 0.0730 1.5401 0.2685 0.6800 0.6245
2010
1.1744 0.2759 1.1157 0.5603
2011
1.3397 0.2742 1.0953 0.5353
2012
1.1216 0.2744 1.4104 0.5064
2013
1.4966 0.3006 1.1915 0.5479
PRE-DECIS
IONAL

June 2015 Gulf of Mexico Red Grouper
SEDAR 42 SAR Section III Assessment Process Report
32
Table 2.7.1 Number of Red Grouper lengths measured in the Gulf of Mexico by year and survey.
Number of Measured Lengths
Year
Combined
Video
SEAMAP
Groundfish
NMFS
Bottom Longline
Total
Fishery-Ind.
1996
10 10
1997
6 6
1998
7 7
1999
1 1
2000
26 26
2001
79 79
2002
16 16
2003
162 162
2004
170 170
2005
32 32
2006
32 32
2007
51 51
2008 32 33 31 96
2009 99 298 64 461
2010 48 187 81 316
2011 116 114 312 542
2012 105 151 111 367
2013 39 72 47 158
2014
24 24
PRE-DECIS
IONAL

June 2015 Gulf of Mexico Red Grouper
SEDAR 42 SAR Section III Assessment Process Report
33
2.10 Figures
Figure 2.1.1 Von Bertalanffy growth relationship recommended by the Data Workshop (blue diamond)
compared to the relationship used in the SS model (green triangle). The von Bertalanffy parameters
using constant CV were: Linf = 82.89 cm, K = 0.125, and t0 = -1.20. The parameters using increasing CV
with age were: Linf = 82.72 cm, K = 0.124, and t0 = -1.26. After adjusting to account for peak spawning
on May 15th
the parameters were, Linf = 82.72 cm, K = 0.124, and t0 = -0.89.
0
20
40
60
80
0 2 4 6 8 10 12 14 16 18 20
Fork
len
gth
(cm
)
Age (year)
CV Constant
CV increases
CV increases, adjusted for peak spawning
PRE-DECIS
IONAL

June 2015 Gulf of Mexico Red Grouper
SEDAR 42 SAR Section III Assessment Process Report
34
Figure 2.1.2 Recommended age-specific natural mortality vector and upper and lower range
recommended by the Data Workshop. The standard deviation (±5 years) at age for the maximum age
(29 years) was used to calculate the upper and lower range for natural mortality. The target mortality
was 0.14.
Figure 2.1.3 Proportion mature at age.
0
0.1
0.2
0.3
0.4
0.5
0.6
0.7
0.8
0 2 4 6 8 10 12 14 16 18 20 22 24 26 28
Mort
ality
Age (year)
Target M
Natural Mortality
Max Age + std dev
Max age - St dev
0.00
0.20
0.40
0.60
0.80
1.00
1.20
0 5 10 15 20 25
Pro
port
ion
Matu
re
Age (year)
PRE-DECIS
IONAL

June 2015 Gulf of Mexico Red Grouper
SEDAR 42 SAR Section III Assessment Process Report
35
Figure 2.1.4 Proportion female at age.
Figure 2.1.5 Batch fecundity at age.
0.00
0.10
0.20
0.30
0.40
0.50
0.60
0.70
0.80
0.90
1.00
0 5 10 15 20 25
Pro
port
ion
Fem
ale
Age (year)
0
500
1000
1500
2000
2500
3000
3500
4000
0 5 10 15 20 25
Ba
tch
Fec
un
dit
y
Age (year)PRE-DECIS
IONAL

June 2015 Gulf of Mexico Red Grouper
SEDAR 42 SAR Section III Assessment Process Report
36
Figure 2.1.6. Fecundity at age equal to proportion mature * proportion female * batch fecundity.
Figure 2.2.1 Red Grouper commercial landings from the U.S. Gulf of Mexico in metric tons gutted weight
from 1880-2013.
0
1,000
2,000
3,000
4,000
5,000
La
nd
ing
s in
met
ric
ton
s (g
utt
ed w
eig
ht)
Year
Total Commercial Vertical Line Longline
Trap Other Cuban Vertical Line
PRE-DECIS
IONAL

June 2015 Gulf of Mexico Red Grouper
SEDAR 42 SAR Section III Assessment Process Report
37
Figure 2.2.2 Red Grouper recreational landings from the U.S. Gulf of Mexico in thousands of fish from
1945-2013.
Figure 2.3.1 Red Grouper commercial discards from the U.S. Gulf of Mexico in thousands of fish from
1990-2013.
0
100
200
300
400
500
600
700
800
900
Lan
din
gs
in t
ho
usa
nd
s of
fish
Year
Total Recreational Charterboat & Private Private
Charterboat Headboat Shore
0
500
1,000
1,500
2,000
2,500
3,000
3,500
4,000
4,500
Dis
card
s in
th
ou
san
ds
of
fis
h
Year
Total Commercial Vertical Line Longline Trap
PRE-DECIS
IONAL

June 2015 Gulf of Mexico Red Grouper
SEDAR 42 SAR Section III Assessment Process Report
38
A.
B.
Figure 2.3.2. Comparison of Red Grouper landings compiled for SEDAR 42 and landings calculated as:
observer reported Red Grouper kept rate*effort reported in coastal logbook. A. Vertical line landings
compared. B. Bottom longline landings compared. Landings from trip ticket data are in blue.
Calculated landings are in red.
0
5
10
15
20
25
30
1990 1995 2000 2005 2010 2015
Millio
ns
of
po
un
ds
gu
tted
wei
gh
t
Year
Vertical Line Landings - Trip Ticket Vertical Line Landings - Obs. Calculated
0.0
0.5
1.0
1.5
2.0
2.5
3.0
3.5
4.0
4.5
1990 1995 2000 2005 2010 2015
Milli
on
sof
po
un
ds
gu
tted
wei
gh
t
Year
Longline Landings - Trip Ticket Longline Landings - Obs. Calculated
PRE-DECIS
IONAL
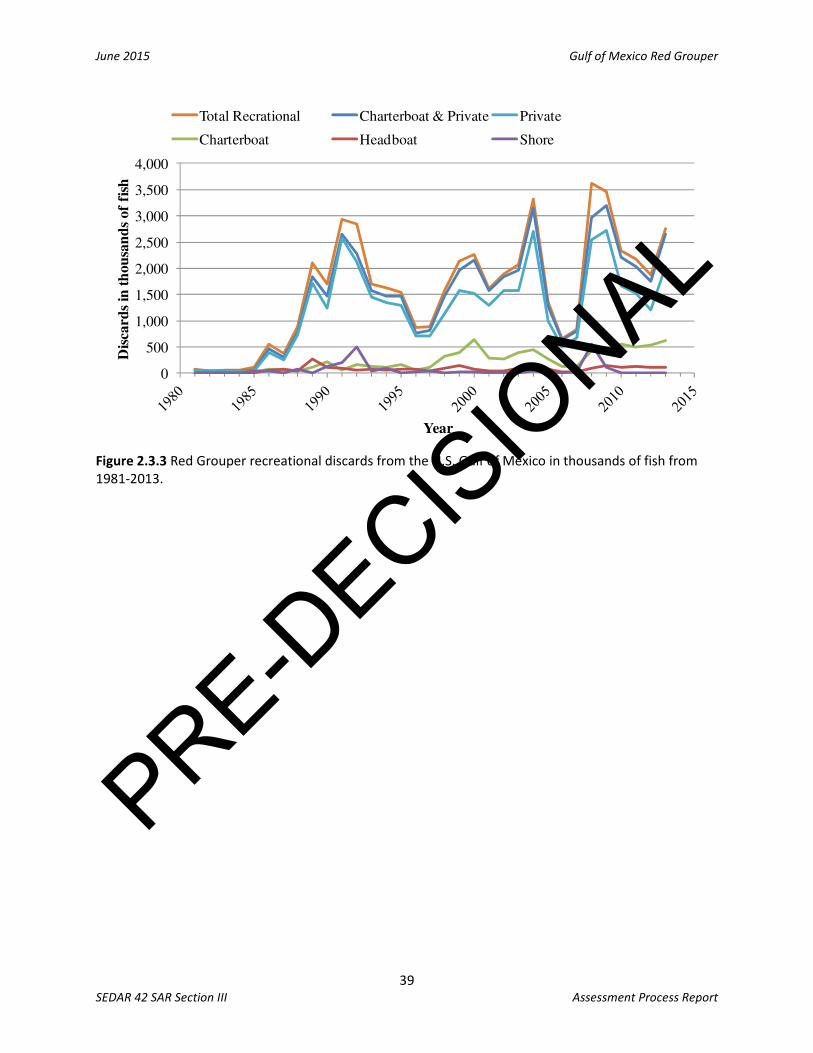
June 2015 Gulf of Mexico Red Grouper
SEDAR 42 SAR Section III Assessment Process Report
39
Figure 2.3.3 Red Grouper recreational discards from the U.S. Gulf of Mexico in thousands of fish from
1981-2013.
0
500
1,000
1,500
2,000
2,500
3,000
3,500
4,000
Dis
card
s in
th
ou
san
ds
of
fish
Year
Total Recrational Charterboat & Private Private
Charterboat Headboat Shore
PRE-DECIS
IONAL
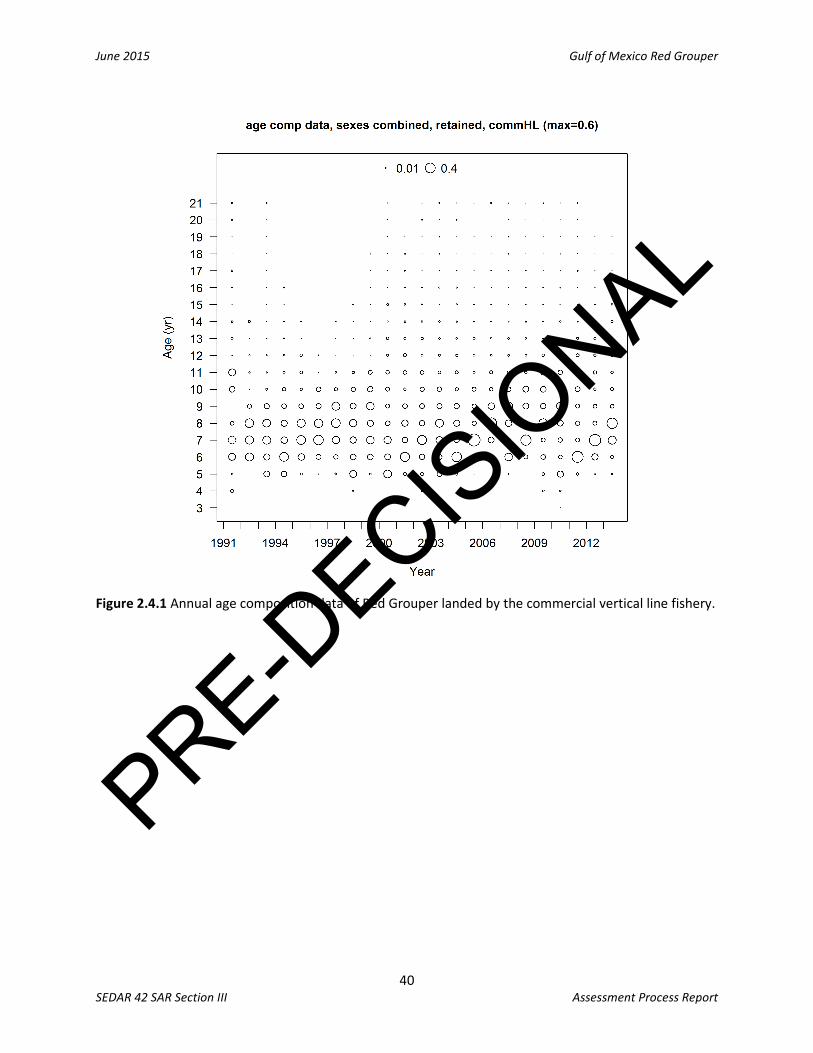
June 2015 Gulf of Mexico Red Grouper
SEDAR 42 SAR Section III Assessment Process Report
40
Figure 2.4.1 Annual age composition data of Red Grouper landed by the commercial vertical line fishery.
PRE-DECIS
IONAL

June 2015 Gulf of Mexico Red Grouper
SEDAR 42 SAR Section III Assessment Process Report
41
Figure 2.4.2 Annual age composition data of Red Grouper landed by the commercial longline fishery.
PRE-DECIS
IONAL

June 2015 Gulf of Mexico Red Grouper
SEDAR 42 SAR Section III Assessment Process Report
42
Figure 2.4.3 Annual age composition data of Red Grouper landed by the commercial trap fishery.
PRE-DECIS
IONAL

June 2015 Gulf of Mexico Red Grouper
SEDAR 42 SAR Section III Assessment Process Report
43
Figure 2.4.4 Annual age composition data of Red Grouper landed by the recreational combined
charterboat and private fishery.
PRE-DECIS
IONAL

June 2015 Gulf of Mexico Red Grouper
SEDAR 42 SAR Section III Assessment Process Report
44
Figure 2.4.5 Annual age composition data of Red Grouper landed by the recreational headboat fishery.
PRE-DECIS
IONAL

June 2015 Gulf of Mexico Red Grouper
SEDAR 42 SAR Section III Assessment Process Report
45
Figure 2.5.1 Annual length composition data of Red Grouper discarded by the commercial vertical line
fishery. The y-axis represents fork length of Red Grouper in centimeters.
PRE-DECIS
IONAL

June 2015 Gulf of Mexico Red Grouper
SEDAR 42 SAR Section III Assessment Process Report
46
Figure 2.5.2 Annual length composition data of Red Grouper discarded by the commercial longline
fishery. The y-axis represents fork length of Red Grouper in centimeters.
PRE-DECIS
IONAL
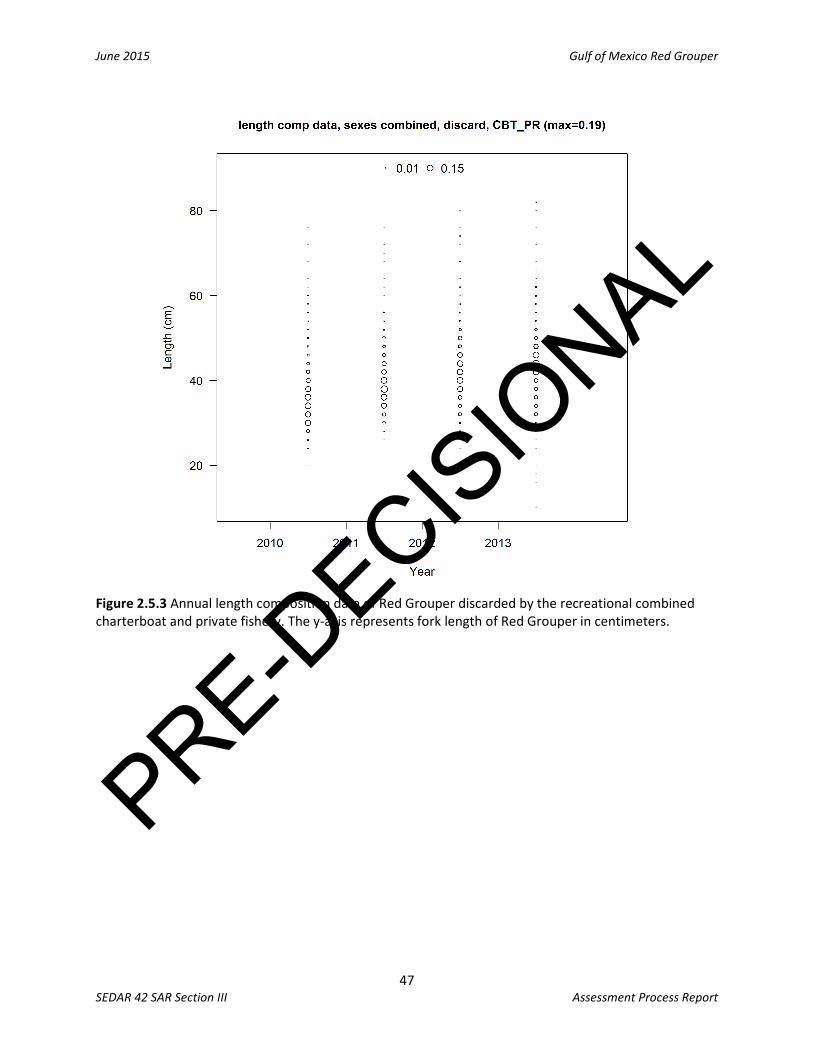
June 2015 Gulf of Mexico Red Grouper
SEDAR 42 SAR Section III Assessment Process Report
47
Figure 2.5.3 Annual length composition data of Red Grouper discarded by the recreational combined
charterboat and private fishery. The y-axis represents fork length of Red Grouper in centimeters.
PRE-DECIS
IONAL

June 2015 Gulf of Mexico Red Grouper
SEDAR 42 SAR Section III Assessment Process Report
48
Figure 2.5.4 Annual length composition data of Red Grouper discarded by the recreational headboat
fishery. The y-axis represents fork length of Red Grouper in centimeters.
PRE-DECIS
IONAL

June 2015 Gulf of Mexico Red Grouper
SEDAR 42 SAR Section III Assessment Process Report
49
Figure 2.6.1 Standardized indices of abundance and the associated log-scale standard errors from the
Gulf of Mexico SEAMAP groundfish survey. The index is scaled to a mean of one over the time series and
was derived using the number of Red Grouper per trawl hour.
Figure 2.6.2 Standardized indices of abundance and the associated log-scale standard errors from the
Gulf of Mexico NMFS bottom longline survey. The index is scaled to a mean of one over the time series
and was derived using the number of Red Grouper per 100 hook hours.
-0.5
0
0.5
1
1.5
2
2.5
3
Ind
ex
Year
SEAMAP Groundfish
-0.5
0
0.5
1
1.5
2
2.5
3
Ind
ex
Year
NMFS Bottom Longline
PRE-DECIS
IONAL

June 2015 Gulf of Mexico Red Grouper
SEDAR 42 SAR Section III Assessment Process Report
50
Figure 2.6.3 Standardized indices of abundance and the associated log-scale standard errors from the
combined the Gulf of Mexico combined SEAMAP, Panama City and FWRI video survey. The index is
scaled to a mean of one over the time series and was derived using the minimum count (maximum
number of individuals in the field of view at one instance) of Red Grouper per 20 minute recording.
Figure 2.6.4 Standardized indices of abundance and the associated log-scale standard errors from the
Gulf of Mexico vertical line commercial fishery. The index is scaled to a mean of one over the time series
and was derived using the pounds of Red Grouper per number of hook hours.
-0.5
0
0.5
1
1.5
2
2.5
3
Ind
ex
Year
Combined Video
-0.5
0
0.5
1
1.5
2
2.5
3
Ind
ex
Year
Commercial Vertical Line
PRE-DECIS
IONAL

June 2015 Gulf of Mexico Red Grouper
SEDAR 42 SAR Section III Assessment Process Report
51
Figure 2.6.5 Standardized indices of abundance and the associated log-scale standard errors from the
Gulf of Mexico longline commercial fishery. The index is scaled to a mean of one over the time series
and was derived using the pounds of Red Grouper per number of hooks fished.
Figure 2.6.6 Standardized indices of abundance and the associated log-scale standard errors from the
Gulf of Mexico charterboat and private boat recreational fishery. The index is scaled to a mean of one
over the time series and was derived using the number of Red Grouper per angler hour.
-0.5
0
0.5
1
1.5
2
2.5
3
Ind
ex
Year
Commercial Longline
-0.5
0
0.5
1
1.5
2
2.5
3
Ind
ex
Year
Recreational Charterboat and Private
PRE-DECIS
IONAL

June 2015 Gulf of Mexico Red Grouper
SEDAR 42 SAR Section III Assessment Process Report
52
Figure 2.6.7 Standardized indices of abundance and the associated log-scale standard errors from the
Gulf of Mexico headboat recreational fishery. The index is scaled to a mean of one over the time series
and was derived using the number of Red Grouper per angler hour.
-0.5
0
0.5
1
1.5
2
2.5
3
Ind
ex
Year
Recreational Headboat
PRE-DECIS
IONAL

June 2015 Gulf of Mexico Red Grouper
SEDAR 42 SAR Section III Assessment Process Report
53
Figure 2.7.1 Annual length composition data of Red Grouper observed in the Combined Video survey.
PRE-DECIS
IONAL

June 2015 Gulf of Mexico Red Grouper
SEDAR 42 SAR Section III Assessment Process Report
54
Figure 2.7.2 Annual length composition data of Red Grouper observed in the SEAMAP groundfish
survey.
PRE-DECIS
IONAL
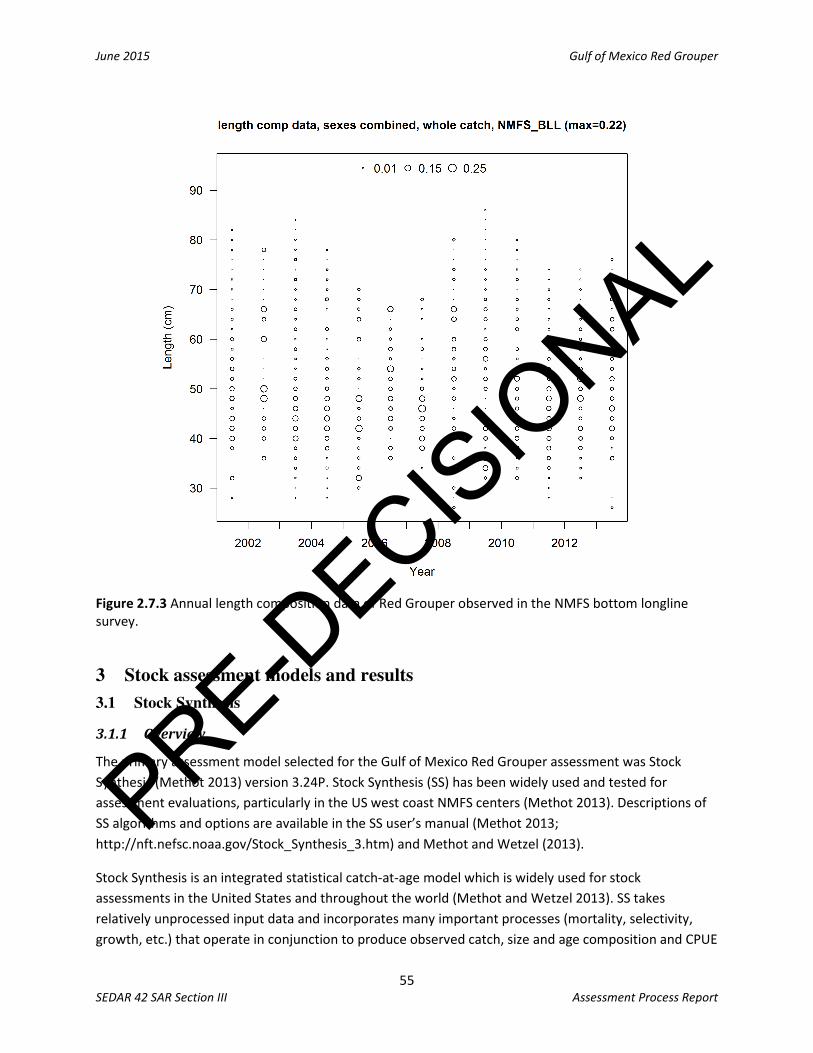
June 2015 Gulf of Mexico Red Grouper
SEDAR 42 SAR Section III Assessment Process Report
55
Figure 2.7.3 Annual length composition data of Red Grouper observed in the NMFS bottom longline
survey.
3 Stock assessment models and results
3.1 Stock Synthesis
3.1.1 Overview
The primary assessment model selected for the Gulf of Mexico Red Grouper assessment was Stock
Synthesis (Methot 2013) version 3.24P. Stock Synthesis (SS) has been widely used and tested for
assessment evaluations, particularly in the US west coast NMFS centers (Methot 2013). Descriptions of
SS algorithms and options are available in the SS user’s manual (Methot 2013;
http://nft.nefsc.noaa.gov/Stock_Synthesis_3.htm) and Methot and Wetzel (2013).
Stock Synthesis is an integrated statistical catch-at-age model which is widely used for stock
assessments in the United States and throughout the world (Methot and Wetzel 2013). SS takes
relatively unprocessed input data and incorporates many important processes (mortality, selectivity,
growth, etc.) that operate in conjunction to produce observed catch, size and age composition and CPUE
PRE-DECIS
IONAL

June 2015 Gulf of Mexico Red Grouper
SEDAR 42 SAR Section III Assessment Process Report
56
indices. Because many of these inputs are correlated, the concept behind SS is that they should be
modeled together, which helps to ensure that uncertainties in the input data are properly accounted for
in the assessment. SS is comprised of three sub-models: 1) a population sub-models that recreates an
estimate of the numbers/biomass at age using estimates of natural mortality, growth, fecundity, etc.; 2)
an observational sub-model that consists of observed (measured) quantities such as CPUE or proportion
at length/age; and 3) a statistical sub-model that uses likelihoods to quantify the fit of the observations
to the recreated population.
3.1.2 Data sources
The data sources used in the assessment model are described in Section 2. Figure 3.1.1 illustrates the
data sources and their corresponding temporal scale. The Stock Synthesis data file is included in
Appendix A.
3.1.3 Model configuration and equations
Life history
Growth rates were estimated externally from the model and a single growth curve was estimated for
both sexes. The growth curve was modeled using the von Bertalanffy equation. The parameterization
of von Bertalanffy included two additional parameters used to describe the variability in size-at-age.
These parameters represent the CV in size-at-age at the minimum (age 1) and maximum (age 20) ages.
Models testing the variance structure were compared; they assumed either constant standard deviation
at age, constant CV at age, linear increase in CV with age, or linear increase in CV with length. AIC
results indicated that assuming a linear increase in CV with length best described the data. The growth
parameter estimates were used as fixed inputs in the SS3 model.
Growth within SS was modeled with a three parameter von Bertalanffy equation (Lmin, Lmax, and K). In
SS, when fish recruit at the real age of 0.0 they have a body size equal to the lower limit of the first
population bin (Lbin; fixed at 2 cm FL). Fish then grow linearly until they reach a real age equal to the
input value of Amin (growth age for Lmin) and have a size equal to the Lmin. As they age further, they
grow according to the von Bertalanffy growth equation. Lmax was specified as equivalent to Linf. Two
additional parameters are used to describe the variability in size-at-age; these parameters represent the
CV in length-at-age at Amin (age 1) and Amax (age 20). For intermediate ages a linear interpolation of
the CV on mean size-at-age is used. The three parameters of the von Bertalanffy equation (Lmin, Lmax,
and K) were fixed in the SS model (Table 3.1.1). The CVs for length-at-age were input as fixed
parameters at 0.144 and 0.165 for age-1 and age-20 fish, respectively (Table 3.1.1). A fixed length-
weight relationship was used to convert body length (cm) to body weight (kg) (Table 3.1.1).
The natural mortality rate (M) was assumed constant over time, but decreasing with age. The form of M
as a function of age was based on Lorenzen (2005). The Data Workshop life history working group
recommended using a base M = 0.144 y-1, which was developed using the relationship between
maximum age (29) and M (Hoenig 1983). The age-specific natural mortality vector developed at the
Data Workshop was input into SS as a fixed vector (Table 2.1.1). The Data Workshop life history working
group recommended sensitivity runs where the natural mortality vector was adjusted by the base M,
PRE-DECIS
IONAL

June 2015 Gulf of Mexico Red Grouper
SEDAR 42 SAR Section III Assessment Process Report
57
where base M was adjusted by the standard deviation in the maximum age (29 + 5). Figure 2.1.2
illustrates the base natural mortality values and the sensitivities.
Red Grouper are protogynous hermaphrodites (female at birth, then a portion of the population
transitions to male). Hermaphroditism was accounted for implicitly in the fecundity vector in the model.
Fecundity was modeled as the product of batch fecundity, the proportion of mature Red Grouper, and
the proportion of female Red Grouper (Figure 2.1.6). Immature females transitioned to mature females
based on a logistic function of age (Figure 2.1.4). Mature females transitioned to mature males based on
a fixed logistic function of age (Figure 2.1.3). In previous Gulf of Mexico assessments of Red Grouper, the
form of reproductive potential used in the assessment model was spawning stock biomass of females
(SSB-female), based upon a female maturity function, a sex-transition function, and average gonad
weight-at-age. The SEDAR 42 life history working group indicated that batch fecundity was a better
proxy for fecundity than gonad weight because “the variation in gonad weight, even when classified by
stage of development is quite large due to the temporal changes in oocyte size affecting gonad weight”.
As such, batch fecundity was used in this assessment.
Stock-recruitment model
The Beverton-Holt stock-recruitment model was used in this assessment. Three parameters of the stock
recruitment relationship were estimated in the model; the log of unexploited equilibrium recruitment
(Ln(R0)), an offset parameter for initial equilibrium recruitment relative to virgin recruitment log(R1) and
the steepness (h) parameter. The steepness parameter describes the fraction of the unexploited recruits
produced at 20% of the equilibrium spawning biomass level. A fourth parameter representing the
standard deviation in recruitment (σR) was also estimated.
Annual deviations from the stock-recruit function were estimated for an early period (prior to 1986) and
a later data-rich period (1986-2012). Stock Synthesis follows cohorts through time so it was assumed
that the age composition data provided some indication of early recruitment. Early recruitment was
estimated as far back as 1969. The central tendency that penalizes the log (recruitment) deviations for
deviating from zero was assumed to sum to zero over each of the two estimated periods. Stock
Synthesis assumes a lognormal error structure for recruitment. Therefore, expected recruitments were
bias adjusted. Methot and Taylor (2011) recommend that the full bias adjustment only be applied to
data-rich years in the assessment. This is done so Stock Synthesis will apply the full bias-correction only
to those recruitment deviations that have enough data to inform the model about the full range of
recruitment variability (Methot 2011). Full bias adjustment was used from 1986 to 2012. Bias
adjustment was phased in from no bias adjustment to full bias adjustment in 1986 linearly. Bias
adjustment was phased out over the last year, decreasing from full bias adjustment to no bias
adjustment.
Starting conditions
The starting year of the assessment model is 1986. Removals of Red Grouper are known to have
occurred in the Gulf of Mexico prior to 1986, so the stock was not assumed to be at equilibrium at the
PRE-DECIS
IONAL

June 2015 Gulf of Mexico Red Grouper
SEDAR 42 SAR Section III Assessment Process Report
58
start of the model. Estimates of Red Grouper removals prior to 1986 were provided at the Data
Workshop. Estimates were reconstructed back to 1880. An initial step in transitioning the read grouper
assessment to SS3 was to develop a model with the same start year as the previous assessment and
ensure its stability. Model runs starting in 1880 were shown to the Assessment Workshop panel;
however, this was not done for the resulting base model. Anomalous recruitment events were
predicted by the preliminary model runs; thus, the panel recommended starting the model in 1986.
Starting the assessment model in 1986 requires the estimation of initial conditions. These initial
conditions include estimates of equilibrium catch and fishing mortality. Equilibrium catch is the catch
taken from a stock for which removals and natural mortality are balanced by stable recruitment and
growth. This equilibrium catch can be used to estimate the initial fishing mortality rates in the
assessment model. Not fitting to the equilibrium catch is equivalent to estimating the catch and
therefore the initial fishing mortality rates (Fs) that best correspond to the data during the dynamic
period. Equilibrium catches and fishing mortalities for all fleets were estimated in this assessment. In
addition, early recruitment deviations were estimated prior to the data-rich period to allow the initial
population to better match composition information available at the start of the dynamic period of the
model.
Fleet structure and indices of abundance
The assessment model includes five fishing fleets. The fleets represent the commercial handline,
commercial longline, commercial trap, the recreational headboat, and the combined recreational
charterboat and private fisheries. The previous assessment used the same fleet structure except the
recreational fleets were aggregated and modeled as a single recreational fleet.
The assessment model includes seven indices of abundance. The four fishery-dependent indices include
the commercial handline (commHL), the commercial longline (commLL), the headboat (HB), and the
charter-private mode (CBT_PR) indices (Figures 2.6.4 – 2.6.7). These indices were modeled as landings
indices with the exception of the charter-private index. The charter-private index of abundance
included discards and as such was treated as a total catch index. The three fishery-independent indices
include the combined SEAMAP/PC Lab/FWRI video survey (video), the SEAMAP summer groundfish
survey (SEAMAP-GF), and the NMFS bottom-longline survey (NMFS-BLL) (Figures 2.6.1 – 2.6.3). The
SEAMAP-GF and NMFS-BLL indices were not used in the previous assessment.
Selectivity and retention distributions
Age-based selectivity functions were specified for the commercial and recreational fleets, whereas
length-based selectivity functions were specified for the fishery-independent surveys. Selectivity
patterns represent the probability of capture for a given gear and are used to model not only gear
function but fishery availability (spatial patterns of fish and fishers) by spatially stratified fisheries.
The age-based selectivities were modeled using the random walk function in SS3. This function models
the selectivity of each age as a random walk of the previous age. The first two ages (age-0 and age-1)
were fixed parameters; the parameters associated with all other ages were estimated. A normal prior
PRE-DECIS
IONAL

June 2015 Gulf of Mexico Red Grouper
SEDAR 42 SAR Section III Assessment Process Report
59
was used to penalize the random walk between ages. The assumed distribution of the penalty for age-2
through age-11 was ~ N(0.25) and for age-12 through age-20 was ~ N(0, 0.1).
The functional form of the double normal curve was used in this assessment to approximate selectivity
patterns for the fishery-independent surveys. The double normal selectivity pattern is described by two
adjacent normal distributions. Each has its own variance term and the two are joined by a horizontal
line. This selectivity pattern is described by six parameters, all of which were estimated.
Selectivity patterns were assumed to be constant over time for each fishery and survey. The Red
Grouper fishery has experienced changes in management regulation over time, which were assumed to
influence the discard patterns more so than selectivity. As such, these changes were accounted for in
the model using time-varying retention patterns and modeling discards explicitly.
Changes in the management regulations for the commercial fleets includes the implementation of a 20
inch total length (50.8 cm TL, 48.80 cm FL) size limit from 1990 until 2008. The commercial size limit was
reduced to 18 inches TL (45.7 cm TL, 43.97 cm FL) in 2009. The reduction in the commercial size limit
was followed by the implementation of the individual fishing quota (IFQ) program in 2010. The
retention patterns were assumed to change with the changes in the size limit. Retention is modeled as a
logistic function with size in SS3. Four parameters describe this function; the inflection point, the slope,
the asymptote, and the male offset inflection, which is not applicable to this model and assumed to be
zero.
The retention pattern associated with the 1990-2008 time block and 20 inch TL commercial size limit
was assumed to be knife-edge at the size limit where 100% of individuals were retained above the size
limit (Figure 3.1 2 - Figure 3.1 4). This was the assumed relationship for the commercial trap fleet since
its discard observations only pertain to this time block. The parameters describing the retention pattern
for the commercial handline and longline fleets associated with the 2009-2013 time block and 18 inch TL
commercial size limit were freely estimated given that the majority of discard length composition data
corresponded to this time block (Figure 3.1 2 - Figure 3.1 3).
The recreational fishery has also experienced changes in management regulations. An 18 inch TL size
limit (43.97 cm FL) was implemented in Florida state waters prior to 1990. Similar to the commercial
fishery, a 20 inch TL size limit ( 50.8 cm FL) was implemented in federal waters starting in 1990 until
present. The retention pattern for the 1986-1989 time block and 18 inch TL size limit in FL state waters
was assumed to be knife-edge at the size limit where 100% of individuals were retained above the size
limit (Figure 3.1 5Figure 3.1 6). The parameters describing the retention pattern associated with the
1990-2013 time block and 20 inch TL recreational size limit in Federal waters were freely estimated
(Figure 3.1 5Figure 3.1 6).
Accounting for mortality due to red tide
The Assessment Panel recommended the continued consideration of a mortality event associated with
the 2005 red tide on the West Florida Shelf in the assessment model. The model configuration used to
make management recommendations in the previous assessment (SEDAR 2006) and update (SEDAR
PRE-DECIS
IONAL

June 2015 Gulf of Mexico Red Grouper
SEDAR 42 SAR Section III Assessment Process Report
60
2009) included the 2005 red tide event by estimating an extra mortality term, Mrt, in 2005. By including
red tide mortality, the model was better able to explain the sudden declines in abundance indices
between 2005 and 2006. The point estimate for Mrt was applied to all ages in the model in 2005 and was
assumed constant with age. Two alternative approaches for incorporating red tide mortality were
evaluated using the SS model built to mimic the previous assessment model. The objective was to
incorporate red tide mortality into SS such that it would provide similar model predictions as the ASAP
model.
The first approach used to incorporate red tide mortality involved adding a constant M deviate to all 21
age classes. This approach is similar to the approach used in ASAP; however, SS does not have the
capability of estimating a constant deviate to be added to all ages. Instead, natural mortality was
modeled as a vector of age-specific natural mortality and then a fixed deviate was added to each age-
specific M solely in 2005. Two fixed deviates were considered within the SS model: (1) the point
estimate of extra mortality from the ASAP assessment model (Mrt = 0.2548) (SEDAR 2009) and (2) the
point estimate that was best supported by the data and was determined using likelihood profiling in SS.
The second approach evaluated for incorporating red tide mortality used a red tide fishing fleet to
model removals of Red Grouper from red tide. For this pseudo-fishery, all fish encountered were
discarded with 100% mortality and therefore no catches were required as input. An index of fishing
effort for the red tide fleet was based on the Walter Threshold Index (Walter et al. 2013), a binary index
where red tide events were depicted as present (= 1, solely in 2005) or absent (= 0) between 1998 and
2010 based on the predicted probability of a severe red tide bloom. This threshold index was extended
to include 2011 through 2013 (= 0) based on evidence of no severe red tides during these years from
both field observations and modeling approaches. This index assumed that negative effects, i.e., red tide
mortality, only occurred under severe red tide events. Baseline levels of red tide are likely already
accounted for within estimates of natural mortality derived from empirical data. A catchability
parameter (Q) was estimated to scale the fishing mortality rate. No discards were input into the model;
instead the model used information from data sources already in the model to scale red tide removals.
Selectivity of the red tide fishing fleet was set to 1 for age-0 through age-20 and was assumed constant
at age due to the lack of available data on size-specific red tide mortality.
The Assessment Panel decided to use this approach (red tide fishing fleet) as the central approach for
incorporating red tide mortality. This approach gave similar results as the approach that used a fixed
constant Mrt applied to all ages (Table 3.1.2, Figure 3.1.7). However, the red tide fishing fleet allows for
the level of mortality to be estimated by the assessment model rather than input as a fixed parameter.
This configuration should lead to a better representation of model uncertainty to the 2005 red tide
mortality event.
3.1.4 Estimated parameters
A total of 331 parameters were estimated for the base case model (Table 3.1.1). Of the 331 parameters,
151 were fleet specific fishing mortality rates. The remaining 180 estimated parameters include 125
PRE-DECIS
IONAL

June 2015 Gulf of Mexico Red Grouper
SEDAR 42 SAR Section III Assessment Process Report
61
used to estimate selectivity and retention curves, 28 annual recruitment deviations, 1 catchability
parameter used to scale the red tide mortality index, and 5 initial fishing mortality rates.
Table 3.2.1 includes predicted parameter values and their associated standard errors from SS, initial
parameter values, and minimum and maximum values a parameter could take. Parameters designated
as fixed were held at their initial values. Steepness was estimated in the base model using a symmetrical
beta prior; the mean and standard deviation associated with this parameter was taken from the SEDAR
update assessment and is in line with the recommendation of 0.84 by Shertzer et al. (2012). Normal
priors were used to penalize the random walk. Parameter bounds were selected to be sufficiently wide
to avoid truncating the searching procedure during maximum likelihood estimation. The soft bounds
option in SS was utilized when fitting the assessment model. This option creates a weak symmetric beta
penalty on selectivity parameters to move parameters away from the bounds (Methot 2011).
3.1.5 Model Convergence
Model convergence was evaluated using jitter analysis. The jitter analysis perturbs the initial values so
that a broad range of parameter values along the likelihood surface are used as starting values. This
ensures that the model converged to a global solution rather than a local minima. Starting values of all
estimated parameters were randomly perturbed by 10% and 50 trials were run. A total of 28 runs
converged on a solution that was within 2 likelihood units of the base case (Table 3.1.3). A total of 42
out of 50 runs converged on a solution which provided similar levels (within 5%) of ending depletion and
spawning biomass. While this test cannot prove convergence of the model, it did not provide any
evidence to the contrary.
3.1.6 Uncertainty and Measures of Precision
Uncertainty in parameter estimates and derived quantities was evaluated using multiple approaches.
First, uncertainty in parameter estimates was quantified by computing asymptotic standard errors for
each parameter (Table 3.1.1). Asymptotic standard errors are calculated by inverting the Hessian matrix
(i.e., the matrix of second derivatives of the likelihood with respect to the parameters) after the model
fitting process. Asymptotic standard errors are based upon the model’s analytical estimate of the
variance near the converged solution.
Likelihood profiles were completed for five model parameters: steepness of the stock-recruit
relationship (h), the log of unexploited equilibrium recruitment (R0), the standard deviation in
recruitment (σR), the offset parameter for initial equilibrium recruitment relative to virgin recruitment
log(R1), and the last parameter describing the double normal distribution for the selectivity of the NMFS
bottom longline survey. Likelihood profiles are commonly used to elucidate conflicting information
among various data sources, to determine how asymmetric the likelihood surfaces surrounding point
estimates may be, and to provide an additional evaluation of how precisely parameters are being
estimated.
PRE-DECIS
IONAL
June 2015 Gulf of Mexico Red Grouper
SEDAR 42 SAR Section III Assessment Process Report
62
3.1.7 Sensitivity analysis
Uncertainty in data inputs and model configuration was examined through sensitivity analyses. The
models reported in this section are by no means a comprehensive evaluation of all possible aspects of
model uncertainty, nor do they reflect the full range of models considered in developing the base case.
These scenarios are intended to provide more information about sensitivity to key model parameters
and potential conflict in signal among data sources. The order in which they are presented is not
intended to reflect their importance; each run included here provided important information for
developing or evaluating the base case model and alternate states of nature.
Steepness
Steepness is generally a one of the most uncertain but critical parameters estimated in a stock
assessment model. In this assessment model, a symmetric beta prior centered at 0.83 and with a
standard deviation of 1 on steepness was used. This was an informative prior, as the model tended to
estimate steepness at 0.99 when the prior was removed. Given the information provided by the prior
about steepness and the model’s tendency to estimate steepness at 0.99 two fixed values of steepness
were evaluated: a lower value of 0.65 (Run 1) and an upper value of 0.98 (Run 2).
Natural mortality
Model sensitivity to the specification of the natural mortality rate was evaluated. The natural mortality
rate (M) was assumed constant over time, but decreasing with age. The form of M as a function of age
was based on Lorenzen (2005). The central model uses a base M = 0.144 y-1 .The Data Workshop life
history working group recommended two sensitivity runs where the natural mortality vector was
adjusted by the base M. More specifically, they recommended that the base M be adjusted assuming
higher or lower maximum age where the maximum age was varied by the standard deviation around the
maximum age of 29 (+/- 5 or 24-34) and the Hoenig (1983) estimator of M used for the base M in the
scaled Lorenzen functions (Figure 2.1.2).
Discards
The absolute magnitude of the commercial discards from 1993 to 2005 is a source of uncertainty in this
assessment model. As such, fairly large CVs were put on the total commercial discards. The model’s
sensitivity to discard weighting was evaluated in two ways. The first was to upweight all discards (Run 5).
The second was to remove the discards from 1993-2005, allow them to be estimated given the retention
patterns and upweight the 2006-2013 discards (Run 6).
Selectivity pattern of the NMFS bottom longline survey
During the assessment webinars the assessment panel discussed the shape of the NMFS bottom longline
selectivity pattern. More specifically, it was suggested that the selectivity of this survey be fixed as
asymptotic. The assessment panel was not in total agreement about this and it was decided to allow the
model to freely estimate the NMFS bottom longline selectivity parameters for the base case. As such, a
PRE-DECIS
IONAL
June 2015 Gulf of Mexico Red Grouper
SEDAR 42 SAR Section III Assessment Process Report
63
sensitivity fixing the NMFS bottom longline selectivity as asymptotic was evaluated as a sensitivity run
(Run 7).
Jack-knife analysis
The final set of sensitivity runs was used to evaluate the model sensitivity to each of the indices of
abundance. A jack-knife approach was used where each index of abundance was removed from the
model and then the model was refit to the remaining data.
3.1.8 Retrospective analysis
Retrospective analysis was conducted to assess the consistency of stock assessment results by
sequentially eliminating a year of data from the terminal year while using the same model configuration.
The results of this analysis were useful in assessing potential biases and uncertainty in terminal year
estimates.
3.1.9 Benchmarks/reference points
Various stock status benchmarks and reference points are calculated in SS. The user can select reference
points based on maximum sustainable yield (MSY), equilibrium spawning biomass per recruit (SPR), and
spawning stock biomass (SSB). Stock Synthesis calculates SPR as the ratio of the equilibrium
reproductive output per recruit that would occur with the current year’s F intensities and biology, to the
equilibrium reproductive output per recruit that would occur with the current year’s biology and no
fishing. For SPR-based reference points, SS searches for an F that will produce the specified level of
spawning biomass per recruit relative to the unfished value. For spawning biomass-based reference
points, SS searches for an F that produces the specified level of spawning biomass relative to the
unfished value. Both MSY and spawning biomass-based reference points are dependent on the stock-
recruit relationship. YPR and SPR fishing mortality reference points can be calculated independent of the
stock-recruit relationship.
The Assessment Workshop panel for SEDAR 42 recommended using MSY-based reference points (i.e.,
Fmsy) to determine stock status, which is similar to the recommendation from the previous Red
Grouper Assessment (SEDAR 2006). MSY-based reference points were recommended because an
informative prior on steepness was used, which informed the stock-recruit relationship. The panel also
discussed the appropriate units of SSB. The frame of reference for this discussion was Brooks et al.
(2008). Brooks et al. (2008) conducted a simulation study evaluating various SSB approaches and stock
assessment performance given uncertainties regarding loss of males and reduced fertility. They
concluded that the SSB-female approach best estimates biological reference points if the potential for
decreased fertilization is weak. Brooks et al. (2008) determined SSB-combined is best when the potential
for decreased fertility is moderate or unknown. The Assessment Workshop panel recommended that
SSB-female to be used when calculating SSB, where the unit of SSB was the number of eggs. This
recommendation was made given that the sex ratio of Red grouper, ~28% male, was relatively high
reducing concerns about reduced fertilization. The Assessment Workshop panel also recommended
that this decision be revisted by the Review Workshop Panel and the Science and Statistical Committee
(SSC).
PRE-DECIS
IONAL

June 2015 Gulf of Mexico Red Grouper
SEDAR 42 SAR Section III Assessment Process Report
64
3.1.10 Projections
Projections were run to evaluate stock status and associated yields for a range of fishing mortality rate
scenarios. Projections were run from 2014 to 2030 for the base model configuration . The projections
assumed current (2013) yields into the future for 2014. Projections were run assuming that selectivity,
discarding, and retention were the same as the most recent five years (2009-2013). This timeframe
corresponds to the most recent time block on retention. The catch allocation among fleets used for the
projections reflects those used for management, 76% for commercial fleet and 24% for the recreational
fleet.
Deterministic projections were run for three fishing mortality rate scenarios:
F = Fmsy,
F=Foy, where Foy is 75% of Fmsy, and
F = Fcurrent.
3.2 Model Results
3.2.1 Measures of model fit
Landings
The predicted landings fit the observed landings perfectly since SS3 effectively treats the landings as
known without error. Figure 3.2.1- Figure 3.2.5 show the precise fit of the predicted landings to the
observed landings.
Discards
The model was fit to the discards of five fleets including commercial handline, commercial longline,
commercial trap, charterboat-private, and headboat. Figure 3.2.6 - Figure 3.2.10 illustrate the model fit
to the discards. The observed discards from the commercial handline fleet have an increasing trend
between 1993 and 2009 and then decline. The model underestimated the commercial handline discards
in all years (Figure 3.2.6). The observed discards from the commercial longline fleet are relatively stable
between 1993 and 2006 and then decline. The model underestimated these discards in all years (Figure
3.2.7). The observed commercial trap discards increase between 1990 and 1996 and then generally
decline until 2006 (the last year of the fishery). The discards from this fleet are fewer than either the
commercial handline or longline discards. The model underestimated the commercial trap discards in all
years (Figure 3.2.8).
The observed charterboat-private mode discards varied over time with peaks in 1990, 2005, and 2009.
The fits to these discards were generally good, with a systematic underestimation between 2008 and
2013 (Figure 3.2.9). The observed headboat discards were also variable over time with peaks every ten
years in 1989, 1999, and 2009. The fits to the headboat discards were generally good with systematic
underestimation between 2009 and 2013 (Figure 3.2.10).
PRE-DECIS
IONAL

June 2015 Gulf of Mexico Red Grouper
SEDAR 42 SAR Section III Assessment Process Report
65
Indices of abundance
The model was fit to four fishery-dependent indices, the red tide index, and three fishery-independent
indices. Figure 3.2.11 - Figure 3.2.18 show the model fit to the standardized indices.
The model fit to the commercial handline standardized index (RMSE = 0.3097) predicted an increase in
the index between 1993 and 2005 (Figure 3.2.11). The standardized index demonstrates a general
increase during this time period, however; the main increase was between 1996 and 2005. The model fit
dampens this increase. The predicted fit follows the decline between 2005 and 2006 and predicts a
stable index between 2006 and 2009 when the observed index increases. The model fit to the
commercial longline index (RMSE= 0.1572) predicts an increase in the index between 1993 and 2005
(Figure 3.2.12). The standardized index peaked in 2005 and the model fit underestimates this peak. The
model fit also underestimates the decline in the commercial longline index between 2005 and 2007 and
instead predicts that the index between 2006 and 2009 is generally flat.
The model fit to the standardized charterboat-private (RMSE = 0.316) and headboat indices (RSME =
0.3067) are shown in Figure 3.2.13 - Figure 3.2.14. The charterboat-private standardized index
increased between 1986 and 1990, declined between 1990 and 1995, and then increased between 1986
and 2004 (Figure 3.2.13). The model fit between 1986 and 1996 is rather flat and misses the changes in
the index between 1986 and 1996. The model fit predicts the increase between 1996 and 2004,
predicting the peak in 2004 exactly. The model fit predicts the decline between 2005 and 2007 fairly
well and the following increase between 2006 and 2009. The standardized index is variable between
2010 and 2013 with an increase between 2012 and 2013. The model fit predicts a peak in 2010 followed
by a decline. The model fit to the standardized headboat index generally predicts the trends throughout
time (Figure 3.2.14). The model predicts the initial increase between 1986 and 1987, albeit an
underestimate, followed by a moderate decline between 1987 and 1989, The standardized index
exhibits a steep decline between 1989 and 1990, which is predicted by the model fit. The decline is
followed by a moderately stable period between 1990 and 2000, which is predicted by the model,
although the model overestimates the index during this time period. The standardized headboat index
increases between 2000 and 2005 when the index peaks and then steeply declines between 2005 and
2006. The model predicts an increase, but predicts the peak in 2004 followed by a predicted decline
between 2004 and 2006. The standardized index was stable between 2006 and 2010 before it exhibits
an increase to 2012 and then a decline to 2013. The model fit generally predicts this trend.
The fit to the red tide index was perfect (Figure 3.2.15).
The model fits to the standardized fishery-independent indices are shown in Figure 3.2.16 - Figure
3.2.18. The standardized video survey has a slight increasing trend between 1993 and 2004, which is
underestimated by the model fit (Figure 3.2.16). The standardized video index declines between 2004
and 2007. This decline in predicted, but the model predicts an increase after 2006 missing the lowest
point of the index in 2007. The increase in the video index between 2008 and 2010 is predicted as is the
following decline. The standardized SEAMAP groundfish summer survey (SEAMAP-GF) declines between
2009 and 2013. The model over-predicts this decline (Figure 3.2.17). The standardized NMFS bottom
PRE-DECIS
IONAL

June 2015 Gulf of Mexico Red Grouper
SEDAR 42 SAR Section III Assessment Process Report
66
longline index increased between 2001 and 2004, declined between 2004 and 2006, generally increased
between 2006 and 2010, and then declined (Figure 3.2.18). The model fit predicts a stable index
between 2001 and 2004 that declines between 2004 and 2006. It then predicts an increase between
2007 and 2010 followed by a decline. The model fit misses the peaks in 2011 and 2012 underestimating
the final decline in the index.
Length composition
The model fits to the length composition data associated with the discard series and fishery-
independent surveys and the Pearson residuals for each fleet and data type are presented in Figure
3.2.19 - Figure 3.2.32. The quality of the fit varied among the fleets and surveys.
The fit to the commercial handline and longline discard length composition was similar (Figure 3.2.19 -
Figure 3.2.22). In general, the model fit the discard length composition data relatively well. The peaks of
the distributions were underestimated between 2009 and 2011 for commercial handline and between
2010 and 2012 for commercial longline (Figure 3.2.19 - Figure 3.2.22). The Pearson residuals indicate
that there is a bit of noise in the model fit to the data for these fleets. This noise is mainly concentrated
in the upper tails of the distributions between 2007 and 2009 for the commercial handline fleet and
between 2006 and 2009 for the commercial longline fleet. These large residuals are likely due to the
underestimation of few individuals.
The model fit to the recreational discard length composition is marginal for both charterboat-private
and headboat (Figure 3.2.23 - Figure 3.2.26). The expected distributions are skewed to larger sized fish
and the peaks are generally underestimated in all years, except in 2007 for the headboat fishery. The
Pearson residuals for the recreational fleets show that there is some evidence of cohorts that are not
being accurately predicted by the model.
The model was fit to the length composition data from the three fishery independent surveys (Figure
3.2.27 - Figure 3.2.32). The model fit to these data was relatively good with Pearson residuals that did
not exhibit any systematic patterns.
Age composition
The model fits to the age data associated with the landings series and the Pearson residuals for each
fleet are presented in Figure 3.2.33 - Figure 3.2.42. The quality of the fit varies among the fleets.
The model fit to the commercial landings age composition is relatively good for the commercial handline
and slightly better for the commercial longline (Figure 3.2.33 - Figure 3.2.35). For the handline there are
years where the peaks are underestimated (e.g., 2011-2013) and years where the bimodal distribution
of the observed data is not accurately captured in the model predictions (e.g., 1991, 1998-2000, 2010).
Patterns in the Pearson residuals for the handline provide evidence that the cohorts tracked in the
observed data are not being accurately predicted (Figure 3.2.34). More specifically they seem to be
underestimated to some degree. The fit to the age composition data for longline is quite good in most
years. Similar to the handline fleet but to a lesser extent, the fit to the longline age data shows years
PRE-DECIS
IONAL

June 2015 Gulf of Mexico Red Grouper
SEDAR 42 SAR Section III Assessment Process Report
67
with underestimated peaks (e.g., 1999, 2012) and years with lack of fit to observed binomial
distributions (e.g., 1995-1996, 2001). While there are patterns in the Pearson residuals for both the
handline and longline fleets, the observable patterns for the longline fleet are less pronounced than for
the handline fleet (Figure 3.2.34 - Figure 3.2.36). The fit to the age data from the trap fishery is marginal,
and in most years the age data for the trap fishery has relatively low sample sizes (Figure 3.2.37). There
are fewer systematic patterns in the Pearson residuals fit to the trap data than in the residuals
associated with the handline and longline data (Figure 3.2.38).
The fits to the recreational discard length composition for the charterboat-private and headboat
fisheries are marginal (Figure 3.2.39 - Figure 3.2.41). In general, the recreational age composition has
relatively low samples sizes and the distributions of ages each year are irregular and jagged. The Pearson
residuals for the recreational fleets show that there is some evidence of cohorts that are not being
accurately predicted by the model, particularly for the 1998 and 2005 cohorts.
3.2.2 Parameter estimates and associated uncertainty
Table 3.1.1 summarizes the parameter estimates and the asymptotic standard errors from SS3. The
majority of parameters have relatively low standard errors. Table 3.2.1 summarizes the parameters and
their associated coefficients of variation (CVs). The parameters with larger CVs are mainly the size and
age selectivity parameters, the initial age parameters, the inflection and slope parameters describing the
charterboat-private and headboat retention patterns, and some of the main recruitment deviations (
Table 3.2.1). The size selectivity parameters had the highest uncertainty indicating that they were not
well estimated.
Likelihood profiles were generated for several key parameters in this assessment. They include
steepness (h), recruitment at an unexploited state (Ln(R0)), variation in recruitment (σR), the offset in
recruitment from unexploited equilibrium (Ln(R1_offset)), and the parameter describing selectivity of
the final population length bin for the NMFS bottom longline survey. This was done to evaluate how well
estimated these parameters are and to identify conflicts in the data.
The likelihood profile of the steepness parameter shows that there are conflicts between data sources
(Figure 3.2.43). The obvious conflict is between the length composition data and the recruitment,
discard, and index information. Less obvious is the conflict between the age data and the recruitment,
discard, and index information. The length and age data components favor a smaller steepness value,
whereas the recruitment, discard and catch components favor a higher steepness value.
The total likelihood component from the Ln(R0) likelihood profile indicates that the global solution for
this parameter is approximately 9.5 (Figure 3.2.44). The recruitment likelihood component is the largest
component of the total dictating this outcome. The data conflicts are seemingly minimal, but the length
and prior components are in conflict with the other components, favoring a lower Ln(R0) estimate.
The likelihood profile on the variation in recruitment parameter, σR, indicates that all likelihood
components favor an estimate of larger than 0.5, which is considerably larger than the previous
assessment (Figure 3.2.45). The previous assessment estimated σR to be ~ 0.3.
PRE-DECIS
IONAL

June 2015 Gulf of Mexico Red Grouper
SEDAR 42 SAR Section III Assessment Process Report
68
The likelihood profile on the parameter accounting for the offset in recruitment from unexploited
equilibrium (Ln (R1_offset)) shows that the dominating influence on the likelihood is the recruitment
likelihood component (Figure 3.2.46). This likelihood component is in conflict with the other likelihood
components favoring a higher offset between the initial recruitment and recruitment at the unexploited
equilibrium. This profile also indicates that this parameter is difficult to estimate.
The likelihood profile of the parameter describing the selectivity of the final length bin of the NMFS
bottom longline selectivity pattern, indicates that this parameter cannot be well estimated (Figure
3.2.47).
3.2.3 Selectivity and retention
The estimated age-based selectivity patterns for the fishing fleets are shown in Figure 3.2.48 - Figure
3.2.53. Selectivity was assumed to be constant over time in the assessment model. All age-based
selectivity patterns were modeled as a random walk and were estimated to have a dome-shape. The
estimated selectivity patterns illustrate that the headboat and charterboat-private fleets select smaller
Red Grouper than the commercial fleets. Additionally, the age at full selection for headboat is age-3,
whereas age-7, age-8, age-9, and age-10 are fully selected for by the charterboat-private, the
commercial handline, the commercial trap, and the commercial longline fleets, respectively.
Time blocks were used to describe the retention process in response to changes in size limits over time.
Separate time blocks were used for the commercial and recreational fleets due to different
management regulations. The first time block used for the commercial fleets corresponds to the 20 in
TL (50.8 cm TL and 48.79 cm FL) size limit. The parameters describing this retention function were fixed
given that there were few years of discard length composition data for this time period. The retention
function for the first time block was assumed to be knife-edged at the size limit with 100% retention of
individuals above the size limit (Figure 3.1 2 - Figure 3.1 4). The second time block corresponded to the
reduction in the commercial size limit to 18 in TL (43.97 cm FL) and the parameters were freely
estimated. The estimated inflection points were 45.46 cm FL and 46.38 cm FL, slightly higher than the
size limit, for the commercial handline and longline fleets, respectively. Both the slope and asymptote
estimates were approximately one for both fleets. Figure 3.1 2 and Figure 3.1 3 show the estimated
retention patterns for the commercial handline and longline fleets. These figures show that the majority
of retained fish are above the limit.
The retention pattern for the pre-1990 time block for the recreational fleets was a fixed, knife-edge
relationship at the 18 inch TL size limit. It was assumed that 100% of fish above the size limit were
retained. The charterboat-private and headboat retention patterns were estimated for the 1990-2013
time block. The inflection parameters were estimated to be 53.704 cm FL and 50.304 cm FL for the
charterboat-private and headboat fleets, respectively (Table 3.1.1). The slope parameter was estimated
at 0.545 for the charterboat-private fleet and 0.319 for the headboat fleet. The asymptote parameter
was estimated at 0.833 for the charterboat-private fleet and 0.972 for the headboat fleet. The
charterboat-private inflection point is slightly larger than the 20 in TL (50.8 cm FL) size limit. The
retention patterns allow for the discarding of legal size Red Grouper due to the combination of the slope
and asymptote parameters (Figure 3.1 5 - Figure 3.1 6).
PRE-DECIS
IONAL

June 2015 Gulf of Mexico Red Grouper
SEDAR 42 SAR Section III Assessment Process Report
69
The fishery-independent surveys selectivity patterns were length-based and estimated using the double
normal function. Figure 3.2.54 shows the estimated selectivity patterns for the three fishery-
independent surveys. The video survey selectivity pattern was estimated to be essentially asymptotic,
where Red Grouper are fully selected above 50 cm (Figure 3.2.55). The SEAMAP-GF selectivity pattern
was estimated to be dome-shaped, where the pattern increases to full selection sharply between 15 cm
FL and 18 cm FL and are fully selected between 18 cm FL and 30 cm FL (Figure 3.2.56). The NMFS_BLL
longline survey selectivity pattern was estimated to be dome-shaped, but was essentially asymptotic
over the range of observed sizes in the length composition data (Figure 3.2.57).
The Assessment Workshop panel discussed whether the selectivity pattern for the NMFS bottom
longline should be fixed as an asymptotic relationship. Support for fixing this relationship to asymptotic
was that the fishing gear captures a wide range of sizes and covers a wide distribution of the West
Florida shelf where Red Grouper of all sizes should be available for capture. Additionally, as seen in the
profiles explained in Section 3.2.2, the parameter that was fixed to ensure asymptotic selectivity was not
well estimated from the data. Nonetheless, the Assessment Workshop panel decided to allow the
selectivity parameters to be freely estimated because the assessment outcomes were similar between
the model where the NMFS bottom longline selectivity pattern was freely estimated and the model that
assumed asymptotic selectivity. The reason for the relatively minor differences between these two
states was that there were very few fish in the population above the 100 cm where the selectivity was
estimated to decline and these differences in estimation of the bottom longline selectivity had relatively
minor effects upon the estimation of the selectivities of the other fleets.
3.2.4 Recruitment
The three leading parameters for defining the stock-recruitment relationship were steepness (h), virgin
recruitment (R0), and an offset parameter for initial equilibrium recruitment relative to virgin
recruitment Ln (R1). Steepness was estimated with a symmetric beta prior centered at 0.83 and the
other parameters were estimated without priors (Table 3.1.1). Steepness was estimated at 0.802 for
the base model. The log of virgin recruitment was estimated at 9.67 (15,835,350 age-0 recruits). The R1
offset parameter was estimated at -0.048, which suggests the stock was at 95% of virgin recruitment
(R1=R0*exp(-Ln(R1_offset)) when the model starts in 1986.
The plot of the stock-recruitment relationship shows high recruitment associated with years 1995, 1998,
2001, and 2005 (Figure 3.2.58). This agrees with the cohort structure seen in the age composition data
associated with landings for fishing fleets (Figure 3.2.33, Figure 3.2.35, Figure 3.2.39, Figure 3.2.41).Both
high and low levels of recruitment are predicted across the range of spawning biomass values, resulting
in a relatively flat stock-recruit relationship.
The likelihood profile for steepness shows that the most likely solution is near 0.8 (Figure 3.2.43). This
profile is driven by reductions in the likelihood components for recruitment, discards, and indices. The
likelihood profile of equilibrium recruitment shows that this parameter is well estimated (Figure 3.2.44).
The recruitment component of the likelihood seems to be the most influential dataset for informing
PRE-DECIS
IONAL

June 2015 Gulf of Mexico Red Grouper
SEDAR 42 SAR Section III Assessment Process Report
70
unfished recruitment. The likelihood profile for the offset parameter for initial equilibrium recruitment
relative to virgin recruitment log(R1) shows that this parameter is not well estimated (Figure 3.2.46).
Predicted age-0 recruits are presented in Figure 3.2.59 and Table 3.2.2. Average recruitment is variable
over time. The higher average recruitments are generally preceded and followed by relatively low
average recruitments. The RMSE for recruitment deviations was 1.03. The age composition data
provides evidence of strong year classes moving through the different fisheries. Recruitment in 2005 is
predicted to be the highest recruitment over the time series. Age-0 recruitments in the six most recent
years are predicted to be relatively low.
3.2.5 Stock biomass
Predicted total biomass and spawning output in eggs are summarized in Table 3.2.2 and Figure 3.2.60 -
Figure 3.2.61 for the base model configuration. Total biomass generally increased from 1986 until 2005,
declined in 2006, and increased from 2006 to 2013 (Figure 3.2.60). The decline in 2006 is associated with
the red tide event in 2005. The trend seen in total biomass is also evident in the predicted spawning
output time-series (Figure 3.2.61).
The predicted numbers-at-age and mean age is presented in Figure 3.2.62. The predicted numbers-at-
age indicate that two strong recruitment events were predicted in 1998 and 2005. Mean age varied
between two and three between 1986 and 1996. The mean age declined from three to one in 1997 and
then varied between one and three between 1998 and 2003. Mean age increased to four in 2003 and
then declined to one in 2005 when there was a strong recruitment event (Figure 3.2.59). Predicted
mean age steadily increased to five between 2004 and 2013 (Figure 3.2.62).
The trend in the numbers-at-length and mean length is obviously similar to the predicted numbers-at-
age and mean age (Figure 3.2.63). Mean length varied between 20 cm FL and approximately 35 cm FL
between 1986 and 2004. Mean length declined in 2005 and then steadily increased to approximately 40
cm FL.
3.2.6 Fishing mortality
The overall fishing mortality rate was expressed as exploitation rate in biomass. Fleet specific fishing
mortalities are presented as instantaneous rates. The predicted fishing mortalities overall and by fleet
are presented in Table 3.2 3 and Figure 3.2.64- Figure 3.2.65. Predicted total fishing mortality declined,
on average, between 1986 and 2004. The highest predicted fishing mortality rate was in 2005, which is
the year of the red tide event in the eastern Gulf of Mexico (Figure 3.2.64). This red tide event was
modeled as a fishing fleet that removed Red Grouper. Its effect was not seen in the landings history, but
rather, it was seen as a discard fishery and caused a substantial increase in total catch in 2005 (Figure
3.2.66). The estimated mortality rate from the red tide event was 0.44. Fishing mortality declined in
2006 and continued to do so until 2010, the lowest point of the time series. This decline was followed
by an increase in total fishing mortality.
Early in the time series the main sources of fishing mortality were the commercial longline and
handlines fleets and the charterboat-private fleet (Figure 3.2.65). The commercial handline fishing
PRE-DECIS
IONAL

June 2015 Gulf of Mexico Red Grouper
SEDAR 42 SAR Section III Assessment Process Report
71
mortality declined after 1989 until 1999, remained relatively low and lower than that of the charterboat
and private and longline fleets until 2005, increased until 2009 and then declined (Figure 3.2.65). The
fishing morality rate of the charterboat-private declined after 1993 until 1997, increased after 1997 until
2000, and then generally declined over the rest of the time period, with a final increase between 2011
and 2013 (Figure 3.2.65). The fishing mortality trends for the commercial handline and charterboat-
private fleets are similar to the trends in observed landings. The fishing mortality from the commercial
longline fleet has generally declined since 1993 (Figure 3.2.65). Unlike the commercial handline and
charterboat-private fleets, this trend in fishing mortality cannot be explained by the trend in landings,
which has remained relatively stable over time. Rather this decline in fishing mortality may be better
explained by the decline in commercial longline discards (Figure 3.2.7).
The fishing mortalities associated with the commercial trap fleet and headboat fleet were relatively low
over time compared to the other fleets (Figure 3.2.65). This corresponds to relatively low landings and
discards over time (Figure 3.2.66).
3.2.7 Sensitivity analysis
The results of the sensitivity analyses are summarized in Table 3.2.5 and Figure 3.2.67 - Figure 3.2.73.
Steepness
The absolute magnitude of SSB, recruitment and fishing mortality rate seemed insensitive to the
assumed values of steepness (Figure 3.2.71). Nonetheless, stock status estimates will likely be affected
by different fixed values of steepness.
Natural mortality
The assessment results seemed most sensitive to the assumed natural mortality vector (
Figure 3.2.70). Estimates of SSB and age-0 recruits were higher than the base when natural mortality
was larger and lower when natural mortality was smaller. Fishing mortality was lower than the base
when natural mortality was larger and was higher when natural mortality was small than base.
Total discards
The assessment results were relatively insensitive to the data weighting of the total discards (Figure
3.2.72)
Selectivity of NMFS bottom longline survey
The assessment results seemed insensitive to the assumption of asymptotic selectivity for the NMFS
bottom longline survey (Figure 3.2.73).
Jack-knife of indices
The results of the jack-knife analysis are summarized in Table 3.2. 6 and Figure 3.2.74 - Figure 3.2.76.
PRE-DECIS
IONAL

June 2015 Gulf of Mexico Red Grouper
SEDAR 42 SAR Section III Assessment Process Report
72
The jack knife analysis of the abundance indices revealed that the model was sensitive to the
charterboat-private index and the headboat index. This sensitivity is most obvious when comparing the
SSB estimates. Removal of the charterboat-private index exaggerated the increase in SSB in 2005,
whereas the removal of the headboat index reduced the absolute estimate of SSB in 2005. This was also
true for the fishing mortality estimates. The fits to these indices were similar when comparing the
RMSEs, 0.316 and 0.3067 for the charterboat-private fleet and headboat fleet, respectively.
The estimate of the age-0 recruits, especially in the last 4-5 years of the model seemed sensitive to the
SEAMAP groundfish index. This makes intuitive sense since this index can be considered as a
recruitment index and only covers the last five years of the model.
3.2.8 Retrospective results
The results from the retrospective analysis are summarized in Figure 3.2.77 - Figure 3.2.80. There were
no major patterns or systematic bias in the spawning stock biomass, the fishing mortality, or the ratio of
SSB and SSB achieved at MSY. The retrospective pattern in the recruits was highly variable for the years
prior to the SEAMAP survey, but largely indicative of random fluctuations in the estimates of
recruitment in years prior to having a recruitment index. This variability in recruitment does not
translate to substantial retrospective bias in SSB (Figure 3.2.79).
3.2.9 Benchmark and reference points
Stock status relative to the minimum stock size threshold (MSST) and maximum fishing mortality
threshold (MFMT) are presented in Table 3.2.2 and Figures 3.2.81 – 3.2.82. The comparison of SSB and
MSST indicates that Red Grouper were overfished between 1986 and 1996 since spawning stock
biomass was below MSST (Figure 3.2.81). Spawning stock biomass has been above the MSST since 1997.
The comparison of fishing mortality and MFMT indicates that Red Grouper experienced overfishing
between 1986 and 1995 and did not experience overfishing between 1996 and 2013, except for 2000
and 2005 (Figure 3.2.82).
Estimates of yield per recruit and spawner per recruit are summarized in Figure 3.2.84.
3.2.10 Projections
Three projection scenarios were run where fishing mortality was equal to either Fmsy, Foy (i.e., 75% of
Fmsy), or Fcurrent. Figure 3.2.83 summarizes the results with respect to the ratio between SSB and the
minimum stock size threshold (MSST), age-0 recruits, the ratio between fishing mortality and Fmsy, and
retained yield. The ratio between SSB and MSST is projected to decline between 2014 and 2018 and
then increase and equilibrate between 2019 and 2030. The ratio between SSB and MSST is projected to
drop below 1 (i.e., the stock is expected to be overfished) between 2018 and 2019 when fishing
mortality was set equal to Fmsy and be above 1 in all other years. The ratio between fishing mortality
and the maximum fishing mortality threshold (MFMT) was projected to increase between 2014 and
2017 and be greater than 1 (i.e., the stock is projected to experience overfishing), decline below 1 after
2017, and equilibrate at sustainable levels between 2024 and 2030. The projections have similar trends
under the Foy and Fcurrent fishing mortality scenarios as the Fmsy scenario, but the stock is not
PRE-DECIS
IONAL

June 2015 Gulf of Mexico Red Grouper
SEDAR 42 SAR Section III Assessment Process Report
73
expected to be overfished over experience overfishing during the projection period. Retained yield was
projected to equilibrate between 2025 and 2030 at ~3700 mt, ~3500 mt, and ~3300 mt for the Fmsy,
Foy, and Fcurrent fishing mortality scenarios (Table 3.2.7).
3.3 Discussion and recommendations
3.3.1 Discussion
The assessment model predicts that total biomass and the spawning potential (egg production)
increased from 2006 to 2012 and declined slightly between 2012 and 2013 (Figure 3.2.60, Figure 3.2.61).
The predicted biomass in 2006 was at a record low due to the red tide event in 2005 and has increased
since. In 2005, a large recruitment event was predicted, which may help explain the predicted increase
in total biomass and spawning output (Figure 3.2.59). This large recruitment event was supported by the
age composition data, which does not suggest subsequent strong year classes (Figure 2.4.1 – Figure
2.4.5).
Overall, total biomass increased between 1986 and 2005. This corresponded to a period of decline in
predicted fishing mortality. The fishing mortality rate since 2005 has remained low suggesting that
biomass has had the opportunity to accumulate between 2006 and 2012. Biomass is 2013 is similar to
biomass in 2012.
3.3.2 Recommendations
1. Evaluate existing methods for deriving historical discard numbers and discard rates and improve
methods as appropriate.
2. Develop/evaluate methods to maintain continuity of fishery-dependent indices in light of
management regulations and ITQs.
3. Considering red tide is an unpredictable event, but can be a significant source of mortality, a response
protocol should be developed for data collection and incorporation of the information into updated
assessments.
4. The start year of this assessment is 1986. Future assessments should investigate extending the
assessment model further back in time.
5. Develop protocol for reliable estimation of fishery discards.
3.4 Acknowledgements
Many people from state and federal agencies worked diligently to assemble the data included in this
stock assessment and the Data Workshop Panel was incredibly helpful with addressing the issues and
nuances of the data. The Assessment Panel, as well as scientists from the Sustainable Fisheries Division
at the Southeast Fisheries Science Center were instrumental in guiding the stock assessment model
configuration.
3.5 References
PRE-DECIS
IONAL

June 2015 Gulf of Mexico Red Grouper
SEDAR 42 SAR Section III Assessment Process Report
74
Brooks, E.N., K.W. Shertzer, T. Gedamke, and D.S. Vaughan. 2008. Stock assessment of protogynous fish:
evaluating measures of spawning biomass used to estimate biological reference points. Fish Bull. U.S.
106:12-28.
SEDAR. 2006. SEDAR 12 Stock Assessment Report Gulf of Mexico Red Grouper. 358 pp.
SEDAR. 2009. Stock assessment of Red Grouper in the Gulf of Mexico - SEDAR Update Assessment.
143pp.
Shertzer, K.W., Conn, P.B. 2012. Spawner-recruit relationships of demersal marine fishes:Prior
distribution of steepness. Bulletin of Marine Science 88(1): 39-50.
Walter, J., M.C. Christman, J.H. Landsberg, B. Linton, K. Steidinger, R. Stumpf, and J. Tustison. 2013.
Satellite derived indices of red tide severity for input for Gulf of Mexico Gag grouper stock
assessment. SEDAR33-DW08. 43 pp.
PRE-DECIS
IONAL

June 2015 Gulf of Mexico Red Grouper
SEDAR 42 SAR Section III Assessment Process Report
75
3.6 Tables
Table 3.1.1 List of SS parameters for Gulf of Mexico Red Grouper. The list includes predicted parameter
values and their associated standard errors from the base model run, initial parameter values, lower and
upper bounds of the parameters, and the prior densities assigned to the parameters. Parameters
designated as fixed were held at their initial values.
Predicted Prior
Label
Lower
bound
Upper
bound Value SD Type Value SD Status
L_at_Amin_Fem_GP_1 1 40 17.29 _ No_prior
Fixed
L_at_Amax_Fem_GP_1 60 100 82.72 _ No_prior
Fixed
VonBert_K_Fem_GP_1 0.05 0.3 0.124 _ No_prior
Fixed
CV_young_Fem_GP_1 1.00E-06 0.2 0.144 _ No_prior
Fixed
CV_old_Fem_GP_1 1.00E-06 0.2 0.165 _ No_prior
Fixed
Wtlen_1_Fem -3 3 0.000 _ No_prior
Fixed
Wtlen_2_Fem -3 4 3.250 _ No_prior
Fixed
Mat50%_Fem 1 10 2.8 _ No_prior
Fixed
Mat_slope_Fem -30 3 -1.15 _ No_prior
Fixed
Eggs_scalar_Fem -3 3 4.47E-08 _ No_prior
Fixed
Eggs_exp_len_Fem -3 3 5.48 _ No_prior
Fixed
RecrDist_GP_1 -4 4 0 _ No_prior
Fixed
RecrDist_Area_1 -4 4 0 _ No_prior
Fixed
RecrDist_Seas_1 -4 4 0 _ No_prior
Fixed
CohortGrowDev 0.5 1.5 1 _ No_prior
Fixed
SR_LN(R0) 1 40 9.670 0.126 No_prior
Estimated
SR_BH_steep 0.2 0.99 0.802 0.132 Sym_Beta 0.83 1 Estimated
SR_sigmaR 0 2 0.965 0.117 No_prior
Estimated
SR_envlink -5 5 0.000 _ No_prior
-
SR_R1_offset -5 5 -0.048 0.123 No_prior
Estimated
SR_autocorr 0 0 0.000 _ No_prior
-
Early_InitAge_17 _ _ 0.185 1.052
Estimated
Early_InitAge_16 _ _ 0.249 1.081
Estimated
Early_InitAge_15 _ _ 0.331 1.116
Estimated
Early_InitAge_14 _ _ -0.037 0.957
Estimated
Early_InitAge_13 _ _ -0.266 0.869
Estimated
Early_InitAge_12 _ _ -0.431 0.813
Estimated
Early_InitAge_11 _ _ -0.633 0.765
Estimated
Early_InitAge_10 _ _ -0.761 0.730
Estimated
Early_InitAge_9 _ _ -0.727 0.712
Estimated
Early_InitAge_8 _ _ -0.567 0.709
Estimated
Early_InitAge_7 _ _ -0.254 0.731
Estimated
Early_InitAge_6 _ _ 0.133 0.739
Estimated
Early_InitAge_5 _ _ 0.717 0.457
Estimated
PRE-DECIS
IONAL

June 2015 Gulf of Mexico Red Grouper
SEDAR 42 SAR Section III Assessment Process Report
76
Table 3.1.1. Continued
Predicted Prior
Label
Lower
bound
Upper
bound Value SD Value SD Status Value
Early_InitAge_4 _ _ 0.063 0.603
Estimated
Early_InitAge_3 _ _ -0.176 0.485
Estimated
Early_InitAge_2 _ _ 0.670 0.187
Estimated
Early_InitAge_1 _ _ 0.309 0.193
Estimated
Main_RecrDev_1986 _ _ 0.706 0.132
Estimated
Main_RecrDev_1987 _ _ -0.495 0.285
Estimated
Main_RecrDev_1988 _ _ 0.947 0.108
Estimated
Main_RecrDev_1989 _ _ 0.704 0.118
Estimated
Main_RecrDev_1990 _ _ 0.160 0.170
Estimated
Main_RecrDev_1991 _ _ 0.017 0.180
Estimated
Main_RecrDev_1992 _ _ -0.188 0.182
Estimated
Main_RecrDev_1993 _ _ 0.666 0.108
Estimated
Main_RecrDev_1994 _ _ -1.118 0.380
Estimated
Main_RecrDev_1995 _ _ 1.190 0.083
Estimated
Main_RecrDev_1996 _ _ -0.353 0.189
Estimated
Main_RecrDev_1997 _ _ -1.383 0.404
Estimated
Main_RecrDev_1998 _ _ 1.867 0.071
Estimated
Main_RecrDev_1999 _ _ -0.333 0.278
Estimated
Main_RecrDev_2000 _ _ -0.759 0.355
Estimated
Main_RecrDev_2001 _ _ 1.252 0.099
Estimated
Main_RecrDev_2002 _ _ -0.841 0.307
Estimated
Main_RecrDev_2003 _ _ 0.430 0.118
Estimated
Main_RecrDev_2004 _ _ -2.499 0.521
Estimated
Main_RecrDev_2005 _ _ 2.206 0.100
Estimated
Main_RecrDev_2006 _ _ 0.897 0.113
Estimated
Main_RecrDev_2007 _ _ 0.804 0.124
Estimated
Main_RecrDev_2008 _ _ 0.016 0.166
Estimated
Main_RecrDev_2009 _ _ -0.282 0.150
Estimated
Main_RecrDev_2010 _ _ -0.619 0.170
Estimated
Main_RecrDev_2011 _ _ -1.418 0.234
Estimated
Main_RecrDev_2012 _ _ -0.893 0.237
Estimated
Main_RecrDev_2013 _ _ -0.682 0.450
Estimated
InitF_1commHL 0 1 0.097 0.018 No_prior
Estimated
InitF_2commLL 0 1 0.142 0.030 No_prior
Estimated
InitF_3commTrap 0 1 0.025 0.006 No_prior
Estimated
InitF_4CBT_PR 0 1 0.104 0.011 No_prior
Estimated
InitF_5HB 0 1 0.012 0.001 No_prior
Estimated
InitF_6RedTide 0 1 0.000 _ Normal 0.01 0.1 -
F_fleet_1_YR_1986_s_1 0 8 0.198 0.026
Estimated
PRE-DECIS
IONAL

June 2015 Gulf of Mexico Red Grouper
SEDAR 42 SAR Section III Assessment Process Report
77
Table 3.1.1. Continued
Predicted Prior
Label
Lower
bound
Upper
bound Value SD Value SD Status Value
F_fleet_1_YR_1987_s_1 0 8 0.154 0.018
Estimated
F_fleet_1_YR_1988_s_1 0 8 0.116 0.012
Estimated
F_fleet_1_YR_1989_s_1 0 8 0.241 0.020
Estimated
F_fleet_1_YR_1990_s_1 0 8 0.194 0.017
Estimated
F_fleet_1_YR_1991_s_1 0 8 0.146 0.013
Estimated
F_fleet_1_YR_1992_s_1 0 8 0.094 0.008
Estimated
F_fleet_1_YR_1993_s_1 0 8 0.086 0.008
Estimated
F_fleet_1_YR_1994_s_1 0 8 0.082 0.007
Estimated
F_fleet_1_YR_1995_s_1 0 8 0.065 0.006
Estimated
F_fleet_1_YR_1996_s_1 0 8 0.043 0.004
Estimated
F_fleet_1_YR_1997_s_1 0 8 0.046 0.004
Estimated
F_fleet_1_YR_1998_s_1 0 8 0.035 0.003
Estimated
F_fleet_1_YR_1999_s_1 0 8 0.058 0.005
Estimated
F_fleet_1_YR_2000_s_1 0 8 0.083 0.008
Estimated
F_fleet_1_YR_2001_s_1 0 8 0.076 0.007
Estimated
F_fleet_1_YR_2002_s_1 0 8 0.073 0.008
Estimated
F_fleet_1_YR_2003_s_1 0 8 0.049 0.005
Estimated
F_fleet_1_YR_2004_s_1 0 8 0.052 0.006
Estimated
F_fleet_1_YR_2005_s_1 0 8 0.050 0.006
Estimated
F_fleet_1_YR_2006_s_1 0 8 0.062 0.005
Estimated
F_fleet_1_YR_2007_s_1 0 8 0.074 0.008
Estimated
F_fleet_1_YR_2008_s_1 0 8 0.087 0.010
Estimated
F_fleet_1_YR_2009_s_1 0 8 0.117 0.012
Estimated
F_fleet_1_YR_2010_s_1 0 8 0.061 0.007
Estimated
F_fleet_1_YR_2011_s_1 0 8 0.059 0.007
Estimated
F_fleet_1_YR_2012_s_1 0 8 0.053 0.007
Estimated
F_fleet_1_YR_2013_s_1 0 8 0.032 0.004
Estimated
F_fleet_2_YR_1986_s_1 0 8 0.230 0.035
Estimated
F_fleet_2_YR_1987_s_1 0 8 0.363 0.051
Estimated
F_fleet_2_YR_1988_s_1 0 8 0.194 0.023
Estimated
F_fleet_2_YR_1989_s_1 0 8 0.284 0.031
Estimated
F_fleet_2_YR_1990_s_1 0 8 0.229 0.025
Estimated
F_fleet_2_YR_1991_s_1 0 8 0.271 0.027
Estimated
F_fleet_2_YR_1992_s_1 0 8 0.233 0.024
Estimated
F_fleet_2_YR_1993_s_1 0 8 0.409 0.043
Estimated
F_fleet_2_YR_1994_s_1 0 8 0.258 0.027
Estimated
F_fleet_2_YR_1995_s_1 0 8 0.208 0.023
Estimated
F_fleet_2_YR_1996_s_1 0 8 0.204 0.021
Estimated
F_fleet_2_YR_1997_s_1 0 8 0.191 0.021
Estimated
PRE-DECIS
IONAL

June 2015 Gulf of Mexico Red Grouper
SEDAR 42 SAR Section III Assessment Process Report
78
Table 3.1.1 Continued
Predicted Prior
Label
Lower
bound
Upper
bound Value SD Value SD Status Value
F_fleet_2_YR_1998_s_1 0 8 0.154 0.016
Estimated
F_fleet_2_YR_1999_s_1 0 8 0.223 0.022
Estimated
F_fleet_2_YR_2000_s_1 0 8 0.178 0.019
Estimated
F_fleet_2_YR_2001_s_1 0 8 0.215 0.024
Estimated
F_fleet_2_YR_2002_s_1 0 8 0.192 0.023
Estimated
F_fleet_2_YR_2003_s_1 0 8 0.165 0.020
Estimated
F_fleet_2_YR_2004_s_1 0 8 0.188 0.027
Estimated
F_fleet_2_YR_2005_s_1 0 8 0.169 0.020
Estimated
F_fleet_2_YR_2006_s_1 0 8 0.173 0.022
Estimated
F_fleet_2_YR_2007_s_1 0 8 0.120 0.017
Estimated
F_fleet_2_YR_2008_s_1 0 8 0.156 0.017
Estimated
F_fleet_2_YR_2009_s_1 0 8 0.064 0.009
Estimated
F_fleet_2_YR_2010_s_1 0 8 0.075 0.010
Estimated
F_fleet_2_YR_2011_s_1 0 8 0.155 0.020
Estimated
F_fleet_2_YR_2012_s_1 0 8 0.114 0.016
Estimated
F_fleet_2_YR_2013_s_1 0 8 0.087 0.013
Estimated
F_fleet_3_YR_1986_s_1 0 8 0.053 0.009
Estimated
F_fleet_3_YR_1987_s_1 0 8 0.035 0.006
Estimated
F_fleet_3_YR_1988_s_1 0 8 0.040 0.006
Estimated
F_fleet_3_YR_1989_s_1 0 8 0.044 0.006
Estimated
F_fleet_3_YR_1990_s_1 0 8 0.034 0.004
Estimated
F_fleet_3_YR_1991_s_1 0 8 0.036 0.005
Estimated
F_fleet_3_YR_1992_s_1 0 8 0.053 0.007
Estimated
F_fleet_3_YR_1993_s_1 0 8 0.061 0.008
Estimated
F_fleet_3_YR_1994_s_1 0 8 0.077 0.010
Estimated
F_fleet_3_YR_1995_s_1 0 8 0.084 0.010
Estimated
F_fleet_3_YR_1996_s_1 0 8 0.035 0.005
Estimated
F_fleet_3_YR_1997_s_1 0 8 0.039 0.005
Estimated
F_fleet_3_YR_1998_s_1 0 8 0.016 0.002
Estimated
F_fleet_3_YR_1999_s_1 0 8 0.042 0.006
Estimated
F_fleet_3_YR_2000_s_1 0 8 0.060 0.008
Estimated
F_fleet_3_YR_2001_s_1 0 8 0.044 0.006
Estimated
F_fleet_3_YR_2002_s_1 0 8 0.056 0.008
Estimated
F_fleet_3_YR_2003_s_1 0 8 0.034 0.006
Estimated
F_fleet_3_YR_2004_s_1 0 8 0.036 0.005
Estimated
F_fleet_3_YR_2005_s_1 0 8 0.032 0.005
Estimated
F_fleet_3_YR_2006_s_1 0 8 0.030 0.005
Estimated
F_fleet_3_YR_2007_s_1 0 8 0.001 0.000
Estimated
F_fleet_3_YR_2008_s_1 _ _ 0.000 _
-
PRE-DECIS
IONAL

June 2015 Gulf of Mexico Red Grouper
SEDAR 42 SAR Section III Assessment Process Report
79
Table 3.1.1 Continued
Predicted Prior
Label
Lower
bound
Upper
bound Value SD Type Value SD Status
F_fleet_3_YR_2009_s_1 _ _ 0.000 _
-
F_fleet_3_YR_2010_s_1 _ _ 0.000 _
-
F_fleet_3_YR_2011_s_1 0 8 0.000 0.000
Estimated
F_fleet_3_YR_2012_s_1 _ _ 0.000 _
-
F_fleet_3_YR_2013_s_1 _ _ 0.000 _
-
F_fleet_4_YR_1986_s_1 0 8 0.151 0.016
Estimated
F_fleet_4_YR_1987_s_1 0 8 0.087 0.008
Estimated
F_fleet_4_YR_1988_s_1 0 8 0.193 0.018
Estimated
F_fleet_4_YR_1989_s_1 0 8 0.208 0.019
Estimated
F_fleet_4_YR_1990_s_1 0 8 0.180 0.020
Estimated
F_fleet_4_YR_1991_s_1 0 8 0.253 0.029
Estimated
F_fleet_4_YR_1992_s_1 0 8 0.408 0.044
Estimated
F_fleet_4_YR_1993_s_1 0 8 0.312 0.038
Estimated
F_fleet_4_YR_1994_s_1 0 8 0.252 0.027
Estimated
F_fleet_4_YR_1995_s_1 0 8 0.201 0.023
Estimated
F_fleet_4_YR_1996_s_1 0 8 0.083 0.010
Estimated
F_fleet_4_YR_1997_s_1 0 8 0.064 0.008
Estimated
F_fleet_4_YR_1998_s_1 0 8 0.091 0.011
Estimated
F_fleet_4_YR_1999_s_1 0 8 0.160 0.018
Estimated
F_fleet_4_YR_2000_s_1 0 8 0.272 0.035
Estimated
F_fleet_4_YR_2001_s_1 0 8 0.173 0.020
Estimated
F_fleet_4_YR_2002_s_1 0 8 0.183 0.025
Estimated
F_fleet_4_YR_2003_s_1 0 8 0.138 0.020
Estimated
F_fleet_4_YR_2004_s_1 0 8 0.242 0.032
Estimated
F_fleet_4_YR_2005_s_1 0 8 0.094 0.014
Estimated
F_fleet_4_YR_2006_s_1 0 8 0.113 0.015
Estimated
F_fleet_4_YR_2007_s_1 0 8 0.125 0.015
Estimated
F_fleet_4_YR_2008_s_1 0 8 0.113 0.016
Estimated
F_fleet_4_YR_2009_s_1 0 8 0.128 0.017
Estimated
F_fleet_4_YR_2010_s_1 0 8 0.104 0.015
Estimated
F_fleet_4_YR_2011_s_1 0 8 0.048 0.006
Estimated
F_fleet_4_YR_2012_s_1 0 8 0.096 0.014
Estimated
F_fleet_4_YR_2013_s_1 0 8 0.168 0.025
Estimated
F_fleet_5_YR_1986_s_1 0 8 0.024 0.003
Estimated
F_fleet_5_YR_1987_s_1 0 8 0.017 0.002
Estimated
F_fleet_5_YR_1988_s_1 0 8 0.019 0.002
Estimated
F_fleet_5_YR_1989_s_1 0 8 0.037 0.004
Estimated
F_fleet_5_YR_1990_s_1 0 8 0.022 0.003
Estimated
F_fleet_5_YR_1991_s_1 0 8 0.013 0.002
Estimated
PRE-DECIS
IONAL

June 2015 Gulf of Mexico Red Grouper
SEDAR 42 SAR Section III Assessment Process Report
80
Table 3.1.1 Continued
Predicted Prior
Label
Lower
bound
Upper
bound Value SD Type Value SD Status
F_fleet_5_YR_1992_s_1 0 8 0.012 0.002
Estimated
F_fleet_5_YR_1993_s_1 0 8 0.012 0.002
Estimated
F_fleet_5_YR_1994_s_1 0 8 0.012 0.002
Estimated
F_fleet_5_YR_1995_s_1 0 8 0.016 0.002
Estimated
F_fleet_5_YR_1996_s_1 0 8 0.019 0.003
Estimated
F_fleet_5_YR_1997_s_1 0 8 0.006 0.001
Estimated
F_fleet_5_YR_1998_s_1 0 8 0.006 0.001
Estimated
F_fleet_5_YR_1999_s_1 0 8 0.009 0.001
Estimated
F_fleet_5_YR_2000_s_1 0 8 0.011 0.002
Estimated
F_fleet_5_YR_2001_s_1 0 8 0.006 0.001
Estimated
F_fleet_5_YR_2002_s_1 0 8 0.005 0.001
Estimated
F_fleet_5_YR_2003_s_1 0 8 0.007 0.001
Estimated
F_fleet_5_YR_2004_s_1 0 8 0.010 0.002
Estimated
F_fleet_5_YR_2005_s_1 0 8 0.012 0.002
Estimated
F_fleet_5_YR_2006_s_1 0 8 0.006 0.001
Estimated
F_fleet_5_YR_2007_s_1 0 8 0.006 0.001
Estimated
F_fleet_5_YR_2008_s_1 0 8 0.007 0.001
Estimated
F_fleet_5_YR_2009_s_1 0 8 0.007 0.001
Estimated
F_fleet_5_YR_2010_s_1 0 8 0.005 0.001
Estimated
F_fleet_5_YR_2011_s_1 0 8 0.005 0.001
Estimated
F_fleet_5_YR_2012_s_1 0 8 0.007 0.001
Estimated
F_fleet_5_YR_2013_s_1 0 8 0.009 0.002
Estimated
F_fleet_6_YR_1986_s_1 _ _ 0.000 _
-
F_fleet_6_YR_1987_s_1 _ _ 0.000 _
-
F_fleet_6_YR_1988_s_1 _ _ 0.000 _
-
F_fleet_6_YR_1989_s_1 _ _ 0.000 _
-
F_fleet_6_YR_1990_s_1 _ _ 0.000 _
-
F_fleet_6_YR_1991_s_1 _ _ 0.000 _
-
F_fleet_6_YR_1992_s_1 _ _ 0.000 _
-
F_fleet_6_YR_1993_s_1 _ _ 0.000 _
-
F_fleet_6_YR_1994_s_1 _ _ 0.000 _
-
F_fleet_6_YR_1995_s_1 _ _ 0.000 _
-
F_fleet_6_YR_1996_s_1 _ _ 0.000 _
-
F_fleet_6_YR_1997_s_1 _ _ 0.000 _
-
F_fleet_6_YR_1998_s_1 0 8 0.000 0.000
Estimated
F_fleet_6_YR_1999_s_1 0 8 0.000 0.000
Estimated
F_fleet_6_YR_2000_s_1 0 8 0.000 0.000
Estimated
F_fleet_6_YR_2001_s_1 0 8 0.000 0.000
Estimated
F_fleet_6_YR_2002_s_1 0 8 0.000 0.000
Estimated
PRE-DECIS
IONAL

June 2015 Gulf of Mexico Red Grouper
SEDAR 42 SAR Section III Assessment Process Report
81
Table 3.1.1 Continued
Predicted Prior
Label
Lower
bound
Upper
bound Value SD Value SD Status Value
F_fleet_6_YR_2003_s_1 0 8 0.000 0.000
Estimated
F_fleet_6_YR_2004_s_1 0 8 0.000 0.000
Estimated
F_fleet_6_YR_2005_s_1 0 8 0.442 0.096
Estimated
F_fleet_6_YR_2006_s_1 0 8 0.000 0.000
Estimated
F_fleet_6_YR_2007_s_1 0 8 0.000 0.000
Estimated
F_fleet_6_YR_2008_s_1 0 8 0.000 0.000
Estimated
F_fleet_6_YR_2009_s_1 0 8 0.000 0.000
Estimated
F_fleet_6_YR_2010_s_1 0 8 0.000 0.000
Estimated
F_fleet_6_YR_2011_s_1 0 8 0.000 0.000
Estimated
F_fleet_6_YR_2012_s_1 0 8 0.000 0.000
Estimated
F_fleet_6_YR_2013_s_1 0 8 0.000 0.000
Estimated
LnQ_base_6_RedTide -15 15 0.816 0.217 No_prior
Estimated
Retain_1P_1_commHL 0 85 0.000 _ No_prior
-
Retain_1P_2_commHL 0 20 0.250 _ No_prior
-
Retain_1P_3_commHL 0 1 1.000 _ No_prior
-
Retain_1P_4_commHL -1 2 0.000 _ No_prior
-
DiscMort_1P_1_commHL -20 20 -15.000 _ No_prior
-
DiscMort_1P_2_commHL -2 2 1.000 _ No_prior
-
DiscMort_1P_3_commHL -1 2 0.190 _ No_prior
-
DiscMort_1P_4_commHL -1 2 0.000 _ No_prior
-
Retain_2P_1_commLL 0 85 0.000 _ No_prior
-
Retain_2P_2_commLL 0 20 0.250 _ No_prior
-
Retain_2P_3_commLL 0 1 1.000 _ No_prior
-
Retain_2P_4_commLL -1 10 0.000 _ No_prior
-
DiscMort_2P_1_commLL -20 20 -15.000 _ No_prior
-
DiscMort_2P_2_commLL -2 2 1.000 _ No_prior
-
DiscMort_2P_3_commLL -1 2 0.415 _ No_prior
-
DiscMort_2P_4_commLL -1 2 0.000 _ No_prior
-
Retain_3P_1_commTrap 0 85 0.000 _ No_prior
-
Retain_3P_2_commTrap 0 20 0.250 _ No_prior
-
Retain_3P_3_commTrap 0 1 1.000 _ No_prior
-
Retain_3P_4_commTrap -1 2 0.000 _ No_prior
-
DiscMort_3P_1_commTrap -20 20 -15.000 _ No_prior
-
DiscMort_3P_2_commTrap -2 2 1.000 _ No_prior
-
DiscMort_3P_3_commTrap -1 2 0.100 _ No_prior
-
DiscMort_3P_4_commTrap -1 2 0.000 _ No_prior
-
Retain_4P_1_CBT_PR 20 85 43.969 _ No_prior
-
Retain_4P_2_CBT_PR 0 20 0.500 _ No_prior
-
Retain_4P_3_CBT_PR 0 1 1.000 _ No_prior
-
PRE-DECIS
IONAL

June 2015 Gulf of Mexico Red Grouper
SEDAR 42 SAR Section III Assessment Process Report
82
Table 3.1.1 Continued
Predicted Prior
Label
Lower
bound
Upper
bound Value SD Value SD Status Value
Retain_4P_4_CBT_PR -1 2 0.000 _ No_prior
-
DiscMort_4P_1_CBT_PR -20 20 -15.000 _ No_prior
-
DiscMort_4P_2_CBT_PR -2 2 1.000 _ No_prior
-
DiscMort_4P_3_CBT_PR -1 2 0.116 _ No_prior
-
DiscMort_4P_4_CBT_PR -1 2 0.000 _ No_prior
-
Retain_5P_1_HB 20 85 43.969 _ No_prior
-
Retain_5P_2_HB 0 20 0.500 _ No_prior
-
Retain_5P_3_HB 0 1 1.000 _ No_prior
-
Retain_5P_4_HB -1 2 0.000 _ No_prior
-
DiscMort_5P_1_HB -20 20 -15.000 _ No_prior
-
DiscMort_5P_2_HB -2 2 1.000 _ No_prior
-
DiscMort_5P_3_HB -1 2 0.116 _ No_prior
-
DiscMort_5P_4_HB -1 2 0.000 _ No_prior
-
SizeSel_7P_1_SEAMAP_Vid 10 60 55.290 3.457 No_prior
Estimated
SizeSel_7P_2_SEAMAP_Vid -15 15 3.145 75.845 No_prior
Estimated
SizeSel_7P_3_SEAMAP_Vid -15 15 5.721 0.313 No_prior
Estimated
SizeSel_7P_4_SEAMAP_Vid -15 15 0.243 400.230 No_prior
Estimated
SizeSel_7P_5_SEAMAP_Vid -15 15 -4.830 1.409 No_prior
Estimated
SizeSel_7P_6_SEAMAP_Vid -15 15 2.504 196.010 No_prior
Estimated
SizeSel_8P_1_SEAMAP_GF 10 60 13.350 6.561 No_prior
Estimated
SizeSel_8P_2_SEAMAP_GF -15 15 -2.147 0.574 No_prior
Estimated
SizeSel_8P_3_SEAMAP_GF -15 15 -1.068 37.904 No_prior
Estimated
SizeSel_8P_4_SEAMAP_GF -15 15 4.941 0.279 No_prior
Estimated
SizeSel_8P_5_SEAMAP_GF -15 15 -2.103 0.251 No_prior
Estimated
SizeSel_8P_6_SEAMAP_GF -15 15 -2.055 0.231 No_prior
Estimated
SizeSel_9P_1_NMFS_BLL 0.5 129 45.565 0.966 No_prior
Estimated
SizeSel_9P_2_NMFS_BLL -15 15 0.516 6.058 No_prior
Estimated
SizeSel_9P_3_NMFS_BLL -15 15 4.284 0.182 No_prior
Estimated
SizeSel_9P_4_NMFS_BLL -15 15 -0.089 294.529 No_prior
Estimated
SizeSel_9P_5_NMFS_BLL -15 15 -5.759 0.680 No_prior
Estimated
SizeSel_9P_6_NMFS_BLL -15 15 0.808 45.495 No_prior
Estimated
AgeSel_1P_1_commHL -1010 1 -1000 _ No_prior
-
AgeSel_1P_2_commHL -5 5 0.000 _ Normal 0 0.25 -
AgeSel_1P_3_commHL -5 5 1.210 0.231 Normal 1 0.25 Estimated
AgeSel_1P_4_commHL -5 5 1.511 0.217 Normal 1 0.25 Estimated
AgeSel_1P_5_commHL -5 5 1.516 0.211 Normal 1 0.25 Estimated
AgeSel_1P_6_commHL -5 5 1.316 0.173 Normal 1 0.25 Estimated
AgeSel_1P_7_commHL -5 5 0.966 0.103 Normal 0 0.25 Estimated
AgeSel_1P_8_commHL -5 5 0.674 0.085 Normal 0 0.25 Estimated
PRE-DECIS
IONAL

June 2015 Gulf of Mexico Red Grouper
SEDAR 42 SAR Section III Assessment Process Report
83
Table 3.1.1 Continued
Predicted Prior
Label
Lower
bound
Upper
bound Value SD Value SD Status Value
AgeSel_1P_9_commHL -5 5 0.096 0.091 Normal 0 0.25 Estimated
AgeSel_1P_10_commHL -5 5 -0.056 0.106 Normal 0 0.25 Estimated
AgeSel_1P_11_commHL -5 5 -0.101 0.124 Normal 0 0.25 Estimated
AgeSel_1P_12_commHL -5 5 -0.161 0.138 Normal 0 0.25 Estimated
AgeSel_1P_13_commHL -5 5 -0.130 0.089 Normal 0 0.1 Estimated
AgeSel_1P_14_commHL -5 5 -0.100 0.089 Normal 0 0.1 Estimated
AgeSel_1P_15_commHL -5 5 -0.077 0.091 Normal 0 0.1 Estimated
AgeSel_1P_16_commHL -5 5 -0.062 0.093 Normal 0 0.1 Estimated
AgeSel_1P_17_commHL -5 5 -0.051 0.095 Normal 0 0.1 Estimated
AgeSel_1P_18_commHL -5 5 -0.038 0.096 Normal 0 0.1 Estimated
AgeSel_1P_19_commHL -5 5 -0.024 0.097 Normal 0 0.1 Estimated
AgeSel_1P_20_commHL -5 5 -0.011 0.097 Normal 0 0.1 Estimated
AgeSel_1P_21_commHL -5 5 -0.004 0.098 Normal 0 0.1 Estimated
AgeSel_2P_1_commLL -1010 1 -1000 _ No_prior
-
AgeSel_2P_2_commLL -5 5 0.000 _ Normal 0 0.25 -
AgeSel_2P_3_commLL -5 5 1.241 0.229 Normal 1 0.25 Estimated
AgeSel_2P_4_commLL -5 5 1.581 0.219 Normal 1 0.25 Estimated
AgeSel_2P_5_commLL -5 5 1.156 0.219 Normal 1 0.25 Estimated
AgeSel_2P_6_commLL -5 5 1.070 0.201 Normal 1 0.25 Estimated
AgeSel_2P_7_commLL -5 5 0.807 0.124 Normal 0 0.25 Estimated
AgeSel_2P_8_commLL -5 5 1.082 0.097 Normal 0 0.25 Estimated
AgeSel_2P_9_commLL -5 5 0.537 0.091 Normal 0 0.25 Estimated
AgeSel_2P_10_commLL -5 5 0.119 0.105 Normal 0 0.25 Estimated
AgeSel_2P_11_commLL -5 5 0.140 0.117 Normal 0 0.25 Estimated
AgeSel_2P_12_commLL -5 5 -0.181 0.118 Normal 0 0.25 Estimated
AgeSel_2P_13_commLL -5 5 -0.171 0.086 Normal 0 0.1 Estimated
AgeSel_2P_14_commLL -5 5 -0.139 0.087 Normal 0 0.1 Estimated
AgeSel_2P_15_commLL -5 5 -0.098 0.089 Normal 0 0.1 Estimated
AgeSel_2P_16_commLL -5 5 -0.106 0.092 Normal 0 0.1 Estimated
AgeSel_2P_17_commLL -5 5 -0.089 0.094 Normal 0 0.1 Estimated
AgeSel_2P_18_commLL -5 5 -0.075 0.095 Normal 0 0.1 Estimated
AgeSel_2P_19_commLL -5 5 -0.053 0.096 Normal 0 0.1 Estimated
AgeSel_2P_20_commLL -5 5 -0.033 0.097 Normal 0 0.1 Estimated
AgeSel_2P_21_commLL -5 5 -0.024 0.098 Normal 0 0.1 Estimated
AgeSel_3P_1_commTrap -1010 1 -1000 _ No_prior
-
AgeSel_3P_2_commTrap -5 5 0.000 _ Normal 0 0.25 -
AgeSel_3P_3_commTrap -5 5 0.920 0.259 Normal 1 0.25 Estimated
AgeSel_3P_4_commTrap -5 5 0.799 0.270 Normal 1 0.25 Estimated
AgeSel_3P_5_commTrap -5 5 0.615 0.270 Normal 1 0.25 Estimated
PRE-DECIS
IONAL

June 2015 Gulf of Mexico Red Grouper
SEDAR 42 SAR Section III Assessment Process Report
84
Table 3.1.1 Continued
Predicted Prior
Label
Lower
bound
Upper
bound Value SD Value SD Status Value
AgeSel_3P_6_commTrap -5 5 0.429 0.232 Normal 1 0.25 Estimated
AgeSel_3P_7_commTrap -5 5 0.255 0.174 Normal 0 0.25 Estimated
AgeSel_3P_8_commTrap -5 5 0.798 0.169 Normal 0 0.25 Estimated
AgeSel_3P_9_commTrap -5 5 0.688 0.159 Normal 0 0.25 Estimated
AgeSel_3P_10_commTrap -5 5 0.146 0.164 Normal 0 0.25 Estimated
AgeSel_3P_11_commTrap -5 5 -0.036 0.186 Normal 0 0.25 Estimated
AgeSel_3P_12_commTrap -5 5 -0.238 0.186 Normal 0 0.25 Estimated
AgeSel_3P_13_commTrap -5 5 -0.048 0.095 Normal 0 0.1 Estimated
AgeSel_3P_14_commTrap -5 5 -0.036 0.096 Normal 0 0.1 Estimated
AgeSel_3P_15_commTrap -5 5 -0.077 0.096 Normal 0 0.1 Estimated
AgeSel_3P_16_commTrap -5 5 -0.070 0.096 Normal 0 0.1 Estimated
AgeSel_3P_17_commTrap -5 5 -0.053 0.097 Normal 0 0.1 Estimated
AgeSel_3P_18_commTrap -5 5 -0.043 0.098 Normal 0 0.1 Estimated
AgeSel_3P_19_commTrap -5 5 -0.033 0.098 Normal 0 0.1 Estimated
AgeSel_3P_20_commTrap -5 5 -0.025 0.099 Normal 0 0.1 Estimated
AgeSel_3P_21_commTrap -5 5 -0.020 0.099 Normal 0 0.1 Estimated
AgeSel_4P_1_CBT_PR -1010 1 -1000 _ No_prior
-
AgeSel_4P_2_CBT_PR -5 5 0.000 _ Normal 0 0.25 -
AgeSel_4P_3_CBT_PR -5 5 1.225 0.228 Normal 1 0.25 Estimated
AgeSel_4P_4_CBT_PR -5 5 1.343 0.216 Normal 1 0.25 Estimated
AgeSel_4P_5_CBT_PR -5 5 0.411 0.211 Normal 1 0.25 Estimated
AgeSel_4P_6_CBT_PR -5 5 0.107 0.129 Normal 1 0.25 Estimated
AgeSel_4P_7_CBT_PR -5 5 0.019 0.104 Normal 0 0.25 Estimated
AgeSel_4P_8_CBT_PR -5 5 -0.029 0.102 Normal 0 0.25 Estimated
AgeSel_4P_9_CBT_PR -5 5 -0.625 0.119 Normal 0 0.25 Estimated
AgeSel_4P_10_CBT_PR -5 5 -0.192 0.139 Normal 0 0.25 Estimated
AgeSel_4P_11_CBT_PR -5 5 -0.535 0.161 Normal 0 0.25 Estimated
AgeSel_4P_12_CBT_PR -5 5 -0.264 0.172 Normal 0 0.25 Estimated
AgeSel_4P_13_CBT_PR -5 5 -0.105 0.094 Normal 0 0.1 Estimated
AgeSel_4P_14_CBT_PR -5 5 -0.041 0.094 Normal 0 0.1 Estimated
AgeSel_4P_15_CBT_PR -5 5 -0.013 0.095 Normal 0 0.1 Estimated
AgeSel_4P_16_CBT_PR -5 5 -0.033 0.096 Normal 0 0.1 Estimated
AgeSel_4P_17_CBT_PR -5 5 -0.017 0.097 Normal 0 0.1 Estimated
AgeSel_4P_18_CBT_PR -5 5 -0.008 0.098 Normal 0 0.1 Estimated
AgeSel_4P_19_CBT_PR -5 5 0.003 0.099 Normal 0 0.1 Estimated
AgeSel_4P_20_CBT_PR -5 5 0.008 0.099 Normal 0 0.1 Estimated
AgeSel_4P_21_CBT_PR -5 5 0.010 0.099 Normal 0 0.1 Estimated
AgeSel_5P_1_HB -1010 1 -1000 _ No_prior
-
AgeSel_5P_2_HB -5 5 0.000 _ Normal 0 0.25 -
PRE-DECIS
IONAL

June 2015 Gulf of Mexico Red Grouper
SEDAR 42 SAR Section III Assessment Process Report
85
Table 3.1.1. Continued
Predicted Prior
Label
Lower
bound
Upper
bound Value SD Value SD Status Value
AgeSel_5P_3_HB -5 5 1.615 0.181 Normal 1 0.25 Estimated
AgeSel_5P_4_HB -5 5 1.371 0.162 Normal 1 0.25 Estimated
AgeSel_5P_5_HB -5 5 -1.066 0.159 Normal 1 0.25 Estimated
AgeSel_5P_6_HB -5 5 -0.215 0.141 Normal 1 0.25 Estimated
AgeSel_5P_7_HB -5 5 0.231 0.123 Normal 0 0.25 Estimated
AgeSel_5P_8_HB -5 5 -0.005 0.123 Normal 0 0.25 Estimated
AgeSel_5P_9_HB -5 5 -0.515 0.143 Normal 0 0.25 Estimated
AgeSel_5P_10_HB -5 5 -0.200 0.166 Normal 0 0.25 Estimated
AgeSel_5P_11_HB -5 5 -0.380 0.186 Normal 0 0.25 Estimated
AgeSel_5P_12_HB -5 5 -0.387 0.197 Normal 0 0.25 Estimated
AgeSel_5P_13_HB -5 5 -0.038 0.097 Normal 0 0.1 Estimated
AgeSel_5P_14_HB -5 5 -0.031 0.097 Normal 0 0.1 Estimated
AgeSel_5P_15_HB -5 5 -0.017 0.098 Normal 0 0.1 Estimated
AgeSel_5P_16_HB -5 5 -0.006 0.098 Normal 0 0.1 Estimated
AgeSel_5P_17_HB -5 5 0.006 0.099 Normal 0 0.1 Estimated
AgeSel_5P_18_HB -5 5 0.013 0.099 Normal 0 0.1 Estimated
AgeSel_5P_19_HB -5 5 0.016 0.099 Normal 0 0.1 Estimated
AgeSel_5P_20_HB -5 5 0.018 0.100 Normal 0 0.1 Estimated
AgeSel_5P_21_HB -5 5 0.018 0.100 Normal 0 0.1 Estimated
AgeSel_6P_1_RedTide 0.1 21 0.100 _ No_prior
-
AgeSel_6P_2_RedTide 21 21 21.000 _ No_prior
-
Retain_1P_1_commHL_BLK2repl_1990 20 85 48.795 _ No_prior
-
Retain_1P_1_commHL_BLK2repl_2009 20 85 45.462 0.254 No_prior
Estimated
Retain_1P_2_commHL_BLK2repl_1990 0 20 0.100 _ No_prior
-
Retain_1P_2_commHL_BLK2repl_2009 0 20 0.986 0.111 No_prior
Estimated
Retain_1P_3_commHL_BLK2repl_1990 0 1 1.000 _ No_prior
-
Retain_1P_3_commHL_BLK2repl_2009 0 1 0.998 0.001 No_prior
Estimated
Retain_2P_1_commLL_BLK2repl_1990 20 85 48.795 _ No_prior
-
Retain_2P_1_commLL_BLK2repl_2009 20 85 46.383 0.305 No_prior
Estimated
Retain_2P_2_commLL_BLK2repl_1990 0 20 0.100 _ No_prior
-
Retain_2P_2_commLL_BLK2repl_2009 0 20 1.229 0.129 No_prior
Estimated
Retain_2P_3_commLL_BLK2repl_1990 0 1 1.000 _ No_prior
-
Retain_2P_3_commLL_BLK2repl_2009 0 1 1.000 0.001 No_prior
Estimated
Retain_3P_1_commTrap_BLK3repl_1990 20 85 48.975 _ No_prior
-
Retain_3P_2_commTrap_BLK3repl_1990 0 20 0.100 _ No_prior
-
Retain_3P_3_commTrap_BLK3repl_1990 0 1 1.000 _ No_prior
-
Retain_4P_1_CBT_PR_BLK1repl_1990 20 85 53.704 0.611 No_prior
Estimated
Retain_4P_2_CBT_PR_BLK1repl_1990 0 20 0.545 0.265 No_prior
Estimated
Retain_4P_3_CBT_PR_BLK1repl_1990 0 1 0.833 0.047 No_prior
Estimated
PRE-DECIS
IONAL

June 2015 Gulf of Mexico Red Grouper
SEDAR 42 SAR Section III Assessment Process Report
86
Table 3.1.1 Continued
Predicted Prior
Label
Lower
bound
Upper
bound Value SD Value SD Status Value
Retain_5P_1_HB_BLK1repl_1990 20 85 50.304 1.323 No_prior
Estimated
Retain_5P_2_HB_BLK1repl_1990 0 20 0.319 0.615 No_prior
Estimated
Retain_5P_3_HB_BLK1repl_1990 0 1 0.972 0.014 No_prior
Estimated
PRE-DECIS
IONAL

June 2015 Gulf of Mexico Red Grouper
SEDAR 42 SAR Section III Assessment Process Report
87
Table 3.1.2 Model performance comparison: NoRT = no red tide model, EpiM0.25 = model adding an
additional mortality due to red tide of 0.2541 to the natural mortality vector in 2005, EpiM0.48 = model
adding an additional mortality due to red tide of 0.48 to the natural mortality vector, and FLEET = model
accounting for red tide as a fleet.
NoRT EpiM0.25 EpiM0.48 FLEET
Performance
Gradient 0.005 0.047 0.021 0.300
K 179 179 179 331
N 305 305 305 321
AICc 6723 6708 6703 -13645
BIC 6873 6858 6853 7584
Likelihood
Total 2925 2917 2915 2837
Discard 320 318 316 311
Length composition 1079 1083 1086 1086
Age composition 1454 1453 1452 1451
Recruitment 18 17 17 17
Survey -80 -88 -90 -164
commHL -10 -11 -12 -12
commLL -17 -18 -18 -18
commTrap 0 0 0 0
CBT_PR 0 0 0 0
HB -11 -15 -18 -18
RedTide - - - -74
CBT_PRSurv -22 -20 -18 -18
SEAMAP_Vid -13 -14 -15 -15
SEAMAP_GF -4 -4 -4 -4
NMFS_BLL -3 -5 -5 -5
Red tide
Ln(Q) - - - 0.83
F_2005 - - - 0.48
NoRT EpiM0.25 EpiM0.48 FLEET
Performance
Gradient 0.005 0.047 0.021 0.300
K 179 179 179 331
PRE-DECIS
IONAL

June 2015 Gulf of Mexico Red Grouper
SEDAR 42 SAR Section III Assessment Process Report
88
Table 3.1.3 Model total likelihood, predicted unfished spawning biomass (eggs), predicted 2013
spawning biomass, spawning biomass achieved at MSY (eggs), and unexploited recruitment from 50
model runs from the jitter analysis. * indicates that a positive definite hessian was not obtained.
Run Total likelihood SSB_Virgin SSB_2013 SSB_MSY R0
1 2838.47 4056110 2215550 1414710 15985
2 2838.34 4057960 2227670 1412140 15992
3* 2954.07 8.28e-317 0 0 8.28e-317
4 2838.47 4056180 2216090 1414580 15985
5 2838.48 4057230 2216910 1415080 15990
6 2888.39 3585530 1936580 1352220 14131
7 2838.48 4057410 2217900 1414890 15990
8 2838.48 4057430 2217910 1414890 15990
9 2838.47 4056190 2216100 1414590 15985
10 2838.47 4055890 2216050 1414490 15984
11 4904.46 2728690 1256910 1051720 10754
12 2888.99 3982000 2303260 1363420 15693
13* 3318.05 8.76e-317 0 0 8.76e-317
14 2866.57 4058480 2198010 1444760 15995
15 2838.47 4056190 2216100 1414590 15985
16 2839.91 4054760 2212850 1414480 15980
17 2839.91 4054960 2213830 1414290 15981
18 2838.35 4059220 2229520 1412450 15997
19 2838.47 4056190 2216090 1414590 15985
20 22225.2 2389670 953613 934868 9418
21 2838.47 4056190 2216100 1414590 15985
22 2861.18 4018010 2164290 1402800 15835
23 2838.35 4059240 2229530 1412450 15997
24 3265.59 3655900 2169240 1188870 14408
25 3072.25 4066880 2218050 1411330 16028
26 2838.35 4059230 2229520 1412450 15997
27 2838.34 4057960 2227670 1412140 15992
28* 2838.58 6.89e-317 0 0 6.89e-317
29 2861.31 4016170 2152180 1405410 15828
30 2862.29 4326920 2075190 1547260 17052
31 2843.67 4049140 2219390 1422530 15958
32 3337.03 4092410 2190690 1418020 16128
33 2892.66 4008420 2289150 1397400 15797
34 2838.48 4057310 2216830 1415140 15990
35 2838.47 4056180 2216090 1414590 15985
36 2838.48 4057420 2217900 1414890 15990
37 2838.47 4056060 2215030 1414840 15985
38 2838.65 4055950 2216760 1416430 15985
39 2866.57 4058540 2198470 1444650 15995
40 2863.54 4055000 2222970 1414200 15981
41 2838.47 4056180 2216090 1414590 15985
42 2838.34 4057960 2227660 1412140 15992
43 2838.47 4055990 2215110 1414780 15985
44 2838.48 4057440 2217900 1414900 15990
45 2838.47 4056170 2216090 1414580 15985
46 7380.78 1449990 3432890 718108 5714
47 2838.47 4056190 2216090 1414590 15985
48 2864.09 4021490 2190740 1405090 15849
49 5618.6 10987900 1099610 3979560 43303
50 2838.51 4056400 2226500 1413620 15986
PRE-DECIS
IONAL

June 2015 Gulf of Mexico Red Grouper
SEDAR 42 SAR Section III Assessment Process Report
89
Table 3.2.1 Parameter estimates with coefficient of variation (CV).
Parameter Label Value CV Parameter description
SizeSel_7P_4_SEAMAP_Vid 0.24 1647.04 Descending width of double normal for video survey
SizeSel_7P_6_SEAMAP_Vid 2.50 78.28
Selectivity of last length bin in double normal for
video survey
SizeSel_9P_6_NMFS_BLL 0.81 56.31
Selectivity of last length bin in double normal for
NMFS bottom longline
AgeSel_4P_19_CBT_PR 0.00 33.00 Age-18 penalty for charterboat-private fleet
SizeSel_7P_2_SEAMAP_Vid 3.15 24.12 Width of double normal plateau for video survey
AgeSel_5P_17_HB 0.01 16.50 Age-16 penalty for headboat fleet
AgeSel_4P_20_CBT_PR 0.01 12.38 Age-19 penalty for charterboat-private fleet
SizeSel_9P_2_NMFS_BLL 0.52 11.74
Width of double normal plateau for NMFS bottom
longline
Main_RecrDev_1991 0.02 10.59 Recruitment deviation in 1991
Main_RecrDev_2008 0.02 10.38 Recruitment deviation in 2008
AgeSel_4P_21_CBT_PR 0.01 9.90 Age-20 penalty for charterboat-private fleet
Early_InitAge_4 0.06 9.57
AgeSel_5P_18_HB 0.01 7.62 Age-17 penalty for headboat fleet
AgeSel_5P_19_HB 0.02 6.19 Age-18 penalty for headboat fleet
Early_InitAge_17 0.19 5.69
Early_InitAge_6 0.13 5.56
AgeSel_5P_20_HB 0.02 5.56 Age-19 penalty for headboat fleet
AgeSel_5P_21_HB 0.02 5.56 Age-20 penalty for headboat fleet
AgeSel_4P_7_CBT_PR 0.02 5.47 Age-6 penalty for charterboat-private fleet
Early_InitAge_16 0.25 4.34
Early_InitAge_15 0.33 3.37
Retain_5P_2_HB_BLK1repl_1990 0.32 1.93 Retention slope for headboat fleet 1990-2008
AgeSel_4P_6_CBT_PR 0.11 1.21 Age-6 penalty for charterboat-private fleet
AgeSel_3P_10_commTrap 0.15 1.12 Age-9 penalty for commercial trap fleet
Main_RecrDev_1990 0.16 1.06 Recruitment deviation in 1990
AgeSel_1P_9_commHL 0.10 0.95 Age-8 penalty for commercial handline fleet
AgeSel_2P_10_commLL 0.12 0.88 Age-9 penalty for commercial longline fleet
AgeSel_2P_11_commLL 0.14 0.84 Age-10 penality for commercial longline fleet
AgeSel_3P_7_commTrap 0.26 0.68 Age-6 penalty for commercial trap fleet
Early_InitAge_5 0.72 0.64
Early_InitAge_1 0.31 0.62
AgeSel_3P_6_commTrap 0.43 0.54 Age-5 penalty for commercial trap fleet
AgeSel_5P_7_HB 0.23 0.53 Age-6 penalty for headboat fleet
AgeSel_4P_5_CBT_PR 0.41 0.51 Age-4 penalty for charterboat-private fleet
SizeSel_8P_1_SEAMAP_GF 13.35 0.49
Beginning size bin for double normal plateau for
SEAMAP groundfish
Retain_4P_2_CBT_PR_BLK1repl_1990 0.55 0.49
Retention slope for charterboat-private fleet 1990-
2008
AgeSel_3P_5_commTrap 0.62 0.44 Age-4 penalty for commercial trap fleet
AgeSel_3P_4_commTrap 0.80 0.34 Age-3 penalty for commercial trap fleet
AgeSel_3P_3_commTrap 0.92 0.28 Age-2 penalty for commercial trap fleet
Early_InitAge_2 0.67 0.28
Main_RecrDev_2003 0.43 0.27 Main recruitment deviation in 2003
LnQ_base_6_RedTide 0.82 0.27 Natural log of the Red Tide fleet’s catchability
PRE-DECIS
IONAL

June 2015 Gulf of Mexico Red Grouper
SEDAR 42 SAR Section III Assessment Process Report
90
Table. 3.2.1 continued
Parameter Label Value CV Parameter description
InitF_3commTrap 0.03 0.24 Initial fishing mortality for commercial trap fleet
AgeSel_3P_9_commTrap 0.69 0.23 Penalty on age-8 for commercial trap fleet
F_fleet_5_YR_2013_s_1 0.01 0.22 2013 instantaneous F for headboat fleet
F_fleet_6_YR_2005_s_1 0.44 0.22 2005 instantaneous F for Red Tide fleet
AgeSel_3P_8_commTrap 0.80 0.21 Penalty on age-7 for commercial trap fleet
InitF_2commLL 0.14 0.21 Initial fishing mortality for commercial longline fleet
F_fleet_5_YR_2002_s_1 0.01 0.20 2002 instantaneous F for headboat fleet
F_fleet_5_YR_2004_s_1 0.01 0.20 2004 instantaneous F for headboat fleet
F_fleet_5_YR_2010_s_1 0.01 0.20 2010 instantaneous F for headboat fleet
F_fleet_5_YR_2011_s_1 0.01 0.20 2011 instantaneous F for headboat fleet
AgeSel_1P_3_commHL 1.21 0.19 Penalty on age-2 for commercial handline fleet
AgeSel_2P_5_commLL 1.16 0.19 Penalty on age-4 for commercial longline fleet
AgeSel_2P_6_commLL 1.07 0.19 Penalty on age-5 for commercial longline fleet
Main_RecrDev_1986 0.71 0.19 Main recruitment deviation for 1986
AgeSel_4P_3_CBT_PR 1.23 0.19 Penalty on age-2 for charterboat-private fleet
InitF_1commHL 0.10 0.19 Initial fishing mortality for commercial handline fleet
AgeSel_2P_3_commLL 1.24 0.18 Penalty on age-2 for commercial longline fleet
F_fleet_5_YR_2000_s_1 0.01 0.18 2000 instantaneous F for headboat fleet
F_fleet_3_YR_2003_s_1 0.03 0.18 2003 instantaneous F for commercial trap fleet
F_fleet_3_YR_1987_s_1 0.04 0.17 1987 instantaneous F for commercial trap fleet
F_fleet_3_YR_1986_s_1 0.05 0.17 1986 instantaneous F for commercial trap fleet
AgeSel_2P_9_commLL 0.54 0.17 Penalty on age-8 for commercial longline fleet
Main_RecrDev_1989 0.70 0.17 Main recruitment deviation for 1989
F_fleet_3_YR_2006_s_1 0.03 0.17 2006 instantaneous F for commercial trap fleet
F_fleet_5_YR_1992_s_1 0.01 0.17 1992 instantaneous F for headboat fleet
F_fleet_5_YR_1993_s_1 0.01 0.17 1993 instantaneous F for headboat fleet
F_fleet_5_YR_1994_s_1 0.01 0.17 1994 instantaneous F for headboat fleet
F_fleet_5_YR_1997_s_1 0.01 0.17 1997 instantaneous F for headboat fleet
F_fleet_5_YR_1998_s_1 0.01 0.17 1998 instantaneous F for headboat fleet
F_fleet_5_YR_2001_s_1 0.01 0.17 2001 instantaneous F for headboat fleet
F_fleet_5_YR_2005_s_1 0.01 0.17 2005 instantaneous F for headboat fleet
F_fleet_5_YR_2006_s_1 0.01 0.17 2006 instantaneous F for headboat fleet
F_fleet_5_YR_2007_s_1 0.01 0.17 2007 instantaneous F for headboat fleet
SR_BH_steep 0.80 0.16 Steepness
Main_RecrDev_1993 0.67 0.16 Main recruitment deviation for 1993
AgeSel_4P_4_CBT_PR 1.34 0.16 Penalty on age-3 for charterboat-private fleet
F_fleet_5_YR_1996_s_1 0.02 0.16 1996 instantaneous F for headboat fleet
F_fleet_3_YR_2005_s_1 0.03 0.16 2005 instantaneous F for commercial trap fleet
Main_RecrDev_2007 0.80 0.15 Main recruitment deviation for 2007
F_fleet_5_YR_1991_s_1 0.01 0.15 1991 instantaneous F for headboat fleet
AgeSel_2P_7_commLL 0.81 0.15 Penalty on age-6 for commercial longline fleet
F_fleet_2_YR_1986_s_1 0.23 0.15 1986 instantaneous F for commercial longline fleet
F_fleet_3_YR_1988_s_1 0.04 0.15 1988 instantaneous F for commercial trap fleet
F_fleet_2_YR_2013_s_1 0.09 0.15 2013 instantaneous F for commercial longline fleet
F_fleet_4_YR_2005_s_1 0.09 0.15 2005 instantaneous F for charterboat-private fleet
PRE-DECIS
IONAL

June 2015 Gulf of Mexico Red Grouper
SEDAR 42 SAR Section III Assessment Process Report
91
Table. 3.2.1 continued
Parameter Label Value CV Parameter description
F_fleet_3_YR_1988_s_1 0.04 0.15 1988 instantaneous F for commercial trap fleet
F_fleet_2_YR_2013_s_1 0.09 0.15 2013 instantaneous F for commercial longline fleet
F_fleet_4_YR_2005_s_1 0.09 0.15 2005 instantaneous F for charterboat-private fleet
F_fleet_4_YR_2013_s_1 0.17 0.15 2013 instantaneous F for charterboat-private fleet
F_fleet_4_YR_2012_s_1 0.10 0.15 2012 instantaneous F for charterboat-private fleet
PRE-DECIS
IONAL

June 2015 Gulf of Mexico Red Grouper
SEDAR 42 SAR Section III Assessment Process Report
92
Table 3.2.2 Predicted total biomass (mt), mature biomass (SSB, eggs), and age-0 recruits (thousand fish),
minimum stock size threshold (MSST), the ratio between SSB and MSST, fishing mortality (F), maximum
fishing mortality threshold (MFMT), which is equal to FMSY, and the ratio between F and MFMT for Gulf
of Mexico Red Grouper from the base model run.
Year
Total
biomass SSB
Age-0
recruits MSST SSB/MSST F MFMT F/MFMT
1986 21144.7 1156630 17910 1416320 0.95 0.21 0.16 1.32
1987 20727.8 1129980 5363.6
0.93 0.19 1.21
1988 20410.8 1139280 22718.3
0.94 0.20 1.28
1989 20365.1 1144990 17843
0.94 0.27 1.68
1990 19183.6 1050940 10184.5
0.87 0.17 1.04
1991 20302.1 1132070 8957.31
0.93 0.19 1.17
1992 20786.9 1203400 7380.53
0.99 0.21 1.31
1993 20505.6 1228180 17397.2
1.01 0.23 1.44
1994 19794.5 1187210 2905.62
0.98 0.19 1.18
1995 19569.5 1180980 29175
0.97 0.18 1.13
1996 20067.1 1182310 6233.87
0.98 0.13 0.82
1997 21133.3 1228460 2241.56
1.01 0.12 0.77
1998 21897.9 1310930 58466.6
1.08 0.10 0.65
1999 24611.1 1408770 6552.14
1.16 0.15 0.93
2000 26173.7 1430260 4292.6
1.18 0.17 1.04
2001 27042.1 1532670 32396.7
1.26 0.14 0.88
2002 28860.9 1685460 4050.1
1.39 0.14 0.88
2003 29976.9 1775000 14539.2
1.46 0.11 0.70
2004 31571.5 1909760 784.179
1.58 0.16 0.99
2005 31065.4 1925010 86737.4
1.59 0.48 2.97
2006 21545.3 1239230 21962.3
1.02 0.14 0.87
2007 23495.3 1231680 19982.6
1.02 0.10 0.65
2008 26626.1 1399270 9284.35
1.15 0.11 0.69
2009 29283.4 1633450 7049.86
1.35 0.08 0.52
2010 32017.7 1902920 5133.91
1.57 0.07 0.41
2011 34456.5 2140040 2340.96
1.77 0.08 0.51
2012 35330.1 2252710 3978.58
1.86 0.11 0.67
2013 34516.6 2222750 5271.35
1.83 0.12 0.76
PRE-DECIS
IONAL

June 2015 Gulf of Mexico Red Grouper
SEDAR 42 SAR Section III Assessment Process Report
93
Table 3.2 3 Annual fishing mortality, overall and by fleet.
Fleet
Year Overall commHL commLL commTrap CBT_PR HB Red Tide
1986 0.21 0.20 0.23 0.05 0.15 0.02 0.00
1987 0.19 0.15 0.36 0.04 0.09 0.02 0.00
1988 0.20 0.12 0.19 0.04 0.19 0.02 0.00
1989 0.27 0.24 0.28 0.04 0.21 0.04 0.00
1990 0.17 0.19 0.23 0.03 0.18 0.02 0.00
1991 0.19 0.15 0.27 0.04 0.25 0.01 0.00
1992 0.21 0.09 0.23 0.05 0.41 0.01 0.00
1993 0.23 0.09 0.41 0.06 0.31 0.01 0.00
1994 0.19 0.08 0.26 0.08 0.25 0.01 0.00
1995 0.18 0.07 0.21 0.08 0.20 0.02 0.00
1996 0.13 0.04 0.20 0.04 0.08 0.02 0.00
1997 0.12 0.05 0.19 0.04 0.06 0.01 0.00
1998 0.10 0.04 0.15 0.02 0.09 0.01 0.00
1999 0.15 0.06 0.22 0.04 0.16 0.01 0.00
2000 0.17 0.08 0.18 0.06 0.27 0.01 0.00
2001 0.14 0.08 0.22 0.04 0.17 0.01 0.00
2002 0.14 0.07 0.19 0.06 0.18 0.00 0.00
2003 0.11 0.05 0.17 0.03 0.14 0.01 0.00
2004 0.16 0.05 0.19 0.04 0.24 0.01 0.00
2005 0.48 0.05 0.17 0.03 0.09 0.01 0.44
2006 0.14 0.06 0.17 0.03 0.11 0.01 0.00
2007 0.10 0.07 0.12 0.00 0.12 0.01 0.00
2008 0.11 0.09 0.16 0.00 0.11 0.01 0.00
2009 0.08 0.12 0.06 0.00 0.13 0.01 0.00
2010 0.07 0.06 0.07 0.00 0.10 0.01 0.00
2011 0.08 0.06 0.15 0.00 0.05 0.00 0.00
2012 0.11 0.05 0.11 0.00 0.10 0.01 0.00
2013 0.12 0.03 0.09 0.00 0.17 0.01 0.00
PRE-DECIS
IONAL

June 2015 Gulf of Mexico Red Grouper
SEDAR 42 SAR Section III Assessment Process Report
94
Table 3.2.4 Likelihood values for the data components for each sensitivity run.
Run Model
Data
component Total commHL
comm
LL
comm
Trap CBT_ PR HB Red Tide Video
SEAMAP-
GF NMFS BLL
CBT_
PRSurv
0 Base Age_like: 1451.0 352.0 283.6 143.6 459.4 212.4 0 0 0 0 0
1 low M Age_like: 1449.4 351.6 283.2 143.5 459.0 212.2 0 0 0 0 0
2 high M Age_like: 1452.2 352.3 284.4 143.7 459.3 212.4 0 0 0 0 0
3 low steepness Age_like: 1451.0 351.9 283.8 143.5 459.4 212.4 0 0 0 0 0
4 high steepness Age_like: 1450.9 352.0 283.5 143.6 459.4 212.5 0 0 0 0 0
5
Upweight
discards Age_like: 1709.4 433.9 433.8 147.9 476.2 217.6 0 0 0 0 0
6
Upweight recent
discards Age_like: 1523.1 380.6 314.5 145.0 467.9 215.1 0 0 0 0 0
7
Asymptotic
selectivity
NFMS_BLL Age_like: 1452.3 351.9 284.7 143.6 459.4 212.7 0 0 0 0 0
0 Base Catch_like: 3.7 1.0 2.1 0.1 0.1 0.3 0 0 0 0 0
1 low M Catch_like: 3.8 1.1 2.2 0.1 0.1 0.3 0 0 0 0 0
2 high M Catch_like: 3.4 1.0 1.9 0.1 0.1 0.3 0 0 0 0 0
3 low steepness Catch_like: 3.7 1.0 2.1 0.1 0.1 0.3 0 0 0 0 0
4 high steepness Catch_like: 3.7 1.0 2.1 0.1 0.1 0.3 0 0 0 0 0
5
Upweight
discards Catch_like: 22.5 8.4 9.0 1.9 1.0 2.1 0 0 0 0 0
6
Upweight recent
discards Catch_like: 20.0 6.6 10.2 0.5 0.9 1.9 0 0 0 0 0
7
Asymptotic
selectivity
NFMS_BLL Catch_like: 3.7 1.0 2.1 0.1 0.1 0.3 0 0 0 0 0
0 Base Disc_like: 310.7 108.8 187.1 14.3 -7.0 7.5 0 0 0 0 0
1 low M Disc_like: 311.5 108.9 187.3 14.9 -7.2 7.6 0 0 0 0 0
2 high M Disc_like: 307.4 108.4 186.4 13.2 -7.1 6.5 0 0 0 0 0
3 low steepness Disc_like: 311.3 108.8 187.1 14.3 -6.8 7.8 0 0 0 0 0
4 high steepness Disc_like: 310.4 108.8 187.0 14.3 -7.1 7.4 0 0 0 0 0
5
Upweight
discards Disc_like: 481.3 207.8 223.4 30.9 -5.2 24.3 0 0 0 0 0
6
Upweight recent
discards Disc_like: 436.8 172.3 246.0 9.8 -9.5 18.0 0 0 0 0 0
7
Asymptotic
selectivity
NFMS_BLL Disc_like: 310.8 108.8 187.1 14.3 -6.9 7.6 0 0 0 0 0
0 Base Length_like: 1085.8 161.4 170.6 0.0 83.3 105.4 0 110.6 201.8 252.7 0
1 low M Length_like: 1082.9 161.0 170.2 0.0 83.6 105.3 0 110.4 200.9 251.5 0
2 high M Length_like: 1121.2 162.4 171.8 0.0 83.4 105.2 0 110.5 234.0 253.9 0
3 low steepness Length_like: 1085.3 161.3 170.6 0.0 83.2 105.2 0 110.6 201.6 252.7 0
4 high steepness Length_like: 1085.9 161.4 170.7 0.0 83.3 105.4 0 110.5 201.9 252.7 0
5
Upweight
discards Length_like: 1433.5 281.9 400.9 0.0 80.4 111.3 0 108.1 205.2 245.8 0 PRE-DECIS
IONAL

June 2015 Gulf of Mexico Red Grouper
SEDAR 42 SAR Section III Assessment Process Report
95
6
Upweight recent
discards Length_like: 1173.6 193.0 214.2 0.0 80.2 112.8 0 112.7 208.5 252.1 0
7
Asymptotic
selectivity
NFMS_BLL Length_like: 1085.4 161.4 170.6 0.0 83.2 105.3 0 110.5 201.7 252.6 0
0 Base Surv_like: -164.0 -11.9 -18.4 0.0 0.0 -17.6 -73.7 -14.7 -4.2 -5.0 -18.5
1 low M Surv_like: -164.8 -11.8 -18.5 0.0 0.0 -17.3 -73.7 -14.7 -4.4 -5.4 -19.1
2 high M Surv_like: -162.3 -12.0 -18.3 0.0 0.0 -18.0 -73.7 -14.7 -4.1 -4.2 -17.3
3 low steepness Surv_like: -163.8 -11.8 -18.4 0.0 0.0 -17.3 -73.7 -14.9 -4.1 -4.8 -18.8
4 high steepness Surv_like: -164.0 -12.0 -18.4 0.0 0.0 -17.7 -73.7 -14.7 -4.2 -5.0 -18.3
5
Upweight
discards Surv_like: -166.5 -12.7 -18.6 0.0 0.0 -19.2 -73.7 -16.0 -4.6 -4.7 -16.9
6
Upweight recent
discards Surv_like: -162.3 -9.6 -18.6 0.0 0.0 -14.6 -73.7 -14.0 -5.0 -6.5 -20.4
7
Asymptotic
selectivity
NFMS_BLL Surv_like: -163.9 -11.9 -18.4 0.0 0.0 -17.6 -73.7 -14.8 -4.2 -4.9 -18.5
Table 3.2.5 Summary of sensitivity runs. The results include estimated virgin recruitment (thousand fish; R0), virgin total biomass (mt; B0), total
biomass in final year (mt; B2013), virgin spawning biomass (eggs; SSB0), spawning biomass in final year (eggs; SSB-2013), spawning biomass
achieved at MSY (SSB_MSY), fishing mortality in 2013 (F2013), fishing mortality achieved at MSY (F_MSY), the ratio of F2013 and F_MSY,
minimum spawning stock threshold (MSST), and the ratio of SSB and MSST.
Run Model R0 B0 B2013 SSB0 SSB2013 SSB_MSY F2013 F_MSY F/F_MSY MSST SSB/MSST
0 Base 15833.9 88350.3 34516.6 4.02E+06 2.22E+06 1.42E+06 0.13 0.160043 0.817643 1.22E+06 1.82E+00
1 low M 11303 99234.8 31910 4.22E+06 2.06E+06 1.50E+06 0.130858 0.152182 0.859878 1.29E+06 1.60E+00
2 high M 30846.1 78346.5 40991.6 3.89E+06 2.62E+06 1.36E+06 0.101834 0.171161 0.59496 1.17E+06 2.24E+00
3 low steepness 17218.7 96077.1 33643.5 4.37E+06 2.17E+06 1.68E+06 0.12389 0.126604 0.978563 1.44E+06 1.50E+00
4 high steepness 14846.4 82840.3 35008.2 3.77E+06 2.25E+06 1.19E+06 0.119219 0.20051 0.594579 1.02E+06 2.21E+00
5 Upweight discards 17300 96530.8 32592.6 4.39E+06 2.09E+06 1.51E+06 0.134786 0.163063 0.826588 1.30E+06 1.60E+00
6 Upweight recent discards 16613.3 92699.1 34800.1 4.22E+06 2.24E+06 1.48E+06 0.125734 0.166162 0.756695 1.27E+06 1.77E+00
7
Asymptotic selectivity
NFMS_BLL 15985 89193.5 34407.9 4.06E+06 2.22E+06 1.41E+06 0.121216 0.163763 0.740192 1.22E+06 1.82E+00
PRE-DECIS
IONAL

June 2015 Gulf of Mexico Red Grouper
SEDAR 42 SAR Section III Assessment Process Report
96
Table 3.2. 6 Estimates of key population parameters from the jack-knife analysis of indices of abundance.
Parameter Base No_commHL No_commLL No_HB No_CBT_PRSurv No_Video No_SEAMAP_GF No_NMFS_BLL
SR_LN(R0) 9.69197 9.71233 9.72768 9.69684 9.73454 9.68229 9.71466 9.6794
SR_BH_steep 0.811118 0.826445 0.83691 0.815204 0.839927 0.811591 0.819052 0.799961
SR_sigmaR 1.01222 0.899639 0.893099 0.906837 0.951769 0.972815 1.03534 1.01334
SR_R1_offset -0.0681964 -0.0841788 -0.101037 -0.0705069 -0.109375 -0.0561492 -0.0854636 -0.0467304
SPB_Virgin 4.11E+06 4.19E+06 4.26E+06 4.13E+06 4.29E+06 4.07E+06 4.20E+06 4.06E+06
SPB_Initial 1.52E+06 1.58E+06 1.57E+06 1.57E+06 1.54E+06 1.57E+06 1.58E+06 1.63E+06
Recr_Virgin 16187.1 16520 16775.6 16266.1 16891.1 16031.1 16558.6 15984.8
Recr_Initial 15120 15186.3 15163.5 15158.7 15141.1 15155.8 15202.2 15255
TotBio_Unfished 90321.1 92178.7 93604.6 90761.7 94249.3 89450.6 92393.7 89192.3
SSB_MSY 1.44E+06 1.48E+06 1.49E+06 1.45E+06 1.49E+06 1.44E+06 1.47E+06 1.47E+06
TotYield_MSY 4000.59 4156.9 4241.07 4126.63 4154.14 3995.33 4135.86 3913.51
RetYield_MSY 3430.84 3527.96 3584.44 3581.05 3392.11 3416.72 3517.51 3304.11
PRE-DECIS
IONAL

June 2015 Gulf of Mexico Red Grouper
SEDAR 42 SAR Section III Assessment Process Report
97
Table 3.2.7. Preliminary results from projections.
Criteria Definition Value
Base M 0.144
Steepness 0.801
Virgin Recruitment 15833.9
SSB unfished 4017750
Mortality rate criteria
Fmsy or proxy Fmsy 0.1600
MFMT Fmsy 0.1600
Foy 75% of Fmsy 0.1200
Fcurrent F2013 0.1209
Fcurrent/MFMT F2013 0.7554
Biomass criteria
SSBmsy SSB at Fmsy 1416320
MSST (1-M)*SSBmsy 1212370
SSBcurrent SSB2013 2222750
SSBcurrent/MSST SSB2013 1.83
Equilibrium MSY Equilibrium yield at Fmsy 3329.33
Equilibrium OY Equilibrium yield at Foy 2497.00
OFL Annual yield at MFMT
OFL 2014 3946.13
OFL 2015 6263.09
OFL 2016 4835.98
OFL 2017 3700.32
OFL 2018 2885.36
OFL 2019 2499.72
OFL 2020 2503.59
Annual OY Annual yield at Foy
OY2014 3946.13
OY2015 4839.32
OY2016 3962.91
OY2017 3194.04
OY2018 2596.36
OY2019 2295.19
OY2020 2286.2
Annual Yield Annual yield at Fcurrent
Y 2014 3946.13
Y 2015 3961.65
Y 2016 3358.72
Y 2017 2792.16
Y 2018 2327.98
Y 2019 2086.98
Y 2020 2078.44
PRE-DECIS
IONAL
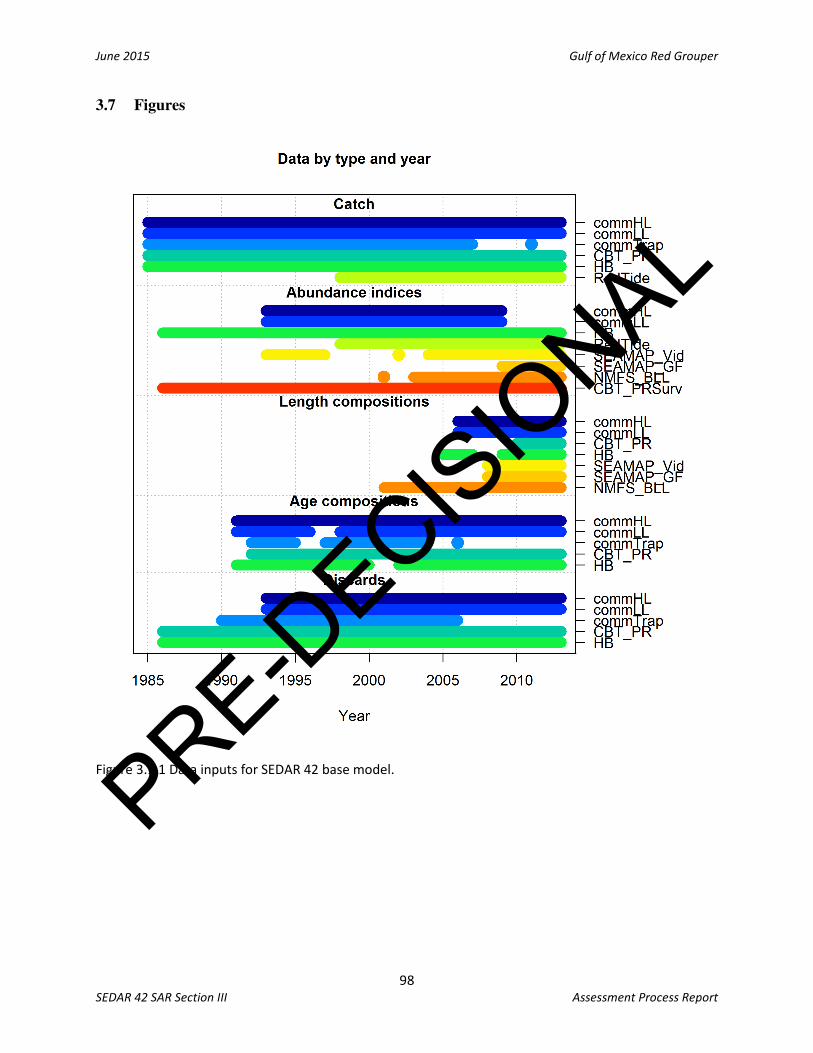
June 2015 Gulf of Mexico Red Grouper
SEDAR 42 SAR Section III Assessment Process Report
98
3.7 Figures
Figure 3.1.1 Data inputs for SEDAR 42 base model. PRE-DECIS
IONAL

June 2015 Gulf of Mexico Red Grouper
SEDAR 42 SAR Section III Assessment Process Report
99
Figure 3.1 2 The commercial handline retention patterns. The 1990-2008 retention pattern was fixed,
whereas the 2009-2013 retention pattern was estimated.
Figure 3.1 3 The commercial longline retention patterns. The 1990-2008 retention pattern was fixed,
whereas the 2009-2013 retention pattern was estimated.
PRE-DECIS
IONAL

June 2015 Gulf of Mexico Red Grouper
SEDAR 42 SAR Section III Assessment Process Report
100
Figure 3.1 4 The commercial trap retention pattern. This pattern was fixed.
Figure 3.1 5 The recreational charterboat-private mode retention pattern. The pre-1990 retention
pattern was fixed, whereas the 1990-2013 retention pattern was estimated.
PRE-DECIS
IONAL

June 2015 Gulf of Mexico Red Grouper
SEDAR 42 SAR Section III Assessment Process Report
101
Figure 3.1 6 The recreational headboat retention pattern. The pre-1990 retention pattern was fixed,
whereas the 1990-2013 retention pattern was estimated.
PRE-DECIS
IONAL

June 2015 Gulf of Mexico Red Grouper
SEDAR 42 SAR Section III Assessment Process Report
102
Figure 3.1.7 Comparison of annual estimates of spawning stock biomass (SSB in 1000s of eggs) for Gulf
of Mexico Red Grouper derived from a model with no red tide (No RT), a model with an episodic red tide
mortality estimate of 0.48 in 2005 (2005 RT M=0.48), and a model with red tide treated as a fishing fleet
(2005 RT FLEET).
PRE-DECIS
IONAL

June 2015 Gulf of Mexico Red Grouper
SEDAR 42 SAR Section III Assessment Process Report
103
Figure 3.2.1 Observed (black dots) and predicted landings (red line) (mt) of Gulf of Mexico Red Grouper
from the commercial vertical line fishing fleet, 1986-2013.
Figure 3.2.2 Observed (black dots) and predicted landings (red line) (mt) of Gulf of Mexico Red Grouper
from the commercial longline fishing fleet, 1986-2013.
0
200
400
600
800
1000
1200
1400
1600
1800
2000
1985 1990 1995 2000 2005 2010 2015
Lan
din
gs
in m
etri
c to
ns
(gu
tted
wei
gh
t)
Year
Landings Commercial Vertical Line
Observed
Expected
0
500
1000
1500
2000
2500
1985 1990 1995 2000 2005 2010 2015
Lan
din
gs
in m
etri
c to
ns
(gu
tted
wei
gh
t)
Year
Landings Commercial Longline
Observed
Expected
PRE-DECIS
IONAL

June 2015 Gulf of Mexico Red Grouper
SEDAR 42 SAR Section III Assessment Process Report
104
Figure 3.2.3 Observed (black dots) and predicted landings (red line) (mt) of Gulf of Mexico Red Grouper
from the commercial trap fishing fleet, 1986-2013.
Figure 3.2.4 Observed (black dots) and predicted landings (red line) (thousands of fish) of Gulf of Mexico
Red Grouper from the combined recreational charterboat and private fishing fleet, 1986-2013.
0
100
200
300
400
500
600
1985 1990 1995 2000 2005 2010 2015
Lan
din
gs
in m
etri
c to
ns
(gu
tted
wei
gh
t)
Year
Landings Commercial Trap
Observed
Expected
0
100
200
300
400
500
600
700
800
1985 1990 1995 2000 2005 2010 2015
Lan
din
gs
in t
hou
san
ds
of
fish
Year
Landings Recreational Charterboat and Private
Observed
Expected
PRE-DECIS
IONAL

June 2015 Gulf of Mexico Red Grouper
SEDAR 42 SAR Section III Assessment Process Report
105
Figure 3.2.5 Observed (black dots) and predicted landings (red line) (thousands of fish) of Gulf of Mexico
Red Grouper from the recreational headboat fishing fleet, 1986-2013.
0
10
20
30
40
50
60
1985 1990 1995 2000 2005 2010 2015
Lan
din
gs
in t
hou
san
ds
of
fish
Year
Landings Recreational Headboat
Observed
Expected
PRE-DECIS
IONAL

June 2015 Gulf of Mexico Red Grouper
SEDAR 42 SAR Section III Assessment Process Report
106
Figure 3.2.6 Observed (open circles) and predicted discards (blue dashes) (thousands of fish) of Gulf of
Mexico Red Grouper from the commercial vertical line fishing fleet, 1993-2013.
PRE-DECIS
IONAL

June 2015 Gulf of Mexico Red Grouper
SEDAR 42 SAR Section III Assessment Process Report
107
Figure 3.2.7 Observed (open circles) and predicted discards (blue dashes) (thousands of fish) of Gulf of
Mexico Red Grouper from the commercial longline fishing fleet, 1993-2013.
PRE-DECIS
IONAL

June 2015 Gulf of Mexico Red Grouper
SEDAR 42 SAR Section III Assessment Process Report
108
Figure 3.2.8 Observed (open circles) and predicted discards (blue dashes) (thousands of fish) of Gulf of
Mexico Red Grouper from the commercial trap fishing fleet, 1990-2006.
PRE-DECIS
IONAL
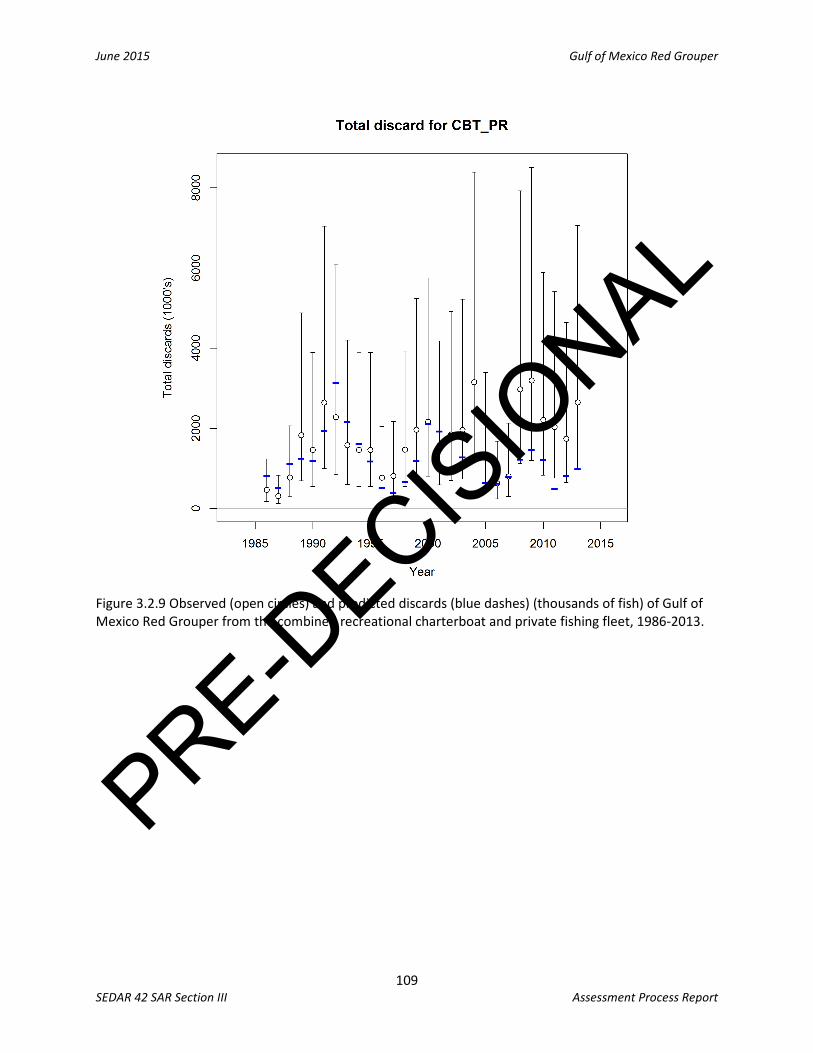
June 2015 Gulf of Mexico Red Grouper
SEDAR 42 SAR Section III Assessment Process Report
109
Figure 3.2.9 Observed (open circles) and predicted discards (blue dashes) (thousands of fish) of Gulf of
Mexico Red Grouper from the combined recreational charterboat and private fishing fleet, 1986-2013.
PRE-DECIS
IONAL

June 2015 Gulf of Mexico Red Grouper
SEDAR 42 SAR Section III Assessment Process Report
110
Figure 3.2.10 Observed (open circles) and predicted discards (blue dashes) (thousands of fish) of Gulf of
Mexico Red Grouper from the recreational headboat fishing fleet, 1986-2013.
PRE-DECIS
IONAL

June 2015 Gulf of Mexico Red Grouper
SEDAR 42 SAR Section III Assessment Process Report
111
Figure 3.2.11 Model fit (blue line) to the standardized commercial vertical line CPUE index (open circles),
1993-2009 (top panel). The bottom panel also shows a comparison of the observed and predicted
indices, where the black line is the 1:1 line.
PRE-DECIS
IONAL

June 2015 Gulf of Mexico Red Grouper
SEDAR 42 SAR Section III Assessment Process Report
112
Figure 3.2.12 Model fit (blue line) to the standardized commercial longline CPUE index (open circles),
1993-2009 (top panel). The bottom panel also shows a comparison of the observed and predicted
indices, where the black line is the 1:1 line.
PRE-DECIS
IONAL

June 2015 Gulf of Mexico Red Grouper
SEDAR 42 SAR Section III Assessment Process Report
113
Figure 3.2.13 Model fit (blue line) to the standardized combined recreational charterboat and private
CPUE index (open circles), 1986-2013 (top panel). The bottom panel also shows a comparison of the
observed and predicted indices, where the black line is the 1:1 line.
PRE-DECIS
IONAL

June 2015 Gulf of Mexico Red Grouper
SEDAR 42 SAR Section III Assessment Process Report
114
Figure 3.2.14 Model fit (blue line) to the standardized recreational headboat CPUE index (open circles),
1986-2013 (top panel). The bottom panel also shows a comparison of the observed and predicted
indices, where the black line is the 1:1 line.
PRE-DECIS
IONAL

June 2015 Gulf of Mexico Red Grouper
SEDAR 42 SAR Section III Assessment Process Report
115
Figure 3.2.15 Model fit (blue line) to the red tide index (open circles), 1998-2013 (top panel). The
bottom panel also shows a comparison of the observed and predicted indices, where the black line is
the 1:1 line.
PRE-DECIS
IONAL

June 2015 Gulf of Mexico Red Grouper
SEDAR 42 SAR Section III Assessment Process Report
116
Figure 3.2.16 Model fit (blue line) to the standardized combined video survey index (open circles), 1993-
1997, 2002, and 2004-2013 (top panel). The bottom panel also shows a comparison of the observed and
predicted indices, where the black line is the 1:1 line.
PRE-DECIS
IONAL

June 2015 Gulf of Mexico Red Grouper
SEDAR 42 SAR Section III Assessment Process Report
117
Figure 3.2.17 Model fit (blue line) to the standardized SEAMAP groundfish survey index (open circles),
2009-2013 (top panel). The bottom panel also shows a comparison of the observed and predicted
indices, where the black line is the 1:1 line.
PRE-DECIS
IONAL

June 2015 Gulf of Mexico Red Grouper
SEDAR 42 SAR Section III Assessment Process Report
118
Figure 3.2.18 Model fit (blue line) to the standardized NMFS bottom longline survey index (open circles),
2001, 2003-2013 (top panel). The bottom panel also shows a comparison of the observed and predicted
indices, where the black line is the 1:1 line.
PRE-DECIS
IONAL

June 2015 Gulf of Mexico Red Grouper
SEDAR 42 SAR Section III Assessment Process Report
119
Figure 3.2.19 Observed and predicted length compositions of discards of Red Grouper in the commercial
vertical line fleet. Observed (N) sample sizes and effective sample sizes (effN) estimated by SS are also
reported. Observed sample sizes were capped at a maximum of 200 fish.
PRE-DECIS
IONAL

June 2015 Gulf of Mexico Red Grouper
SEDAR 42 SAR Section III Assessment Process Report
120
Figure 3.2.20 Pearson residuals for the length composition fit to commercial vertical line discards. Solid
circles are positive residuals (i.e., observed greater than predicted) and open circles are negative
residuals (i.e., predicted greater than observed).
PRE-DECIS
IONAL

June 2015 Gulf of Mexico Red Grouper
SEDAR 42 SAR Section III Assessment Process Report
121
Figure 3.2.21 Observed and predicted length compositions of discards of Red Grouper in the commercial
longline fleet. Observed (N) sample sizes and effective sample sizes (effN) estimated by SS are also
reported. Observed sample sizes were capped at a maximum of 200 fish.
PRE-DECIS
IONAL

June 2015 Gulf of Mexico Red Grouper
SEDAR 42 SAR Section III Assessment Process Report
122
Figure 3.2.22 Pearson residuals for the length composition fit to commercial longline discards. Solid
circles are positive residuals (i.e., observed greater than predicted) and open circles are negative
residuals (i.e., predicted greater than observed).
PRE-DECIS
IONAL

June 2015 Gulf of Mexico Red Grouper
SEDAR 42 SAR Section III Assessment Process Report
123
Figure 3.2.23 Observed and predicted length compositions of discards of Red Grouper in the combined
recreational charterboat and private fleet. Observed (N) sample sizes and effective sample sizes (effN)
estimated by SS are also reported. Observed sample sizes were capped at a maximum of 200 fish.
PRE-DECIS
IONAL

June 2015 Gulf of Mexico Red Grouper
SEDAR 42 SAR Section III Assessment Process Report
124
Figure 3.2.24 Pearson residuals for the length composition fit to the combined recreational charterboat
and private discards. Solid circles are positive residuals (i.e., observed greater than predicted) and open
circles are negative residuals (i.e., predicted greater than observed).
PRE-DECIS
IONAL

June 2015 Gulf of Mexico Red Grouper
SEDAR 42 SAR Section III Assessment Process Report
125
Figure 3.2.25 Observed and predicted length compositions of discards of Red Grouper in the
recreational headboat fleet. Observed (N) sample sizes and effective sample sizes (effN) estimated by SS
are also reported. Observed sample sizes were capped at a maximum of 200 fish.
PRE-DECIS
IONAL

June 2015 Gulf of Mexico Red Grouper
SEDAR 42 SAR Section III Assessment Process Report
126
Figure 3.2.26 Pearson residuals for the length composition fit to recreational headboat discards. Solid
circles are positive residuals (i.e., observed greater than predicted) and open circles are negative
residuals (i.e., predicted greater than observed).
PRE-DECIS
IONAL

June 2015 Gulf of Mexico Red Grouper
SEDAR 42 SAR Section III Assessment Process Report
127
Figure 3.2.27 Observed and predicted length compositions of landings from the combined video survey.
Observed (N) sample sizes and effective sample sizes (effN) estimated by SS are also reported.
PRE-DECIS
IONAL

June 2015 Gulf of Mexico Red Grouper
SEDAR 42 SAR Section III Assessment Process Report
128
Figure 3.2.28 Pearson residuals for the length composition fit to the combined video survey length
observations. Solid circles are positive residuals (i.e., observed greater than predicted) and open circles
are negative residuals (i.e., predicted greater than observed).
PRE-DECIS
IONAL

June 2015 Gulf of Mexico Red Grouper
SEDAR 42 SAR Section III Assessment Process Report
129
Figure 3.2.29 Observed and predicted length compositions of landings from the SEAMAP groundfish
survey. Observed (N) sample sizes and effective sample sizes (effN) estimated by SS are also reported.
PRE-DECIS
IONAL

June 2015 Gulf of Mexico Red Grouper
SEDAR 42 SAR Section III Assessment Process Report
130
Figure 3.2.30 Pearson residuals for the length composition fit to the SEAMAP groundfish survey length
observations. Solid circles are positive residuals (i.e., observed greater than predicted) and open circles
are negative residuals (i.e., predicted greater than observed).
PRE-DECIS
IONAL

June 2015 Gulf of Mexico Red Grouper
SEDAR 42 SAR Section III Assessment Process Report
131
Figure 3.2.31 Observed and predicted length compositions of landings from the NMFS bottom longline
survey. Observed (N) sample sizes and effective sample sizes (effN) estimated by SS are also reported.
PRE-DECIS
IONAL

June 2015 Gulf of Mexico Red Grouper
SEDAR 42 SAR Section III Assessment Process Report
132
Figure 3.2.32 Pearson residuals for the length composition fit to the NMFS bottom longline survey
length observations. Solid circles are positive residuals (i.e., observed greater than predicted) and open
circles are negative residuals (i.e., predicted greater than observed).
PRE-DECIS
IONAL

June 2015 Gulf of Mexico Red Grouper
SEDAR 42 SAR Section III Assessment Process Report
133
Figure 3.2.33 Observed and predicted age compositions of landings of Red Grouper in the
commercial vertical line fleet. Observed (N) sample sizes and effective sample sizes (effN)
estimated by SS are also reported. Observed sample sizes were capped at a maximum of 200
fish.
PRE-DECIS
IONAL

June 2015 Gulf of Mexico Red Grouper
SEDAR 42 SAR Section III Assessment Process Report
134
Figure 3.2.34 Pearson residuals for the age composition fit to commercial vertical line landings.
Solid circles are positive residuals (i.e., observed greater than predicted) and open circles are
negative residuals (i.e., predicted greater than observed).
PRE-DECIS
IONAL

June 2015 Gulf of Mexico Red Grouper
SEDAR 42 SAR Section III Assessment Process Report
135
Figure 3.2.35 Observed and predicted age compositions of landings of Red Grouper in the
commercial longline fleet. Observed (N) sample sizes and effective sample sizes (effN)
estimated by SS are also reported. Observed sample sizes were capped at a maximum of 200
fish.
PRE-DECIS
IONAL

June 2015 Gulf of Mexico Red Grouper
SEDAR 42 SAR Section III Assessment Process Report
136
Figure 3.2.36 Pearson residuals for the age composition fit to commercial longline landings. Solid
circles are positive residuals (i.e., observed greater than predicted) and open circles are negative
residuals (i.e., predicted greater than observed).
PRE-DECIS
IONAL

June 2015 Gulf of Mexico Red Grouper
SEDAR 42 SAR Section III Assessment Process Report
137
Figure 3.2.37 Observed and predicted age compositions of landings of Red Grouper in the
commercial trap fleet. Observed (N) sample sizes and effective sample sizes (effN) estimated by
SS are also reported. Observed sample sizes were capped at a maximum of 200 fish.
PRE-DECIS
IONAL

June 2015 Gulf of Mexico Red Grouper
SEDAR 42 SAR Section III Assessment Process Report
138
Figure 3.2.38 Pearson residuals for the age composition fit to commercial trap landings. Solid
circles are positive residuals (i.e., observed greater than predicted) and open circles are negative
residuals (i.e., predicted greater than observed).
PRE-DECIS
IONAL

June 2015 Gulf of Mexico Red Grouper
SEDAR 42 SAR Section III Assessment Process Report
139
Figure 3.2.39 Observed and predicted age compositions of landings of Red Grouper in the
combined recreational charterboat and private fleet. Observed (N) sample sizes and effective
sample sizes (effN) estimated by SS are also reported. Observed sample sizes were capped at a
maximum of 200 fish.
PRE-DECIS
IONAL

June 2015 Gulf of Mexico Red Grouper
SEDAR 42 SAR Section III Assessment Process Report
140
Figure 3.2.40 Pearson residuals for the age composition fit to the combined recreational
charterboat and private landings. Solid circles are positive residuals (i.e., observed greater than
predicted) and open circles are negative residuals (i.e., predicted greater than observed).
PRE-DECIS
IONAL

June 2015 Gulf of Mexico Red Grouper
SEDAR 42 SAR Section III Assessment Process Report
141
Figure 3.2.41 Observed and predicted age compositions of landings of Red Grouper in the
recreational headboat fleet. Observed (N) sample sizes and effective sample sizes (effN)
estimated by SS are also reported. Observed sample sizes were capped at a maximum of 200
fish.
PRE-DECIS
IONAL

June 2015 Gulf of Mexico Red Grouper
SEDAR 42 SAR Section III Assessment Process Report
142
Figure 3.2.42 Pearson residuals for the age composition fit to recreational headboat landings. Solid
circles are positive residuals (i.e., observed greater than predicted) and open circles are negative
residuals (i.e., predicted greater than observed).
PRE-DECIS
IONAL

June 2015 Gulf of Mexico Red Grouper
SEDAR 42 SAR Section III Assessment Process Report
143
Figure 3.2.43 Likelihood profile on steepness at intervals of 0.02.
0.4 0.5 0.6 0.7 0.8 0.9 1.0
01
020
30
Steepness (h)
Cha
ng
e in
-lo
g-l
ikelih
oo
d
Total
Length data
Recruitment
Discard
Index data
Age data
Priors
Catch
PRE-DECIS
IONAL

June 2015 Gulf of Mexico Red Grouper
SEDAR 42 SAR Section III Assessment Process Report
144
Figure 3.2.44 Likelihood profile on Ln (R0) at intervals of 0.1.
8 9 10 11 12
05
01
00
15
0
Ln(R0)
Ch
an
ge
in
-lo
g-l
ike
lih
oo
d
TotalRecruitment
Age dataLength dataDiscardIndex data
PriorsCatch
PRE-DECIS
IONAL

June 2015 Gulf of Mexico Red Grouper
SEDAR 42 SAR Section III Assessment Process Report
145
Figure 3.2.45 Likelihood profile on σR at intervals of 0.1.
0.0 0.5 1.0 1.5
01
00
02
00
03
00
04
00
05
00
0
SigmaR
Ch
an
ge
in
-lo
g-l
ike
lih
oo
d
TotalIndex data
Age dataCatchLength dataRecruitment
DiscardEquilibrium catchPriors
PRE-DECIS
IONAL

June 2015 Gulf of Mexico Red Grouper
SEDAR 42 SAR Section III Assessment Process Report
146
Figure 3.2.46 Likelihood profile on Ln(R1_offset) at intervals of 0.2.
-4 -3 -2 -1 0 1
05
01
00
15
0
R1_offset
Ch
an
ge
in
-lo
g-l
ike
lih
oo
d
TotalLength data
RecruitmentIndex dataDiscardPriors
Age dataEquilibrium catch
PRE-DECIS
IONAL

June 2015 Gulf of Mexico Red Grouper
SEDAR 42 SAR Section III Assessment Process Report
147
Figure 3.2.47 Likelihood profile on the selectivity of the last length bin for the NMFS bottom longline
survey at intervals of 0.2.
-1 0 1 2 3 4 5
05
10
15
20
25
30
Dbl Norm Par6
Ch
an
ge
in
-lo
g-l
ike
lih
oo
d
TotalLength data
DiscardAge dataPriorsIndex data
RecruitmentCatch
PRE-DECIS
IONAL

June 2015 Gulf of Mexico Red Grouper
SEDAR 42 SAR Section III Assessment Process Report
148
Figure 3.2.48 The estimated age-based selectivity patterns for the five fishing fleets.
PRE-DECIS
IONAL

June 2015 Gulf of Mexico Red Grouper
SEDAR 42 SAR Section III Assessment Process Report
149
Figure 3.2.49 The estimated, commercial handline selectivity pattern using a random walk.
PRE-DECIS
IONAL

June 2015 Gulf of Mexico Red Grouper
SEDAR 42 SAR Section III Assessment Process Report
150
Figure 3.2.50 The estimated, commercial longline selectivity pattern using a random walk.
PRE-DECIS
IONAL

June 2015 Gulf of Mexico Red Grouper
SEDAR 42 SAR Section III Assessment Process Report
151
Figure 3.2.51 The estimated commercial trap selectivity pattern using a random walk.
PRE-DECIS
IONAL

June 2015 Gulf of Mexico Red Grouper
SEDAR 42 SAR Section III Assessment Process Report
152
Figure 3.2.52 The estimated charterboat-private mode selectivity pattern using a random walk.
PRE-DECIS
IONAL

June 2015 Gulf of Mexico Red Grouper
SEDAR 42 SAR Section III Assessment Process Report
153
Figure 3.2.53 The estimated headboat mode selectivity pattern using a random walk.
PRE-DECIS
IONAL

June 2015 Gulf of Mexico Red Grouper
SEDAR 42 SAR Section III Assessment Process Report
154
Figure 3.2.54 The estimated length-based selectivity patterns for the three fishery-independent surveys.
PRE-DECIS
IONAL

June 2015 Gulf of Mexico Red Grouper
SEDAR 42 SAR Section III Assessment Process Report
155
Figure 3.2.55 Length-based selectivity for the fishery-independent combined video survey.
PRE-DECIS
IONAL

June 2015 Gulf of Mexico Red Grouper
SEDAR 42 SAR Section III Assessment Process Report
156
Figure 3.2.56 Length-based selectivity for the fishery-independent SEAMAP groundfish survey.
PRE-DECIS
IONAL

June 2015 Gulf of Mexico Red Grouper
SEDAR 42 SAR Section III Assessment Process Report
157
Figure 3.2.57 Length-based selectivity for the fishery-independent NMFS bottom longline survey.
PRE-DECIS
IONAL

June 2015 Gulf of Mexico Red Grouper
SEDAR 42 SAR Section III Assessment Process Report
158
Figure 3.2.58 Predicted stock-recruitment relationship for Gulf of Mexico Red Grouper. Plotted are
predicted annual recruitments from SS (circles), expected recruitment from the stock-recruit
relationship (black line), and bias adjusted recruitment from the stock-recruit relationship (green line).
PRE-DECIS
IONAL

June 2015 Gulf of Mexico Red Grouper
SEDAR 42 SAR Section III Assessment Process Report
159
Figure 3.2.59 Predicted age-0 recruits with associated 95% asymptotic intervals.
PRE-DECIS
IONAL

June 2015 Gulf of Mexico Red Grouper
SEDAR 42 SAR Section III Assessment Process Report
160
Figure 3.2.60 Predicted total biomass (mt) of Gulf of Mexico Red Grouper from 1986 to 2013
PRE-DECIS
IONAL

June 2015 Gulf of Mexico Red Grouper
SEDAR 42 SAR Section III Assessment Process Report
161
Figure 3.2.61 Predicted spawning output (eggs) with associated 95% asymptotic intervals.
PRE-DECIS
IONAL

June 2015 Gulf of Mexico Red Grouper
SEDAR 42 SAR Section III Assessment Process Report
162
Figure 3.2.62 Predicted numbers-at-age (bubbles) and mean age of Gulf of Mexico Red Grouper.
PRE-DECIS
IONAL

June 2015 Gulf of Mexico Red Grouper
SEDAR 42 SAR Section III Assessment Process Report
163
Figure 3.2.63 Predicted numbers-at-length (bubbles) and mean length of Gulf of Mexico Red Grouper.
PRE-DECIS
IONAL

June 2015 Gulf of Mexico Red Grouper
SEDAR 42 SAR Section III Assessment Process Report
164
Figure 3.2.64 Predicted annual exploitation rate calculated as the ratio of total annual catch in weight to
total biomass in weight. The exceptionally high estimate of exploitation in 2005 is due to the estimation
of a red tide mortality term. PRE-DECIS
IONAL

June 2015 Gulf of Mexico Red Grouper
SEDAR 42 SAR Section III Assessment Process Report
165
Figure 3.2.65 Predicted fleet specific fishing mortality.
PRE-DECIS
IONAL

June 2015 Gulf of Mexico Red Grouper
SEDAR 42 SAR Section III Assessment Process Report
166
Figure 3.2.66 Fleet specific total catch (landings + discards).
PRE-DECIS
IONAL

June 2015 Gulf of Mexico Red Grouper
SEDAR 42 SAR Section III Assessment Process Report
167
Figure 3.2.67 Estimates of spawning stock biomass (SSB) in eggs from all sensitivity runs.
Figure 3.2.68 Estimates of age-0 recruits from all sensitivity runs.
PRE-DECIS
IONAL

June 2015 Gulf of Mexico Red Grouper
SEDAR 42 SAR Section III Assessment Process Report
168
Figure 3.2.69 Estimates of fishing mortality from all sensitivity runs.
PRE-DECIS
IONAL

June 2015 Gulf of Mexico Red Grouper
SEDAR 42 SAR Section III Assessment Process Report
169
Figure 3.2.70 Estimates of SSB, age-0 recruits, and fishing mortality for the natural mortality sensitivity
runs.
PRE-DECIS
IONAL

June 2015 Gulf of Mexico Red Grouper
SEDAR 42 SAR Section III Assessment Process Report
170
Figure 3.2.71 Estimates of SSB, age-0 recruits, and fishing mortality for the steepness sensitivity runs.
PRE-DECIS
IONAL

June 2015 Gulf of Mexico Red Grouper
SEDAR 42 SAR Section III Assessment Process Report
171
Figure 3.2.72 Estimates of SSB, age-0 recruits, and fishing mortality for the total discard sensitivity runs.
PRE-DECIS
IONAL

June 2015 Gulf of Mexico Red Grouper
SEDAR 42 SAR Section III Assessment Process Report
172
Figure 3.2.73 Estimates of SSB, age-0 recruits, and fishing mortality for the NMFS bottom longline
selectivity pattern sensitivity run.
PRE-DECIS
IONAL

June 2015 Gulf of Mexico Red Grouper
SEDAR 42 SAR Section III Assessment Process Report
173
Figure 3.2.74 Estimates of spawning stock biomass (SSB, eggs) from the jack-knife analysis.
Figure 3.2.75 Estimates of fishing mortality from the jack-knife analysis.
PRE-DECIS
IONAL

June 2015 Gulf of Mexico Red Grouper
SEDAR 42 SAR Section III Assessment Process Report
174
Figure 3.2.76 Estimates of age-0 recruits from the jack-knife analysis.
Figure 3.2.77 Estimates of spawning stock biomass (SSB, eggs) from the retrospective analysis.
PRE-DECIS
IONAL

June 2015 Gulf of Mexico Red Grouper
SEDAR 42 SAR Section III Assessment Process Report
175
Figure 3.2.78 Estimates of fishing mortality from the retrospective analysis.
Figure 3.2.79 Estimates of age-0 recruits from the retrospective analysis.
PRE-DECIS
IONAL

June 2015 Gulf of Mexico Red Grouper
SEDAR 42 SAR Section III Assessment Process Report
176
Figure 3.2.80 Estimates of the ratio between spawning stock biomass (SSB) and SSB achieved at MSY
(SSB_MSY) from the retrospective analysis.
Figure 3.2.81 Stock status with respect to the spawning stock biomass, where the ratio of SSB and the
minimum stock stize threshold (MSST) is used to determine whether a population is overfished.
PRE-DECIS
IONAL

June 2015 Gulf of Mexico Red Grouper
SEDAR 42 SAR Section III Assessment Process Report
177
Figure 3.2.82 Stock status with respect to fishing mortality, where the ratio between fishing mortality (F)
and the maximum fishing mortlaity threshold (MFMT) is used to determine whether a population is
experiencing overfishing.
PRE-DECIS
IONAL

June 2015 Gulf of Mexico Red Grouper
SEDAR 42 SAR Section III Assessment Process Report
178
Figure 3.2.83 Projection results, the ratio between reproductive potentional in eggs (SSB) and minimum stock size threshold (MSST, upper left
panel), age-0 recruits (upper right panel), the ratio between fishing mortality (F) and Fmsy (lower left panel), and retained yield (lower right
panel), for three fishing mortality scenarios: F = Fmsy, F = Foy (75% Fmsy), and F = Fcurrent. PRE-DECIS
IONAL

June 2015 Gulf of Mexico Red Grouper
SEDAR 42 SAR Section III Assessment Process Report
179
Figure 3.2.84 Yield per recruit (YPR, blue line) and spawner per recruit (SPR, red line) as a function of
fishing mortality for SSB-female. Vertical lines represent Fmsy (F = 0.16), Fmax (F = 0.66), and Fspr30% (F
= 0.72).
PRE-DECIS
IONAL

June 2015 Gulf of Mexico Red Grouper
SEDAR 42 SAR Section III Assessment Process Report
180
3.8 Appendix
Appendix A. Data file used for the Red Grouper Stock Synthesis model.
#V3.20f
#C this comment will be stored because it starts with #C.
It will be written to output files
1986 #_styr
2013 #_endyr
1 #_nseas
12 #_months/season
1 #_spawn_seas
6 #_Nfleet
4 #_Nsurveys
1 #_N_areas
# below are the fishery and survey names, separated by a %
delimiter; later the data from first survey will have index number
2 and survey 2 will have index number3
commHL%commLL%commTrap%CBT_PR%HB%RedTide%SEAMAP_Vid%SEAMAP_GF%NMFS_BLL%CBT_
PRSur
-1 -1 -1 -1 -1 -1 0.5 0.5 0.5 0.5
#_surveytiming_in_season; but use -1 for a fishery so that
the expected value will be same as the whole season catch-
at-age, rather than a midseason sample
1 1 1 1 1 1 1 1 1 1
#_area_assignments_for_each_fishery_and_survey; so in a multi-area
setup, each fleet and survey only occurs in one area
1 1 1 2 2 2
#_units_of_Catch_for_each_Fleet:_1=biomass;_2=numbers; It is OK to
have some fleets with catch in biomass and some in
numbers
0.05 0.05 0.05 0.05 0.05 -1 #_se_of_log(catch) for each fleet. This
is used for
PRE-DECIS
IONAL

June 2015 Gulf of Mexico Red Grouper
SEDAR 42 SAR Section III Assessment Process Report
181
init_eq_catch_and_for_Fmethod_2_and_3;_do_not_make_this_overly_small. Year specific
values can be input in the control file if needed.
1 #_Ngenders: if 2 genders are used, females will be gender=1
and their data will be entered first
20 #_Nages: this accumulator age should be large enough so that
little growth occurs after reaching this age
1168.167 1281.168 258.513 560.36 28.865 0
#_init_equil_catch_for_each_fishery
134 #_N_lines_of_catch_to_read
#_catch_biomass(mtons):_columns_are_fisheries,year,season
# Commercial landings are in gutted metric tons
# Rec landings are in numbers
1421.948 1136.626 327.249 605.318 32.913 0 1986 1
1153.087 1712.243 203.246 336.508 25.729 0 1987 1
929.465 994.634 245.043 739.254 27.954 0 1988 1
1730.406 1414.392 268.877 751.017 49.777 0 1989 1
1116.269 918.839 154.628 180.334 14.582 0 1990 1
949.749 1171.895 169.529 295.986 9.509 0 1991 1
655.426 1092.953 273.147 471.717 9.049 0 1992 1
589.817 1938.815 322.543 359.095 8.802 0 1993 1
563.102 1224.284 414.504 311.441 9.617 0 1994 1
531.27 1101.965 479.444 285.734 14.499 0 1995 1
392.427 1318.679 244.649 109.879 15.594 0 1996 1
430.178 1371.747 311.088 77.233 4.676 0 1997 1
336.39 1207.755 134.966 108.91 4.382 0.001 1998 1
550.097 1730.638 341.019 195.205 6.918 0.001 1999 1
780.627 1319.655 464.846 366.937 8.861 0.001 2000 1
PRE-DECIS
IONAL

June 2015 Gulf of Mexico Red Grouper
SEDAR 42 SAR Section III Assessment Process Report
182
705.66 1542.048 337.15 237.09 5.56 0.001 2001 1
738.529 1419.999 444.653 267.88 4.402 0.001 2002 1
507.236 1344.782 318.271 218.029 7.521 0.001 2003 1
624.44 1534.715 338.021 529.891 13.81 0.001 2004 1
636.955 1456.744 277.924 183.664 13.967 0.001 2005 1
624.002 1366.521 266.189 131.509 4.63 0.001 2006 1
708.094 900.102 11.102 154.741 4.245 0.001 2007 1
856.484 1271.938 0 133.129 5.003 0.001 2008 1
1109.097 510.213 0 124.559 4.666 0.001 2009 1
614.033 596.212 0 156.087 4.952 0.001 2010 1
765.79 1381.228 0.007 110.909 7.387 0.001 2011 1
1011.3 1333.59 0 300.283 13.544 0.001 2012 1
698.756 1368.763 0 440.387 14.089 0.001 2013 1
139 #_N_cpue_and_surveyabundance_observations
#_Units: 0=numbers; 1=biomass;
#_Errtype: -1=normal; 0=lognormal;
#_Fleet Units Errtype
1 1 0 # commHL_1
2 1 0 # commLL_2
3 1 0 # commTRAP_3
4 0 0 # CBT_PR_4
5 0 0 # HB_5
6 2 0 # RedTide
7 0 0 # SEAMAP_Vid_7
8 0 0 # SEAMAP_GF_8
PRE-DECIS
IONAL

June 2015 Gulf of Mexico Red Grouper
SEDAR 42 SAR Section III Assessment Process Report
183
9 0 0 # NMFS_BLL_9
10 0 0 # CBT_PRSurv
#_year seas index obs err # Label #
1993 1 1 0.7311 0.30939 # commHL_1 #
1994 1 1 0.716 0.30573 # commHL_1 #
1995 1 1 0.7886 0.30929 # commHL_1 #
1996 1 1 0.4907 0.31794 # commHL_1 #
1997 1 1 0.5647 0.31855 # commHL_1 #
1998 1 1 0.5185 0.31722 # commHL_1 #
1999 1 1 0.7399 0.31112 # commHL_1 #
2000 1 1 0.9911 0.3038 # commHL_1 #
2001 1 1 1.347 0.29536 # commHL_1 #
2002 1 1 1.3871 0.29495 # commHL_1 #
2003 1 1 0.9471 0.29078 # commHL_1 #
2004 1 1 1.274 0.2858 # commHL_1 #
2005 1 1 1.4169 0.28763 # commHL_1 #
2006 1 1 1.1435 0.29109 # commHL_1 #
2007 1 1 1.2066 0.28824 # commHL_1 #
2008 1 1 1.5309 0.28671 # commHL_1 #
2009 1 1 1.2061 0.28641 # commHL_1 #
1993 1 2 0.9785 0.33218 # commLL_2 #
1994 1 2 0.7235 0.2943 # commLL_2 #
1995 1 2 0.7742 0.30486 # commLL_2 #
1996 1 2 1.0397 0.31852 # commLL_2 #
1997 1 2 0.9069 0.26574 # commLL_2 #
PRE-DECIS
IONAL

June 2015 Gulf of Mexico Red Grouper
SEDAR 42 SAR Section III Assessment Process Report
184
1998 1 2 0.9552 0.27381 # commLL_2 #
1999 1 2 0.9968 0.27195 # commLL_2 #
2000 1 2 0.898 0.28871 # commLL_2 #
2001 1 2 1.0563 0.27754 # commLL_2 #
2002 1 2 1.06 0.29244 # commLL_2 #
2003 1 2 0.9284 0.28126 # commLL_2 #
2004 1 2 1.1124 0.27319 # commLL_2 #
2005 1 2 1.4437 0.28251 # commLL_2 #
2006 1 2 1.0927 0.27009 # commLL_2 #
2007 1 2 0.7796 0.31169 # commLL_2 #
2008 1 2 1.1811 0.30796 # commLL_2 #
2009 1 2 1.0731 0.45325 # commLL_2 #
1986 1 5 1.0334 0.31493 # HB_5 #
1987 1 5 1.6494 0.285 # HB_5 #
1988 1 5 1.6056 0.27997 # HB_5 #
1989 1 5 1.5487 0.28973 # HB_5 #
1990 1 5 0.699 0.32704 # HB_5 #
1991 1 5 0.4941 0.34598 # HB_5 #
1992 1 5 0.4723 0.34554 # HB_5 #
1993 1 5 0.6343 0.318 # HB_5 #
1994 1 5 0.5523 0.32777 # HB_5 #
1995 1 5 0.8352 0.30809 # HB_5 #
1996 1 5 0.4933 0.33475 # HB_5 #
1997 1 5 0.475 0.33612 # HB_5 #
1998 1 5 0.5671 0.33016 # HB_5 #
PRE-DECIS
IONAL

June 2015 Gulf of Mexico Red Grouper
SEDAR 42 SAR Section III Assessment Process Report
185
1999 1 5 0.4741 0.33421 # HB_5 #
2000 1 5 0.5944 0.32977 # HB_5 #
2001 1 5 0.8726 0.30414 # HB_5 #
2002 1 5 0.8929 0.29716 # HB_5 #
2003 1 5 1.4145 0.25883 # HB_5 #
2004 1 5 2.1247 0.24276 # HB_5 #
2005 1 5 2.3719 0.23998 # HB_5 #
2006 1 5 0.8687 0.30585 # HB_5 #
2007 1 5 0.9534 0.29305 # HB_5 #
2008 1 5 0.88 0.29652 # HB_5 #
2009 1 5 0.68 0.30492 # HB_5 #
2010 1 5 1.1157 0.27357 # HB_5 #
2011 1 5 1.0953 0.26137 # HB_5 #
2012 1 5 1.4104 0.24726 # HB_5 #
2013 1 5 1.1915 0.26752 # HB_5 #
1998 1 6 0.0001 0.01 # REDTIDE
1999 1 6 0.0001 0.01 # REDTIDE
2000 1 6 0.0001 0.01 # REDTIDE
2001 1 6 0.0001 0.01 # REDTIDE
2002 1 6 0.0001 0.01 # REDTIDE
2003 1 6 0.0001 0.01 # REDTIDE
2004 1 6 0.0001 0.01 # REDTIDE
2005 1 6 1 0.01 # REDTIDE
2006 1 6 0.0001 0.01 # REDTIDE
2007 1 6 0.0001 0.01 # REDTIDE
PRE-DECIS
IONAL

June 2015 Gulf of Mexico Red Grouper
SEDAR 42 SAR Section III Assessment Process Report
186
2008 1 6 0.0001 0.01 # REDTIDE
2009 1 6 0.0001 0.01 # REDTIDE
2010 1 6 0.0001 0.01 # REDTIDE
2011 1 6 0.0001 0.01 # REDTIDE
2012 1 6 0.0001 0.01 # REDTIDE
2013 1 6 0.0001 0.01 # REDTIDE
1993 1 7 0.766 0.47365 # SEAMAP_Vid_7 #
1994 1 7 1.0119 0.48119 # SEAMAP_Vid_7 #
1995 1 7 1.0444 0.54786 # SEAMAP_Vid_7 #
1996 1 7 0.9761 0.39249 # SEAMAP_Vid_7 #
1997 1 7 1.1872 0.30205 # SEAMAP_Vid_7 #
2002 1 7 1.1571 0.31364 # SEAMAP_Vid_7 #
2004 1 7 1.3156 0.28379 # SEAMAP_Vid_7 #
2005 1 7 1.0877 0.23451 # SEAMAP_Vid_7 #
2006 1 7 0.9176 0.23538 # SEAMAP_Vid_7 #
2007 1 7 0.5652 0.32814 # SEAMAP_Vid_7 #
2008 1 7 0.6947 0.27886 # SEAMAP_Vid_7 #
2009 1 7 0.8743 0.20987 # SEAMAP_Vid_7 #
2010 1 7 1.1093 0.1832 # SEAMAP_Vid_7 #
2011 1 7 1.2464 0.14668 # SEAMAP_Vid_7 #
2012 1 7 1.0255 0.17392 # SEAMAP_Vid_7 #
2013 1 7 1.0211 0.2148 # SEAMAP_Vid_7 #
2009 1 8 1.4703 0.29223 # SEAMAP_GF_8 #
2010 1 8 0.9486 0.2983 # SEAMAP_GF_8 #
2011 1 8 0.9334 0.31917 # SEAMAP_GF_8 #
PRE-DECIS
IONAL

June 2015 Gulf of Mexico Red Grouper
SEDAR 42 SAR Section III Assessment Process Report
187
2012 1 8 0.9518 0.27765 # SEAMAP_GF_8 #
2013 1 8 0.6959 0.31266 # SEAMAP_GF_8 #
2001 1 9 0.6445 0.29973 # NMFS_BLL_9 #
2003 1 9 0.8907 0.20933 # NMFS_BLL_9 #
2004 1 9 1.4493 0.19919 # NMFS_BLL_9 #
2005 1 9 0.5438 0.40675 # NMFS_BLL_9 #
2006 1 9 0.4974 0.39368 # NMFS_BLL_9 #
2007 1 9 0.77 0.4612 # NMFS_BLL_9 #
2008 1 9 0.5298 0.32732 # NMFS_BLL_9 #
2009 1 9 0.818 0.27036 # NMFS_BLL_9 #
2010 1 9 1.1009 0.27141 # NMFS_BLL_9 #
2011 1 9 2.0208 0.18801 # NMFS_BLL_9 #
2012 1 9 1.8742 0.26158 # NMFS_BLL_9 #
2013 1 9 0.8606 0.31143 # NMFS_BLL_9 #
1986 1 10 1.0925 0.25451 # CBT_PRSurv_10 #
1987 1 10 0.8681 0.3013 # CBT_PRSurv_10 #
1988 1 10 1.1339 0.33987 # CBT_PRSurv_10 #
1989 1 10 1.3293 0.294 # CBT_PRSurv_10 #
1990 1 10 1.5569 0.26209 # CBT_PRSurv_10 #
1991 1 10 1.4756 0.33192 # CBT_PRSurv_10 #
1992 1 10 1.2438 0.28789 # CBT_PRSurv_10 #
1993 1 10 0.7682 0.33867 # CBT_PRSurv_10 #
1994 1 10 0.8707 0.31888 # CBT_PRSurv_10 #
1995 1 10 0.8627 0.31407 # CBT_PRSurv_10 #
1996 1 10 0.5555 0.36974 # CBT_PRSurv_10 #
PRE-DECIS
IONAL

June 2015 Gulf of Mexico Red Grouper
SEDAR 42 SAR Section III Assessment Process Report
188
1997 1 10 0.5467 0.37584 # CBT_PRSurv_10 #
1998 1 10 0.6533 0.33136 # CBT_PRSurv_10 #
1999 1 10 0.735 0.3124 # CBT_PRSurv_10 #
2000 1 10 0.8305 0.30473 # CBT_PRSurv_10 #
2001 1 10 0.6524 0.31074 # CBT_PRSurv_10 #
2002 1 10 0.7901 0.30343 # CBT_PRSurv_10 #
2003 1 10 0.9794 0.29058 # CBT_PRSurv_10 #
2004 1 10 1.2459 0.2546 # CBT_PRSurv_10 #
2005 1 10 0.8296 0.28669 # CBT_PRSurv_10 #
2006 1 10 0.4391 0.36253 # CBT_PRSurv_10 #
2007 1 10 0.6953 0.3075 # CBT_PRSurv_10 #
2008 1 10 1.1731 0.25784 # CBT_PRSurv_10 #
2009 1 10 1.5401 0.24831 # CBT_PRSurv_10 #
2010 1 10 1.1744 0.25516 # CBT_PRSurv_10 #
2011 1 10 1.3397 0.25358 # CBT_PRSurv_10 #
2012 1 10 1.1216 0.25377 # CBT_PRSurv_10 #
2013 1 10 1.4966 0.278 # CBT_PRSurv_10 #
#_discard_units (1=same_as_catchunits(bio/num); 2=fraction; 3=numbers)
#_discard_errtype: >0 for DF of T-dist(read CV below);
normal with CV; -1 for normal with se; -2 for lognormal
#_Fleet units errtype
1 3 -2 # commHL_1
2 3 -2 # commLL_2
3 3 -2 # commTRAP_3
4 3 -2 # CBT_PR_4
5 3 -2 # HB_5
PRE-DECIS
IONAL
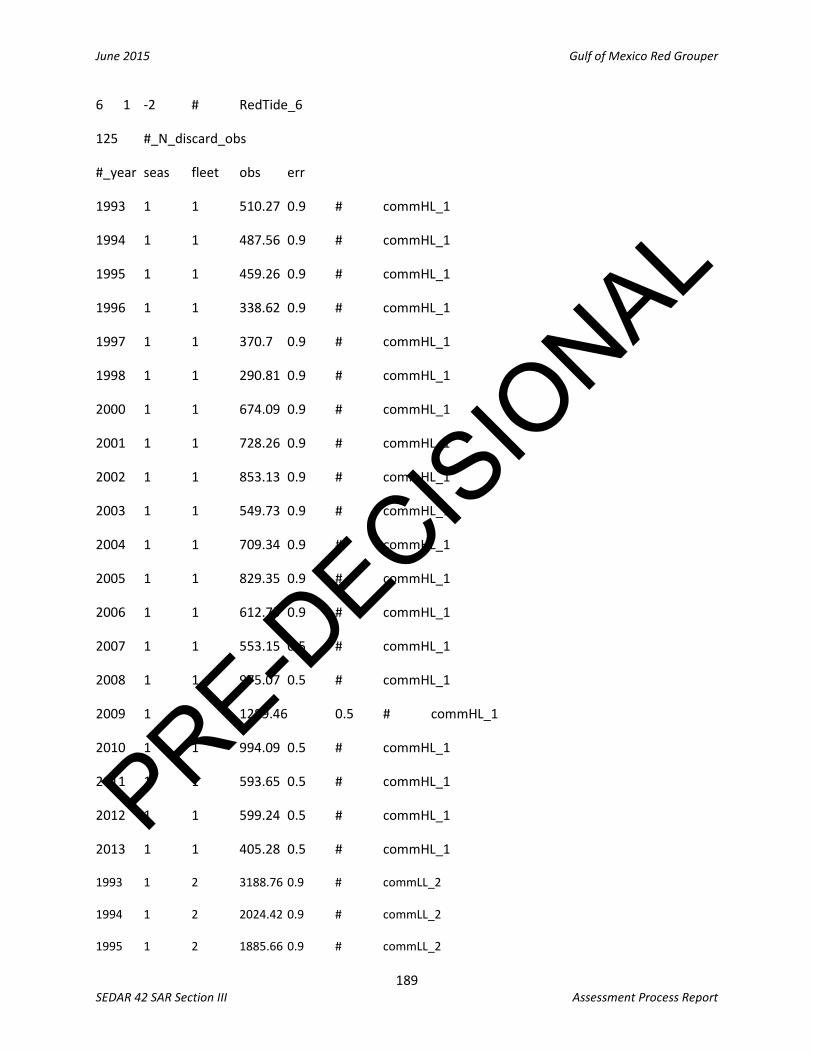
June 2015 Gulf of Mexico Red Grouper
SEDAR 42 SAR Section III Assessment Process Report
189
6 1 -2 # RedTide_6
125 #_N_discard_obs
#_year seas fleet obs err
1993 1 1 510.27 0.9 # commHL_1
1994 1 1 487.56 0.9 # commHL_1
1995 1 1 459.26 0.9 # commHL_1
1996 1 1 338.62 0.9 # commHL_1
1997 1 1 370.7 0.9 # commHL_1
1998 1 1 290.81 0.9 # commHL_1
2000 1 1 674.09 0.9 # commHL_1
2001 1 1 728.26 0.9 # commHL_1
2002 1 1 853.13 0.9 # commHL_1
2003 1 1 549.73 0.9 # commHL_1
2004 1 1 709.34 0.9 # commHL_1
2005 1 1 829.35 0.9 # commHL_1
2006 1 1 612.75 0.9 # commHL_1
2007 1 1 553.15 0.5 # commHL_1
2008 1 1 975.07 0.5 # commHL_1
2009 1 1 1289.46 0.5 # commHL_1
2010 1 1 994.09 0.5 # commHL_1
2011 1 1 593.65 0.5 # commHL_1
2012 1 1 599.24 0.5 # commHL_1
2013 1 1 405.28 0.5 # commHL_1
1993 1 2 3188.76 0.9 # commLL_2
1994 1 2 2024.42 0.9 # commLL_2
1995 1 2 1885.66 0.9 # commLL_2
PRE-DECIS
IONAL

June 2015 Gulf of Mexico Red Grouper
SEDAR 42 SAR Section III Assessment Process Report
190
1996 1 2 2308.81 0.9 # commLL_2
1997 1 2 2336.64 0.9 # commLL_2
1998 1 2 2053.71 0.9 # commLL_2
1999 1 2 2926.61 0.9 # commLL_2
2000 1 2 2186 0.9 # commLL_2
2001 1 2 2479.02 0.9 # commLL_2
2002 1 2 2297 0.9 # commLL_2
2003 1 2 2194.27 0.9 # commLL_2
2004 1 2 2497.77 0.9 # commLL_2
2005 1 2 2359.92 0.9 # commLL_2
2006 1 2 2216.68 0.9 # commLL_2
2007 1 2 1511.24 0.5 # commLL_2
2008 1 2 1275.03 0.5 # commLL_2
2009 1 2 793.21 0.5 # commLL_2
2010 1 2 616.22 0.5 # commLL_2
2011 1 2 1408.01 0.5 # commLL_2
2012 1 2 1133.24 0.5 # commLL_2
2013 1 2 840.29 0.5 # commLL_2
1990 1 3 69.05 0.9 # commTRAP_3
1991 1 3 131.4 0.9 # commTRAP_3
1992 1 3 87.5 0.9 # commTRAP_3
1993 1 3 169.87 0.9 # commTRAP_3
1994 1 3 53.9 0.9 # commTRAP_3
1995 1 3 124.73 0.9 # commTRAP_3
1996 1 3 732.74 0.9 # commTRAP_3
1997 1 3 598.57 0.9 # commTRAP_3
1998 1 3 50.19 0.9 # commTRAP_3
PRE-DECIS
IONAL

June 2015 Gulf of Mexico Red Grouper
SEDAR 42 SAR Section III Assessment Process Report
191
1999 1 3 106.19 0.9 # commTRAP_3
2000 1 3 234.98 0.9 # commTRAP_3
2001 1 3 167.62 0.9 # commTRAP_3
2002 1 3 146.06 0.9 # commTRAP_3
2003 1 3 134.7 0.9 # commTRAP_3
2004 1 3 81.9 0.9 # commTRAP_3
2005 1 3 122.09 0.9 # commTRAP_3
2006 1 3 139.27 0.9 # commTRAP_3
1981 1 4 61.2 0.5 # MRFSS_4
1982 1 4 38.81 0.5 # MRFSS_4
1983 1 4 48.61 0.5 # MRFSS_4
1984 1 4 46.12 0.5 # MRFSS_4
1985 1 4 63.19 0.5 # MRFSS_4
1986 1 4 464.26 0.5 # MRFSS_4
1987 1 4 311.65 0.5 # MRFSS_4
1988 1 4 773.1 0.5 # MRFSS_4
1989 1 4 1831.36 0.5 # MRFSS_4
1990 1 4 1462.48 0.5 # MRFSS_4
1991 1 4 2643.55 0.5 # MRFSS_4
1992 1 4 2280.88 0.5 # MRFSS_4
1993 1 4 1578.13 0.5 # MRFSS_4
1994 1 4 1463.31 0.5 # MRFSS_4
1995 1 4 1460.5 0.5 # MRFSS_4
1996 1 4 768 0.5 # MRFSS_4
1997 1 4 812.83 0.5 # MRFSS_4
1998 1 4 1466.21 0.5 # MRFSS_4
1999 1 4 1966.82 0.5 # MRFSS_4
PRE-DECIS
IONAL

June 2015 Gulf of Mexico Red Grouper
SEDAR 42 SAR Section III Assessment Process Report
192
2000 1 4 2159.51 0.5 # MRFSS_4
2001 1 4 1569.41 0.5 # MRFSS_4
2002 1 4 1845.37 0.5 # MRFSS_4
2003 1 4 1959.63 0.5 # MRFSS_4
2004 1 4 3149.76 0.5 # MRFSS_4
2005 1 4 1274.2 0.5 # MRFSS_4
2006 1 4 631.25 0.5 # MRFSS_4
2007 1 4 800.18 0.5 # MRFSS_4
2008 1 4 2975.12 0.5 # MRFSS_4
2009 1 4 3192.92 0.5 # MRFSS_4
2010 1 4 2211.75 0.5 # MRFSS_4
2011 1 4 2029.25 0.5 # MRFSS_4
2012 1 4 1742.3 0.5 # MRFSS_4
2013 1 4 2650.3 0.5 # MRFSS_4
1981 1 5 4.01 0.5 # HBT_5
1982 1 5 1.56 0.5 # HBT_5
1983 1 5 3.3 0.5 # HBT_5
1984 1 5 9.57 0.5 # HBT_5
1985 1 5 13.78 0.5 # HBT_5
1986 1 5 57.06 0.5 # HBT_5
1987 1 5 68.1 0.5 # HBT_5
1988 1 5 44.78 0.5 # HBT_5
1989 1 5 268.56 0.5 # HBT_5
1990 1 5 115.23 0.5 # HBT_5
1991 1 5 87.71 0.5 # HBT_5
1992 1 5 52.25 0.5 # HBT_5
1993 1 5 77.61 0.5 # HBT_5
PRE-DECIS
IONAL

June 2015 Gulf of Mexico Red Grouper
SEDAR 42 SAR Section III Assessment Process Report
193
1994 1 5 65.15 0.5 # HBT_5
1995 1 5 74.07 0.5 # HBT_5
1996 1 5 78.15 0.5 # HBT_5
1997 1 5 41.7 0.5 # HBT_5
1998 1 5 101.36 0.5 # HBT_5
1999 1 5 143.73 0.5 # HBT_5
2000 1 5 80.84 0.5 # HBT_5
2001 1 5 44.31 0.5 # HBT_5
2002 1 5 44.64 0.5 # HBT_5
2003 1 5 98.17 0.5 # HBT_5
2004 1 5 123.86 0.5 # HBT_5
2005 1 5 80.59 0.5 # HBT_5
2006 1 5 29.16 0.5 # HBT_5
2007 1 5 17.37 0.5 # HBT_5
2008 1 5 89.62 0.5 # HBT_5
2009 1 5 153.83 0.5 # HBT_5
2010 1 5 117.88 0.5 # HBT_5
2011 1 5 134.11 0.5 # HBT_5
2012 1 5 117.81 0.5 # HBT_5
2013 1 5 112.27 0.5 # HBT_5
0 #_N_meanbodywt_obs
30 #_DF_for_meanbodywt_T-distribution_like
2 # length bin method: 1=use databins(read below); 2=generate from
binwidth,min,max below; 3=read vector
2 # binwidth for population size comp
2 # minimum size in the population (lower edge of first
bin and size at age 0.00)
PRE-DECIS
IONAL

June 2015 Gulf of Mexico Red Grouper
SEDAR 42 SAR Section III Assessment Process Report
194
130 # maximum size in the population (lower edge of last
bin)
#_following two entries are used for all length and age composition
processing
0.0001 #_comp_tail_compression
1.00E-07 #_add_to_comp
0 #_combine males into females at or below this bin number (useful
if hard to sex small fish)
48 #_N_LengthBins
PRE-DECIS
IONAL

June 2015 Gulf of Mexico Red Grouper
SEDAR 42 SAR Section III Assessment Process Report
195
2 4 6 8 10 12 14 16 18 20 22 24 26 28 30 32 34 36
38 40 42 44 46 48 50 52 54 56 58 60 62 64 66 68 70
72 74 76 78 80 82 84 86 88 90 92 94 96
#year seas flt/svy gender part Nsamp 2 4 6 8 10 12 14 16 18 20 22 24
26 28 30 32 34 36 38 40 42 44 46 48 50 52 54 56 58
60 62 64 66 68 70 72 74 76 78 80 82 84 86 88 90 92
94 96 # 937
2006 1 1 1 1 100 0 0 0 0 0 0 0 0 0 0 0 0.00107
0 0 0.00961 0.02134 0.04482 0.08751 0.11419 0.16115 0.16435 0.13767 0.15155 0.09072 0.01387 0 0.00213 0 0
0 0 0 0 0 0 0 0 0 0 0 0 0 0 0 0 0
0 0 # 2064 # 937
2007 1 1 1 1 100 0 0 0 0 0 0 0 0 0 0 0.00145 0.00339
0.00242 0.00242 0.00436 0.00921 0.01211 0.02762 0.04748 0.1124 0.18169 0.19331 0.19913 0.15649 0.03779 0.00484 0.00194 0.00097 0.00048
0 0.00048 0 0 0 0 0 0 0 0 0 0 0 0 0 0 0
0 0 # 1073 # 2064
2008 1 1 1 1 100 0 0 0 0 0 0 0 0 0 0.00093 0.00093 0.00186
0.00186 0.00839 0.02516 0.03914 0.06431 0.05126 0.07642 0.07642 0.13048 0.16589 0.22088 0.12954 0.0028 0.0028 0.00093 0 0
0 0 0 0 0 0 0 0 0 0 0 0 0 0 0 0 0
0 0 # 1529 # 1073
2009 1 1 1 1 100 0 0 0 0 0 0 0 0 0 0 0.00065 0.00065
0.00392 0.01439 0.02943 0.07979 0.16612 0.1877 0.18247 0.155 0.09418 0.03859 0.02224 0.01373 0.00065 0.00131 0.00523 0.00065 0.00131
0 0.00065 0 0 0.00065 0 0 0 0 0.00065 0 0 0 0 0 0 0
0 0 # 2980 # 1529
2010 1 1 1 1 100 0 0 0 0 0 0 0 0 0 0 0.00034 0.00134
0.00302 0.00705 0.01409 0.0255 0.06779 0.14631 0.18993 0.24262 0.22483 0.06678 0.00671 0.00268 0.00067 0.00034 0 0 0
0 0 0 0 0 0 0 0 0 0 0 0 0 0 0 0 0
0 0 # 5190 # 2980 PRE-DECIS
IONAL

June 2015 Gulf of Mexico Red Grouper
SEDAR 42 SAR Section III Assessment Process Report
196
2011 1 1 1 1 100 0 0 0 0 0 0 0 0 0 0 0.00019 0
0.00116 0.00116 0.00482 0.0106 0.04104 0.0975 0.16031 0.21811 0.23873 0.18536 0.0341 0.00559 0.00019 0.00039 0.00039 0.00019 0
0.00019 0 0 0 0 0 0 0 0 0 0 0 0 0 0 0 0
0 0 # 8917 # 5190
2012 1 1 1 1 100 0 0 0 0 0 0 0 0.00022 0 0.00022 0.00011 0.00101
0.00168 0.00348 0.00707 0.01884 0.03645 0.07648 0.13514 0.20175 0.25221 0.16384 0.06011 0.02568 0.01054 0.00135 0.00146 0.00079 0.00067
0.00045 0.00034 0.00011 0 0 0 0 0 0 0 0 0 0 0 0 0 0
0 0 # 2291 # 8917
2013 1 1 1 1 100 0 0 0 0 0 0 0 0 0 0 0 0.00044
0.00131 0.00175 0.00873 0.03012 0.05412 0.09603 0.12746 0.22392 0.24007 0.14055 0.055 0.01746 0.00131 0.00131 0.00044 0 0
0 0 0 0 0 0 0 0 0 0 0 0 0 0 0 0 0
0 0 # 3912 # 2291
2006 1 2 1 1 100 0 0 0 0 0 0 0 0 0 0.00026 0 0
0 0.00204 0.00537 0.0138 0.03093 0.06084 0.10302 0.14238 0.16385 0.14647 0.14162 0.12551 0.04908 0.00511 0.00358 0.00179 0.00153
0.00077 0.00102 0.00026 0 0.00051 0.00026 0 0 0 0 0 0 0 0 0 0 0
0 0 # 2921 # 3912
2007 1 2 1 1 100 0 0 0 0 0 0 0 0 0 0 0 0
0.00068 0.0024 0.00719 0.01404 0.02705 0.03971 0.06915 0.12735 0.16296 0.20096 0.21499 0.11503 0.01541 0.00068 0.00068 0.00034 0.00103
0 0 0.00034 0 0 0 0 0 0 0 0 0 0 0 0 0 0
0 0 # 917 # 2921
2008 1 2 1 1 100 0 0 0 0 0 0 0 0 0 0.00109 0 0.00218
0.00545 0.01745 0.04907 0.0458 0.06761 0.07415 0.12105 0.15812 0.18212 0.19738 0.0687 0.00763 0.00109 0 0 0.00109 0
0 0 0 0 0 0 0 0 0 0 0 0 0 0 0 0 0
0 0 # 6447 # 917
2009 1 2 1 1 100 0 0 0 0 0.00016 0.00016 0 0 0 0.00016 0.00155 0.00062
0.00295 0.01039 0.03459 0.05972 0.08516 0.10408 0.10346 0.1047 0.13029 0.14518 0.13045 0.06654 0.01474 0.00217 0.00124 0.0014 0.00016
0 0.00016 0 0 0 0 0 0 0 0 0 0 0 0 0 0 0
0 0 # 18635 # 6447 PRE-DECIS
IONAL

June 2015 Gulf of Mexico Red Grouper
SEDAR 42 SAR Section III Assessment Process Report
197
2010 1 2 1 1 100 0 0 0 0 0 0 0 0 0 0.00005 0.00021 0.00059
0.0015 0.00762 0.02399 0.06075 0.10942 0.14929 0.17526 0.18975 0.16453 0.0945 0.0198 0.00129 0.00043 0.00027 0.00032 0 0.00016
0.00011 0.00005 0 0.00005 0 0 0.00005 0 0 0 0 0 0 0 0 0 0
0 0 # 40239 # 18635
2011 1 2 1 1 100 0 0 0 0 0 0 0 0 0 0 0.00015 0.00052
0.0008 0.00422 0.01228 0.03402 0.0718 0.11238 0.14759 0.18363 0.20028 0.14414 0.05713 0.02219 0.00678 0.00127 0.0003 0.0002 0.00005
0.00005 0.00007 0.00005 0.00005 0.00002 0 0 0 0.00002 0 0 0 0 0 0 0 0
0 0 # 11969 # 40239
2012 1 2 1 1 100 0 0 0 0 0 0 0 0 0 0 0 0
0.00042 0.00117 0.00384 0.01345 0.03367 0.09007 0.15766 0.20361 0.20754 0.15507 0.07035 0.03994 0.01211 0.00685 0.00343 0.00033 0.00017
0 0.00008 0.00017 0 0.00008 0 0 0 0 0 0 0 0 0 0 0 0
0 0 # 22056 # 11969
2013 1 2 1 1 100 0 0 0 0 0 0 0 0 0 0.00009 0.00009 0.00005
0.00086 0.00317 0.00775 0.01759 0.03595 0.06633 0.10954 0.17791 0.23526 0.20842 0.10251 0.02861 0.0039 0.00077 0.00027 0.00045 0.00009
0.00014 0.00005 0.00005 0 0 0 0 0.00005 0.00005 0.00005 0 0 0 0 0 0 0
0 0 # # 22056
2010 1 4 1 1 100 0 0 0 0 0 0 0 0 0 0.00021 0.00182 0.00459
0.01406 0.04494 0.1277 0.12816 0.15155 0.15372 0.11611 0.07649 0.05478 0.03796 0.0247 0.01481 0.01571 0.00822 0.00629 0.00439 0.0034
0.004 0.00187 0 0.00082 0.00028 0.00082 0 0.00059 0.00128 0.00072 0 0 0 0 0 0 0
0 0 # # 2313
2011 1 4 1 1 100 0 0 0 0 0 0 0 0 0 0 0 0
0.00112 0.00647 0.03107 0.05086 0.10275 0.1499 0.18568 0.14313 0.09952 0.07783 0.04891 0.0391 0.02981 0.01137 0.00562 0.00758 0.00113
0.00193 0.0015 0.00047 0.00044 0 0.00197 0.00131 0 0 0.00052 0 0 0 0 0 0 0
0 0 # # 1834
2012 1 4 1 1 100 0 0 0 0 0 0 0 0 0 0.0001 0.00011 0
0.00215 0.00841 0.01495 0.04218 0.0424 0.06393 0.11507 0.14696 0.13591 0.13842 0.10579 0.04571 0.0604 0.02433 0.01664 0.0103 0.00603
0.00244 0.00401 0.00227 0 0.00503 0.00088 0.00036 0.00364 0.00038 0.00081 0 0.0004 0 0 0 0 0
0 0 # # 1324 PRE-DECIS
IONAL

June 2015 Gulf of Mexico Red Grouper
SEDAR 42 SAR Section III Assessment Process Report
198
2013 1 4 1 1 100 0 0 0 0 0.00026 0 0 0 0 0 0 0.00096
0.00212 0.00968 0.01631 0.04516 0.05115 0.05577 0.05394 0.06403 0.14031 0.17147 0.14791 0.08885 0.05259 0.03283 0.01593 0.00494 0.01712
0.01041 0.00793 0.00151 0.00199 0 0 0 0 0.0013 0 0 0.00552 0 0 0 0 0
0 0 # 1195
2005 1 5 1 1 100 0 0 0 0 0 0 0 0.00239 0.00723 0.01353 0.04022 0.06889
0.0541 0.0599 0.0633 0.09093 0.10375 0.07107 0.04886 0.05949 0.04263 0.05341 0.04335 0.01649 0.00334 0.00181 0.00275 0.00094 0.00087
0.00007 0 0 0.0008 0 0 0 0 0 0 0 0 0 0 0 0 0
0 0 # 1126
2006 1 5 1 1 100 0 0 0 0 0 0 0.00206 0.02105 0.01799 0.0207 0.04287 0.07574
0.11561 0.11846 0.10795 0.08351 0.04475 0.04589 0.02836 0.0438 0.02643 0.02695 0.01669 0.0093 0.00181 0.00021 0 0 0
0 0 0 0 0 0 0 0 0 0 0 0 0 0 0 0 0
0 0 # 1058
2007 1 5 1 1 100 0 0 0 0.00003 0.00082 0 0.0007 0.00349 0.02041 0.03143 0.09084 0.1188
0.12969 0.10632 0.07839 0.04718 0.03707 0.03696 0.03753 0.02913 0.02441 0.02463 0.01842 0.00751 0.00331 0.00013 0.00137 0.00067 0
0 0 0 0 0.00003 0.0007 0.00013 0 0.00003 0 0 0 0 0 0 0 0
0 0 # 1633
2009 1 5 1 1 100 0 0 0 0 0 0.00053 0 0 0.00403 0.0007 0.02064 0.04008
0.05362 0.05867 0.11222 0.15123 0.13377 0.10421 0.06921 0.04634 0.02634 0.01492 0.00972 0.0016 0.0007 0 0.00106 0 0.00053
0 0 0 0 0 0 0 0 0 0 0 0 0 0 0 0 0
0 0 # 1734
2010 1 5 1 1 100 0 0 0 0 0 0 0 0.00101 0.0005 0.00151 0.00554 0.01519
0.03203 0.07606 0.1466 0.13503 0.12659 0.09329 0.07347 0.04869 0.04108 0.03006 0.01614 0.00533 0.00101 0.0005 0.0005 0 0
0 0 0 0 0 0 0 0 0 0 0 0 0 0 0 0 0
0 0 # 1592
2011 1 5 1 1 100 0 0 0 0 0 0 0 0.0016 0.00242 0.00161 0.00632 0.01906
0.02435 0.01874 0.03954 0.09063 0.15742 0.17804 0.10608 0.08124 0.04937 0.04659 0.01436 0.00632 0.00081 0.00081 0 0.00081 0.0016
0.00195 0 0.00046 0 0 0 0 0 0 0 0 0 0 0 0 0 0
0 0 # 1056 PRE-DECIS
IONAL

June 2015 Gulf of Mexico Red Grouper
SEDAR 42 SAR Section III Assessment Process Report
199
2012 1 5 1 1 100 0 0 0 0 0 0 0 0 0.00136 0.00133 0.0027 0.01471
0.03204 0.03607 0.04515 0.05426 0.06052 0.07549 0.10616 0.1409 0.11164 0.07456 0.05706 0.02459 0.00406 0.00406 0.0027 0 0.00077
0 0 0 0 0 0 0 0 0 0 0 0 0 0 0 0 0
0 0 # 635
2013 1 5 1 1 100 0 0 0 0 0 0 0 0.00042 0.00052 0 0.00665 0.00867
0.00763 0.02278 0.03187 0.0671 0.08033 0.07345 0.07364 0.12248 0.10366 0.09838 0.10886 0.03057 0.00612 0.0015 0.00192 0.0015 0.00202
0.00005 0 0 0 0 0 0 0 0 0 0 0 0 0 0 0 0
0 0 # 772
2008 1 7 1 2 32 0 0 0 0 0 0 0 0 0 0 0.03125 0
0.03125 0 0.03125 0.03125 0.0625 0 0 0.03125 0 0.09375 0.09375 0.0625 0.15625 0.15625 0.03125 0 0.0625
0.03125 0.0625 0 0 0 0 0 0 0 0 0 0 0 0 0 0 0
0 0.03125
2009 1 7 1 2 99 0 0 0 0 0 0 0 0 0 0.010101 0
0 0 0 0.050505 0.070707 0.090909 0.040404 0.141414 0.050505 0.080808
0.060606 0.060606 0.030303 0.040404 0.030303 0.060606 0.010101 0.040404
0.010101 0 0.020202 0.010101 0.020202 0.020202 0.010101 0.020202 0
0.010101 0 0.010101 0 0 0 0 0 0 0
2010 1 7 1 2 48 0 0 0 0 0 0 0 0 0 0 0 0
0.020833 0 0.041667 0 0 0.041667 0.041667 0.020833 0.145833 0.145833
0.104167 0.0625 0.041667 0.041667 0.083333 0.020833 0.0625 0 0.020833 0.020833
0.020833 0.041667 0 0 0 0 0 0 0.020833 0 0 0 0 0
0 0
2011 1 7 1 2 116 0 0 0 0 0 0 0 0 0 0 0 0
0 0.008621 0.008621 0.008621 0.051724 0.017241 0.034483 0.086207 0.043103
0.051724 0.112069 0.137931 0.043103 0.051724 0.051724 0.034483 0.008621
0.025862 0.060345 0.025862 0.025862 0.017241 0.025862 0.008621 0.008621
0.017241 0.008621 0.008621 0.017241 0 0 0 0 0 0 0
PRE-DECIS
IONAL

June 2015 Gulf of Mexico Red Grouper
SEDAR 42 SAR Section III Assessment Process Report
200
2012 1 7 1 2 105 0 0 0 0 0 0 0 0 0 0 0
0.009524 0.009524 0.009524 0 0.038095 0.047619 0.009524 0.066667 0.019048
0.047619 0.066667 0.07619 0.07619 0.07619 0.057143 0.085714 0.057143 0.038095 0.009524
0.047619 0.057143 0.009524 0.019048 0.019048 0 0.028571 0.019048 0 0
0 0 0 0 0 0 0 0
2013 1 7 1 2 39 0 0 0 0 0 0 0 0 0 0 0 0
0 0.025641 0 0.025641 0 0.076923 0.051282 0.051282 0.025641 0.051282
0.128205 0.076923 0 0.051282 0.051282 0.051282 0.076923 0.025641 0
0.025641 0 0.076923 0.025641 0 0.025641 0 0.025641 0.025641 0.025641
0 0 0 0 0 0 0
2008 1 8 1 0 33 0 0 0.0303 0 0 0 0 0 0.030303 0.060606
0.090909 0.090909 0.181818 0.151515 0.121212 0.060606 0.060606 0 0
0.060606 0 0 0.030303 0 0 0 0 0.030303 0 0 0 0 0
0 0 0 0 0 0 0 0 0 0 0 0 0 0 0
2009 1 8 1 0 298 0 0 0.00671 0.00671 0.01007 0.01678 0.00336 0.00671 0.013423 0.020134
0.083893 0.120805 0.137584 0.107383 0.083893 0.090604 0.097315 0.067114
0.043624 0.016779 0.02349 0.010067 0.003356 0.006711 0 0.003356 0.003356
0.006711 0 0 0.003356 0 0.003356 0.003356 0 0 0 0 0 0
0 0 0 0 0 0 0 0
2010 1 8 1 0 187 0 0 0 0 0 0.0107 0.04813 0.07487 0.02139 0.016043
0.026738 0.037433 0.085561 0.112299 0.117647 0.074866 0.085561 0.042781
0.080214 0.058824 0.032086 0.02139 0.010695 0.010695 0.005348 0.005348 0 0
0 0.005348 0.005348 0 0 0.005348 0.005348 0 0 0 0 0 0
0 0 0 0 0 0 0
2011 1 8 1 0 114 0 0.00877 0 0 0 0.00877 0.01754 0.12281 0.061404 0.026316
0.061404 0.070175 0.070175 0.087719 0.026316 0.070175 0.070175 0.061404
0.087719 0.026316 0.026316 0.017544 0 0.008772 0.017544 0.008772 0.008772PRE-DECIS
IONAL

June 2015 Gulf of Mexico Red Grouper
SEDAR 42 SAR Section III Assessment Process Report
201
0 0.008772 0 0 0 0 0.008772 0 0 0 0.008772 0 0.008772
0 0 0 0 0 0 0 0
2012 1 8 1 0 151 0.00662 0.04636 0.00662 0.02649 0.01325 0 0.00662 0.05298 0.059603 0.019868
0.02649 0.059603 0.086093 0.059603 0.059603 0.066225 0.033113 0.07947 0.019868
0.033113 0.046358 0.033113 0.019868 0.05298 0.013245 0.033113 0.013245 0.013245
0 0 0.006623 0 0 0 0 0 0 0 0 0 0.006623 0 0
0 0 0 0 0
2013 1 8 1 0 72 0 0 0.01389 0.01389 0 0.04167 0.01389 0.01389 0.055556 0.069444
0.027778 0.041667 0.041667 0.083333 0.013889 0.083333 0.041667 0.027778
0.041667 0.055556 0.069444 0.069444 0.027778 0 0.041667 0.013889 0.027778
0 0 0.027778 0 0.013889 0 0 0.013889 0 0.013889 0 0 0
0 0 0 0 0 0 0 0
-1995 1 9 1 0 10 0 0 0 0 0 0 0 0 0 0 0 0
0 0 0 0 0 0.1 0.1 0 0 0 0 0.1 0 0.1 0 0 0.1
0.1 0 0.1 0.2 0.1 0 0 0 0 0 0 0 0 0 0 0 0
0 0
-1996 1 9 1 0 6 0 0 0 0 0 0 0 0 0 0 0 0
0 0 0 0 0 0 0 0 0 0 0 0 0 0.33333 0.16667 0.16667 0
0.16667 0 0 0 0 0.16667 0 0 0 0 0 0 0 0 0 0 0
0 0
-1997 1 9 1 0 7 0 0 0 0 0 0 0 0 0 0 0 0
0 0 0 0 0 0 0 0 0 0 0 0 0 0 0.14286 0.14286 0.14286
0.14286 0 0 0.28571 0 0 0 0.14286 0 0 0 0 0 0 0 0 0
0 0
-1999 1 9 1 0 1 0 0 0 0 0 0 0 0 0 0 0 0
0 0 0 0 0 0 0 0 0 0 0 0 0 0 0 0 0
0 0 0 1 0 0 0 0 0 0 0 0 0 0 0 0 0
0 0 PRE-DECIS
IONAL

June 2015 Gulf of Mexico Red Grouper
SEDAR 42 SAR Section III Assessment Process Report
202
-2000 1 9 1 0 26 0 0 0 0 0 0 0 0 0 0 0 0
0 0 0 0 0 0.03846 0.03846 0.11538 0.19231 0 0.11538 0.11538 0.15385 0.07692 0.03846 0 0
0.07692 0 0.03846 0 0 0 0 0 0 0 0 0 0 0 0 0 0
0 0
2001 1 9 1 0 79 0 0 0 0 0 0 0 0 0 0 0 0
0 0.01266 0 0.06329 0 0 0.05063 0.10127 0.08861 0.10127 0.03797 0.08861 0.08861 0.05063 0.06329 0.05063 0.02532
0.05063 0.01266 0.02532 0.02532 0 0.01266 0.01266 0 0 0.01266 0.01266 0.01266 0 0 0 0 0
0 0
2002 1 9 1 0 16 0 0 0 0 0 0 0 0 0 0 0 0
0 0 0 0 0 0.0625 0 0.0625 0.0625 0.0625 0 0.1875 0.1875 0 0 0 0
0.125 0 0.0625 0.125 0 0 0 0 0 0.0625 0 0 0 0 0 0 0
0 0
2003 1 9 1 0 162 0 0 0 0 0 0 0 0 0 0 0 0
0 0.00617 0 0.01235 0.02469 0.03704 0.03704 0.11728 0.08642 0.12346 0.09259 0.0679 0.05556 0.04321 0.01235 0.01852 0.03704
0.01235 0.03704 0.01852 0.03704 0.01852 0.01852 0.02469 0.00617 0.02469 0.01235 0.01235 0 0.00617 0 0 0 0
0 0
2004 1 9 1 0 170 0 0 0 0 0 0 0 0 0 0 0 0
0 0.00588 0.00588 0.00588 0.02941 0.01765 0.06471 0.07059 0.10588 0.12941 0.10588 0.1 0.05882 0.02941 0.04118 0.02941 0.00588
0.02353 0.04118 0 0.02353 0.04118 0.01765 0.01765 0.01765 0 0.01176 0 0 0 0 0 0 0
0 0
2005 1 9 1 0 32 0 0 0 0 0 0 0 0 0 0 0 0
0 0 0.03125 0.125 0.03125 0.03125 0.03125 0.03125 0.1875 0.0625 0.03125 0.15625 0 0.03125 0.03125 0 0
0.0625 0 0.0625 0.03125 0.03125 0.03125 0 0 0 0 0 0 0 0 0 0 0
0 0
2006 1 9 1 0 32 0 0 0 0 0 0 0 0 0 0 0 0
0 0 0 0 0 0.0625 0.0625 0 0.0625 0.09375 0.0625 0.09375 0.0625 0.0625 0.15625 0.03125 0.0625
0.03125 0.03125 0 0.125 0 0 0 0 0 0 0 0 0 0 0 0 0
0 0 PRE-DECIS
IONAL

June 2015 Gulf of Mexico Red Grouper
SEDAR 42 SAR Section III Assessment Process Report
203
2007 1 9 1 0 51 0 0 0 0 0 0 0 0 0 0 0 0
0 0 0 0 0.01961 0 0.09804 0.11765 0.07843 0.09804 0.21569 0.13725 0.05882 0.01961 0.01961 0 0.03922
0.01961 0 0.01961 0.01961 0.03922 0 0 0 0 0 0 0 0 0 0 0 0
0 0
2008 1 9 1 0 31 0 0 0 0 0 0 0 0 0 0 0 0
0.03226 0 0.03226 0 0.06452 0.03226 0 0 0.06452 0.03226 0 0.06452 0.03226 0.09677 0.06452 0.03226 0.06452
0.06452 0 0.09677 0.12903 0 0 0.03226 0.03226 0 0 0.03226 0 0 0 0 0 0
0 0
2009 1 9 1 0 64 0 0 0 0 0 0 0 0 0 0 0 0
0 0 0.01563 0.03125 0.10938 0.10938 0.01563 0.0625 0.07813 0.03125 0 0 0.04688 0.0625 0.03125 0.09375 0.0625
0.04688 0.01563 0.04688 0.04688 0.03125 0.01563 0.01563 0.01563 0 0 0 0 0 0.01563 0 0 0
0 0
2010 1 9 1 0 81 0 0 0 0 0 0 0 0 0 0 0 0
0 0 0 0.04938 0.02469 0.01235 0.07407 0.07407 0.06173 0.1358 0.04938 0.04938 0.04938 0.11111 0.04938 0.02469 0.03704
0 0.04938 0.03704 0.02469 0.02469 0 0.02469 0.01235 0 0.01235 0.01235 0 0 0 0 0 0
0 0
2011 1 9 1 0 312 0 0 0 0 0 0 0 0 0 0 0 0
0 0.00321 0.00321 0.00962 0.03526 0.05769 0.06731 0.08333 0.09615 0.07692 0.08654 0.10256 0.08013 0.04808 0.05128 0.03526 0.02885
0.01603 0.02564 0.02244 0.01923 0.02244 0.01603 0.00641 0.00641 0 0 0 0 0 0 0 0 0
0 0
2012 1 9 1 0 111 0 0 0 0 0 0 0 0 0 0 0 0
0 0 0 0.01802 0.01802 0.01802 0.05405 0.06306 0.09009 0.04505 0.04505 0.15315 0.06306 0.14414 0.06306 0.02703 0.04505
0.02703 0.03604 0.01802 0.03604 0 0.01802 0.00901 0.00901 0 0 0 0 0 0 0 0 0
0 0
2013 1 9 1 0 47 0 0 0 0 0 0 0 0 0 0 0 0
0.02128 0 0 0 0 0.06383 0.02128 0.04255 0.10638 0.06383 0.12766 0.06383 0.04255 0.08511 0.04255 0.04255 0
0.04255 0.06383 0.06383 0.02128 0.04255 0.02128 0 0 0.02128 0 0 0 0 0 0 0 0
0 0 PRE-DECIS
IONAL

June 2015 Gulf of Mexico Red Grouper
SEDAR 42 SAR Section III Assessment Process Report
204
-2014 1 9 1 0 24 0 0 0 0 0 0 0 0 0 0 0 0
0 0 0 0 0 0.08333 0.08333 0.08333 0 0.08333 0.08333 0.04167 0.08333 0 0.04167 0 0
0.08333 0.04167 0.08333 0.16667 0 0 0 0 0.04167 0 0 0 0 0 0 0 0
0 0 21 #_N_age_bins
1 2 3 4 5 6 7 8 9 10 11 12 13 14 15 16 17 18
19 20 21
1 #_N_ageerror_definitions
0.5 1.5 2.5 3.5 4.5 5.5 6.5 7.5 8.5 9.5 10.5 11.5 12.5 13.5 14.5 15.5 16.5 17.5
18.5 19.5 20.5
0.06 0.064 0.272 0.34 0.407 0.474 0.541 0.608 0.676 0.743 0.81 0.877 0.944 1.012 1.079 1.146 1.213 1.28
1.348 1.415 1.784
107 #_N_Agecomp_obs
1 #_Lbin_method: 1=poplenbins; 2=datalenbins; 3=lengths
1 #_combine males into females at or below this bin number
#Yr Seas Flt/Svy Gender Part Ageerr Lbin_lo Lbin_hi Nsamp AGE0 AGE1 AGE2 AGE3 AGE4 AGE5 AGE6 AGE7 AGE8
AGE9 AGE10 AGE11 AGE12 AGE13 AGE14 AGE15 AGE16 AGE17 AGE18 AGE19 AGE20 #
1991 1 1 1 2 1 -1 -1 43 0 0 0 0.0511 0.0169 0.1973 0.2499 0.0614 0
0.1345 0.2063 0.0049 0.0227 0.0173 0 0.0045 0.0132 0 0 0.0087 0.0112 # 43
1992 1 1 1 2 1 -1 -1 42 0 0 0 0 0 0.2716 0.2877 0.3157 0.083
0 0.01 0.0114 0 0.0205 0 0 0 0 0 0 0 # 42
1993 1 1 1 2 1 -1 -1 93 0 0 0 0.0019 0.1444 0.1654 0.2725 0.2541 0.1112
0.0232 0.01 0.0077 0.0041 0 0 0 0 0 0.0012 0 0.0041 # 93
1994 1 1 1 2 1 -1 -1 200 0 0 0 0.0015 0.1284 0.3128 0.1857 0.1642 0.0951
0.057 0.0209 0.0133 0.0085 0.0039 0 0.0088 0 0 0 0 0 # 239 PRE-DECIS
IONAL

June 2015 Gulf of Mexico Red Grouper
SEDAR 42 SAR Section III Assessment Process Report
205
1995 1 1 1 2 1 -1 -1 180 0 0 0 0 0.0276 0.1832 0.3136 0.2767 0.0934
0.0271 0.036 0.0332 0 0.0092 0 0 0 0 0 0 0 # 180
1996 1 1 1 2 1 -1 -1 141 0 0 0 0 0.0015 0.1087 0.3815 0.2967 0.1113
0.0969 0 0.0035 0 0 0 0 0 0 0 0 0 # 141
1997 1 1 1 2 1 -1 -1 35 0 0 0 0 0.0218 0.0894 0.2267 0.3242 0.2708
0.0492 0.0136 0 0 0.0043 0 0 0 0 0 0 0 # 35
1998 1 1 1 2 1 -1 -1 39 0 0 0 0.0081 0.1959 0.1362 0.1715 0.2284 0.1454
0.0781 0.0278 0 0 0 0.0087 0 0 0 0 0 0 # 39
1999 1 1 1 2 1 -1 -1 77 0 0 0 0 0.0166 0.1364 0.2409 0.1591 0.2413
0.1224 0.0728 0 0.0074 0.0015 0 0 0 0.0015 0 0 0 # 77
2000 1 1 1 2 1 -1 -1 200 0 0 0 0 0.2492 0.1433 0.2277 0.0985 0.0747
0.0689 0.0562 0.0221 0.0299 0.0081 0.0178 0.0021 0 0 0 0.0004 0.001 # 206
2001 1 1 1 2 1 -1 -1 200 0 0 0 0 0.0421 0.354 0.124 0.1722 0.0955
0.0324 0.0643 0.0426 0.0219 0.0175 0.0148 0.0038 0.0092 0.0049 0.0003 0 0.0005 # 575
2002 1 1 1 2 1 -1 -1 200 0 0 0 0.0111 0.0465 0.1236 0.3553 0.1277 0.1087
0.0783 0.0665 0.0224 0.0266 0.0126 0.007 0.0032 0.0022 0.0018 0.0012 0.0029 0.0024 # 573
2003 1 1 1 2 1 -1 -1 200 0 0 0 0 0.0953 0.1162 0.2068 0.2638 0.1162
0.089 0.0354 0.0199 0.0173 0.0146 0.001 0.0068 0.0031 0.003 0.0034 0.0012 0.0071 # 561
2004 1 1 1 2 1 -1 -1 200 0 0 0 0 0.0283 0.3927 0.1258 0.1575 0.1248
0.0515 0.0406 0.0256 0.0136 0.0116 0.0075 0.0081 0.0038 0.002 0.0024 0.0029 0.0013 # 1062
2005 1 1 1 2 1 -1 -1 200 0 0 0 0 0.0015 0.0879 0.5971 0.0806 0.0793
0.0695 0.0211 0.0205 0.0207 0.0088 0.0055 0.0008 0.0022 0.0014 0 0.0006 0.0025 # 626
2006 1 1 1 2 1 -1 -1 200 0 0 0 0 0 0.02 0.1539 0.4878 0.18
0.0551 0.0411 0.0175 0.0142 0.0085 0.0052 0.0012 0.0056 0.0019 0.0008 0 0.0072 # 629 PRE-DECIS
IONAL

June 2015 Gulf of Mexico Red Grouper
SEDAR 42 SAR Section III Assessment Process Report
206
2007 1 1 1 2 1 -1 -1 200 0 0 0 0 0.0036 0.2463 0.0834 0.18 0.2865
0.0984 0.0392 0.0196 0.0193 0.0063 0.003 0.0028 0.0039 0.0035 0.0028 0 0.0014 # 497
2008 1 1 1 2 1 -1 -1 200 0 0 0 0 0 0.0735 0.4394 0.1023 0.146
0.1536 0.0298 0.0161 0.015 0.0105 0.0024 0.0032 0.0033 0 0.0019 0.001 0.002 # 503
2009 1 1 1 2 1 -1 -1 200 0 0 0 0.0221 0.035 0.0965 0.068 0.3336 0.1288
0.134 0.1169 0.0319 0.0085 0.007 0.0035 0.0045 0.0016 0.0011 0.0007 0 0.0063 # 895
2010 1 1 1 2 1 -1 -1 200 0 0 0.0011 0.0152 0.1659 0.0629 0.089 0.1508 0.2265
0.1212 0.0878 0.044 0.0047 0.0141 0.0056 0.0047 0.0024 0.0025 0 0.0013 0.0003 # 1030
2011 1 1 1 2 1 -1 -1 200 0 0 0 0 0.031 0.5065 0.0717 0.0819 0.0677
0.1098 0.043 0.0419 0.0217 0.0061 0.0049 0.0037 0.0056 0 0 0.0003 0.0044 # 629
2012 1 1 1 2 1 -1 -1 200 0 0 0 0.0004 0.0061 0.1718 0.5278 0.0681 0.0607
0.0301 0.052 0.0335 0.0201 0.0191 0.0055 0.0015 0.0007 0.0015 0 0 0.0011 # 1019
2013 1 1 1 2 1 -1 -1 200 0 0 0 0 0.0101 0.0521 0.2727 0.4514 0.0653
0.0431 0.0321 0.026 0.0092 0.0218 0.0127 0.0011 0.0009 0 0.0016 0 0 # 558
1991 1 2 1 2 1 -1 -1 37 0 0 0 0 0 0.1367 0.1258 0.3341 0.1593
0.1272 0 0.0183 0.014 0 0 0 0 0 0 0.0846 0 # 37
1992 1 2 1 2 1 -1 -1 143 0 0 0 0 0 0.1371 0.1949 0.3669 0.1553
0.0892 0.0232 0.0114 0.0134 0 0 0 0 0.0086 0 0 0 # 143
1993 1 2 1 2 1 -1 -1 200 0 0 0 0 0.0531 0.1321 0.2866 0.2497 0.135
0.0709 0.0417 0.0166 0.0039 0.0062 0.0018 0 0.0024 0 0 0 0 # 200
1994 1 2 1 2 1 -1 -1 88 0 0 0 0 0.056 0.1404 0.1253 0.2879 0.1426
0.1084 0.0892 0.0236 0.0234 0.0017 0 0 0 0 0 0 0.0014 # 88
1995 1 2 1 2 1 -1 -1 140 0 0 0 0 0.0251 0.0744 0.3285 0.1364 0.237
0.1137 0.0647 0.0076 0.0037 0.0037 0 0 0 0 0 0 0.0054 # 140 PRE-DECIS
IONAL

June 2015 Gulf of Mexico Red Grouper
SEDAR 42 SAR Section III Assessment Process Report
207
1996 1 2 1 2 1 -1 -1 96 0 0 0 0 0.0132 0.0789 0.2309 0.3444 0.0634
0.1812 0.07 0.0052 0.0041 0 0 0.0064 0 0.0023 0 0 0 # 96
-1997 1 2 1 2 1 -1 -1 7 0 0 0 0 0.7193 0.0801 0.0583 0.1384 0
0 0 0 0 0 0 0 0.0039 0 0 0 0 # 7
1998 1 2 1 2 1 -1 -1 122 0 0 0 0 0.0413 0.1572 0.1643 0.2724 0.1548
0.1054 0.028 0.0542 0.014 0.0047 0 0.0037 0 0 0 0 0 # 122
1999 1 2 1 2 1 -1 -1 200 0 0 0 0 0.0061 0.0628 0.1123 0.1849 0.2541
0.1967 0.0876 0.0492 0.025 0.0105 0.0052 0.0035 0.0007 0 0.0007 0 0.0006 # 643
2000 1 2 1 2 1 -1 -1 200 0 0 0 0 0.0388 0.0523 0.202 0.1499 0.1586
0.1197 0.0997 0.1026 0.0363 0.0127 0.0095 0.0063 0.0049 0 0.0011 0.0029 0.0028 # 405
2001 1 2 1 2 1 -1 -1 200 0 0 0 0 0.0036 0.2011 0.1327 0.2345 0.125
0.0626 0.0833 0.0809 0.0393 0.012 0.0086 0.0064 0.0049 0.0012 0.0008 0.0009 0.0022 # 1210
2002 1 2 1 2 1 -1 -1 200 0 0 0 0 0.0042 0.0486 0.2703 0.1661 0.1567
0.1224 0.0621 0.0588 0.0572 0.0223 0.0129 0.0089 0.0028 0.0013 0.0017 0.0009 0.0028 # 1067
2003 1 2 1 2 1 -1 -1 200 0 0 0 0.0009 0.0335 0.03 0.1156 0.2377 0.1394
0.1324 0.0892 0.0611 0.0528 0.041 0.0303 0.0144 0.0048 0.0083 0.0028 0.0024 0.0033 # 1080
2004 1 2 1 2 1 -1 -1 200 0 0 0 0.0013 0.0146 0.2316 0.0507 0.1566 0.1877
0.1189 0.0773 0.0463 0.0322 0.0233 0.0255 0.0115 0.0053 0.005 0.005 0.0021 0.0052 # 1153
2005 1 2 1 2 1 -1 -1 200 0 0 0 0 0.0035 0.0966 0.4442 0.0759 0.1234
0.1084 0.061 0.0294 0.0172 0.0107 0.0083 0.0053 0.0055 0.0025 0.0029 0.0013 0.004 # 1455
2006 1 2 1 2 1 -1 -1 200 0 0 0 0 0 0.0293 0.1663 0.3771 0.1627
0.0898 0.0619 0.0383 0.0242 0.0177 0.0143 0.0069 0.0069 0.0006 0.0011 0.0011 0.0017 # 538
2007 1 2 1 2 1 -1 -1 200 0 0 0 0 0.002 0.0637 0.0963 0.1927 0.2992
0.1171 0.0613 0.0743 0.0266 0.0182 0.0265 0.0095 0.0031 0.0033 0.0017 0.0034 0.0013 # 599 PRE-DECIS
IONAL

June 2015 Gulf of Mexico Red Grouper
SEDAR 42 SAR Section III Assessment Process Report
208
2008 1 2 1 2 1 -1 -1 200 0 0 0 0 0 0.0155 0.2005 0.1393 0.2402
0.2387 0.0709 0.0457 0.0183 0.012 0.0072 0.003 0.002 0.0029 0.002 0.0008 0.001 # 509
2009 1 2 1 2 1 -1 -1 200 0 0 0 0.0003 0.003 0.0153 0.0736 0.3252 0.1257
0.1688 0.1887 0.0399 0.0091 0.0108 0.0119 0.0109 0.0043 0.0025 0.0011 0.0036 0.0054 # 994
2010 1 2 1 2 1 -1 -1 200 0 0 0 0.0061 0.1163 0.0578 0.1151 0.1808 0.277
0.093 0.0983 0.0286 0.0073 0.0037 0.0028 0.0043 0.0044 0 0.0014 0.0029 0 # 650
2011 1 2 1 2 1 -1 -1 200 0 0 0 0.0025 0.0498 0.3107 0.062 0.1427 0.1234
0.1675 0.0449 0.0571 0.0214 0.0113 0 0.0001 0.0038 0 0 0.0025 0.0004 # 499
2012 1 2 1 2 1 -1 -1 200 0 0 0 0 0.0047 0.1093 0.4614 0.09 0.0851
0.0644 0.0917 0.0378 0.0287 0.0134 0.0035 0.0078 0 0 0 0.0011 0.0009 # 861
2013 1 2 1 2 1 -1 -1 200 0 0 0 0 0.001 0.0422 0.2897 0.3692 0.0887
0.0602 0.0479 0.0511 0.0158 0.0174 0.0068 0.002 0.0028 0.0008 0.0017 0.001 0.0018 # 1130
-1991 1 3 1 2 1 -1 -1 2 0 0 0 0 0.0328 0 0.9672 0 0
0 0 0 0 0 0 0 0 0 0 0 0 # 2
1992 1 3 1 2 1 -1 -1 14 0 0 0 0 0 0.1471 0.4923 0.0422 0.2481
0 0.0597 0 0.0068 0 0 0 0 0.0038 0 0 0 # 14
1993 1 3 1 2 1 -1 -1 84 0 0 0 0 0.047 0.0435 0.2138 0.3409 0.2725
0.0679 0.0143 0 0 0 0 0 0 0 0 0 0 # 84
1994 1 3 1 2 1 -1 -1 29 0 0 0 0 0 0 0.0283 0.1208 0.3499
0.3176 0.12 0.0439 0.0098 0 0.0098 0 0 0 0 0 0 # 29
1995 1 3 1 2 1 -1 -1 39 0 0 0 0 0 0.0476 0.4586 0.1074 0.2173
0.0879 0.0166 0 0.0579 0.0066 0 0 0 0 0 0 0 # 39
-1996 1 3 1 2 1 -1 -1 8 0 0 0 0 0 0 0 0.3504 0.1709
0.1823 0.2279 0 0.0684 0 0 0 0 0 0 0 0 # 8 PRE-DECIS
IONAL

June 2015 Gulf of Mexico Red Grouper
SEDAR 42 SAR Section III Assessment Process Report
209
1997 1 3 1 2 1 -1 -1 17 0 0 0 0 0.1291 0.4163 0.3007 0.0421 0.1013
0 0 0 0 0.0105 0 0 0 0 0 0 0 # 17
1998 1 3 1 2 1 -1 -1 33 0 0 0 0.03 0.0965 0.03 0.1509 0.2616 0.1537
0.1716 0.0649 0 0.041 0 0 0 0 0 0 0 0 # 33
1999 1 3 1 2 1 -1 -1 31 0 0 0 0 0.1012 0.0732 0.0973 0.0288 0.2114
0.1615 0.1135 0.1914 0 0.021 0.0006 0 0 0 0 0 0 # 31
2000 1 3 1 2 1 -1 -1 38 0 0 0 0 0.0246 0.0246 0.4501 0.21 0.0902
0.1193 0.0301 0.0247 0 0.0265 0 0 0 0 0 0 0 # 38
2001 1 3 1 2 1 -1 -1 39 0 0 0 0 0 0.0807 0.1026 0.2107 0.1754
0.0658 0.1454 0.0096 0.1843 0 0 0.0171 0 0.0084 0 0 0 # 39
2002 1 3 1 2 1 -1 -1 89 0 0 0 0 0.0646 0.0649 0.1662 0.1652 0.1977
0.1002 0.0702 0.0676 0.0374 0.0486 0.0038 0.0066 0.0071 0 0 0 0 # 89
2003 1 3 1 2 1 -1 -1 65 0 0 0 0 0.1979 0.0102 0.1652 0.1786 0.1629
0.1271 0.0539 0.0169 0.0696 0.0049 0.0037 0.0073 0.0016 0 0 0 0 # 65
2004 1 3 1 2 1 -1 -1 38 0 0 0 0 0.1122 0.2652 0.0625 0.2343 0.1503
0.012 0.0742 0.0343 0 0 0.0167 0 0.0096 0 0.0287 0 0 # 38
2006 1 3 1 2 1 -1 -1 173 0 0 0 0 0 0.0135 0.0923 0.5382 0.1501
0.047 0.0595 0.0337 0.0413 0.0058 0 0.013 0 0.0056 0 0 0 # 173
-1991 1 4 1 2 1 -1 -1 1 0 0 0 0 0 0 0 0 0
0 0 0 0 0 0 0 0 0 0 0 1 # 1
1992 1 4 1 2 1 -1 -1 25 0 0 0 0 0.3522 0.2525 0 0 0.0701
0.2372 0.0359 0.0305 0.018 0.0036 0 0 0 0 0 0 0 # 25
1993 1 4 1 2 1 -1 -1 62 0 0 0 0.0598 0.3283 0.04 0.1018 0.2007 0.1565
0.0568 0.0231 0.0228 0 0.0051 0 0.0051 0 0 0 0 0 # 62 PRE-DECIS
IONAL

June 2015 Gulf of Mexico Red Grouper
SEDAR 42 SAR Section III Assessment Process Report
210
1994 1 4 1 2 1 -1 -1 72 0 0 0 0.0324 0.2312 0.2394 0.1745 0.1369 0.0949
0.0084 0.0193 0.0182 0.014 0.0111 0.0071 0 0 0 0 0 0.0127 # 72
1995 1 4 1 2 1 -1 -1 91 0 0 0 0 0.0723 0.3154 0.3879 0 0.1495
0.0357 0.0089 0.0047 0.0047 0.0082 0.0127 0 0 0 0 0 0 # 91
1996 1 4 1 2 1 -1 -1 134 0 0 0 0 0 0.1728 0.446 0.203 0.0749
0.0624 0.0313 0 0 0.0065 0 0 0 0 0 0 0.0032 # 134
1997 1 4 1 2 1 -1 -1 70 0 0 0 0.0135 0.0322 0.0873 0.2939 0.3596 0.1488
0.0118 0 0.0124 0.0071 0.0071 0.0118 0.0071 0.0071 0 0 0 0 # 70
1998 1 4 1 2 1 -1 -1 76 0 0 0 0 0.0606 0.3308 0.2881 0.2088 0.0922
0.0117 0 0 0 0 0.0078 0 0 0 0 0 0 # 76
1999 1 4 1 2 1 -1 -1 106 0 0 0 0.0153 0.0499 0.4618 0.1999 0.0744 0.1164
0.0566 0.0208 0 0 0 0 0 0.0025 0 0 0 0.0025 # 106
2000 1 4 1 2 1 -1 -1 59 0 0 0 0 0.3738 0.1787 0.1815 0.0618 0.106
0.0587 0.0167 0.0026 0 0.0092 0 0.0059 0 0.0026 0 0 0.0026 # 59
2001 1 4 1 2 1 -1 -1 47 0 0 0 0 0.0546 0.5729 0.1771 0.1751 0
0 0.0092 0 0 0.0092 0 0 0 0.0021 0 0 0 # 47
2002 1 4 1 2 1 -1 -1 200 0 0 0 0.0179 0.0934 0.2095 0.4108 0.1415 0.0616
0.0194 0.0051 0.014 0.0063 0.0082 0.0068 0.0054 0 0 0 0 0 # 299
2003 1 4 1 2 1 -1 -1 169 0 0 0 0.0349 0.4303 0.1575 0.1255 0.1724 0.0233
0.0244 0.0136 0 0.0136 0.0045 0 0 0 0 0 0 0 # 169
2004 1 4 1 2 1 -1 -1 185 0 0 0 0.0071 0.0521 0.6512 0.0844 0.0873 0.0648
0.0108 0.0264 0.0124 0 0 0.0036 0 0 0 0 0 0 # 185
2005 1 4 1 2 1 -1 -1 65 0 0 0 0 0.0202 0.2226 0.6468 0.0504 0.0201
0.0337 0 0.0062 0 0 0 0 0 0 0 0 0 # 65 PRE-DECIS
IONAL

June 2015 Gulf of Mexico Red Grouper
SEDAR 42 SAR Section III Assessment Process Report
211
2006 1 4 1 2 1 -1 -1 44 0 0 0 0 0 0.0509 0.1585 0.3874 0.2226
0.1163 0.039 0.0231 0 0 0 0 0.002 0 0 0 0 # 44
2007 1 4 1 2 1 -1 -1 62 0 0 0 0.0554 0.0633 0.0517 0.1577 0.2386 0.3016
0.0546 0.0112 0.0112 0.0439 0.0112 0 0 0 0 0 0 0 # 62
2008 1 4 1 2 1 -1 -1 105 0 0 0 0.0085 0.1966 0.2339 0.2222 0.1012 0.1084
0.1031 0 0.0164 0 0 0.0098 0 0 0 0 0 0 # 105
2009 1 4 1 2 1 -1 -1 117 0 0 0 0.1854 0.0352 0.2569 0.1365 0.1566 0.0638
0.098 0.0411 0.0107 0.0157 0 0 0 0 0 0 0 0 # 117
2010 1 4 1 2 1 -1 -1 200 0 0 0 0.0195 0.5864 0.0413 0.1583 0.0671 0.084
0.0113 0.0213 0 0.0035 0 0.0036 0 0 0 0.0038 0 0 # 310
2011 1 4 1 2 1 -1 -1 200 0 0 0 0.0021 0.0646 0.7976 0.0336 0.034 0.0261
0.0176 0.0082 0.0014 0.0064 0.0042 0.0042 0 0 0 0 0 0 # 404
2012 1 4 1 2 1 -1 -1 200 0 0 0 0 0.01 0.3389 0.4836 0.0658 0.0101
0.0037 0.036 0.015 0.0147 0.0171 0 0 0 0 0 0.0051 0 # 237
2013 1 4 1 2 1 -1 -1 200 0 0 0 0.0039 0.0079 0.0968 0.586 0.255 0.0081
0.0029 0.0034 0.0139 0 0.0029 0.0193 0 0 0 0 0 0 # 241
1991 1 5 1 2 1 -1 -1 36 0 0 0 0.0321 0.1284 0.4058 0.1554 0.0451 0.066
0.0176 0.065 0.0229 0.0245 0.0196 0 0 0 0 0 0 0.0176 # 36
1992 1 5 1 2 1 -1 -1 33 0 0 0 0.0556 0.0159 0.4546 0.2791 0.0653 0.0247
0 0.0123 0 0.0741 0.0185 0 0 0 0 0 0 0 # 33
1993 1 5 1 2 1 -1 -1 21 0 0 0.0286 0.0286 0.3341 0.1315 0.1914 0.0571 0.1143
0.0571 0 0 0 0 0 0 0 0 0.0286 0 0.0286 # 21
1994 1 5 1 2 1 -1 -1 29 0 0 0 0.0191 0.2728 0.5085 0.0976 0.0354 0
0 0.0476 0 0 0 0 0 0 0 0 0 0.0191 # 29 PRE-DECIS
IONAL

June 2015 Gulf of Mexico Red Grouper
SEDAR 42 SAR Section III Assessment Process Report
212
1995 1 5 1 2 1 -1 -1 53 0 0 0 0 0.0601 0.5195 0 0.3492 0.03
0 0 0.0103 0 0.0103 0 0 0.0206 0 0 0 0 # 53
1996 1 5 1 2 1 -1 -1 41 0 0 0 0.0128 0 0.1987 0.391 0.3147 0.0314
0.0513 0 0 0 0 0 0 0 0 0 0 0 # 41
1997 1 5 1 2 1 -1 -1 28 0 0 0 0 0.0807 0.1557 0.2781 0.38 0.0391
0.0351 0.0156 0.0156 0 0 0 0 0 0 0 0 0 # 28
1998 1 5 1 2 1 -1 -1 21 0 0 0 0 0.102 0.2517 0.3283 0.2568 0.0204
0.0408 0 0 0 0 0 0 0 0 0 0 0 # 21
1999 1 5 1 2 1 -1 -1 8 0 0 0 0 0 0.1862 0.4607 0.152 0.0883
0 0.1128 0 0 0 0 0 0 0 0 0 0 # 8
2000 1 5 1 2 1 -1 -1 12 0 0 0 0 0.62 0.1938 0.0969 0.0715 0
0 0 0.0178 0 0 0 0 0 0 0 0 0 # 12
-2001 1 5 1 2 1 -1 -1 1 0 0 0 0 0 1 0 0 0
0 0 0 0 0 0 0 0 0 0 0 0 # 1
2002 1 5 1 2 1 -1 -1 50 0 0 0 0 0 0.3492 0.5748 0.076 0
0 0 0 0 0 0 0 0 0 0 0 0 # 50
2003 1 5 1 2 1 -1 -1 30 0 0 0 0 0.7509 0.1012 0.0886 0.0593 0
0 0 0 0 0 0 0 0 0 0 0 0 # 30
2004 1 5 1 2 1 -1 -1 43 0 0 0 0 0 0.7074 0.1921 0.0086 0.0686
0.0233 0 0 0 0 0 0 0 0 0 0 0 # 43
2005 1 5 1 2 1 -1 -1 52 0 0 0 0 0.045 0.2121 0.605 0.0978 0
0.0268 0.0134 0 0 0 0 0 0 0 0 0 0 # 52
2006 1 5 1 2 1 -1 -1 33 0 0 0 0 0.0373 0.165 0.0964 0.5854 0.0689
0.047 0 0 0 0 0 0 0 0 0 0 0 # 33 PRE-DECIS
IONAL

June 2015 Gulf of Mexico Red Grouper
SEDAR 42 SAR Section III Assessment Process Report
213
2007 1 5 1 2 1 -1 -1 28 0 0 0 0 0.0564 0.2025 0.1231 0.1792 0.3941
0.0184 0 0.0263 0 0 0 0 0 0 0 0 0 # 28
2008 1 5 1 2 1 -1 -1 44 0 0 0 0 0.1344 0.2317 0.3072 0.0941 0.0873
0.1198 0.0256 0 0 0 0 0 0 0 0 0 0 # 44
2009 1 5 1 2 1 -1 -1 102 0 0 0.0069 0.2528 0.1136 0.2083 0.1496 0.1765 0.0083
0.0666 0.0175 0 0 0 0 0 0 0 0 0 0 # 102
2010 1 5 1 2 1 -1 -1 85 0 0 0.0105 0.0591 0.5454 0.0373 0.0745 0.0517 0.1462
0.0202 0.0468 0.0084 0 0 0 0 0 0 0 0 0 # 85
2011 1 5 1 2 1 -1 -1 114 0 0 0 0 0.1276 0.5803 0.135 0.0315 0.0648
0.0481 0 0.0128 0 0 0 0 0 0 0 0 0 # 114
2012 1 5 1 2 1 -1 -1 39 0 0 0 0 0.014 0.4437 0.4486 0.014 0
0.0064 0.0159 0.0382 0.0096 0 0 0.0096 0 0 0 0 0 # 39
2013 1 5 1 2 1 -1 -1 45 0 0 0 0 0.0339 0.0679 0.6803 0.1903 0
0.0055 0.0055 0.011 0 0 0.0055 0 0 0 0 0 0 # 45
0 #_N_MeanSize-at-Age_obs
0 #_N_environ_variables
0 #_N_environ_obs
0 # N sizefreq methods to read
0 # no tag data
0 # no morph composition data
999 # end of file marker PRE-DECIS
IONAL

June 2015 Gulf of Mexico Red Grouper
SEDAR 42 SAR Section III Assessment Process Report
214
PRE-DECIS
IONAL