Embed Size (px)
Citation preview
1
Supporting Text
Single-Molecule Fluorescence Resonance Energy Transfer (FRET) Analysis. Structural
details of the RNA modifications introduced are shown in Fig. 7. The durations of their docked
and undocked events are obtained from single-molecule FRET time trajectories, examples of
which are given in Fig. 2. The distributions of docked and undocked times are plotted as
histograms (Fig. 4), each bar representing the number of dwell times that fall into its particular
time range. Integrating the histograms generates cumulative plots where each point represents
the number of events counted that have a dwell time less than or equal to the specified time (Fig.
4). Fitting these cumulative plots with Eq. S1 yields the rate constants for docking and
undocking, respectively:
N t( )= Ai 1− eki ,observed t( )i=1
M
∑ [S1]
The number of exponentials M indicates the number of rate constants detected from dwell
times obtained with one particular time resolution. However, most ribozyme variants exhibited
more rate constants than could be accurately determined from experiments at only one time
resolution. Therefore, dwell times obtained from two time resolutions were separately fit with
multiexponentials with the minimum number of rate constants necessary to produce a low-
residuals fit. Rate constants that were extracted from both sets of dwell times corresponded well.
For example, dwell times of the docked states of the wild-type ribozyme in our 2-s time-
resolution data were fit with a triple exponential to yield kundock,1-3. The 0.1-s time-resolution data
were fit with a triple exponential to yield kundock,2-4. The two middle rate constants, kundock,2 and
kundock,3, extracted from these two separate data sets agree within experimental error (1). The
undocking rate constants of the dC12, dA38, and C39S3 variants were extracted in a similar
fashion, except that fewer rate constants were obtained (Table 1).

2
In the case of the RzAS3 and RzAS3/C39S3 variants, the 0.1-s time-resolution data were fit
with a triple exponential to yield kundock,2-4. The 1-s time-resolution data exhibit all four
undocking rate constants, including the fastest one corresponding to kundock,4. This is due to the
rapid docking rate constant of these variants and the memory effect, that is, the observation that
one trajectory is characterized by only a single undocking rate constant. To avoid having too
many variable fitting parameters, we fit the dwell time histogram using a quadruple exponential
decay, but with the two fastest undocking rate constants, kundock,3,4, fixed to the values determined
from the 0.1-s time-resolution data. This procedure allowed us to determined kundock,1, 2 from the
fit. It is worth noting that even when leaving kundock,3,4 as free fitting parameters, the derived
values for kundock,3,4 were similar.
The histograms of the dwell times of the undocked states of all variants were fit with single-
or double-exponential decays to yield kdock,1(2). The determination of docking rate constants is
thus completely uncoupled from the determination of the docking rate constants. Errors in our
rate constants (Table 1) were estimated by independently analyzing subsets of our data and
comparing the resulting rate constants.
The use of finite observation windows to measure the dwell times introduces a systematic
bias in the observed rate constants. This was corrected for by measuring the rate at which either
Cy3 or Cy5 is inactivated by photobleaching and subtracting this rate kphotobleach from the
observed rate kobserved along with the reciprocal of the observation window tw (2):
whphotobleacii t
kkk 1actualobserved ++= ,, [S2]
Because the time resolutions used in the experiments may not be sufficient to resolve all docked
events that undock rapidly, the amplitude Ai for the relatively fast undocking populations could
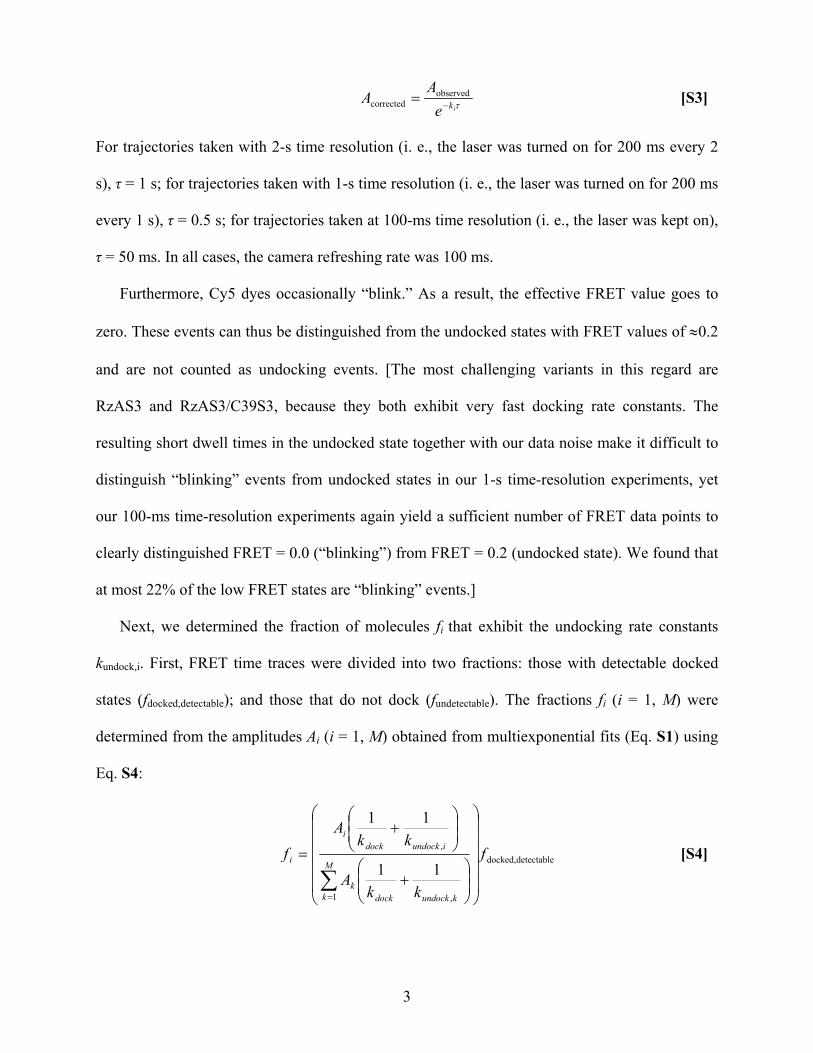
be underestimated with Eq. S1. This was corrected with Eq. S3, which assumes that all dwell
times shorter than τ are not observed:
3
τikeA
A −= observedcorrected [S3]
For trajectories taken with 2-s time resolution (i. e., the laser was turned on for 200 ms every 2
s), τ = 1 s; for trajectories taken with 1-s time resolution (i. e., the laser was turned on for 200 ms
every 1 s), τ = 0.5 s; for trajectories taken at 100-ms time resolution (i. e., the laser was kept on),
τ = 50 ms. In all cases, the camera refreshing rate was 100 ms.
Furthermore, Cy5 dyes occasionally “blink.” As a result, the effective FRET value goes to
zero. These events can thus be distinguished from the undocked states with FRET values of ≈0.2
and are not counted as undocking events. [The most challenging variants in this regard are
RzAS3 and RzAS3/C39S3, because they both exhibit very fast docking rate constants. The
resulting short dwell times in the undocked state together with our data noise make it difficult to
distinguish “blinking” events from undocked states in our 1-s time-resolution experiments, yet
our 100-ms time-resolution experiments again yield a sufficient number of FRET data points to
clearly distinguished FRET = 0.0 (“blinking”) from FRET = 0.2 (undocked state). We found that
at most 22% of the low FRET states are “blinking” events.]
Next, we determined the fraction of molecules fi that exhibit the undocking rate constants
kundock,i. First, FRET time traces were divided into two fractions: those with detectable docked
states (fdocked,detectable); and those that do not dock (fundetectable). The fractions fi (i = 1, M) were
determined from the amplitudes Ai (i = 1, M) obtained from multiexponential fits (Eq. S1) using
Eq. S4:
detectabledocked,
1 ,
,
11
11
f
kkA
kkA
fM
k kundockdockk
iundockdocki
i
+
+
=
∑=
[S4]

4
For the dA38 and dC12 variants, we observed two undocking rate constants, both of which are
much faster than those of the wild-type ribozyme. Therefore, the comparably large
fdocked,undetectable fractions determined for both variants are likely in part due to undocking rate(s)
too fast to be detected at even our highest time resolution (100 ms).
For the C39S3 variant, we observed three undocking rate constants. Two time resolutions
were used to determine the fractions f1, f2, f3, and fundetectable. Trajectories with 1-s time resolution
give fractions '1f , '
2f , and fun det ectable' using Eqs. S1-S4, whereas the 100-ms resolution
trajectories give fractions ''2f , ''
3f , and ''leundetectabf . The rate constant kundock,2 determined from
trajectories with 1-s time resolution was comparable with that determined from trajectories with
100-ms time resolution. Because the 1-s time resolution was sufficient to resolve the rate
constants kundock,1 and kundock,2, f1 = '1f and f2 = '
2f . f3 was calculated from f3''
f2''
f2
' , whereas
fundetectable was determined as 'leundetectabf – f3, because traces exhibiting kundock,3 are expected to be
counted in the low-resolution data as part of 'leundetectabf .
For the wild-type hairpin construct, we observed four undocking rate constants. Two time
resolutions were used to determine the fractions f1, f2, f3, f4, and fundetectable. Trajectories with 2-s
time resolution gave fractions '1f , '
2f , '3f , and '
leundetectabf . Trajectories with 100-ms time resolution
yielded fractions ''2f , ''
3f , ''4f and ''
leundetectabf . The rate constants kundock,2 and kundock,3 determined
from trajectories with 2-s time resolution were comparable to those determined from trajectories
with 100-ms time resolution. We then determined f1, f2, f3, f4, and fundetectable with f1 = '1f , f2 = '
2f ,
3f = '3f , f4 ≈ 3''
3
''4 f
ff
, and fundetectable = '
leundetectabf -f4.
Because the RzAS3 and RzAS3/C39S3 variants exhibit docking rate heterogeneity in
addition to undocking rate heterogeneity, a more sophisticated algorithm was used to determine

5
what fraction of the trajectories exhibits a given pair of docking and undocking rate constants,
denoted jundock,i;dock,p . We first computed the conditional likelihood for each possible pair of
docking and undocking rate constants to give rise to the dwell times observed in a given single-
molecule trace, denoted ( )jundockidockk kktraceP ,, ;| . Bayes’ rule then allows us to express the
conditional probability that a trace belongs to a given subpopulation, ( )kjundockidock, tracekkP |; , , in
terms of ( )jundockidockk kktraceP ,, ;| and a knowledge of jundock,i;dock,p :
( ) ( )( )∑
=
mnmundock,n;dock,mundock,ndock,k
jundock,i;dock,jundock,idock,kkjundock,idock, pkktraceP
pkktracePtracekkP
,;|;|
|; [S5]
Because we do not know the jundock,i;dock,p a priori, we begin with an initial guess for these
occupancies. After computing the above conditional probabilities, we revise our estimate of the
occupancy of each species to:
( )∑→k
kjundock,idock,jundock,i;dock, tracekkPN
p |;1 [S6]
where N is the total number of traces. This process is then iterated until all jundock,i;dock,p converge
to a self-consistent set of occupancies for the subpopulations exhibiting each pair of docking and
undocking rate constants.
For the RzAS3 variant, two time resolutions were used to measure the rate constants and to
determine the fractions fdock,i;undock,j, which are denoted as fi,j hereafter. First, the fractions
'detectabledocked,f and '
leundetectabf were determined by using 1-s time-resolution trajectories. The
algorithm described above was used to determine the set of occupancies ',11p , '
2,1p , '3,1p '
1,2p , '2,2p ,
and '3,2p from the 1-s time-resolution trajectories and ''
3,1p , ''4,1p , ''
3,2p and ''4,2p from the 100-ms
time-resolution trajectories. Here we use jip , to denote jundock,i;dock,p . We determine fi,j using f1,1 =
'', detectabledocked,fp 11 , f1,2 = ''
, detectabledocked,fp 21 , f2,1 = '', detectabledocked,fp 12 , and f2,2 = ''
, detectabledocked,fp 22 . Because of
6
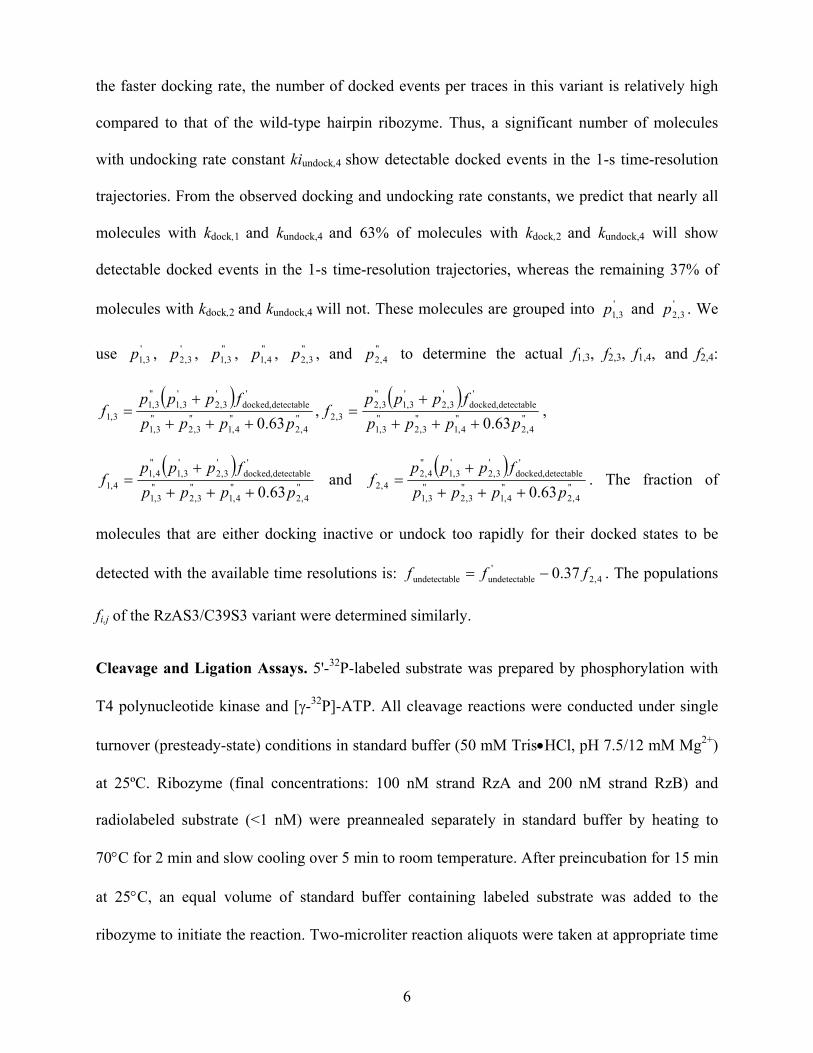
the faster docking rate, the number of docked events per traces in this variant is relatively high
compared to that of the wild-type hairpin ribozyme. Thus, a significant number of molecules
with undocking rate constant kiundock,4 show detectable docked events in the 1-s time-resolution
trajectories. From the observed docking and undocking rate constants, we predict that nearly all
molecules with kdock,1 and kundock,4 and 63% of molecules with kdock,2 and kundock,4 will show
detectable docked events in the 1-s time-resolution trajectories, whereas the remaining 37% of
molecules with kdock,2 and kundock,4 will not. These molecules are grouped into '3,1p and '
3,2p . We
use '3,1p , '
3,2p , ''3,1p , ''
4,1p , ''3,2p , and ''
4,2p to determine the actual f1,3, f2,3, f1,4, and f2,4:
( )''
4,2''4,1
''3,2
''3,1
'detectabledocked,
'3,2
'3,1
''3,1
3,1 63.0 ppppfppp
f+++
+= ,
( )''
4,2''4,1
''3,2
''3,1
'detectabledocked,
'3,2
'3,1
''3,2
3,2 63.0 ppppfppp
f+++
+= ,
( )''
4,2''4,1
''3,2
''3,1
'detectabledocked,
'3,2
'3,1
''4,1
4,1 63.0 ppppfppp
f+++
+= and
( )''
4,2''4,1
''3,2
''3,1
'detectabledocked,
'3,2
'3,1
''4,2
4,2 63.0 ppppfppp
f+++
+= . The fraction of
molecules that are either docking inactive or undock too rapidly for their docked states to be
detected with the available time resolutions is: 4,2'
leundetectableundetectab 37.0 fff −= . The populations
fi,j of the RzAS3/C39S3 variant were determined similarly.
Cleavage and Ligation Assays. 5'-32P-labeled substrate was prepared by phosphorylation with
T4 polynucleotide kinase and [γ-32P]-ATP. All cleavage reactions were conducted under single
turnover (presteady-state) conditions in standard buffer (50 mM Tris•HCl, pH 7.5/12 mM Mg2+)
at 25ºC. Ribozyme (final concentrations: 100 nM strand RzA and 200 nM strand RzB) and
radiolabeled substrate (<1 nM) were preannealed separately in standard buffer by heating to
70°C for 2 min and slow cooling over 5 min to room temperature. After preincubation for 15 min
at 25°C, an equal volume of standard buffer containing labeled substrate was added to the
ribozyme to initiate the reaction. Two-microliter reaction aliquots were taken at appropriate time

7
intervals and quenched with 13-µl stop solution (80% formamide/0.025% xylene-cyanol/0.025%
bromophenol blue/50 mM EDTA). The 5' cleavage product was separated from uncleaved
substrate by denaturing 20% polyacrylamide, 8 M urea, gel electrophoresis, and it was quantified
and normalized to the sum of the substrate and product bands by using a PhosphorImager Storm
840 with IMAGEQUANT software (Molecular Dynamics). Error bars are calculated from at least
two independent cleavage assays. Time traces of product formation were fit to the double-
exponential first-order rate equation ( ) ( ) ( )
−+
−+= −− tk
stk
fsobscleavfobscleav eAeAyty ,,,, 110 , using Marquardt-
Levenberg nonlinear least-squares regression, where Af + As is the final extent of cleavage and
the two kcleav,obss are the first-order rate constants of the fast and slow phases.
5'-32P-labeled 5' product with a 2',3'-cyclic phosphate (5'Pc) was prepared by cleaving the
radio-labeled substrate using wild-type hairpin ribozyme for 4 h in standard buffer (50 mM
Tris•HCl, pH 7.5/12 mM Mg2+) at 25ºC. 5'Pc was purified from uncleaved substrate by
denaturing 20% polyacrylamide, 8 M urea, gel electrophoresis, elution into water at 65ºC for 1 h,
and desalting using a CentriSpin-10 column (Princeton Separations, Adelphia, NJ). Ribozyme
[final saturating concentrations: 8 µM strand RzA/12 µM strand RzB/radiolabeled 5'Pc (<1 nM)]
and 12 µM 3'P were preannealed separately in standard buffer as described for the cleavage
reaction, preincubated for 15 min, then mixed to initiate ligation. After 4 h at 25°C, the reactions
were quenched with 13-µl stop solution as described above. Ligated substrate was separated
from 5'Pc by denaturing 20% polyacrylamide, 8 M urea, gel electrophoresis, and it was
quantified and normalized to the sum of the substrate and 5'Pc bands as described above, yielding
the fraction ligated, flig (Fig. 5). The internal equilibrium of the chemical step was determined as
klig/kcleav = flig/(1−flig)×(1+k'undock/k'dock)/(1+kundock/kdock). [This considers that the binding
equilibrium constants for the substrate and products become very large at the high concentration
of ribozyme used in the experiments. Note that the (un)docking rate constants of the major
8
subpopulation were used as they contribute predominantly to the chemistry equilibrium due to
the longer time that the products stay bound to the major subpopulation.] Error bars are
calculated from at least two independent ligation assays. Forward cleavage assays (with 8 µM
unlabeled and traces of radiolabeled substrate, 10 µM RzA, and 12 µM RzB) yielded very similar
final product/substrate distributions, showing that the internal and overall equilibrium are indeed
reached in both the cleavage and ligation experiments.
Steady-State FRET Kinetic Assays. Steady-state FRET measurements of the hairpin ribozyme
doubly labeled with Cy3 and Cy5 were performed on an Aminco-Bowman Series 2 (AB2)
spectrofluorometer (Thermo Spectronic, Woburn, MA), similar to previously described
experiments (3). Annealed ribozyme (final concentration 100 nM; with a 4-fold, i.e., saturating,
excess of unlabeled strand RzB) was incubated at 25°C for at least 15 min in standard buffer (50
mM Tris•HCl, pH 7.5/12 mM Mg2+) supplemented with 25 mM dithiothreitol (DTT) as oxygen
scavenger. In a 150-µl cuvette, a saturating 8-fold (in the case of the dC12 variant, 20-fold)
excess of noncleavable substrate analog was manually added to form the ribozyme-substrate
complex and initiate docking. Cy3 was excited at 540 nm (4-nm bandwidth), and for kinetic
experiments, the fluorescence emission F was recorded simultaneously at the Cy3 (560 nm, 8-nm
bandwidth) and Cy5 (665 nm, 8-nm bandwidth) maximum emission wavelengths. The FRET
ratio (=F665/(F665+F560) was calculated and normalized with its initial value (Fig. 6). The resulting
time traces were fit to a single exponential increase function of the form
( ) ( )( )tk obsdockeAyty ,10−−+= , where A and kdock,obs are the extent and rate constant of the FRET
increase, respectively (Table 2).
Kinetic Simulations of Steady-State FRET Assays. The (un)docking rate constants of each
hairpin ribozyme variant, kdock,i and kundock,i, and their subpopulation fractions, fi, measured by
9
single-molecule FRET, were used to generate a kinetic simulation that was compared to a typical
experimental steady-state FRET time course determined as described above (Fig. 6). The kinetic
simulation was generated by using Eq. S7:
( ) ( )( )
∑
−
+= +−
i
tkk
iundock,idock,
idock,i
iundockidockekk
kfFtF ,,
max 1 [S7]
where i sums over all subpopulations, and Fmax, the maximum FRET ratio reached at
equilibrium, was fit to match the total amplitude observed experimentally, using Marquardt-
Levenberg nonlinear least-squares regression. In the case of RzAS3 and RzAS3/C39S3, the sum
in Eq. S7 is a double sum that applies over both sets of docking rate constants, and fi becomes fi,j,
as described above.
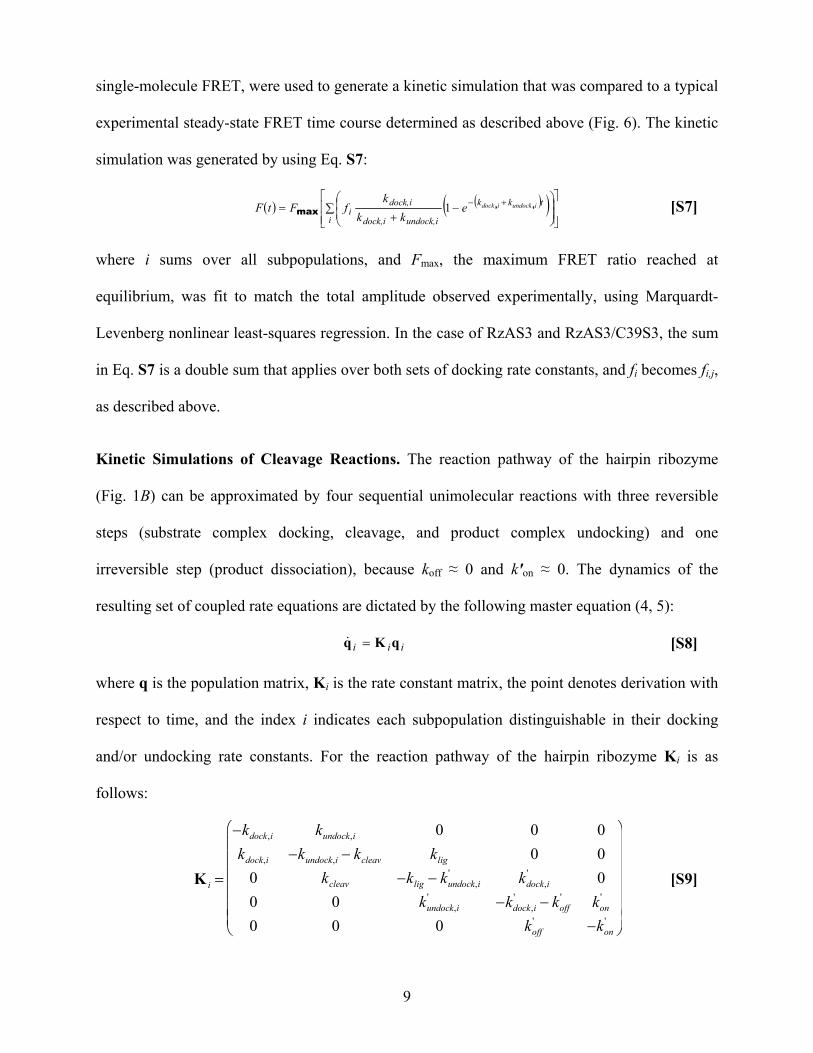
Kinetic Simulations of Cleavage Reactions. The reaction pathway of the hairpin ribozyme
(Fig. 1B) can be approximated by four sequential unimolecular reactions with three reversible
steps (substrate complex docking, cleavage, and product complex undocking) and one
irreversible step (product dissociation), because koff ≈ 0 and k'on ≈ 0. The dynamics of the
resulting set of coupled rate equations are dictated by the following master equation (4, 5):
iii qKq =& [S8]
where q is the population matrix, Ki is the rate constant matrix, the point denotes derivation with
respect to time, and the index i indicates each subpopulation distinguishable in their docking
and/or undocking rate constants. For the reaction pathway of the hairpin ribozyme Ki is as
follows:
K i =
−kdock,i kundock,i 0 0 0kdock,i −kundock,i − kcleav klig 0 0
0 kcleav −klig − kundock,i' kdock,i
' 00 0 kundock,i
' −kdock,i' − koff
' kon'
0 0 0 koff' −kon
'
[S9]

10
where the individual rate constants are defined as in Fig. 1B and Table 1. Here we assume that
kcleav and klig are the same for all molecular subpopulations (see further discussion of this point
below). Because the matrix elements of Ki, i.e., the rate constants of the reaction pathway, are
not time dependent, the general solution for the master equation is:
( ) ( )( ) ( )000 ttttt iii qKq −= exp, [S10]
The rate matrix, Ki, is real, quasisymmetric, and tridiagonal, with values strictly negative in the
main diagonal, strictly positive in the diagonals above and below, and zero elsewhere. Thus, Ki
can be transformed into a symmetric matrix and diagonalized. The eigenvalues of Ki are then
strictly negative or zero. The analytical solution for the general rate equation for each reactant is
given by:
( ) ( )
( ) ( )
( ) ( )
( ) ( )
( ) ( )
∑=
∑=
∑=
∑=
∑=
→=
→=
→=
→=
→=
51,,
51,,
51,,
51,,
51,,
exp
exp
exp
exp
exp
,
,
,
,
kikikP
kikikP
kikikP
kikikS
kikikS
tEtc
tDtc
tCtc
tBtc
tAtc
i
iU
iD
iD
iU
λ
λ
λ
λ
λ
[S11]
where the ( )tciUS ,
, etc., are the reaction intermediate concentrations, λk,i are the eigenvalues of Ki,
and Ak,i to Ek,i are obtained by normalizing the eigenvectors of Ki using the initial and final
boundary conditions at t = 0 and t = ∞.
Based on the above matrix algebra, each molecule subpopulation yielded its own analytical
solution for the overall cleavage time course, which was weighted by their fractions and summed
up. The ratio r = klig/kcleav was experimentally determined as the internal chemistry equilibrium
(see above and Fig. 5) and kept constant throughout the simulation. The cleavage and ligation

11
rate constants were then obtained by a single-variable fit of the simulated cleavage time courses
to the experimental ones using Marquardt-Levenberg least-squares regression (MATLAB,
MathWorks) and experimentally measured docking/undocking rate constants, the subpopulation
fractions and the internal equilibrium constant r. Errors on kcleav (dkcleav) arise from the 95%
confidence intervals of the least-squares fit calculated from the fit residuals and the Jacobian
matrix (MATLAB). Errors on klig (dklig) were calculated from the error on kcleav and the
experimental error on r (dr, Table 2) as follows:
dklig = rdkcleav + kcleavdr [S12]
Using this analysis, we find that modifications of essential residues distant from the site of
catalysis alter not only the rate constants of docking and/or undocking but also those of catalytic
chemistry. This is illustrated in the free energy reaction profile of the dominant subpopulation of
each modified ribozyme in comparison to the wild-type in Fig. 9, calculated from the rate
constants obtained in this study.
In our calculations, we have assumed that kcleav and klig are shared among all molecular
subpopulations with different docking and undocking kinetics. This is necessary to keep the
number of fitting parameters reasonably low. Given the substantial differences between the
docking/undocking and cleavage/ligation rate constants of the various site-specifically modified
variants, it is possible that whatever causes the molecular heterogeneity observed in form of the
subpopulations of each variant also affects their chemistry rate constants. From the high reaction
extent in both cleavage and ligation reactions, it is apparent that most, if not all, of the
noninterchanging subpopulations must be active; yet, we cannot formally prove that they share
the same kcleav and klig. Our analysis therefore yields kcleav and klig values that are not necessarily
specific for any of the molecular subpopulations but are certain averages over all active
subpopulations of a given ribozyme variant. Fig. 3 illustrates that the shape of the overall

12
cleavage time course for all variants is determined by the fact that the fast cleavage phase is
composed mainly of contributions from subpopulations I, II, and in part III, whereas the slow
cleavage phase is dominated by contributions from subpopulation IV and in part III. This general
behavior is similar for all variants, suggesting that our relative comparisons of the averaged kleav
and klig values between them are likely valid, even if some subpopulations may have chemistry
rate constants that differ from those of the major subpopulation.
To further evaluate this notion, we performed analytical fits in which we varied the ratio
ρ of the chemistry rate constants of the minor and major subpopulations:
ρ = kcleav,II-IV/kcleav,I
Table 3 shows the least-square minimized values for kcleav,I and kcleav,II-IV of all variants at several
different ρ values, together with the squared residuals to evaluate the relative quality of the fits,
the fraction of the major subpopulation (taken from Table 1), and the average chemistry rate
constant kcleav,ave over all subpopulations that results from these values. For all variants, the fit
quality improves somewhat with ρ > 1 (and the optimal ρ, with values between 3 and 10, is
similar for all variants), which suggests that the higher subpopulations behave somewhat
similarly in all variants and perhaps are characterized by a faster reaction chemistry than the
corresponding major subpopulation. However, kcleav,ave does not change significantly and even
with an optimized ρ is within 2-fold of the reported values in Fig. 3 (derived for ρ = 1). Likewise,
when ρ is chosen to be significantly <1 (e.g., ρ = 0.33), which results in significantly worse fits
for all variants (Table 3), the average kcleav,ave values change by at most a factor of only 2-3 from
the reported values in Fig. 3. Thus, even if the catalytic behavior of the different subpopulations
were more complex than assumed for the analyses presented in Fig. 3, our comparisons of the
cleavage and ligation rate constants of ribozyme variants are likely valid to within 2- to 3-fold.
Considering that the kcleav values of RzAS3 and RzAS3/C39S3 are both ≈20-fold smaller than

13
that of the wild type, and that the klig/kcleav values of dC12 and dA38, directly measured in
experiments, are also markedly different from that of the wild type, we conclude that
modifications remote from the active site affect the chemistry rate constants.
1. Zhuang, X., Kim, H., Pereira, M. J., Babcock, H. P., Walter, N. G. & Chu, S. (2002) Science
296, 1473-1476.
2. Bartley, L. E., Zhuang, X., Das, R., Chu, S. & Herschlag, D. (2003) J. Mol. Biol. 328, 1011-
1026.
3. Walter, N. G., Hampel, K. J., Brown, K. M. & Burke, J. M. (1998) EMBO J. 17, 2378-2391.
4. Gutfreund, H. (1995) Kinetics for the Life Sciences: Receptors, Transmitters and Catalysts
(Cambridge Univ. Press, Cambridge, U. K.).
5. Steinfeld, J. I., Francisco, J. S. & Hase, W. L. (1989) Chemical Kinetics and Dynamics
(Prentice-Hall, Englewood Cliffs, NJ).
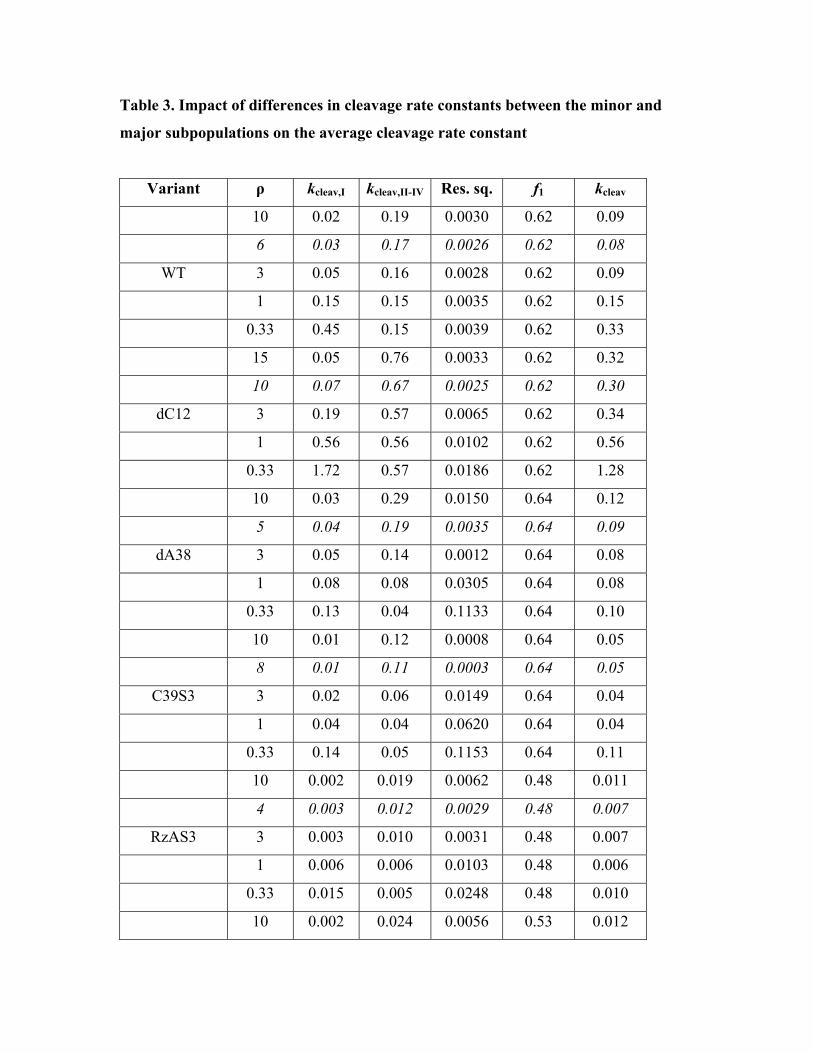
Table 3. Impact of differences in cleavage rate constants between the minor and
major subpopulations on the average cleavage rate constant
Variant ρ kcleav,I kcleav,II-IV Res. sq. f1 kcleav
10 0.02 0.19 0.0030 0.62 0.09
6 0.03 0.17 0.0026 0.62 0.08
WT 3 0.05 0.16 0.0028 0.62 0.09
1 0.15 0.15 0.0035 0.62 0.15
0.33 0.45 0.15 0.0039 0.62 0.33
15 0.05 0.76 0.0033 0.62 0.32
10 0.07 0.67 0.0025 0.62 0.30
dC12 3 0.19 0.57 0.0065 0.62 0.34
1 0.56 0.56 0.0102 0.62 0.56
0.33 1.72 0.57 0.0186 0.62 1.28
10 0.03 0.29 0.0150 0.64 0.12
5 0.04 0.19 0.0035 0.64 0.09
dA38 3 0.05 0.14 0.0012 0.64 0.08
1 0.08 0.08 0.0305 0.64 0.08
0.33 0.13 0.04 0.1133 0.64 0.10
10 0.01 0.12 0.0008 0.64 0.05
8 0.01 0.11 0.0003 0.64 0.05
C39S3 3 0.02 0.06 0.0149 0.64 0.04
1 0.04 0.04 0.0620 0.64 0.04
0.33 0.14 0.05 0.1153 0.64 0.11
10 0.002 0.019 0.0062 0.48 0.011
4 0.003 0.012 0.0029 0.48 0.007
RzAS3 3 0.003 0.010 0.0031 0.48 0.007
1 0.006 0.006 0.0103 0.48 0.006
0.33 0.015 0.005 0.0248 0.48 0.010
10 0.002 0.024 0.0056 0.53 0.012
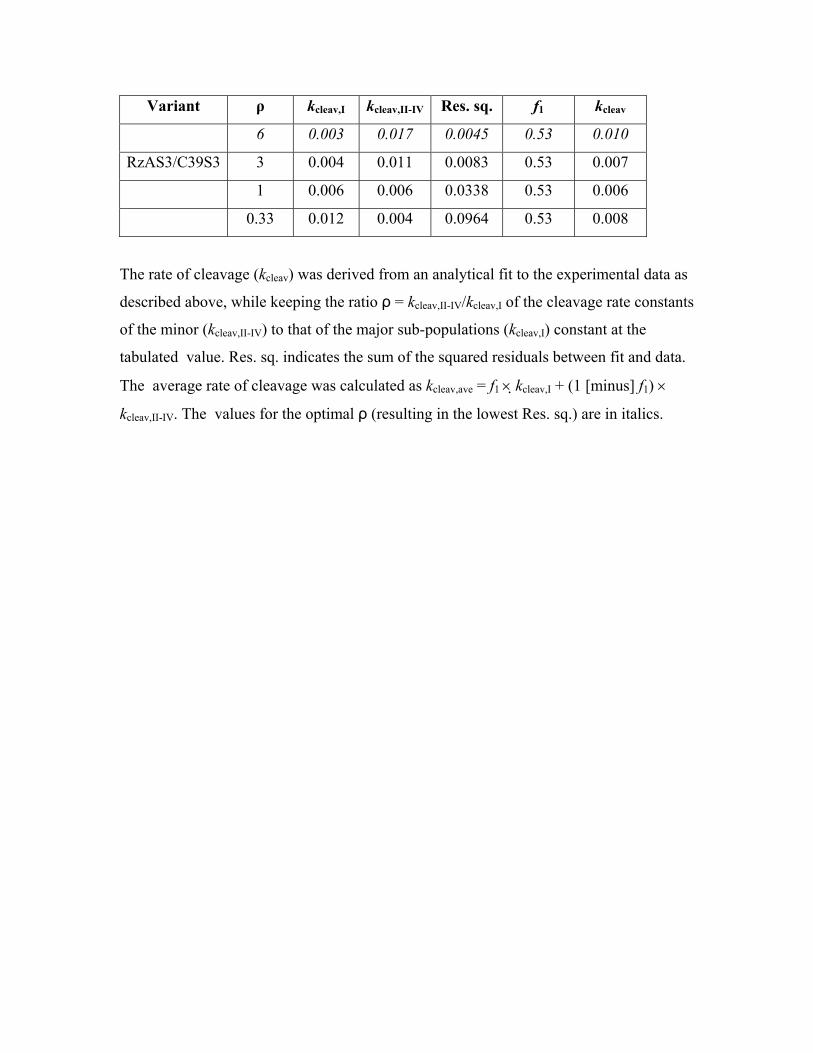
Variant ρ kcleav,I kcleav,II-IV Res. sq. f1 kcleav
6 0.003 0.017 0.0045 0.53 0.010
RzAS3/C39S3 3 0.004 0.011 0.0083 0.53 0.007
1 0.006 0.006 0.0338 0.53 0.006
0.33 0.012 0.004 0.0964 0.53 0.008
The rate of cleavage (kcleav) was derived from an analytical fit to the experimental data as
described above, while keeping the ratio ρ = kcleav,II-IV/kcleav,I of the cleavage rate constants
of the minor (kcleav,II-IV) to that of the major sub-populations (kcleav,I) constant at the
tabulated value. Res. sq. indicates the sum of the squared residuals between fit and data.
The average rate of cleavage was calculated as kcleav,ave = f1 × kcleav,I + (1 [minus] f1) ×
kcleav,II-IV. The values for the optimal ρ (resulting in the lowest Res. sq.) are in italics.


15
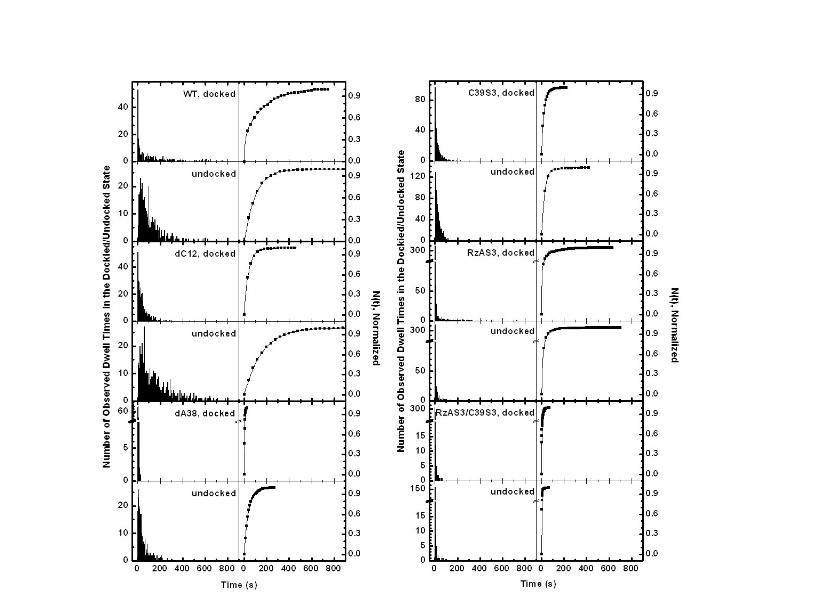
Fig. S2. Left panels: Histograms of the number of events observed with a particular
dwell time in the docked or undocked state, as obtained from FRET single-molecule
time trajectories. Right panels: The number of dwell times N of the docked or undocked
state that are shorter than time t, as derived by integrating the histograms. Lines are the
multi-exponential fits to Eq. S1 that yield the reported docking/undocking rate constants.
Note that the dwell times of the docked state give the undocking rate constants and vice
versa.
18
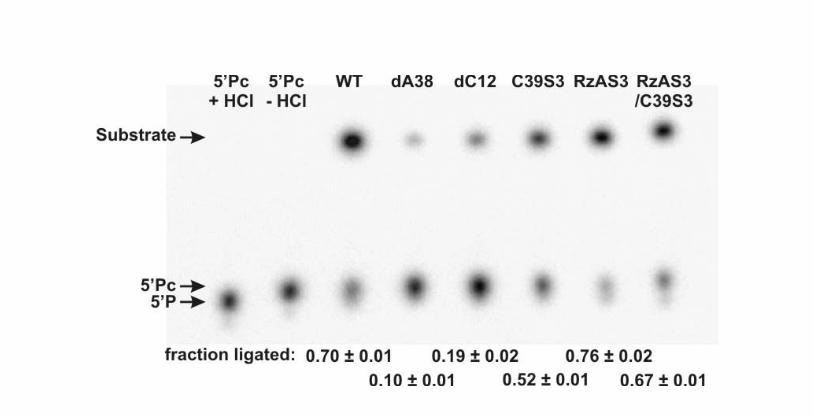
Fig. S5. Ligation assays of the WT and variant hairpin ribozymes, as indicated. The two
leftmost lanes show control experiments on [5’-32P]-labeled 5’ product with a 2’,3’-cyclic
phosphate (5’Pc) before and after incubation with HCl to hydrolyze the cyclic phosphate
to a 2’- or 3’-phosphate (yielding 5’P). 5’P has a higher charge and electrophoretic
mobility than 5’Pc. In the lanes to the right, the upper band shows the ligated substrate
and the lower band the remaining 5’Pc (as distinct from the not ligatable 5’P). The 5’Pc
fraction ligated was calculated as described above. The error bars stem from at least
two independent assays.
16
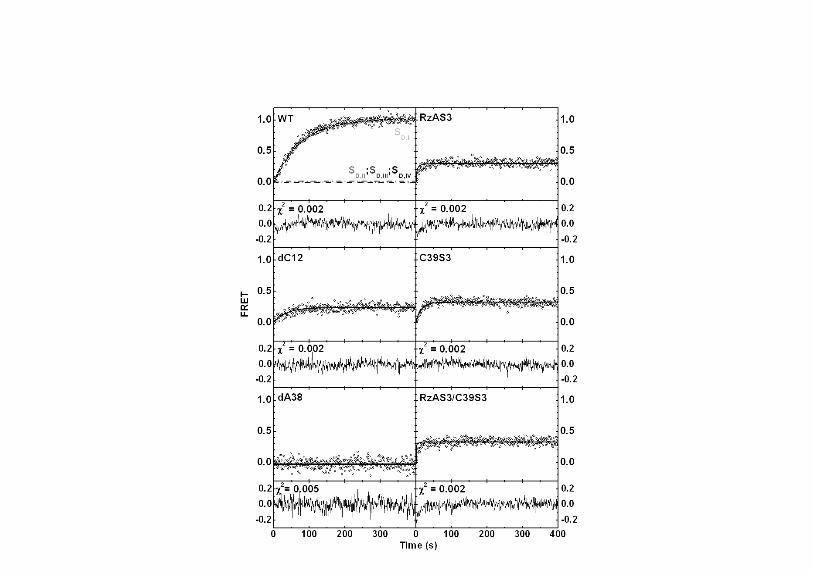
Fig. S3. Bulk solution time courses of the normalized FRET ratio upon addition of
noncleavable substrate analog to the hairpin ribozyme in standard buffer (50 mM Tris-
HCl, pH 7.5, 12 mM Mg2+) supplemented with 25 mM DTT at 25 oC. The measured
experimental curves (open circles) were simulated (black lines, see above) using the
(un)docking rate constants obtained from our single-molecule FRET experiments.
Residuals and χ2 values between simulation and experiment are displayed under each
graph. The comparably larger residuals at early times for RzAS3 and RzAS3/C39S3 are
caused by the longer dead times of the ensemble compared to the single-molecule
FRET assays. The individual sub-population contributions are included for the WT (I,
light gray dashed line; II, gray dash-dotted line; III, dark gray short-dashed line; IV, black
dashed line).

14
Fig. S1. Illustration of regions modified in the selected variant ribozymes. The hydrogen
bond (in dC12 and dA38) or nucleotide (in C39S3) eliminated or linkage extended (in
RzAS3) is highlighted with an arrow.
17
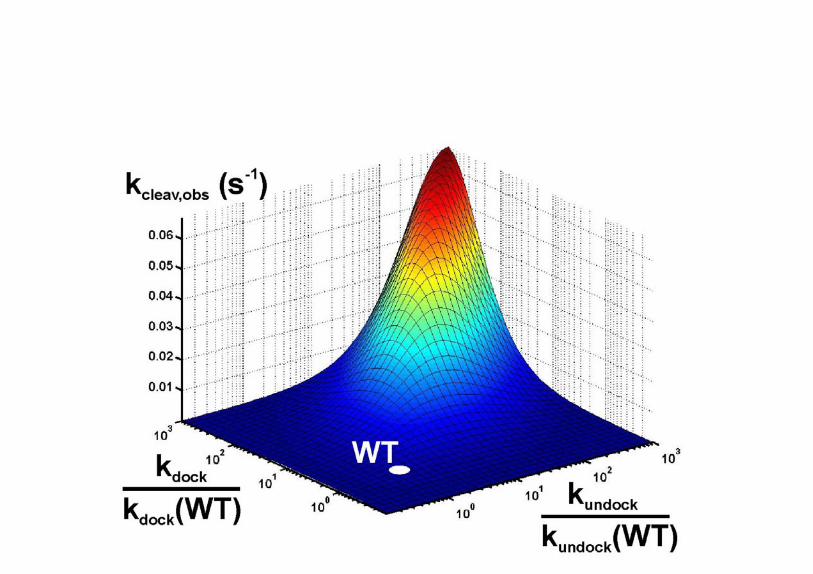
Fig. S4. Results of matrix-algebra assisted kinetic simulations for the dependence of the
overall cleavage rate constant kcleav,obs on kdock and kundock. For this theoretical analysis,
the rate constants for the chemistry steps were assumed to be those of the wild-type
hairpin ribozyme (kcleav = 0.15 s-1 and klig = 0.37 s-1).
19
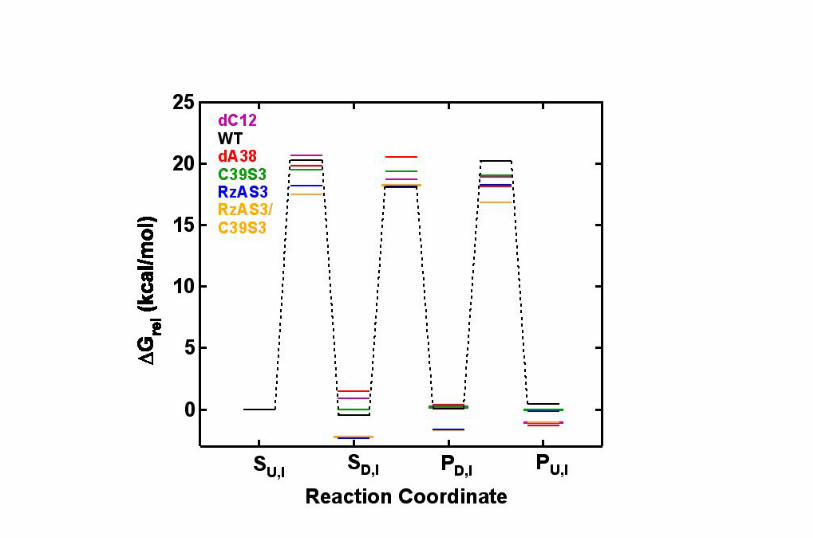
Fig. S6. Relative free energy profiles for the reaction pathways of the wild-type and
variant hairpin ribozymes, as indicated. The energy levels of the different transition
states and intermediates (abbreviated as in Fig. 1B) of the major sub-population I were
successively calculated, relative to that of the undocked ribozyme-substrate complex
SU,I, from the rate constants in Tables I and II under standard buffer conditions at 25 oC,
using transition-state theory with ∆G‡ = -RTln(kh/kBT), where k is the rate constant of
the particular transition, h is Planck’s constant, kB is Boltzmann’s constant, R is the gas
constant, and T is the temperature (298.15 K). While the accuracy of the derived ∆G‡
values may be limited by the limited accuracy of ∆G‡ = -RTln(kh/kBT) when applied to
large biopolymers (4), this approximation allows for an accurate determination of ∆∆G‡
between the wild-type and variant ribozymes.